
Abstract
In industrial applications, particularly in aero, marine and medical industries, titanium has received great attention as a useful material and electrical discharge machining as its machining process. Selection of optimal machining parameters in a multi-objective environment is essential for specific workpiece and tool material combination, which is the concern of industries to improve the overall productivity at less cost. In this article, optimization of critical electrical discharge machining parameters such as pulse current, on time of pulse, off time of pulse and tool geometry depending on the responses such as titanium machining rate, graphite wear rate, surface roughness and deviation between entry and exit while machining titanium grade 5 alloy with graphite tool electrode at negative polarity is presented. Taguchi’s L27 orthogonal array was used to design the experiment with interaction between factors. The weighing method was used to integrate different objectives into one performance. The optimal combination of process parameters was found statistically using signal-to-noise ratios. Significance was checked by analysis of variance. Optimum parameters were found to be pulse current 15 A, on time of pulse 50 µs, off time of pulse 200 µs and cylindrical tool geometry. Resultant percentage improvements in different responses were presented.
Keywords
Introduction
Titanium alloys possess a combination of most useful properties such as great weldability, lightweight, extraordinary corrosion resistance, high tensile strength, high hardness at extreme temperatures and high toughness, 1 which are very suitable for aero, marine and medical implants’ manufacturing applications. Electrical discharge machining (EDM) is a suitable process to machine titanium alloys. 2 Among the 38 different grades of titanium alloys, the most common in industrial applications are the titanium grade 5 alloys. 2 Review articles were published3,4 in 2010 elaborating the status of research in the field of EDM. As per the literature survey, a study of the machinability of titanium alloys using EDM with different tool materials under different conditions has been carried out5–8 in the literature. However, one important concern of industries is to find the optimum machining parameters to improve the overall productivity at less cost. In the past, a lot of research was done in the field of optimization that saw numerous algorithms, and their effectiveness was studied in different areas of applications.9–12 In EDM field too optimization of machining parameters was done for different work materials and tool combinations using different techniques/algorithms.13–15 In most of these researches, many input parameters were considered for optimization, but when it comes to output parameters, mostly one output parameter or two output parameters such as metal removal rate (MRR) and surface roughness (SR) were considered. This is because of the difficulties associated with multi-objective optimization. In this work on optimization, the four objectives, namely, titanium machining rate (TMR), graphite wear rate (GWR), SR and deviation between entry and exit (EED), were considered in the EDM of titanium grade 5 alloy using graphite electrode. The input parameters considered were pulse current, on time of pulse, off time of pulse and tool cross-sectional area.
Experiment details
The experiment was conducted in V5030 EDM machine made by Electronica Corporation, India. Three titanium grade 5 alloy sheets of dimension 100 × 50 × 3mm3 were used as a workpiece. Kerosene was the dielectric with side flushing option. Table 1 provides chemical composition for the titanium grade 5 alloy workpiece.
Chemical composition of titanium grade 5 alloy (by weight—measured using OES—Foundry Master, UV, Germany).
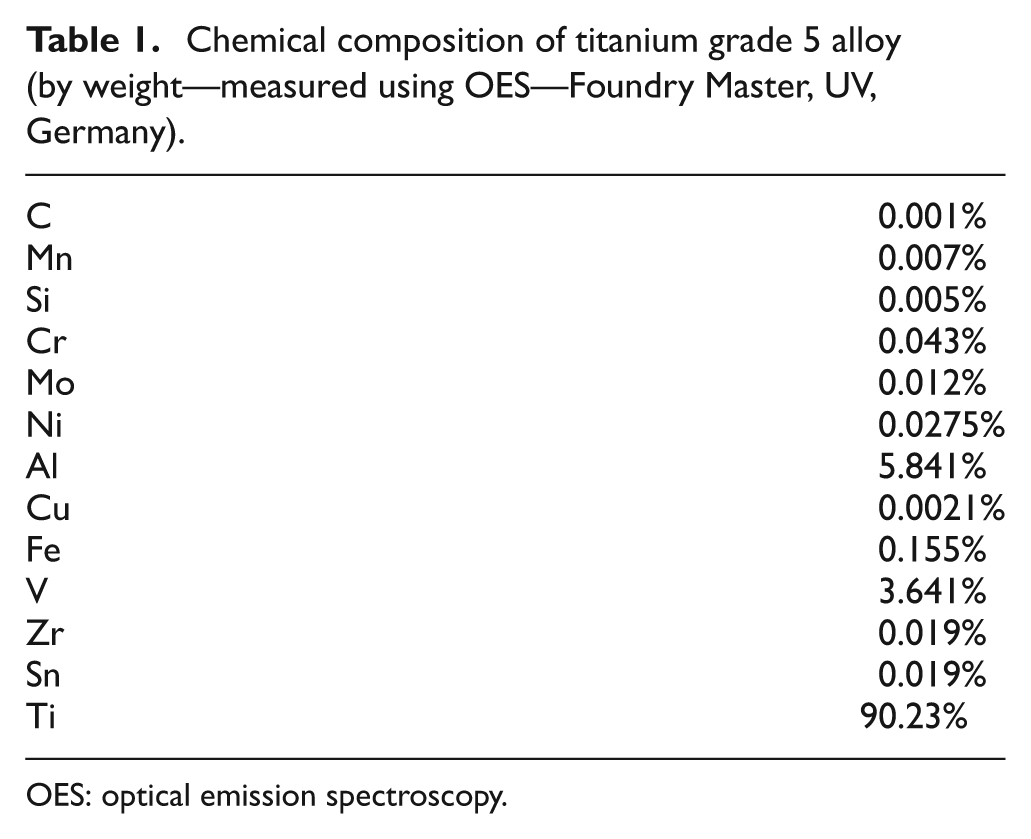
OES: optical emission spectroscopy.
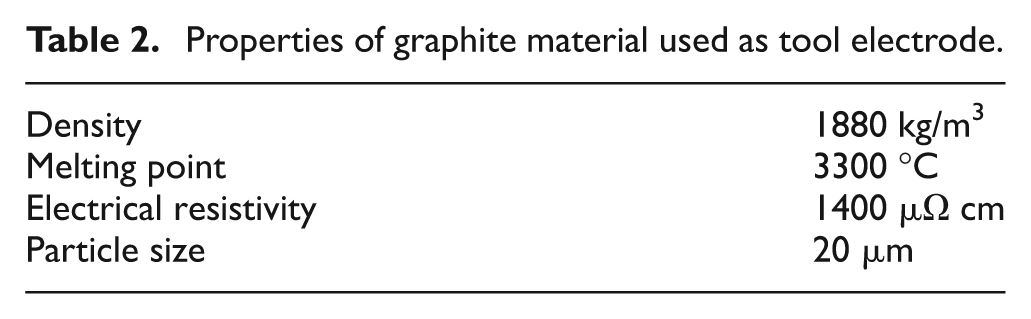
Graphite electrodes of geometrical shapes such as square (8 × 8 mm2), circular (8 mm diameter) and rectangular (8 × 5 mm2) were used as tool material. Its properties are given in Table 2. Nine electrodes per geometry were used in the experiment.
Properties of graphite material used as tool electrode.
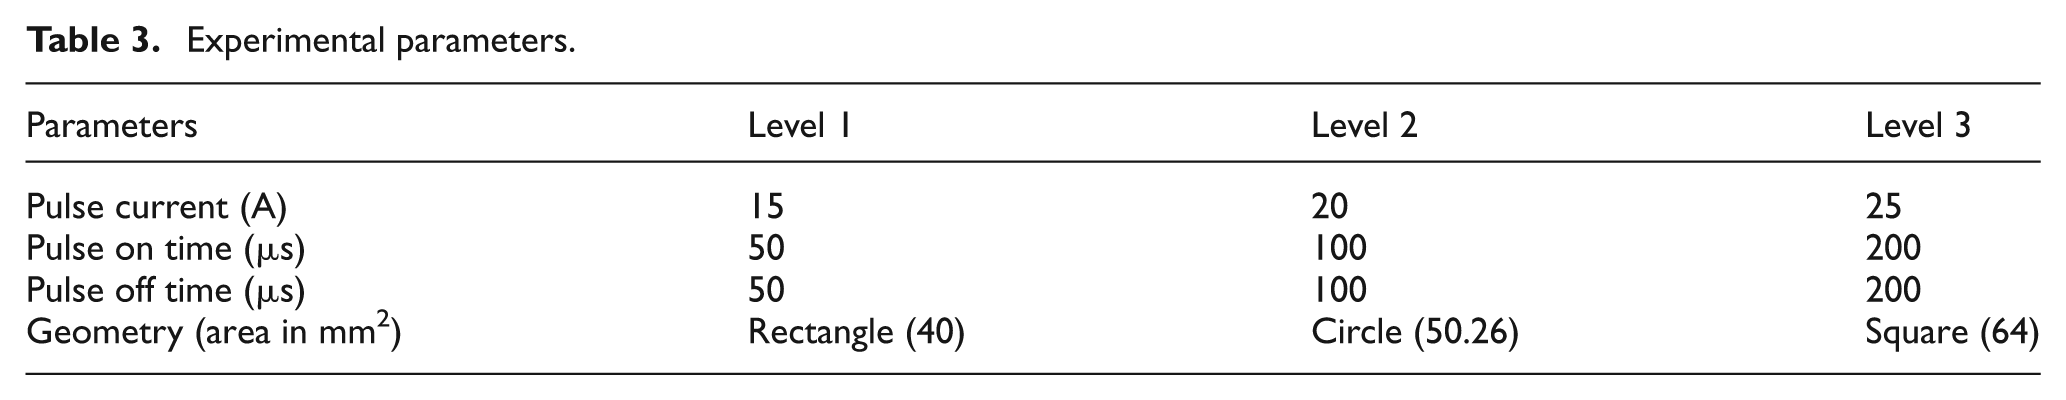
Three levels of four experimental parameters, on time of pulse, off time of pulse, current and tool cross section, were considered. Table 3 provides parameter details. The ranges of level values were chosen based on the work done by Ahmed and Ulas. 16
Experimental parameters.
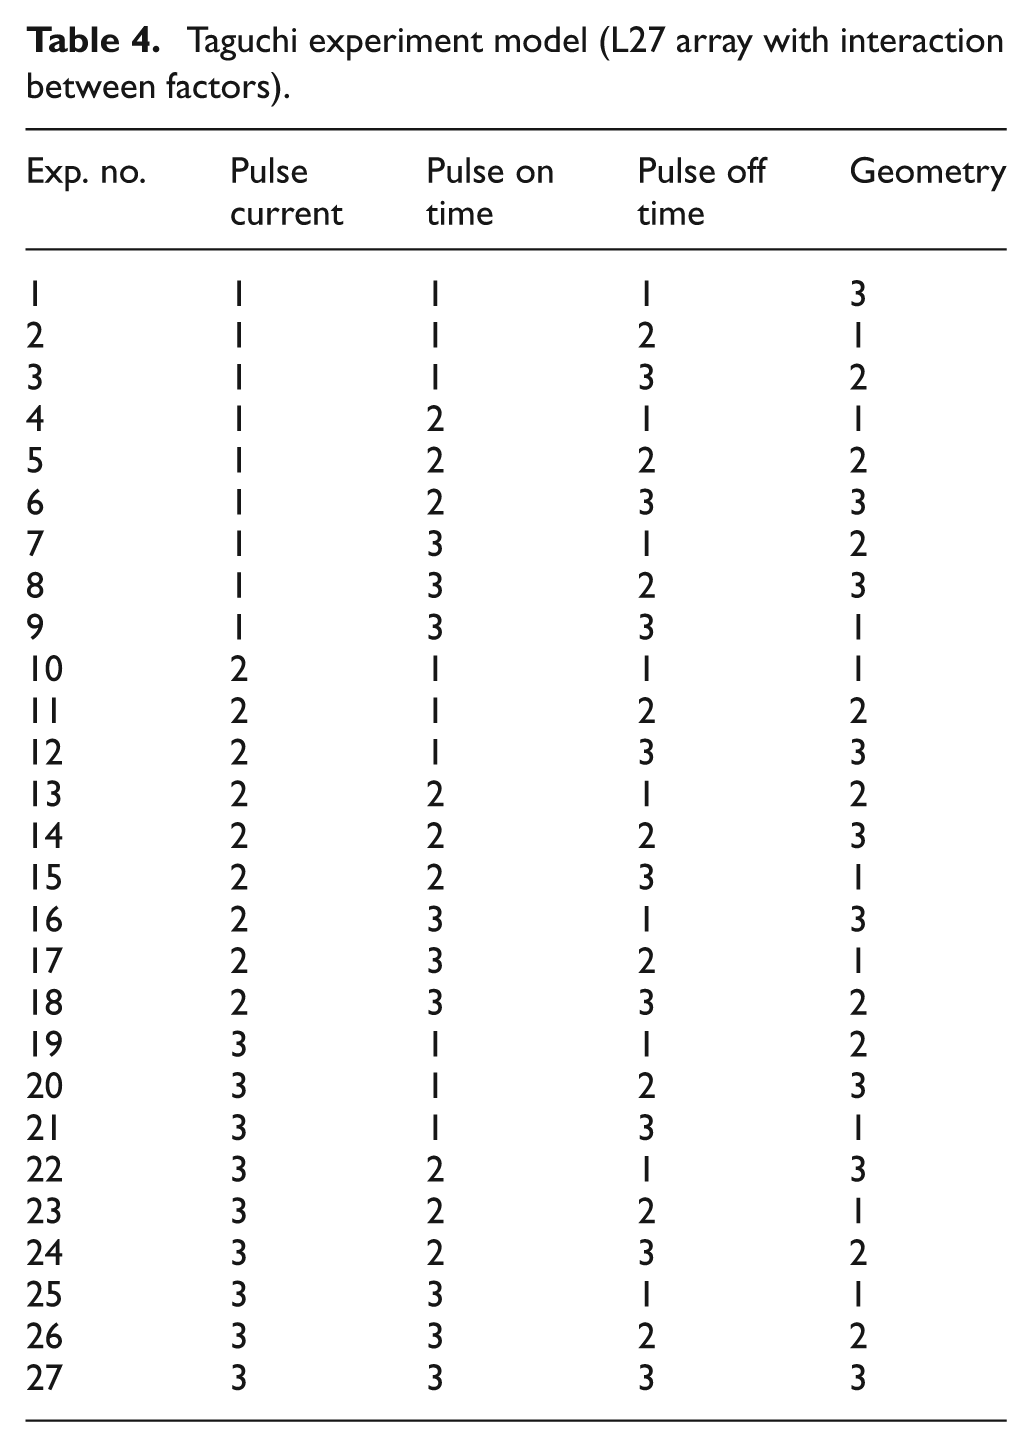
L27 orthogonal array model of Taguchi was chosen while designing the experiment in order to reduce the number of experiments required to cover all experimental combinations. Coded experimental parameters are shown in Table 4.
Taguchi experiment model (L27 array with interaction between factors).
During the experiment, the workpiece was connected to positive and the tool was connected to negative terminals. After the experiment, the workpiece and the tool were washed with dielectric, dried and weighed using electronic balance. A digital watch was used to record the machining time. In random, nine experiments with three experiments/geometry were conducted on each sheet.
After all the holes were made, TMR and GWR were calculated using equations (1) and (2), respectively 8
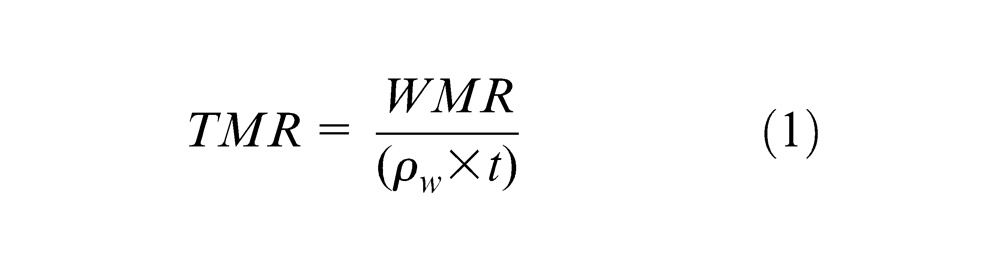
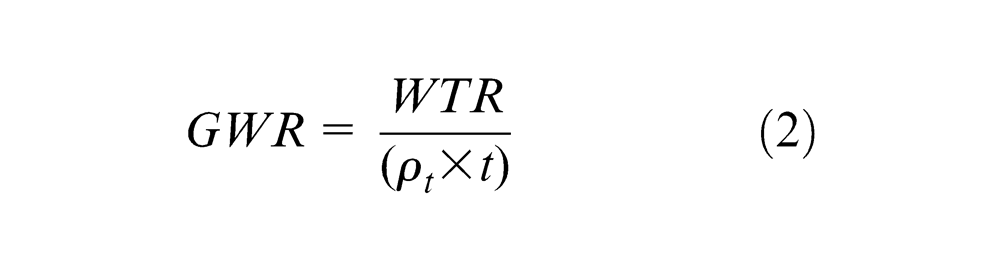
where WMR is the weight of metal removed in grams, ρw is the density of the workpiece in gram per cubic millimeter, t is the machining time in minutes, WTR is the weight of tool material lost during EDM and ρt is the density of the tool in gram per cubic millimeter. WMR and WTR were calculated by measuring the difference in weight before and after machining. Perthometer MarSurf PS1 with 4-µm stylus tip was used to measure the SR of the inner surface of the holes with cutoff length 2.5 mm.
Accurate spectra coordinate measuring machine with TP8 probe head was used to measure entry and exit deviation in the holes. Table 5 shows the results of all the 27 experiments.
Experiment results.
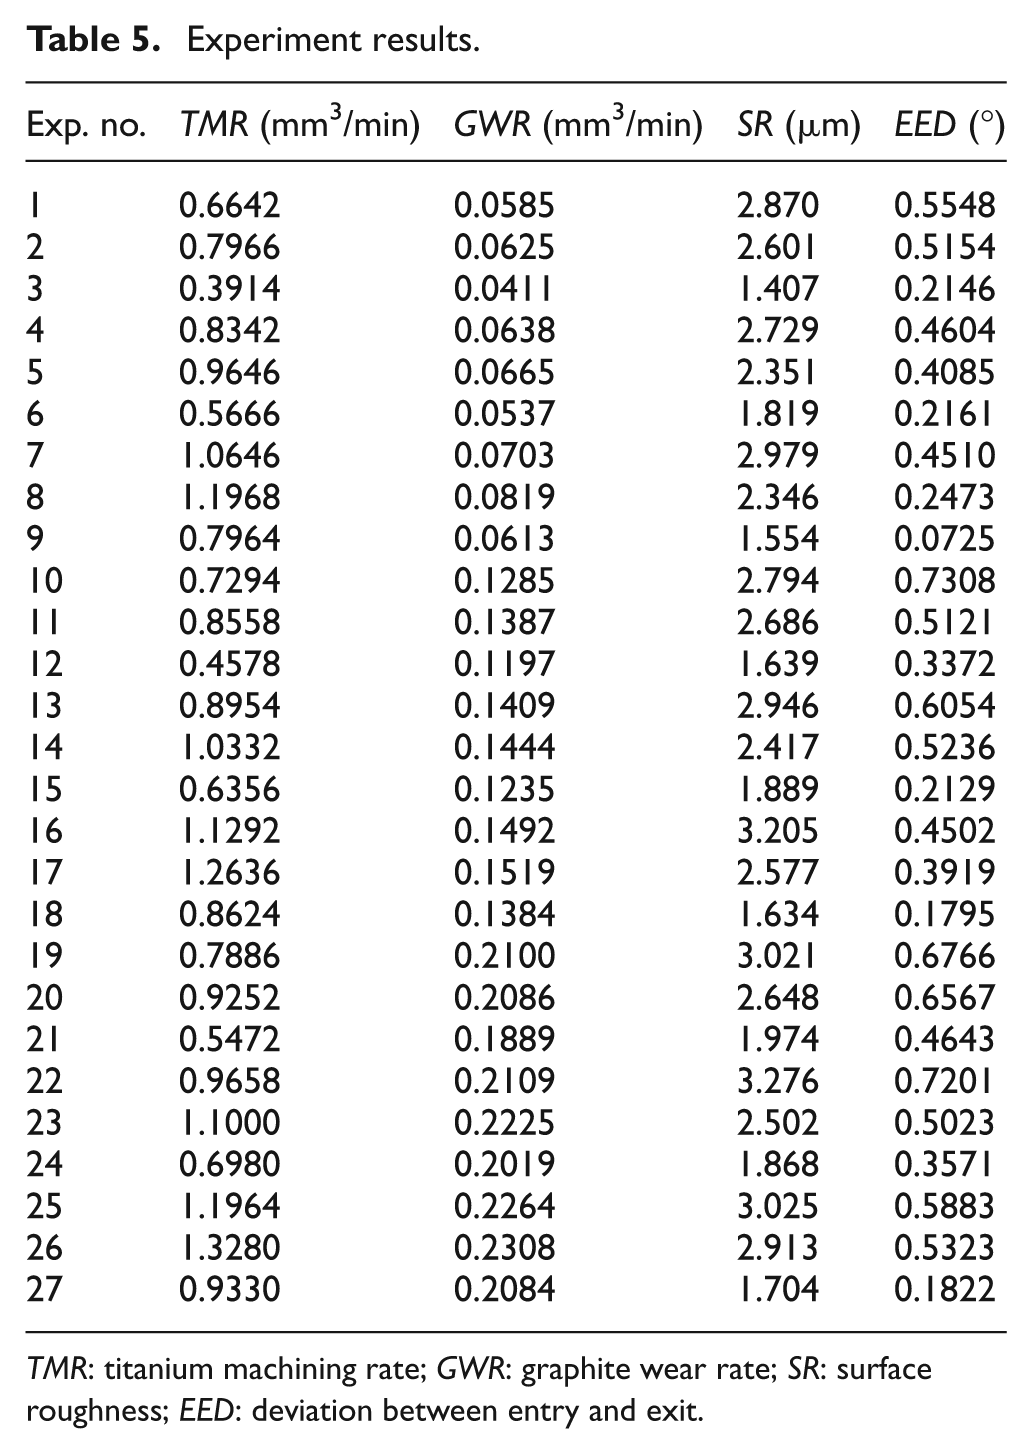
TMR: titanium machining rate; GWR: graphite wear rate; SR: surface roughness; EED: deviation between entry and exit.
Statistical multi-objective optimization methodology
The methodology used here for performing the required multi-objective optimization is signal-to-noise (S/N) ratio–based Taguchi analysis. S/N ratio is used to measure the response variation based on the influence of the noise factors, where S is the measure of the mean of desirable output characteristics called signal and N stands for noise, which is undesirable. 8 The larger the S/N ratio, the better the product quality, in other words, the higher the performance robustness. 9 Therefore, the largest level setting of S/N ratio can optimize the quality characteristic of an experiment. In this work, experiment outputs were transformed to S/N ratio values. Following are the step-by-step method used to find out the optimum parameters.
Step 1. Transform all the experiment output data of various responses into S/N ratios using the following equations.
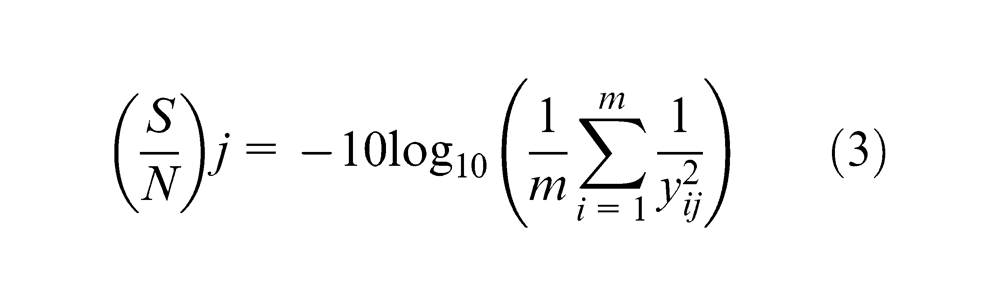
For TMR values, the objective is to maximize the titanium alloy machining rate, so “larger the better approach” was used. The formula used for that approach is given in equation (3), where m is the total number of replications and yij is the value of response in ith replication and jth experimental condition 9
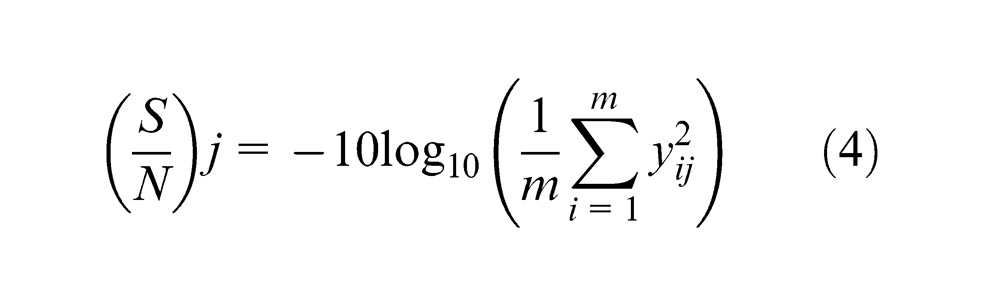
For GWR, SR and EED values, the objective is to minimize all of these, so “smaller the better approach” was used. The formula used for that approach is given in equation (4) 9
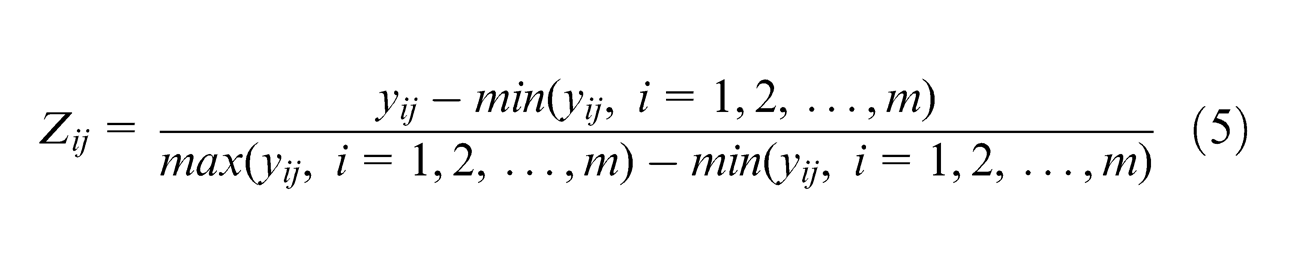
Step 2. Normalize the S/N ratio values for all responses. This is a transformation done on every single data (S/N ratio) to distribute it evenly and scale it into an acceptable range for further analysis without affecting the characteristics of data. In normalization,
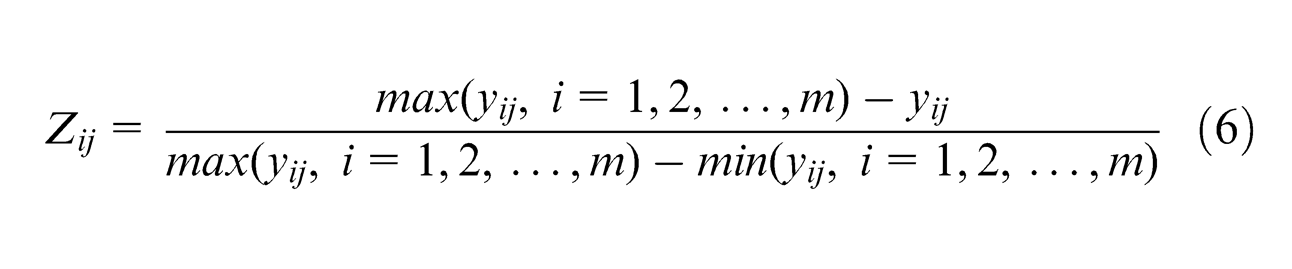
For smaller the better approach S/N ratio values (like for GWR, SR and EED), equation (6) was used in the normalization 9
Step 3. Use the weighing method to convert the multi-objective multiple response into a single performance index. Usually, the weights are determined purely based on engineering judgment 17 and available data based on application requirement. In case of titanium grade 5 alloy, such data are not available in data books as well as in the literature. So, it is not easy to determine a definite weight for each response in reality.
Step 4. Calculate the weighted values (from normalized S/N ratios) using the weights
Step 5. Estimate the effect of each factor, level by level, for each case. To do that, first calculate the average of weighted S/N ratio (WSN) values for each level j, mentioned as
Based on the maximum effect value for each factor, determine the optimal level combination for the factors. That is, if j is the factor, then the best level j* is determined by using equation (9)

Step 6. Through analysis of variance (ANOVA) confirm the significance of the factors case by case using p values; p value is the probability measure of the variation between conditions, which may have occurred by chance. It is a practice to accept the factor effect as significant if the p value is less than 5%. 8
Results
As mentioned in the previous section, at the first step, TMR values were transformed to S/N ratio values using Taguchi’s larger the better approach formula as shown in equation (3). Similarly, GWR values, SR values and EED values were transformed using Taguchi’s smaller the better approach formula as shown in equation (4). The values were tabulated in Table 7.
As the second step, those transformed S/N ratio values of different responses were normalized using equation (5) for TMR and equation (6) for GWR, SR and EED as they belong to smaller the better category. These values are also tabulated in Table 6.
Analysis data.
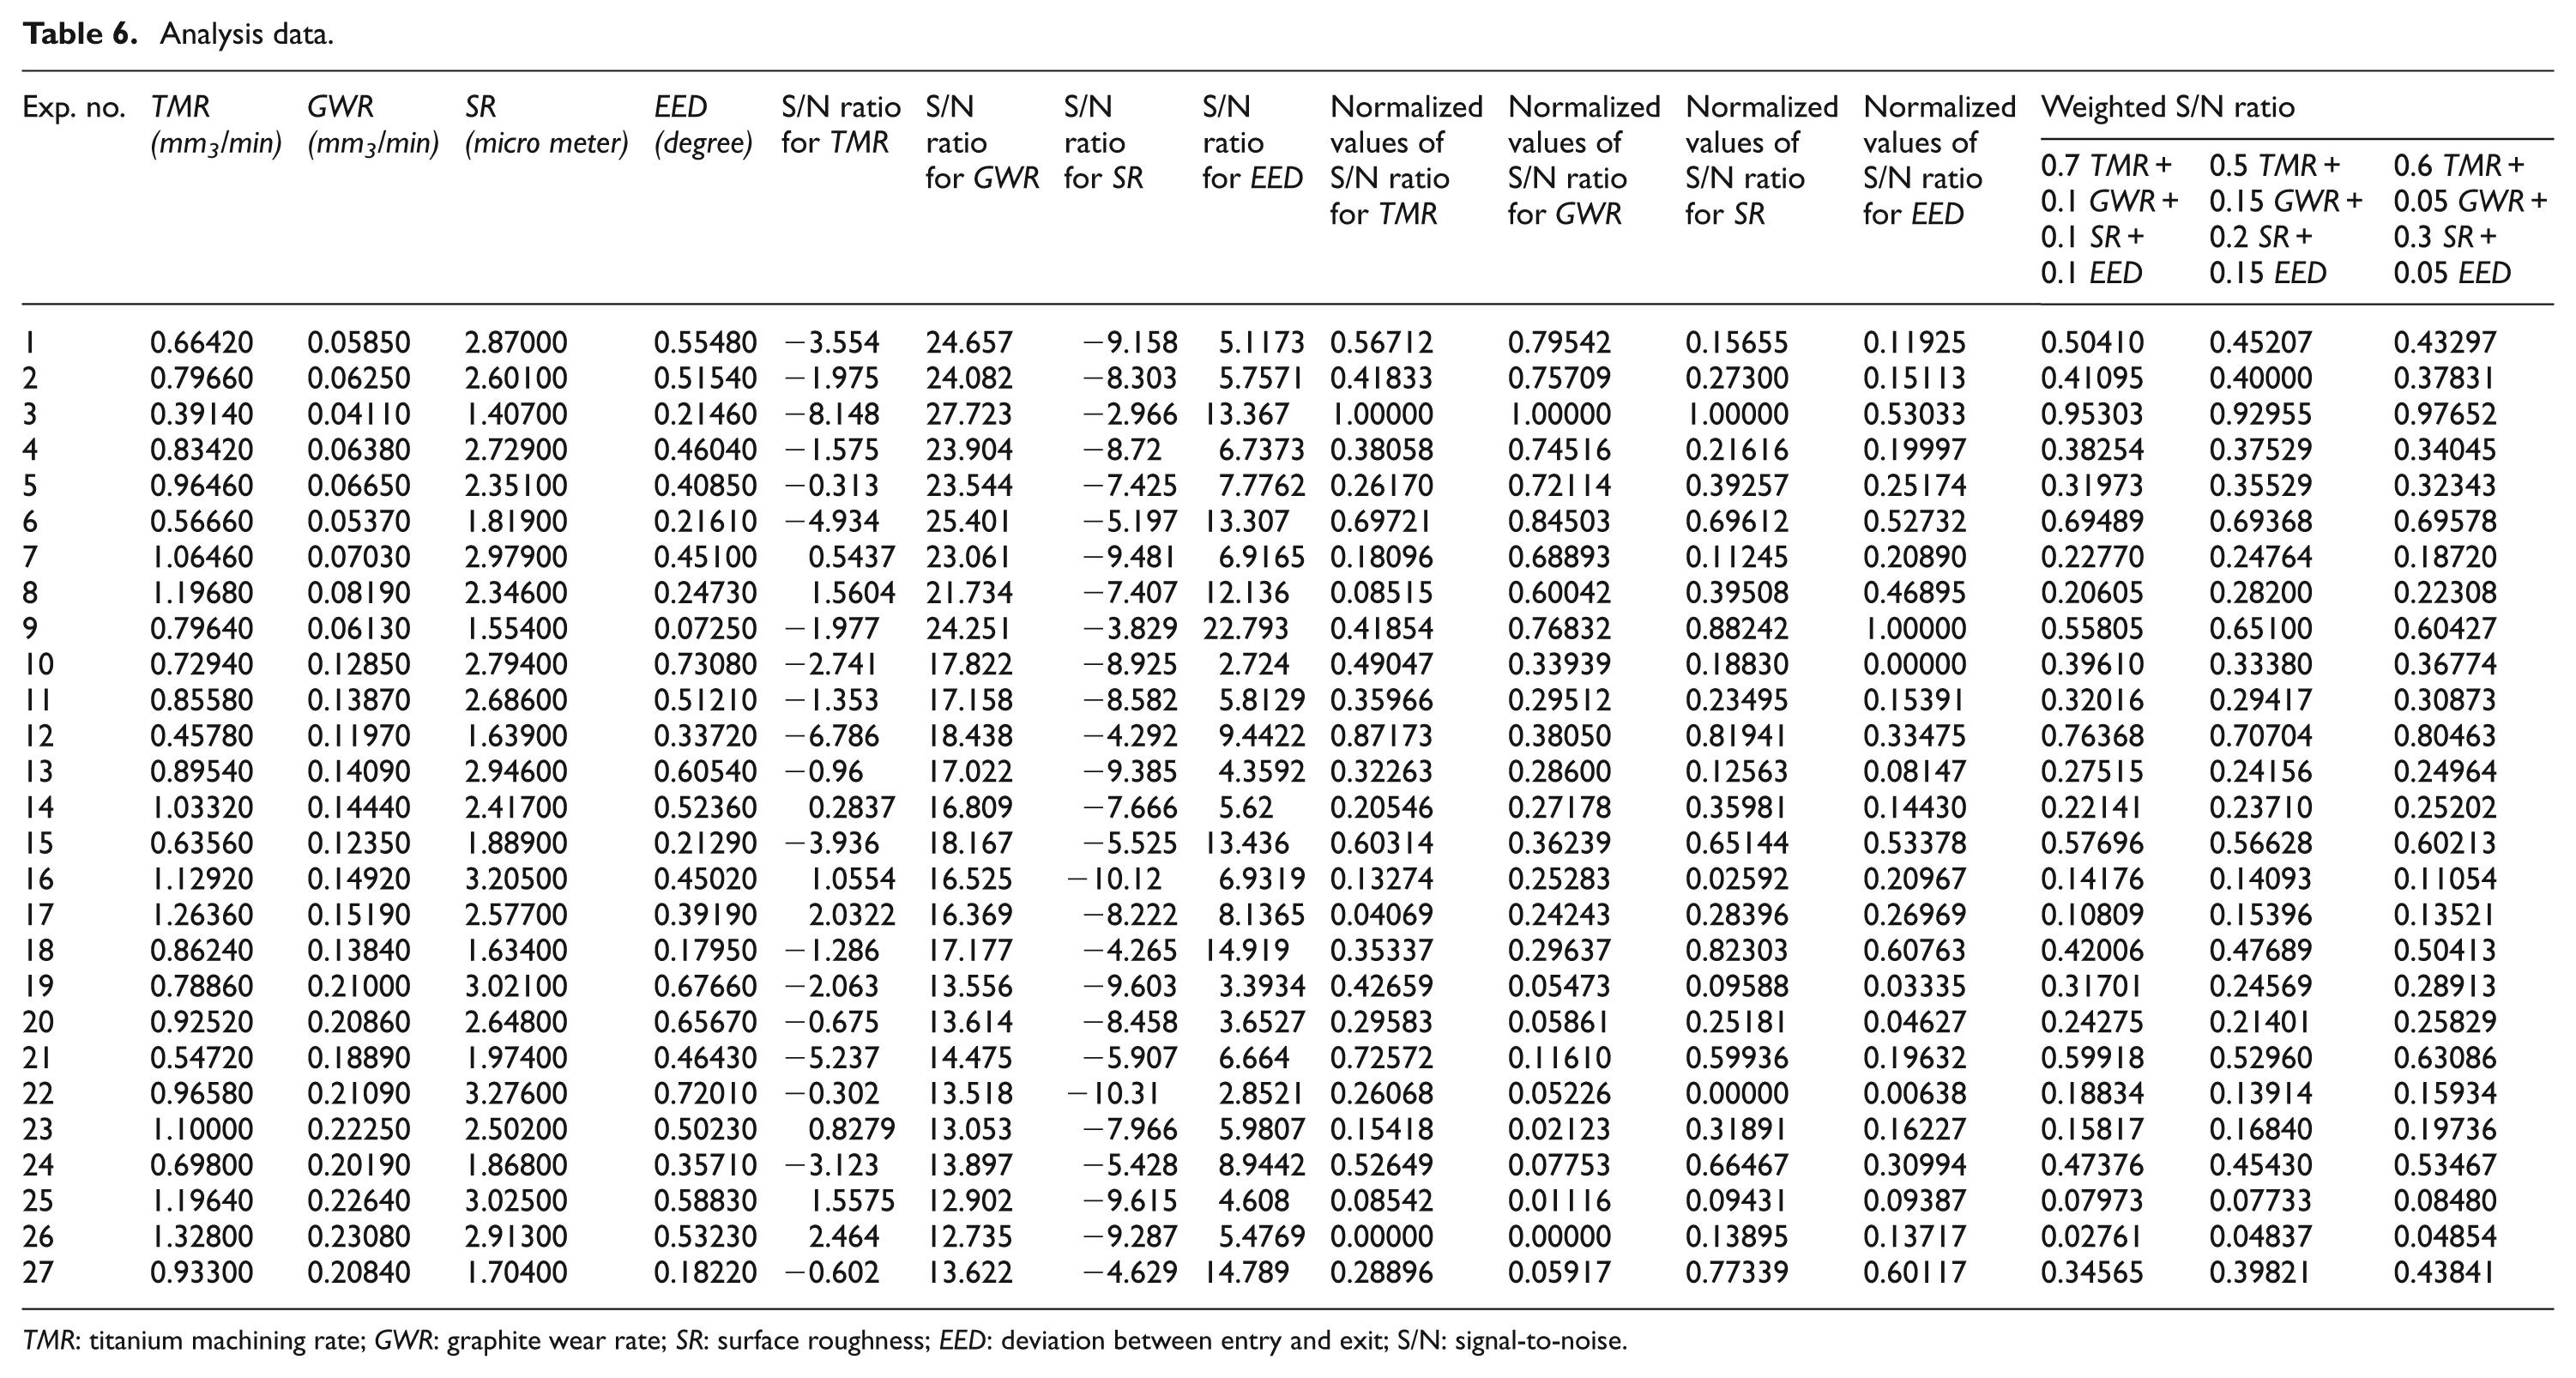
TMR: titanium machining rate; GWR: graphite wear rate; SR: surface roughness; EED: deviation between entry and exit; S/N: signal-to-noise.
In step 3, to convert multi-response into a single performance index, three different sets (cases) of weights were assumed for the responses, which are shown in Table 7. As this step needs to be done based on engineering judgment, 15 these three cases were considered based on the three production requirements such as mass production, batch and job shop productions.
Weight age of output responses.
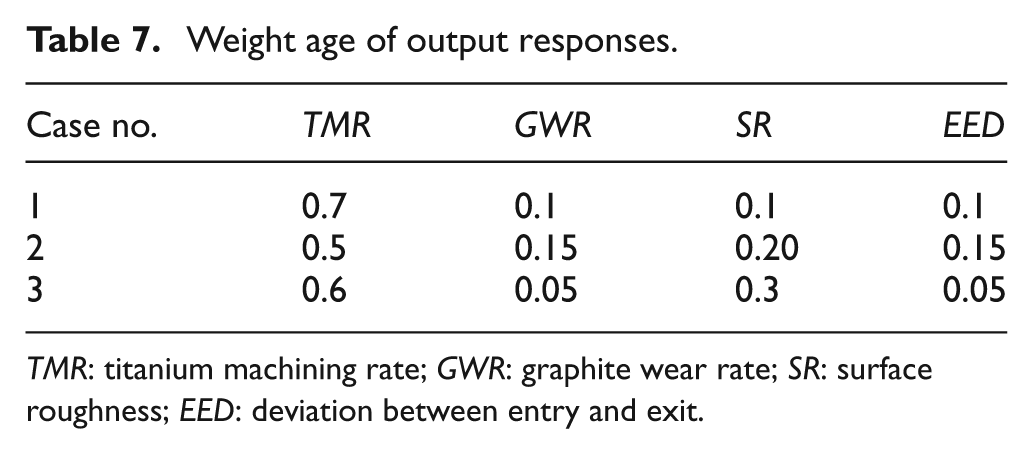
TMR: titanium machining rate; GWR: graphite wear rate; SR: surface roughness; EED: deviation between entry and exit.
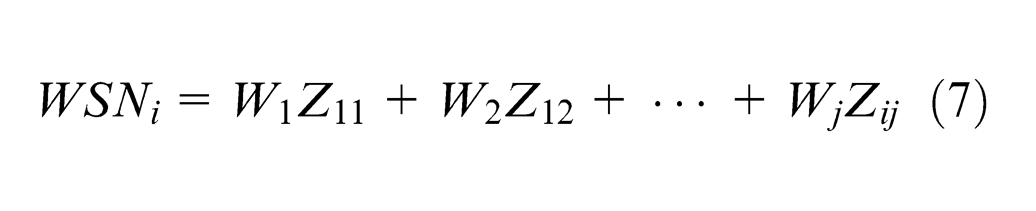
In step 4, WSN values were calculated based on assumed weights and as per equation (7). All these values for all the three cases assumed are given in Table 6.
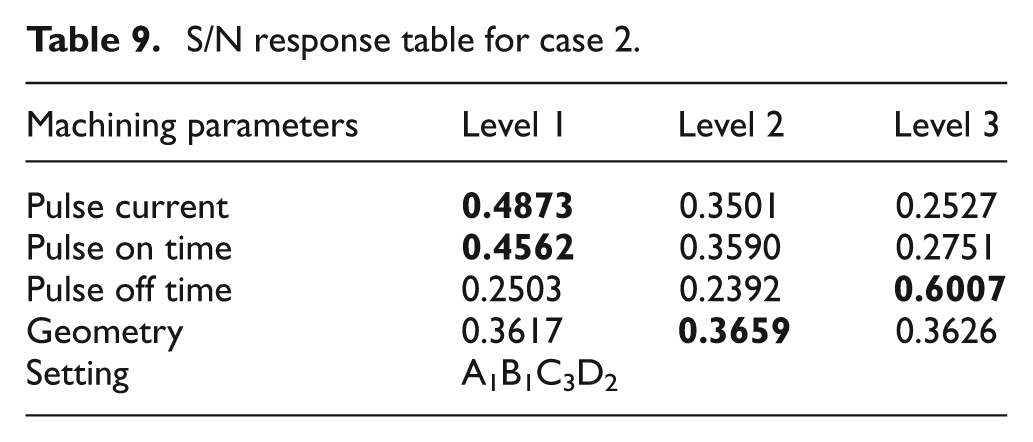
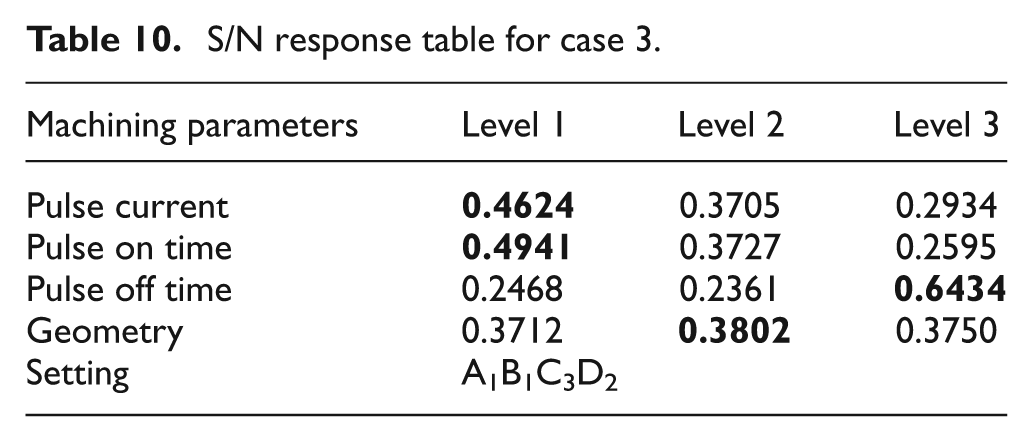
In step 5, as per equations (8) and (9), effects in terms of S/N ratio values for each studied factor such as pulse current, on time of pulse, off time of pulse and geometry at each parameter level were found out, case by case. From these tabulated values, optimal level combination of the factors was determined based on the maximum tabulated value for a particular factor. Tables 8–10 show the S/N ratio values calculated by following all the previous steps for case 1, case 2 and case 3, respectively. In all these tables, values represented in boldface are the largest values indicating the maximum factor effect and thus the optimum factor level. Through all these tables, corresponding to different cases, the optimal combination of factor level was found out to be A1B1C3D2 where the capital alphabets indicate the factors such as A for pulse current, B for on time of pulse, C for off time of pulse and D for tool geometry, and the suffix numerals are the level of those factors. Since the optimum factor level combination obtained through the analysis (1 1 3 2) was one among 27 experiments which is experiment number 3, confirmatory experiment was not required.
S/N response table for case 1.
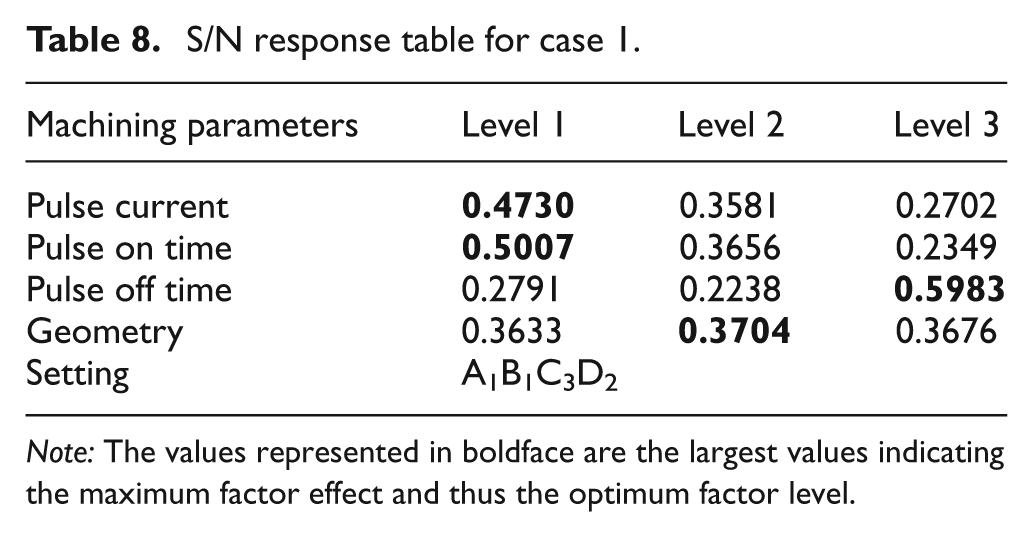
Note: The values represented in boldface are the largest values indicating the maximum factor effect and thus the optimum factor level.
S/N response table for case 2.
S/N response table for case 3.
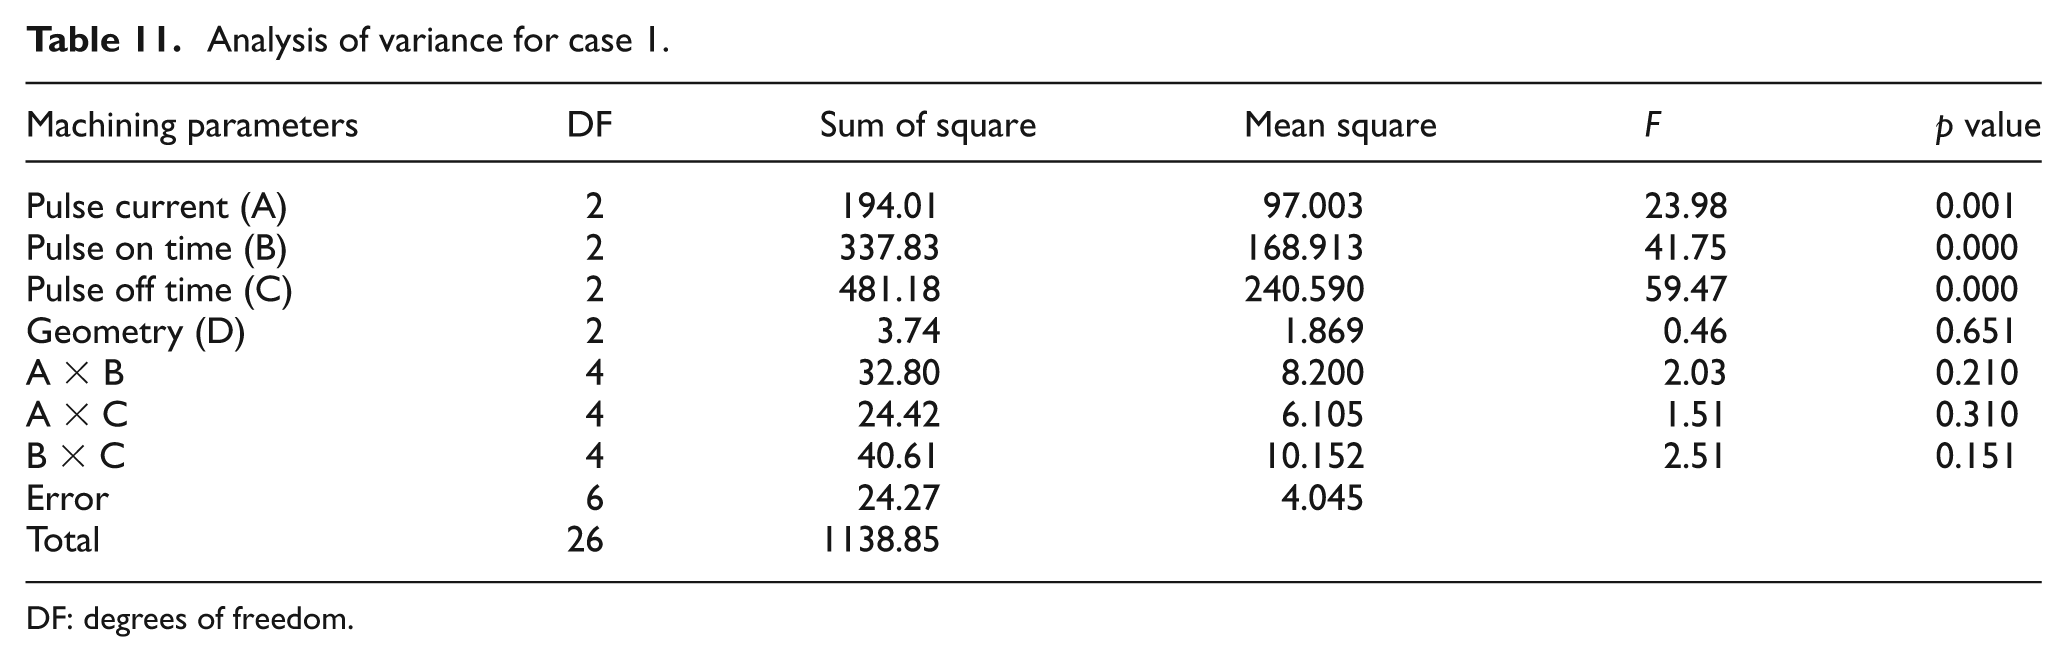
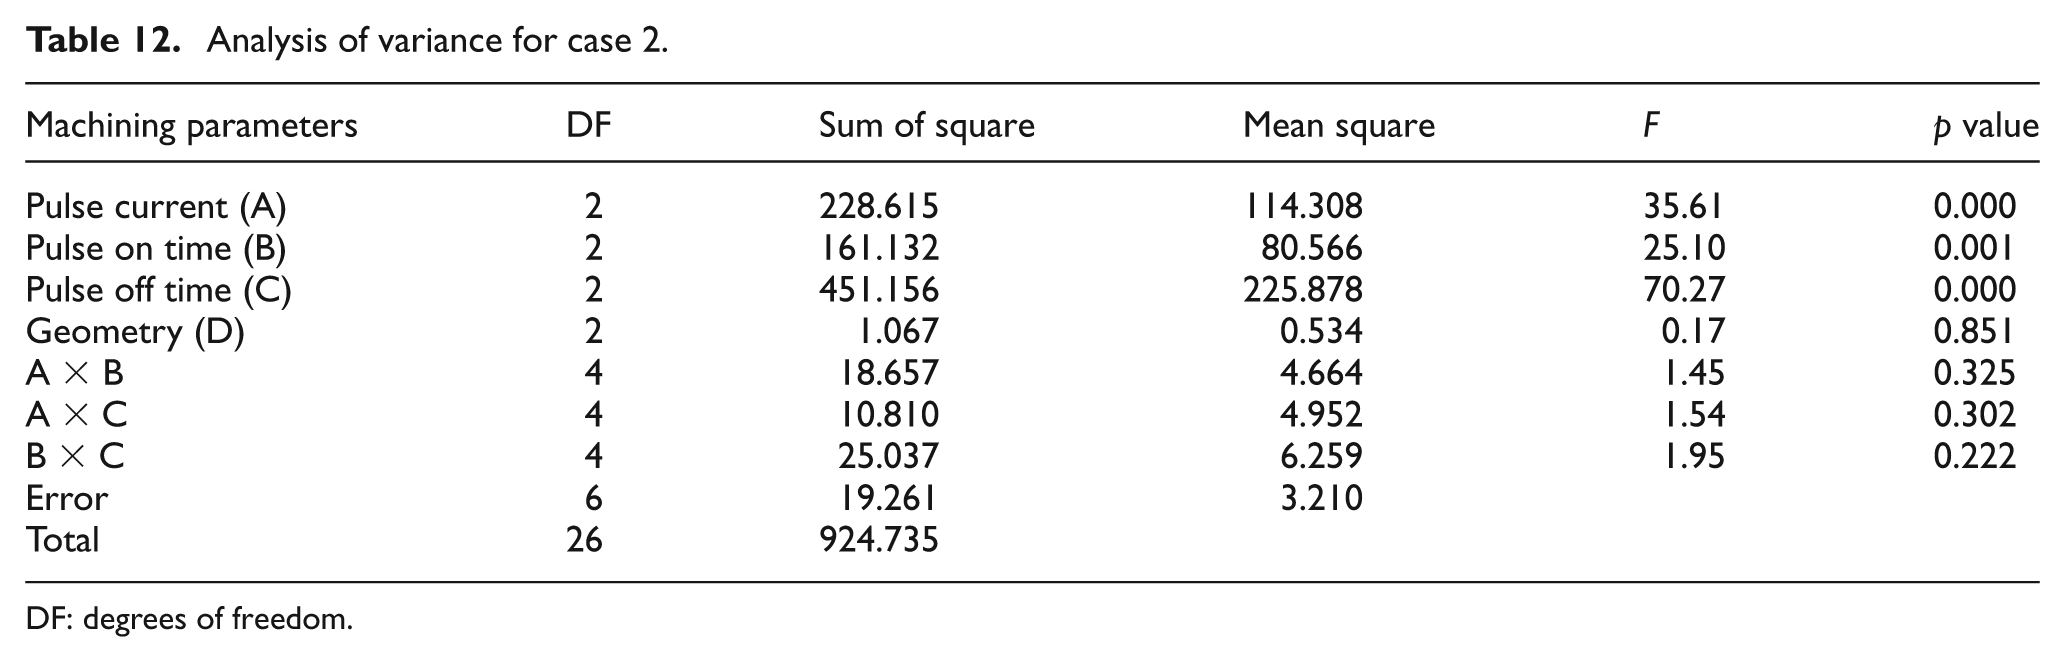
In step 6, significance of the studied factor effects over responses was tested using statistical ANOVAs. Tables 11–13 are the ANOVA tables for cases 1, 2 and 3, respectively. Through ANOVA, significance of individual factor effects as well as interactive factor effects was analyzed. The results show that the effects of the first three factors, pulse current, on time of pulse and off time of pulse, are highly significant as their p values are at very high confidence level in all the three cases, which means the optimum level values found for pulse current, on time of pulse and off time of pulse are reliable, whereas the fourth factor tool geometry/cross-sectional area along with other interactive effects was found to be insignificant.
Analysis of variance for case 1.
DF: degrees of freedom.
Analysis of variance for case 2.
DF: degrees of freedom.
Analysis of variance for case 3.
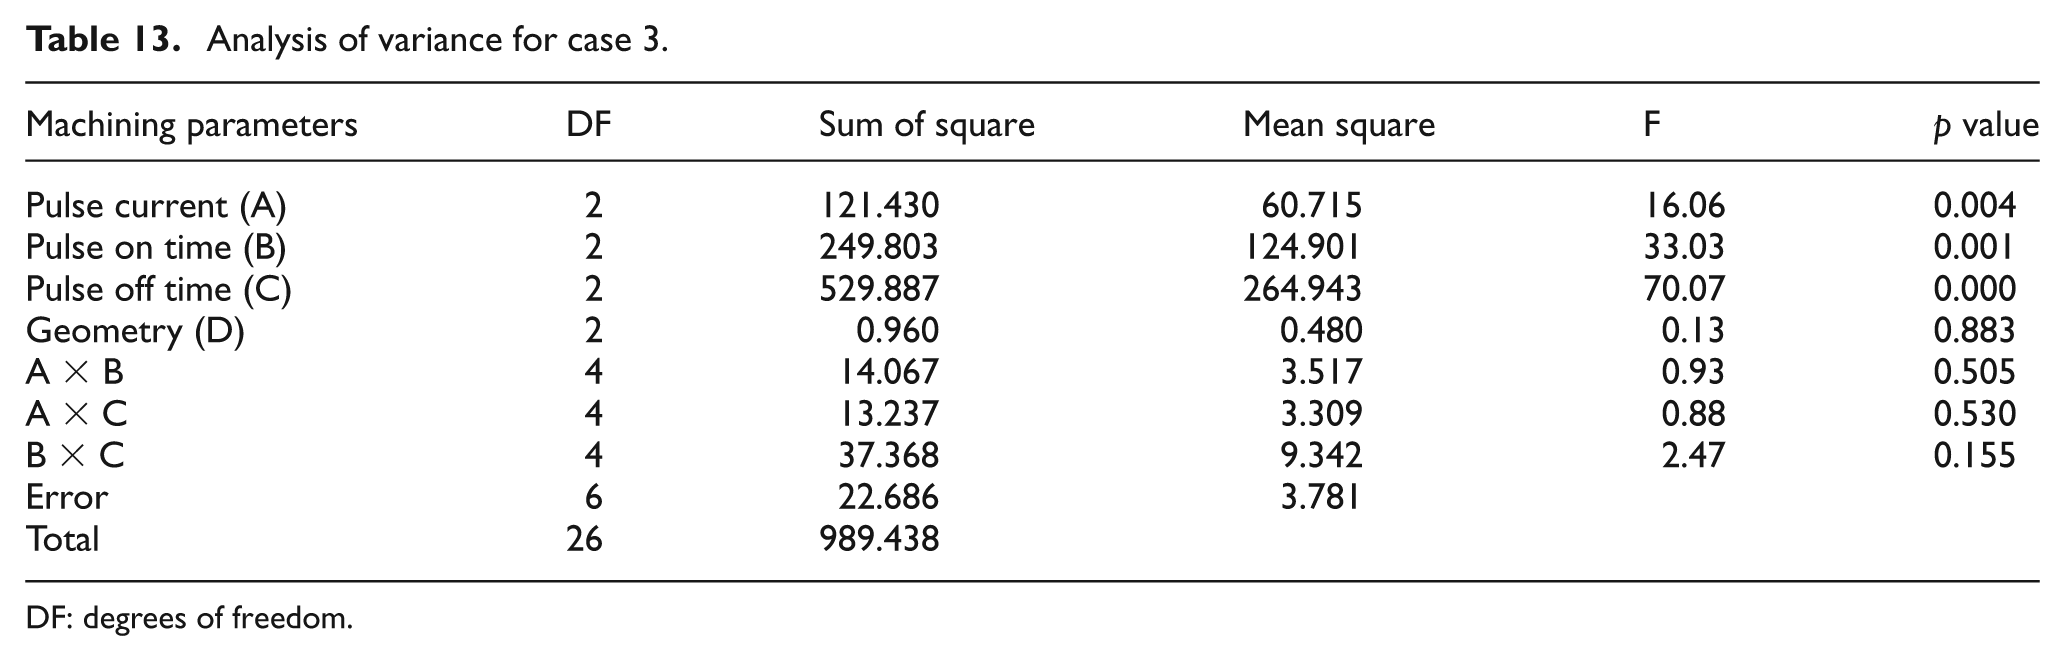
DF: degrees of freedom.
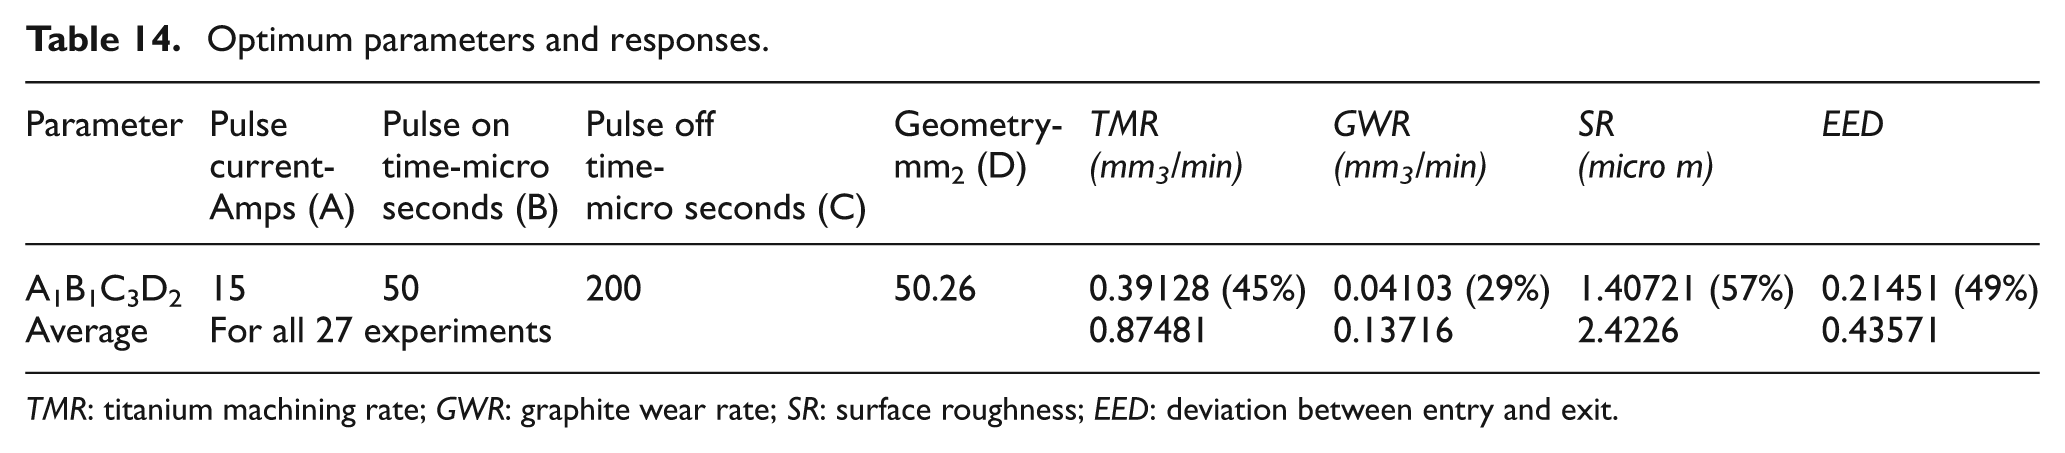
Table 14 shows the findings in optimization of machining parameters in EDM of titanium grade 5 alloy using graphite electrode at the negative polarity experiment and analysis.
Optimum parameters and responses.
TMR: titanium machining rate; GWR: graphite wear rate; SR: surface roughness; EED: deviation between entry and exit.
The first row in this table shows the optimum parameter levels and resultant response values. The second row in this table shows the average response values of all the 27 experiments. The percentage values mentioned in brackets indicate the percentage of optimum response values from the average.
Discussion
Through this experiment and statistical multi-objective optimization, a reliable approach was found to optimize the parameters when there are multiple objectives. The optimized values found resulted in the following percentage reductions compared to the average values of all 27 experiments in three important responses out of the four studied as shown in Table 14.
In GWR, 71%.
In SR, 43%.
In EED, 51%.
On the negative side, these optimum values resulted in 55% reduction in titanium alloy machining rate compared to the average TMR in all the 27 experiments, which was a compromise for the benefits achieved in other three responses. Therefore, this method can be used to optimize the parameters for any number of objectives, provided weighing details are available either by experience or based on the data available in the data books or in the literature. So, the proposed methodology is very useful for small- and medium-scale industries that normally will not spend on research and will have their experience-based weighing data, and also, this work is useful for the industries that are working with titanium grade 5 alloy. One of the findings in this research through ANOVA testing is that the tool geometry is not significantly influencing the optimization except that cylindrical shapes can give better responses. This infers that while designing the tool electrodes, the sharp edges need to be rounded off to get better responses. In addition, optimized parameters found resulted in remarkable improvements in graphite (tool) wear rate, SR and EED, which is an important requirement in high-end applications such as space, aero and marine industries where little trade-off can be tolerated with less TMR in order to achieve better results in above responses. However, by suitable changes at weighing stage, optimized parameters suitable to other industries also can be found.
Conclusion
In this work, multi-objective optimization of operation parameters for EDM of titanium grade 5 alloy using graphite electrode had been achieved. The application of S/N and ANOVA was proved to be useful for achieving the optimal EDM process parameters for desired responses. The findings are summarized below.
The optimum conditions found out in the study were as follows: Pulse current: 15 A On time of pulse: 50 µs Off time of pulse: 200µs Tool geometry: cylindrical
Electrical parameters were found to be the most significant control parameters in obtaining desired SR, TMR, EED and GWR.
The order of influence among the electrical parameters over the studied four responses was on time of pulse, pulse current and off time of pulse.
Footnotes
Appendix 1
Declaration of conflicting interests
The authors declare that there is no conflict of interest.
Funding
This research received no specific grant from any funding agency in the public, commercial or not-for-profit sectors.