
Abstract
In this study, the effect of electrical parameters such as current, pulse-on time, pulse-off time, their interaction, tool geometry, and cross-sectional area over the important machining responses such as metal removal rate, tool wear rate, surface roughness, and entry–exit deviation were studied while machining titanium grade 5 alloy with graphite tool electrode at negative polarity in sink electric discharge machining process. The experiment was designed with Taguchi’s L27 orthogonal array with interaction between factors. The analysis of variance was used to check the significance of parameters effect. The data obtained were analyzed with signal-to-noise ratio analysis. Residual analysis was performed to check the fitness, and a regression model had been created and validated to relate the experiment factors with the responses. The model was found to be good after experimental validation. The ranking of influence of the factors over the responses was also presented.
Keywords
Introduction
Titanium alloys have received great attention because of their high tensile strength, high toughness, light weight, extraordinary corrosion resistance, high hardness at extreme temperatures, and their great weld ability. 1 For these reasons and the electrochemical incompatibility of aluminum with the composite materials used in the aerospace industry with which it forms a galvanic couple, titanium alloys are considered to be a replacement for aluminum in space applications. 2 Electric discharge machining (EDM) is one of the nonconventional machining processes being used to machine very high hardness conductive materials, 3 such as titanium alloys. The most common among 38 grades of titanium alloys and with very wide industrial applications are the titanium grade 5 alloys 4 that are otherwise called Ti6Al4V alloy. Some research papers were published in the field of micro-EDM of titanium grade 5 alloy5,6 using metallic electrodes. Among the many tool electrode materials available for machining titanium alloys, graphite electrode material gives the highest material removal rate.7,8 Although graphite has graphite dust-related housekeeping problems and lower margin of safety with regards to direct current (DC) arcing, it is a preferred tool material because of its many advantages. 8 Extensive research has been carried out in the field of EDM and papers have been published investigating the influence of EDM parameters over machining responses of different work piece material and tool electrode combinations;9–11 however, no or very little published work is available corresponding to titanium grade 5 alloy and graphite tool combination with different tool geometries as per a published literature survey. 12 Same is the case for interaction effect of electrical parameters and ranking of influence over machining responses for titanium grade 5 alloy and graphite tool electrode combination. The aim of this study was to fulfill these needs.
Experiment details
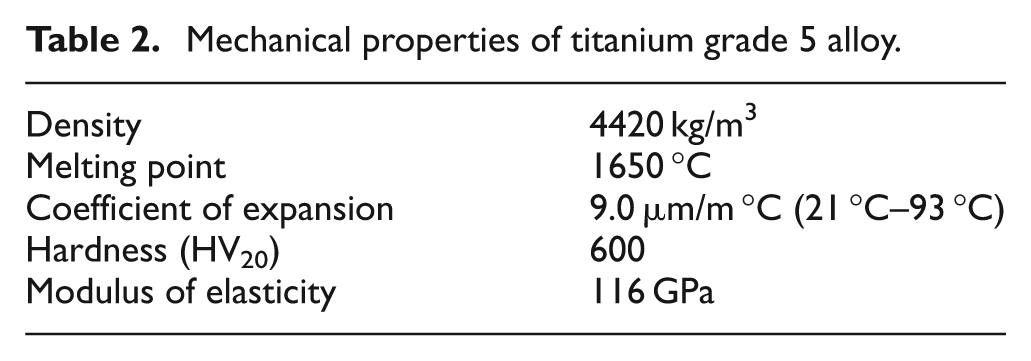
The work piece material used in this study was a commercially available titanium grade 5 alloy sheet that was cut to the dimension 100 mm × 50 mm×3 mm using wire-cut EDM. Three such sheets were cut from one big sheet to avoid any variation in properties. The chemical composition and the mechanical properties of the studied material are given in Tables 1 and 2, respectively.
Chemical composition of titanium grade 5 alloy (by weight – measured using optical emission spectrometer (OES) – Foundry Master, Was, Germany).
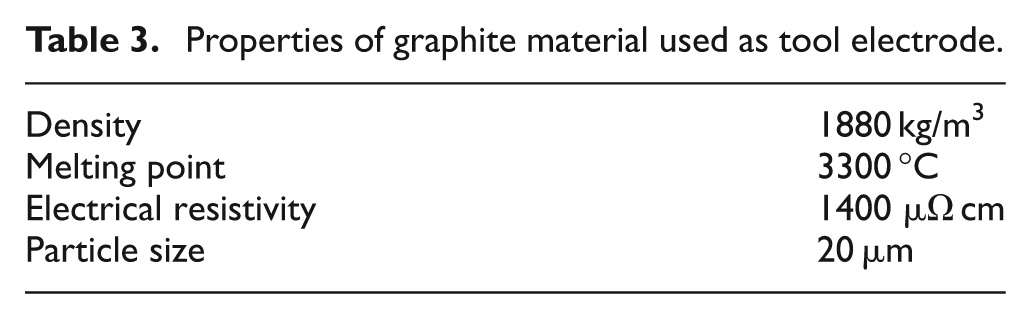
Mechanical properties of titanium grade 5 alloy.
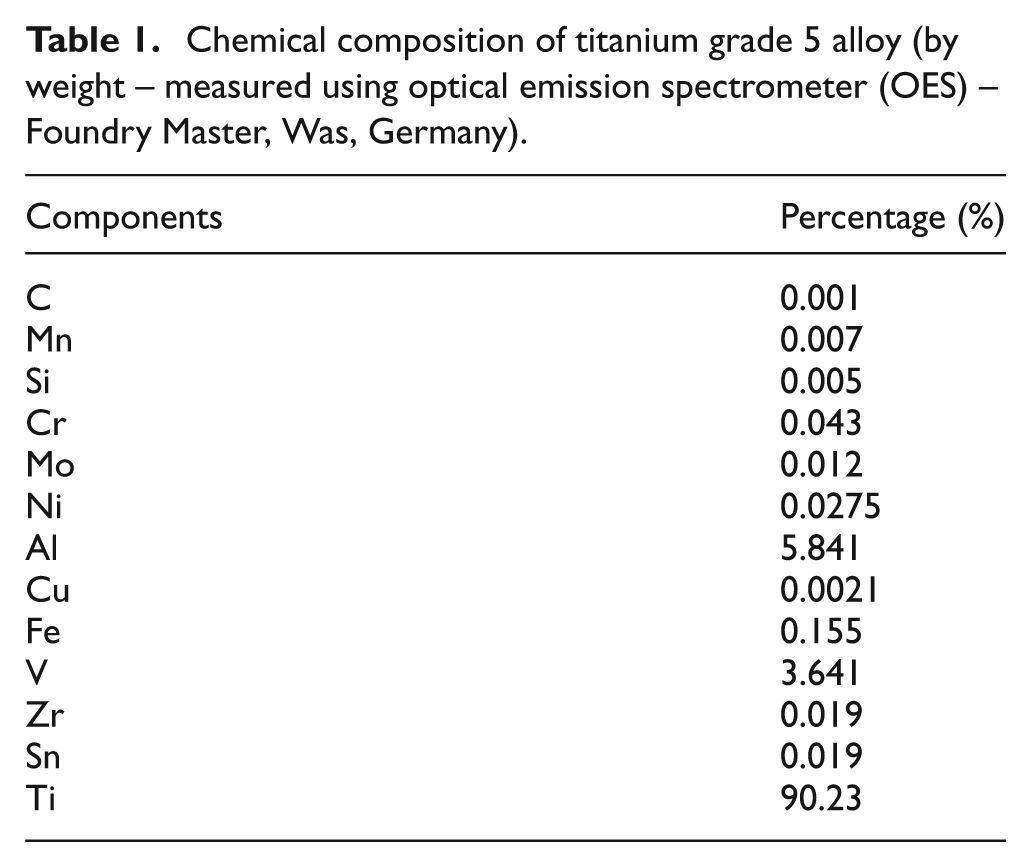
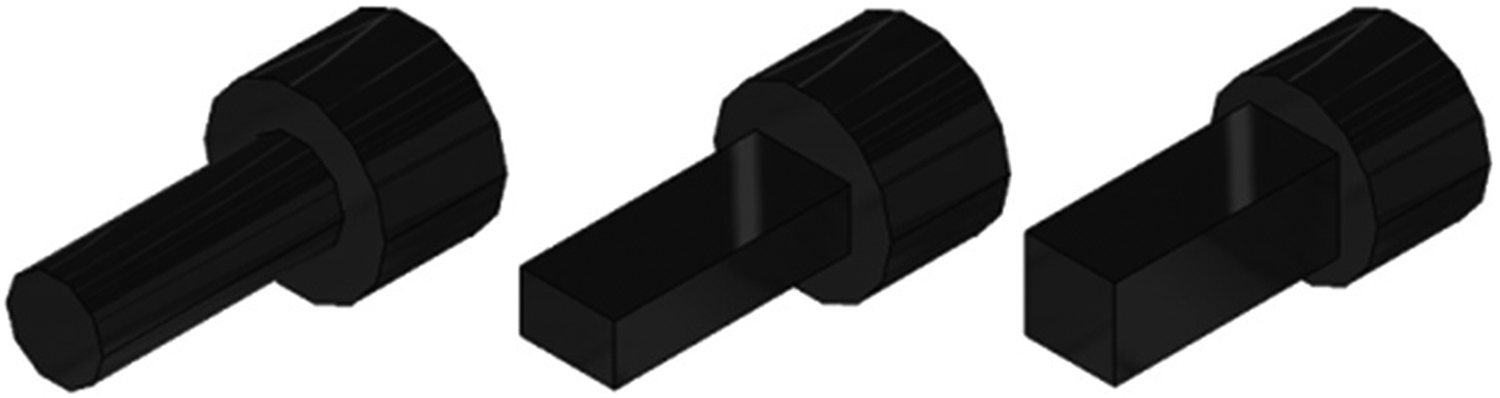
Graphite that has properties mentioned in Table 3 was used as a tool electrode material. Three geometrical-shaped tools, such as square (8 mm×8 mm), circular (8 mm diameter) and rectangular shapes (8 mm×5 mm) were used in the study. Circular shape was obtained by conventional turning while the other two shapes were obtained by milling process. In each geometry, nine electrodes were produced and their dimensions were checked for consistency. Figure 1 shows the computer-aided design (CAD) drawings of the electrodes.
Properties of graphite material used as tool electrode.
Computer-aided design drawings of the graphite tool electrodes.
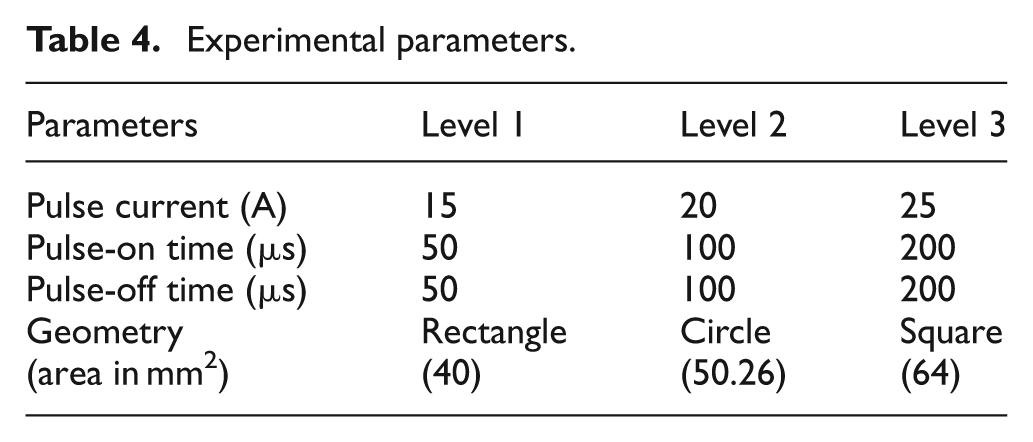
In total, four experimental parameters were considered. Among that, three are electrical parameters including pulse current, pulse-on time, and pulse-off time, and the fourth one is tool geometry and its area of cross-section. Table 4 presents details about the parameters and its three level values. Electrical parameter levels were decided based on the work already performed by Ahmet and Ulas. 7 In their study on surface properties of EDM-machined Ti6Al4, they found that the optimum results lie within this range of values.
Experimental parameters.
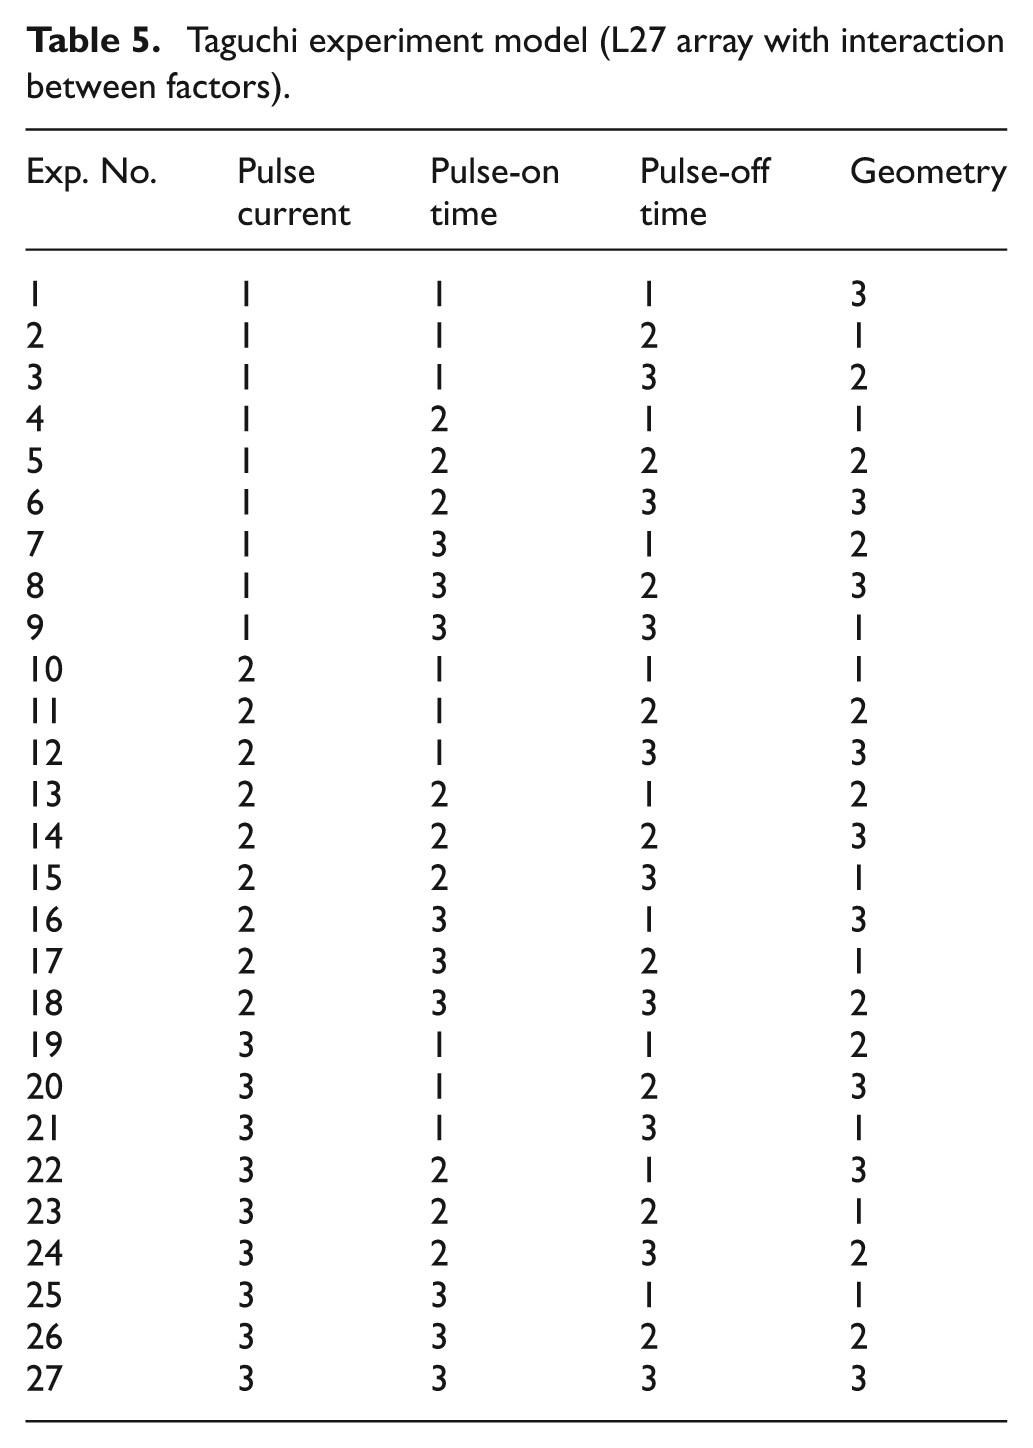
Taguchi’s orthogonal array model was used to design the experiment to reduce the number of replications in the experiment. The orthogonal array chosen was L27 array with interaction between parameters where each row corresponds to a particular experiment (treatment combination) and each column identifies settings of design parameters. For example, in the first run, three design variables are set at their lower level (level 1). Table 5 shows the experiment model with coded parameters where 1 indicates level 1 value, 2 indicates level 2 value, and 3 indicates level 3 value of experimental parameters.
Taguchi experiment model (L27 array with interaction between factors).
The experiments were performed in a ‘V5030’ EDM machine, manufactured by Electronica Corporation, Pune, India. The dielectric fluid used was kerosene with side flushing at a pressure of 0.6 MPa. The gap voltage was kept constant at 60 V. The work piece, top, and bottom faces were ground to a surface finish using a surface-grinding machine before conducting the experiments. The initial weights of the work piece and the tool were weighed using an electronic balance. During the experiment, the work piece was held on the machine table using a specially designed fixture with which the work piece was gas welded. The work piece and the tool were connected to positive and negative terminals of power supply, respectively. At the end of each experiment, the work piece set and the tool were removed, washed, dried, and weighed on an electronic balance. The machining time was determined using a digital stop-watch. New graphite tool electrode was used in every experiment. Nine experiments with different geometries (three each) in a random order were performed on each one of the three work pieces. Figure 2 shows the completed work piece.
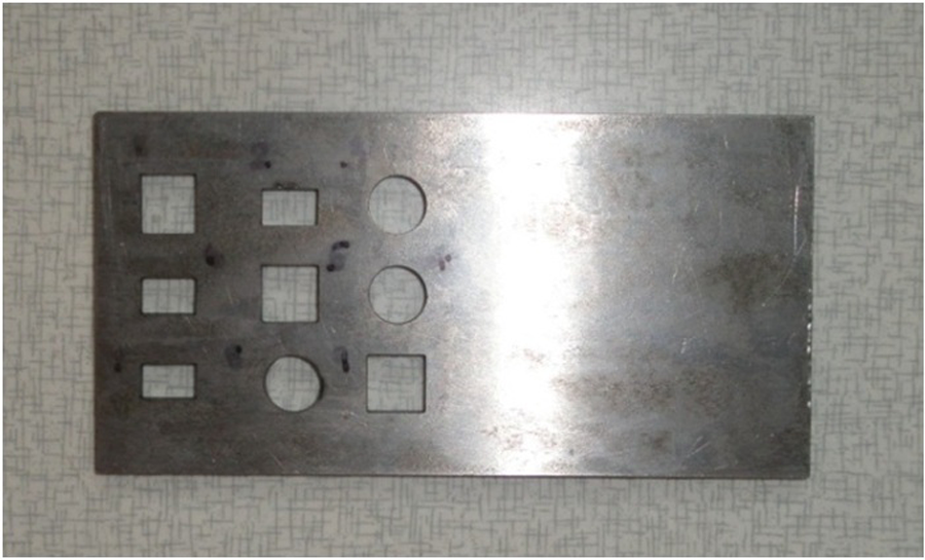
Work piece with the holes.
After every hole was made, the metal removal rate (MRR) in cubic millimeters per minute was calculated using equation (1)

where MRW is the metal removal weight in grams, ρw is the density of the work piece in gram per cubic millimeter, and t is the machining time in minutes. The MRW was calculated by finding the difference between the weight of the work piece before and after a hole was made.
Similarly, after every hole was made, the tool wear rate (TWR) in cubic millimeters per minute was calculated using equation (2)

where TW is the tool weight difference between, before, and after EDM machining in grams, ρt is the density of the tool in gram per cubic millimeter, and t is the machining time in minutes. Surface roughness (SR) was measured using an SR gauge. The SR gauge used was “Perthometer, MahrSurf PS 1” that is shown in Figure 3. The SR values were obtained by allowing a 4-µm stylus tip on the plunger of the gauge to touch and travel over the inner surface of the hole made on the work piece. During measurement, the cut-off length chosen was 0.8 mm, the traversing length limit was set at 5.6 mm, and the number of sampling was 3 for each reading.
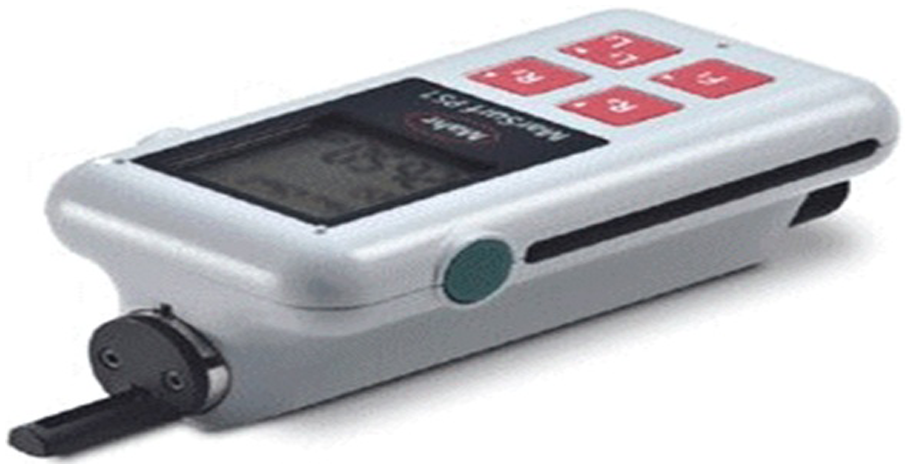
Surface roughness gauge.
The deviation between entry and exit (EED), otherwise known as taper angle, was measured using a coordinate measuring machine (CMM). The CMM was used to calculate the length and width of the hole at the entrance and exit. For a circular hole, it was used to calculate the diameter at the entrance and exit. With a hole depth of 3 mm, the EED dimensions were calculated after drafting them using “Solid Works” software (Dassaut Systemes, USA), the taper angle was observed in degrees. Lesser the deviation between the entrance and exit of a hole, better is the machining process. Figure 4 shows how the length and width of the holes were measured.
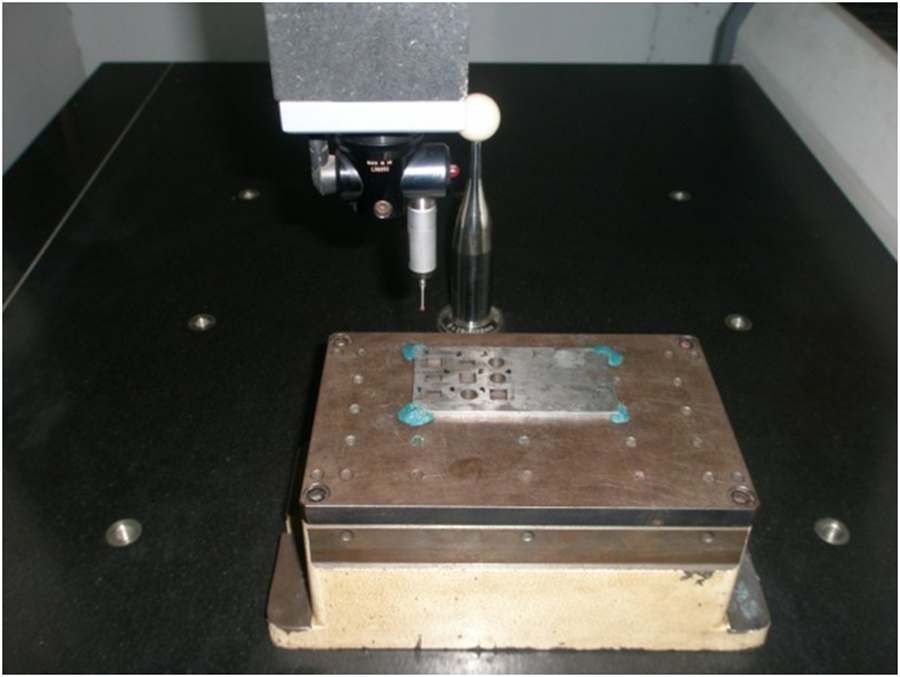
Measuring the length and width of the holes.
The resulting data of the experiment are shown in Table 6 for all 27 experiments. While recording the data, to reduce the gauge error, whenever measurements were taken using a gauge, that is, weight measurement, coordinate measurement, and SR measurement, three measurements were taken and averaged.
Experiment results.
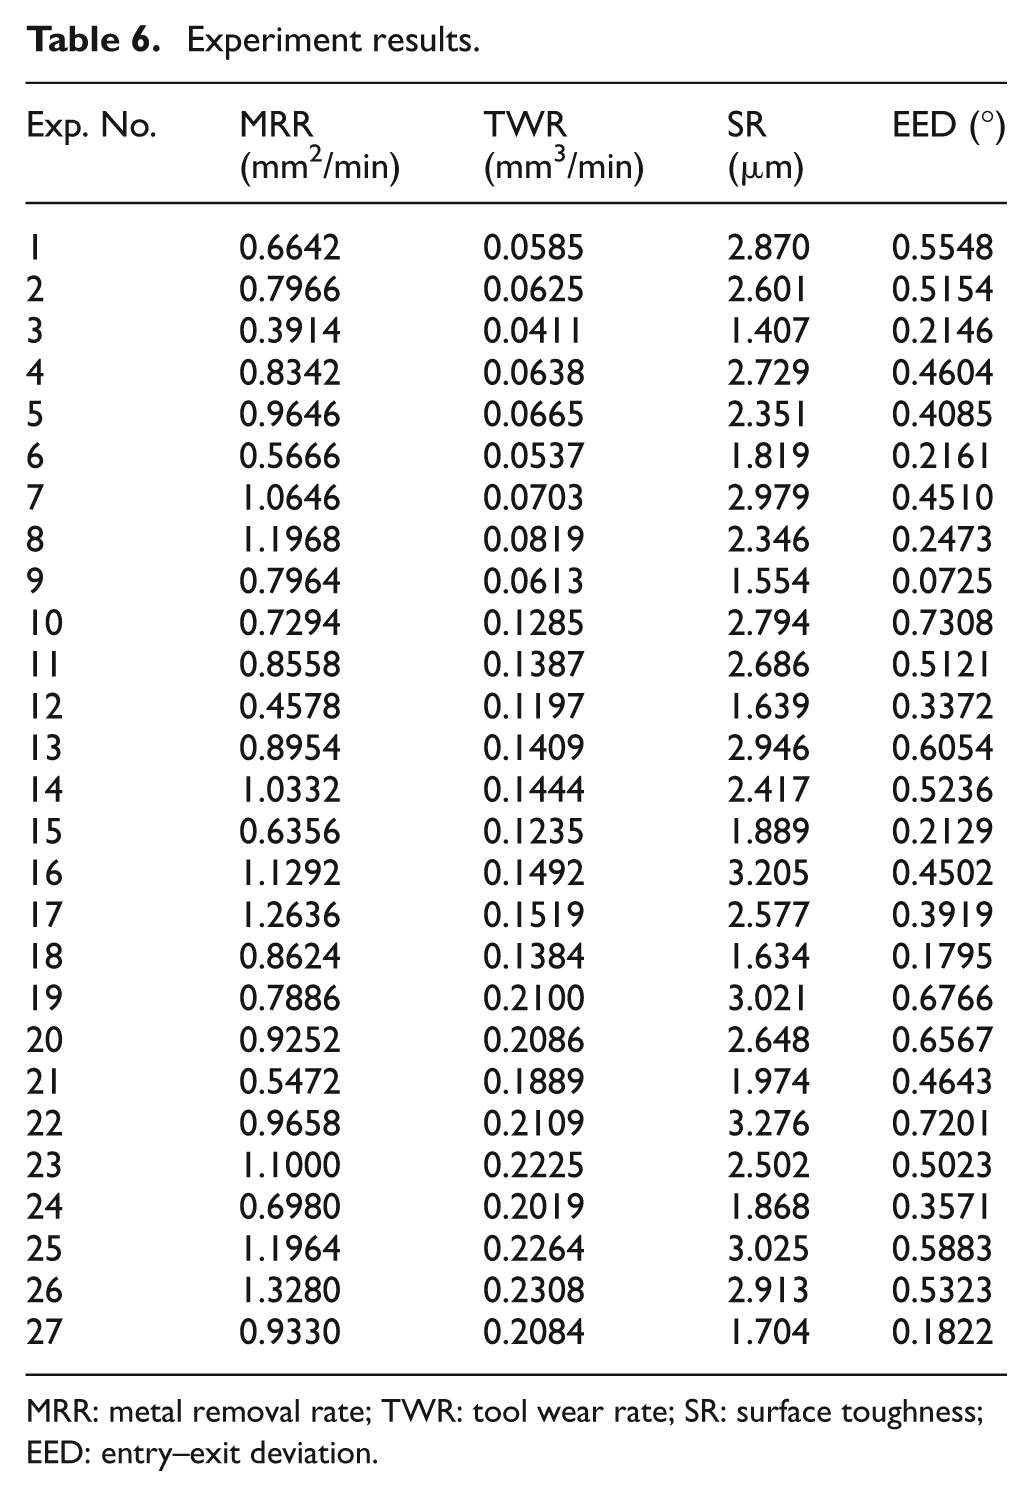
MRR: metal removal rate; TWR: tool wear rate; SR: surface toughness; EED: entry–exit deviation.
Analysis
The experimental results were analyzed using Minitab-R14 software (Minitab, USA). Taguchi analysis based on signal-to-noise (S/N) ratios was used to find out the influence of process parameters and its interactive effects over the machining responses. The S/N ratio is used to measure the variation of a response with respect to the noise factors. In that, S stands for the signal that is the measure of mean of desirable output characteristics, and N stands for the noise that is undesirable (standard deviation). For all the responses, in the analysis “larger is better approach” of S/N ratio was used, because of that higher values of S/N in MRR and lower values of S/N in TWR, SR, and EED are indicating the better machining performance. 13 The S/N ratio for a response y in j-th experiment in “larger is better approach” is defined as
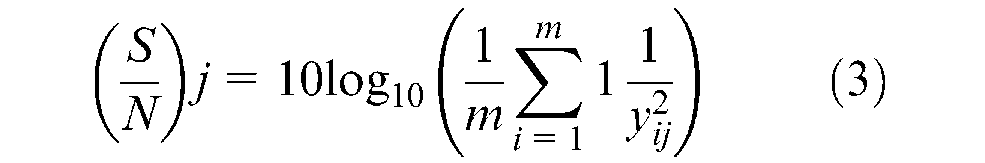
where m is the total number of replications, and yij is the value of a response in i-th replication and j-th experimental condition. 11 To test the significance of factor influence over the responses, the analysis of variance (ANOVA) was used where p-values of ANOVA and adjusted R2 values were used to find out the significance of factors influence and goodness of the model, respectively. ANOVA, p-value is the probability measure of the variation between conditions may have occurred by chance. If its value is less than 5%, it is a practice to accept the significance of a factor effect; whereas R2 value is a measure of how good the data are in prediction. For all responses, adjusted R2 values were more than 95% except for MRR where it was slightly greater than 80%. So the experiment model was found to be good and produced highly reliable results. Residual analysis also was performed to find out the fitness of data. At the end, partial least squares–based regression analysis was performed to find out the regression equations that relate the parameters with responses. The effectiveness of the model was validated with an experiment.
Analysis results
Factors effect on MRR
The ANOVA of the factors effect over MRR, found that the effect of individual factors is significant over the response as their p-values are less than 5% as shown in Table 7. From Figure 5, it was found that the current and the area of cross-section of the tool have direct relationship with MRR as the increase of these two factors proportionally increases MRR. When pulse-on time is between 50 and 100 µs, the MRR shows a direct relationship but, after 100 µs, the curve shows an inverse relationship as it drops down. This may be due to, until optimum value pulse-on time increases the power intensity of the spark and beyond that it reduces the power intensity. So there is a scope to find out the optimum value of pulse-on time by repeating the experiment with intermediate points. The pulse-off time shows very little bearing on MRR as the curve is almost a horizontal line as shown in Figure 6. This result confirms the findings of Belgassim and Abusaada 10 and Lee and Li. 14
Analysis of variance for S/N ratios—MRR.
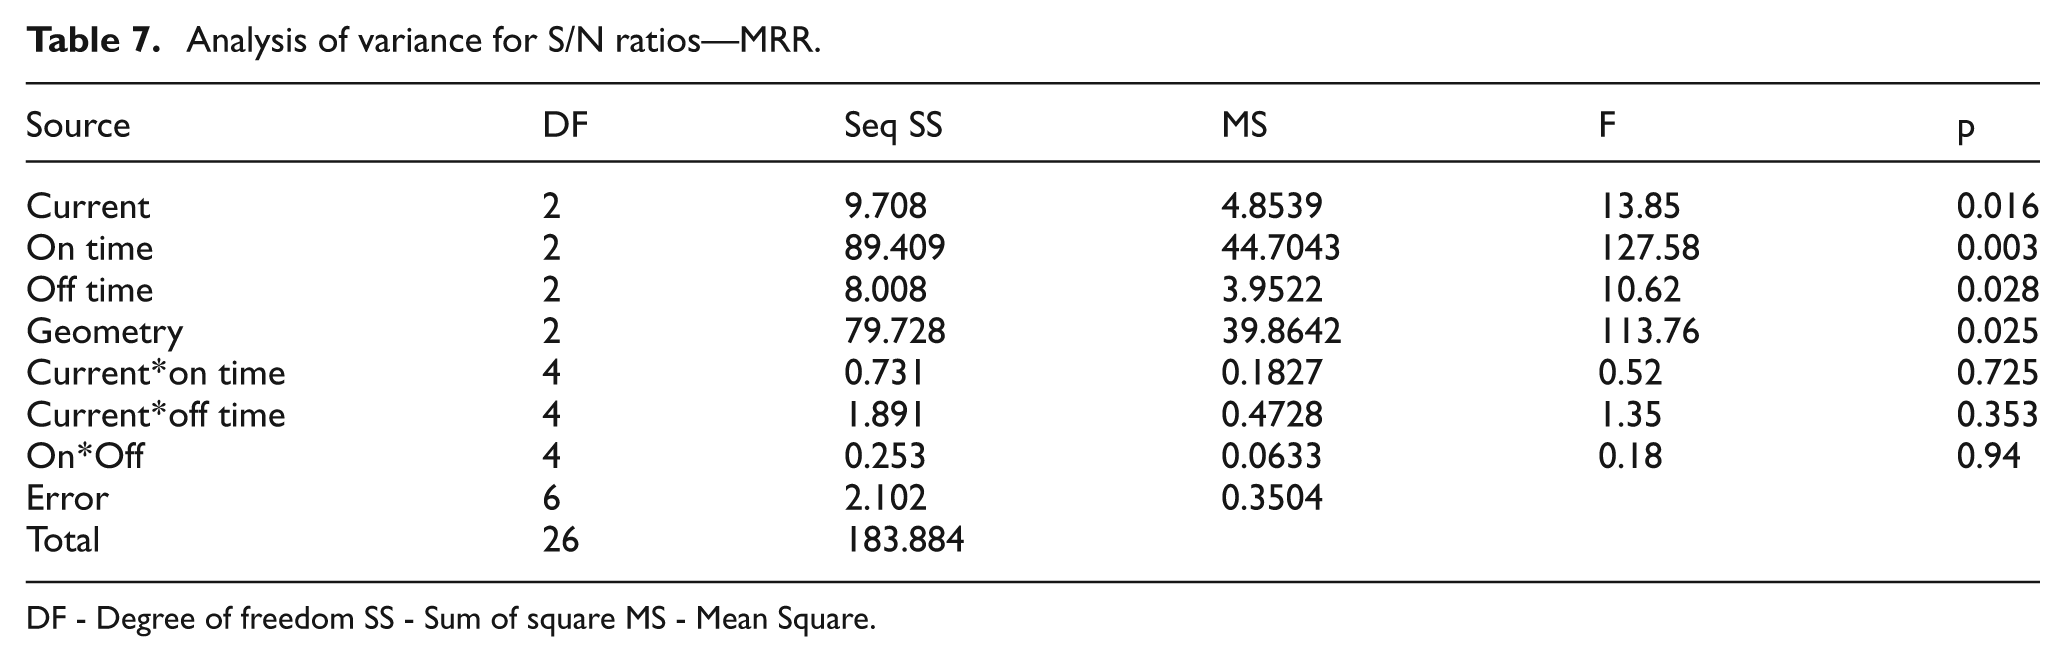
DF - Degree of freedom SS - Sum of square MS - Mean Square.
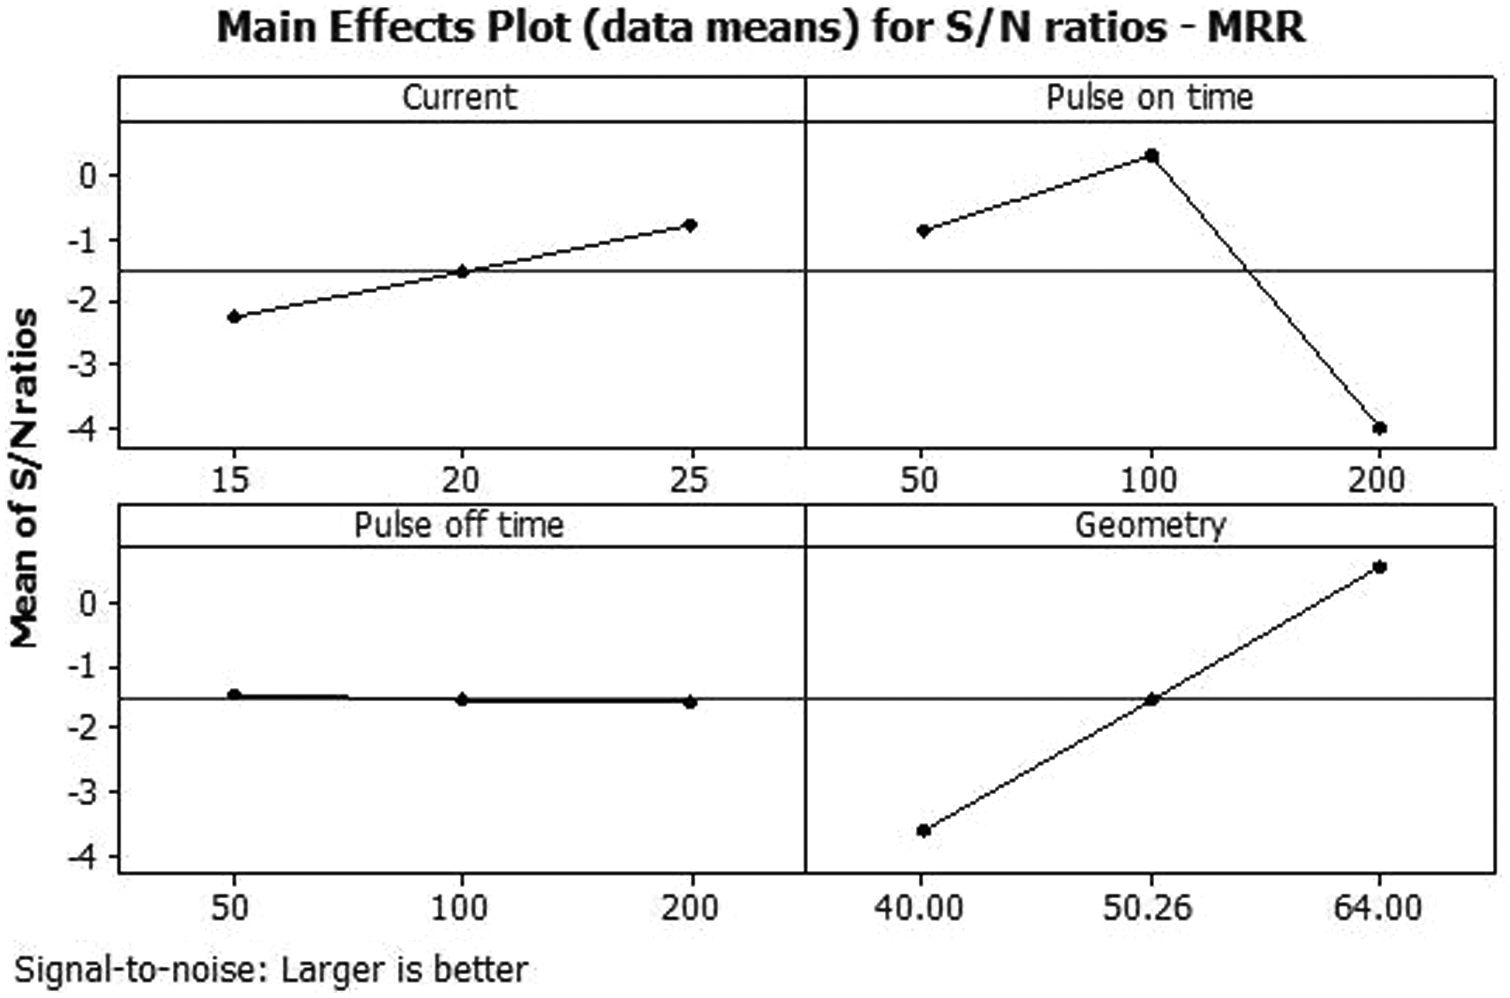
Main effect plot for MRR.
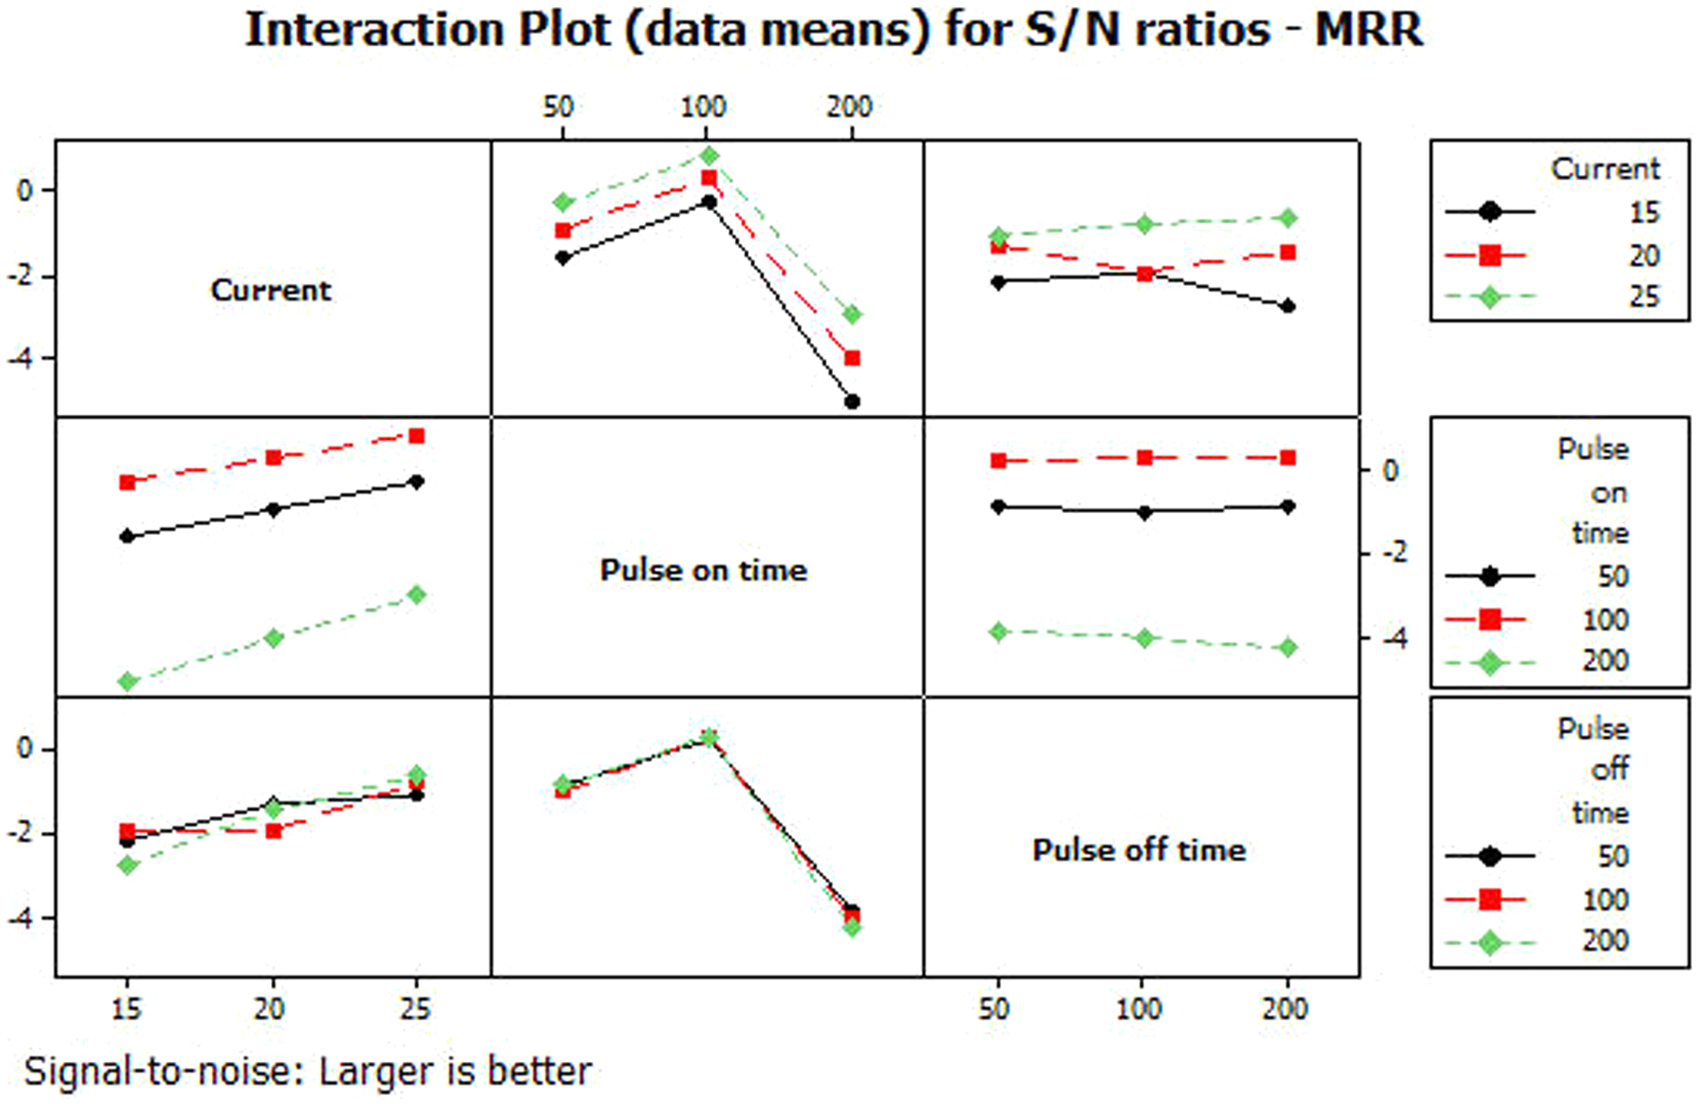
Interaction effect plot for MRR.
As shown in Figure 6, the interaction effect of electrical parameters over MRR is found to be negligible. This is in agreement with the p-values of Table 7, as they are in the insignificant range, and confirms null hypothesis. However, the interaction between current and pulse-off time has a very little effect at around 20 A. The residual analysis graphs shown in Figure 7 do not show any particular pattern in the residuals that is the characteristic of good model and reliable data.
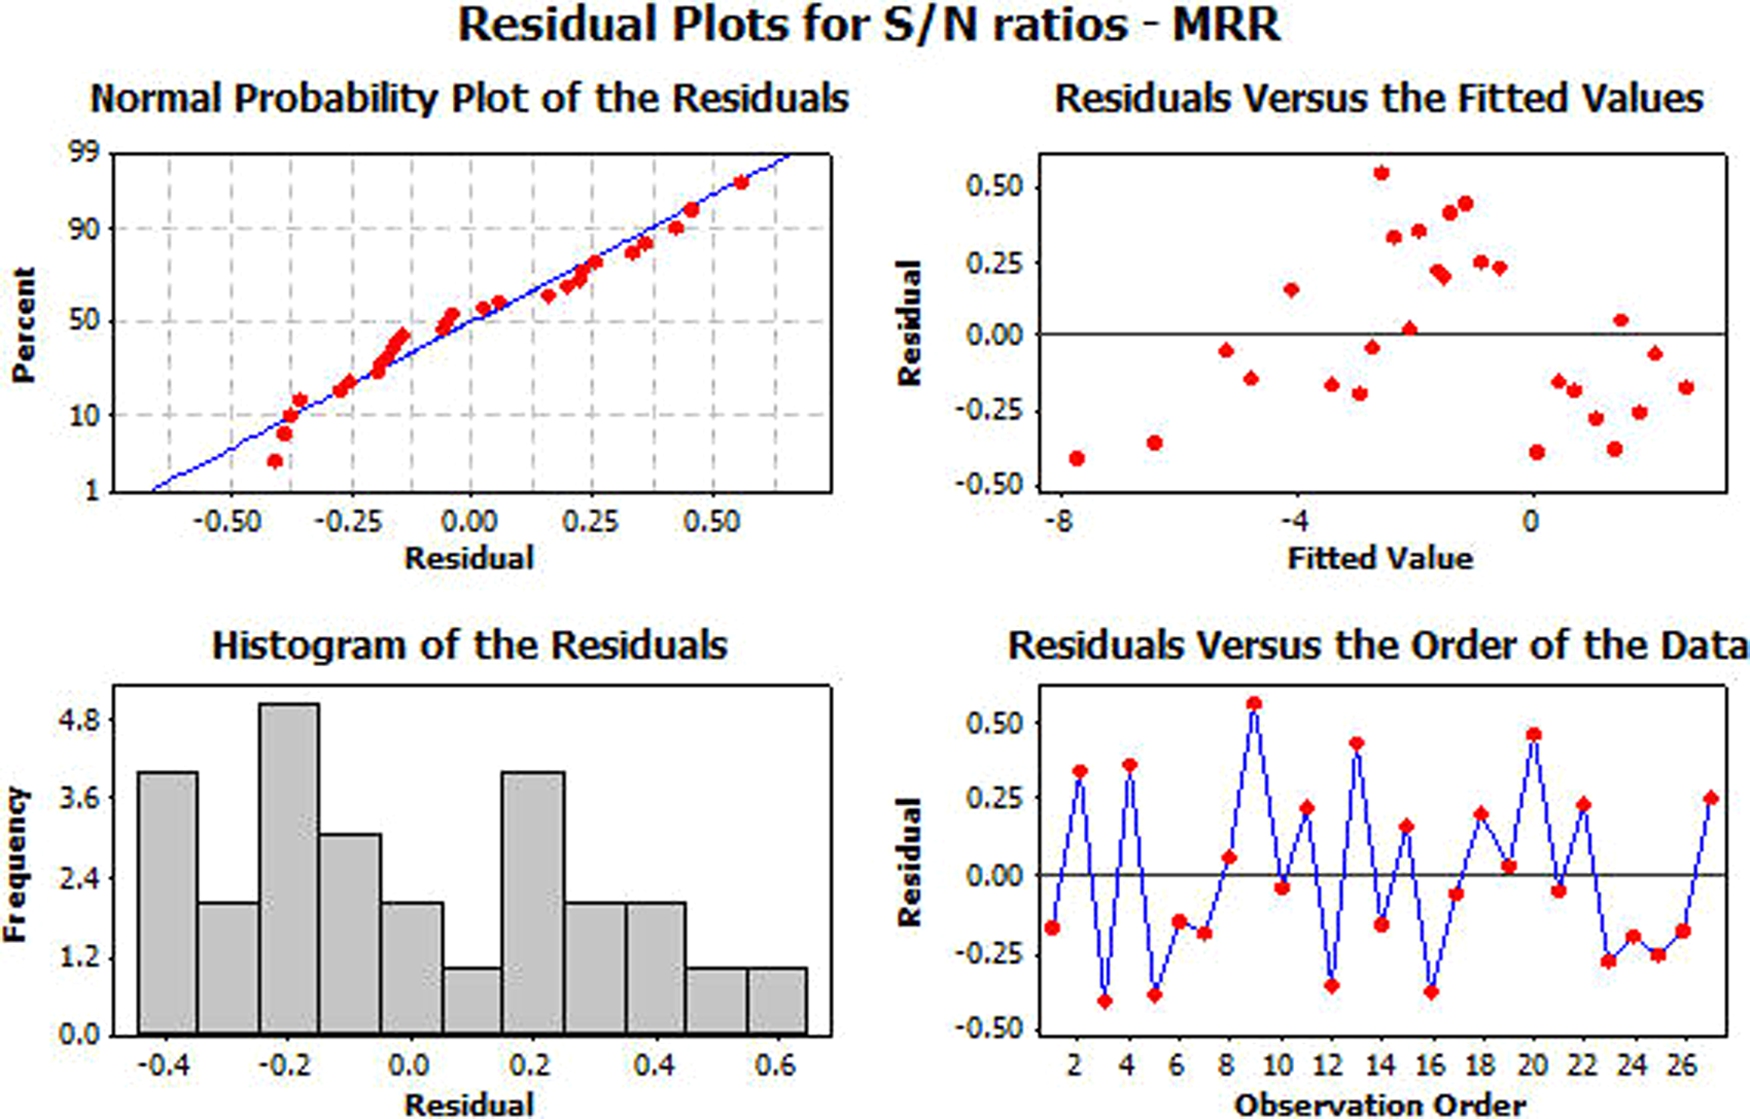
Residual analysis plot for MRR.
Factors effect on TWR
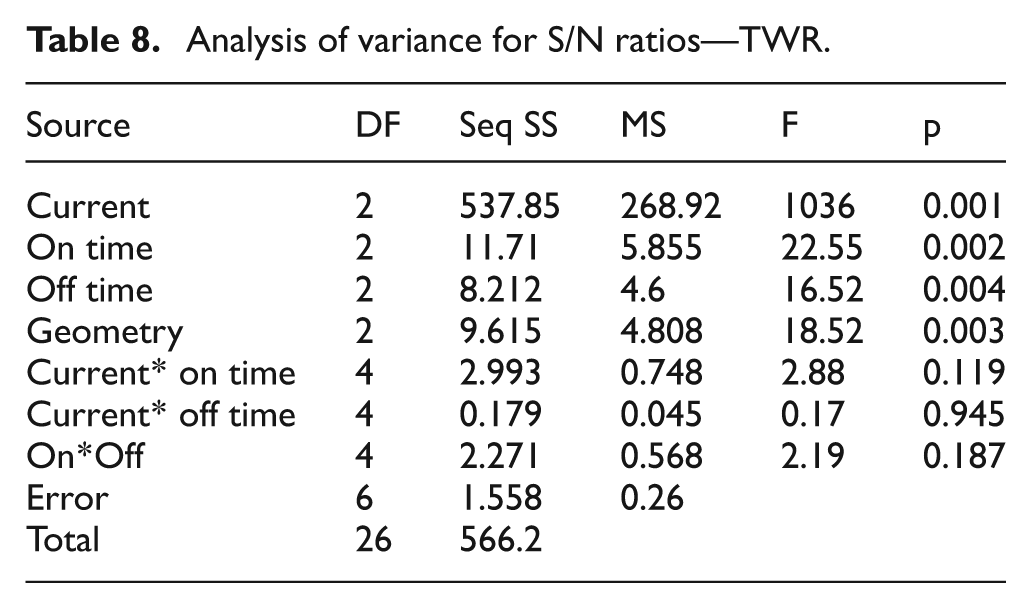
The influence of factors over TWR shows similar trends as that of MRR. In Table 8, the p-values confirming again the individual effect of factors are significant over TWR whereas the interaction effect of factors is found to be insignificant. Here, both the current and the area of cross-section of the tool have direct relationship with the TWR; whereas the pulse-off time seems to not to influence TWR. Here again, the pulse-on time between 50 and 100 µs has direct relationship, and beyond 100 µs, it has inverse relationship as shown in Figure 8. When there is high power intensity spark, both MRR and TWR are high as the spark erodes both work piece and tool. But the slope of the curves shows that MRR is at much higher rate than TWR.
Analysis of variance for S/N ratios—TWR.
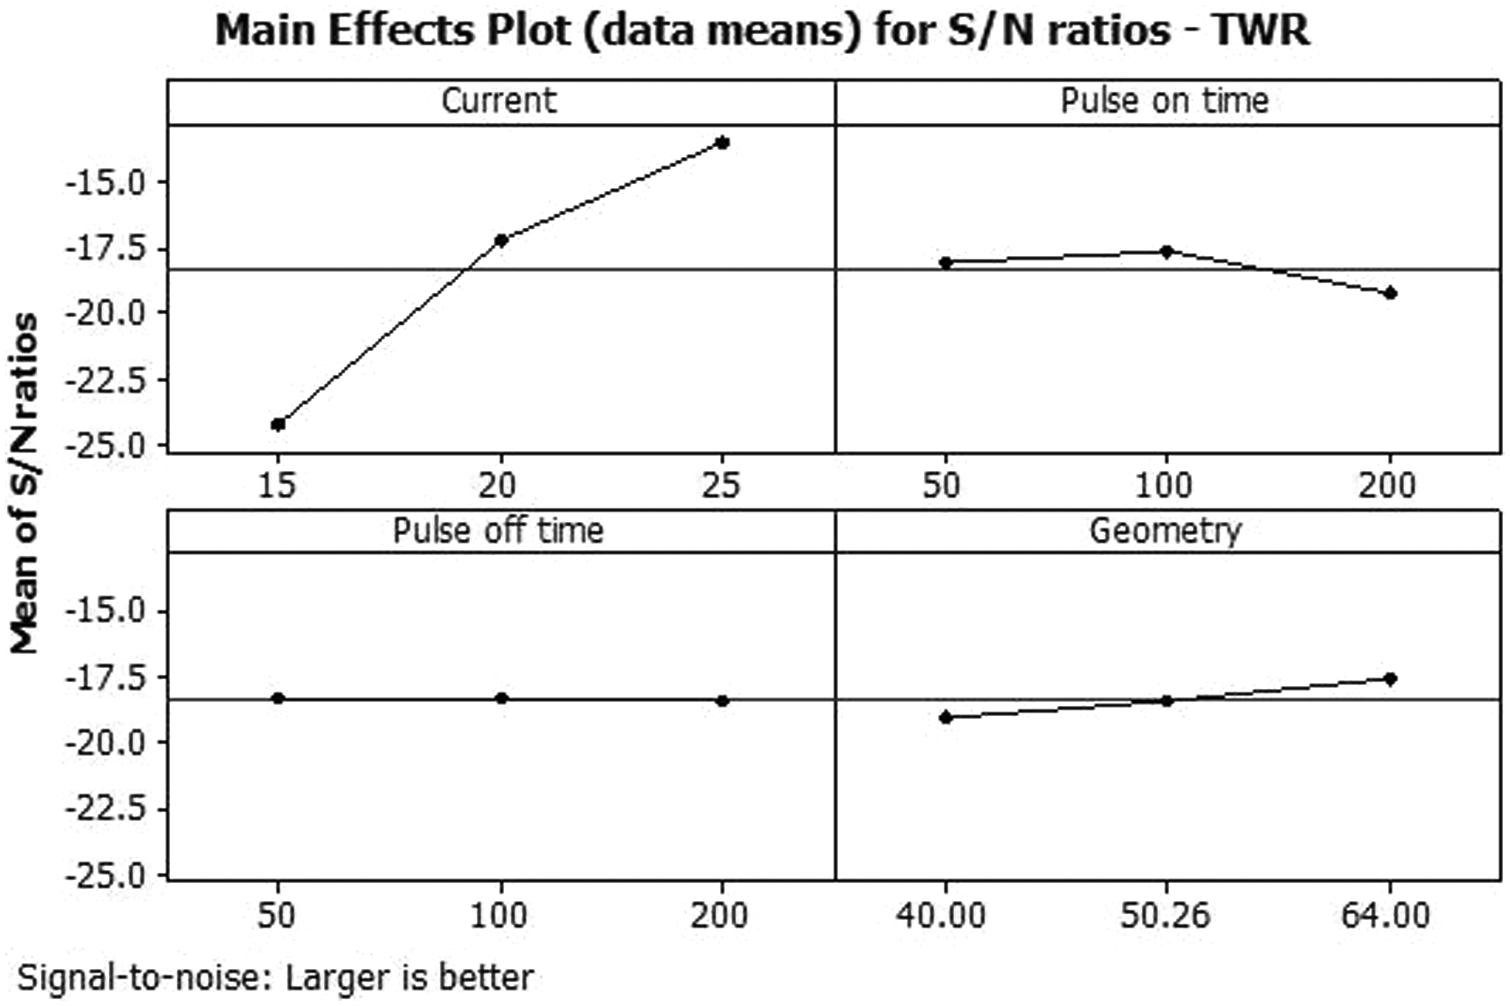
Main effect plot for TWR.
As shown in Figure 9 and Table 8, the interaction effect of electrical parameters over TWR is found to be nil. The residual analysis graphs shown in Figure 10 do not show any particular pattern in the residuals, which confirms good model reliability.
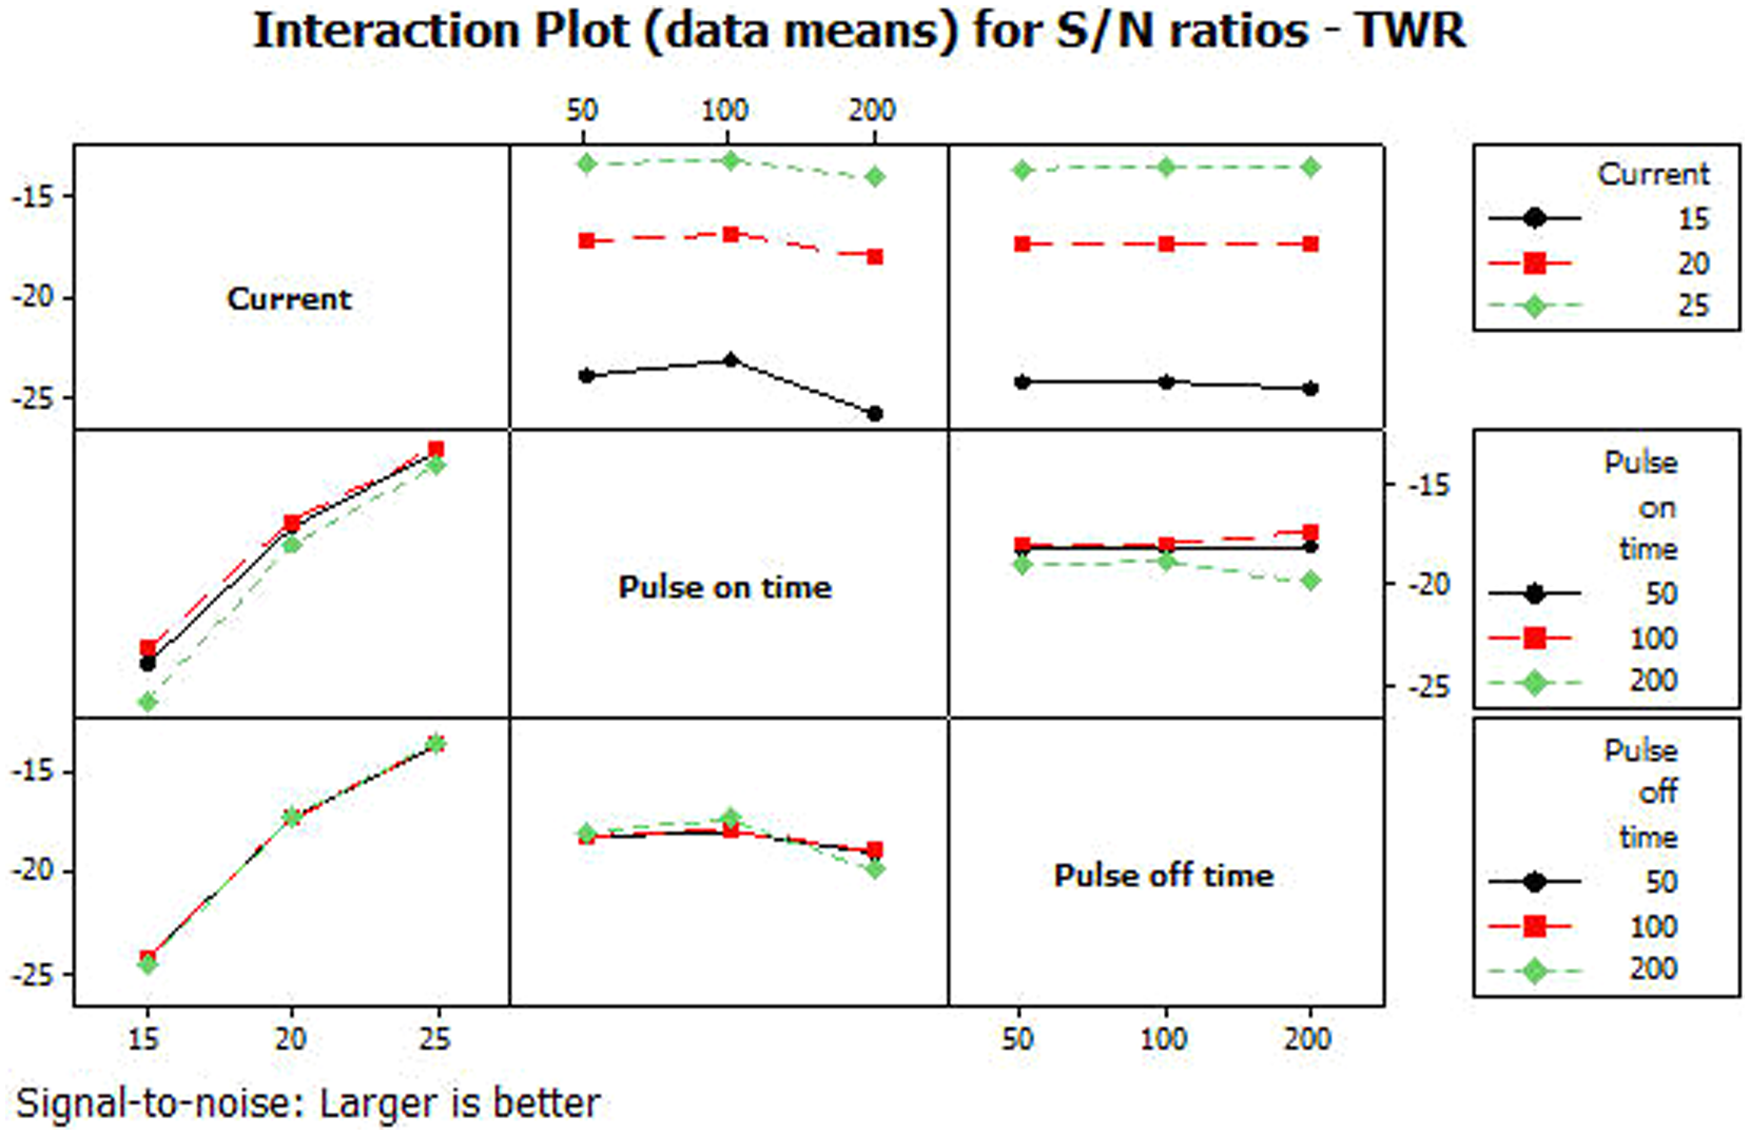
Interaction effect plot for TWR.
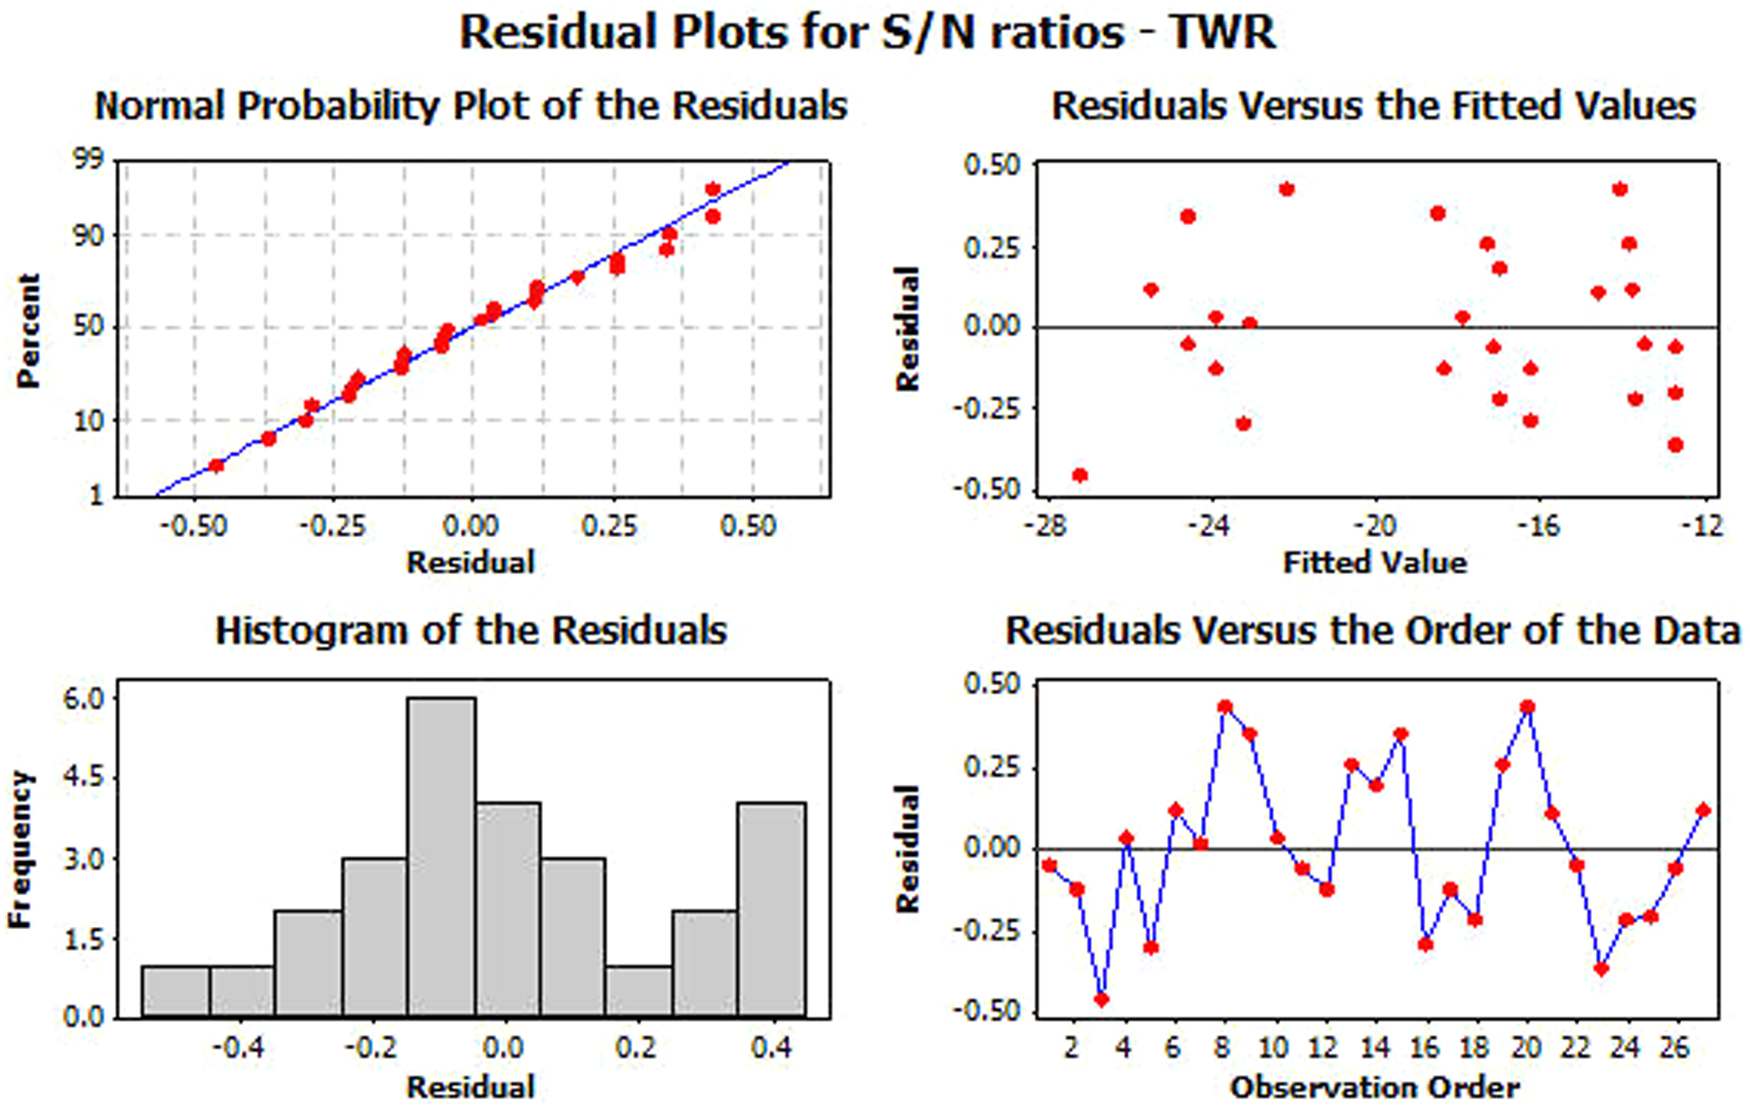
Residual analysis plot for TWR.
Factors effect on SR
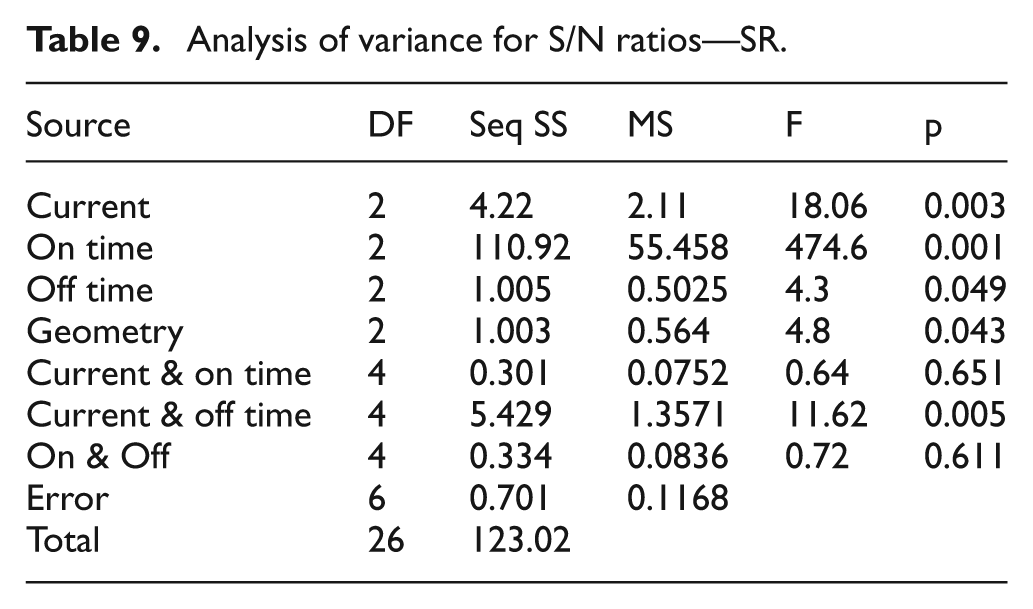
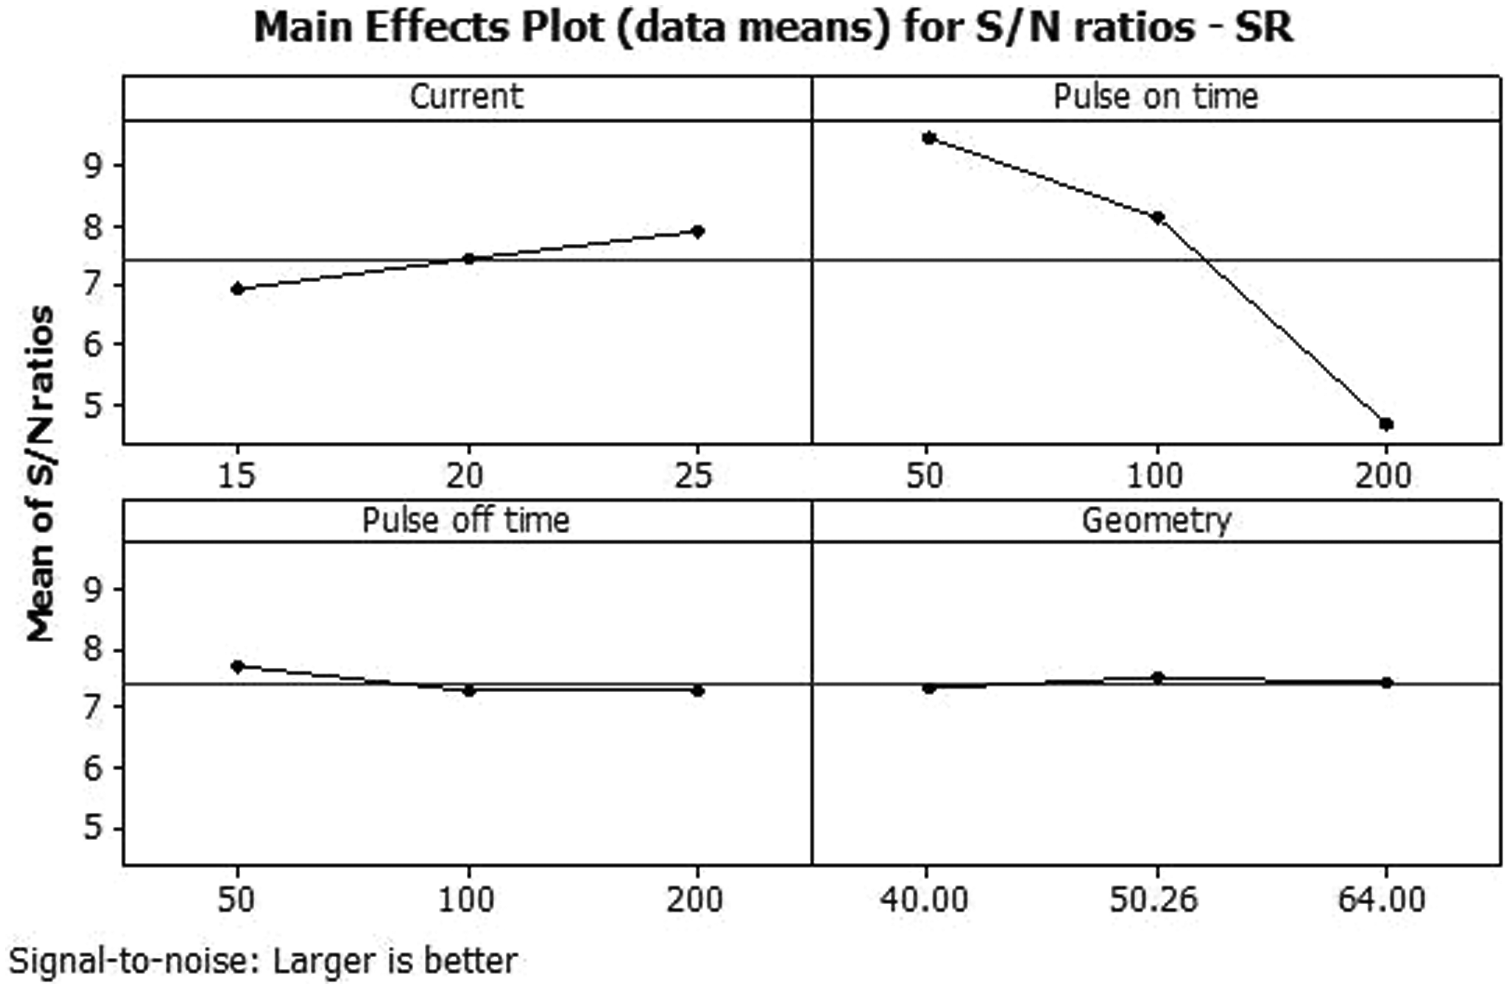
The ANOVA results in Table 9 once again confirms the effect of individual factors; in addition, it is found that the effect of interaction between the current and the pulse-off time over SR is close to significant. The S/N analysis results show that an increase in current value alone increases the SR; whereas pulse-on time and pulse-off time at higher values reduce the SR of the resultant product (Figure 11). One reason for this phenomenon is when the time availability is more between two sparks, the dielectric has enough time to cool the surface and washes away the debris that results in a better surface. The tool geometry does not show any influence on the SR as shown in Figure 11.
Analysis of variance for S/N ratios—SR.
Main effect plot for SR.
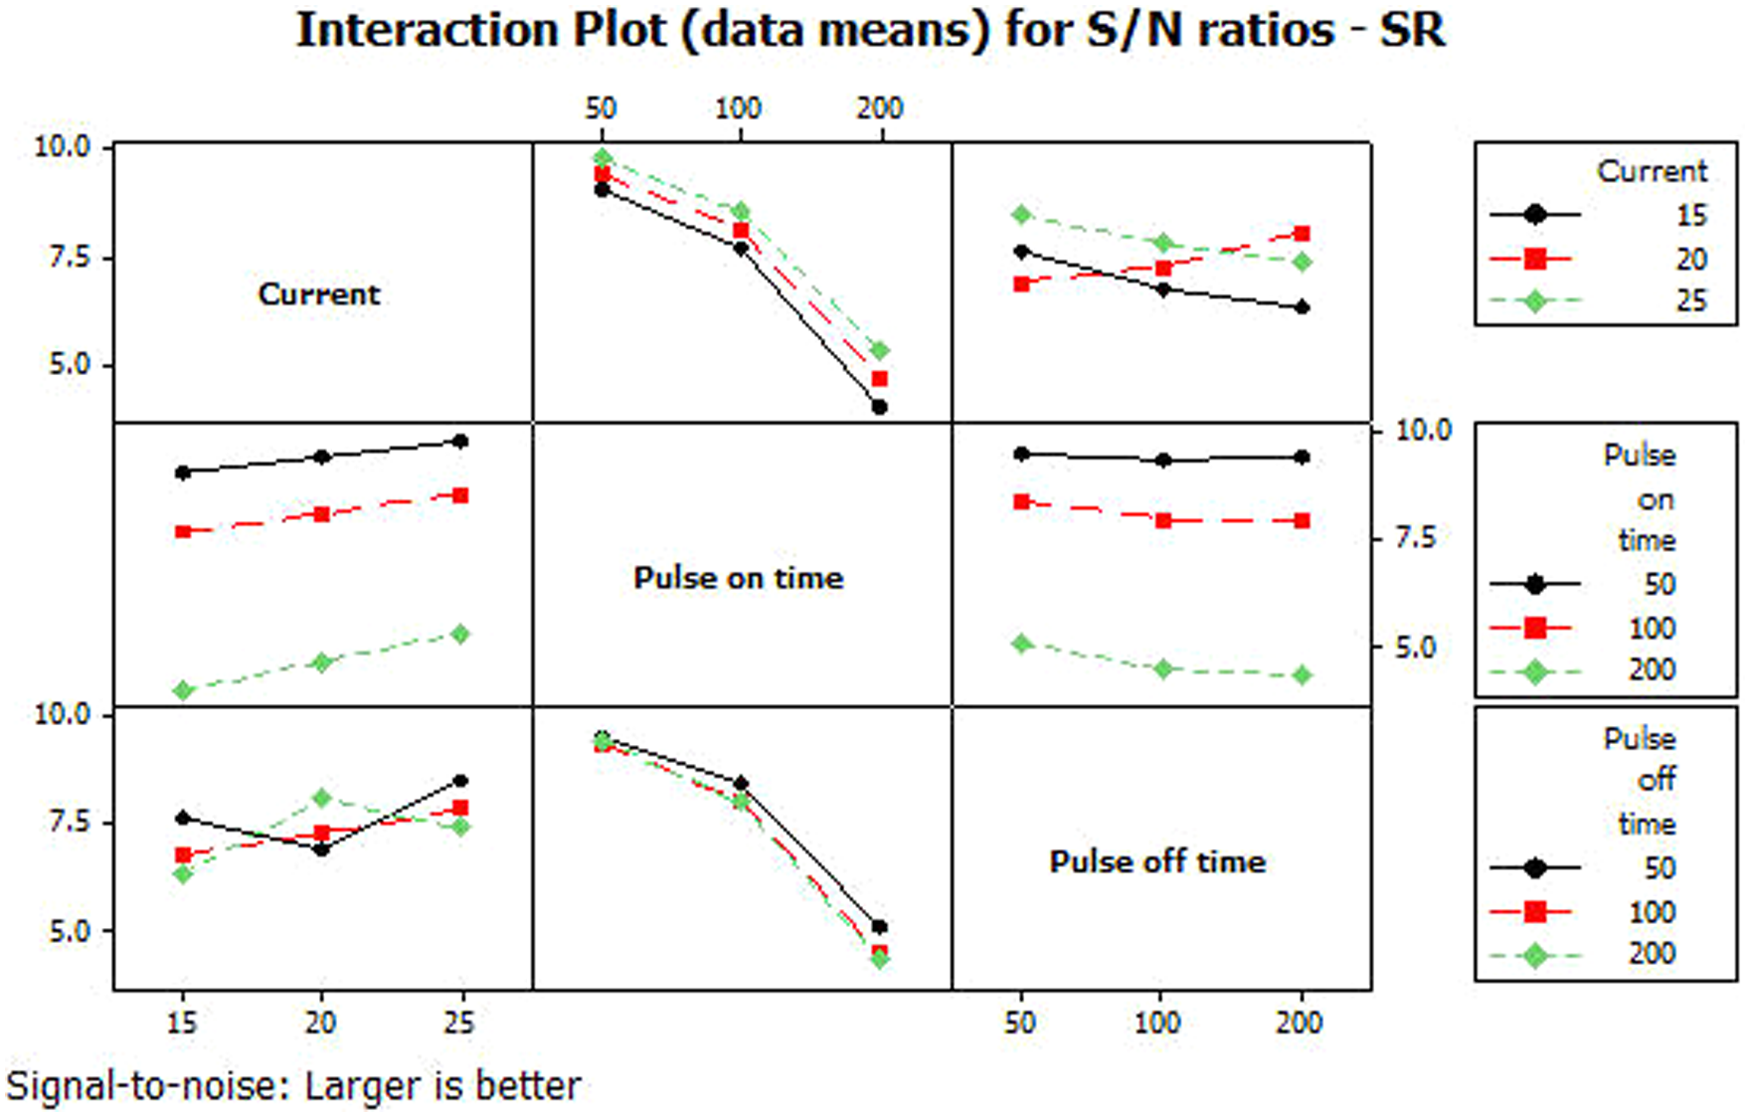
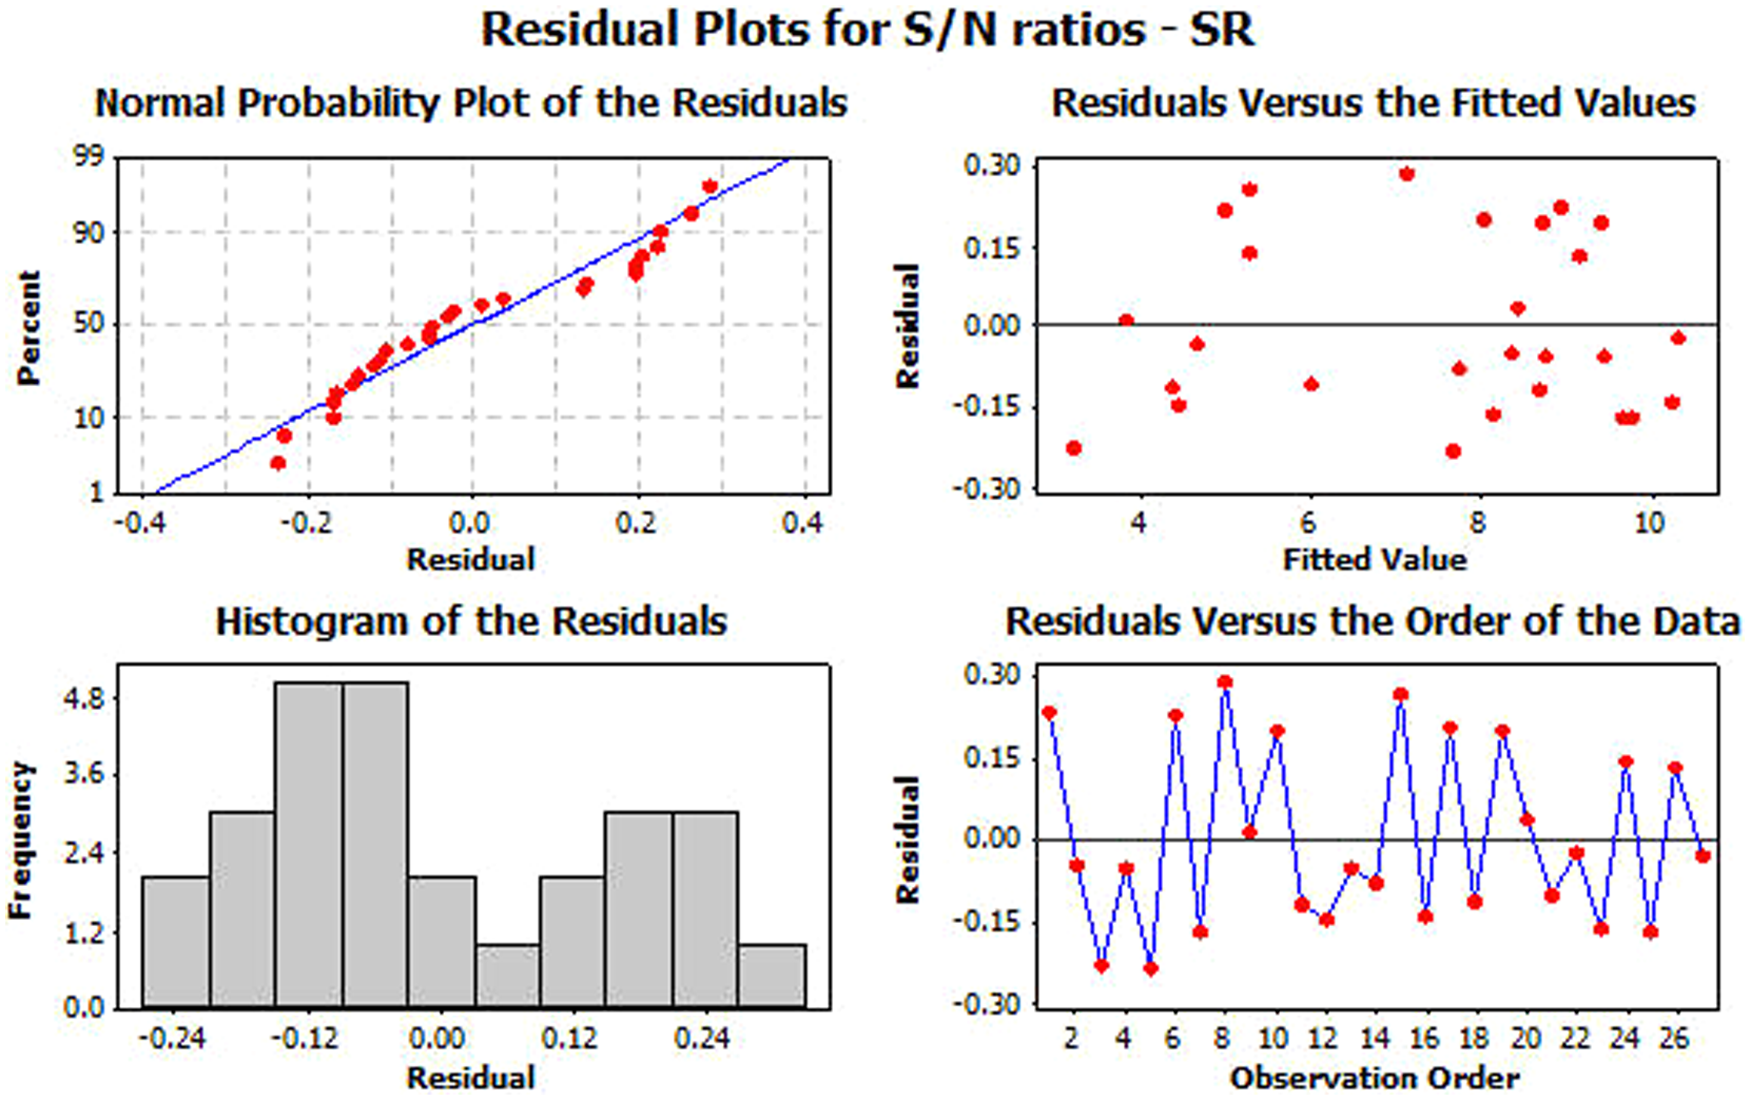
As shown in Figure 12, the interaction effect of electrical parameters over SR is found to be negligible. Once again like in MRR, the interaction between the current and the pulse-off time has a little effect at around 20 A. The residual analysis graphs shown in Figure 13 confirm good model reliability.
Interaction effect plot for SR.
Residual analysis plot for SR.
Factors effect on EED
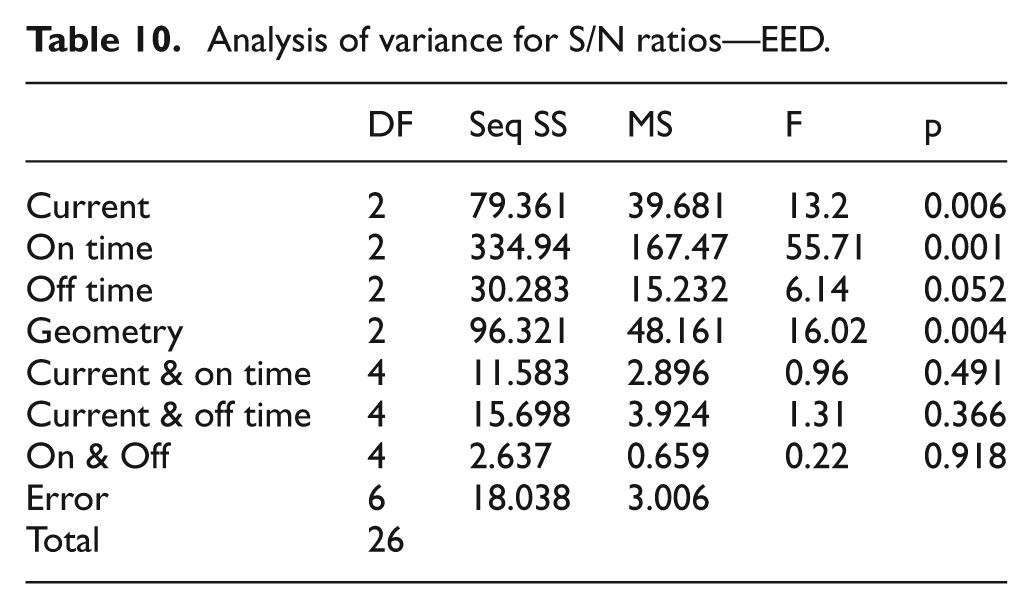
Once again, the effect of individual factors over EED is found to be significant whereas the interactive effects over EED are found to be insignificant by the p-values of ANOVA shown in Table 10. The S/N ratio analysis shows that except current all other factors are reducing the deviation between EED at higher values as shown in Figure 14. An important finding in this analysis is that more than geometry, the cross-sectional area is influencing the deviation more, because there is no significant difference between the plane-surface tools with sharper edges such as rectangle and square, and the curved-surface tools such as the cylindrical one used here. But the cross-sectional area when increases, reducing the deviation as shown in Figure 14.
Analysis of variance for S/N ratios—EED.
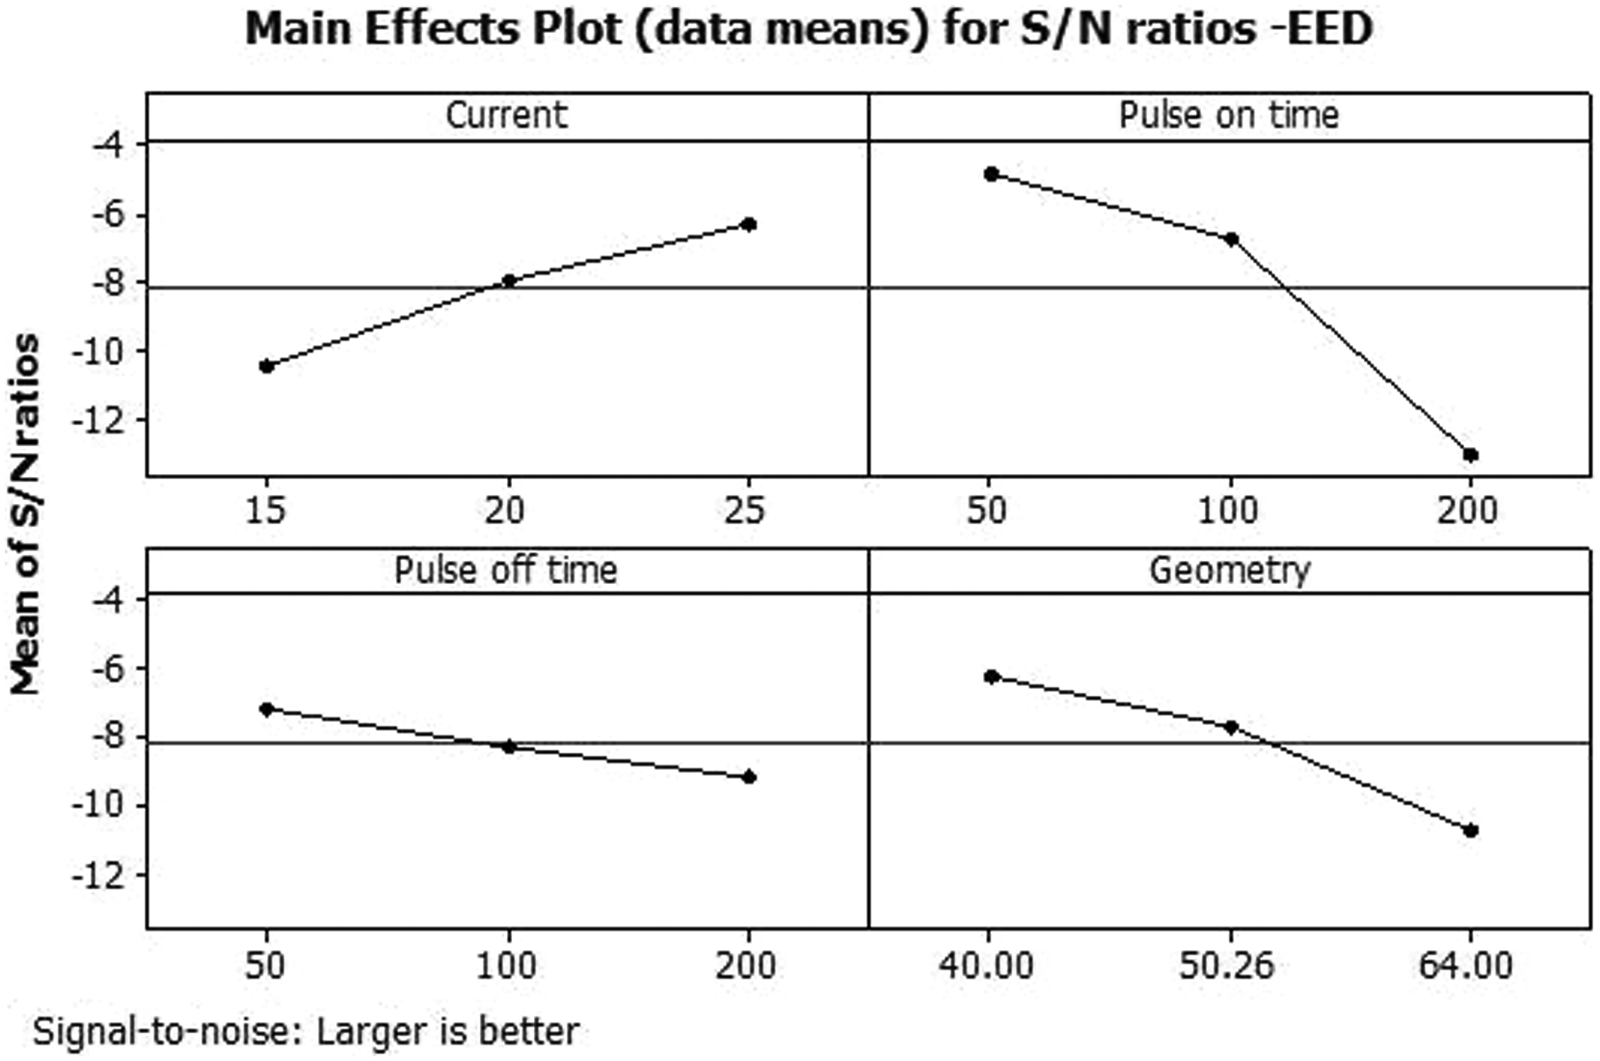
Main effect plot for EED.
As shown in Figure 15, the interaction effect of electrical parameters over EED is found to be nil. The residual analysis graphs shown in Figure 16 confirm good model reliability.
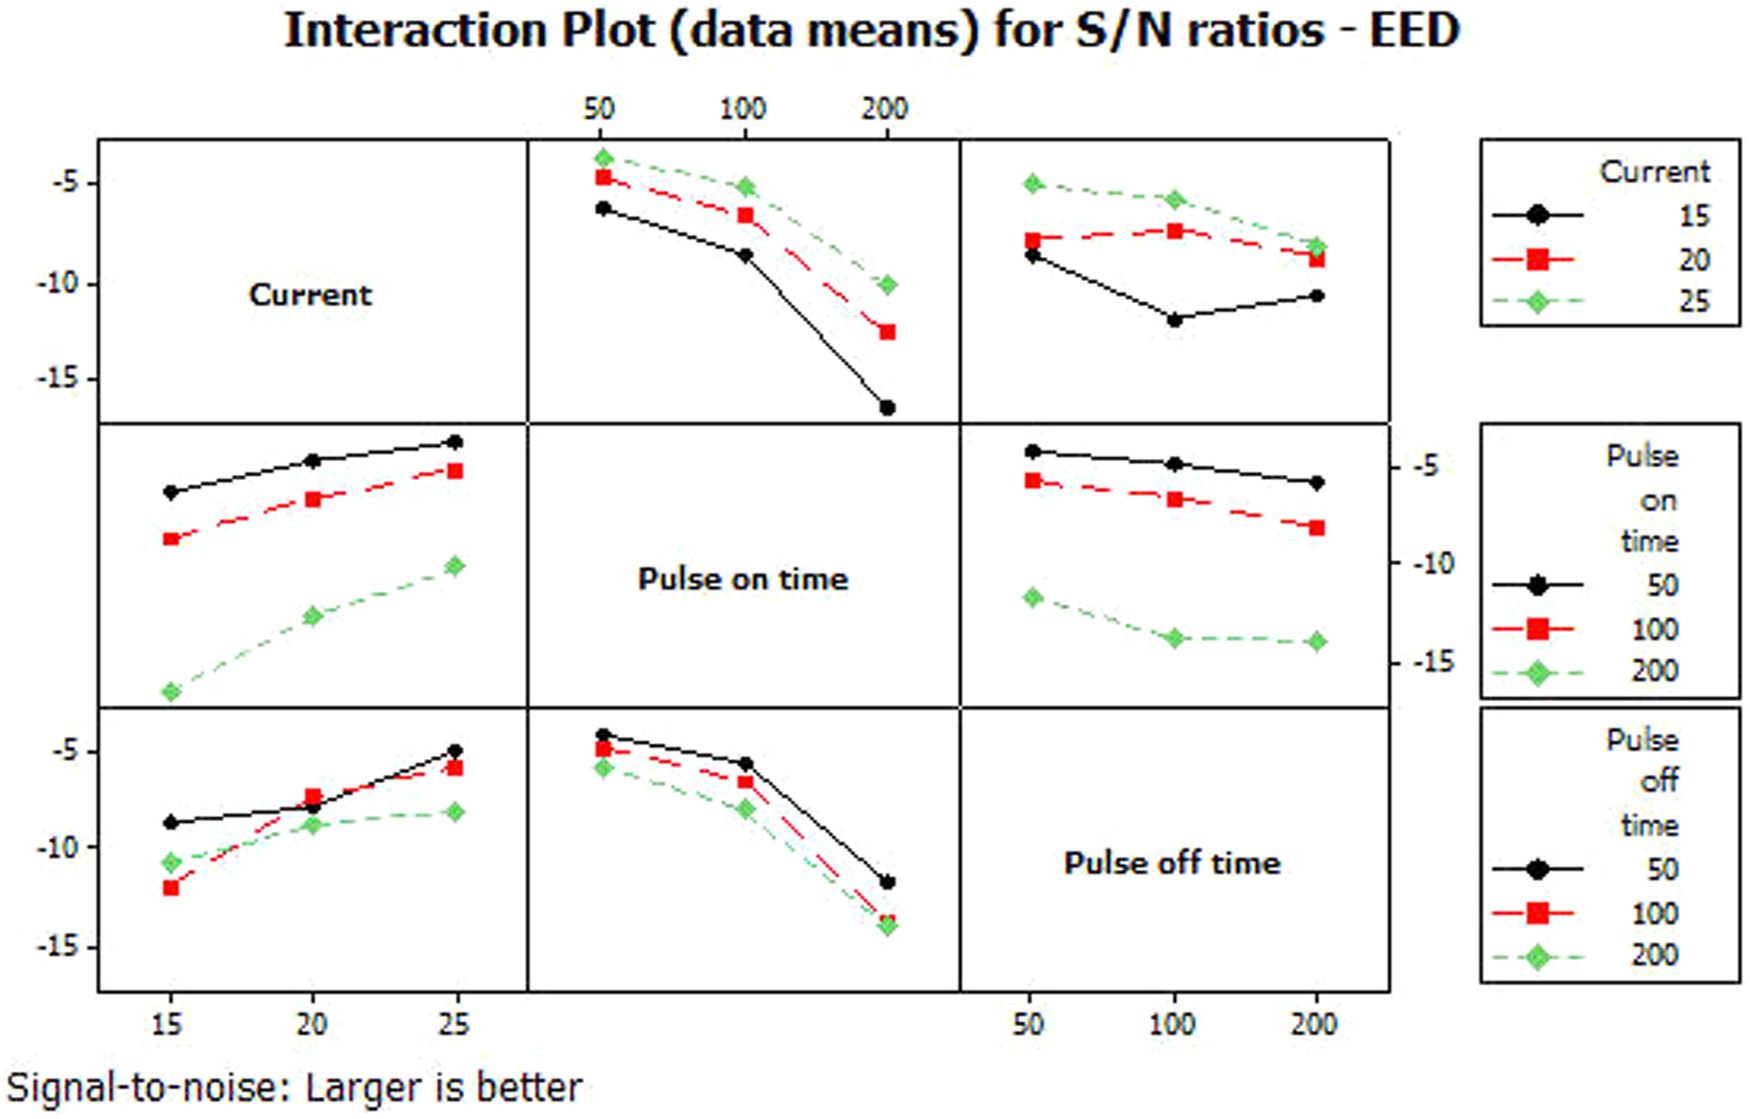
Interaction effect plot for EED.
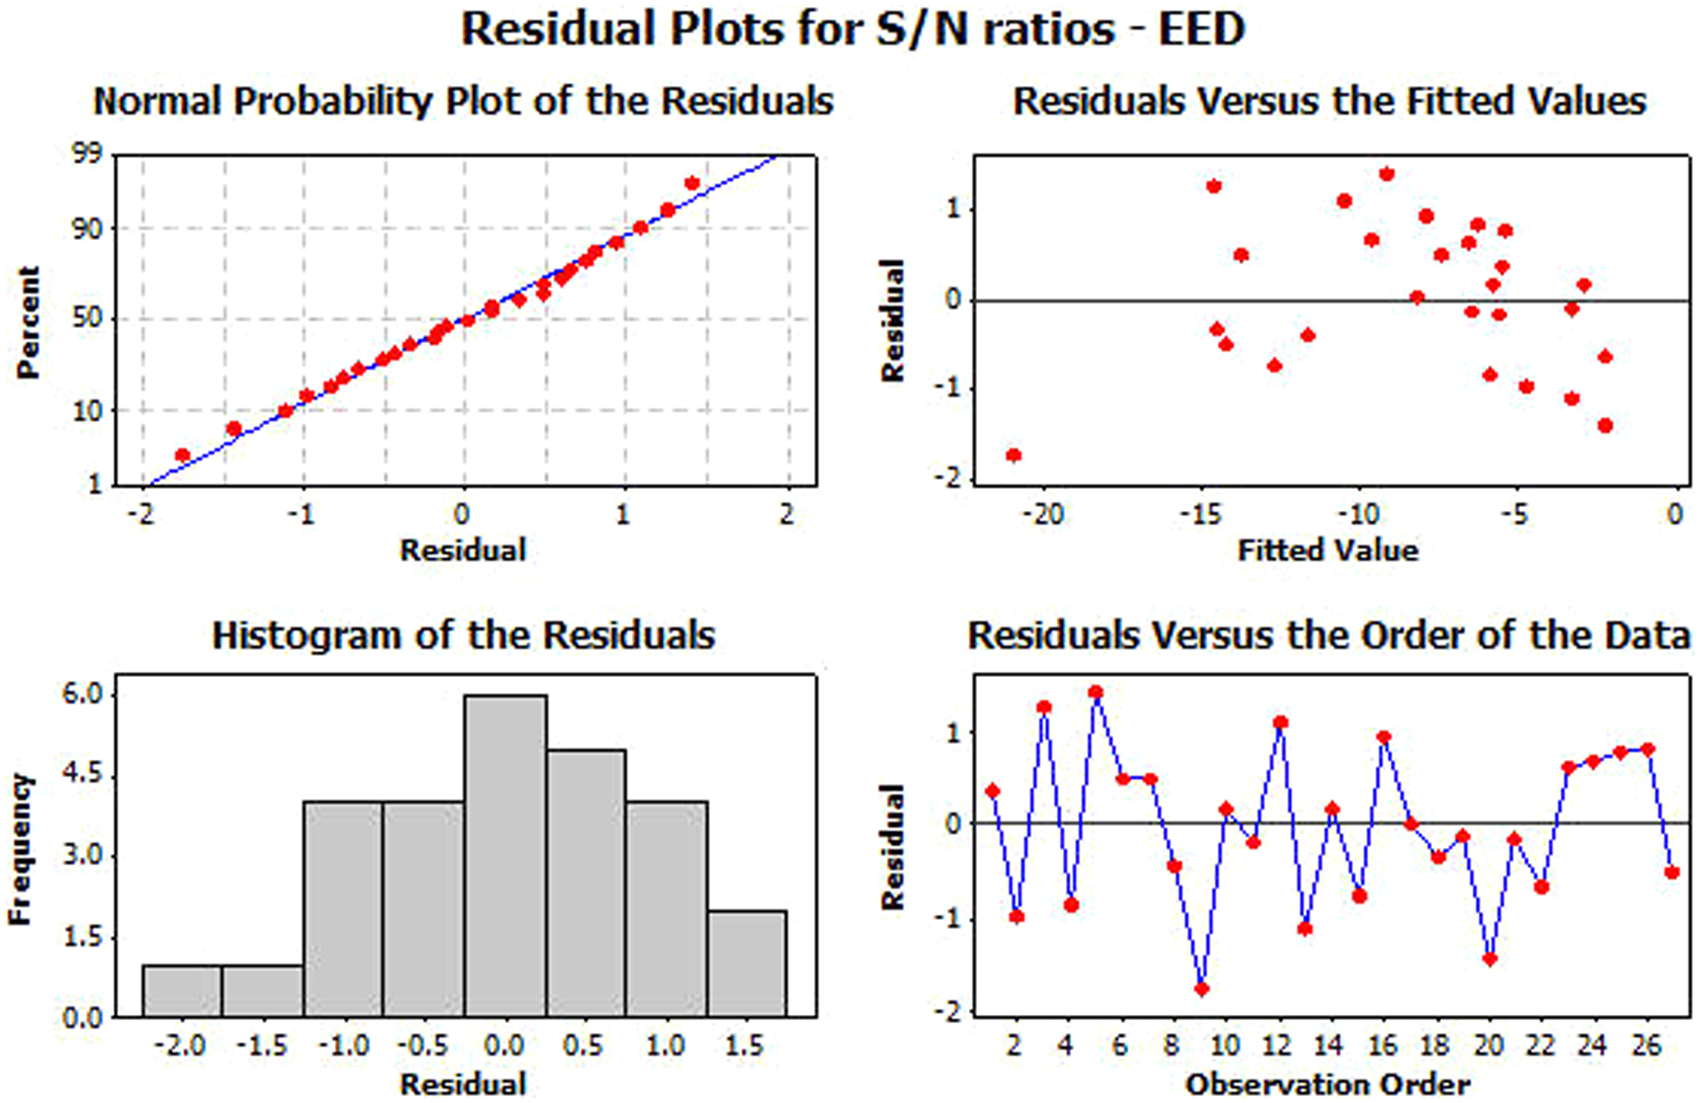
Residual analysis plot for EED.
Delta values and influence ranking
Table 11 consolidates the influence of individual factors over the responses with the help of delta values. The delta values are statistical data that provide magnitude of influence with which the ranking and the real extent of influence of that factor over a response can be seen.
Delta values and influence ranking.
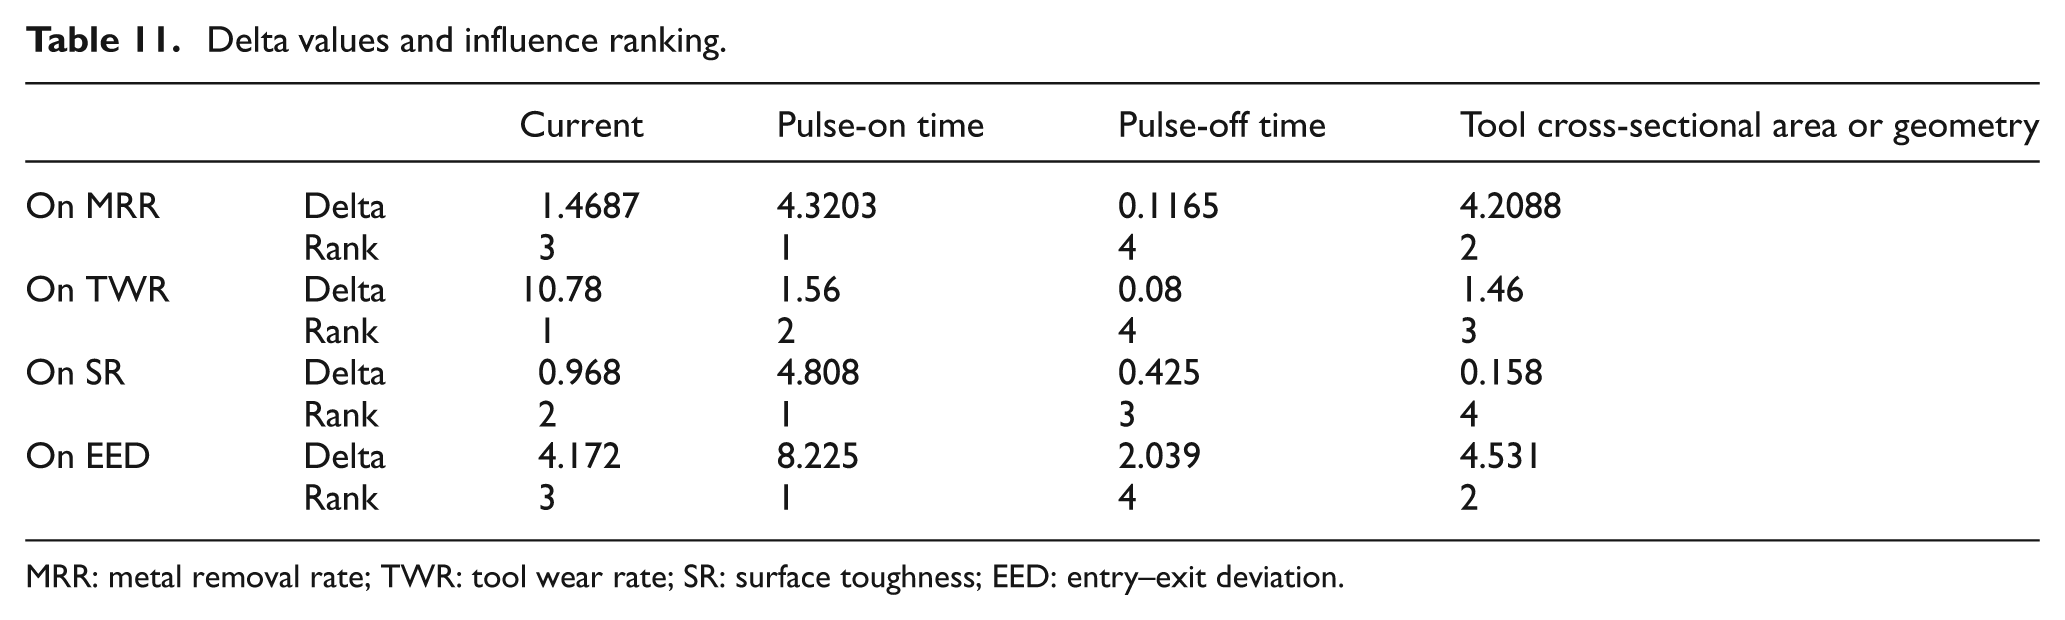
MRR: metal removal rate; TWR: tool wear rate; SR: surface toughness; EED: entry–exit deviation.
In the analysis, the current and the pulse-on time are found to be the two most important factors that have high influence over all the responses.
Regression equations
Since it was found that the interaction effect between factors was very less on the actual machining responses, the regression equations (3) to (6) were found by neglecting the interactions using partial least-squares method in Minitab-R14 software. In these equations, W represents the current in ampere, X represents pulse-on time in microsecond, Y represents the pulse-off time in microsecond, and Z represents the tool cross-sectional area in square millimeter.
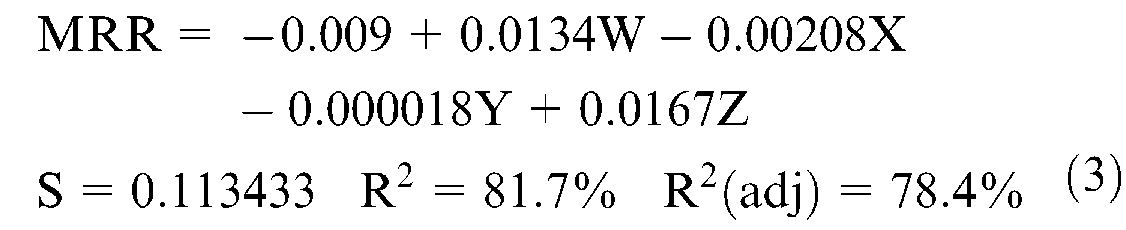
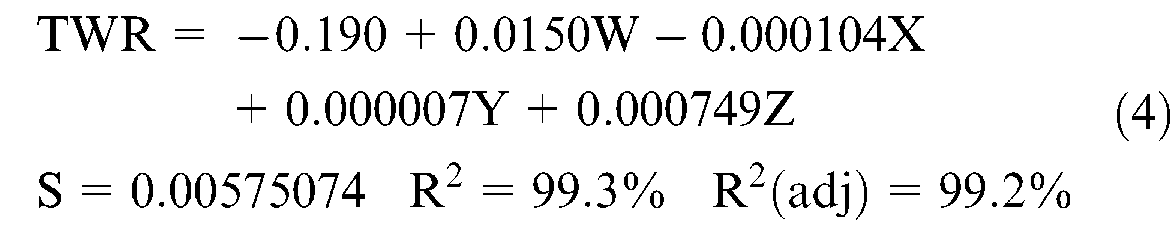
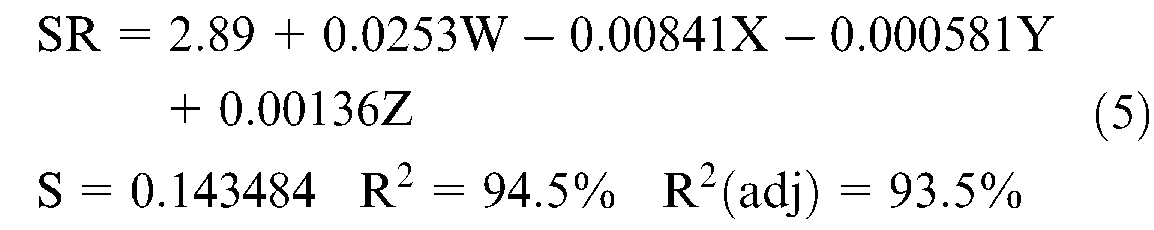
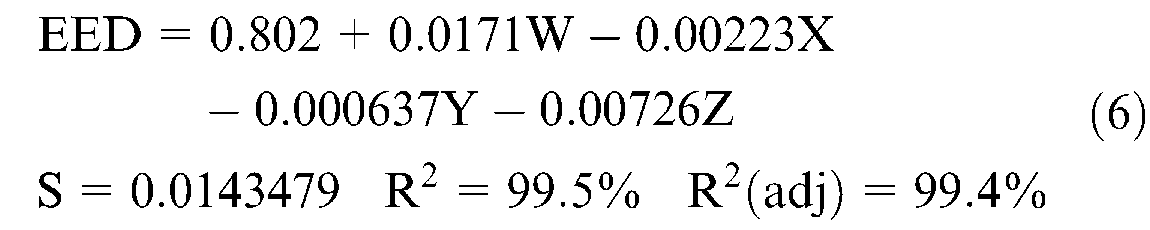
Their R2 values and adjusted R2 values confirm the validity of the model as their values are above 95% for all the responses except MRR where it is close to 80% and is acceptable too.
An experiment was conducted to check the validity of the given regression equations that produced satisfactory results with less than 5% variation (Table 12). For SR, the variation is less than 2%.
Experimental confirmation.
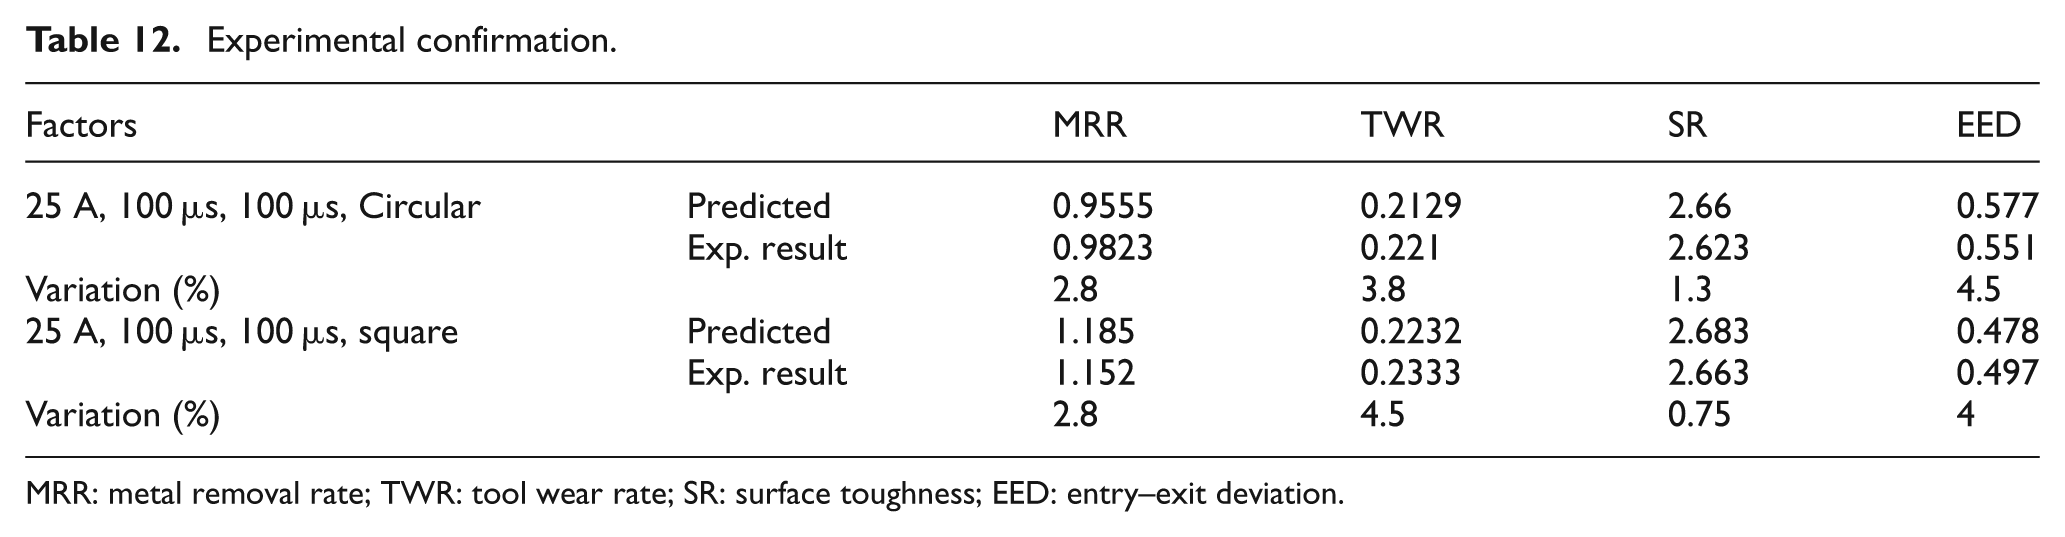
MRR: metal removal rate; TWR: tool wear rate; SR: surface toughness; EED: entry–exit deviation.
Conclusion
The findings in EDM of titanium grade 5 alloy with graphite tool electrode at the negative potential experiment and analysis are as follows:
The effects of interaction between the electrical parameters in EDM over the studied machining responses are not significant.
Based on the delta values, the current and the pulse-on time are the two most important and critical process parameters that affects all the studied responses. Among these two factors, the pulse-on time is more critical.
Except MRR, all other responses are negatively affected by increasing the pulse current value.
The MRR increases with increasing current and optimum pulse-on time at around 100 µs.
The pulse-off time does not affect any response except SR in the studied range.
The tool cross-sectional area influences the entry–exit deviation rather than the geometry. The higher cross-sectional area reduces the deviation.
The tool cross-sectional area does not influence in any way the SR.
The regression model derived in this study is useful to predict the responses in the sink EDM of titanium grade 5 alloy with graphite tool electrode at negative polarity.
Footnotes
Appendix 1
Funding
This research received no specific grant from any funding agency in the public, commercial, or not-for-profit sectors.