
Abstract
A novel analytical model for prediction of forces in elliptical vibration-assisted turning using a dynamic friction model is presented in this article and verified with experimental elliptical vibration-assisted turning tests. In elliptical vibration-assisted turning process, the main cause of force reduction is the reversal of the friction force direction in a fraction of vibration cycle time. In analytical modeling of elliptical vibration-assisted turning, the change of the relative sliding velocity direction causes a stick–slip condition which cannot be detected with static friction models like Coulomb model. In this research, a dynamic friction model, named LuGre model, is used to predict the machining forces in elliptical vibration-assisted turning. To derive the model coefficients, a series of orthogonal cutting experiments are performed on Al 6061, Al 7075 T6, Copper and Inconel 718, and the friction coefficients are identified using genetic algorithm optimization method. The cutting forces are determined by incorporating the friction forces calculated from LuGre model. To verify the results, a series of elliptical vibration-assisted turning experiments are performed on four above-mentioned workpiece materials using an elliptical vibration-assisted turning tool. The machining forces are then compared with the analytical results. The results achieved from the analytical solution using LuGre dynamic friction model are in a good agreement with experimental results.
Keywords
Introduction
Vibration-assisted machining (VAM) is one of the effective methods of manufacturing precise machined parts. The method increases the tool life, excels the surface quality and decreases the machining forces on the cutting tool. In this process, a vibration mostly with ultrasonic frequency is exerted on the cutting tool, causing the machining geometry change periodically during machining. The ultrasonic vibrations are mostly produced using a piezoelectric transducer.
A force model which can predict the force reduction in the process has been a matter of interest. Shamoto et al. 1 have simulated the process with thin shear plane assumption. They have predicted the shear plane angle using both maximum shear stress principle and minimum energy principle. The results then have been verified with experimental results. The Coulomb static friction model has been employed in both cases. Although the simulation results had acceptable agreement with those obtained from the experiment, there were still significant differences in shear and chip flow angles prediction. Ahmed et al. 2 used a dynamic friction model in the finite element (FE) simulation of VAM. A test bench was also designed and manufactured to measure the forces in the process. In this work, the friction force was not dependent on the normal force. It was a function of the sliding velocity, Coulomb coefficient of friction and the equivalent stress. The model, however, could only determine an upper bound for the friction stress and could not calculate the friction force analytically. Fan and Miller 3 have investigated on modeling of vertical VAM. They have assumed that the shear plane angle remains constant in a fixed coordinate system and changes in the direction of cutting. They have used the Coulomb friction model and showed that the chip–tool relative velocity direction changes in vertical VAM. Zhang et al. 4 have proposed an analytical model for VAM and have taken into account the reversal of the friction force and the transient chip thickness. However, the static friction model was used for prediction of the forces in this research, which could not reflect the dynamic phenomenon of the process. Razavi et al. 5 have also proposed some analytical models in VAM. They have studied the process experimentally and analytically. However, they used no dynamic friction model in their research. Also a model for determination of the thrust force in drilling of Al 6061-T6 with the assistance of vibration has been proposed by Chang and Bone, 6 in which the static friction model has been used.
Friction is a challenging and complicated phenomenon in cutting processes. There are several parameters affecting the friction force, including relative velocity between the two surfaces, surface roughness, temperature, surface hardness and so on, which makes the microscopic analysis of the friction difficult. Therefore, the researchers have presented different models for macroscopic analysis of the friction. In macroscopic analysis of the friction, there are several phenomena which have to be taken into account. Stick–slip phenomenon, dynamic breakaway and Stribeck effect are dynamic phenomena observed when two surfaces are in contact with one another. The stick–slip phenomenon is a repeated sequence of sticking and sliding between two contact surfaces. The breakaway force which is also called the static friction level changes as a function of the increasing rate of the applied force. Stribeck effect is the decrease in the friction force in low velocities that is mainly because of the switch between boundary lubrication and full-fluid lubrication.
There are different friction models available in the literature, which have been used in different applications. The most famous model is the Coulomb model which is not appropriate in dynamic friction conditions. In machining, this model is employed extensively because of its simplicity. However, since this model is static and simple, the phenomena like the stick–slip, dynamic breakaway and Stribeck effect cannot be predicted by this model. Using this model in conventional machining is acceptable, but it is not appropriate for elliptical vibration-assisted turning (EVAT), due to the reversal of the direction of the friction force, and the occurrence of stick–slip condition. Furthermore, the Coulomb model has two state equations for sticking and sliding conditions, which makes the simulation difficult. Kranopp model is also one of the static models 7 in which a single equation for both sticking and sliding conditions is suggested. The model, however, cannot detect the dynamic friction phenomena. In Armstrong’s model, although the sticking is taken into account and Stribeck effect can be detected, it needs a logical statement to switch between sticking and sliding conditions which makes the simulation difficult. 8 One of the simple dynamic models is Dahl model. 9 In this model, the friction force is a function of displacement. The friction force increases gradually as a function of displacement until rapture occurs. The main disadvantage of this model is the fact that it is a rate-independent model and therefore cannot reflect the rate-dependent dynamic phenomena like sticking and Stribeck effect. Another dynamic friction model is Bristle model. 10 In this model, each of the microscopic contact points between the two contacting surfaces is modeled with a flexible bristle. The friction force is the summation of the forces needed for bending of these bristles. This model can capture the random nature of the friction phenomenon; however, the complexity of the model increases as the number of bristles increases, which makes the model inappropriate for simulation. Reset integrator model is another model which is presented by Haessig and Friedland. 10 This model is a modified bristle model in which there is a rapture point for each bristle in which the bristle inclination is saturated. This model, therefore, needs one additional term for saturation of the bristles, which makes the model discontinuous. The LuGre model is also a dynamic friction model. 11 Among all these models, LuGre model is more appropriate in most of the applications since it can effectively reflect most of the properties observed in the friction (i.e. stick–slip phenomenon, Stribeck velocity and dynamic breakaway). Dependency on the relative velocity and not on the normal force is also one of the most important advantages of this model. None of the dynamic models mentioned above have been used for modeling of machining process.
The most significant cause of the force reduction in VAM is believed to be the change in the friction force direction during VAM. 3 The direction of the friction force changes in a portion of the vibration cycle, in which the backward tool velocity exceeds the chip velocity. Although there is considerable literature on the VAM modeling, most of the researchers still use the conventional simple Coulomb static friction model, as it is used in the conventional machining.
In this article, the EVAT process is described and modeled with LuGre dynamic friction model. It is shown in this research that the LuGre model can demonstrate the process and the dynamic phenomenon in EVAT better than the Coulomb model. To calculate the cutting forces, the instantaneous chip–tool relative velocity is calculated in EVAT and entered as an input to this friction model. The model coefficients are identified using orthogonal cutting tests and genetic algorithm optimization method.
The results are then verified with experimental results. An EVAT tool is designed and manufactured in which the combination of the bending and longitudinal resonance modes produces an elliptical vibration path. The EVAT tests are performed on four materials: Al 6061, Al 7075 T6, Copper and Inconel 718. The results are then compared with the analytical results.
The LuGre friction model
In this model, it is assumed that the two surfaces are rigid and they contact via a series of microscopic bristles, with elastic and viscoelastic behavior. 11 It can accurately capture most of the complicated pre-sliding and post-sliding characteristics of the friction, such as pre-sliding displacement, frictional lag, varying breakaway force and stick–slip motion. A schematic view of the bristle model is presented in Figure 1. Imagine an object placed stationary on a surface under a gradually increasing force. At the beginning of applying force, the microscopic bristles start to bend similar to small cantilever beams, but they do not allow the object to slide (i.e. pre-sliding). In this case, the friction is equal to the force required to bend the bristles. When the applied force passes a specific threshold value (i.e. breakaway force), the bristles are deflected adequately to allow the sliding of the object. Due to the viscoelastic behavior of the beams, the breakaway force depends on the loading rate too. After passing the breakaway force, the bristles do not deflect anymore (i.e. the deflection is saturated), and the increase of the force causes the object to accelerate (post-sliding). 12
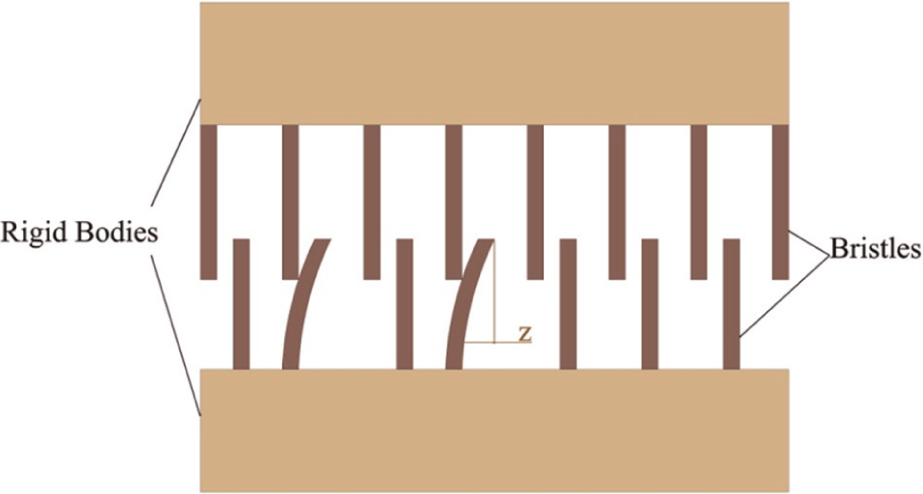
The interface between two surfaces.
z is regarded as the average deflection of the bristles and defined as
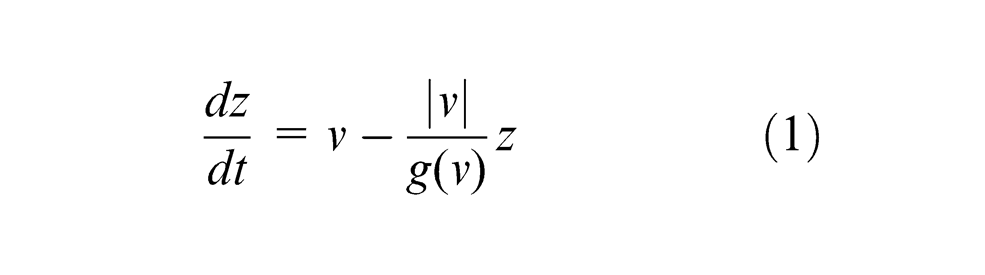
where v is the relative velocity between the two contacting surfaces. The above equation represents a first-order model, where the response reaches exponentially to a final steady-state value (i.e. saturation of the deflection of the beams). In constant velocity (dz/dt=0), the steady-state z can be obtained from the following equation
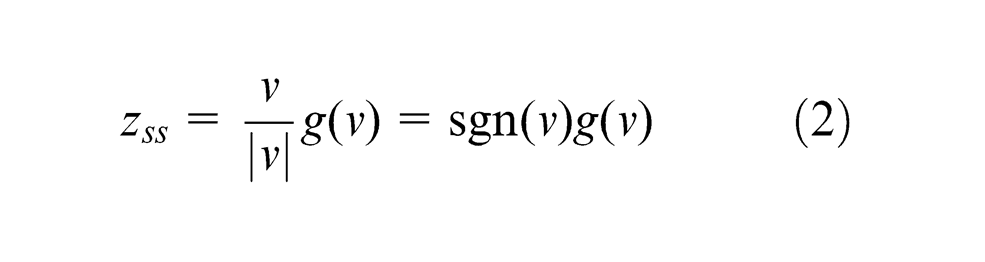
The function g(v) depends on many factors like lubrication, temperature and material properties. 11 This parameter is presented in the following equation by which the Stribeck effect is also shown
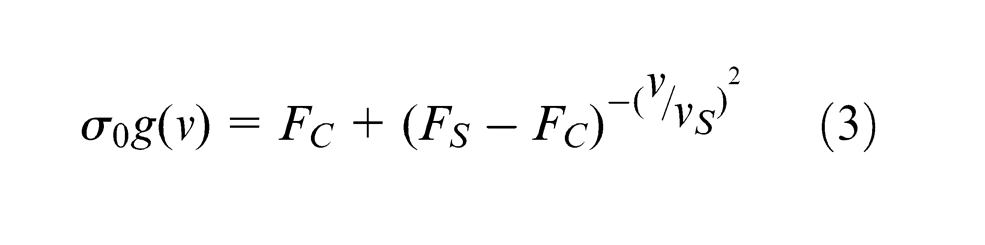
where the level of Coulomb friction is denoted by FC, FS is the sticking force level, σ0 is the stiffness coefficient and vs is the Stribeck velocity. g(v) is also a positive but not necessarily symmetrical function. The friction force can be obtained from the following equation
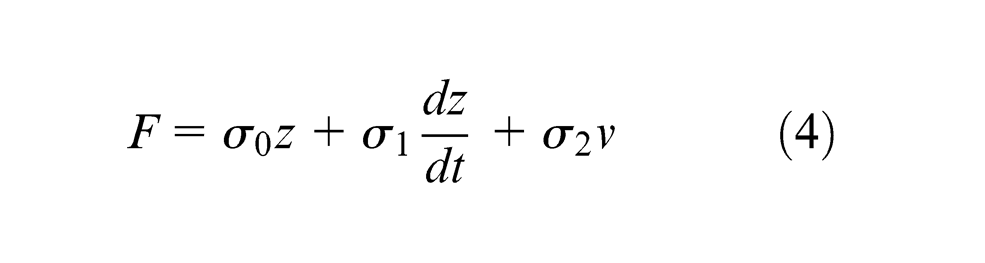
where σ1 is the damping coefficient and σ2v is the viscose term. The model, therefore, can be characterized by six parameters: σ0, σ1, σ2, FC, FS and vs. 11
The EVAT equations
In EVAT, the machining geometry changes periodically. The cutting tool is fed to the workpiece in a fraction of the total vibration period and withdrawn from cutting in the other fraction. Therefore, the tool–workpiece contact is periodic. There is a specific cutting speed which is called critical cutting speed Vcr, below which the tool and the workpiece separate during VAT process periodically. The critical cutting speed can be calculated from the following equation

where f and a are the vibration frequency and the amplitude in the cutting direction, respectively. The workpiece cutting speed should be lower than the critical cutting speed. Furthermore, the rake angle changes during vibration cycle. The change in the rake angle changes the shear plane angle which plays a key role in determination of the cutting forces and machining parameters. The change in the rake angle can be calculated from the following equations 13
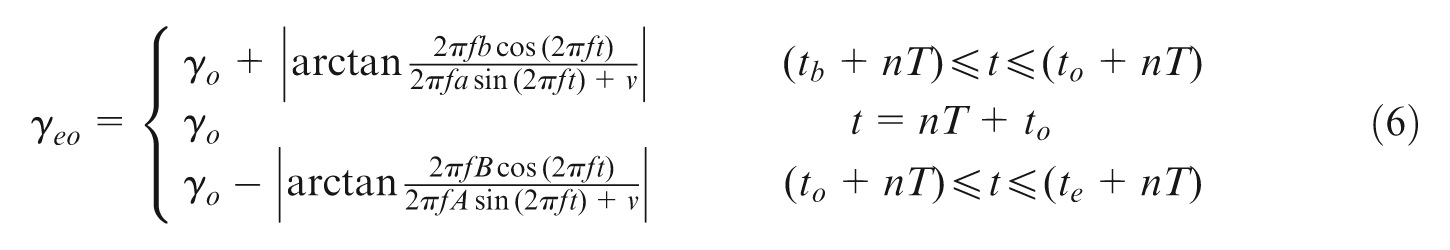
where a and b are, respectively, the vibration amplitude in the x and y directions (i.e. cutting and feed directions), f is the vibration frequency, γo is the nominal (tool’s) rake angle, γeo is the rake angle at the time t, v is the cutting speed, tb is the time in which the tool–workpiece engagement starts, te is the time that the tool–workpiece ends, T is the vibration period and to is the time in which the tool is in its lowest condition. In this research, it is assumed that the shear plane angle changes concurrently with the change of the rake angle. Besides, since the direction of relative velocity between the chip and the tool changes, the friction force direction also changes in this process. This phenomenon, which is the main cause of the reduction of the forces on the tool during EVAT, verifies the necessity of using a dynamic friction model. Figure 2 shows the chip–tool relative velocity calculated in this research. Note that the sign of the chip–tool relative velocity alters during one vibration cycle, due to ultrasonic excitation of the tool. This verifies that stick–slip condition occurs in the surface contact; hence, static friction models used in earlier work, such as Coulomb and Stribeck models, are not appropriate for analysis of ultrasonic-assisted machining (UAM). However, they may be appropriate for the analysis of conventional machining processes.
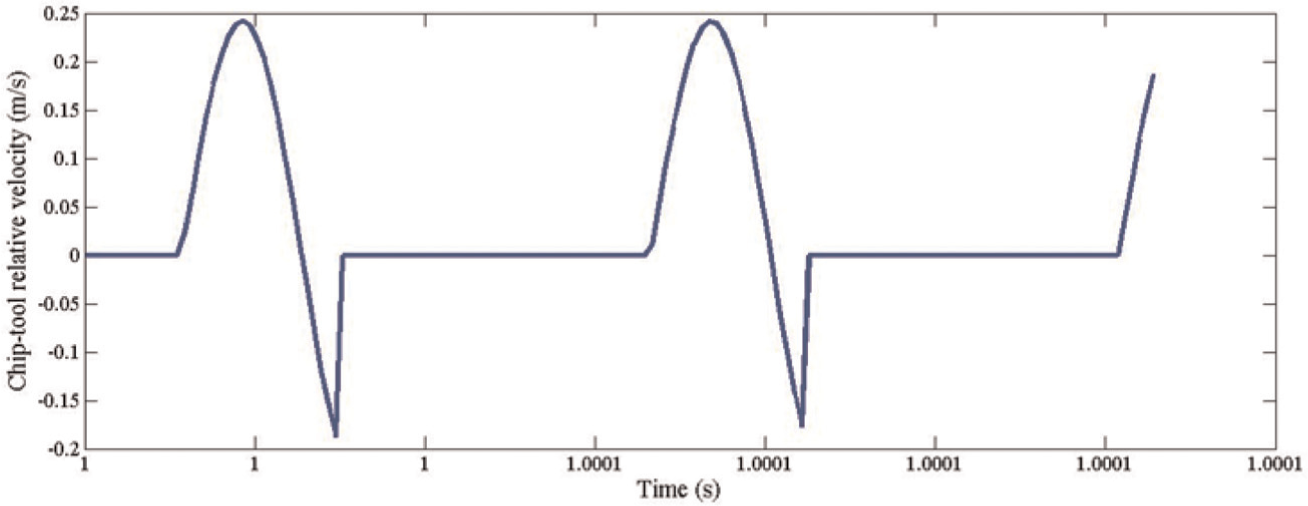
The chip–tool relative velocity in EVAT.
Figure 3 shows the variation of parameter z versus time. The trend of variation clearly shows the saturation of the bristles’ bending (end of the sticking) and the start of sliding. The effect of ultrasonic vibration on z can also be traced in Figure 3. In the sticking phase (i.e. when the relative velocity is 0 or less than Stribeck velocity), as the relative velocity increases, the absolute value of z increases until the saturation point, from which the amount of z remains constant. By switching the relative velocity direction, z is exponentially changed to reach the saturation point in the opposite direction.
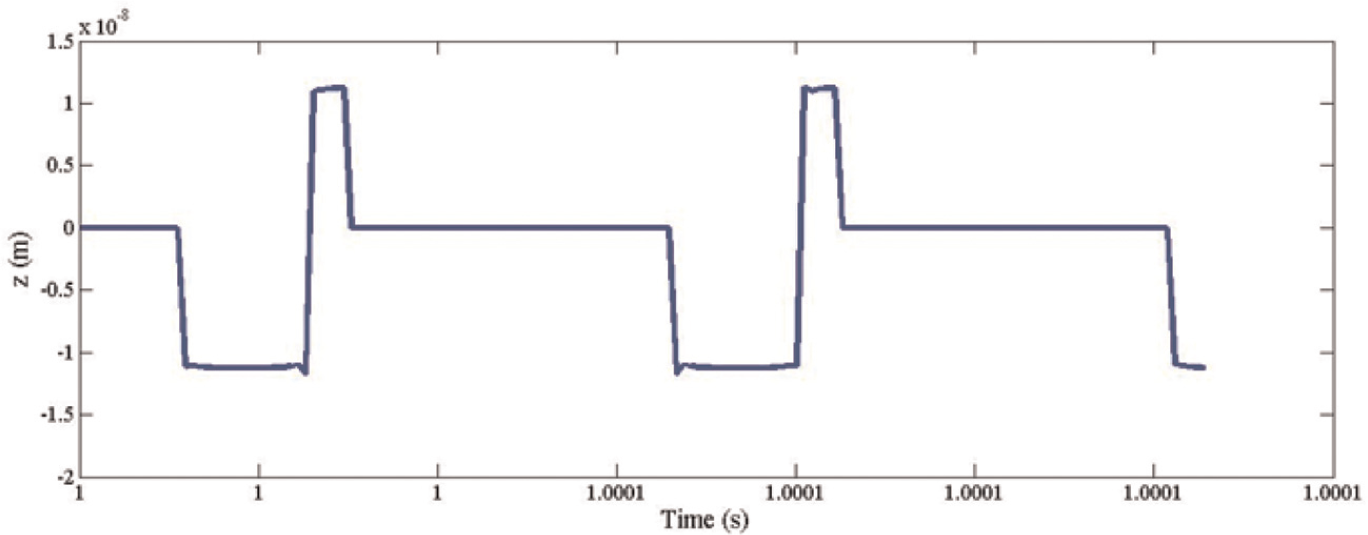
The state parameter z versus time in EVAT.
The variation of relative speed affects g(v) in equation (3) too. Note that all of the parameters σ0, FC, FS and vs are constant, and the only variable in this model is v. In most of the cycle time, the amount of v is quite larger than vs (i.e. sliding occurs), which causes the term
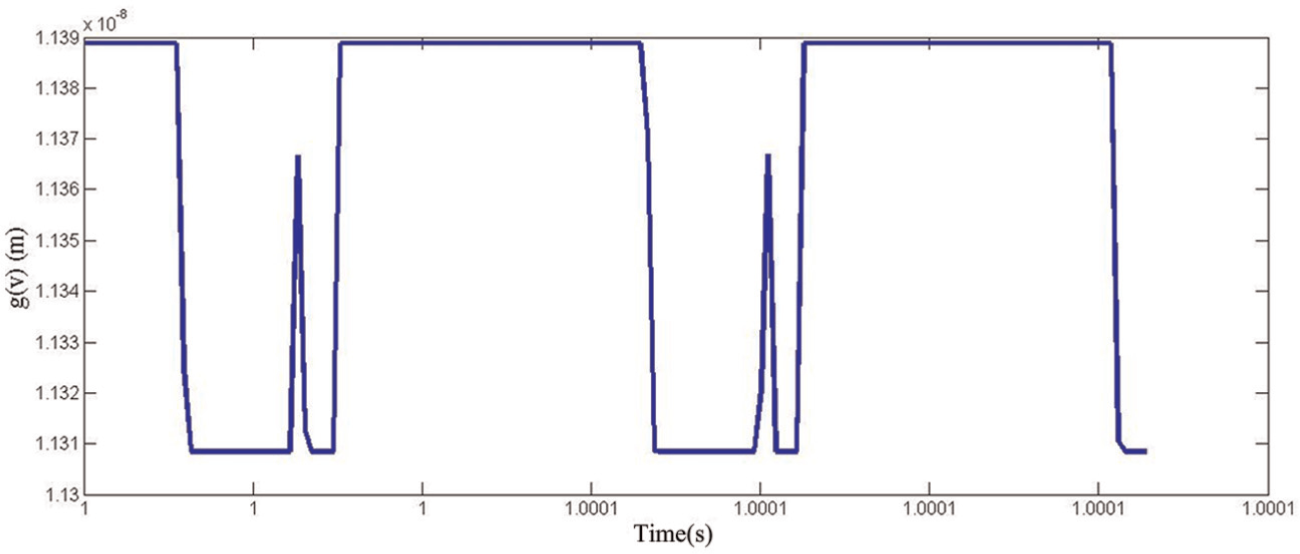
The effect of EVAT on g(v).
Analytical prediction of the forces
In this article, an EVAT process is modeled with the machining and vibration parameters listed in Table 1. The force model which is used for prediction of the forces is presented and described in Appendix 2. The MATLAB software is employed for analytical solution of the equations. The tool–workpiece relative velocity is changed as a result of the change in the rake angle (see Appendix 2). The formulations for calculation of the chip–tool relative velocity are presented in Shamoto et al. 1 This periodic velocity is calculated in a program and entered as an input for solving the LuGre model differential equation (equation (1)).
The machining and vibration parameters of the test setup.
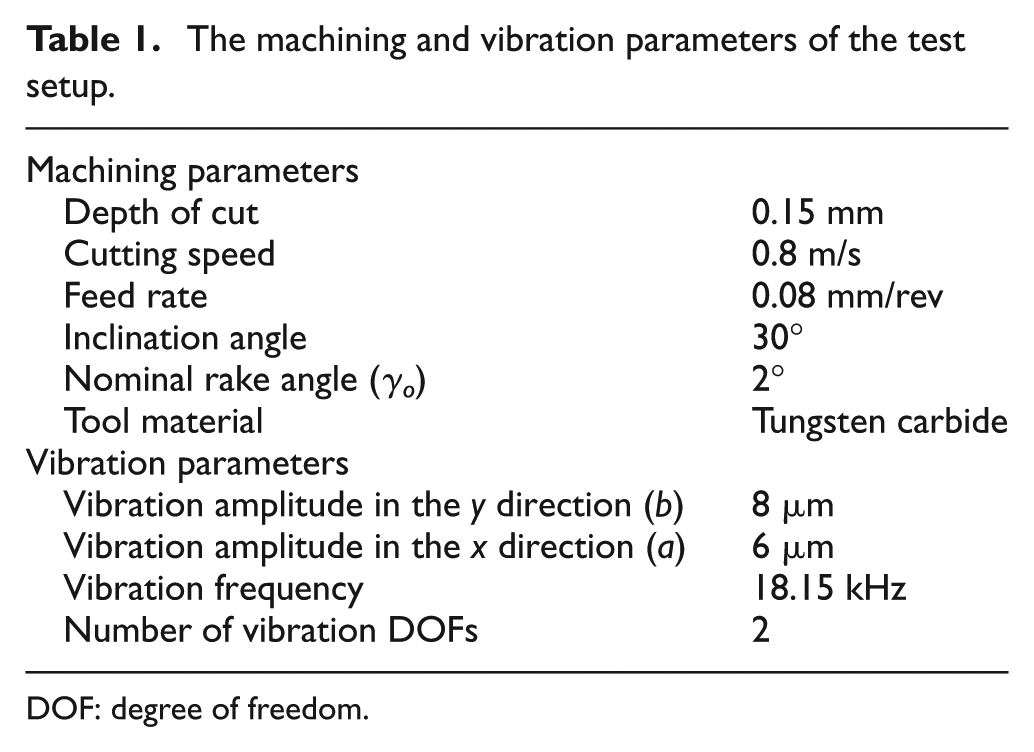
DOF: degree of freedom.
In the next step, the calculated force along with the shear strength of the material is used to calculate the friction angle β. In this step, an equation is needed to predict the shear plane angle φ, which can be computed either by “maximum shear stress principle” 14 or by “minimum energy principle.” 15 Mathematically
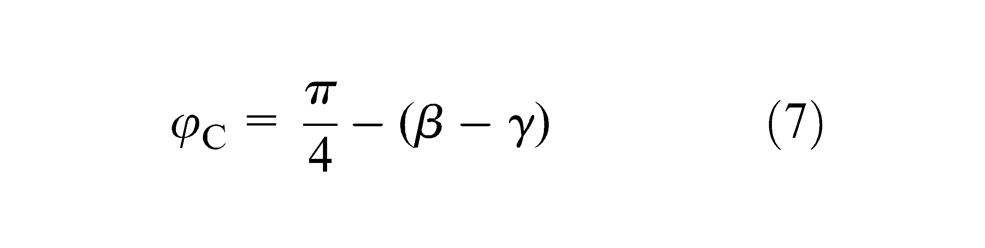
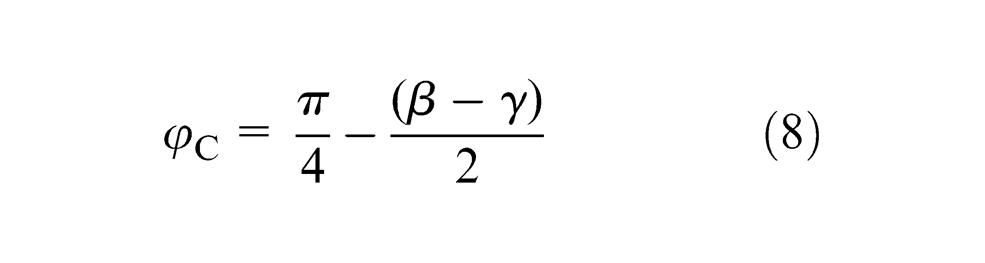
Equation (7) is based on the maximum shear stress principle, while equation (8) is based on minimum energy principle. Equation (8) predicts larger shear plane angle in machining. 16
LuGre model coefficients identification using orthogonal cutting tests and genetic algorithm
To identify the LuGre model coefficients, a series of orthogonal cutting experiments are performed. The aim of these tests is to obtain the friction force versus the tool–chip relative velocity. The tool rake angle is, therefore, selected to be 0, and the side cutting edge angle of the cutting tool is set to be 90°. In such a test, the force in the feed direction is the friction force between the tool and the chip plus a rather small plowing force. Unless in finishing processes where the cutting forces are very small too, the plowing force is considered negligible in comparison to cutting forces in other cutting processes and is not taken into account in the force model. To reduce any possible error due to neglecting the plowing force, new and sharp tools are used in these experiments, and the depth of cut is selected high enough. In fact, the very small plowing force is considered as a part of the friction force, where their addition has the same nature and physical characteristics of the friction, and is identified using LuGre friction model. It should be noted that these tests are performed in conventional machining condition, not in EVAT condition.
Since there is no closed-form equation for identification of the LuGre model coefficients, the genetic algorithm optimization method is used to derive the coefficients. For identification of the LuGre coefficients, the fitness function of the optimization is the norm of the difference between the analytical and the experimental forces, as indicated in equation (9). The genetic algorithm program which is used in this research changes the six friction coefficients so that the error would be minimized. The input of the genetic algorithm is the relative velocity between the chip and the tool in orthogonal cutting tests.
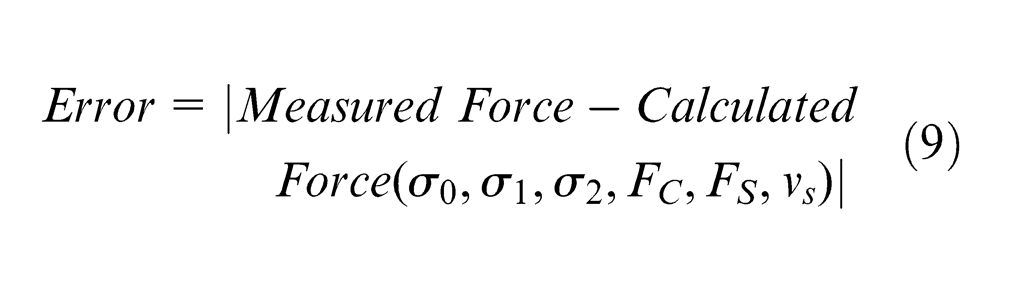
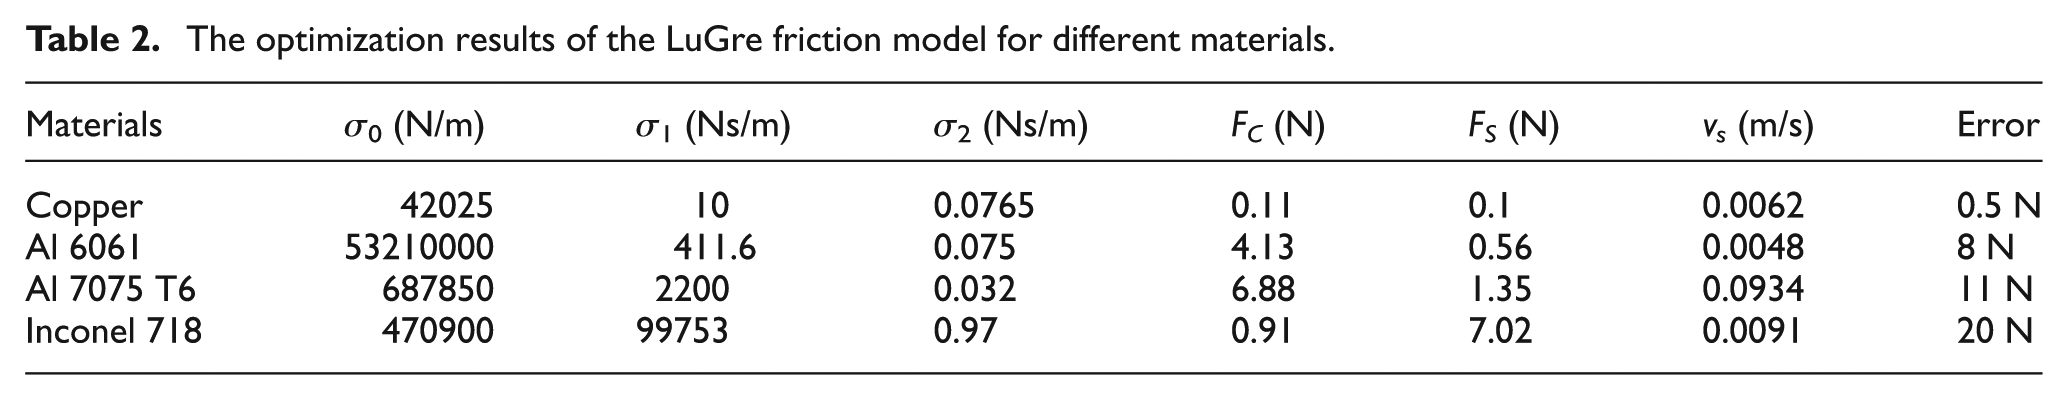
To calculate the friction force, the differential equation (1) is solved in every generation of genetic algorithm, and the friction force is calculated via equation (4). The calculated force is a function of relative velocity and the six LuGre model coefficients. In the optimization process, the coefficients are varied so that the error is minimized. The results achieved from the genetic algorithm optimization method for all six materials are listed in Table 2.
The optimization results of the LuGre friction model for different materials.
Results and discussion
The predicted principal forces achieved from the EVAT force analysis for materials Al 6061, Al 7075, Copper and Inconel 718 are, respectively, presented in Figures 5–8.
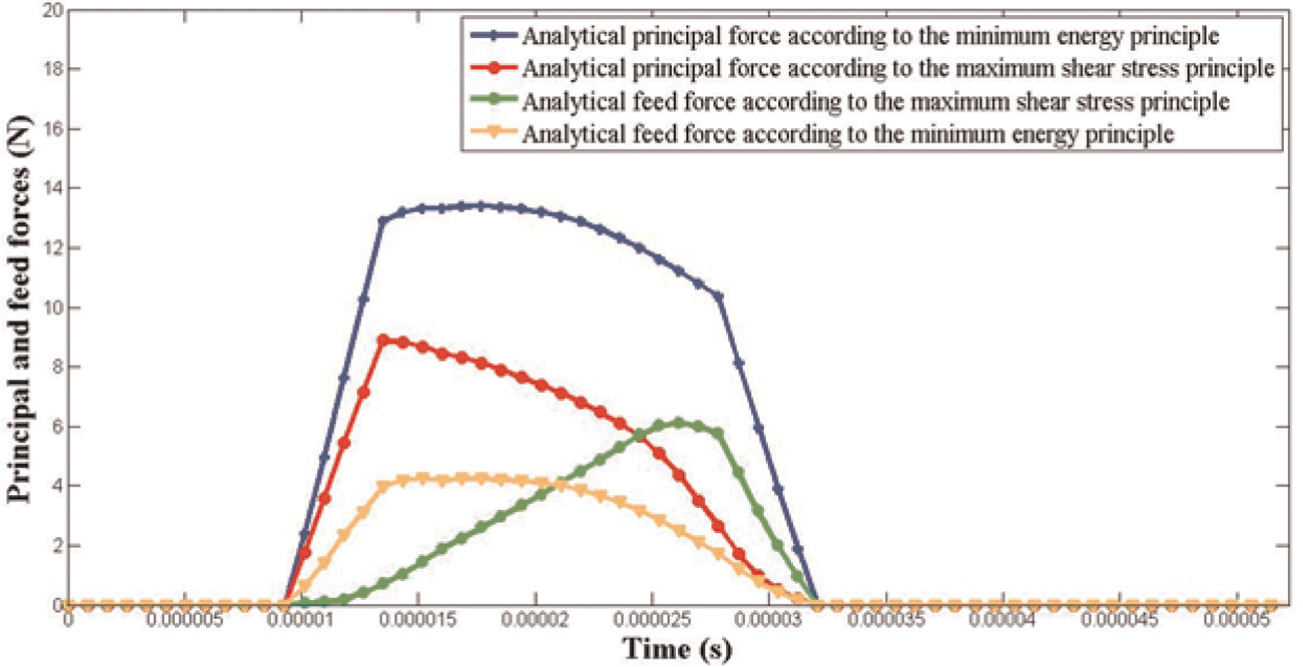
Principle and feed forces of the Al 6061 according to the maximum shear stress and minimum energy principles.
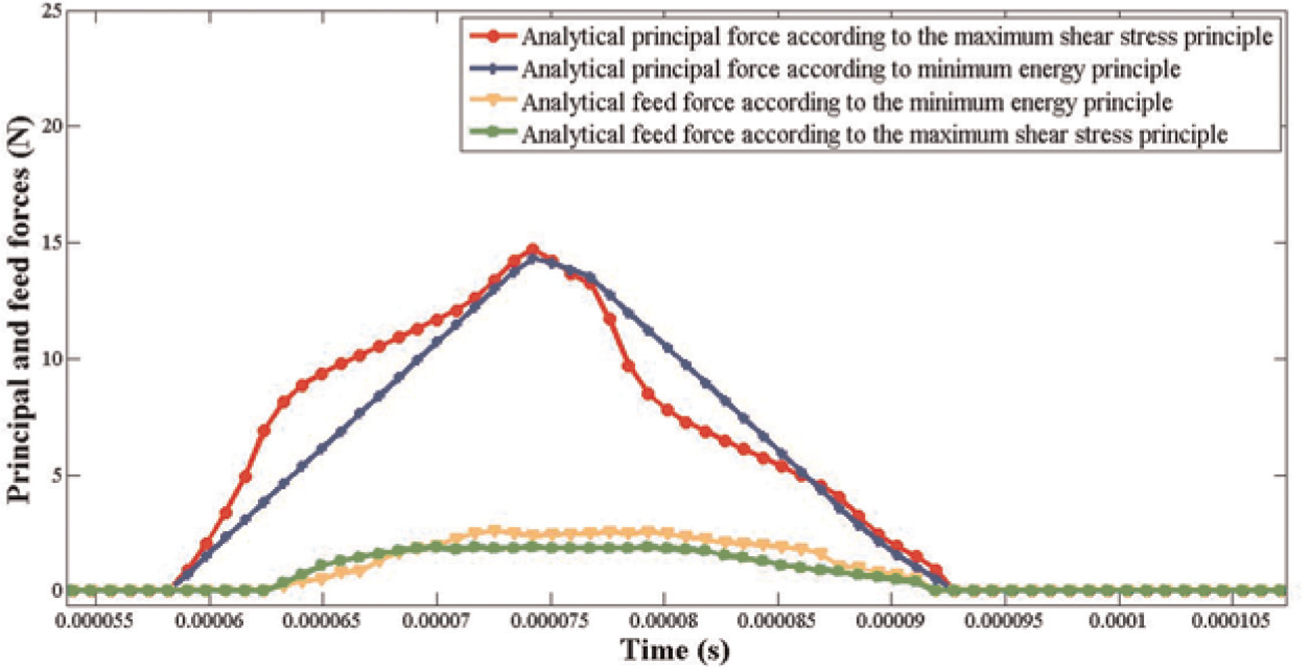
Principle and feed forces of the Al 7075 according to the maximum shear stress and minimum energy principles.
Principle and feed forces of the copper according to the maximum shear stress and minimum energy principles.
Principle and feed forces of the Inconel 718 according to the maximum shear stress and minimum energy principles.
To show the advantages of using the LuGre dynamic friction model in the modeling of EVAT process, the EVAT process is also modeled using the conventional Coulomb friction model. The predicted machining forces are listed in Table 3.
The maximum principal and feed forces achieved from the VAT experiments and analysis.
EVAT experiments
The EVAT experiments for verifying the analytical solution are carried out on a manual lathe. A two-dimensional (2D) vibration tool was used for the tests. There are three sets of piezoelectric stacks used in this tool: two sets of half-ring stacks for bending mode excitation and a set of full-ring stacks for excitation of the longitudinal mode. To amplify the bending vibration amplitude, the two half-ring sets are excited with a phase shift of 180°, causing one of the sets to shrink while the latter expands, and vice versa. The tool is designed so that the excitation frequency of both of the vibration modes would be the same. The excitation signal for longitudinal mode has 90° phase shift with respect to the bending mode, producing an elliptical path in the tool tip. Note that a reference signal is used for both vibration directions. The horn amplifies the longitudinal and bending resonance modes of the tool which generates a 2D elliptical vibration path. The tool and the test setup are illustrated in Figure 9.
The elliptical EVAT tool used for the machining tests.
The vibration amplitudes in both directions are measured using an eddy-current gap sensor. To measure the machining forces, the tool is assembled on a KISTLER dynamometer, and the forces are measured in all three directions. The machining and vibration parameters are listed in Table 1.
Test specimens
VAT experiments were performed on Copper, Al 6061, Al 7075 T6 and Inconel 718. The results of maximum measured forces are presented in the second column of Table 3. The analytical results of the maximum forces using Coulomb friction model and LuGre friction model are also presented in the third and fourth columns, respectively.
As indicated in Table 3, the analytical prediction of the forces is in a good agreement with experimental results. However, a significant difference is observed between the results of the analysis of EVAT using the Coulomb friction model and experimental results. This is mainly because of the simplicity of the Coulomb model and the fact that the friction phenomenon in EVAT is dynamic, and the Coulomb model cannot reflect all the frictional phenomena.
Conclusion
A dynamic friction model is used to model the machining problem in EVAT. The LuGre dynamic friction model is used for the first time in analytical modeling of the machining process, specifically in EVAT. Since the direction of the friction force changes in this process, the conventional static models (Coulomb model specifically), which have been used in earlier works to model the conventional machining processes are not appropriate in modeling the VAT process. It is shown in this research that the difference between the analytical solutions of the EVAT process using Coulomb friction model and experimental measured forces are significant (Table 3). The cutting equations in this article are presented using LuGre friction model, which is an appropriate dynamic friction model. This model can predict the dynamic friction forces on the tool, accounting for most of the observed characteristics of the friction. The obtained results are compared with the experimental results on different materials (Table 3). The results show that the analytical forces are in good agreement with the experimental results, proving the feasibility of using LuGre friction model in VAT modeling, while the Coulomb model is shown not to be an appropriate model for prediction of the forces in EVAT.
Footnotes
Appendix 1
Appendix 2
Acknowledgements
The authors are thankful to the Iran National Science Foundation: INSF for the financial support of this work.
Declaration of conflicting interests
The authors declare that there is no conflict of interest.
Funding
This research received no specific grant from any funding agency in the public, commercial or not-for-profit sectors.