
Abstract
For high-speed machining, the position commands from the trajectory-controlled algorithm should be as smooth as possible since even a small discontinuity in position command may lead to vibrations of the mechanical structure and the servo system. A simplified mechatronic model was proposed to analyze the impact of the trajectory-controlled algorithm on the performance of high-speed machining. The effects of the control loop parameters and natural frequency of mechanical structure on the vibration were also studied. Experimental tests on the vertical z-axis of a high-speed machining center indicate that the presented methodology is able to evaluate the evolution of the vibration due to the trajectory-controlled algorithm, and it is also helpful to choose the suitable controlled parameters for improving the mechatronic performance of high-speed machining.
Introduction
The increase in complexity and capabilities of mechanical products has led to ever-growing design of machine tools for high-speed machining (HSM), especially regarding manufacturing of the aeronautic parts, dies, and complex molds.1,2 The high-speed computer numerical control (CNC) machine tools can be described as very complex mechatronic systems due to the development of machine design and drive technology. The performance of a high-speed machine tool is mainly determined by its kinematics, structural dynamics, control systems, and machining processes.3,4 For example, the high-speed machine tool requires lightweight design together with sufficient stiffness of the structural components, and the machine control system must also be capable of dealing with the high-speed position change at acceptable accuracy.5–7 Therefore, the interaction between structural dynamics and control systems must be taken into account during the design of high-speed machine tools.8–11 Furthermore, a realistic machine tool motion behavior together with accurate evaluation of the final part geometry requires the inclusion of real-time trajectory-controlled algorithm, dynamic behavior of mechanical structure under axis control laws, and cutting process disturbances. 12
Several studies have reported on the integrated analysis of the mechanical structure and the control systems. A systematic methodology for mechatronic system made up of mechanical and control subsystems was proposed in the study by Albertelli et al. 13 to design high-speed feed drive system. Tani et al. 14 described the modeling and simulation of the z-axis of a five-axis machining center for high-speed milling, and the axis consisted of a machine head, a CNC system, and a pneumatic system to compensate for the weight of the vertical machine head. In order to investigate the interaction between the control system and other machine tool subsystems, some approaches were used to arrange the mechatronic machine tool model to tune the control parameters. Here, the machine tracking performance represented the main goal. 3
The problem is, however, that an accurate coupled model is difficult to develop due to the high model complexity and the great time required to set up and update them. 15 The performance of a mechatronic system, such as a high-speed machine tool, is specially quantified in terms of the vibrations of the mechanical structure.16–18 A dynamic absorber was investigated in the study by Duncan et al. 2 to limit the vibration of the spindle–holder–tool assembly in HSM. Okwudire and Altintas 19 presented a detailed model to evaluate the ball screw vibration and also to optimize the drive parameters for high-speed machine tool. Schmitz and Burns 20 and Schmitz and Duncan 21 applied receptance coupling substructure analysis to predict the tool point vibration in HSM, and based on the prediction, the overhung length of the tool was reconfigured to improve the tool dynamics. Nevertheless, the oscillation produced by the trajectory-controlled algorithm was not proposed. In fact, this oscillation makes it more difficult to follow a desired path, which is negative for the manufacturing accuracy. In fact, the trajectory-controlled algorithm plays a key role in the mechatronic performance of high-speed machine tools. The path commands contain speed, acceleration, and jerk, where the derivative of acceleration was defined as jerk. The high accelerations and jerks of the trajectory-controlled algorithm in HSM may imply stronger excitation of oscillation, which limits the fatigue life of mechanism, bandwidth of the servo system, and the manufacturing accuracy of the machine. 22
With consideration of overall above-mentioned issues, Figure 1 presents a schematic diagram of HSM process. The process starts from the parts drawing in computer-aided design (CAD) or computer-aided manufacturing (CAM) software and then the parts’ contour is transformed into numerical control (NC) program. In the CNC and servo systems, the NC program is transformed into trajectory control commands, and these commands are transmitted to some controllers such as position controller, speed controller, and current controller. These position commands should be smooth at high speed since even a small discontinuity in position command could lead to undesirable harmonics, which may excite the vibration of mechanical structure and the servo system. The output from the servo control module is the drive current, which is transmitted into the motor to drive the mechanical structure. It should be noted that the position command is determined by the trajectory-controlled algorithm; therefore, the performance of HSM is together limited by the coupling of the trajectory-controlled algorithm, the servo system, and the mechanical structure.
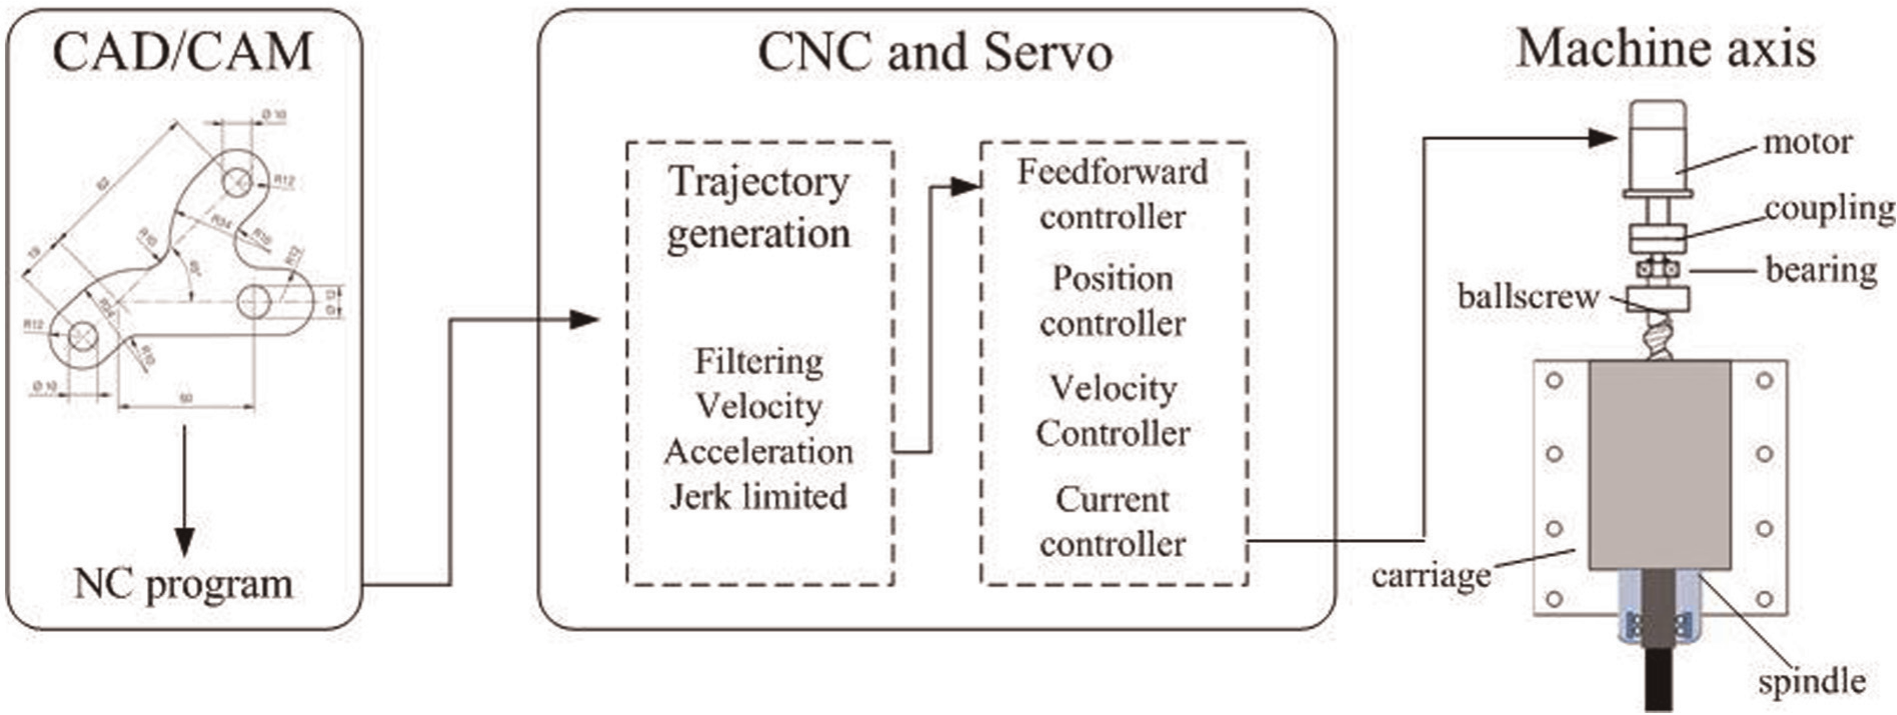
Sketch of high-speed machining process.
In this article, the impact of the trajectory-controlled algorithm on the mechatronic performance of HSM was studied. This study was organized as follows: section “Description of the trajectory-controlled algorithm” described the trajectory-controlled algorithm, section “Mechatronic model of a high-speed machine axis” presented a mechatronic model including its control loop and mechanical structure, and section “Performance analysis” discussed the influence of the trajectory-controlled algorithm on the performance of the mechatronic model, and its validation through comparisons with experimental results was also reported. Conclusions were offered in section “Conclusion.”
Description of the trajectory-controlled algorithm
In the modern CNC system, the NC program segment was divided into discrete position commands as a function of jerk, acceleration, and speed by the trajectory-controlled algorithm. Taking into account the motor and the power module, the acceleration during the acceleration phase should be as constant as possible, and this was called rectangular acceleration law, which ensured a maximum utilization of drive current. Any break in acceleration could create a jerk leap, which may lead to vibration of the machine tool. To prevent such machine oscillations, the jerk should be limited to attain optimum smooth control. However, the result was not a constant acceleration but a short acceleration peak, and this was called trapezoidal acceleration law. In the following, the formulation of distance with jerk limited was presented.
As shown in Figure 2, if the initial condition for distance, speed, and acceleration was 0 and the jerk profile was known, the acceleration a, speed v, and distance x could be obtained by integrating the jerk as follows. The jerk profile in Figure 2 was given by
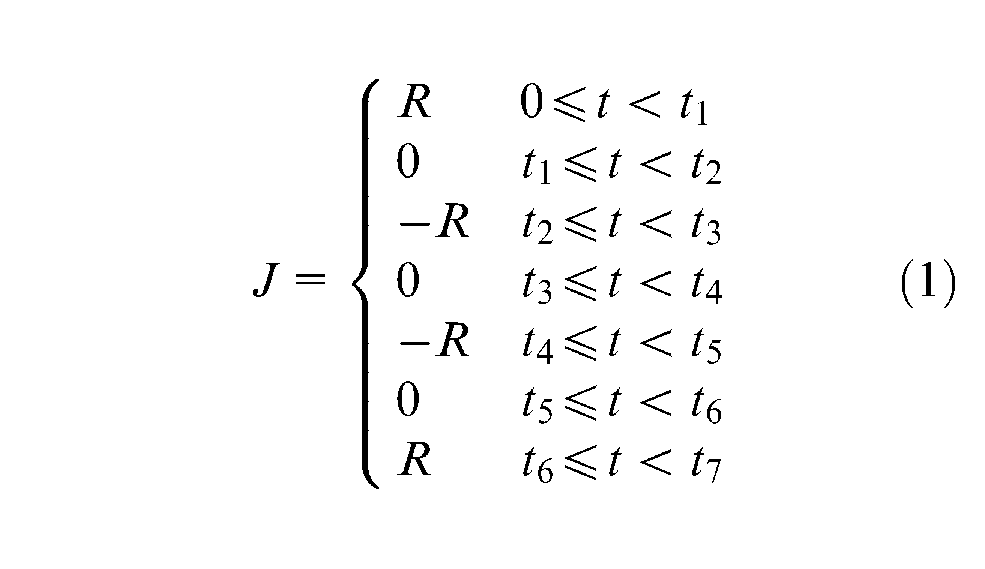
where t represented the absolute time; t1, t2, …, t7 represented the time boundaries of each phase; and R and −R were the amplitudes of jerk.
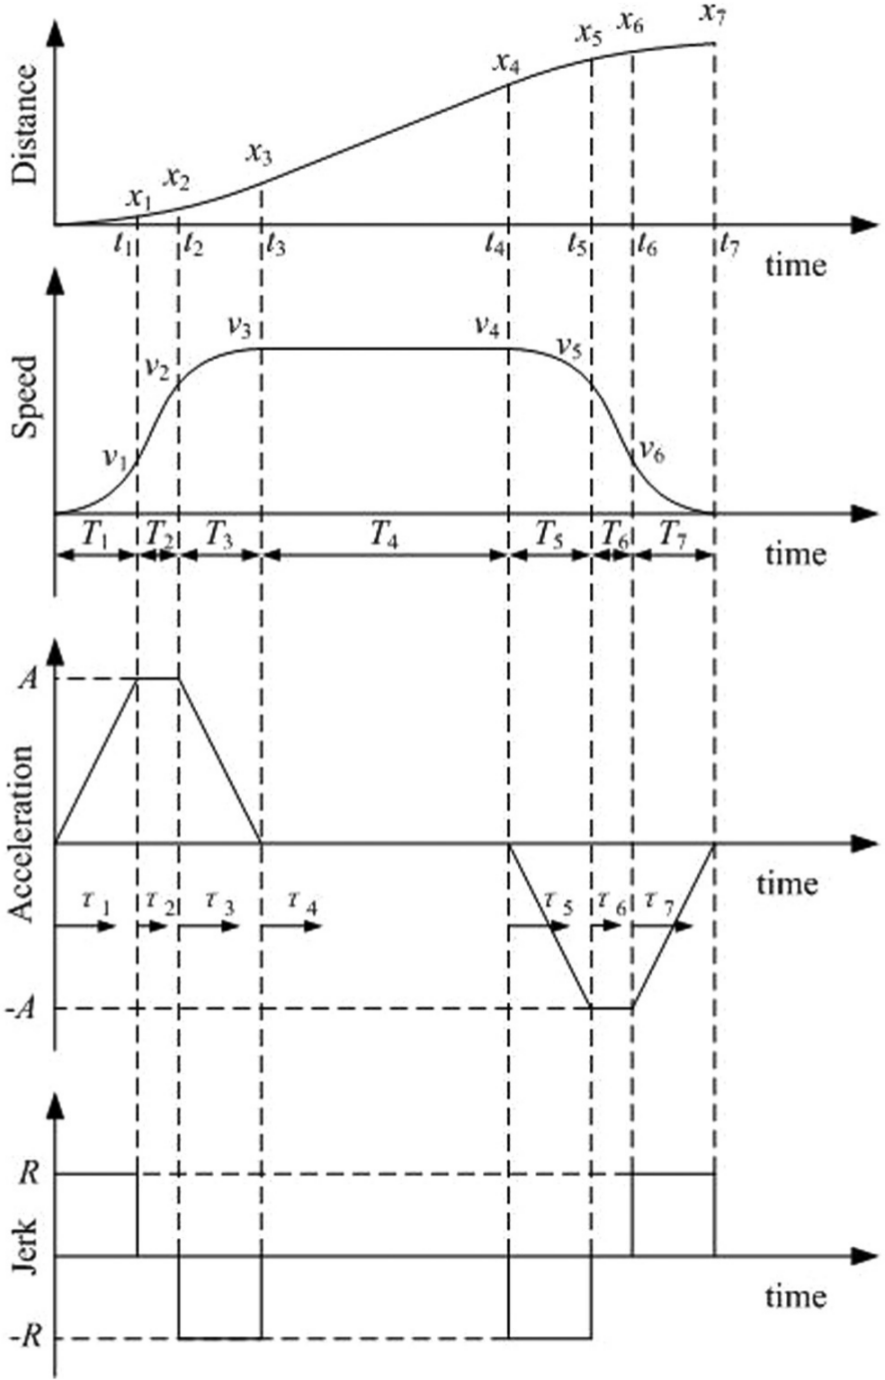
Kinematical profiles for limited jerk.
By integrating equation (1) with respect to time, the acceleration profile could be expressed as
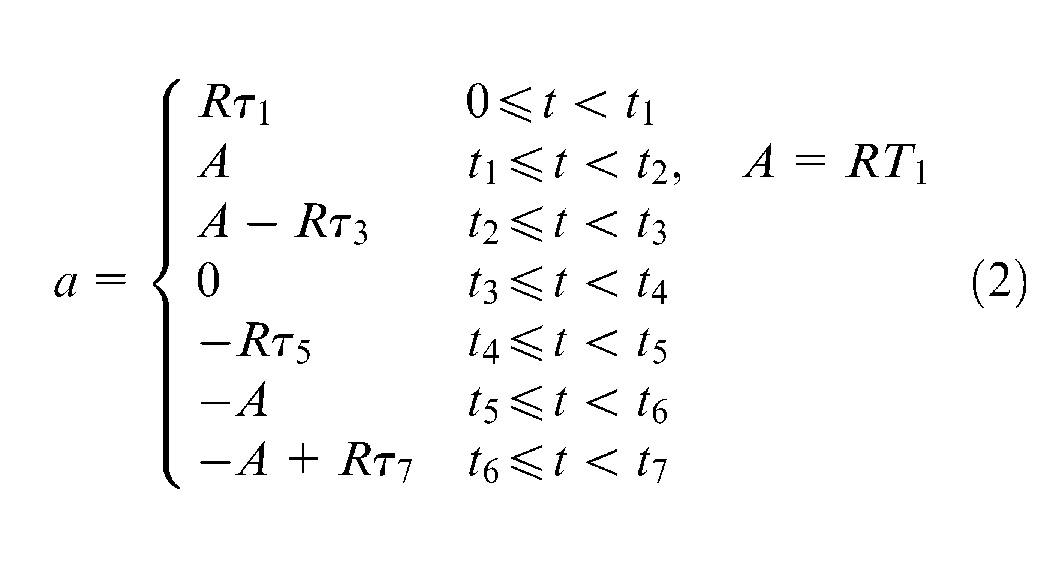
where τi (i = 1, 2, …, 7) was the relative time that starts at the beginning of the ith phase and A and −A represented the acceleration and deceleration amplitudes, respectively, as shown in Figure 2. In the same way, the speed equation was derived as
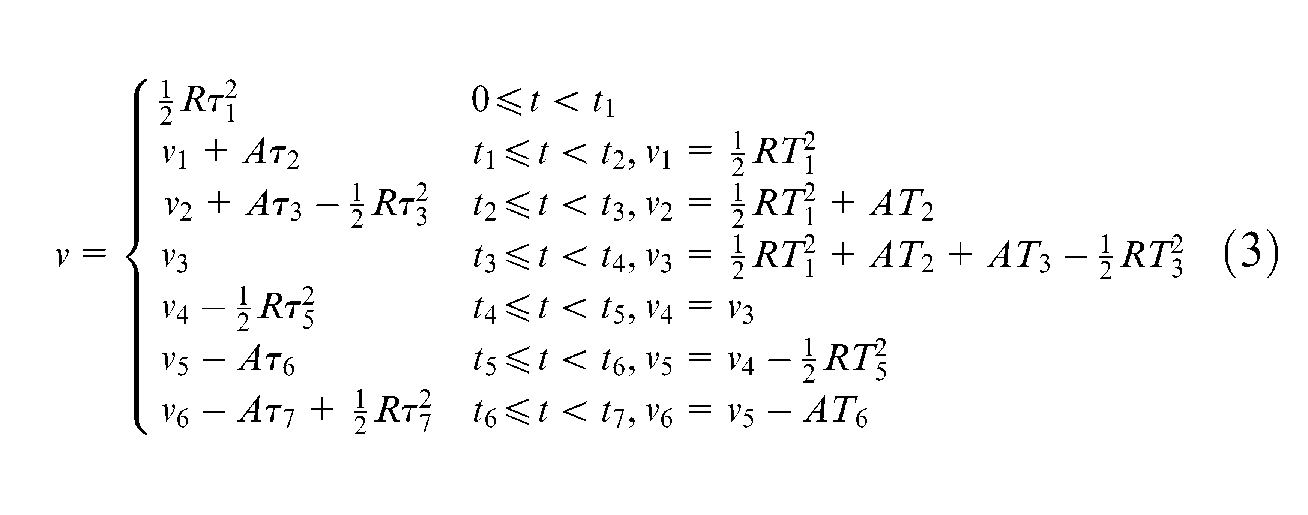
where Ti (i = 1, 2, …, 7) was the duration of the ith phase and vi (i = 1, 2, …, 7) was the speed reached at the end of the corresponding phase. Specially, T1 was the time of acceleration rising stage and T2 was the time of constant acceleration stage. For example, T1 = T3 = T5 = T7, T2 = T6. Then, by integrating equation (3) with respect to time, the distance was obtained as
where xi (i = 1,2, …, 7) was the distance reached at the end of the ith phase.
Mechatronic model of a high-speed machine axis
Modeling of control loop
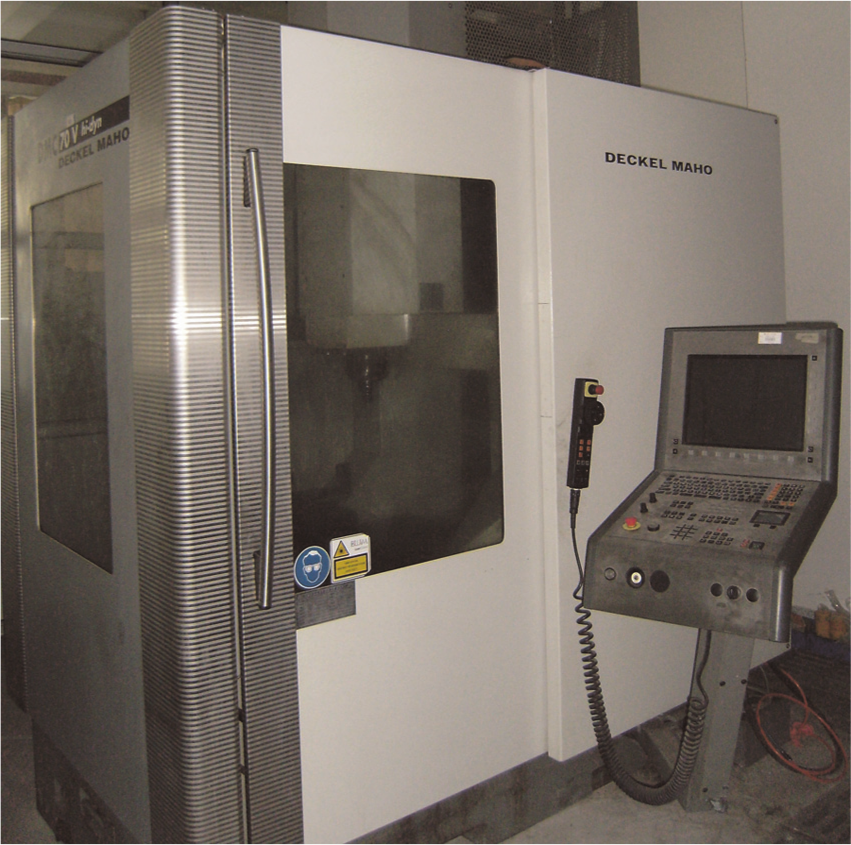
The machine discussed here was a HSM center, as shown in Figure 3, which was driven and controlled by HEIDENHAIN iTNC 530 CNC unit, very suitable for HSM. For HSM, feedforward control was an efficient approach to reduce the following errors. 23 In addition, the position controller, speed controller, and current controller were also integrated into the common CNC system. In general, the position and the speed were regulated by proportional controller, while the current was regulated by proportional integral controllers. The digital control loop can be depicted as shown in Figure 4.
High-speed machining center.
Model of a CNC control loop.
In order to analyze the vibration of position movement, the focus was especially on the position loop. In industrial control system, the bandwidth of the current loop was much wider than that of the speed loop; therefore, the current loop could be regarded as an ideal loop in the following sections, namely, the transfer function of the current loop was regarded as one. 24 The block diagram of the control loop is shown in Figure 5, in which Xref(s) was the reference position command from the trajectory-controlled algorithm, kp was the position gain, kv was the speed gain, XL(s) was the factual position command, fkv was the feedforward gain, and Vm(s) was the command speed of the motor. The various gains could be seen and set up in the HEIDENHAIN iTNC 530 CNC unit.
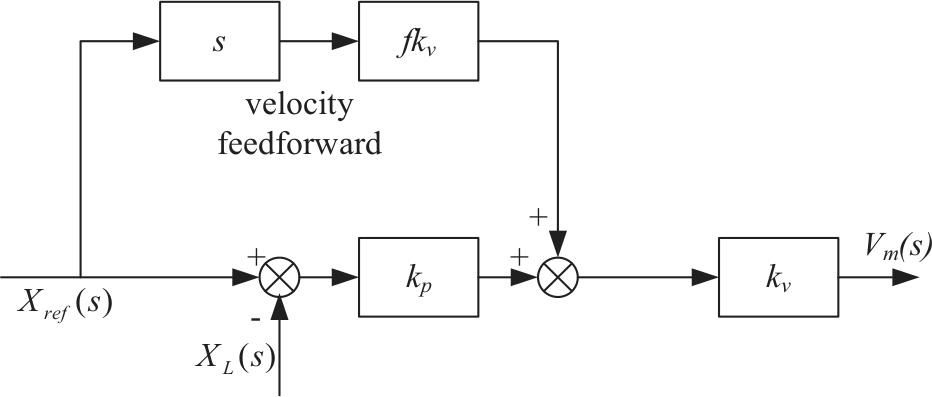
The block diagram of control loop.
Modeling of the mechanical structure
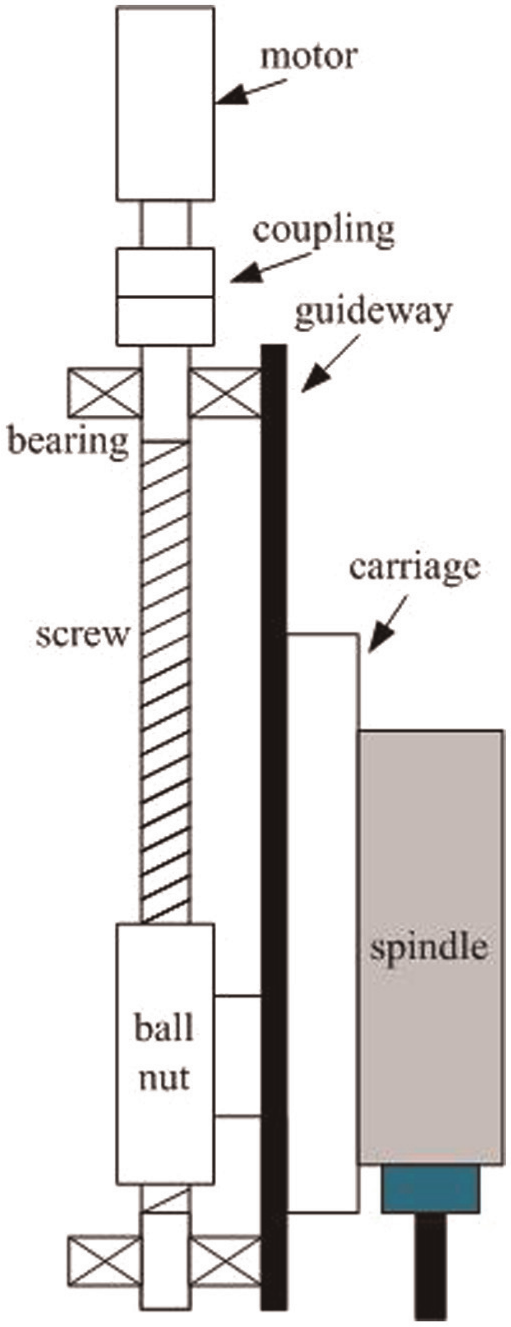
The simplified structure of the vertical z-axis of the HSM center in Figure 3 is shown in Figure 6. The carriage was equipped with a spindle with a maximum speed of 20,000 r/min. The carriage motion was drove by the traverse of a ball nut, and its feedrate was up to 20 m/min. The actual distance of the ball nut was determined by the screw speed, the equivalent stiffness of the bearings, the screw, and the ball nut. The block diagram for the mechanical structure is shown in Figure 7, where Fa was the driving force; Vr(s) was the speed of the screw, which was equal to the command speed of the motor; Xr(s) was the theoretical position of the ball nut, which was fixed in the carriage; XL(s) was the factual position of the carriage; mL was the motion mass; and kL was the equivalent stiffness of the bearings, the screw, and the ball nut. The equivalent stiffness is illustrated in Figure 8, and it could be represented as follows
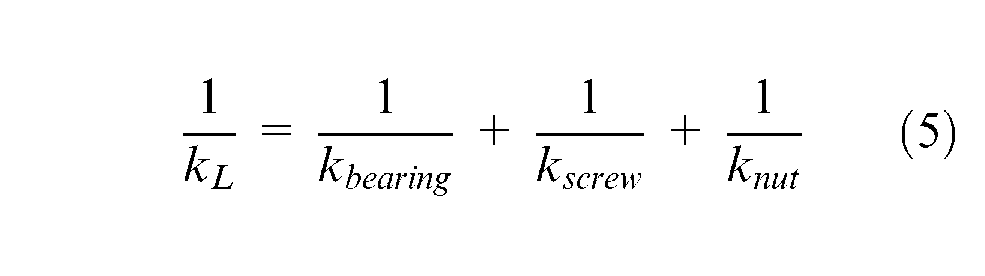
where kbearing, kscrew, and knut were the stiffness of the bearings, the screw, and the ball nut, respectively, which could be derived according to the information in the technical manual of these components.
Physical model of a mechanical structure.
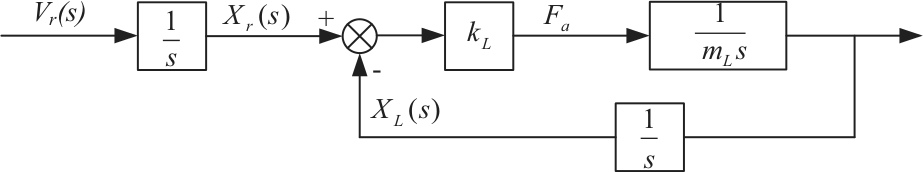
The block diagram of the mechanical structure.
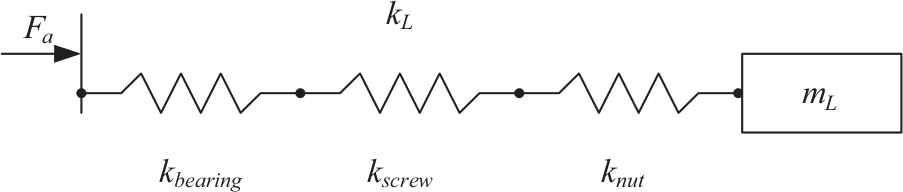
The equivalent stiffness
Performance analysis
Acceleration frequency response analysis
Taking one case for example, the maximum acceleration value of the vertical z-axis was preset as 3 m/s2. If the jerk was 3000 m/s3, the acceleration was approximated to the rectangular acceleration profile, which was widely used in common commercial CNC systems; if the jerk was 100 m/s3, the acceleration was the trapezoidal acceleration profile. The comparison of the two accelerations is shown in Figure 9. As can be seen, the acceleration profile for the jerk-limited trajectory was smoother than the rectangular acceleration profile. Such a jerk-limited algorithm could reduce the possibility of overheating the drives since the motor current was proportional to the instant acceleration. It could also reduce the risk of exciting the machine tool’s structure vibration, which could be seen by comparing the frequency responses of acceleration profiles for the two trajectories. The comparison of frequency responses is shown in Figure 10. The rectangular acceleration profile produced high-frequency response, whereas the jerk-limited trajectory signals were mainly in the low-frequency range, and it was useful to avoid the high-frequency oscillation in HSM.
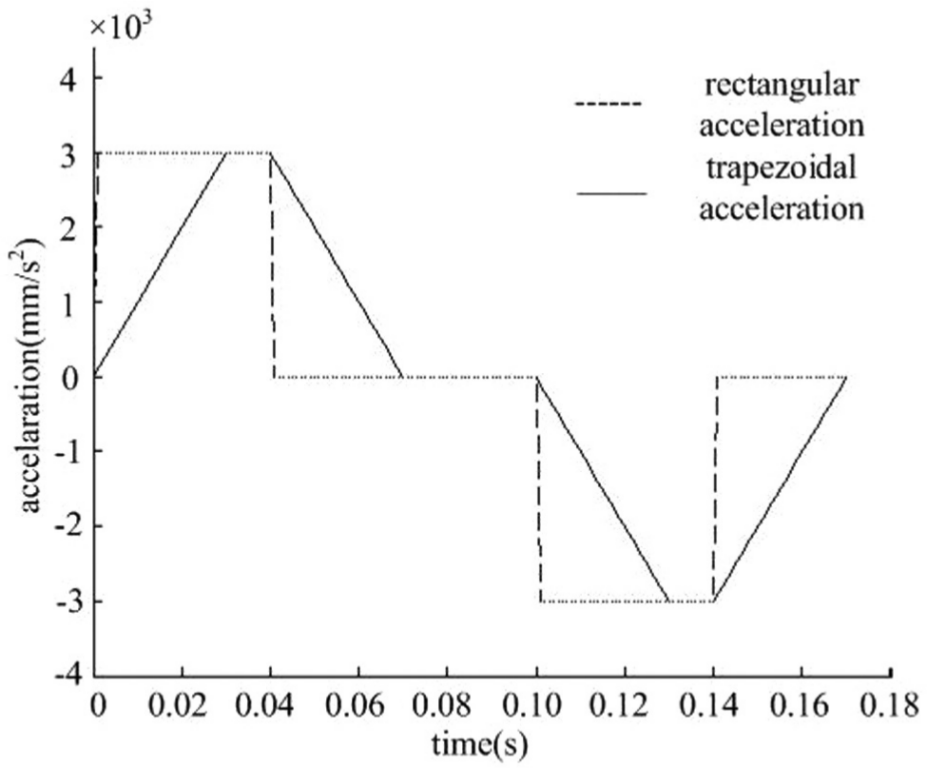
Comparison between rectangular acceleration and trapezoidal acceleration.
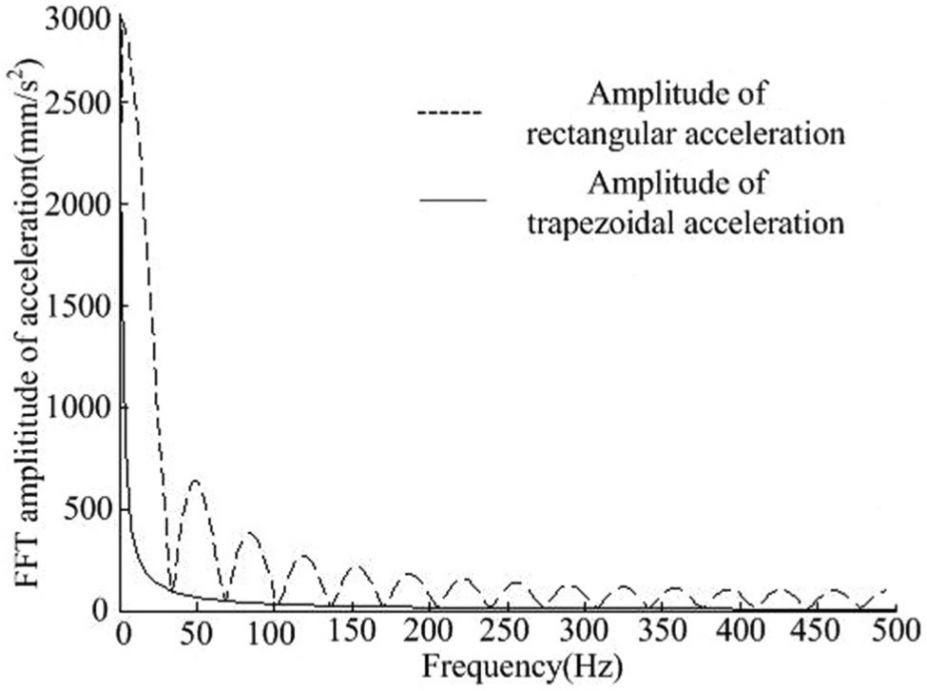
Comparison of frequency responses for two acceleration profiles.
Vibration analysis of movement
In high-speed machine tool design, to ensure that the mechanical compliance would not produce significant errors, some commercial CNC systems required that the first natural frequency of the mechanical structure should be higher than the servo response bandwidth. However, in many high-speed machines, due to heaviness of spindle box, worktable, and also the workpieces, the first natural frequency was hard to heighten. Significant machining errors could be produced because the high jerk exerted high loads on the mechanical structure, and the error during the movement could be defined as

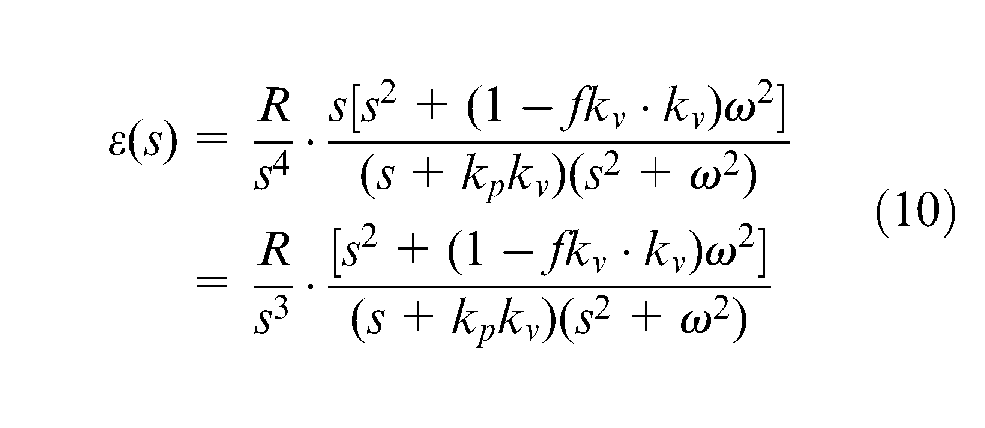
According to Figures 5 and 7, the transfer function governing the error could be described as follows
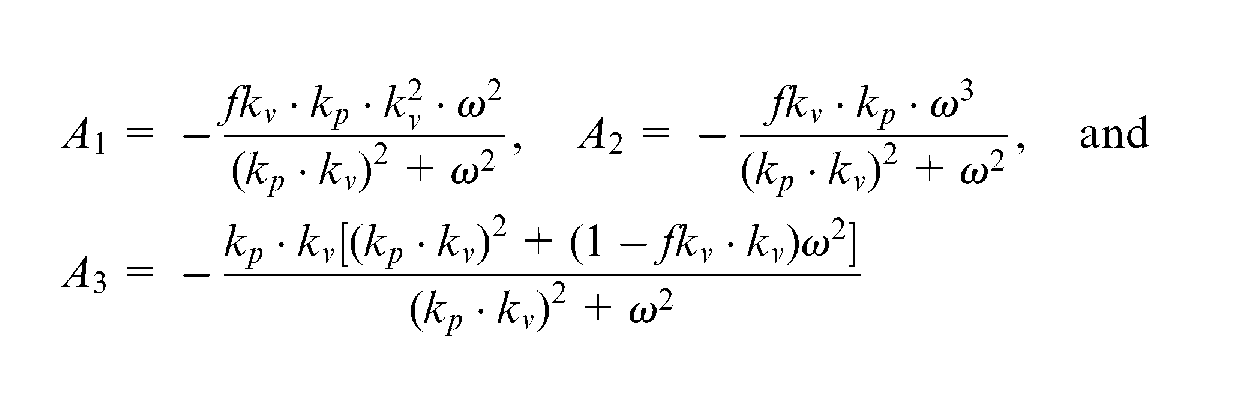
where
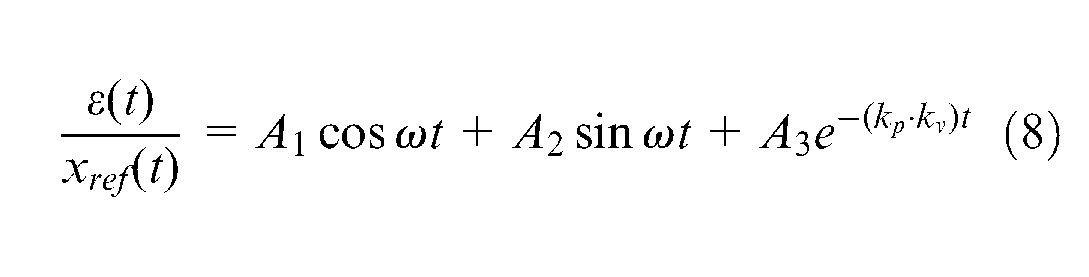
where
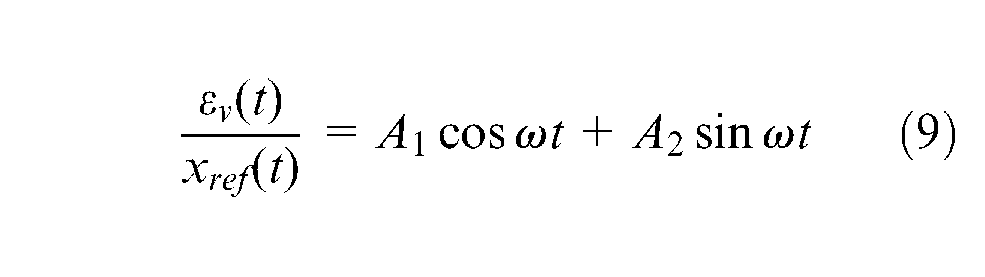
In equation (8), the error could be classified into two groups: one was steady-state vibration term and the other was transient term. The vibration term was expressed as
As shown in equation (4), the position commands produced from the trajectory-controlled algorithm were different functions of jerk at different stages. During 0 < t < t1, the motion was in acceleration rising stage, and the error was derived as follows
Inversing Laplace transformation of equation (10), the error in the time domain was obtained as
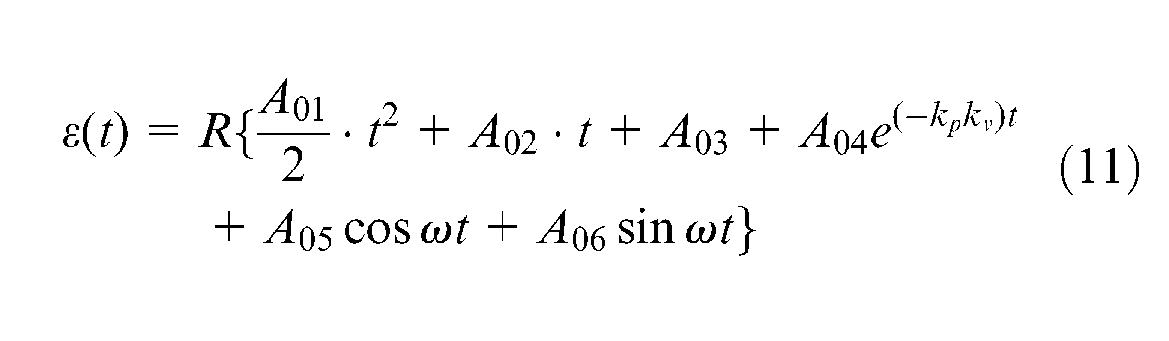
where
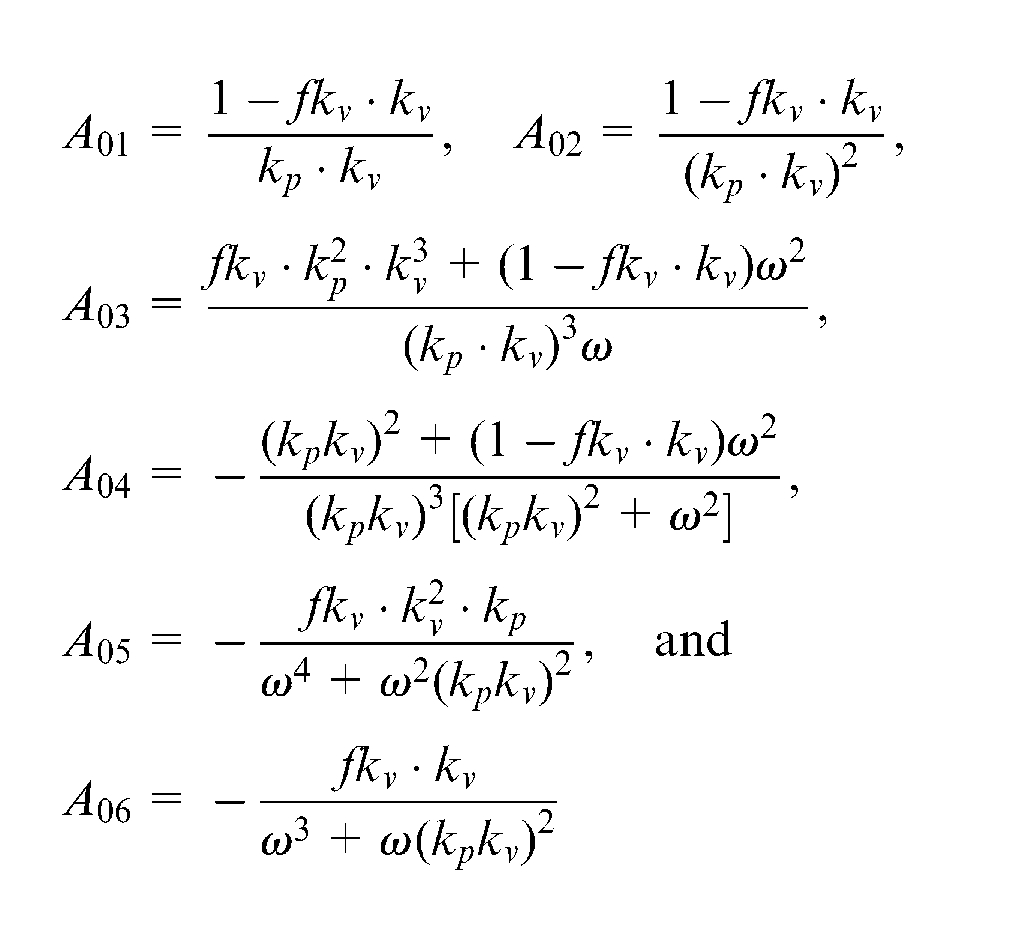
From equation (11), we could see that if the feedforward gain was equal to the reciprocal of the speed gain, the steady-state error could be reduced significantly, and the vibration error could be expressed as
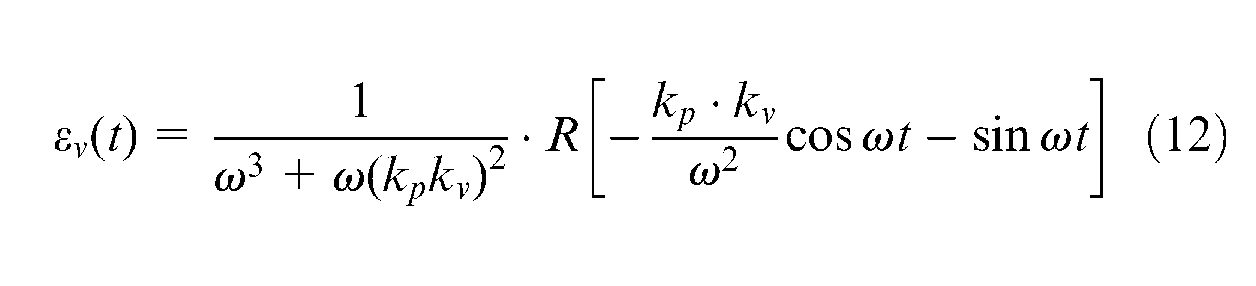
The amplitude of the vibration was
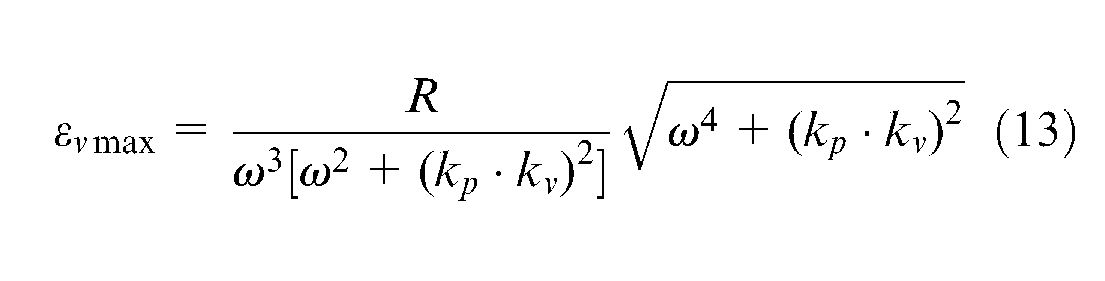
The vibration amplitude was proportional to the jerk and was with respect to the position gain, the speed gain, and the first natural frequency of the mechanical structure. If the jerk was very high, such as rectangular acceleration law, then the vibration would be so significant that the rectangular acceleration law would not be suitable for HSM. In Figure 11, we could find that during the acceleration increase stage, the lower the first natural frequency was, the more serious the vibration was. Therefore, it was effective to reduce the vibration by increasing the speed gain and the position gain in the low-frequency range.
Variation in vibration amplitude with the change of kp, kv, and ωn during 0 < t < t1 stage.
During t1 < t < t2, the motion was in the constant acceleration stage, and the error could be described as follows
Inversing Laplace transformation of equation (15), the vibration error was given by
where
The amplitude of the vibration was
During this stage, the vibration amplitude was with respect to the jerk and the acceleration rising time T1. For a given machine tool, its maximum attainable acceleration was preset. Therefore, if R was decreased, T1 would be increased accordingly. As shown in Figure 12, the vibration was decreased when R was decreased, and hence, T1 was increased. However, the change of the vibration with respect to the speed gain and the position gain was not monotone; there was an inflection in a particular point.
Variation in vibration amplitude with the change of T1, kp, and kv during t1 < t < t2 stage.
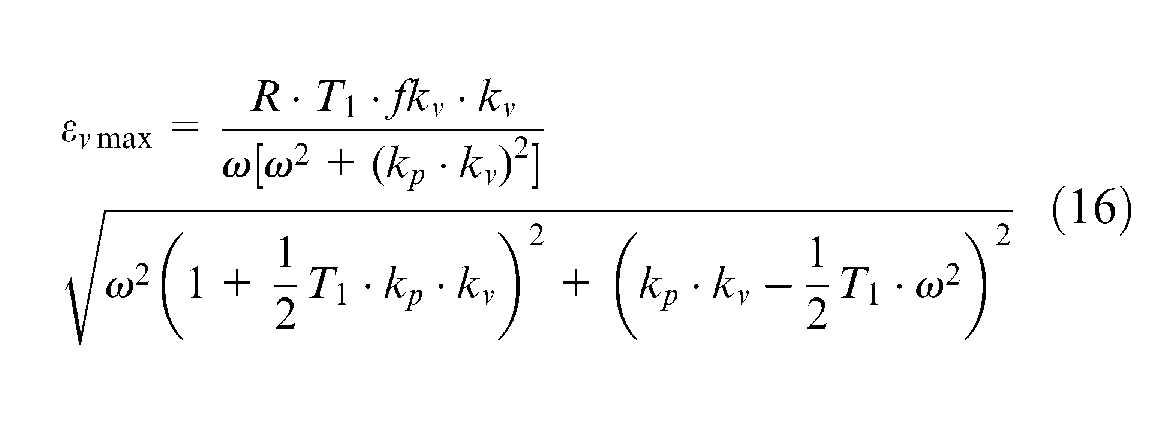
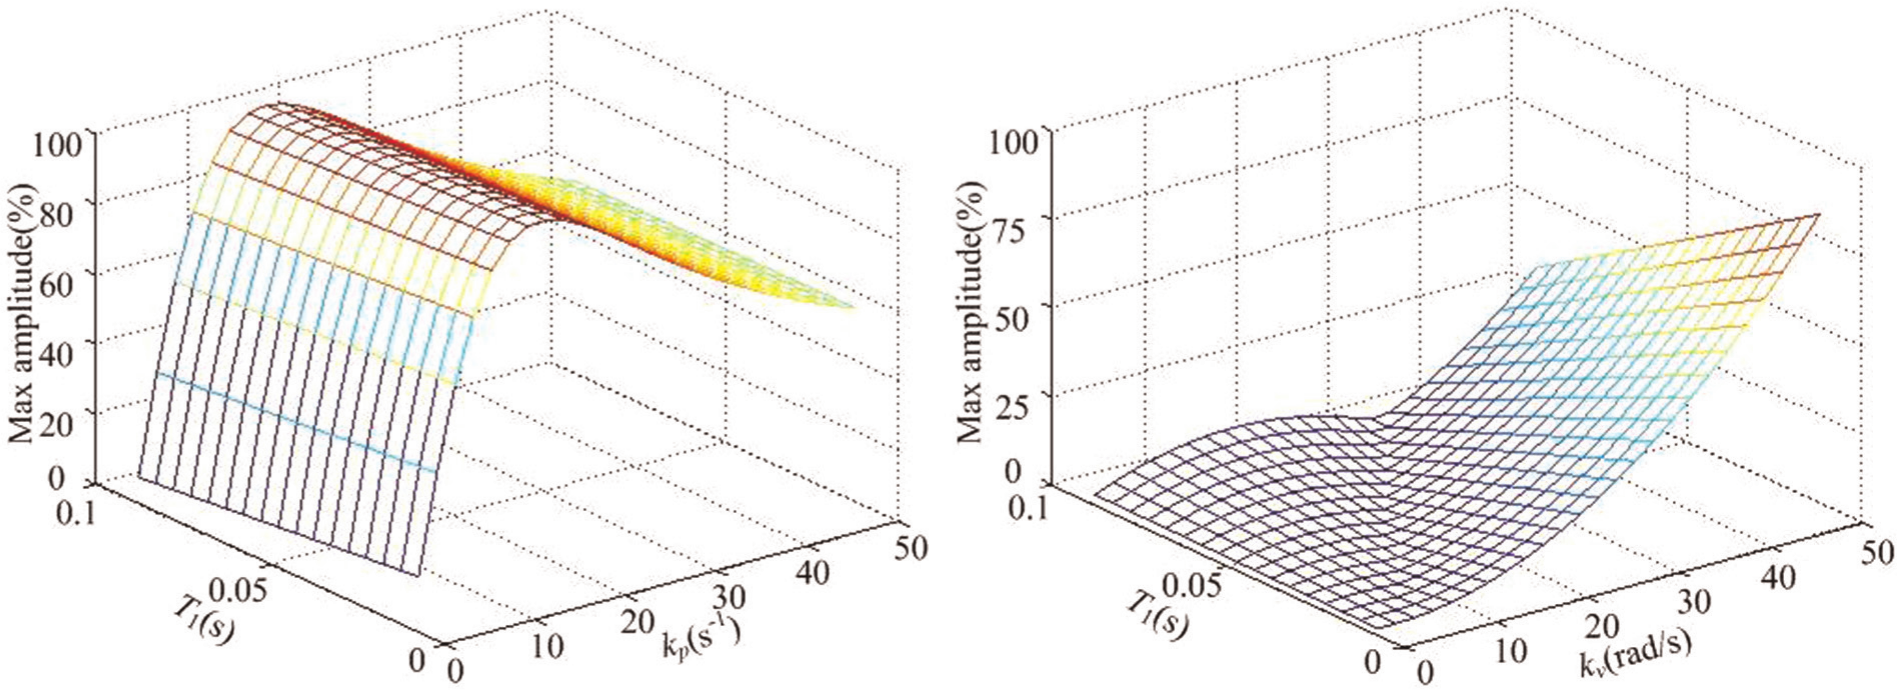
The oscillations at the initial stage were mentioned above. The vibration at the end of the movement was more important, and it was derived as

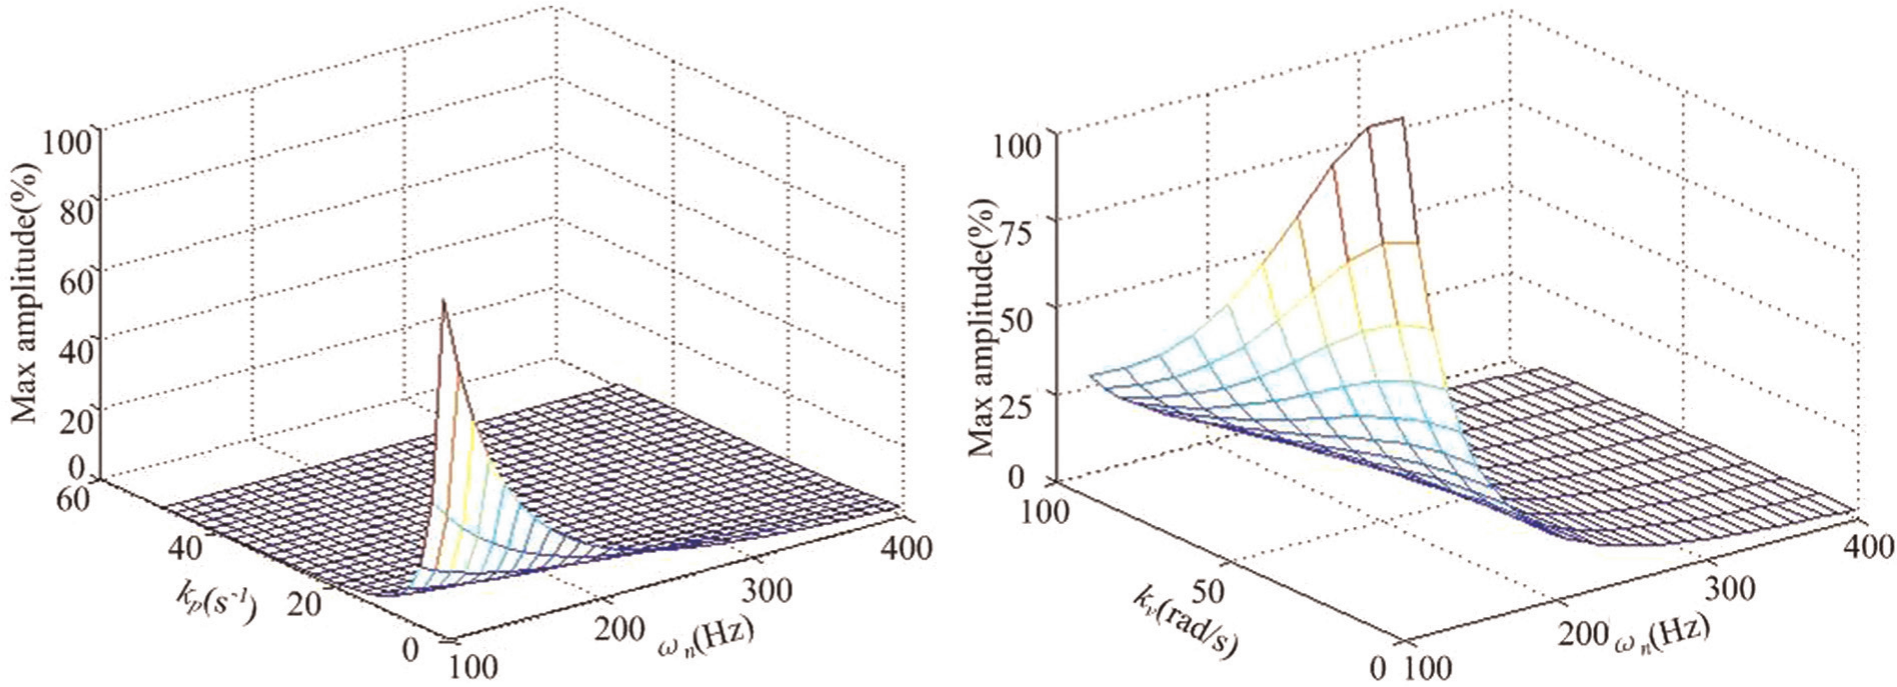
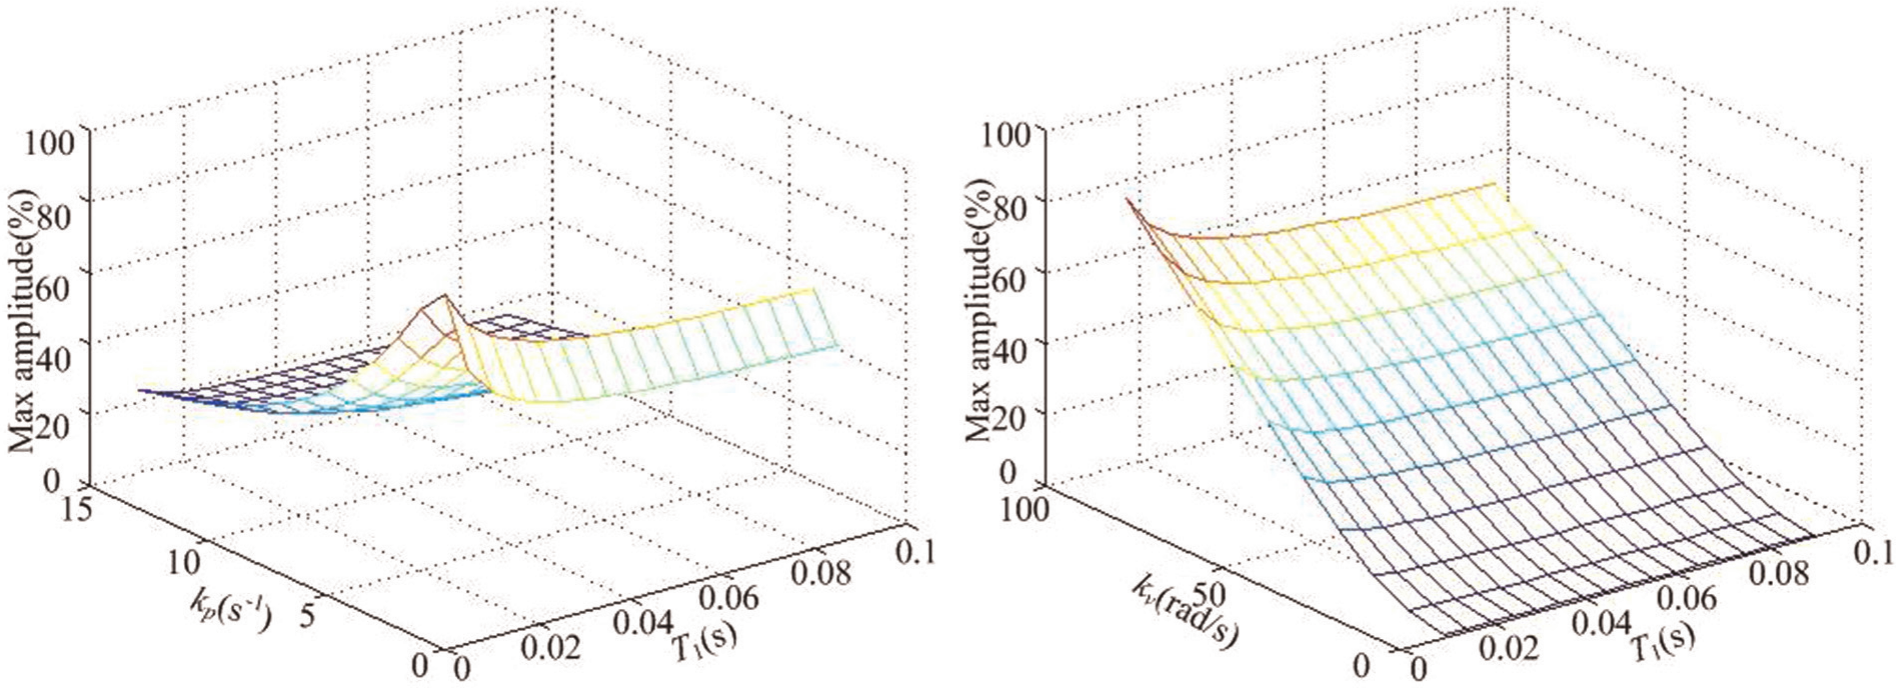
The evolution of the vibration amplitude with respect to T1, kp, and kv is illustrated in Figure 13. In order to verify the validity and efficiency of the above analysis, experimental tests have been performed on the vertical z-axis of the HSM center, which is shown in Figure 3. First, the first natural frequency of the z-axis was measured by hammer tests. In the tests, the impact hammer in use was 086C42 produced by US-based company PCB Piezotronics, Inc. The testing accelerometer was 356A15 piezoelectric accelerometer. The testing data were analyzed by the LMS vibration testing and analysis system, and the first natural frequency of the z-axis was 217 Hz. Then, the maximum acceleration was preset as 3 m/s2, and the distance and the speed programmed were preset as 0.1 m and 0.15 m/s, respectively, in the CNC unit. Finally, the 356A15 piezoelectric accelerometer was stuck on the end of the spindle, and the LMS system was also used to record the vibration amplitude in time domain when the machine was running. By changing the value of R, kp, and kv, the comparisons between the experimental results and the theoretical calculations at the end of the movement are shown in Figure 14. The experiment tests indicated that equation (17) can estimate the evolution of the vibration resulted from the trajectory-controlled algorithm in HSM, although there were some deviations between the experimental records and the theoretical results. The main reason that caused the deviations was that damping existing in the actual structure of the machine tool and some unknown parameters of the CNC system were not taken into account. As shown in Figure 14, the vibration was decreased when R was decreased, and the vibration was increased when the speed gain was increased. However, the change of the vibration with respect to the position gain was not monotone, there was an inflection in a particular point. Based on the analysis mentioned above, the value of the jerk, the speed gain, and the position gain could be tuned in terms of the acceptable dynamic performance.
Variation in vibration amplitude with the change of T1, kp, and kv during t6 < t < t7 stage.
Comparisons between experimental results and theoretical calculations.
Conclusion
In this article, a simple but generic mechatronic model was developed to analyze the influence of the trajectory-controlled algorithm on the performance of HSM.
The integrated model contained the position command resulted from the trajectory-controlled algorithm, the control system, and also the mechanical structure. The results indicated that the maximum vibration amplitude was proportional to the jerk for a given attainable maximum acceleration, and it was also influenced by the position gain, the speed gain, and the natural frequency of mechanical structure.
Comparisons between the theoretical calculations and experimental results proved the validity and efficiency of the presented model. Some deviations between the experimental records and the theoretical results were unavoidable because of the complexity of the experimental machine tool. Damping together with some unknown parameters of the CNC system was responsible for these deviations.
The study presented in this article made it possible to evaluate the evolution of the vibration from the trajectory-controlled algorithm, and it is also helpful to choose the suitable controlled parameters to improve the mechatronic performance of HSM.
Footnotes
Appendix 1
Acknowledgements
The authors wish to acknowledge Nanjing Gongda CNC Technology Co. Ltd for its assistance in experiments.
Declaration of conflicting interests
The authors declare that there is no conflict of interest.
Funding
This research was supported by National Natural Science Foundation of China (grant number 51175242), Innovation Foundation of Nanjing Institute of Technology (grant number CKJ2010014), and Key University Science Research Project of Jiangsu Province (grant number 12KJA460002).