
Abstract
High-speed milling is a manufacturing process that has great economical potential owing to high material removal rate, accuracy and quality of machined workpieces. However, chatter might arise especially in situations where there is lack of dynamic stiffness of the system composed by the machine tool, the cutting tool and the workpiece. This work analyses the dynamic stability of the high-speed end milling process. The evaluation of stability is based on sound pressure, machining force and tool displacements measured during the process. In order to investigate the transition from stable cutting to cutting with chatter, the experimentally measured tool displacements are used as input data into a computer simulation to estimate the chip thickness variation during the process. It was found that for unstable cuts, the tool shaft motions are elliptical, process dynamics are dominated by power at the chatter frequency and other vibration modes of the system can resonate with the harmonics of the chatter frequency. Through the computational simulation of the estimated chip thickness variation, it was possible to observe the transition from stable cutting to cutting with chatter, the phase differences between undulations left by subsequent teeth and their consequences in machining forces.
Introduction
High-speed milling is a manufacturing process that has great economical potential owing to high material removal rate, accuracy and quality of machined workpieces. However, this process might present premature tool wear and dynamic instabilities. The relative vibrations between tool and workpiece highly influence the result of the process. As described by Tobias, 1 metal cutting processes can entail three different types of mechanical vibrations: free vibrations, forced vibrations and self-excited vibrations. Self-excited vibrations, also called chatter, are a limitation to productivity and part quality and arise especially in situations where there is a lack of dynamic stiffness of the system composed by the machine tool, the cutting tool and the workpiece. Chatter vibrations result from a self-excitation mechanism in the generation of chip thickness during machining operations. They may be caused by mode coupling or regeneration of the chip thickness. The mode coupling chatter occurs when there are vibrations in two directions in the plane of cut. The regenerative chatter results from phase differences between the vibration waves left on both sides of the chip and occurs earlier than the mode coupling in most machining cases. 2 This type of vibration is the most undesirable and the least controllable considering it leads the system to instability.
The first approaches to predict chatter were presented by Tobias and Fishwick 3 and Tlusty and Polacek. 4 They identified the regeneration mechanism and developed mathematical models in the form of delay differential equations (DDEs). Merrit 5 presented a feed-back model of the system, explaining it as a closed-loop interaction between the structural dynamics and the cutting process. Tlusty and Ismail 6 have developed time-domain, numerical simulations of the milling operation that allows details of the cutting process to be examined. Altintas and Budak 7 presented an analytical model for prediction of milling stability by using a Fourier series-based method for handling the time-dependent directional dynamic milling force coefficients and achieved reasonably accurate results.
The introduction of high-speed milling renewed the scientific interest in chatter in machining. The concept of stability lobes was finally put to practical use. In addition to that, the development of methods to select the highly stable spindle speeds was stimulated. According to Quintana and Ciurana, 8 chatter is still a very important topic in manufacturing research. That persistent relevance over the years can be explained by two principal factors: the complexity of the phenomenon makes its study and understanding non-trivial; and the negative effects of chatter stimulate interest in solving the problem. Strategies for its recognition, prediction or suppression are still the subject of much research.
There are several setup types for measuring vibrations in the milling process. Vibrations can be detected by displacement probes, accelerometers, microphones, dynamometers and also by optical devices. Generally the closer the sensor is to the region being milled, the more reliable are the measurements. However, measurement may be impaired by chips and cutting fluids. In the study of Delio et al. 9 on chatter detection in metal cutting, three different types of transducers were applied: force dynamometers, accelerometers and microphones. It was concluded that microphones are capable of detecting vibration signals resulting from the tool, the workpiece or the machine, even for cuts with small machined sections. They can be positioned relatively distant from the cutting region without loss of sensitivity. A significant problem may arise when the microphones are used in environments with high noise levels, unless some directionalization technique is employed. Dynamometers normally have an adequate response at low frequencies, however, high frequency vibrations are difficult to detect with this equipment. Sensitivity problems also occur for small machining sections, where the cutting forces are produced for a very short period of time during revolution of the tool and may provide signals that are inadequate for the detection of vibrations. Displacement sensors and accelerometers, when positioned away from the point of milling force application, may be close to a nodal point of a vibration mode or incur problems of transmissibility. Davies et al. 10 introduced a spindle-mounted capacitance probe array capable of measuring tool deflections in two directions during high-speed milling and proposed a method for chatter detection using once-per-revolution samples of measured data. As outlined by Eppel et al., 11 non-contact measurement devices, such as laser distance triangulation sensors (LDS), TV-holography, laser doppler vibrometers (LDV), or laser interferometer (LI) may be also used for chatter detection. The most sensitive, accurate and precise optical device for measuring distance or displacement is the LI. Nevertheless, these vibrometers are expensive devices and errors occur when the contrast of the interferometer signal is not perfect and when the phase-shifted signal is not shifted by exactly 90°.
Previous studies compared different types of sensors to determine which signals are most sensitive for chatter detection and proposed methods consisting of online chatter identification.9,12–14 The general consensus is that one kind of sensor might find some limitation for chatter detection. In this work the simultaneous use of different types of sensors aims to provide information that is complementary and contributes to a better understanding of the phenomena associated to the dynamics of the process. This work analyses the dynamic stability of the high-speed end milling process. The evaluation of stability is based on sound pressure, machining force and tool displacement measured during the process. Moreover, a new method is proposed to investigate the transition from stable cutting to cutting with chatter. In this method the experimentally measured tool displacements are used as input data into a computer simulation to estimate the chip thickness variation during the process.
Material and methods
Experimental setup
The experiments were carried out on a Hermle C600U machining center with a maximum spindle speed of 16,000 r/min and 15 kW power. The workpiece material was a 7075-T6 aluminum alloy. A 16 mm diameter, 80 mm overhang, six-flute, cemented carbide end mill was used. Full immersion (slotting) cutting tests were performed for various spindle speeds (n) and axial depths of cut (ap). A constant feed rate of 0.1 mm/tooth was used for all tests.
The workpiece was clamped on a force dynamometer (Kistler Type 9272A), which was bolted on the feed table of the machining center to measure the instantaneous cutting forces in the feed (X) and normal (Y) directions. The natural frequency of the force dynamometer (with no workpiece attached onto it) for two orthogonal directions in the cutting plane is approximately 4 kHz. The dynamic characteristics of this dynamometer also depend on the workpiece mass.
To measure the tool dynamic displacements in the X and Y directions during machining, two displacement sensors (Bently Nevada type 330103-02-10-10-02-00) were mounted on a fixture that was attached to the spindle face of the machine-tool as shown in Figure 1. Measurements were made indirectly, as it was necessary to use an aluminum pulley fixed by thermal contraction to the shaft of the end mill at 30 mm from its end, similarly to the method used by Diniz and Neves. 15 Geometric error motions of the end mill shaft were in the order of 4 µm.
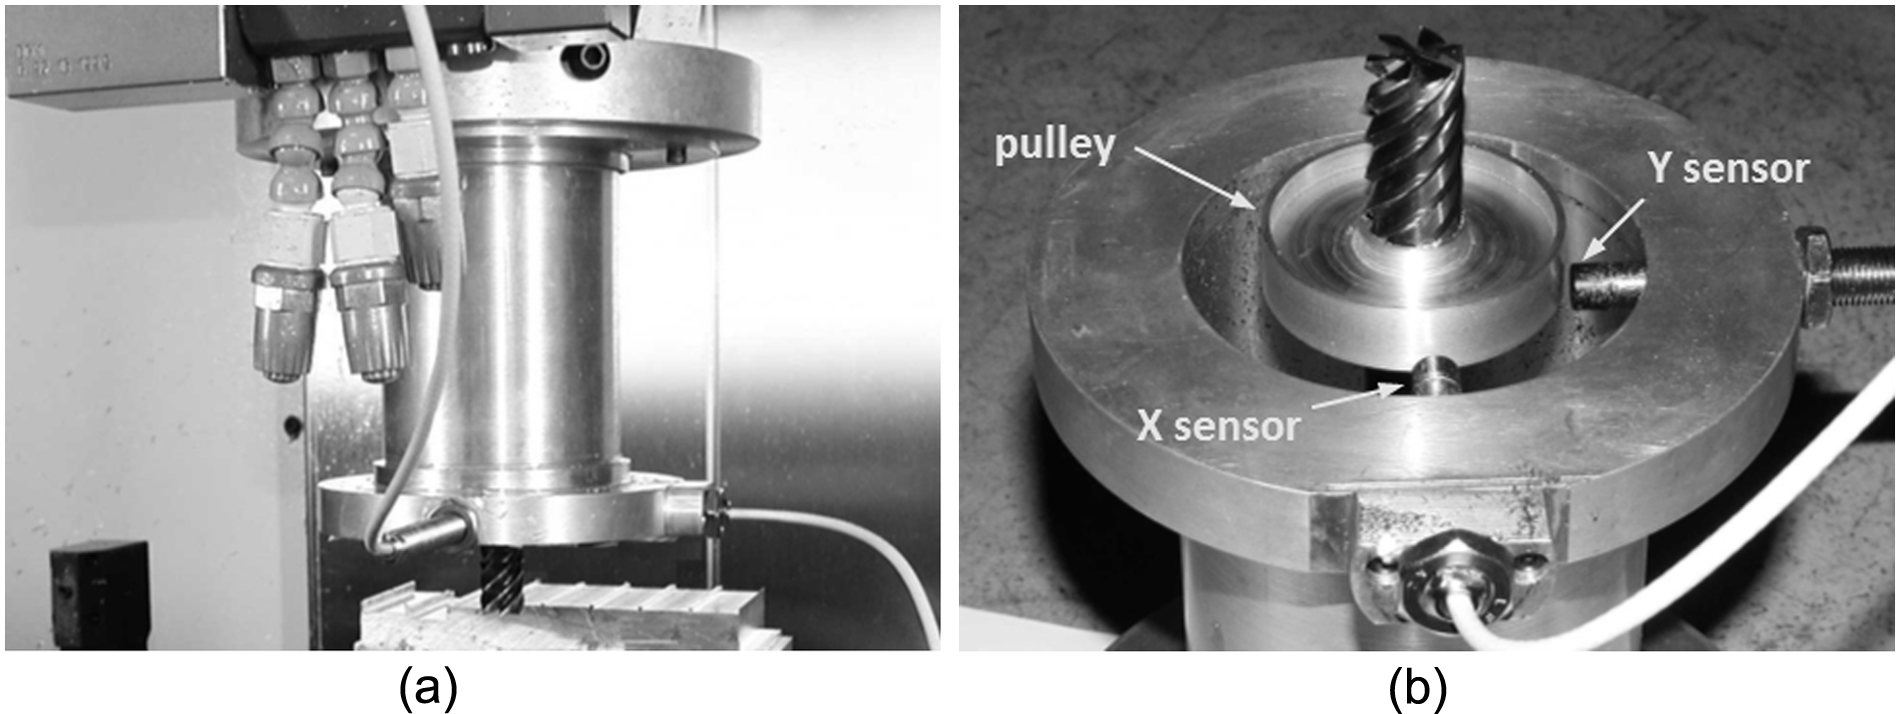
System for measuring tool dynamic displacements.
The sound pressure during milling was measured by a 1/2 in free field microphone (PCB type 377A02 ICP), which was positioned in the machine working area close to the workpiece.
Mathematical formulation
In order to investigate the transition from stable cutting to cutting with chatter, the experimentally measured tool displacements were used as input data in a computer simulation to estimate the chip thickness variation during the process.
The dynamic milling model used was developed by Altintas and Budak, 7 and its brief mathematical formulation related to this article is summarized in this section. In addition, a correction based on the Euler–Bernoulli beam theory was used to calculate the tool tip displacements from the ones measured by the sensors.
Figure 2 shows a schematic of a milling operation. The cutter is assumed to have N number of teeth with a constant pitch angle
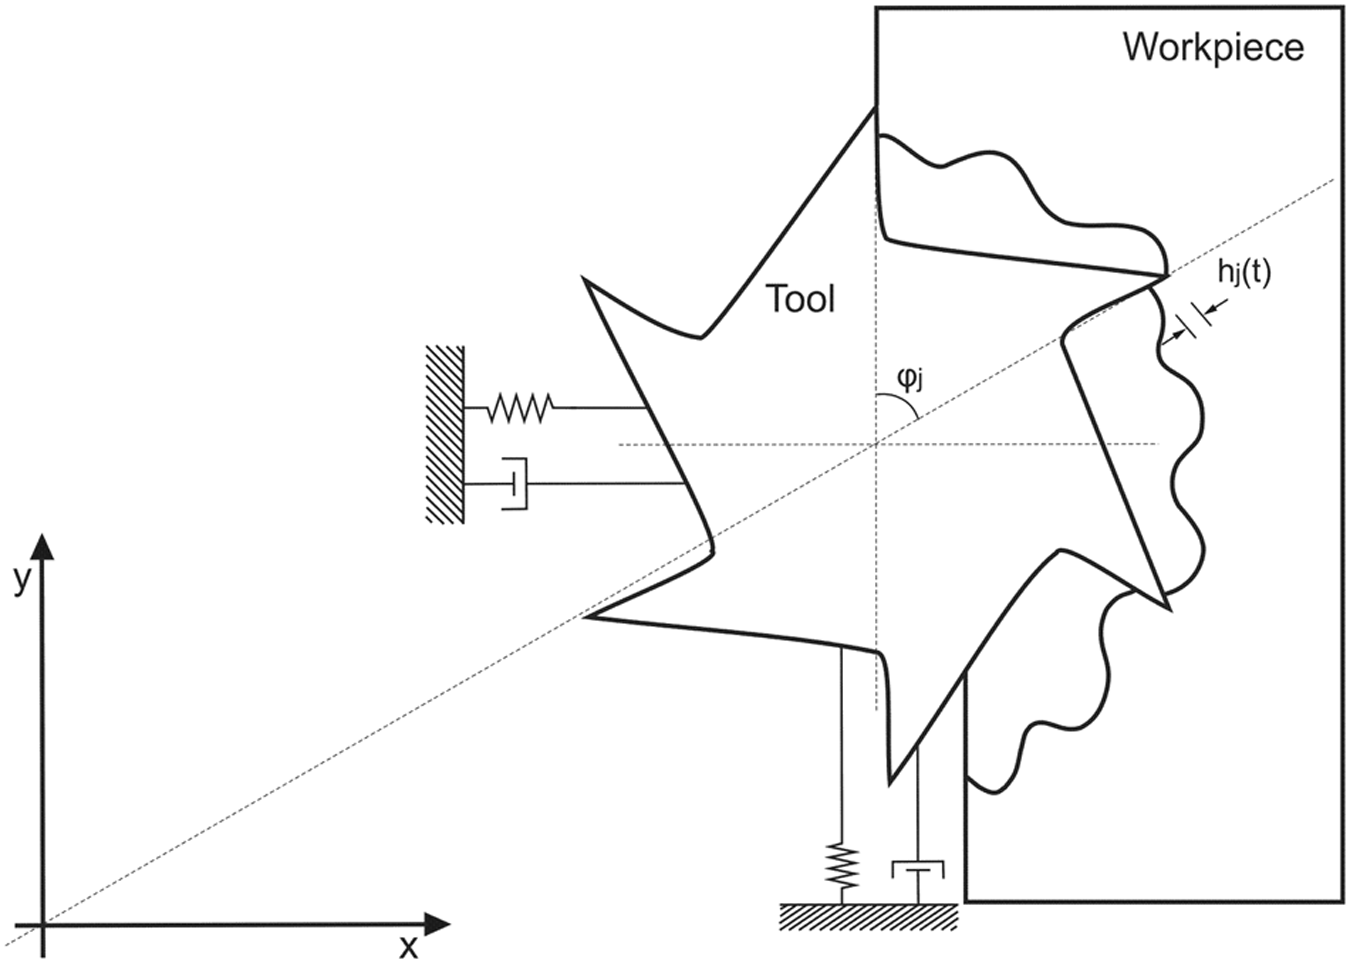
Two degree-of-freedom milling system.
The angle between each tooth j and the vertical (y-axis) is the instantaneous immersion angle

Machining forces excite the structure in the feed (X) and normal (Y) directions, causing dynamic displacements x and y, respectively. The instantaneous chip thickness variation,

where

and
Here
Given the chatter frequency

As the tool shaft displacements were measured at a distance of 30 mm from the cutting end, it was necessary to calculate the tool tip deflections. In order to perform this correction the tool was assumed to be an Euler–Bernoulli cantilever beam (uniform section) with a concentrated load F (cutting force) at the end. In this case the deflection v along the beam is given by

where E is the Young’s modulus, I is the moment of inertia, L is the length of the beam and u is the distance along the beam. This model does not take into account the inertial effects of the cutting process and geometric non-linearities.
Results and discussion
Figure 3 shows plots of the x and y motions of the tool shaft highlighting the points sampled at each revolution for ap = 1 mm. For a spindle speed that resulted in a stable process (n = 12,500 r/min), the points are grouped together presenting a small dispersion and appear to be synchronous with the spindle rotation (Figure 3(c)). For the spindle speeds that resulted in unstable cuts, the points are further away from each other forming an elliptical trajectory (Figure 3(a), (b) and (d)). As suggested by Davies et al., 10 this is indicative of a quasi-periodic motion owing to the simultaneous presence of the tooth passing frequency and the chatter frequency.
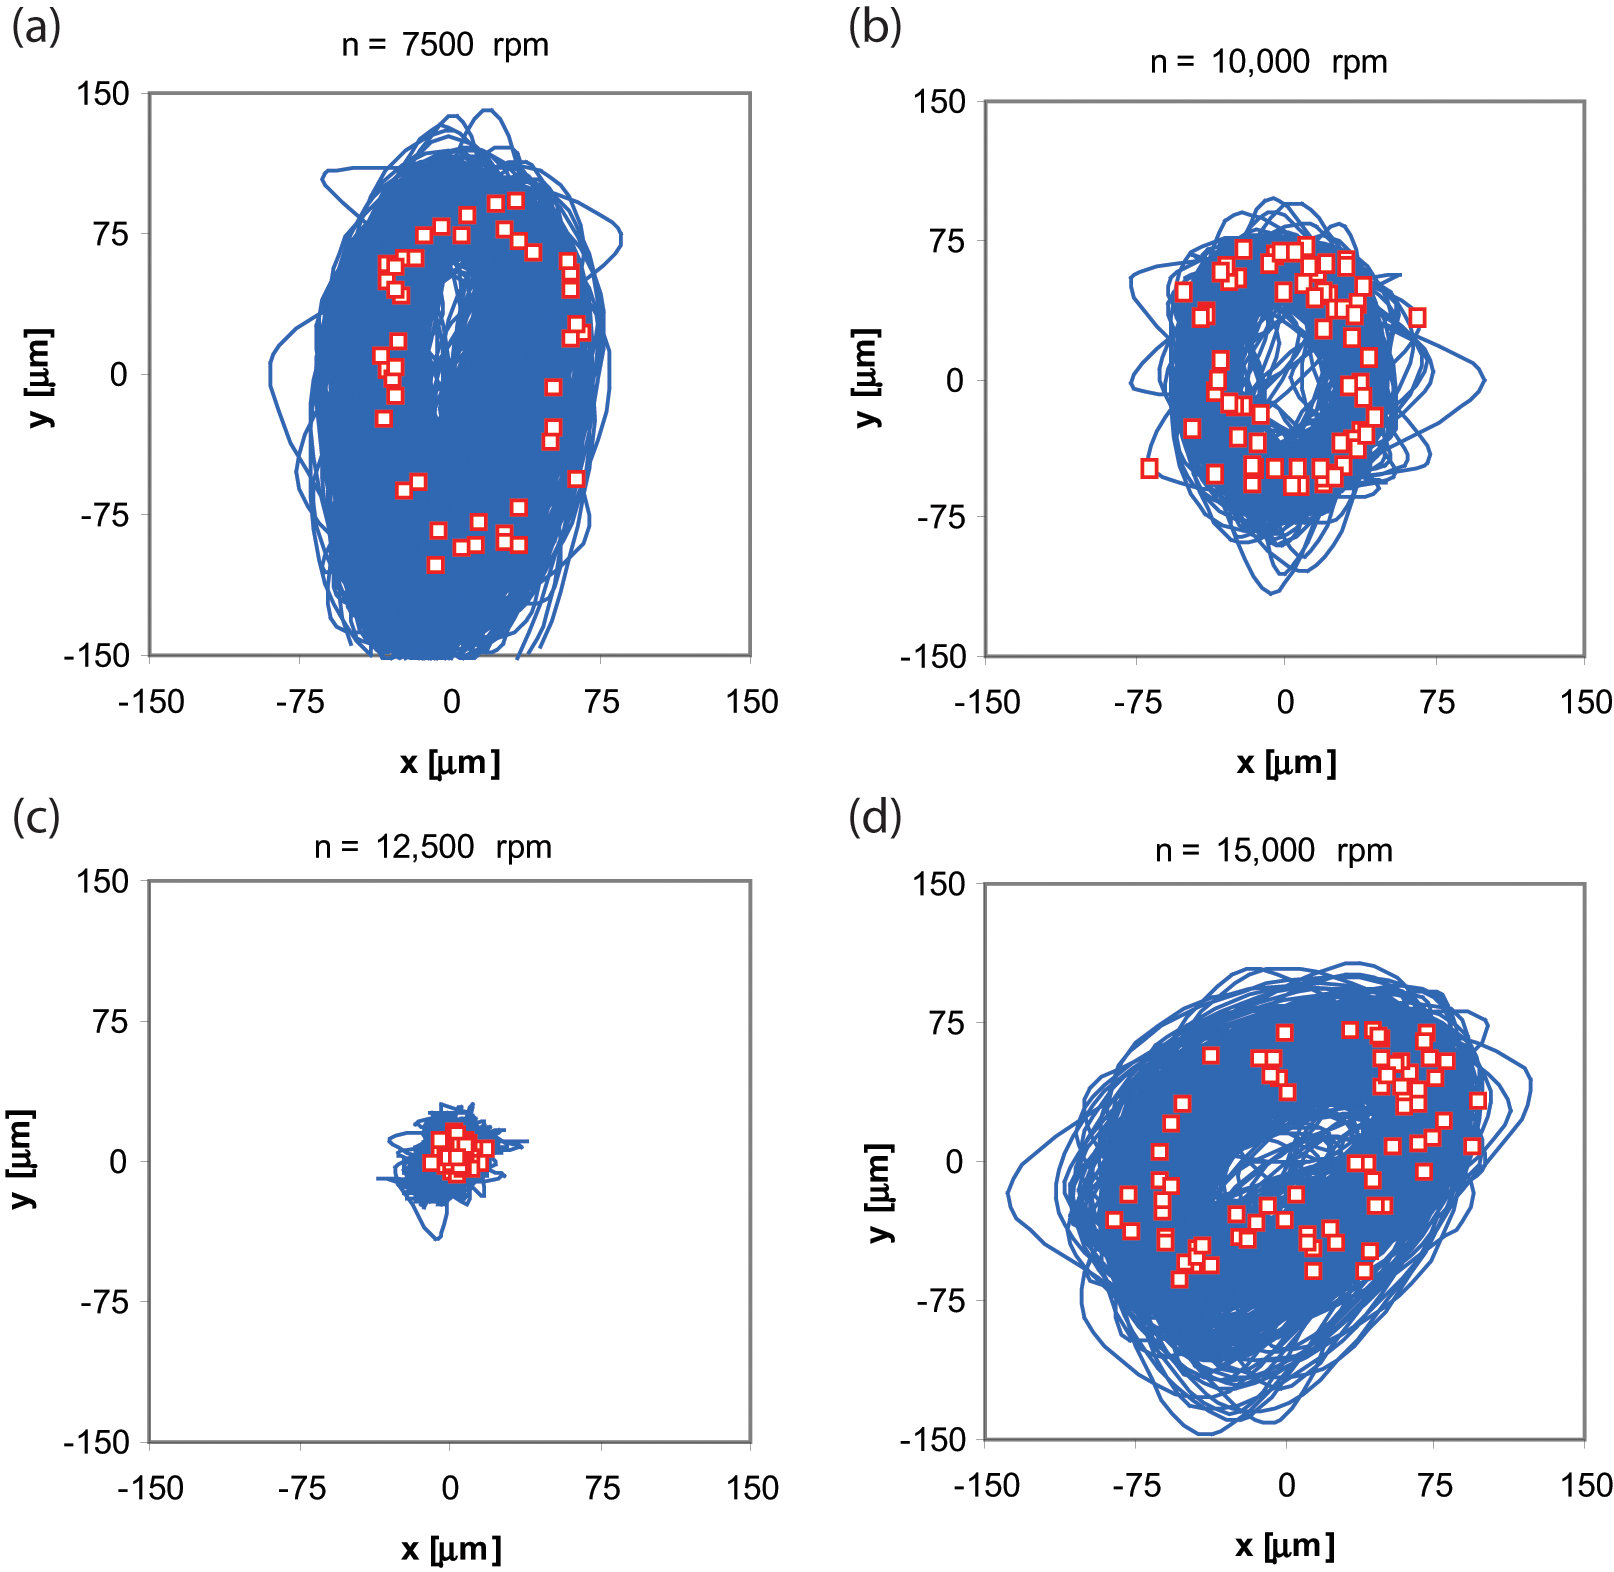
Plots of the x and y motions of the tool shaft on the working plane (ap = 1 mm).
Figure 4 shows the frequency spectra of the displacement signals in the feed direction. For the stable cutting at 12,500 r/min, there is a dominant peak at the tooth passing frequency (f t ). For the unstable conditions, the dominant peaks occur in greater magnitudes at different chatter frequencies. As proposed by Smith and Tlusty, 16 stable machining dynamics are dominated by power at the tooth passing frequency (f t ) and its harmonics, whereas regenerative chatter is characterized by motions that have significant power at the chatter frequency (f c ). In unstable cuts it is possible to observe the presence of the chatter frequency (dominant peak) simultaneously to the tooth passing frequency and its sub-harmonics (Figure 4). According to Tlusty, 17 this gives rise to the phase shift between oscillations of one tooth and the next what results in regenerative chatter.
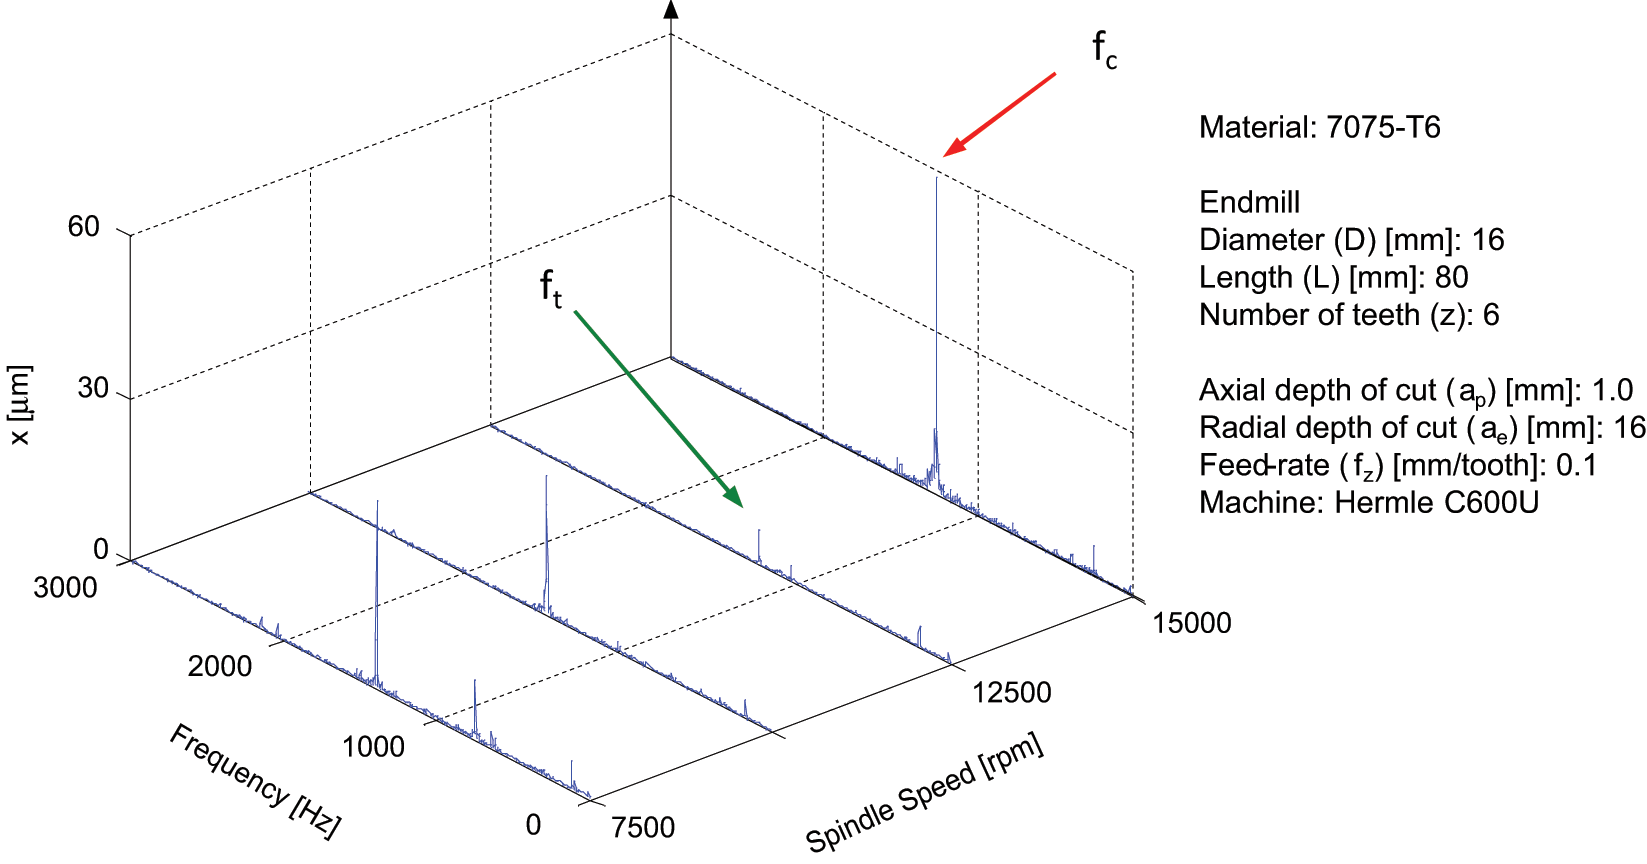
Frequency spectra of the displacement signals in the feed direction.
Figure 5 shows the spectra of the displacement, the sound pressure and the machining forces signals for an unstable cut (n = 10,000 r/min and ap = 1 mm). In the spectra of the displacement signals in the feed and normal directions (Figure 5(a) and (b)) the only apparent peaks are the chatter frequency (clearly dominant one), the tooth passing frequency and its sub-harmonics. The peak of the chatter frequency is higher in the normal direction owing to the force distribution during the milling process. Higher force magnitudes in this direction are typical from slotting operations. Because of the high flexibility of the tool being tested, most of the deflections encountered during machining were concentrated in the tool and primarily associated with its first bending mode.
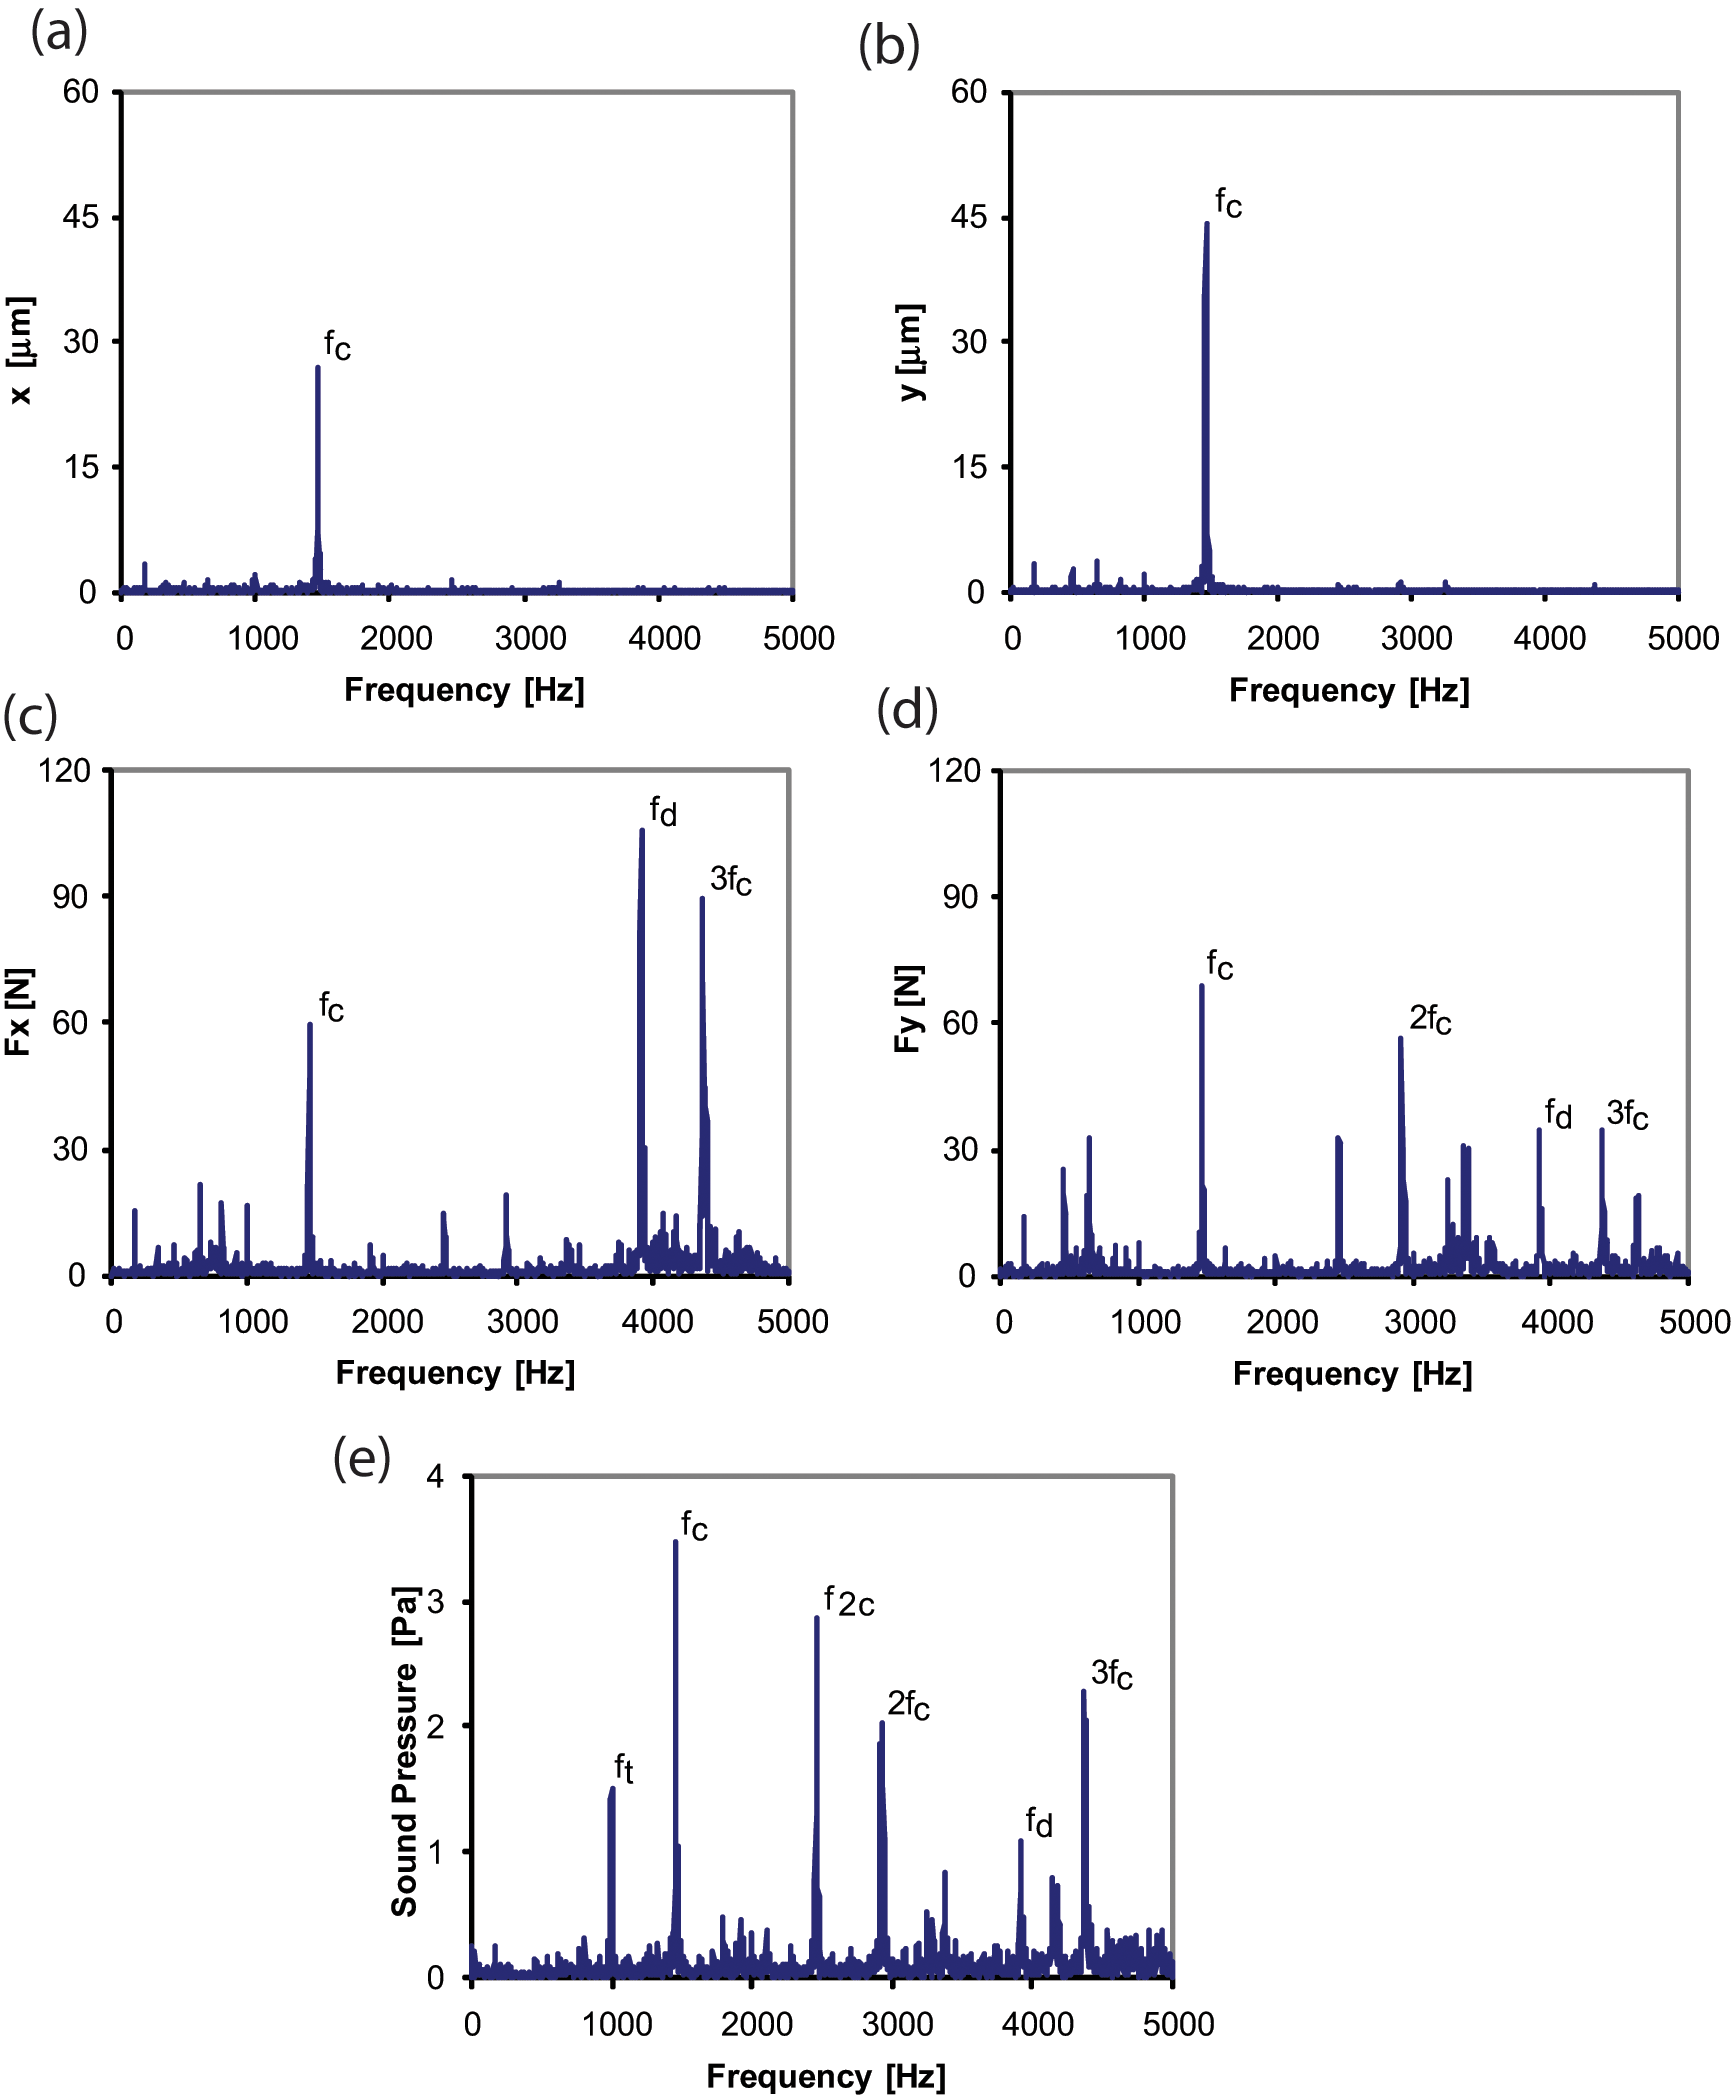
Spectrum of the displacement in the feed direction (a), spectrum of the displacement in the normal direction (b), spectrum of the force in the feed direction (c), spectrum of the force in the normal direction (d), and spectrum of the sound pressure (e) for an unstable cut.
In the spectrum of the force in the feed direction (Figure 5(c)) the highest peak is close to the force dynamometer natural frequency (f d ) and the second highest peak is the third harmonic of the chatter frequency (3f c ). In this case the chatter frequency is only the third highest peak. In the spectra of the force in the normal direction (Figure 5(d)) the highest peaks are the chatter frequency and its second harmonic (2f c ). Peaks close to the force dynamometer natural frequency (f d ) and the third harmonic of the chatter frequency are also visible. Dombovari et al. 18 showed the effect that other modes of the system can resonate with the harmonics of the dominant frequency of the self-excited vibration (in practice the chatter frequency). The presence of a frequency close to the natural frequency of the dynamometer in the spectrum indicates that this sensor is not suitable for chatter detection and control in high-speed milling.
In the spectrum of the sound pressure (Figure 5(e)) the highest peak is the chatter frequency and the second highest peak is the frequency of the second vibration mode (f2c). The second and the third harmonics of the chatter frequency (2f c and 3f c ) are clearly visible, as well as the tooth passing frequency. A peak close to the force dynamometer natural frequency (f d ) can also be noticed. Thus, the microphone was capable of detecting vibration signals from the tool (first and second vibration mode) and also from the force dynamometer with the workpiece attached to it for this particular case.
Table 1 shows the critical depth of cut (alim), the chatter frequency (f c ), the number of waves between consecutive teeth (k) and the phase shift between inner and outer modulations (ε) determined from equation (5), for the tested spindle speeds.
Critical depth of cut (alim), chatter frequency (f c ), calculated number of waves between consecutive teeth (k) and calculated phase shift (ε) for the tested spindle speeds.
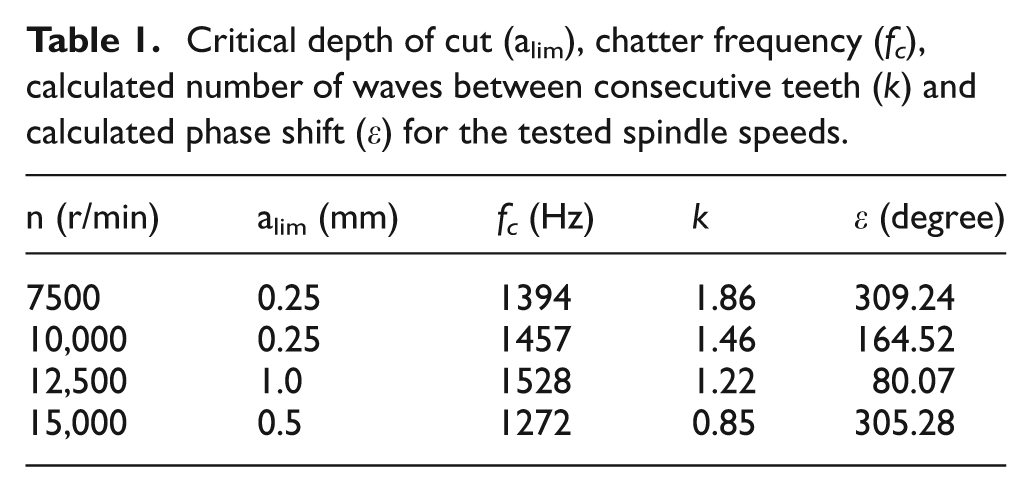
The chatter frequencies presented a relatively high dispersion. In similar conditions, Weingaertner et al. 19 found a strong correlation between the simulated chatter frequencies based on the traditional chatter theory and the experimentally measured ones. In spite of that, the empirically obtained frequencies deviated more from the natural frequency of the system. The highest chatter frequency occurred at n = 12,500 r/min, which also allowed the highest critical axial depth of cut. The lowest one occurred at n = 15,000 r/min, where the number of waves between consecutive teeth was less than 1, which means that tooth passing frequency surpassed the natural frequency of the system. As demonstrated by Smith and Tlusty, 16 once the cut crossed the limit of stability on the highest lobe, the chatter frequency is lower than the tooth passing frequency. Higher critical depth of cut occurred for spindle speeds where the number of waves between consecutive teeth was closer to one. According to Tlusty, 17 when there is exactly one wave between consecutive teeth, there is no chip thickness variation and, consequently, no cutting force variation to excite vibration. On the other hand, for n = 10,000 r/min there was almost one and a half waves between teeth, resulting in opposition of phase (close to 180°), large chip thickness variation and, consequently, lower critical depth of cut.
Figure 6 illustrates the estimated chip thickness in function of the immersion angle of the end mill for two different conditions of stability for ap = 1 mm. Vibration marks left on the surface by four subsequent cuts are also shown. The shaded area represents the actual removed material during one tooth passing period. There are always three teeth simultaneously removing material.
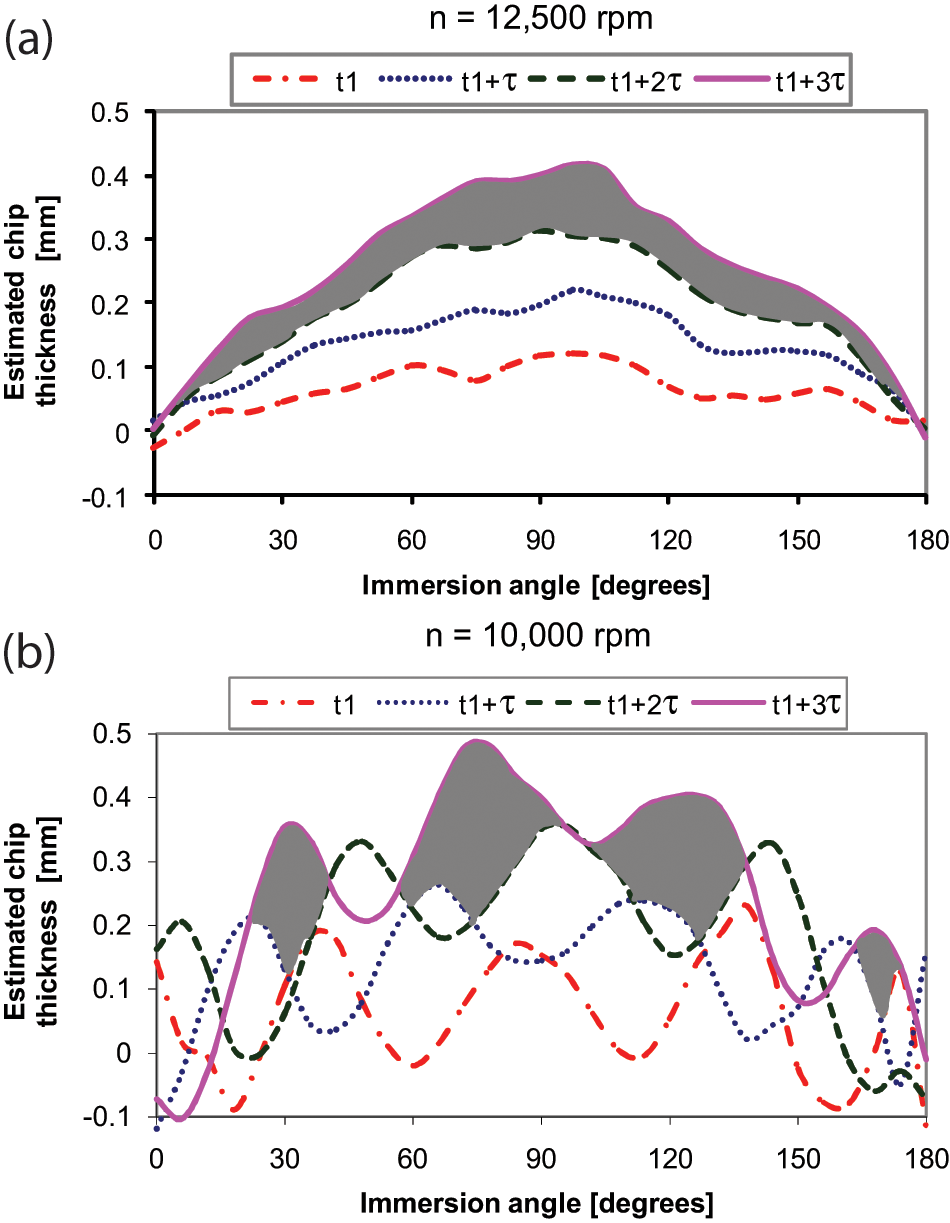
Estimated chip thickness for a stable cut (a) and an unstable one (b).
For the stable condition, chip thickness varies from zero to a maximum of the feed-rate (h0) close to
For the unstable condition, vibration marks left on the surface during previous tooth passing play an important role (Figure 6(b)). In this case, the chip thickness highly varies in time owing to the phase difference between waves left by subsequent teeth. It can be observed that at some instances the end mill jumps out of the cut, thus producing a zero chip thickness and zero cutting force. According to Tlusty and Ismail, 6 this basic non-linearity chatter does not grow indefinitely, but stabilizes at a finite amplitude of vibration. On the other hand, in other instances the chip thickness achieves almost three times the value of the intended chip thickness h0. The chip thickness variation and, consequently, the dynamic force, are not only dependent on the current end mill displacement at time t, but also on the displacement of the previous teeth at time t-τ, t-2τ and t-3τ.
Variations in chip thickness have a direct influence on the machining resulting force on the working plane (Figure 7). As expected for a stable condition (Figure 7(a)), the resulting force variations are small, since the process corresponds to a slotting operation and there are always three teeth simultaneously removing material. The dynamic component of the signal is associated with tool run-out. In the unstable condition (Figure 7(b)), there is large variation in the signal of the resulting force, with peaks with values corresponding to triple those found in the stable condition. This result is in agreement with the variations in chip thickness found in Figure 6(b).
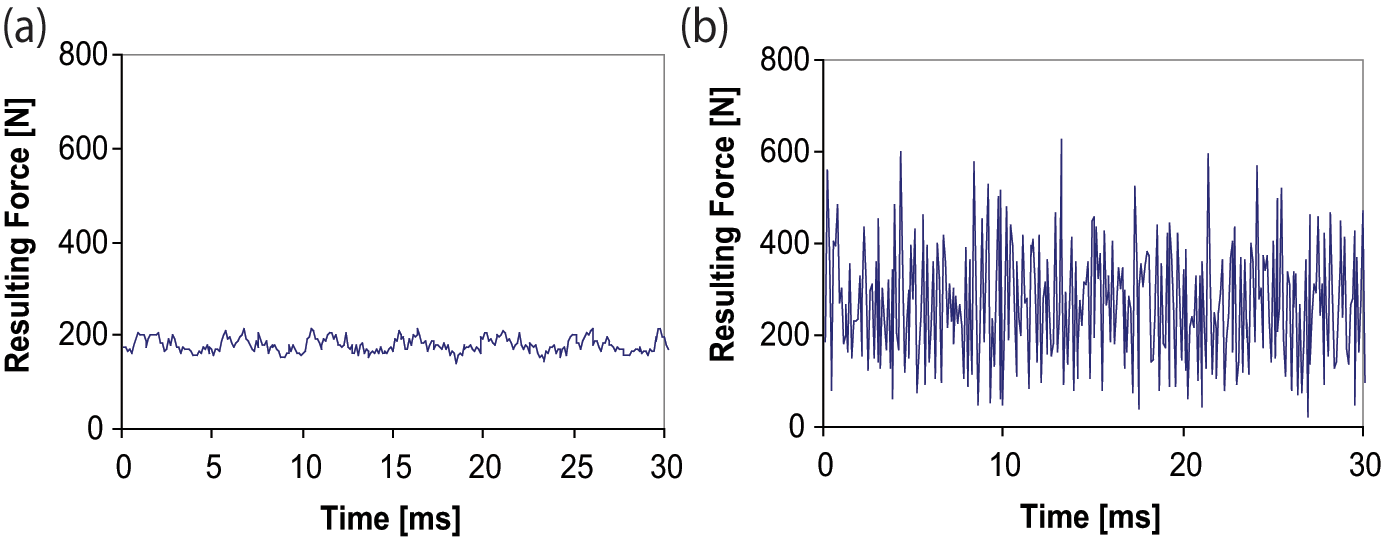
Machining resulting force on working plane for a stable condition (a) and an unstable condition (b).
Figure 8 demonstrates the behavior of the force in the normal direction and the estimated chip thickness as the end mill penetrates into the workpiece for n = 10,000 r/min and ap = 0.5 mm. It also shows the vibration marks left on the surface by subsequent cuts during a period of one tool revolution before full penetration and half tool revolution after full penetration. The shaded areas represent the actual removed material during one tooth passing period at different time instances.
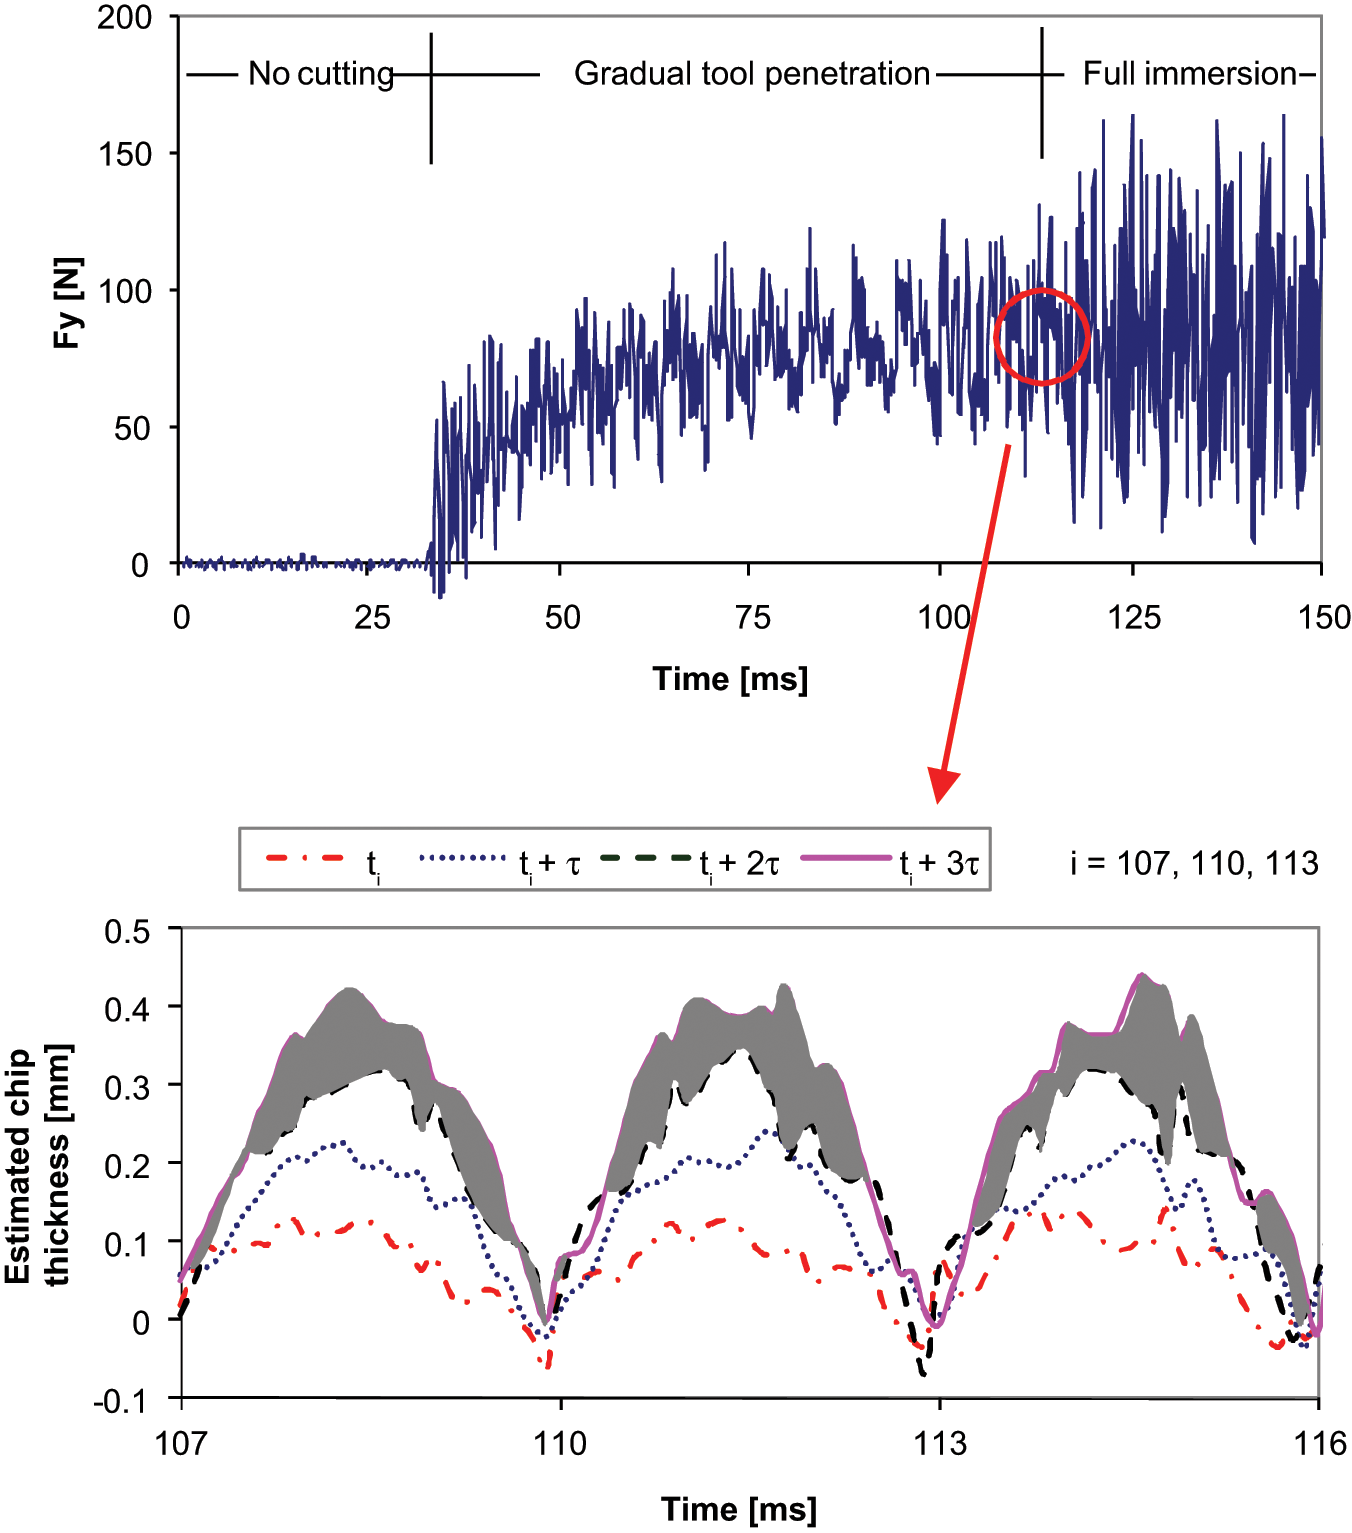
Force in the normal direction and the estimated chip thickness in function of time as the end mill penetrates into the workpiece for n = 10,000 r/min and ap = 0.5 mm.
As the end mill penetrates into the workpiece, the force in the normal direction increases gradually. No chatter occurs during the gradual tool penetration because the phase angles of subsequent undulations are not equal. However, when the full immersion is reached they both adjust simultaneously to the optimum phasing for regeneration, which results in a significant elevation of force magnitude (t = 113 ms). It is possible to observe the transition from stable cutting to cutting with chatter in the graph of the estimated chip thickness in time. The chip thickness begins to widely vary in time as the full immersion is about to be achieved. This can be noticed by comparing the shaded areas representing the actual removed material during a half tool revolution before full penetration and a half tool revolution after full penetration.
A nearly linear relation is maintained between deflection of the tool in the normal direction and machining force when the average values measured are taken into consideration, even for unstable conditions (Figure 9). This is owing to the low structural damping of the system. For stable cuts, static deflection has greater importance as it is one of the factors associated with dimensional errors.
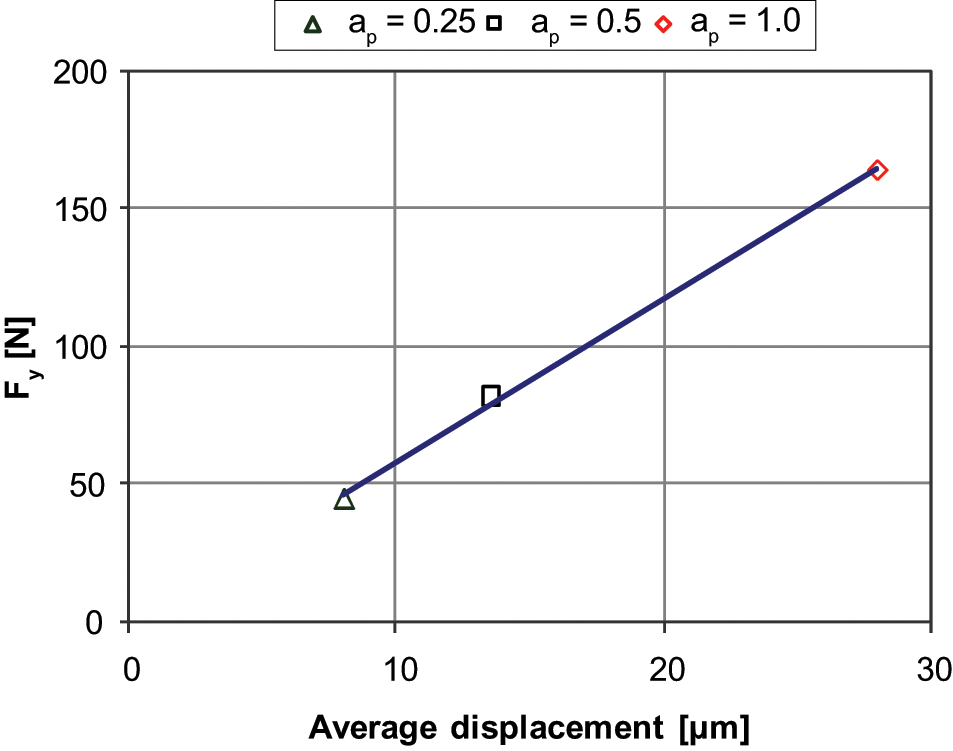
Average displacements in function of the force in the normal direction.
Conclusions
The simultaneous use of different types of sensors (displacement probe, microphone and force dynamometer) provided complementary information to the analysis of chatter in high-speed milling. It was found that, for unstable cuts, the tool shaft motions are elliptical and chatter frequency dominates the displacement, sound pressure and force spectra. However, in addition to the chatter frequency and its harmonics, other frequencies associated to the second mode and the natural frequency of the force dynamometer were visible in the sound pressure and force spectra. This indicates that other vibration modes of the system can resonate with the harmonics of the chatter frequency. The chatter frequencies presented a relatively high dispersion. The highest chatter frequency occurred at a spindle speed, which also allowed the highest critical depth of cut. The lowest chatter frequency occurred at a condition where the number of waves between consecutive teeth was less than one. The new method proposed to estimate the chip thickness variation during the process allowed the observation of the transition from stable cutting to cutting with chatter. It was also possible to verify the phase differences between undulations left by subsequent teeth and their consequences in the machining forces. The estimated chip thickness variation was in agreement with the measured machining resulting force. The results also showed that a nearly linear relation is maintained between deflection of the tool in the normal direction and machining force when the average values measured are taken into consideration, even for unstable conditions.
Footnotes
Appendix
Funding
This research received no specific grant from any funding agency in the public, commercial, or not-for-profit sectors.
Conflict of interest
The Authors declare that there is no conflict of interest.