
Abstract
This research presents a method for detecting tool failures in high-speed face milling. This method detects tool failures from vibration signature maps. Tests were carried out at different tool failure levels, spindle speeds, feed rates, and workpiece mountings. Vibration signals were obtained with an accelerometer and processed using the continuous wavelet transform methodology. The vibration signature maps showed that healthy cutting tools produce a periodic insert passing frequency and its harmonics. In contrast, a damage tool generates additional nonlinear and transient frequencies at nonsynchronous frequencies. The experimental results agree with vibration signature maps obtained from a simulated cutting force model. The proposed method is effective as a tool failure detection method when transient and nonlinear behaviors are presented in face milling process. Moreover, the proposed method showed good results at different process parameters and for several types of tool failures. Finally, it is important to point out the use of accelerometers because they present several advantages against other types of sensors. Advantages such as low cost, wide bandwidth, and easy implementation are important characteristics for tool condition monitoring in high-speed machining.
Keywords
Introduction
High-speed machining (HSM) is a metal cutting process that increases productivity and surface quality due to the high cutting speeds. High-speed cutting operations are widely used in the manufacturing of aluminum structural components in aircraft and automotive industries. Aluminum is generally machined without cooling fluids or lubrication. Under this condition, friction, between the tool and the workpiece, and temperature are increased; thus, aluminum plasticizes and adheres to the cutting tool. Consequently, there is a significant reduction of the tool life.1–3 Therefore, a highlight in HSM is the cutting tool condition. Studies conclude that wear and breakage are the main modes of tool wear in HSM. 4 When these conditions occur and they are not detected during the machining process, it affects production performance because it will have negative effects on the workpiece quality and the production costs. To avoid these problems, automatic systems replace the tools after a programmed operation time. Such systems are based on tool life equations as function of cutting conditions. However, these methodologies are not very reliable, and they are only used in high volume production processes and generate extra-cost if the tools are still useful or have not been severely damaged. Consequently, HSM requires tool condition monitoring (TCM) systems in order to detect abnormal situations to avoid damages and negative effects on the workpiece quality. Many condition monitoring strategies have been reported in a large number of research projects for conventional machining.5–14 As far as the literature search, there is little tool monitoring research for HSM. Strategies reported for HSM are based on measuring physical variables related to the cutting tool conditions, such as cutting force, vibration, and feed and spindle motor currents. Signals of these last variables were analyzed and compared, on the time domain, through statistical methods and on the frequency domain with the fast Fourier transform (FFT). The current signals were obtained through monitoring output servo drivers. 15 Consequently, this limits the system implementation for only those machine tools where the drivers have a commercial current monitoring output. Moreover, this method is limited by the available sensor bandwidth.
Cutting force measurements have been used to detect cutting tools failures for high-speed milling.16–20 This monitoring strategy has been done due to the close relation of the force with the interaction of the tool and workpiece during the cutting process. Cutting force is measured by dynamometers mounted between the workpiece and machining table. This makes difficult their place on the machine tool and limits the maximum workpiece size, making this course of action impractical for industries and investigation into other sensors. Furthermore, the Kistler platform dynamometers that were employed are expensive. Vibration signal monitoring is an alternative technique for predicting tool conditions. This technique detects vibrations produced by the cutting forces. Those vibrations supply enough information regarding the tool’s condition. When a tool fails, the characteristics of the vibration signal change, it makes possible to detect the tool failure. Moreover, vibration signals have a periodic shape that resembles the cutting force; these vibration signals satisfy the conditions of robustness, reliability, and applicability. The implementation of a vibration system is simple and inexpensive, and it does not require tool’s modifications. Tool failures in conventional21–23 and high-speed18,19,24 end milling have been studied using vibration signal analysis. All these studies are based on the FFT; however, the effectiveness of signal spectral analysis in failure detection and diagnosis is limited. It is due to the complexity of the metal cutting process, especially for the interrupted milling process with impact phenomenon. In this case, the dynamic signals are nonlinear and nonstationary, 25 and the basis of the FFT cannot identify transient and nonlinear signals, since they present harmonic distortion or intermodulation distortion. 26 Therefore, the most appropriate methods to process such machining signals are time–frequency analysis techniques. Time–frequency analysis permits the analysis of the changing spectral composition of a nonstationary signal. The difficulty lies on the selection of the most appropriate time–frequency method and its parameters. Up to now, there are different opinions regarding the best method for the analysis of nonlinear vibrations. Among these techniques, the short-time Fourier transform (STFT) is a Fourier transform adapted to analyze small sections of the signal at a time. This method applies the Fourier transform to many short-time windows. This technique provides information about time and frequency; however, this information obtained by the STFT has limited resolution because the window size is fixed. This is the main disadvantage of the STFT. Therefore, its application is limited for the analysis of nonstationary signals. 25 The drawback of STFT is overcome by the continuous wavelet transform (CWT) that uses a mother function with flexible size. The main advantage of the CWT is its excellent performance with good time resolution at high frequencies and good frequency resolution at low frequencies. Of the existing continuous mother wavelets, the Morlet wavelet is the best to extract nonlinear characteristics of mechanical systems. 27
The CWT has been used effectively to detect failures in mechanical systems.28,29 To the author’s knowledge, only one research project has discussed the application of this technique to tool failure monitoring. 30 The detection is based on the mean frequency analysis of the scalogram. In this article, the authors applied the CWT only to detect the end mill breakage. Furthermore, this detection was implemented on a conventional machining. The results of the tool failure are difficult to identify, and the method requires additional signal processing.
The objective of this article is to present an efficient method to detect tool failures in high-speed milling machining. The method is based on identifying the nonlinear and transient responses of a vibration signal through the analysis of time–frequency maps. The method is based on the fact that when a tool fails, its vibration signal deploys nonlinear and transient responses. It was found that the CWT is the best technique for identifying tool failures, especially with the application of the mother Morlet wavelet. 27
The method is validated with a simulated signal, and afterward, it is applied to experimental measurements. The vibration measurements were obtained with an accelerometer mounted close to the working piece.
This article is organized as follows: The “Simulated cutting force analysis” section presents the analysis and calculation of the theoretical cutting force periods. The cutting force signal was simulated and processed to obtain a reference pattern and verify the robustness of the proposed method. The “Experimental setup” section describes the experimental setup. For this study, a series of machining tests at varying cutting and tool conditions were carried out. The tool conditions were (1) healthy inserts, (2) one insert partially worn, (3) one insert severely worn, and (4) one missing insert. The vibration signals were acquired with a biaxial accelerometer that was aligned to the x and y machining center axes. The “Analysis of sensorial information and results” section presents the analysis of the results. In this section, the time–frequency maps were obtained with the CWT. Tool failures were detected with these maps, and the experimental results were compared to the simulated signals. Previous to this time–frequency analysis, the periods of the acquired vibration signals were analyzed and compared with the periods of the theoretical cutting force in order to demonstrate that the measured vibrations are generated by the cutting force. The final conclusions are presented in the “Conclusion” section.
Simulated cutting force analysis
This article begins with the analysis and calculation of the theoretical cutting force periods at two spindle speeds. These periods are calculated to validate the relationship between the theoretical cutting force and the experimental measurements.
Additionally, the robustness of the method is evaluated with a simulated cutting force signal. With this signal, a reference pattern is obtained and the robustness of the proposed method is verified.
Period analysis of the theoretical cutting force
In a downward milling process, the tool rotates in the direction of the feed. The cutting force is maximum at the beginning and gradually decreases to zero (Figure 1). The chip thickness fluctuates following a similar pattern as the cutting force.
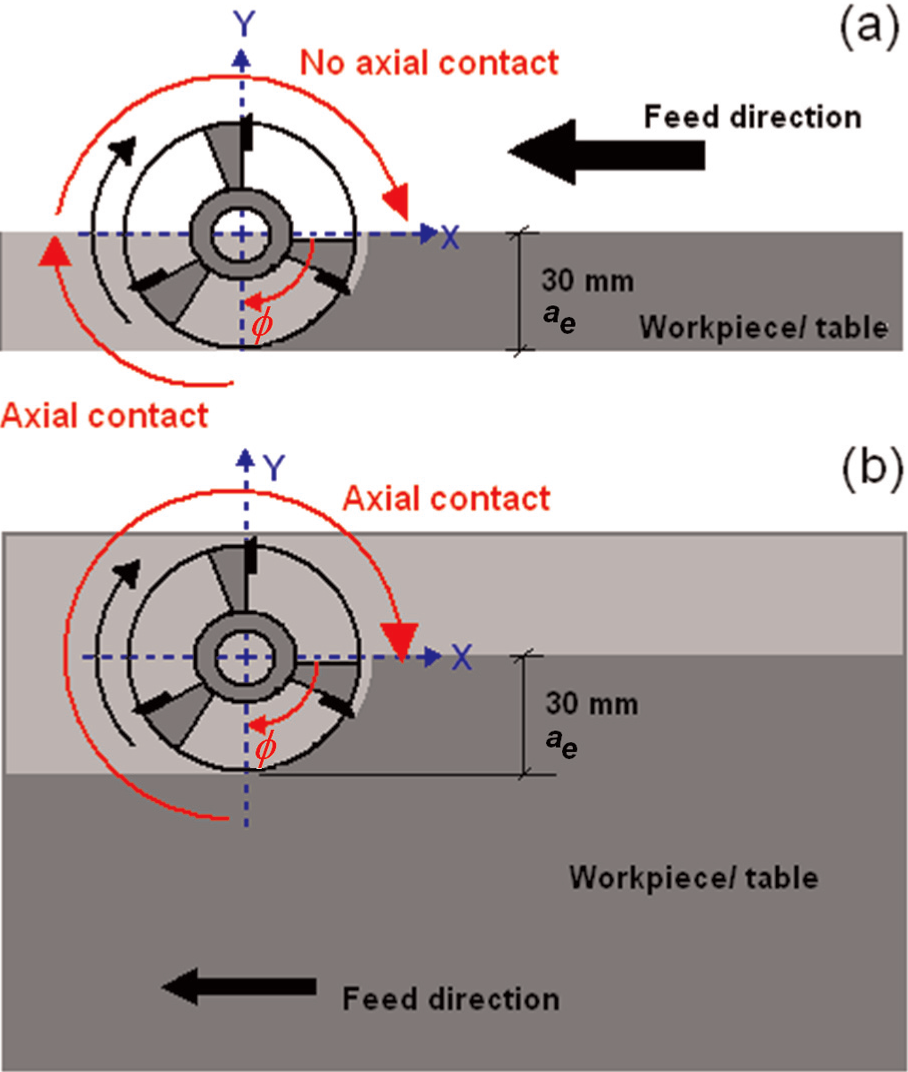
Top view of the test with (a) low axial contact of noncutting inserts and (b) high axial contact of noncutting inserts.
A cutting tool with three inserts rotating at a spindle speed (n) of 8000 r/min has a rotating period (t0) equal to

and an insert passing time (IPT)

where z is the number of inserts on the cutting tool.
According to Figure 1(a) and (b), the engagement angle (φ) per revolution can be expressed as follows

where r is the tool radius and ae is the radial depth of cut.
Combining equations (1) and (3), the engagement time (ten) between each tool insert and the workpiece is

Therefore, the total engagement time (ttotalen) between the tool and the workpiece is
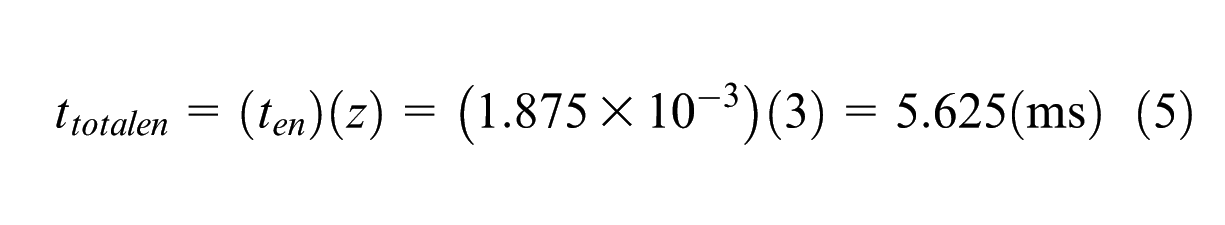
Figure 1(a) and (b) shows that in each IPT, there are an engagement time and a no-engagement time (tno-en). This no-engagement time can be determined by

Considering the period analysis of a cutting tool with three inserts and a spindle speed of 7000 r/min, the following parameters are obtained: t0 = 8.57 ms, IPT = 2.85 ms, ten = 2.14 ms, and tno-en = 0.71 ms.
CWT analysis of a simulated cutting force
The simulation was based on the analytical model of milling process presented in the study by Kasashima et al. 9 The simulated signals of the cutting force are shown in Figure 2, and these signals were processed with the CWT.
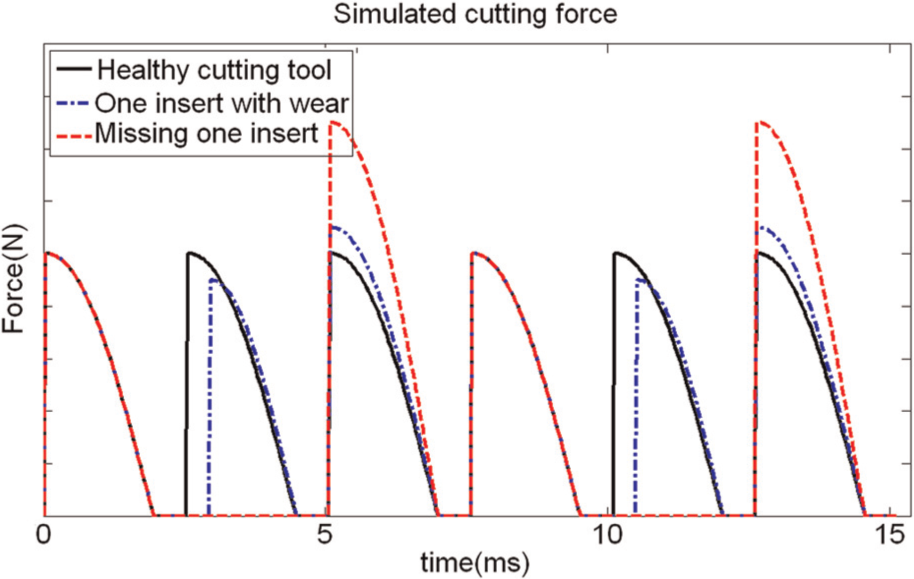
Cutting force waveforms simulated with different tool conditions and n = 8000 r/min.
The method for detecting tool failures is based on the analysis of time–frequency maps.
In this research, the tool failure detection is based on the pattern variations presented on the maps produced by a healthy tool and a damaged one, and it is not based on the differences between the maps produced by cutting tool under different failure conditions. Therefore, the method only detects when the tool is failed. Moreover, it does not indicate specifically the kind of tool failure presented.
The characteristic pattern generated by a healthy tool is the pattern of a periodic signal with a dominant frequency. In this case, the pattern is represented by the insert passing frequency (IPF) as the dominant frequency and its harmonics.
The time–frequency map of the simulated cutting force is shown in Figure 3(a). The simulated signal corresponds to a healthy cutting tool with three inserts rotating at 8000 r/min. The dominant peak occurs at 400 Hz (IPF), and it shows the first and second harmonics (800 and 1200 Hz). Figure 3(b) shows a zoom up of the time–frequency map, the zooming interval is limited to two revolutions, and it can be seen that the dominant frequency varies with time at similar periods as the calculated values (equation (2)).
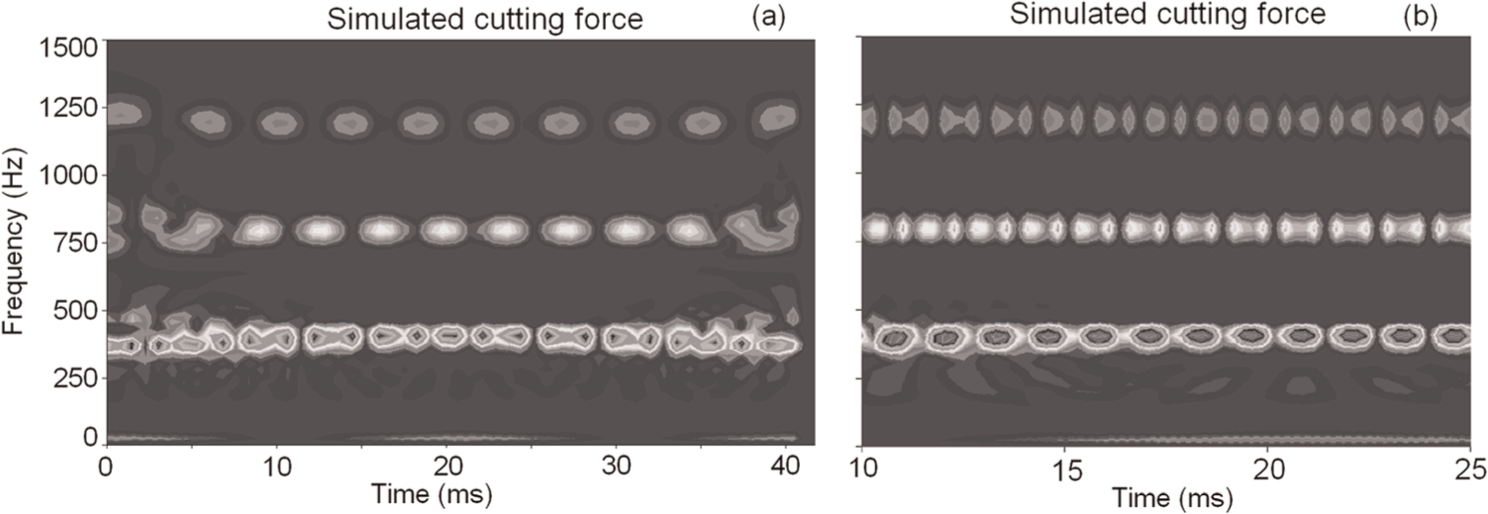
CWT time–frequency map of the cutting force simulated with the healthy cutting tool and n = 8000 r/min (a) for 40 ms and (b) zoomed in two spindle revolutions.
Figure 4(a) and (b) shows the CWT time–frequency maps of the signal simulated at a spindle speed of 8000 r/min, and with one worn insert and one insert missing, respectively. These maps reveal the presence of transient components, nonsynchronous frequencies, and the IPF and its harmonics. Comparing the aforementioned maps with that of Figure 3(a), it can be noted that pattern variations are presented between the maps produced by a damaged tool and a healthy one. These variations are other different dominant peak frequencies that appear besides the IPF and its harmonics. Furthermore, these maps give a clear identification of transient frequencies.
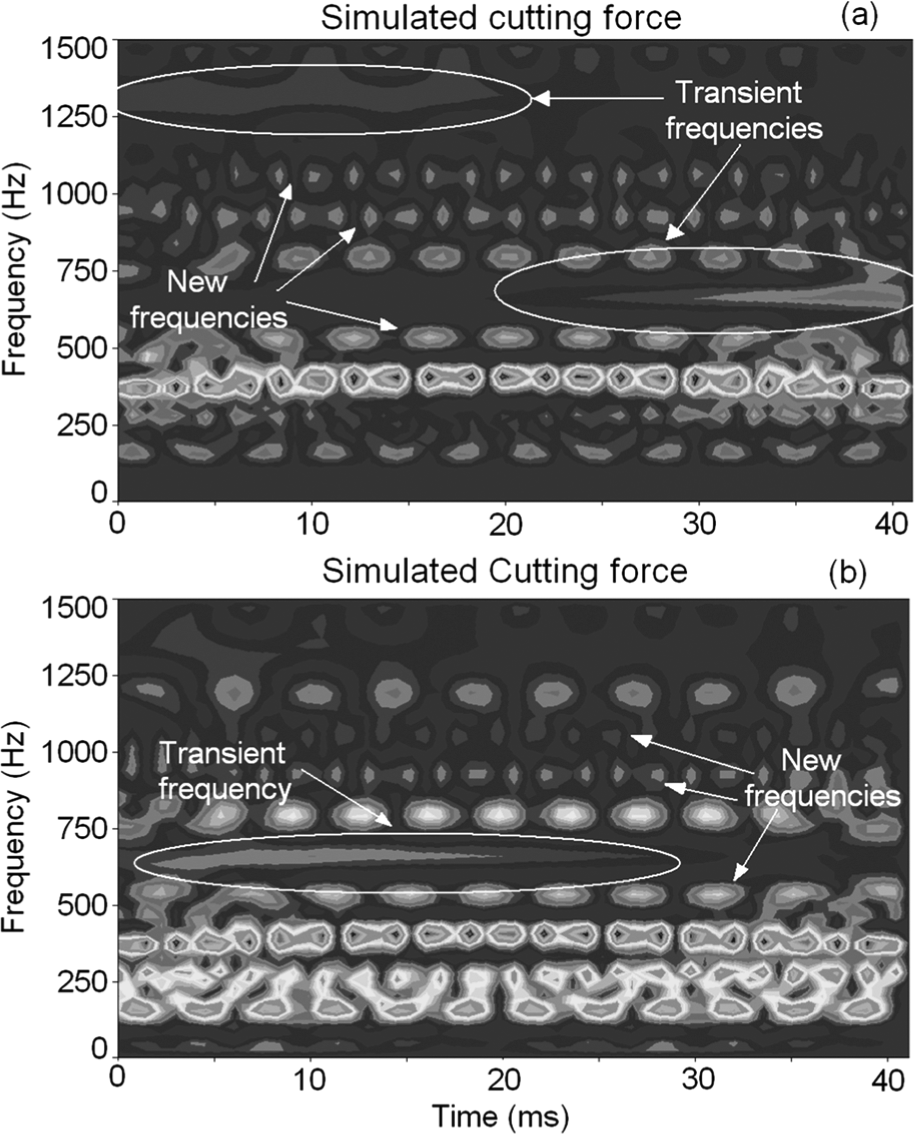
CWT time–frequency maps of the cutting force simulated at n = 8000 r/min and with (a) one worn insert and (b) one insert missing.
Experimental setup
Machining tests were carried out on a DM 4326 numerical controlled three-axis vertical machining center. The workpiece material throughout the experiment was aluminum alloy 6061-T6 possessing a Brinell hardness of 95 HBN, an ultimate tensile strength of 310 MPa, and tensile yield strength of 276 MPa.
Two workpiece mounting arrangements were considered for the tests: low axial contact of noncutting inserts and high axial contact of noncutting inserts (Figure 1(a) and (b), respectively). For the low axial contact tests, the experimental sample was a 300 × 30 × 150-mm rectangular block. For the high axial contact tests, the workpiece was a 300 × 150 × 70-mm rectangular block. Previous to the milling tests, the experimental samples were face-milled to remove any surface defects. The cutting tool was a carbide face mill with a 60 mm diameter and with three inserts. Tool failures were induced by grinding the inserts, and the severity of the failure was produced in two steps, as shown in Figure 5. The experimental condition of a broken insert was simulated by eliminating one insert and keeping the other two in a healthy condition.
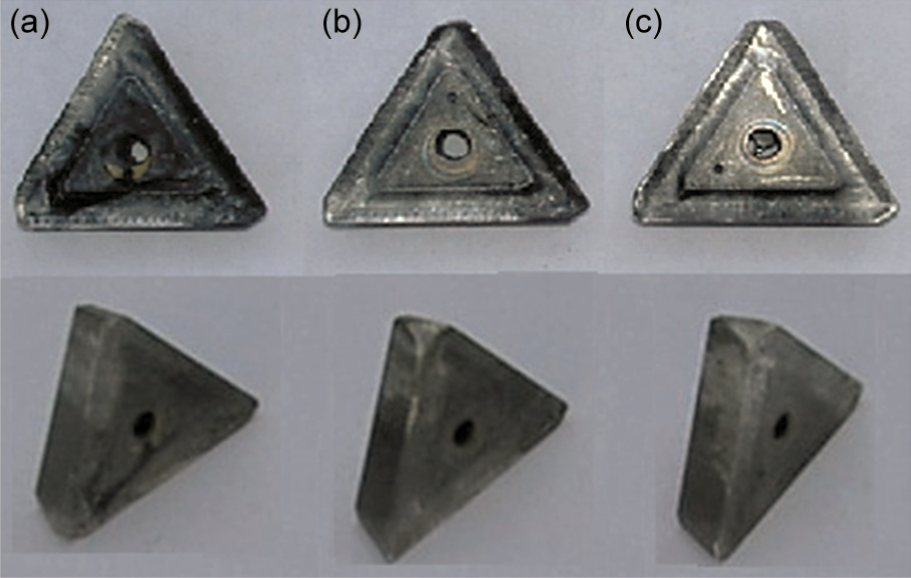
Diverse perspectives of the cutting insert conditions: (a) healthy, (b) partial wear, and (c) severe wear.
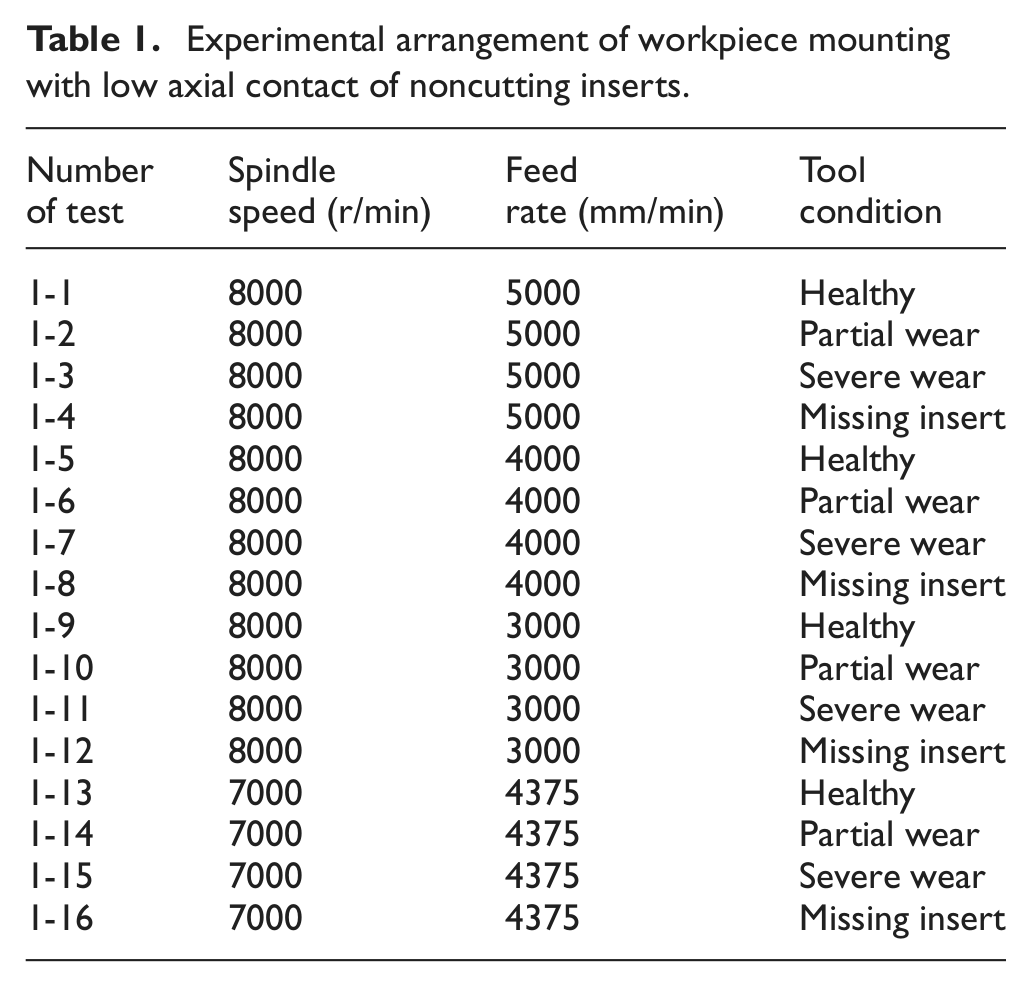
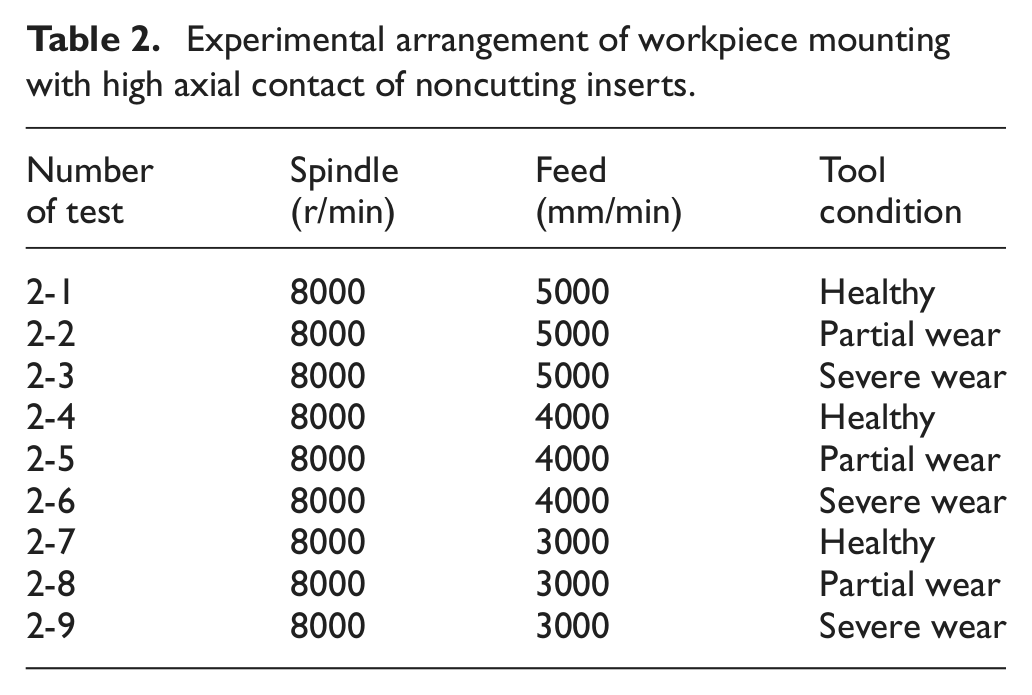
The cutting tests were carried out during a down milling process. A series of machining tests at varying cutting speeds (Vc) and feed rates (Vf) were set up to have enough data. All the experiments had an axial depth of cut (ap) of 3 mm and a radial depth of cut (ae) of 30 mm, and they were performed with dry inserts. The feed direction of the workpiece was along the positive x-axis. The experimental tests are listed in Tables 1 and 2.
Experimental arrangement of workpiece mounting with low axial contact of noncutting inserts.
Experimental arrangement of workpiece mounting with high axial contact of noncutting inserts.
The vibration signals were detected by a biaxial accelerometer sensor (ADXL321). Measurements were recorded during the cutting process in the x and y directions, and the accelerometer was fitted to the jaws (Figure 6). The x and y accelerometer directions were aligned with the machining center axes. The sensor’s bandwidth is able to measure the frequency range generated from the experimental tests. The vibration signals were acquired and recorded with an oscilloscope MSO 4104, Tektronik™. The data sampling rate was set up at 25 kHz that is at least 10 times the highest spindle frequency. The acquisitions of vibration signals were made in segments of 1024 samples. The signal of each axis was initially passed through a low-pass analog filter with a cutoff frequency of 2500 Hz and then sent to the oscilloscope. The vibration acceleration signals recorded in the oscilloscope were transferred to a computer to process them. The experimental setup is shown in Figure 6. The signal processing and the time and time–frequency analyses were carried out with MATLAB™ and AUTOSIGNAL™.
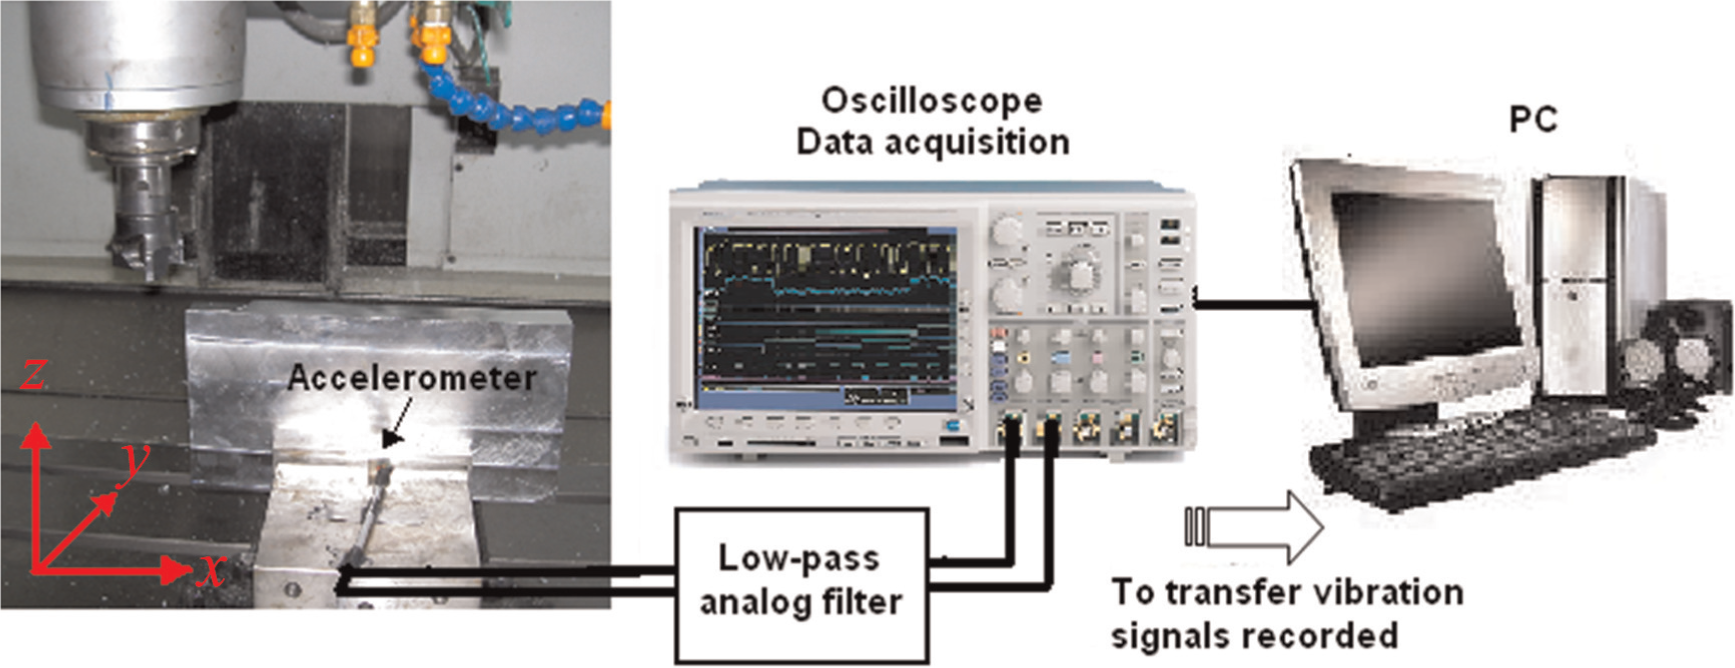
Experimental setup.
Samples of the experimental vibration waveforms are shown in Figure 7. Figure 7(a) and (c) is the waveforms from Tests 1-1 and 1-3 (Table 1), respectively. Figure 7(b) and (d) is the waveforms from Tests 2-1 and 2-3 (Table 2), respectively.
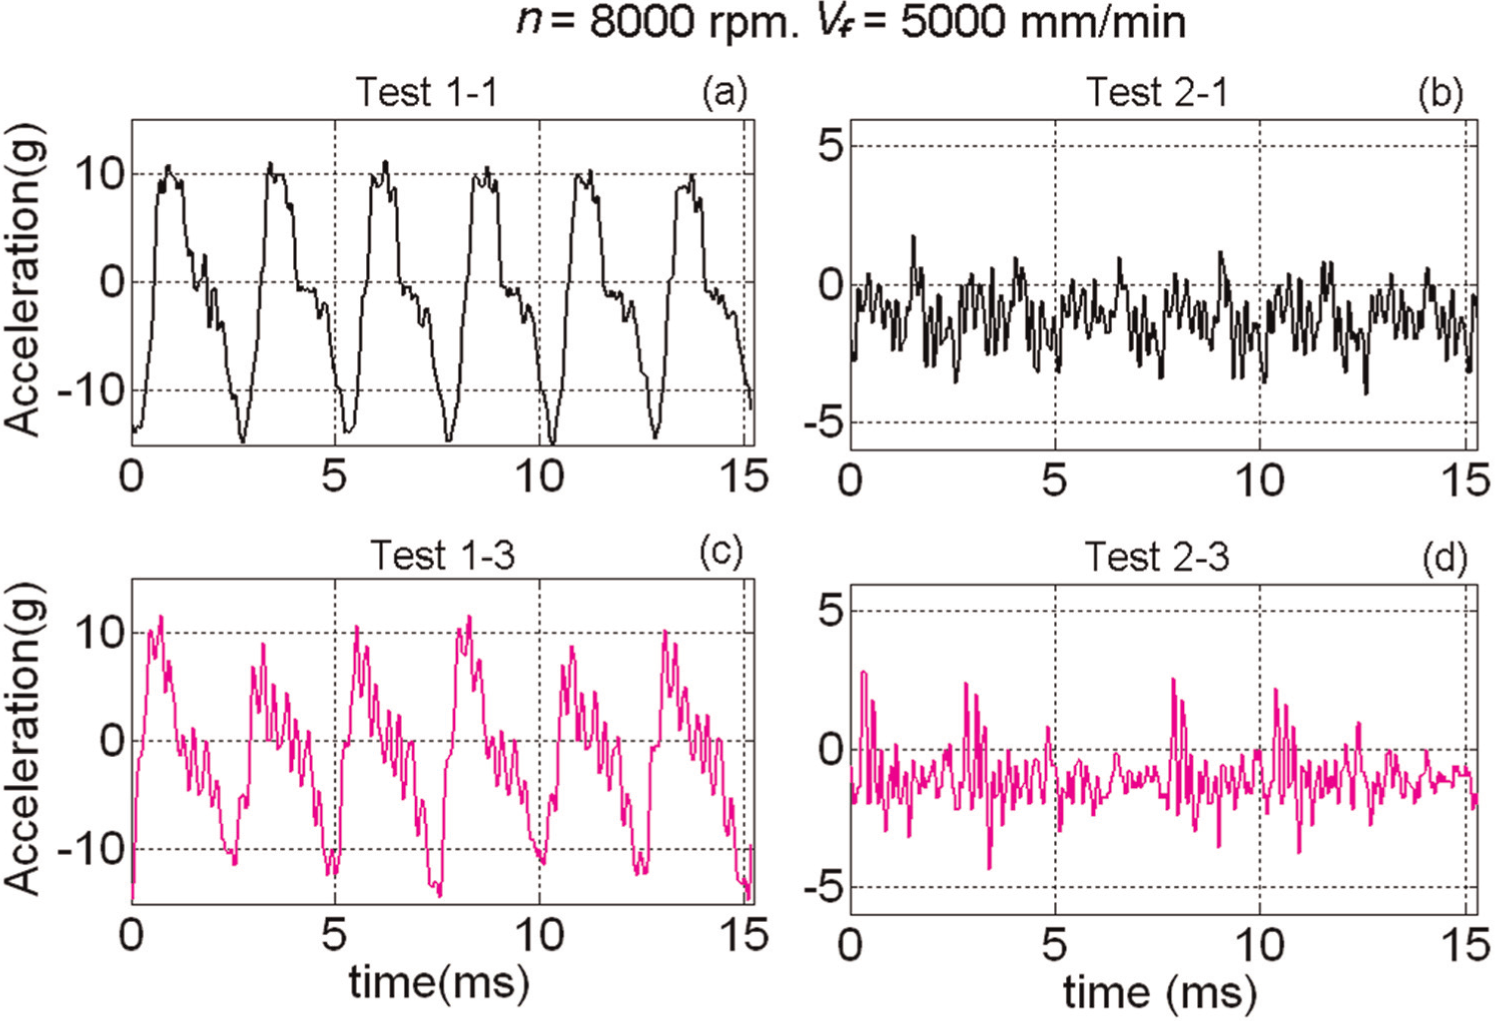
Cutting vibration signals acquired at a n = 8000 r/min, at a Vf = 5000 mm/min: (a) tool healthy and low axial contact, (b) tool healthy and high axial contact, (c) tool with severe wear and low axial contact, and (d) tool with severe wear and high axial contact.
Analysis of sensorial information and results
In this section, the analysis of the experimental data is presented. First, the vibration periods were obtained by analyzing the experimental waveforms. These periods were compared with the theoretical cutting force (see section “Simulated cutting force analysis”) to validate that the vibration measurements have the same waveform as the cutting force.
Then, time–frequency maps were obtained with the CWT method. With this analysis, it is possible to identify the transient and nonlinear effects produced by the tool failures, providing a more efficient TCM.
Periods of the experimental vibration signals
In order to make the analysis and comparison between the periods of the acquired vibration signals and the periods of the theoretical cutting force (see section “Simulated cutting force analysis”), first it was calculated as a resultant vibration signal from the measured accelerations in the x and y directions. Figure 8(a) and (b) shows the resultant vibration waveforms of the signals obtained from Tests 1-1 and 1-13 (Table 1), respectively. Comparing the theoretical cutting force periods and the experimental measurements, there is an agreement between them in all the cases. Hence, it was demonstrated that the measured vibrations are generated by the cutting force.
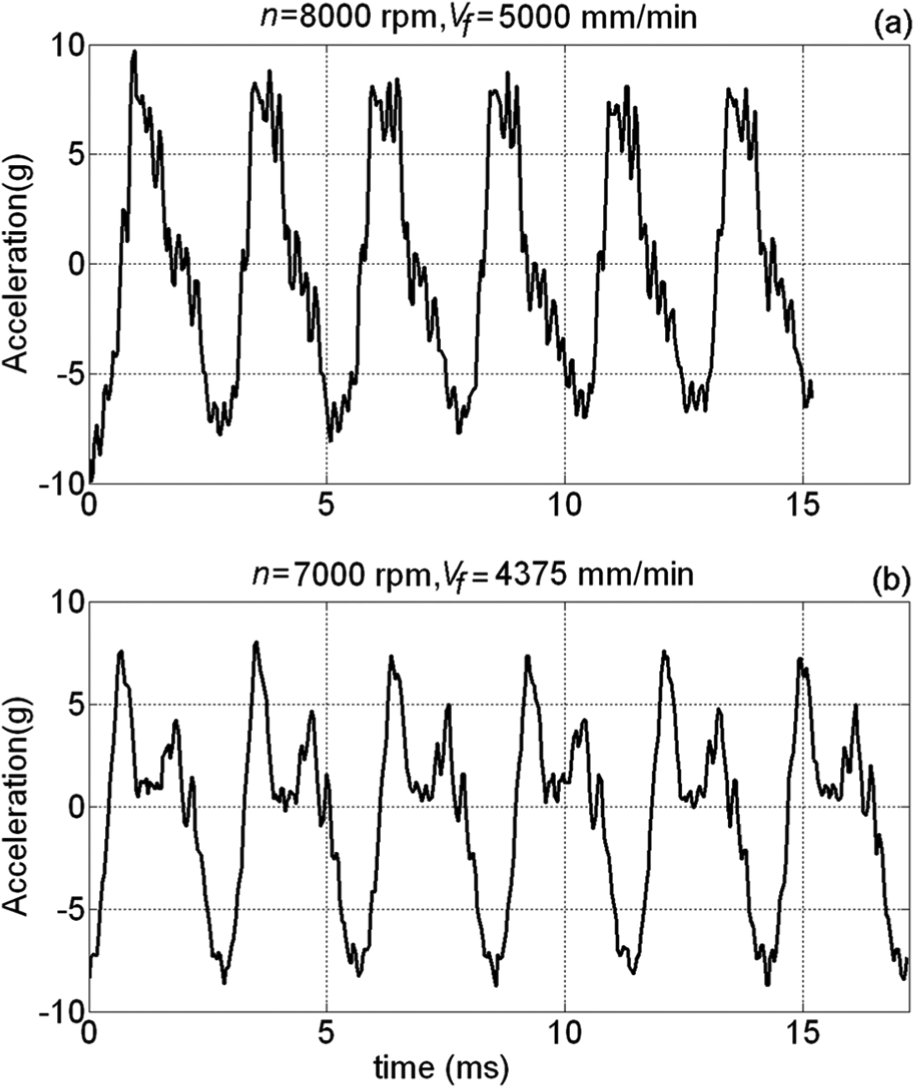
Waveforms in the time domain of the resultant vibration signals at two spindle revolutions with healthy cutting tool and low axial contact of noncutting inserts (Table 1): (a) Test 1-1 and (b) Test 1-13.
CWT analysis of vibration signals
The most significant signal was found along the feed direction (x direction). Due to this fact, the processed vibration signals were the signals acquired in this direction.
The frequency spectra for experimental signals at n = 8000 r/min, and different tool conditions are presented in Figure 9. This FFT analysis shows that the tool failure generates different frequencies from the IPF and its harmonics. However, this analysis does not permit to see the behavior of these frequencies. It limits the identification of theirs causes and their association with phenomena.
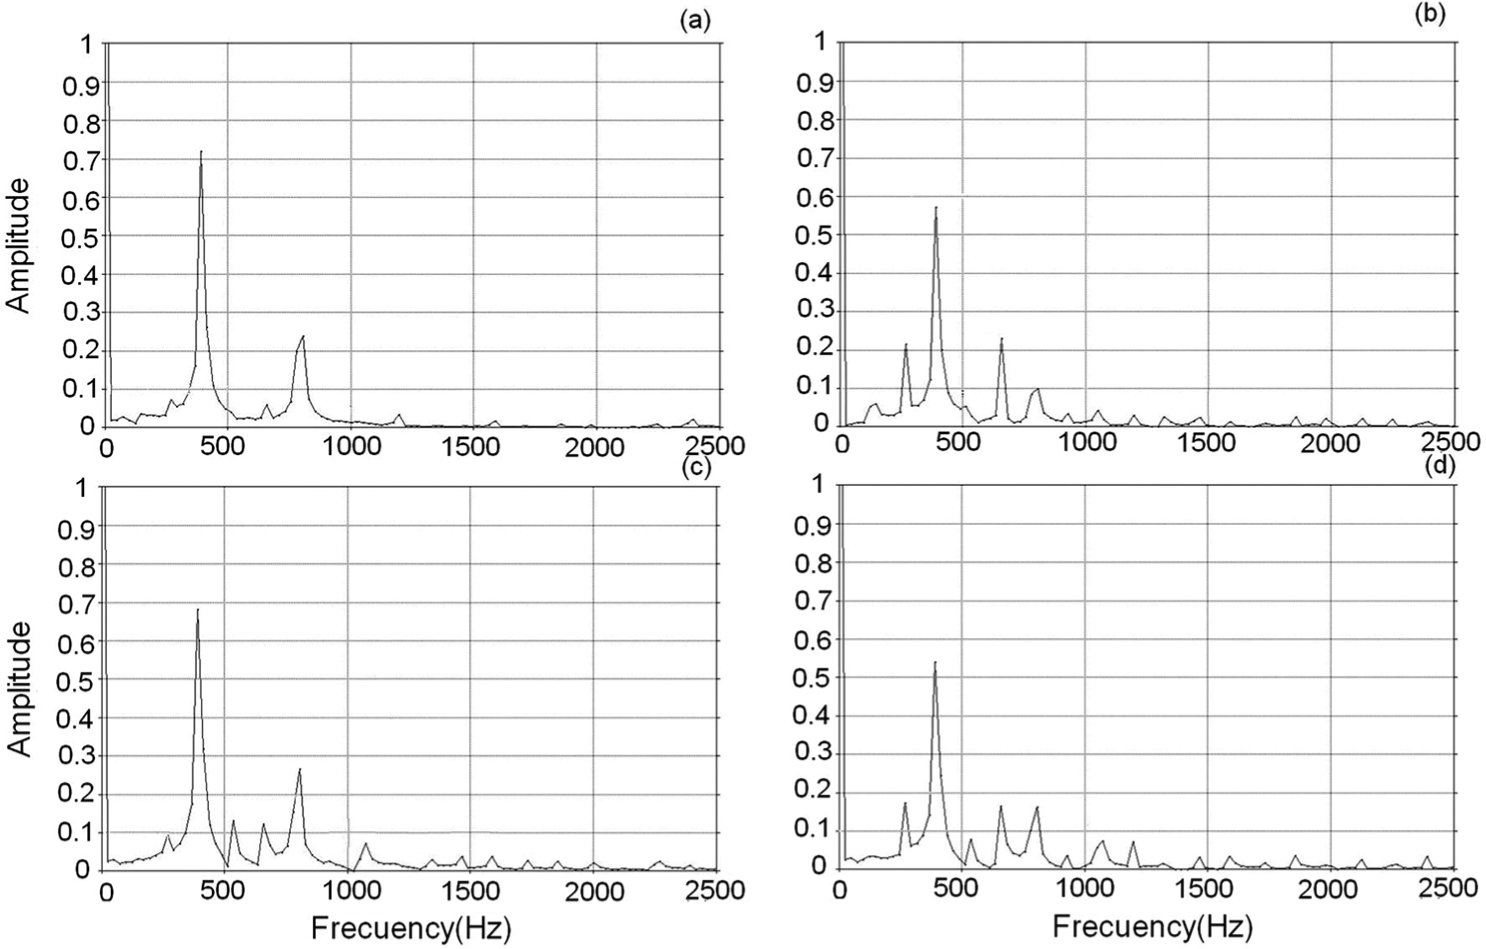
Frequency spectra for experimental signals at n = 8000 r/min and tool: (a) healthy, (b) partial wear, (c) severe wear, and (d) one insert missing.
The CWT time–frequency maps of the vibration signal from Tests 1-1 (Table 1) and 2-1 (Table 2) with a healthy cutting tool are shown in Figure 10(a) and (b), respectively. From these maps, the main peak frequencies occur at 400, 800, and 1200 Hz, which correspond to the IPF, its first and second harmonics, respectively. The maps have the same pattern as the simulated cutting force (Figure 3(a)). Because the friction was neglected in the simulation, there are small differences between the map shown in Figure 10(b) and that from Figure 3(a).
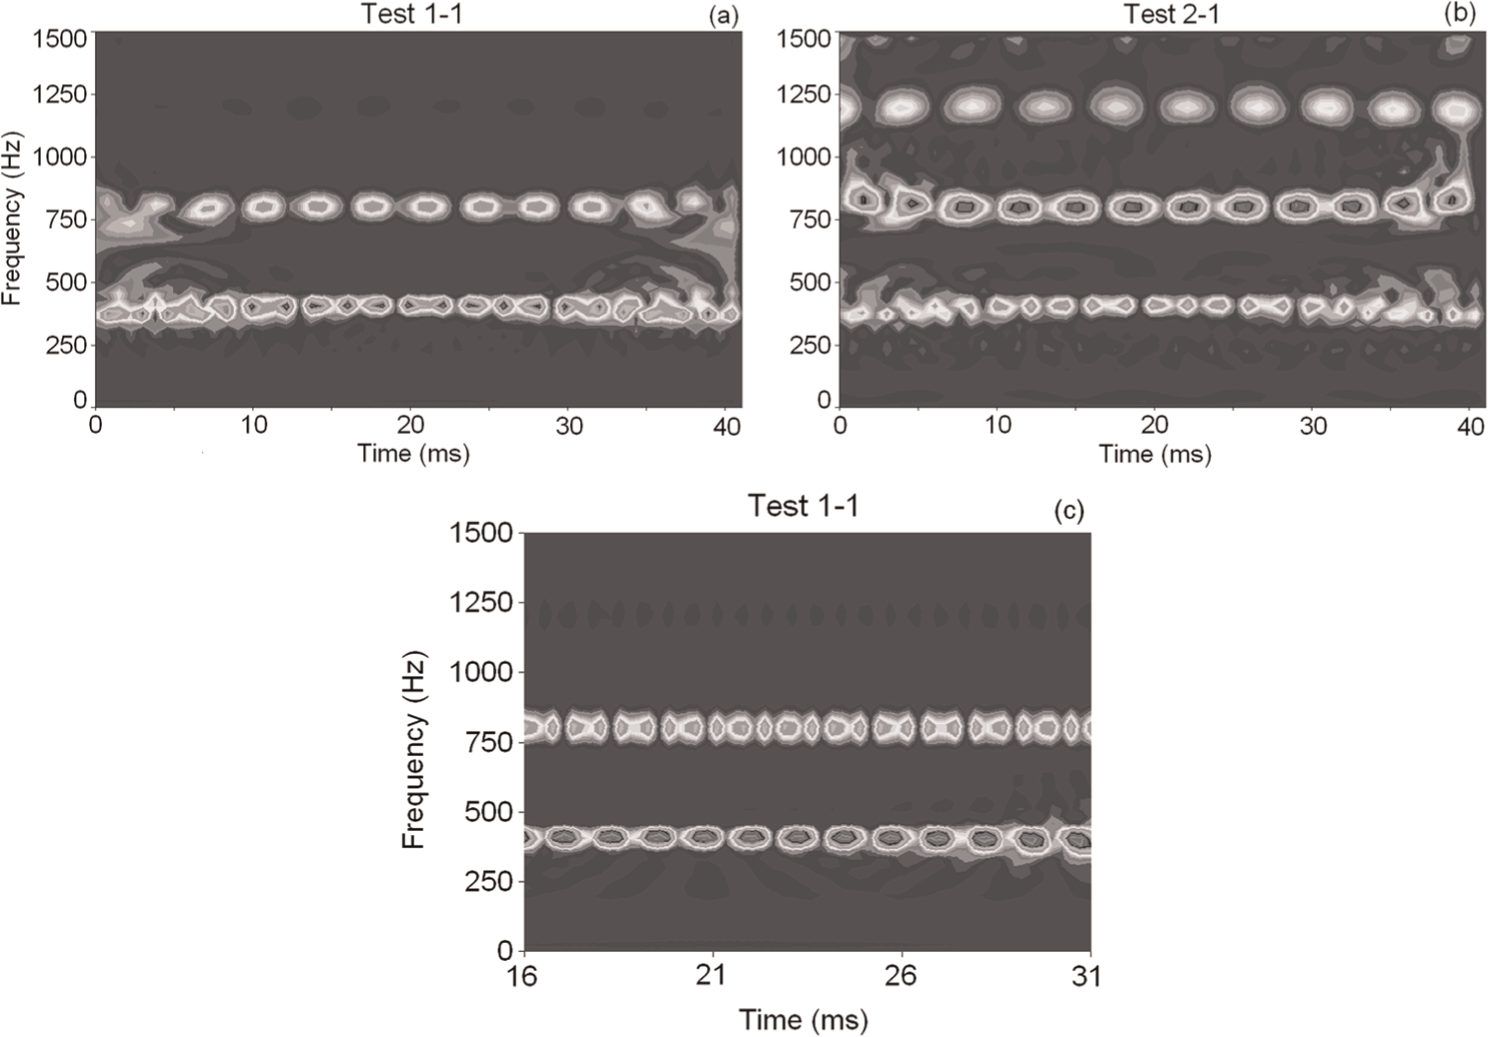
CWT time–frequency maps of vibration signals acquired with the healthy cutting tool, n = 8000 r/min, Vf = 5000 mm/min: (a) low axial contact, (b) high axial contact of noncutting inserts, and (c) CWT time–frequency maps zoomed in two spindle revolutions from (a).
The vibration sources are different in each experimental arrangement (Figure 1) carried out with a healthy tool. Considering the analysis of the arrangement of Figure 1(a), there are two vibration sources during the engagement time. One is the cutting force developed by the material removal process, and the other is the friction generated by the axial contact between one noncutting insert and the workpiece.
During the no-engagement time, the vibration signal is generated only by the friction. This friction is caused by the axial contact between the last insert and the workpiece.
Considering the analysis of the arrangement of Figure 1(b), during the engagement time, the vibration signal is generated by the cutting force developed by one insert during the material removal process, and the friction is generated by axial contact between the other two noncutting inserts and the workpiece. During the no-engagement time, the source of vibration is only friction. This friction is generated by axial contact between the three inserts and the workpiece.
As can be seen, the arrangement of Figure 1(b) presents more frictions during the machining process. However, the workpiece mounting is irrelevant for the detection of the tool failures.
Figure 10(c) shows a zoom of the map (Figure 10(a)) around a period equivalent to two spindle revolutions. This zoomed map shows a periodic behavior (see section “Period analysis of the theoretical cutting force”) similar to the map of the simulated cutting force (Figure 3(b)).
The results obtained from the vibration signal generated with the healthy cutting tool at a spindle speed of 7000 r/min (Test 1-13, Table 1) showed that the frequency components occur at 350, 700, and 1050 Hz, which correspond to the IPF and its harmonics, respectively. Therefore, the vibration responds linearly to the spindle speed.
It is important to mention that the CWT time–frequency maps of all the tests with a healthy cutting tool present the same behavior, which consists of the presence of the IPF and its harmonics.
On the other hand, Figure 11 illustrates the CWT time–frequency maps of the vibration signal generated with the cutting tool under different failure conditions. The CWT time–frequency maps of the vibration signal generated from Tests 1-2 (Table 1) and 2-2 (Table 2) using one insert with partial wear are shown in Figure 11(a) and (b), respectively. Clearly, these maps demonstrate that the vibration signatures are different from those obtained with the healthy cutting tool (see Figure 10). The difference is the presence of transient frequencies, and dominant peaks at different frequencies from the IPF and its harmonics. These results agree with those obtained from the simulated cutting force (see Figure 4(a)), which shows a nonstationary and nonlinear response.
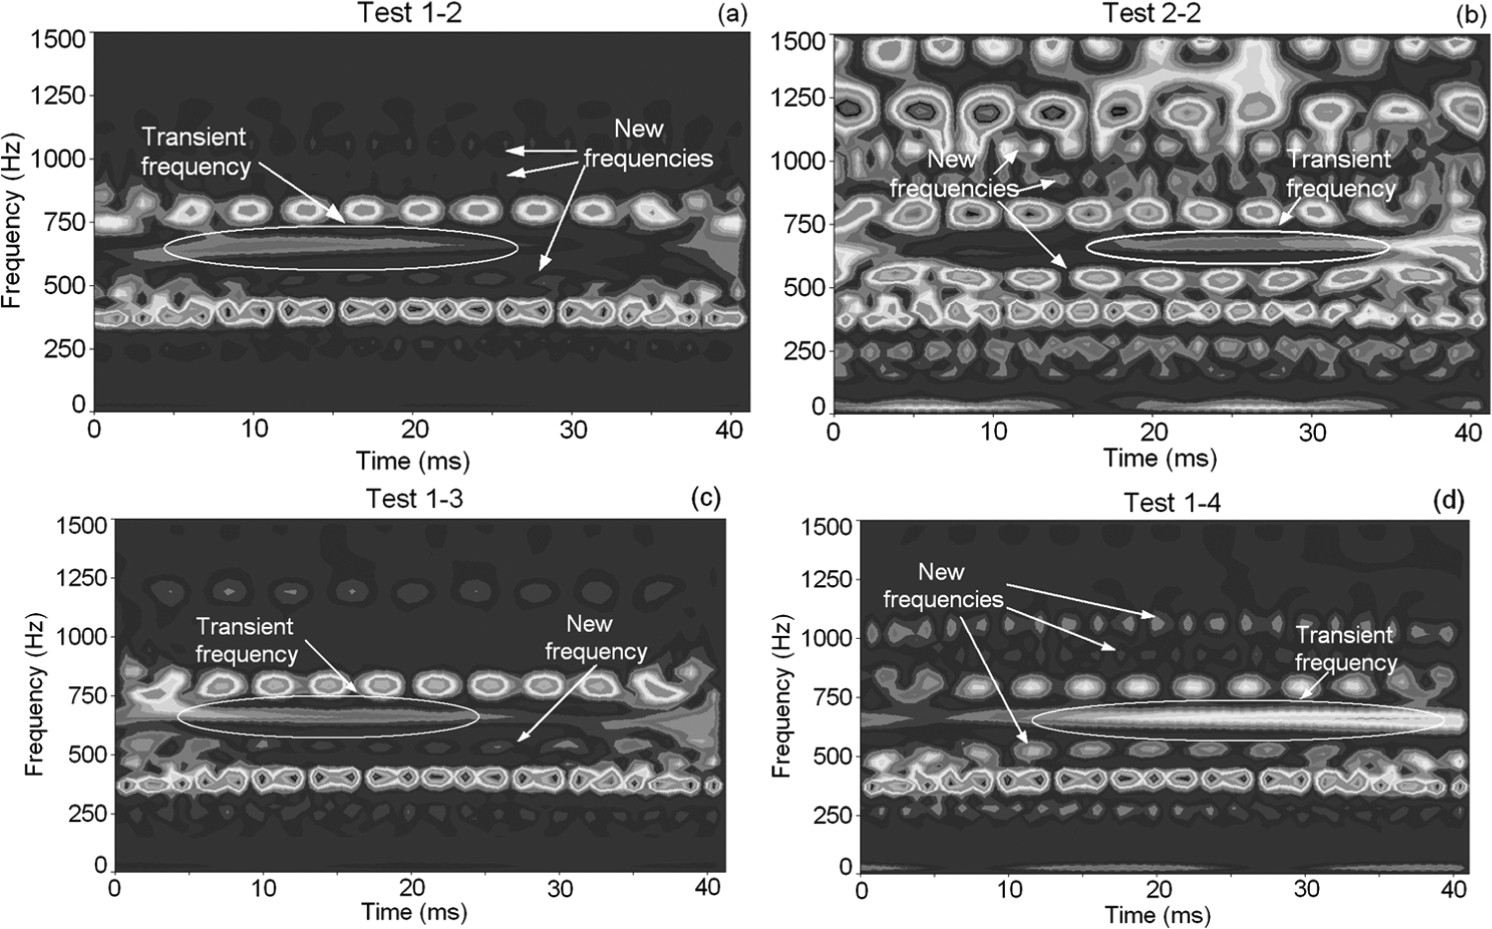
CWT time–frequency maps of vibration signals acquired at n = 8000 r/min, Vf = 5000 mm/min: (a) partial wear cutting tool and low axial contact, (b) partial wear cutting tool and high axial contact of noncutting inserts, (c) severe wear cutting tool and low axial contact of noncutting inserts, and (d) one insert missing and low axial contact of noncutting inserts.
The CWT time–frequency map of the vibration signal using one insert with severe wear (Test 1-3, Table 1) is shown in Figure 11(c). The CWT time–frequency map of the vibration signal generated using the tool with one insert missing (Test 1-4, Table 1) is shown in Figure 11(d). All the maps with a tool failure reveal the presence of transient components, nonsynchronous frequencies, and the IPF and its harmonics. Comparing the map of the experimental test with a tool failure (see Figure 11(d)) and the map of the simulated cutting force (see Figure 4(b)), it can be seen that they show a similar pattern.
The presence of other nonsynchronous frequencies is reported by Haber et al. 18 and Yesilyurt. 30 However, the appearance of those dominant frequencies has not been considered for the detection of tool failures. In those articles, these frequencies are attributed to the cutter run-out and to chip-thickness variation. Nevertheless, the results presented herein show that these dominant frequencies are only present with a damaged tool. Therefore, the presence of tool failure generates nonstationary signals and nonlinear effects that can be easily identified by means of a time–frequency analysis. It is important to mention that the different spindle speeds, feed rates, and workpiece mountings do not interfere with the detection.
Conclusions
In all the tests carried out in this article, the simulated and experimental results showed a correct detection of the tool condition. It demonstrates that the CWT is an efficient signal processing method to detect several types of tool failures in high-speed milling. This is due to the fact that the CWT can provide vibration signature maps where transient and nonlinear effects produced by tool failure are easily identified. The tool failure detection is based on the pattern variations presented on the maps produced by a healthy tool and a damaged one. For a healthy tool, all the CWT maps present a characteristic pattern represented by the IPF as the dominant frequency and its harmonics. In contrast, maps of damaged tool present other different dominant peak frequencies besides the IPF and its harmonics. Furthermore, these maps give a clear identification of transient frequencies.
These results showed the same behavior as the results obtained from a simulated cutting force model. This agreement validates the robustness of the method.
Moreover, it is noteworthy that the different spindle speeds and feed rates do not generate significant changes on the vibration patterns.
On the other hand, the results of this article confirm that the vibration is a variable that supplies significant information about the tool condition. This is due to the fact that vibrations are generated during the cutting process, and they are very close related to the cutting force that is a variable widely used for TCM. The relation between both variables was validated by the period analysis that shows a correspondence between the theoretical cutting force periods and the experimental results. The use of vibration signals presents different advantages for TCM in high-speed process, such as robustness, reliability, and a quick response time that is needed to indicate changes for online (real-time) monitoring. Furthermore, the low cost, wide bandwidth, small size, and high sensitivity of the accelerometers permit an easy and nonlimited implementation of the sensor. Moreover, the sensor implementation does not require modifications to the machine tool and does not interfere with the cutting process. Finally, the results of this article demonstrate that the proposed methodology is efficient for detecting tool failures at different process parameters and for several types of tool failures presented during high-speed face milling.
Footnotes
Funding
The authors would like to gratefully acknowledge the Mexican Government Foundation CONACYT for the financial support for this research.