
Abstract
This article presents an approach related to the dissimilar friction stir welding of AA6082 and AA7075. The effects of tool type, tool rotational speed and welding speed on the ultimate tensile strength (UTS) and percentage of elongation were investigated using grey relational analysis and then the optimal combination was determined. The results of a series of analyses revealed that the tool type 4, a tool rotational speed of 1000 rpm/min and a welding speed of 100 mm/min correspond to the optimal condition. Except for tool rotational speed, the other factors are significant at 95% and affect the grey relational grade value with a percentage contribution sorted in descending order as welding speed (48.7%), tool type (27.48%) and tool rotational speed (15.13%). A confirmation experiment was carried out to verify the optimised parameters. The result indicated that an improvement was achieved in ultimate tensile strength and percentage of elongation.
Introduction
The engineering importance of aluminum alloys is their high mechanical strength, high strength-to-weight ratio, low weight, high resistance to corrosion, excellent electrical and thermal conductivity, good formability and high fatigue resistance. 1 These superior properties provide a wide variety of usage areas in the automotive, aerospace, aircraft, marine and rail industries. The potential materials for these industries are the 2XXX, 6XXX and 7XXX series aluminum alloys. The AA6082 aluminum alloy is a high-strength Al–Mg–Si alloy 2 used in marine industries due to high corrosion resistance. This alloy has good weldability, but the strength of the weld zone is low. The commercial AA7075 alloy is one of the most important aluminum alloys, and it is extensively used in the automotive and aerospace industries due to its high strength.3,4 This alloy is considered as unweldable or difficult to join by fusion welding techniques3,5,6 due to poor solidification microstructure, porosity 3 and the dendritic structure formed 6 in the fusion zone. Coalescence in fusion welding is achieved by the melting of the two plates to be joined and using a filler metal, shielding gas and flux. 7 The use of a filler metal and performing the welding process at melting temperatures causes some defects such as cracks, porosities, voids and segregations. 8 These deteriorate the structure of the joint. However, solid-state welding processes are carried out at below the melting temperature of the metals and without a filler metal or shielding gas being used.7,9 Friction stir welding (FSW) is one of the solid-state welding techniques 7 performed using a specially shaped tool 5 and applying force. Coalescence is achieved by the frictional heat caused by a rotating tool and the displacement of materials at the abutting region along the weld line. FSW is considered as an alternative welding technique to fusion welding in order to achieve coalescence, improved mechanical strength and reduced welding defects. Because there is no melting of the base metal during the FSW process, the above-mentioned defects do not occur in the fusion zone.
Many studies have used the FSW technique since its introduction in 1991. In particular, researchers have investigated the joining of different metals using the FSW technique. Aissani et al. 5 performed a study on AA7075 and AA2024 by using a triflute-type pin with a conical threaded geometry. The weld quality was evaluated by means of a microstructure analysis and microhardness measurements. Results confirmed that a triflute-type pin tool with a conical threaded geometry produces a good weld. The mechanical and metallurgical characterisations of FSW butt joints of aluminum alloy 6061-T6 with 6082-T6 were carried out by Moreira et al. 10 The results showed that the FSW dissimilar joint had intermediate mechanical properties when compared with each base material. The failures occurred near the weld edge line, where a minimum value of hardness is observed. For the hardness profile, the lowest values were obtained in the AA6082-T6 alloy plate side, where rupture occurred, and in the nugget, all types of joints present similar values. Khodir and Shibayanagi 11 carried out a study to investigate the effects of welding speed (WS) and fixed location of material on microstructure, hardness distribution and tensile properties produced by FSW for dissimilar joints of 2024-T3 to 7075-T6 Al alloy. They found that a rise in WS tended to produce the formation of a kissing bond and pores, especially when the 2024 Al alloy plate was located on the retreating side. The minimum hardness value was observed in the heat-affected zone (HAZ) on both sides, and the values increased with WS. Scialpi et al. 12 analyzed the mechanical properties of FSW joints of AA2024-T3 alloy with AA6082-T6 alloy. The results for microhardness showed that a sharp drop was achieved moving from the AA2024 side to the AA6082 side. The mechanical strength of dissimilar joints in the transverse direction is very close to that of AA6082 alloy joints under both welding conditions. The mechanical properties of dissimilar joints are significantly improved in the longitudinal direction with respect to the transverse direction.
This article presents an approach related to the dissimilar FSW of AA6082 and AA7075. The effects of tool type (T), tool rotational speed (TRS) and welding speed (WS) on the ultimate tensile strength (UTS) and percentage of elongation (ε) were investigated using the grey relational analysis (GRA) method, and the optimal parameter combination was determined.
Experimental studies
Material
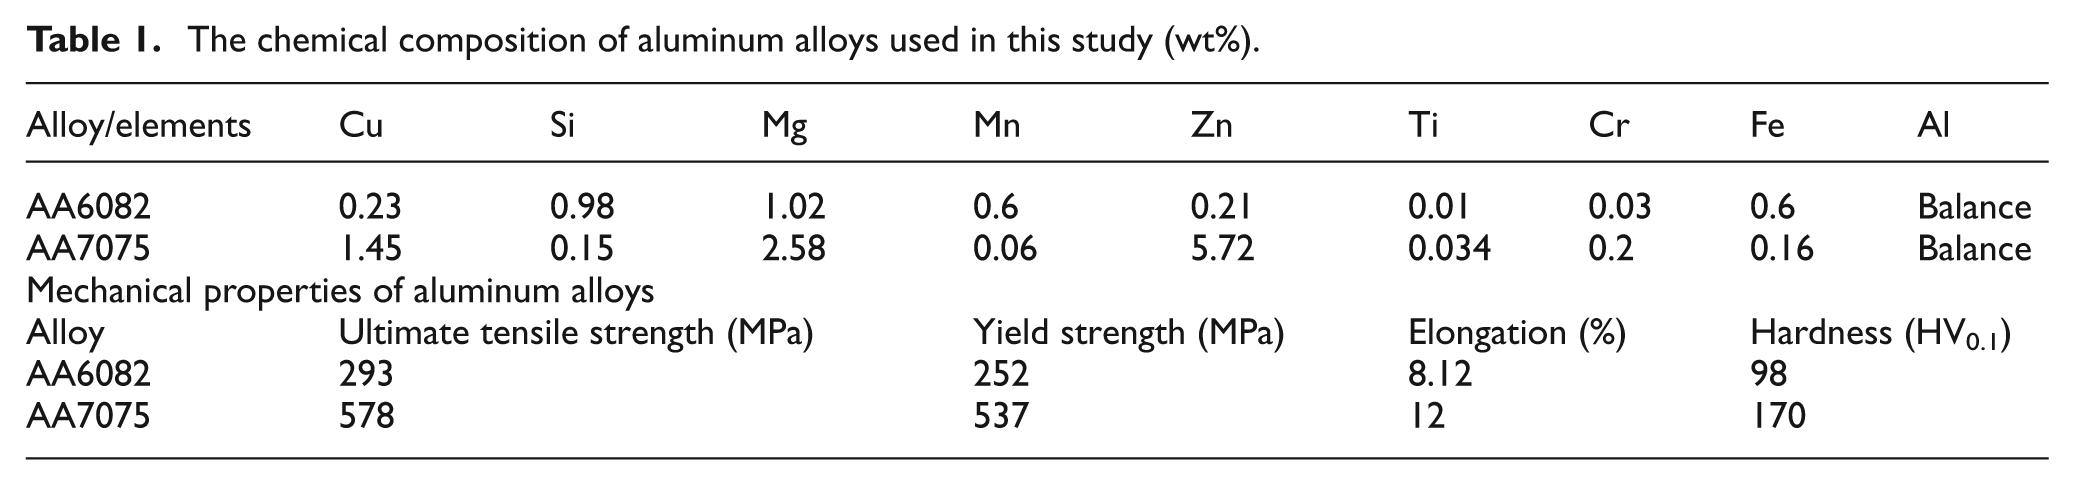
The materials used in this study were 5 mm thick AA6082-T6 and AA7075-T651 aluminum alloys. The chemical and mechanical properties of these materials are given in Table 1. The plates were cut into the size of 100 mm × 150 mm.
The chemical composition of aluminum alloys used in this study (wt%).
Friction stir experiments
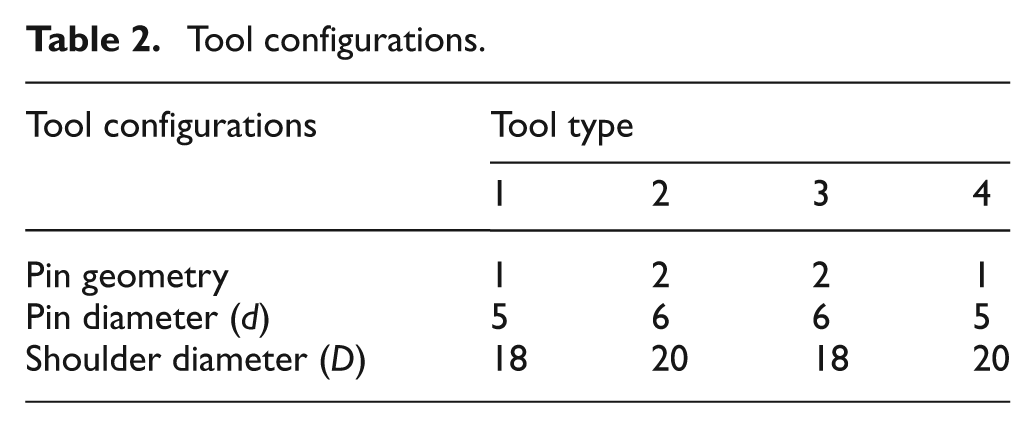
The dissimilar butt welding experiments were performed using a milling machine. Initially, the plates were placed on a backing plate and clamped with studs and bolts, as shown in Figure 1. Four types of nonconsumable tools were used in the experiments, and each one was fabricated from H13 hot work tool steel. The configuration of each tool is given in Table 2. The geometrical configuration of the tool is that the straight shoulders have diameters of 18 and 20 mm, the cylindrical threaded pin has diameters of 5 and 6 mm and a length of 4.8 mm. Figure 2 shows the tool geometries.
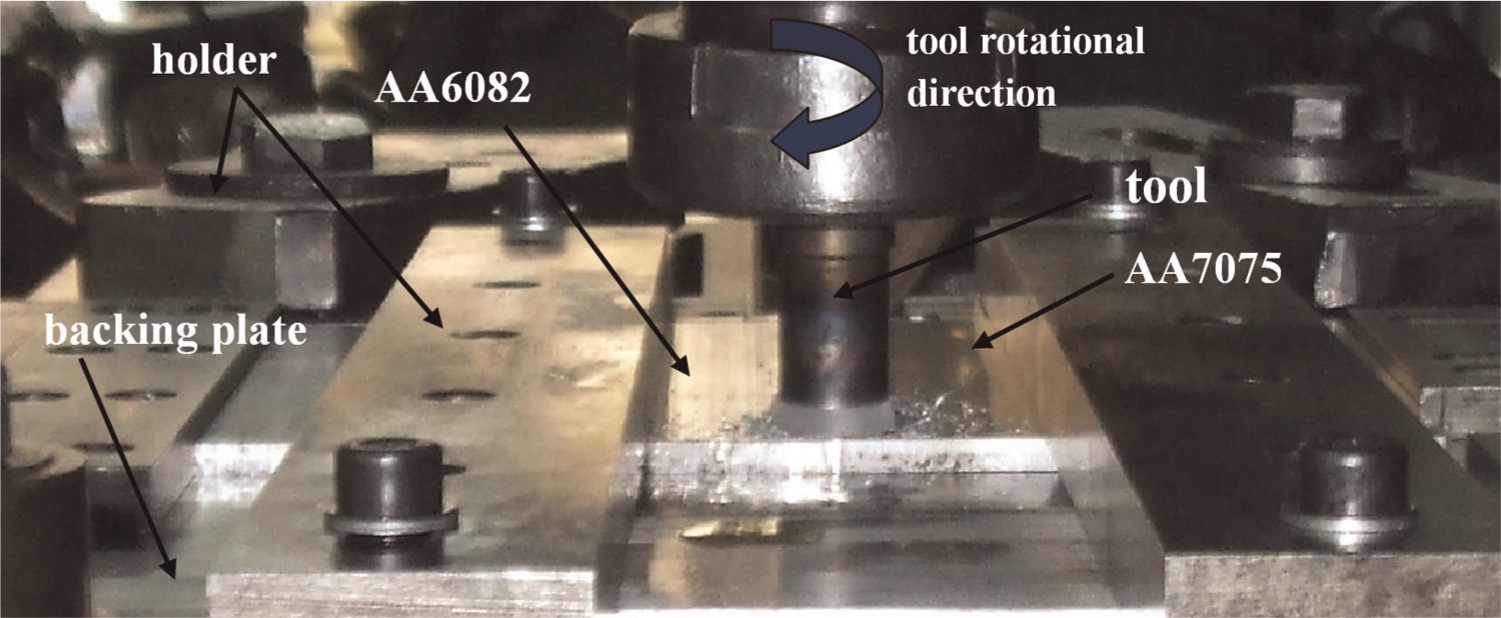
Placement of FSW components.
Tool configurations.
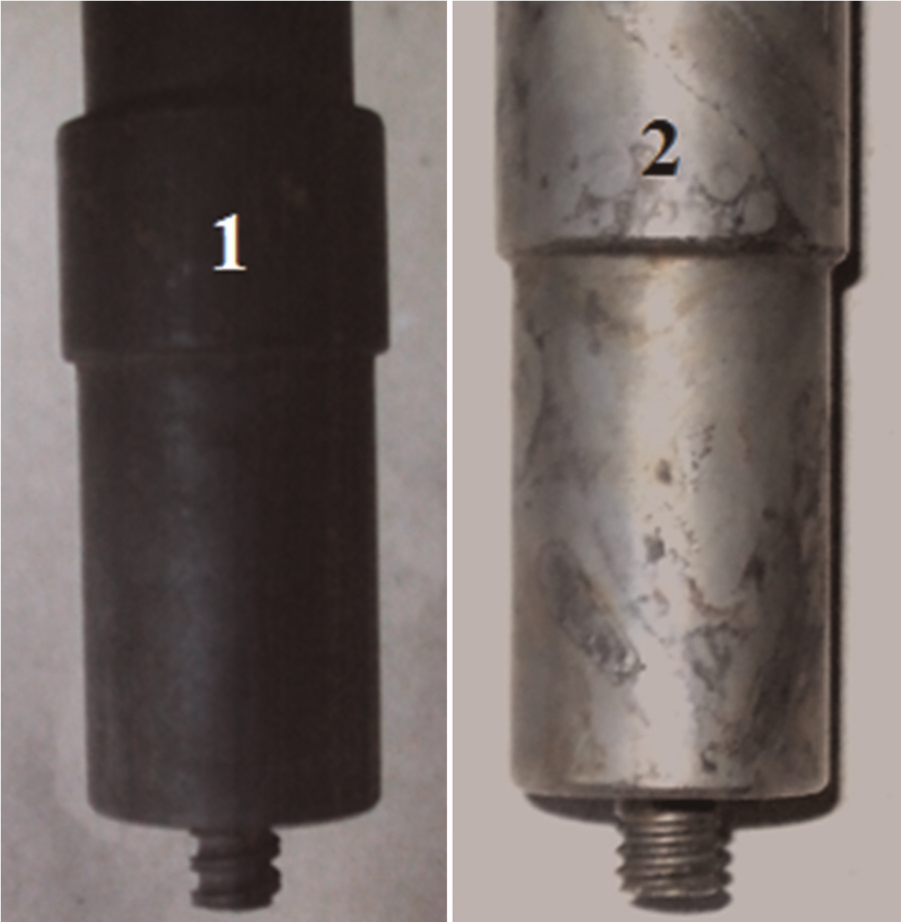
Designed special tools for FSW experiments.
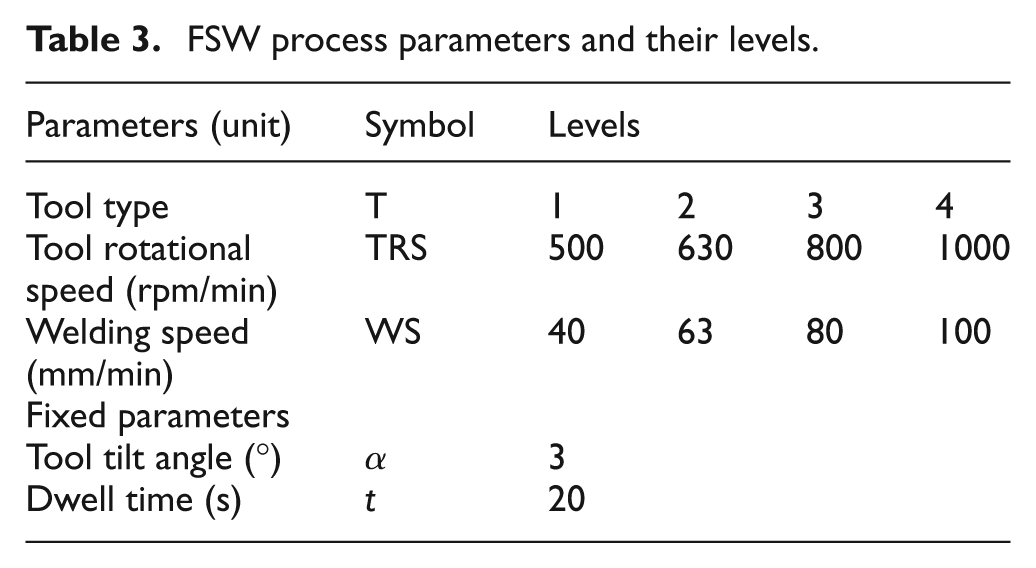
The welds were made using an experimental design composed by welding and tool parameters. The selected welding parameters were tool rotation speed, tool type and welding speed. The tool tilt angle and dwell time were kept constant during the experiments. The FSW experiments were performed using welding conditions given in Table 3. Figure 3 shows one of the welding experiments.
FSW process parameters and their levels.
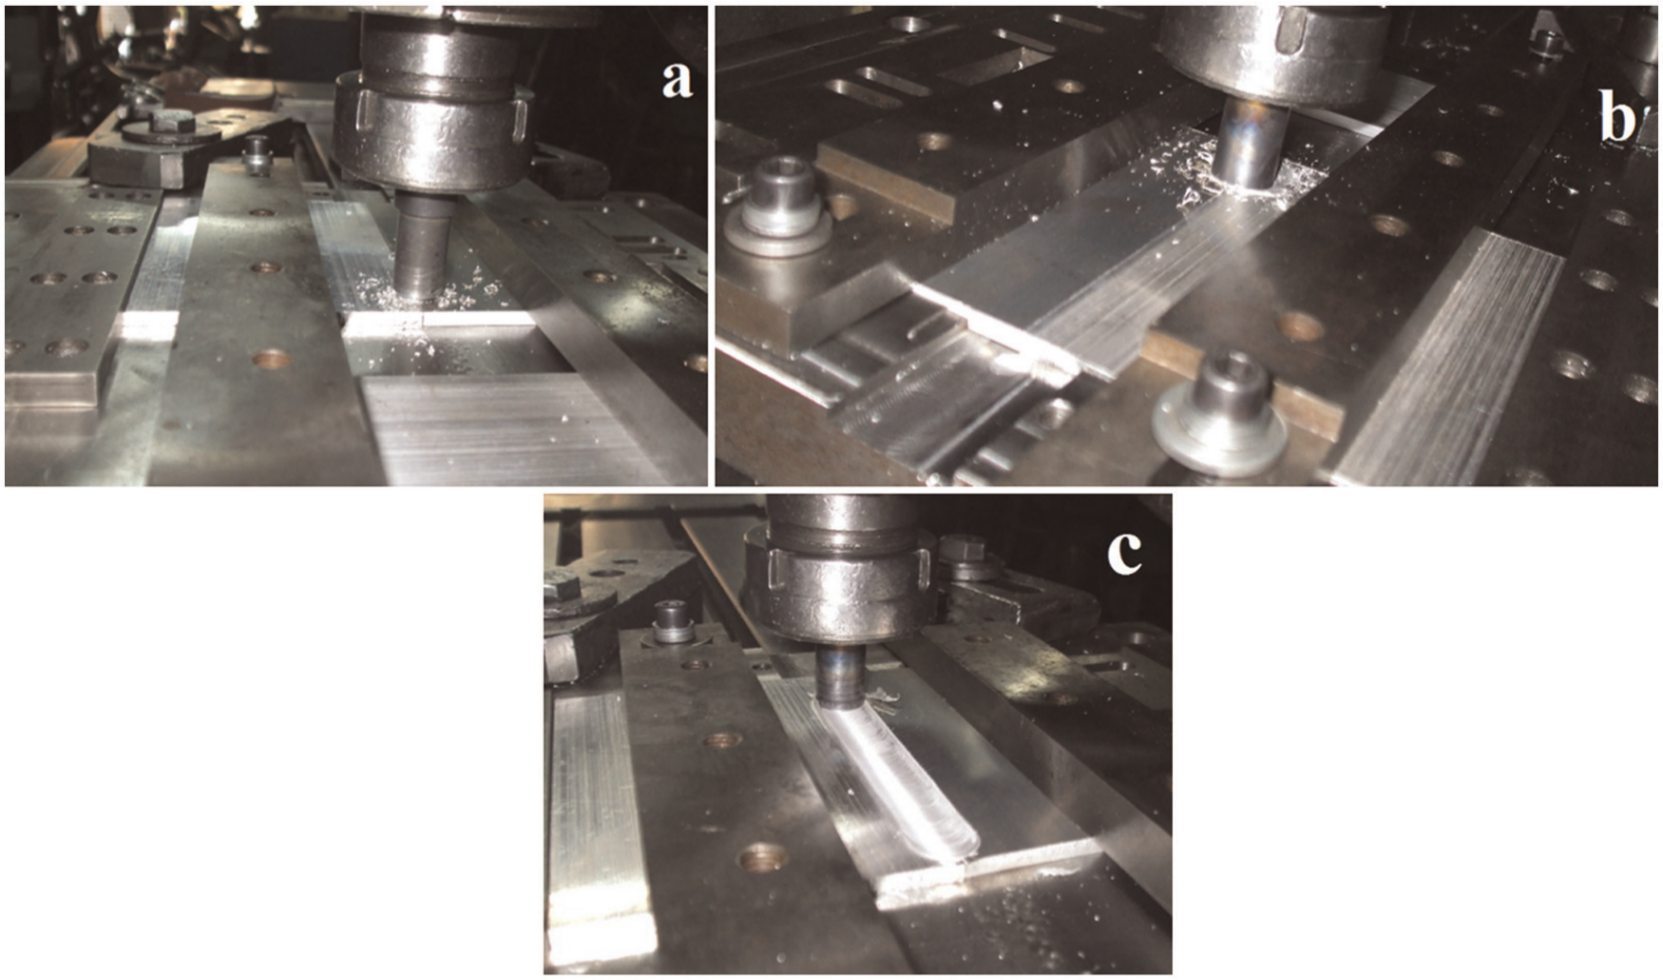
An FSW experiment (a) insertion of tool; (b) moving of tools at the intersection of two adjacent metals and (c) finishing of FSW experiment
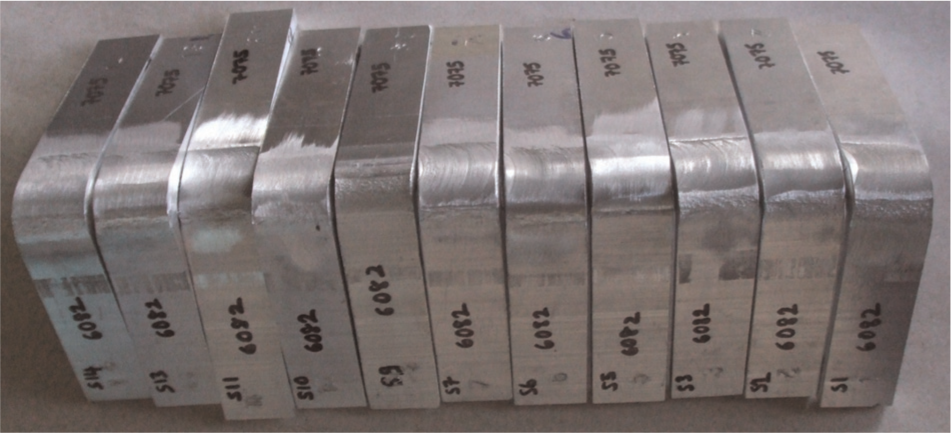
The joints were characterised by the ultimate tensile strength and percentage of elongation. In order to evaluate the mechanical properties of the welded specimens, tensile tests were carried out at 100 kN using a universal testing machine at room temperature. The three transverse tensile specimens were prepared according to the American Society for Testing and Materials (ASTM) E8M specification. The average of three tests was recorded as a result of UTS and ε. All tests were carried out with constant cross-head speed of 2 mm/min. The samples after tensile test are shown in Figure 4. The three-point face bending tests were carried out using a universal testing machine until a 90° bend angle is reached.
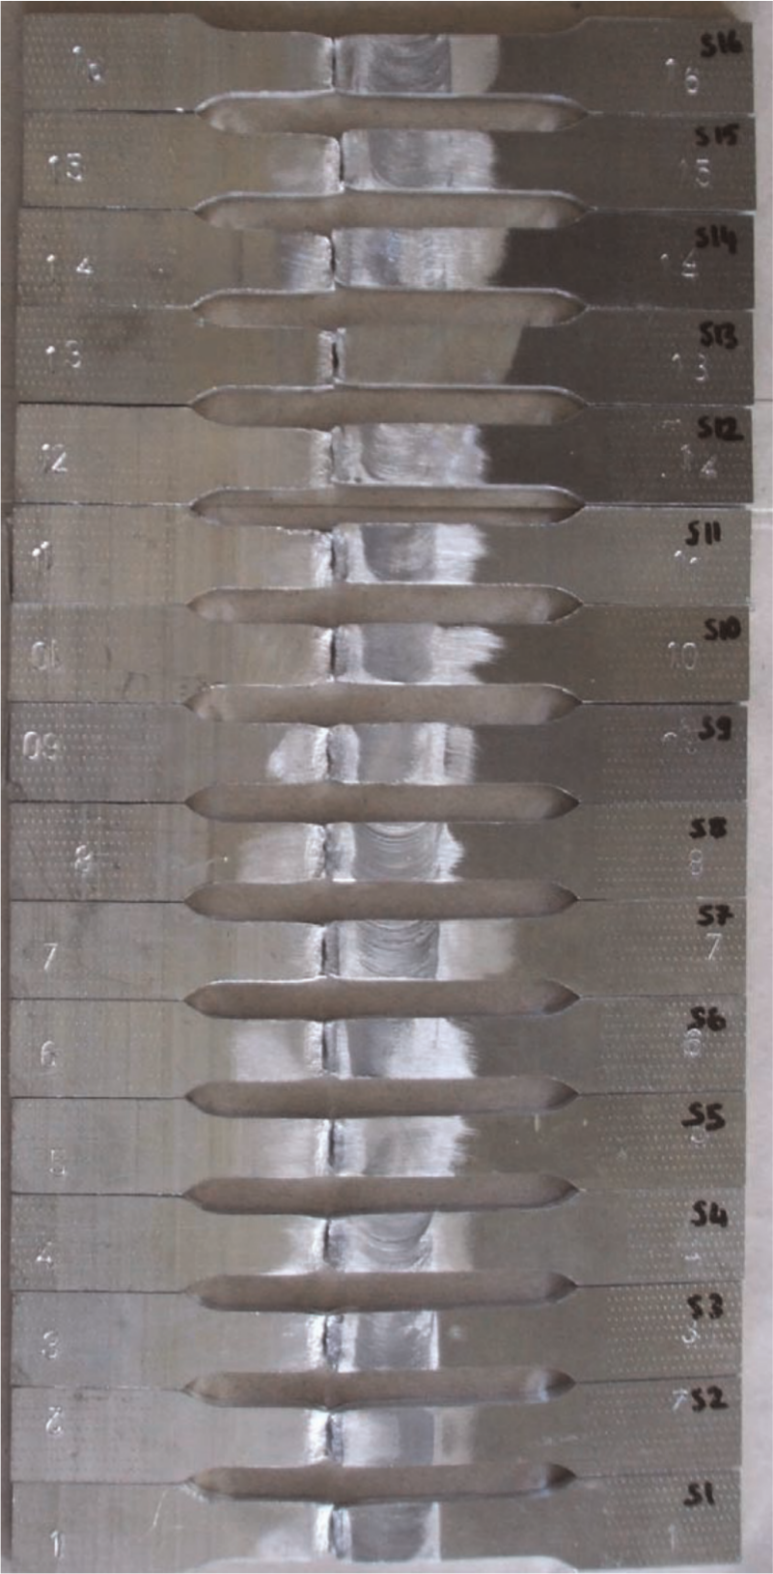
Samples after tensile test.
Selection of orthogonal array
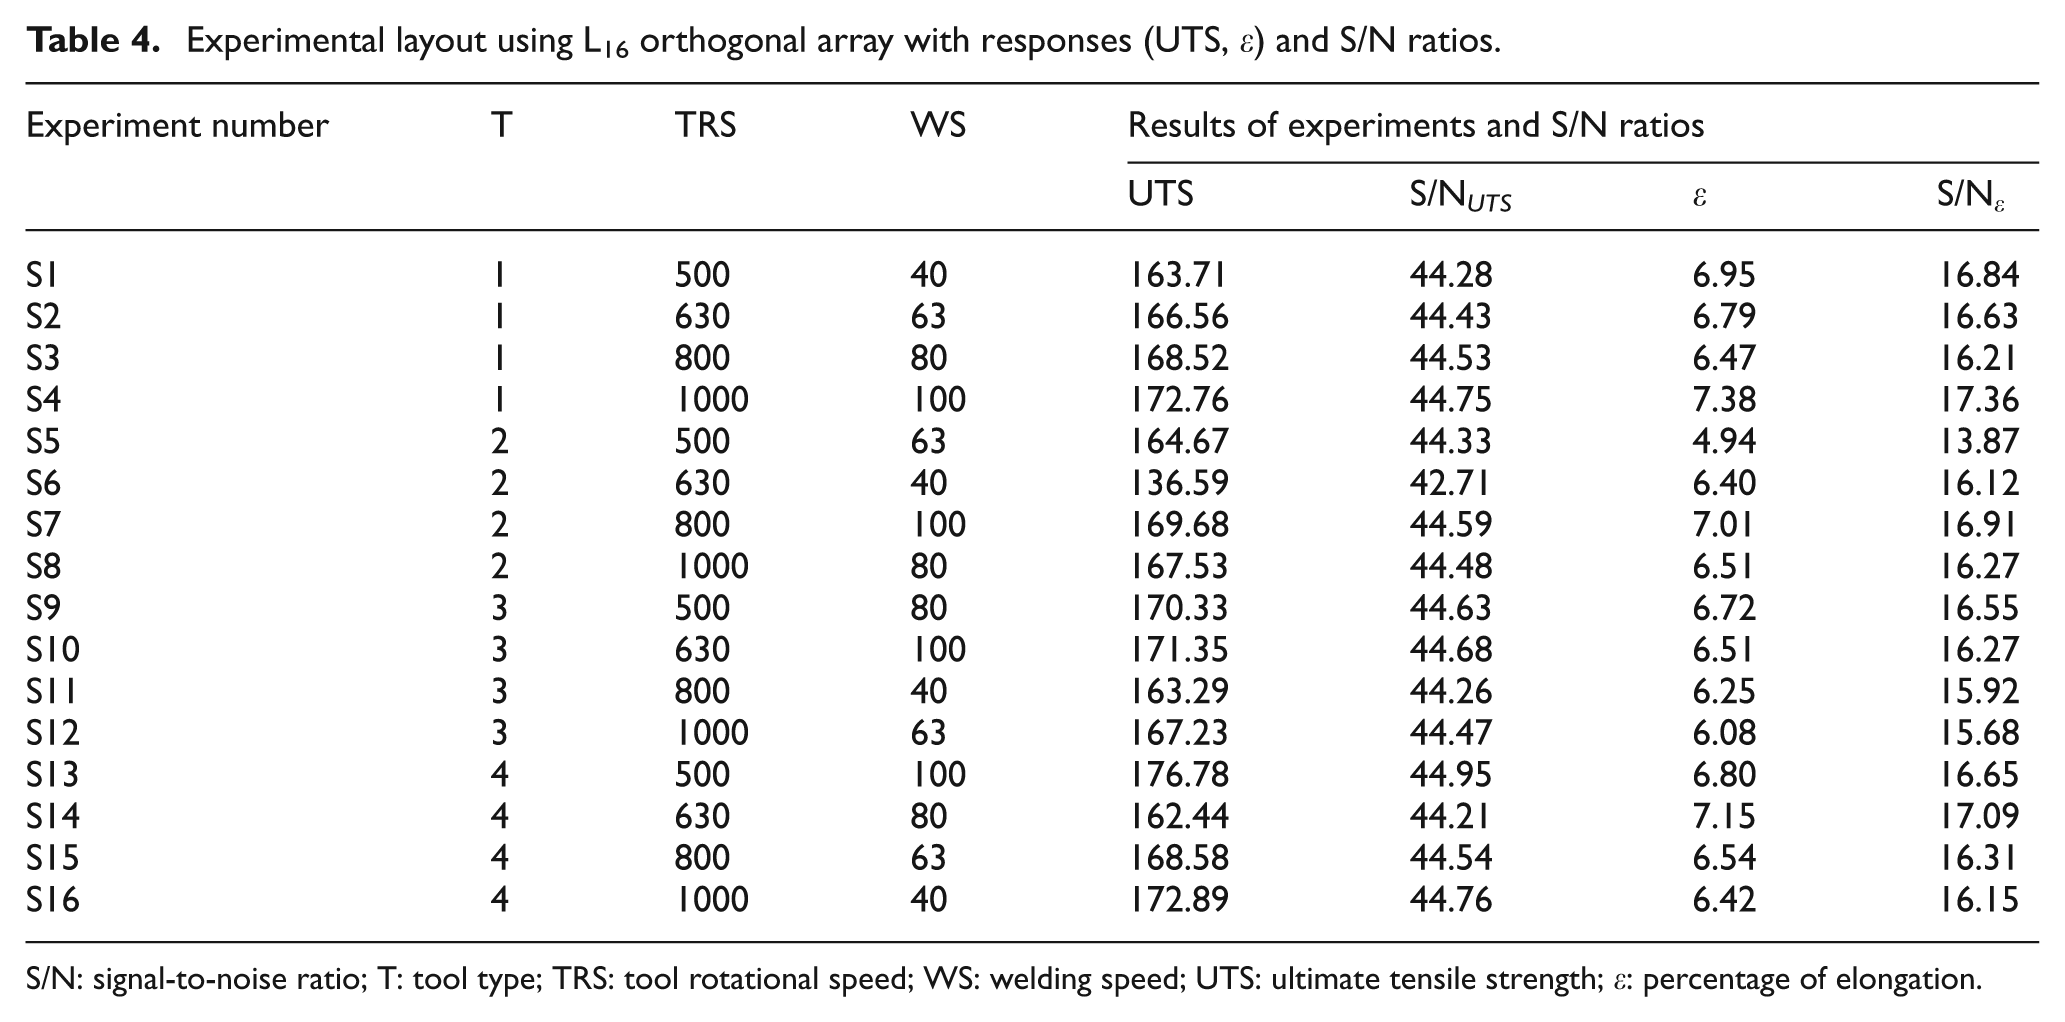
The selection of orthogonal array is the first step in the determination of optimal welding conditions. The selected welding parameters are tool type, tool rotational speed and welding speed. There are four levels for each parameter, which yields 3 degrees of freedom (DOFs). The DOF for a system should be greater than the total DOF of the process parameters.13,14 For this study, the interaction of welding parameters was neglected, and therefore, the DOF of this study was calculated as 9. In this context, the L16 orthogonal array was selected based on 16 DOF and employed to perform the welding experiments. The L16 experimental layout is given in Table 4.
Experimental layout using L16 orthogonal array with responses (UTS, ε) and S/N ratios.
S/N: signal-to-noise ratio; T: tool type; TRS: tool rotational speed; WS: welding speed; UTS: ultimate tensile strength; ε: percentage of elongation.
Implementation of the Taguchi-based grey analysis
The FSW process parameters were evaluated for dissimilar welding of AA6082 and AA7075 alloys. Three welding parameters, each with four levels, were used to analyze the dissimilar FSW process. The data taken from the FSW experiments were analyzed by the Taguchi-based GRA. The steps of each analysis are given in the following order.
Calculation of signal-to-noise ratio
The Taguchi uses three different performance characteristics to calculate the signal-to-noise (S/N) ratio: the larger the better, the nominal the better and the smaller the better. The higher tensile strength and higher percentage of elongation correspond to a better welding performance. Therefore, the larger the better S/N ratio was selected by considering the maximisation of UTS and ε. The larger the better S/N ratio is calculated with the following equation 15
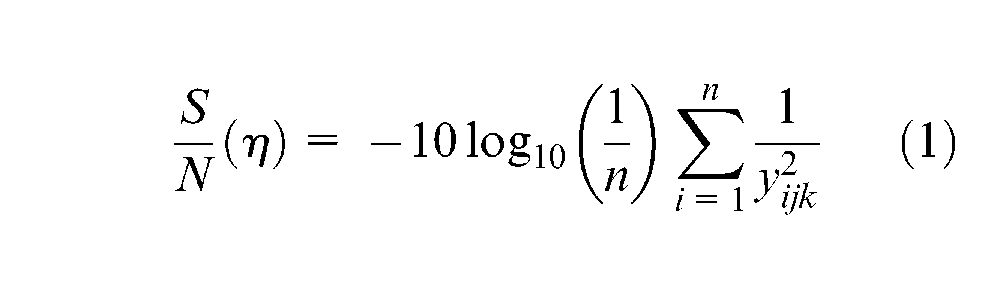
where n is the number of replications and yijk is the response value of the ith performance characteristic in the jth experiment at the kth trial. The results of the UTS and ε tests and their S/N ratios are given in Table 4.
Performing normalisation process for each response
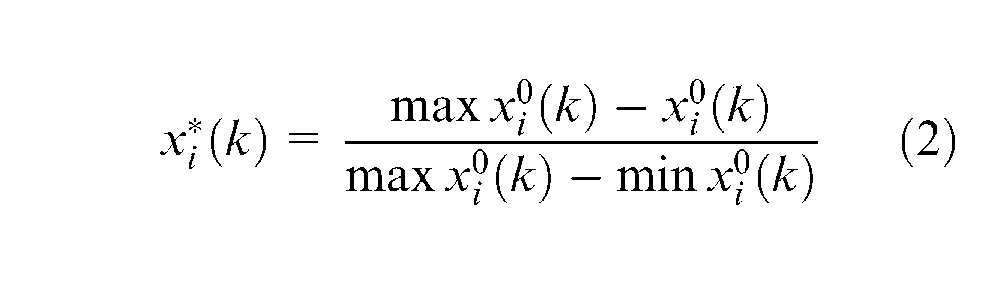
The GRA first begins with the data preprocessing. Data processing performs an analysis, which consists of the transfer of the reference sequence to a comparable sequence. In this analysis, the responses taken from the experiments are normalised in the range between 0 and 1. 14 In the normalisation process, three different performance characteristics—larger the better, smaller the better and nominal the better—are used. Before the normalisation process, it is necessary to determine which quality characteristics explain the reference sequence. If the purpose is to minimise the reference sequence, the “smaller the better” characteristic is used to normalise the reference sequence. Accordingly, the reference sequence is normalised as in equation (2)15–19
If the purpose is to maximise the reference, the “larger the better” characteristic is used to normalise the reference sequence. Accordingly, the reference sequence is normalised as in equation (3)15–19
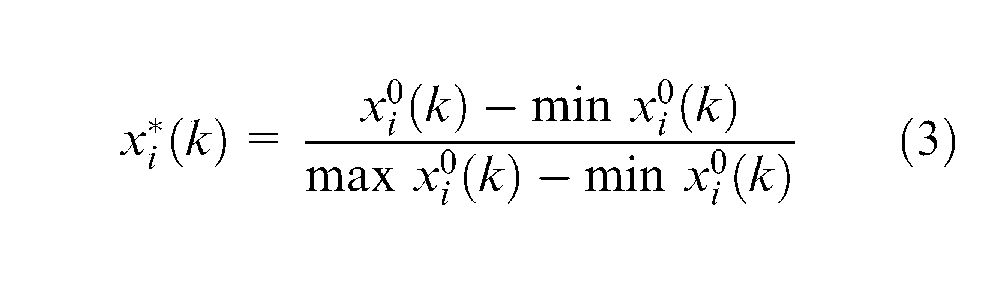
where
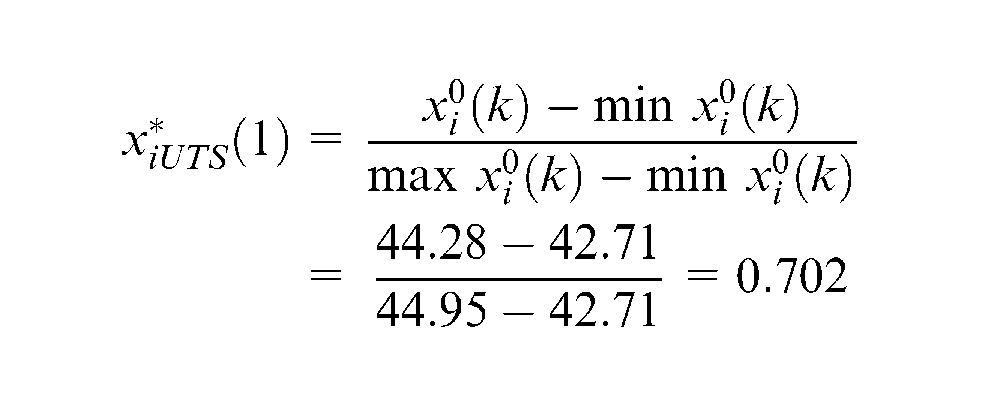
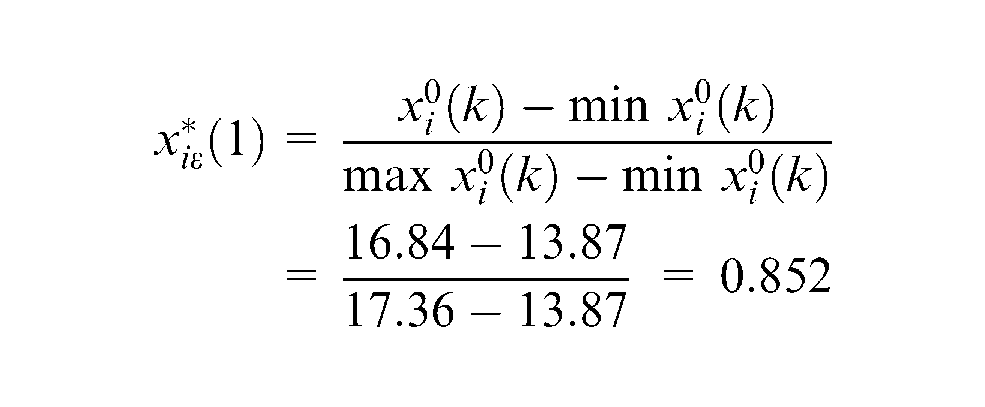
In this study, the aim is to maximise the reference sequence for each response. Therefore, the “larger the better” was employed for the data preprocessing. The S/N ratios in Table 4 were taken as the reference sequence. The data arrived after the preprocessing of the reference sequences are the comparability sequences. The comparability sequences for each experiment were calculated using equation (3), and the results are reported in Table 5. For S1, the data preprocessing of S/N ratio for UTS and ε is calculated as follows
The sequences of each performance characteristics (UTS, ε) after data preprocessing.
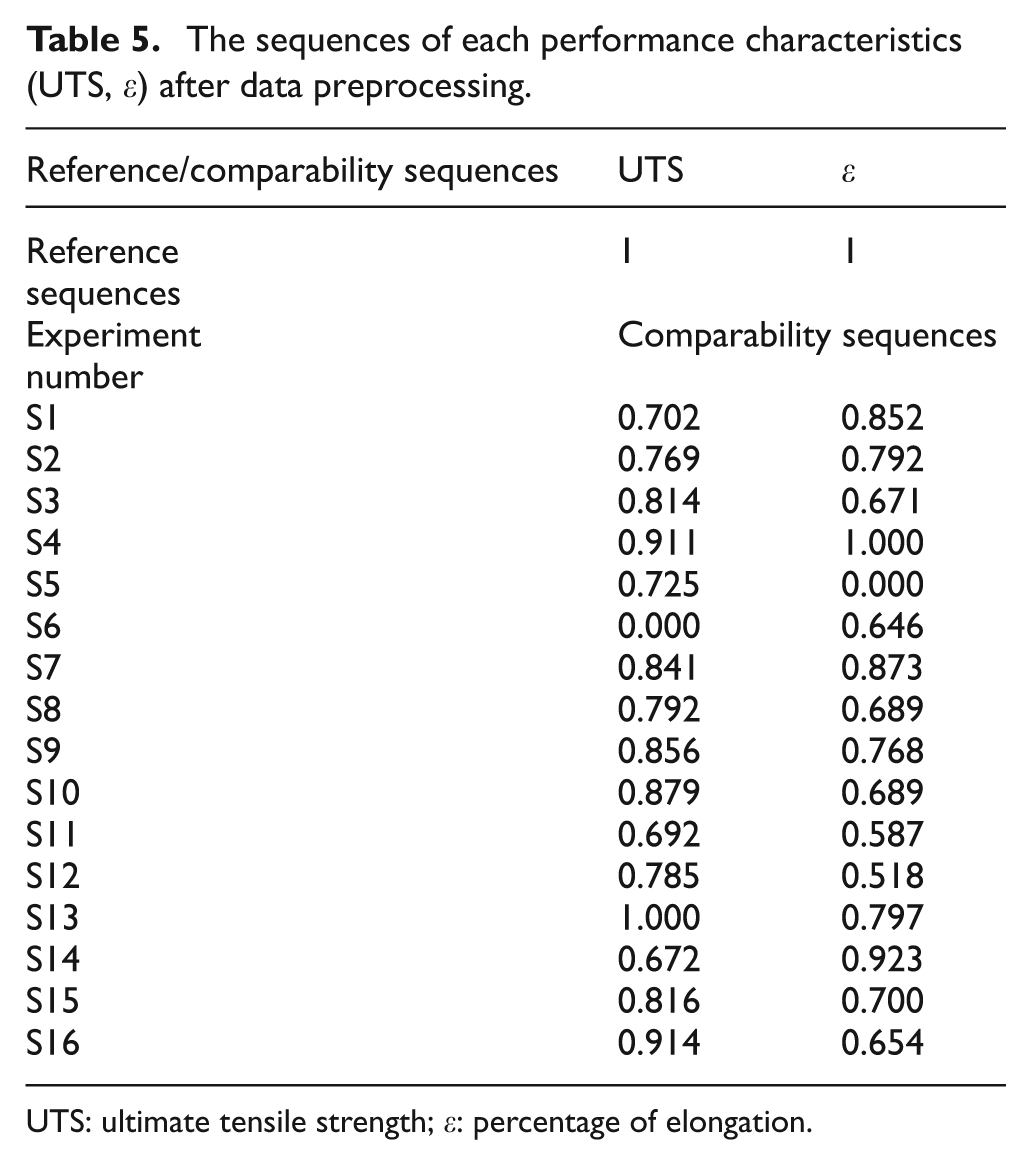
UTS: ultimate tensile strength; ε: percentage of elongation
Calculation of deviation sequences and grey relational coefficients
The next step is the calculation of the grey relational coefficient (GRC). The GRC is used to explain the relationship between the reference sequence and the comparability sequence. The GRC (ξ) is calculated to integrate the data achieved from equations (4) to (7)15–19

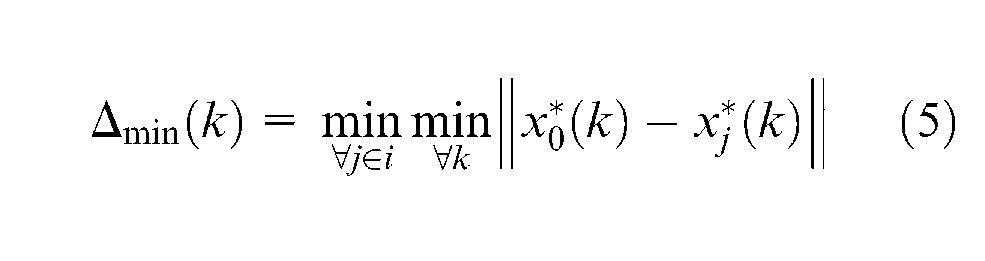
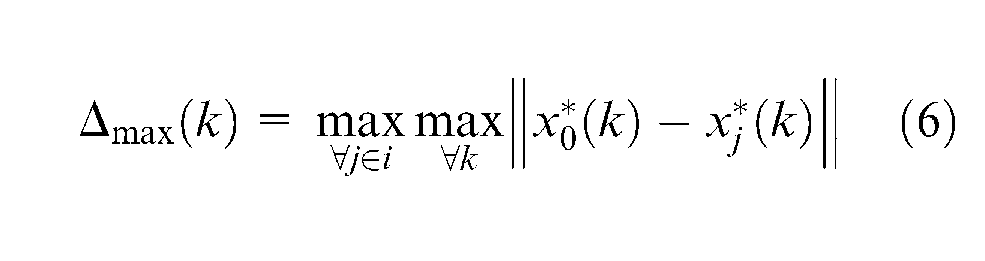
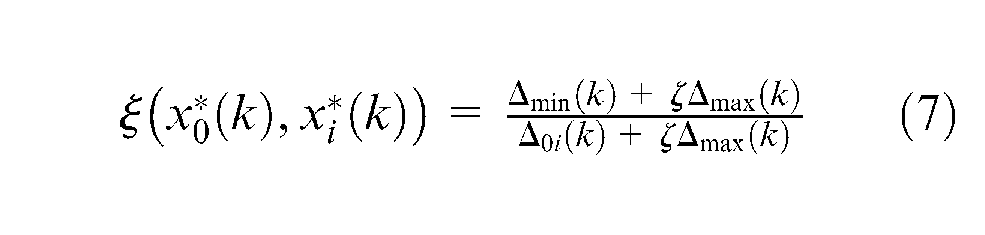
where
As given in equation (7), it is necessary to calculate the deviation sequences before calculation of the GRC. The deviation sequences are calculated using equation (4). For S1, the deviation sequences for the UTS and ε are as follows
The GRCs were calculated using equation (7). For this study, an equal weight was selected, and therefore, the distinguished coefficient was taken as 0.5. Using equation (7), the calculated GRC values are given in Table 6.
Relational coefficients and grey relational grades.
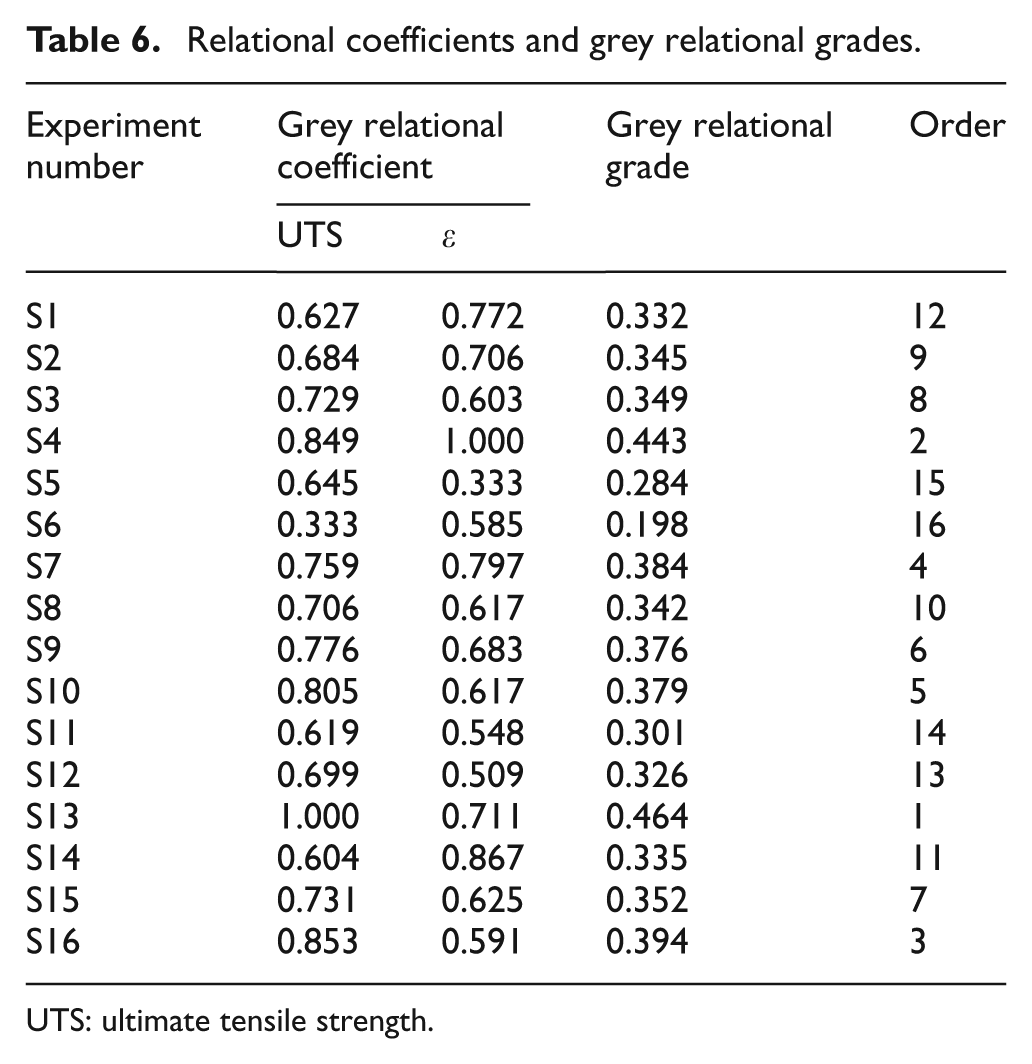
UTS: ultimate tensile strength.
Calculation of grey relational grades
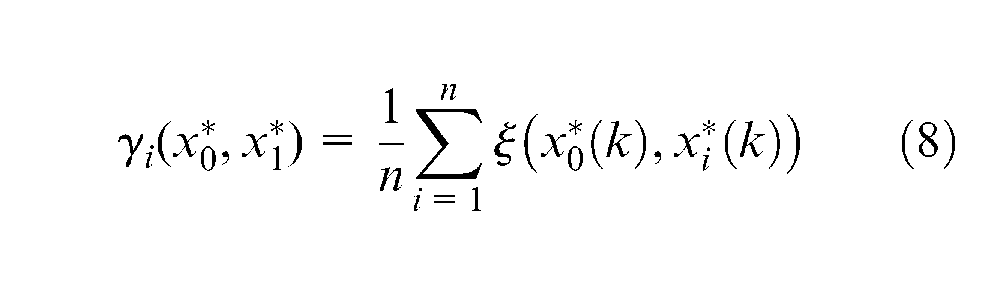
The last step is to determine the grey relational grade (GRG). The GRG is the mean sum of the GRC that is calculated using equation (8)16–19
For practical engineering applications, the weighting of factors on the process performances may not be similar in some cases. Therefore, equation (8) is modified as in equation (9)7,18,19
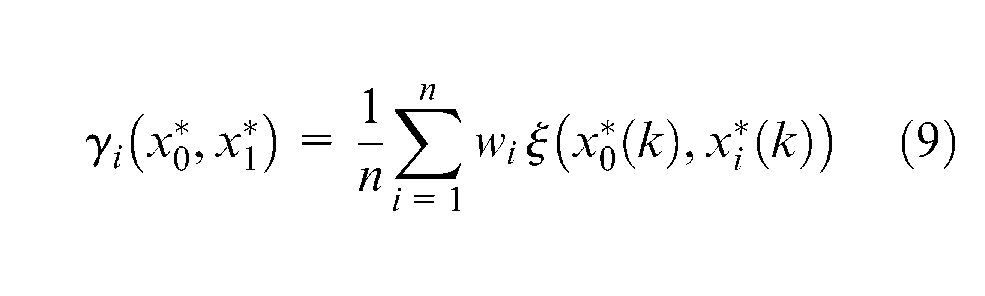
where
In real engineering applications, the weighting of each response is different. Therefore, each response was weighted at a different value. The GRG values were calculated using equation (9), and the results are given in Table 6. The highest value represents the strength of the relationship between the reference sequence and the comparability sequence.
Determination of optimal level of each parameter
After the GRG values were derived, the optimum combination was investigated. From the GRG values given in Table 6, the mean effect for each level of parameters was calculated, and the results are given in Table 7. In addition, a graph was plotted, as in Figure 5. Considering the highest GRG value for each parameter in Table 7, and the marked points in Figure 5, the determined optimal combination is tool type (T) 4, TRS of 1000 rpm/min and WS of 100 mm/min.
Main effects of GRG.
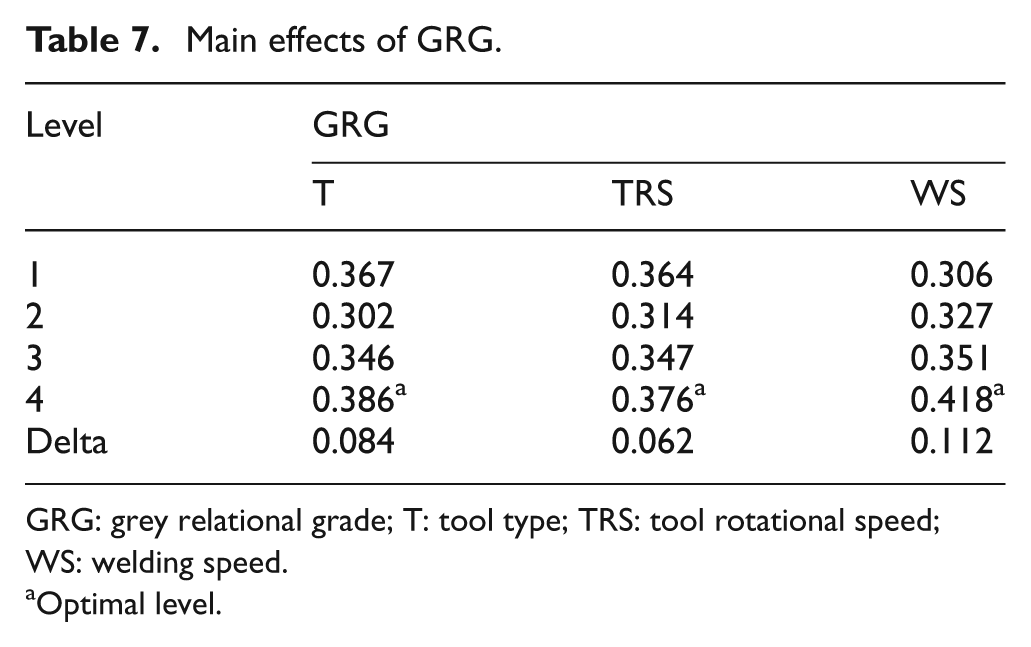
GRG: grey relational grade; T: tool type; TRS: tool rotational speed; WS: welding speed.
Optimal level.
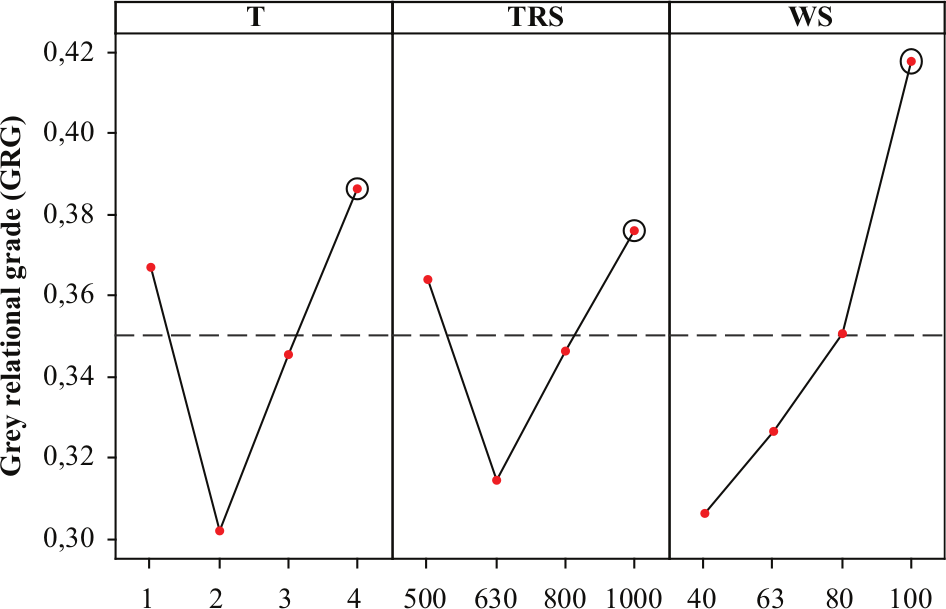
Main effect of grey relational grade (GRG).
Performing analysis of variance
In order to analyze the significance of each parameter, and the contribution of each parameter on the GRG, the analysis of variance (ANOVA) was carried out, and the results are given in Table 8. As can be seen in Table 8, the percentage contribution sorted in descending order is WS (48.7%), T (27.48%) and TRS (15.13%).
ANOVA results for grey relational grade (GRG).
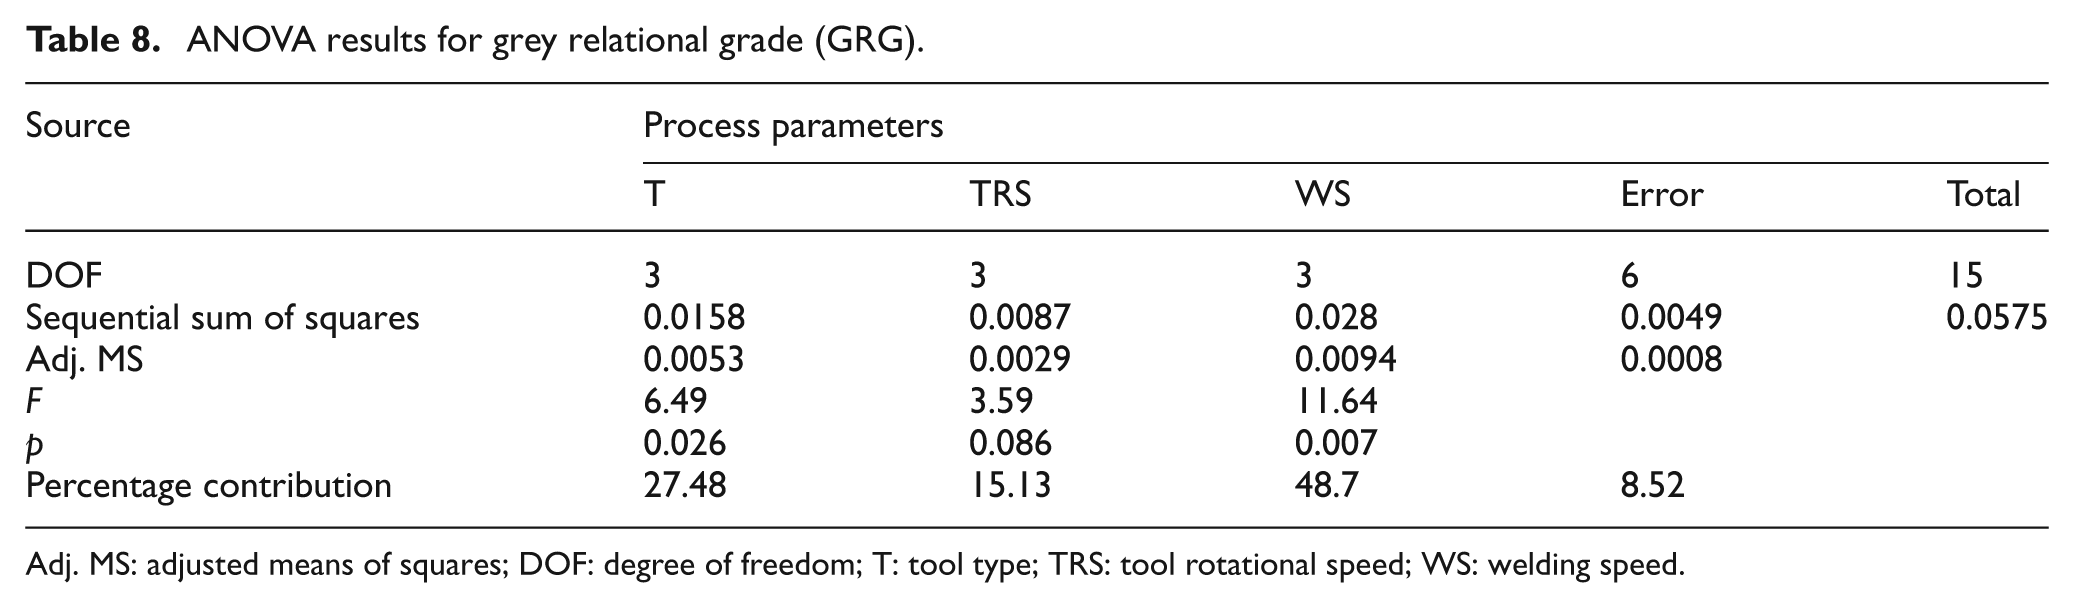
Adj. MS: adjusted means of squares; DOF: degree of freedom; T: tool type; TRS: tool rotational speed; WS: welding speed.
Prediction of optimal GRG value
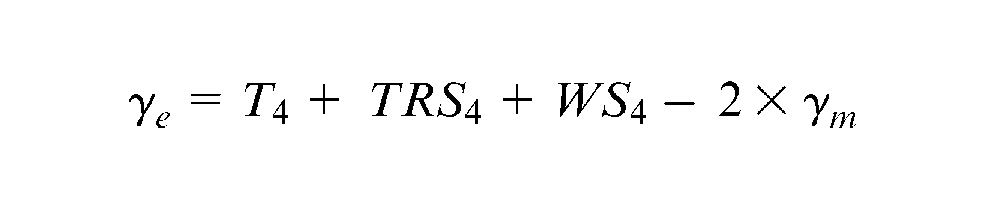
After determining the optimal level of each parameter, the optimal GRG value was calculated. For this purpose, equation (10) was used for estimation and verification of improvement in the GRG7,19
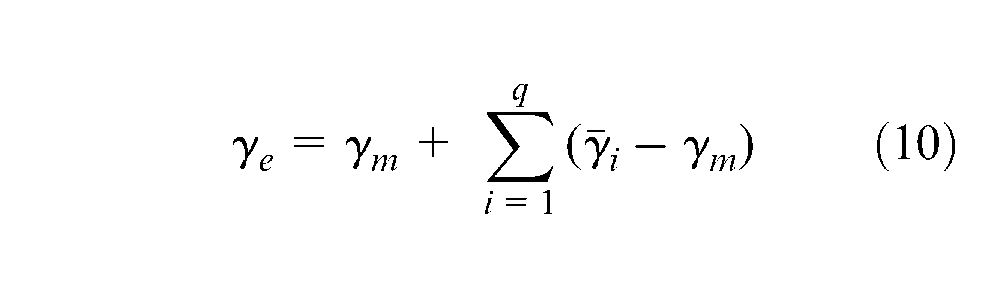
where
Using equation (10), the following result is reached
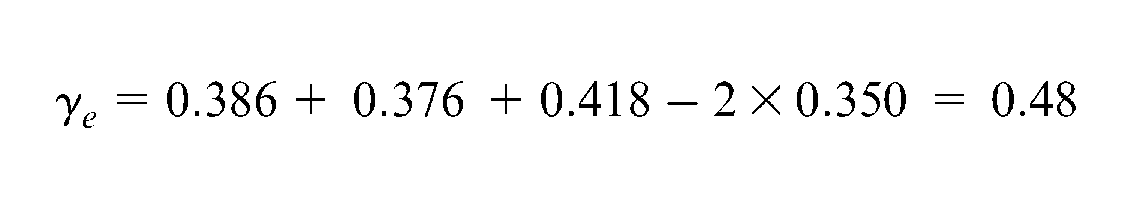
The predicted GRG value is the highest value among all the GRG values. A confirmation experiment was carried out to verify the predicted value. By setting parameters as tool type 4, TRS of 1000 rpm/min and WS of 100 mm/min, the achieved mean UTS value and percentage of elongation are 179.11 MPa and 6.29%, respectively.
The three-point face bending tests were carried out using a universal testing machine until a 90° bend angle is reached. The test results showed that except for S4, S8, S12, S15 and S16, the samples bent at 90° without any defect. Figure 6 shows the appearance of samples after bend test. It can be clearly detectable that the bend have occurred at the side of AA6082, and no crack was observed. The samples cracked at the bend test (S7 and S8) are shown in Figure 7. The crack was occurred at the HAZ.
Samples after three-point bending test.
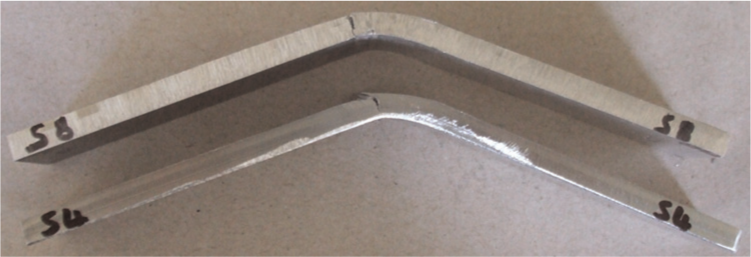
Cracked samples after three-point bending test.
Conclusions
In this study, a dissimilar FSW technique was implemented on AA7075 and AA6082 aluminum alloys. Four different tool types were associated with welding parameters to analyze the effect of combined factors on the mechanical strength such as UTS and percentage of elongation. Based on the L16 orthogonal array, an experimental plan was conducted, and the data taken from the experiments were analyzed using GRA. The following conclusions were drawn.
From the mean GRG, the highest GRG value was achieved with the parameter settings as follows: the tool type 4, the tool rotational speed of 1000 rpm/min and the welding speed of 100 mm/min.
Based on ANOVA results, the tool type and the welding speed have significant effects on the UTS and ε. The welding speed has a greater effect, with a 48.7% contribution, and the tool type effect has a 27.48% contribution.
The comparison of predicted and initial conditions showed that the GRG value increased from 0.332 to 0.480, confirming that the predicted combination explains the process. Additionally, the predicted value is the highest value among all the GRG values.
All the joints were exposed to a three-point face bending test. The bending test results revealed that except for S4, S8, S12, S15 and S16, the samples bent at 90° without any defect.
Footnotes
Declaration of conflicting interests
The author declares that there is no conflict of interest.
Funding
This study is fully supported by Dokuz Eylul University under the project no. 2011.KB.FEN.045.