
Abstract
In friction stir welding of heat treatable aluminum alloys, the thermal cycles developed during the joining process result in softening of the joints which adversely affect their mechanical properties. Underwater friction stir welding can be a process of choice to overcome this problem due to low peak temperature and short dwell time involved during the process. Consequently, this article presents a study pertaining to the underwater friction stir welding of aluminum alloy 6082-T6 with an aim to develop a mathematical model to optimize the underwater friction stir welding process parameters for obtaining maximum tensile strength. The results of the study reveal that the tool shoulder diameter (d), tool rotational speed (ω), welding speed (v), and second-order term of rotational speed, that is, ω2, significantly affect the tensile strength of the joint. The maximum tensile strength of 241 MPa which is indeed 79% of the base metal strength and 10.7% higher than that of conventional (air) friction stir welding joint was achieved at an optimal setting of the underwater friction stir welding parameters, that is, tool rotational speed of 900 r/min, the welding speed of 80 mm/min, and a tool shoulder of 17 mm. The article also presents the results of temperature variation, the macrostructural and microstructural investigations, microhardness, and fractography of the joint obtained at the optimal setting for underwater friction stir welded (UFSWed) joint.
Keywords
Introduction
Since its inception, friction stir welding (FSW) has become one of the most suitable welding techniques to join aluminum alloys (AAs).1,2 Heat treatable aluminum alloys (HTAAs) or precipitation-hardened AAs, which were difficult to weld using fusion welding (FW), can be successfully welded using FSW. Introduced in the 1990s, FSW derives frictional heating as well as intense plastic deformation of the work material to weld two pieces together. Joining of materials takes place in the solid state, resulting in a fine-grained microstructure with sound mechanical properties.3,4 Defects pertaining to improper material solidification and liquation cracking are eliminated in friction stir welded (FSW), enabling manufacturers to exploit the capabilities of FSWed HTAAs. 5
The presence of secondary-phase precipitates is vital from a strength viewpoint in HTAAs.6,7 The strength of these alloys (2xxx, 6xxx, 7xxx) majorly depends on the finely dispersed precipitates within the matrix. These precipitates hinder the dislocation motion, thus increasing the strength of the alloy by manifolds. The precipitate’s morphology and distribution is both time and temperature dependent. During aging treatment, the morphology and distribution of precipitates in HTAAs significantly improves the mechanical properties. In the T6 condition, the alloy is solutionized and artificially aged, enabling the alloy to be used in load-bearing applications. During FW, the conditions of temperature and heat cause coarsening of the precipitates to such an extent such that the welded plates can be ripped apart easily.
Although good weldability is obtained using FSW of these alloys, still the heat generated during the process causes coarsening or dissolution of precipitates leading to reduction in mechanical properties.8,9 FSWed regions most affected by this phenomenon are the thermo-mechanically affected zone (TMAZ) and heat-affected zone (HAZ), where softening takes place.10,11 Furthermore, a varying heat distribution is translated into inhomogeneity of properties along the thickness of the joint. 12 Thus, it is a matter of prime importance to prevent dissolution or growth of strengthening precipitates in HTAAs. Previous studies conducted on FSW of HTAAs have focused on external cooling to alleviate this problem. Water cooling method has also been explored during FSW to limit the coarsening and dissolution of the precipitates owing to its extensive circulation and outstanding heat absorption capability. 13
Tensile properties of the AA2219 were studied by Liu et al. 14 based on cooling media, that is, air and water. They reported an increased tensile strength in underwater friction stir welding (UFSW) joint due to reduction in the precipitate coarsening level. The joint efficiency in UFSW was 0.79 times that of base metal (BM). Fratini et al. 15 made use of water flowing on the top faces of AA7075-T6 samples to demonstrate the potential of water for in-process cooling to improve joint strength. Zhang and Liu 16 used a configuration whereby the AA2219-T6 samples were completely immersed in water, indicating a suitable method for heat extraction. By optimizing the process parameters, the authors improved the tensile strength of the UFSWed specimens by 6% compared to the maximum tensile strength obtained using conventional FSW. Lately, Sabari et al. 17 have used finite element techniques in conjunction with the UFSW denoting the benefits of this technique on armor grade AA2519-T87.
In spite of the research conducted on UFSW of HTAAs, few researchers have focused on the 6xxx AAs. Moreover, a handful of the studies have pinpointed temperature rise in the HAZ during UFSW. The present study is concerned with the use of UFSW to identify the effect of influential process parameters and optimize the tensile strength of AA6082. A factorial-based study is employed to establish a relationship between tensile strength and input parameters in the form of a second-order polynomial regression equation to characterize the process. The article also presents the results of temperature variation, the macro- and microstructural investigations, microhardness, and fractography of the joint obtained at optimal setting for the UFSWed joint.
Experimental procedure
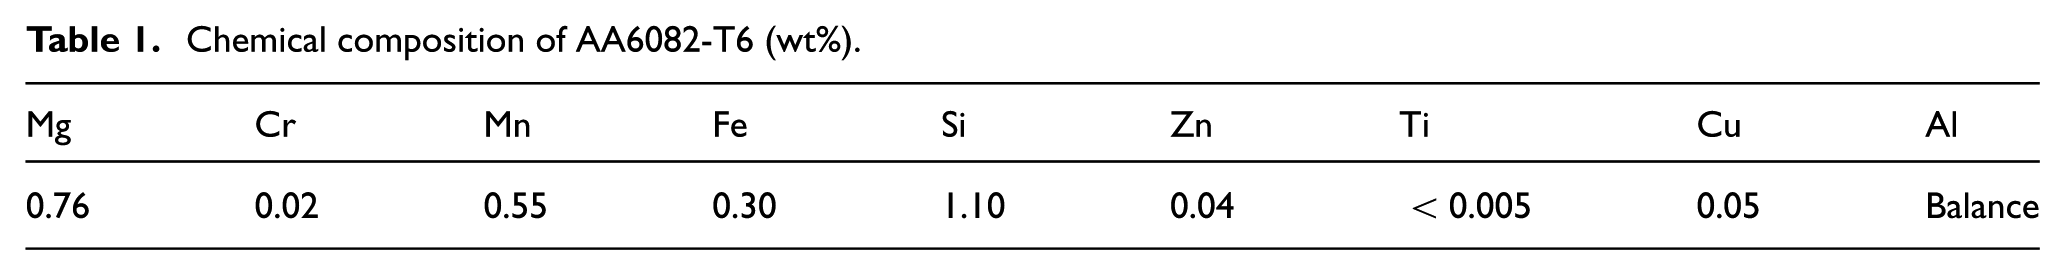
HTAA 6082, widely used for highly loaded structural applications in the shipbuilding sector, was considered as the BM. Butt joint configuration with dimensions 200 mm × 50 mm × 3 mm was used. Tables 1 and 2 represent the chemical composition and mechanical properties of AA6082, respectively.
Chemical composition of AA6082-T6 (wt%).
Mechanical and thermal properties of AA6082-T6..
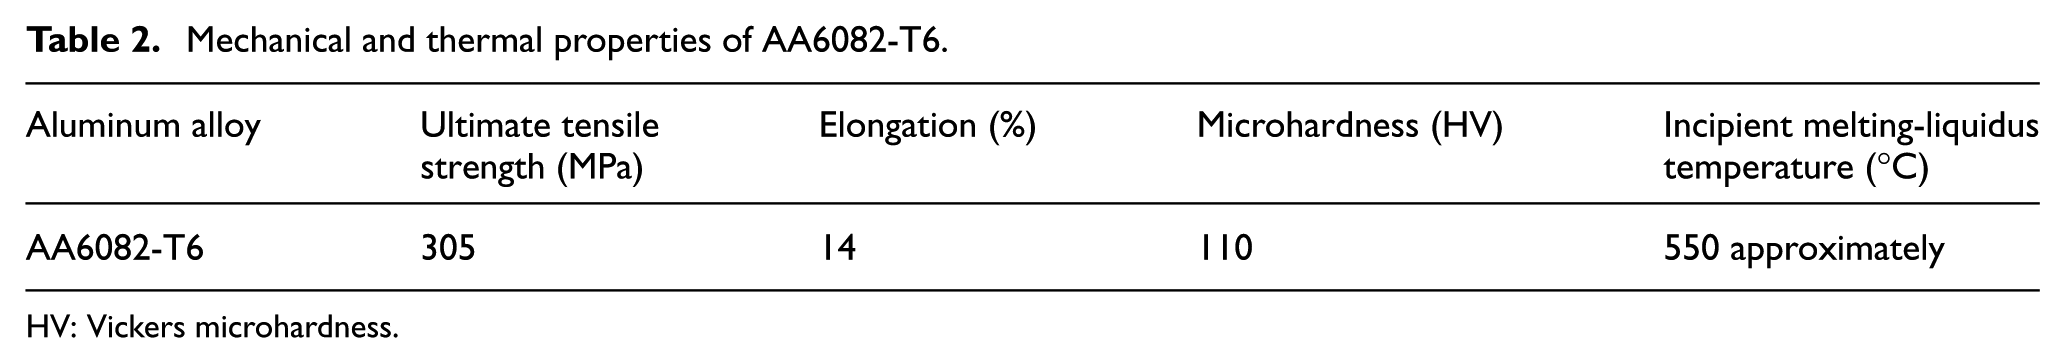
HV: Vickers microhardness.
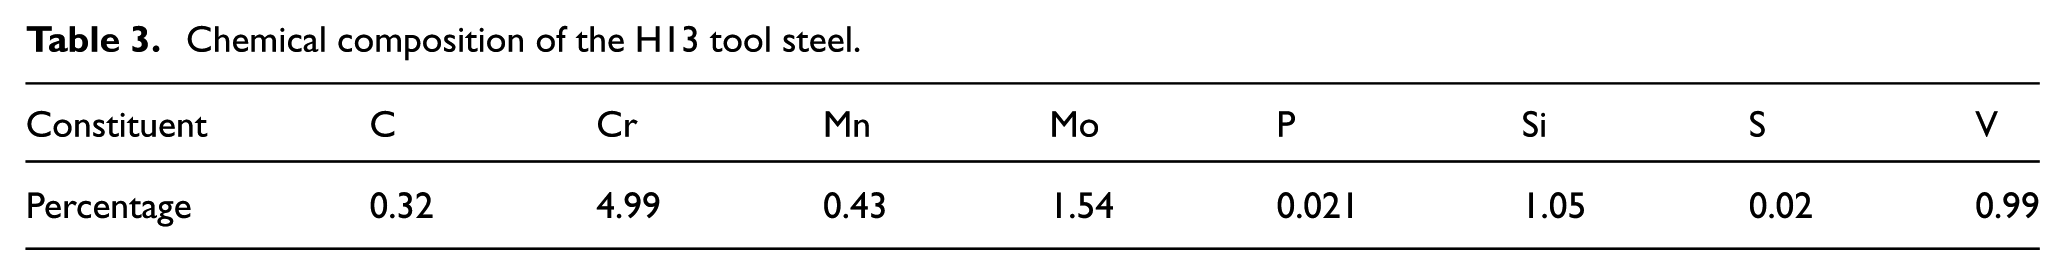
UFSW was performed with tools made up of H13 tool steel with composition as shown in Table 3. Cam profiled pins having a pin diameter of 6 mm and a pin height of 2.7 mm were used for the whole experimental study as shown in Figure 1. A cam pin profile offers a pulsating action during stirring ensuring good material flow. A tool tilt angle of 2° with a tool plunge equal to 0.25 mm was used to perform single pass welding normal to the rolling direction. Welding was performed on a vertical milling machine retrofitted for FSW. Specimens to be welded were cleaned and clamped securely in a specially designed fixture. Before the start of the welding run, the samples were immersed in water such that the top faces of the samples remained fully submerged.
Chemical composition of the H13 tool steel.
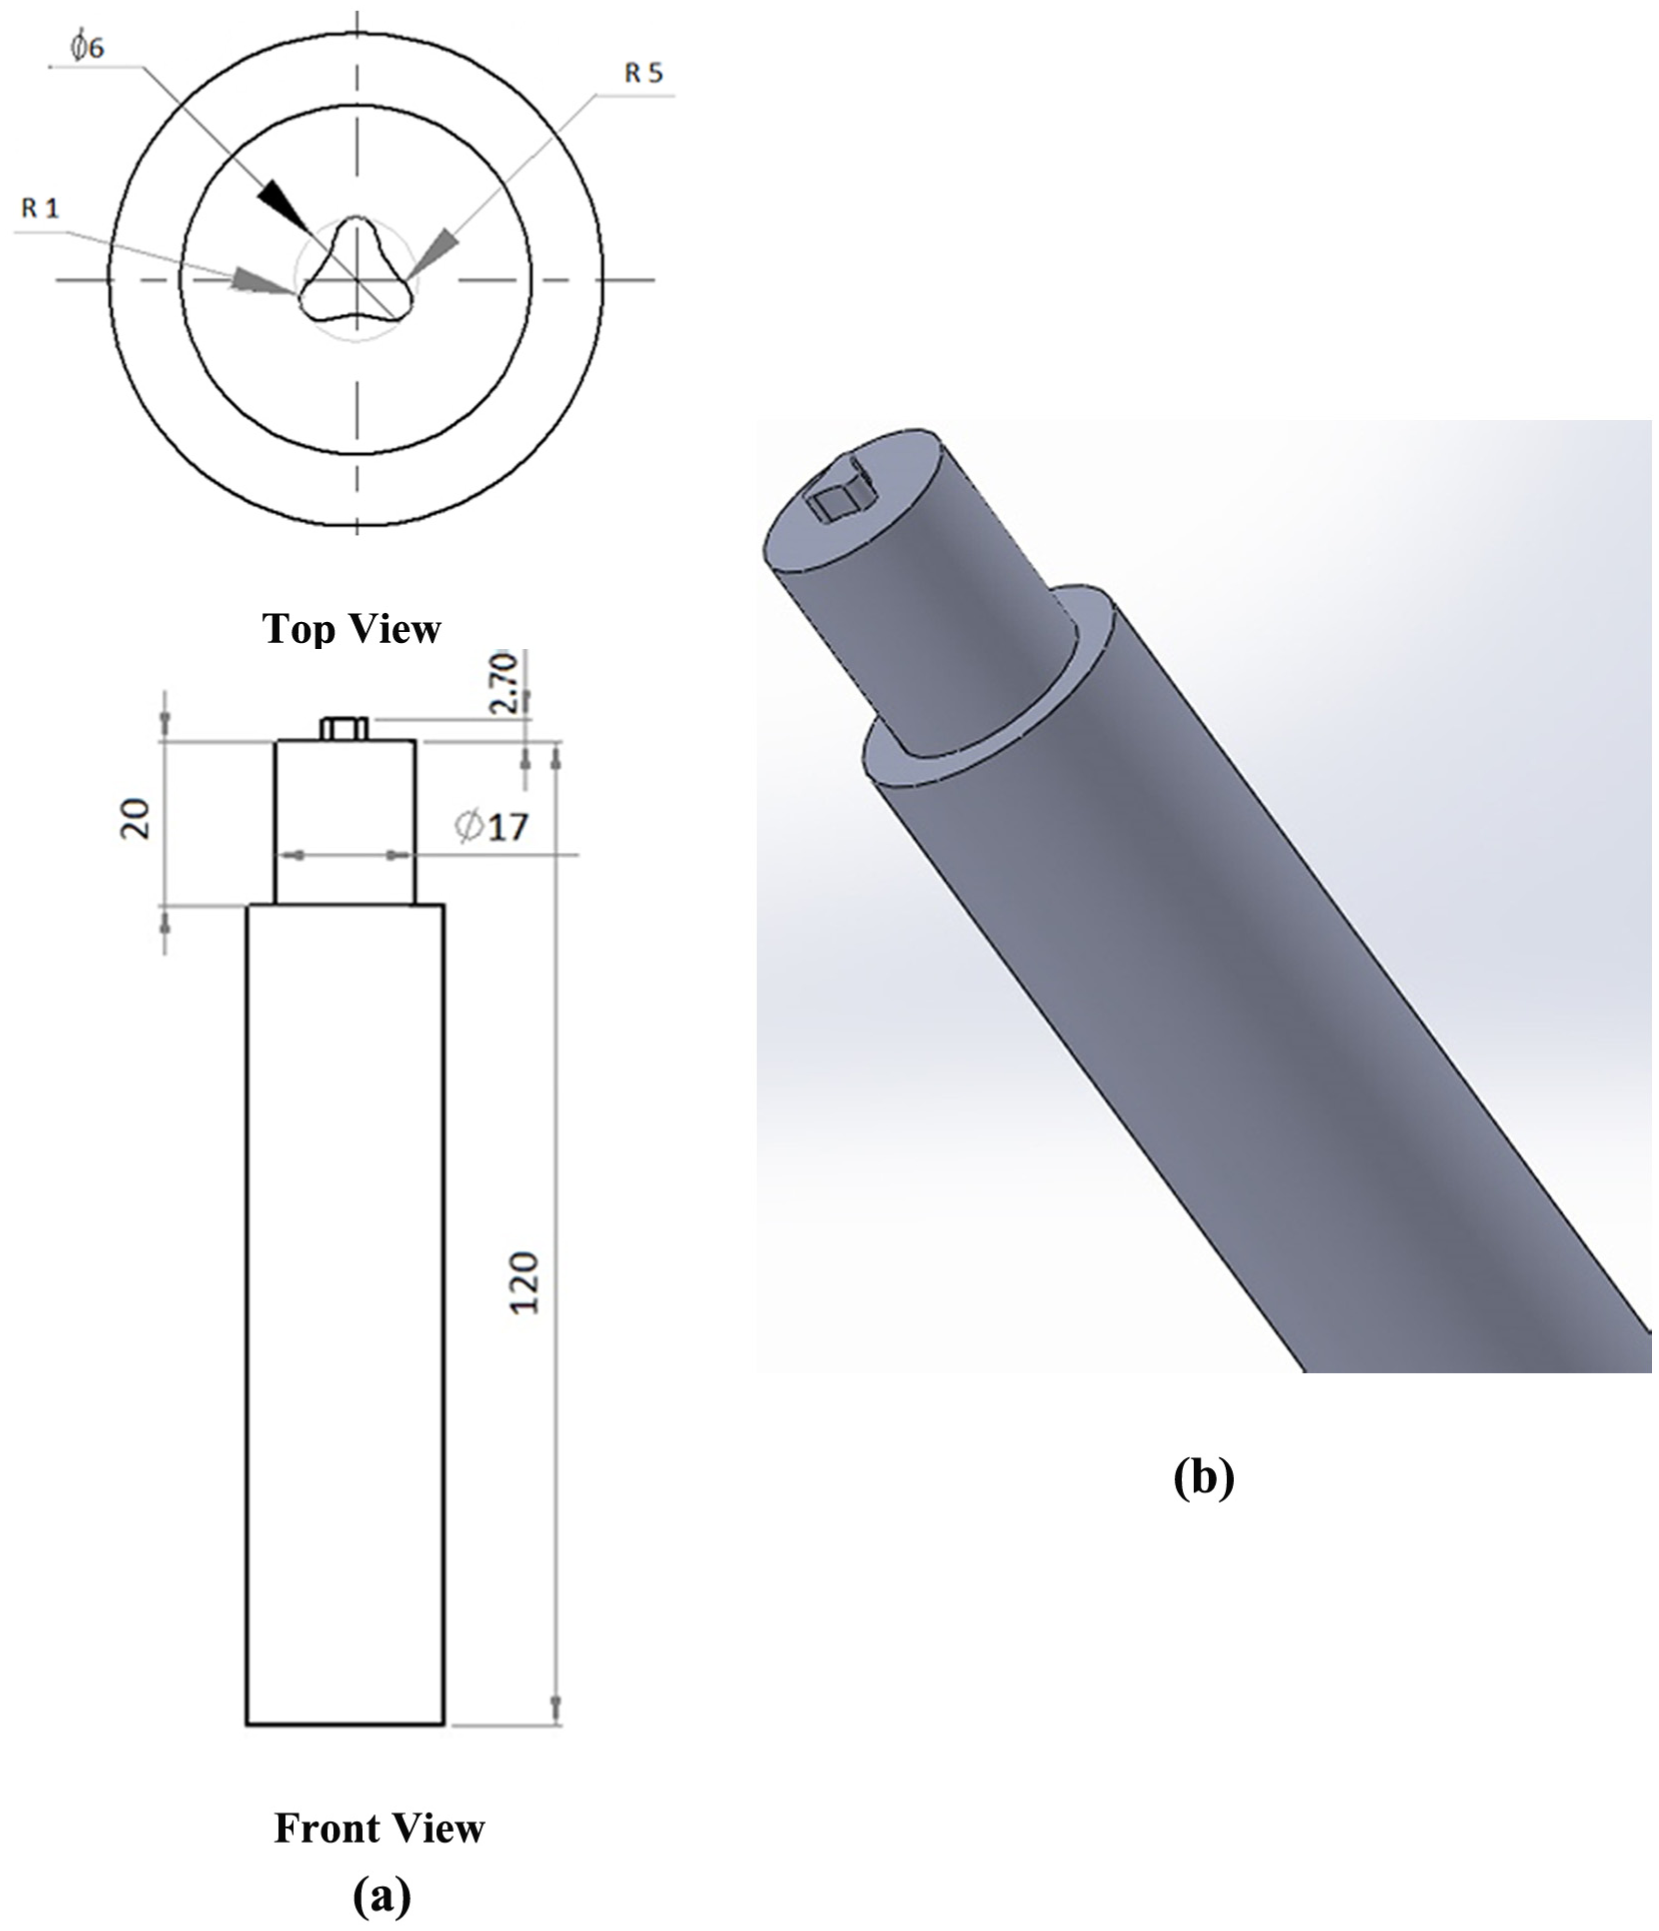
Tool used in the present study: (a) tool dimensions for 17 mm shoulder and (b) solid model.
Design of experiments is a reliable procedure to plan the experiment so that meaningful results can be derived. 18 Thus, a full factorial design was used to conduct experiments. Full factorial designs are known to give agreeable results when the number of factors is limited to 4. Three input parameters, namely, tool shoulder diameter (d), rotational speed of the tool (ω), and welding speed (v), were selected as input parameters in the study, with their levels shown in Table 4.
UFSW parameters and levels.
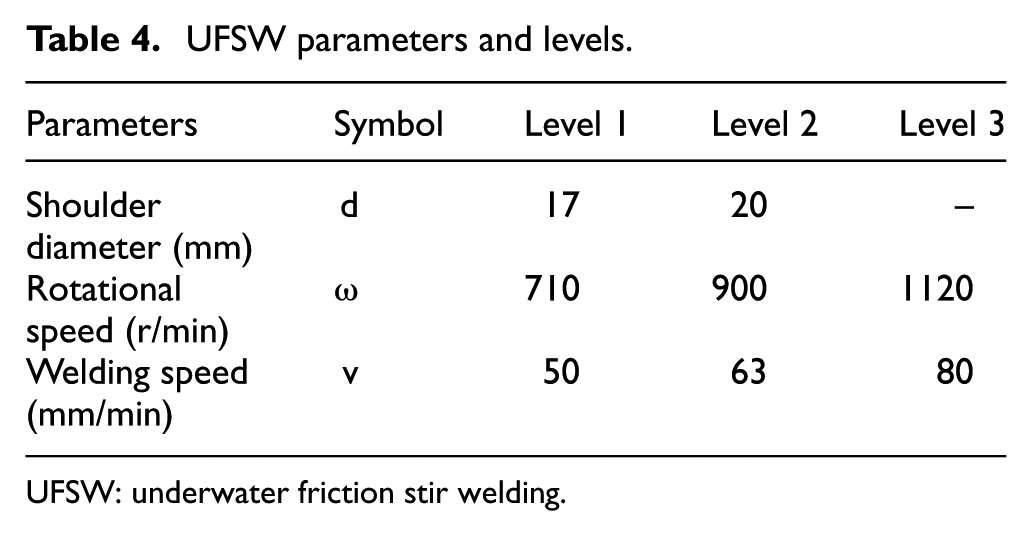
UFSW: underwater friction stir welding.
Prior tests were conducted to find a suitable range of the welding parameters in such a way that defect-free welds were obtained. In the present investigation, full factorial arrays comprising of 18 rows and 3 columns were chosen as shown in Table 5.
Design matrix.
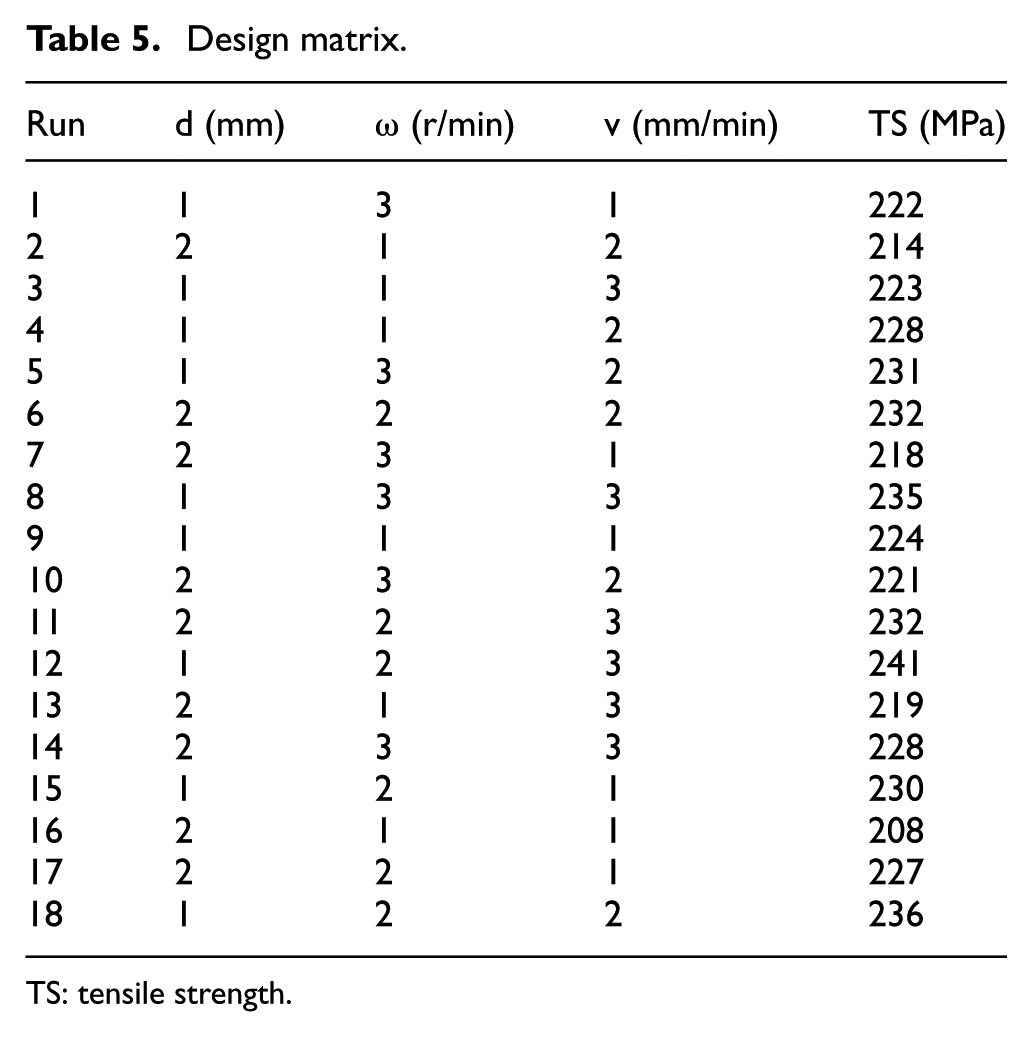
TS: tensile strength.
The measurement of temperature distribution in transverse direction on both the sides of the weld (advancing side (AS) and the retreating side (RS)) was possible with the help of K-type thermocouples. Six thermocouples were used with their location as specified in Figure 2.
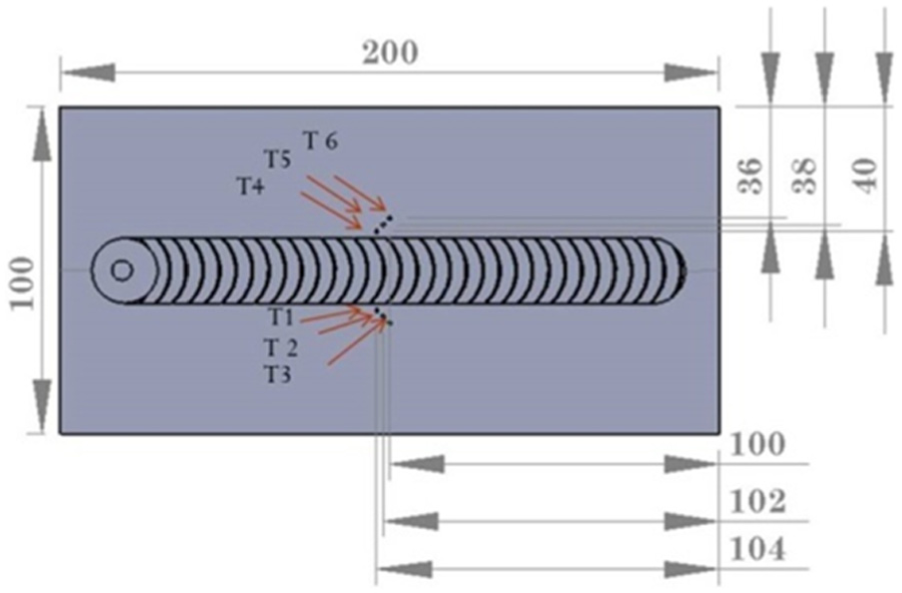
The location of thermocouples.
Metallographic, tensile, and hardness samples were cut normal to the welding direction using wire electro-discharge machining (EDM, Steer Corporation, Jiangsu, China). The tensile properties of joints in the transverse direction were estimated by a tensometer (Kudale Instruments Pvt. Ltd., Pune, India).The tensile tests were performed at room temperature with the cross-head moving at a speed of 2 mm/min. For the assessment of microstructure, weld specimens were ground, polished, and etched by means of a modified Keller’s reagent and examined through a metallurgical microscope (QS Metrology, New Delhi, India). Scanning electron microscopy (SEM) was used to extricate the fracture features of tensile samples and precipitate distribution within the various weld zones. A Vickers microhardness testing machine (HM 200, Mitutoyo, Kawasaki, Japan) was employed for the measurement of microhardness at the mid-depth of the joint by applying an indentation load of 2 N and a delay time of 20 s. Successive indentations were spaced at a distance of 0.5 mm.
Results and discussion
Analysis of variance
Analysis of variance (ANOVA) was used to extract meaningful conclusions from the experimental data. Table 6 shows the ANOVA for tensile strength. The F value is a measure of significance of the parameters under consideration. Variables having a p value lower than 0.05 are considered significant. In the current investigation, it can be inferred that the second-order polynomial regression model and the three factors—namely, tool shoulder diameter (d), tool rotational speed (ω), and welding speed (v) along with the interaction factor of ω2—are significantly affecting the tensile strength since they have a fairly high F value and a p value less than 0.05. Thus, the tensile strength of the welds is dependent to a greater extent on these significant parameters, while other terms play a less important role.
Analysis of variance for tensile strength.
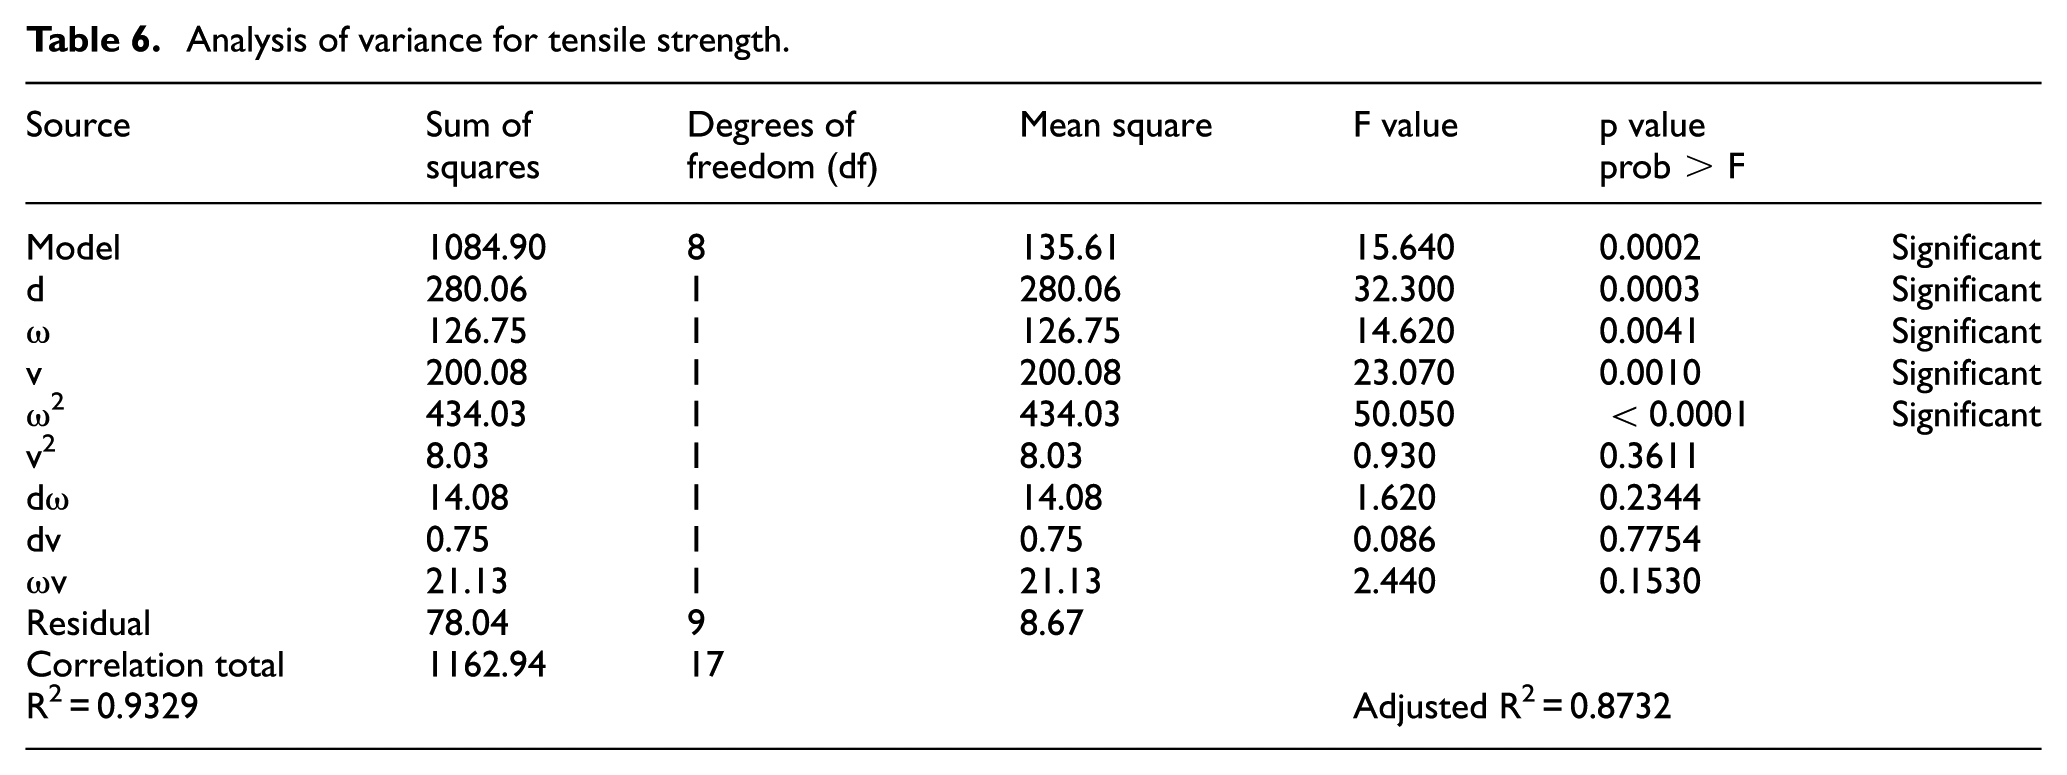
Among the significant factors, the second-order term of rotational speed, that is, ω2, has the greatest influence on the tensile strength. This is followed by the tool shoulder diameter (d), as indicated by its F value. The welding speed (v) and tool rotational speed (ω) come next, respectively.
Thus, the present UFSW model can be described by a second-order polynomial regression equation of the form as given in equation (1)
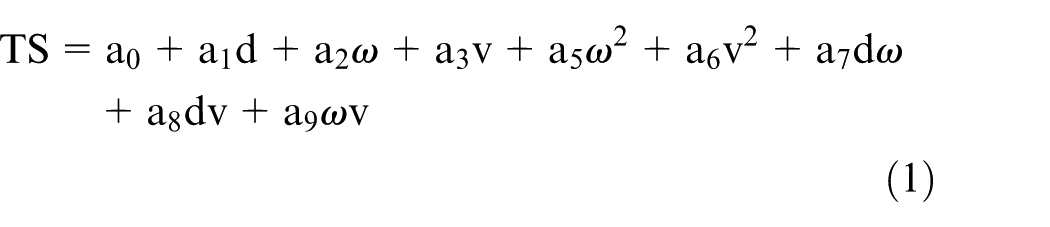
where TS refers to tensile strength, and a0–a9 are regression coefficients.
The relationship of tensile strength and the input parameters in the present investigation is given in equation (2)
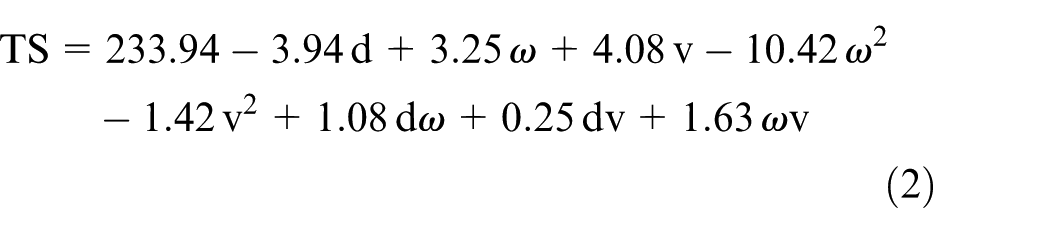
The terms R2 (0.9329) and adjusted R2 (0.8732) refer to the correlation of the regression model to the experimental data, which in this case implies a high degree of correlation. The R2 value of 0.9329 suggests that 93.29% of variation in the model can be explained by the parameters under consideration. Furthermore, the adequacy of the model can be verified by normal probability distribution as shown in Figure 3.
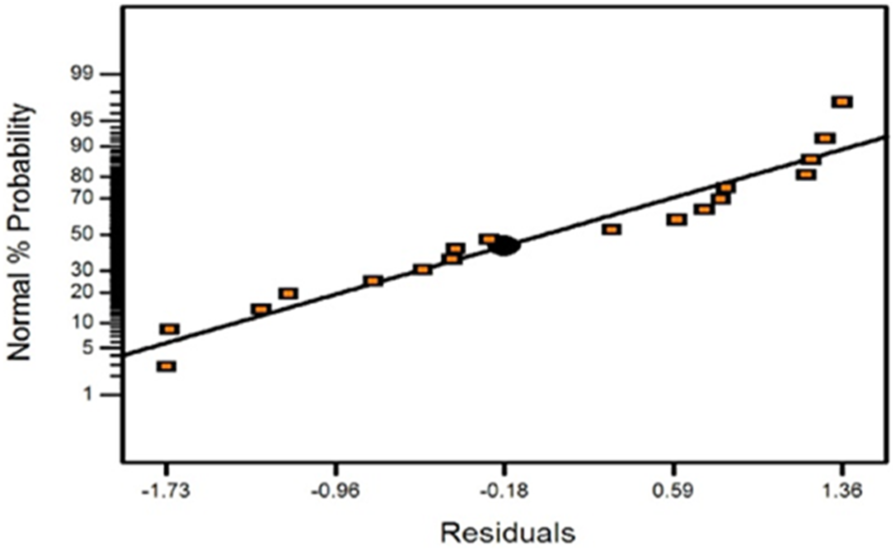
Normal probability plot of residuals.
The closeness of the points to the line of normal probability renders the model adequate. Figure 4 showing the predicted vs. actual tensile strength of the model can also be used to support this proposition. Data points are quite close to the main central line.
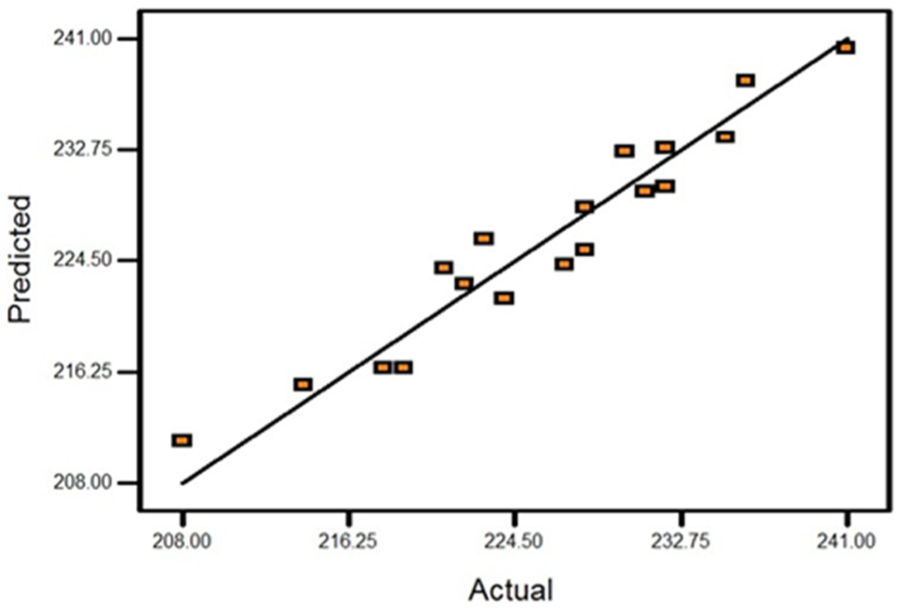
Predicted vs. actual plot of tensile strength.
Effect of process parameters on tensile strength
Influence of tool shoulder diameter
From Figures 5 and 6(a)–(c), it can be inferred that as the tool shoulder diameter increases, the tensile strength of the joint is found to decrease. A reduction in tensile strength with larger tool shoulder can be attributed to the fact that with tool shoulders of higher dimensions, the heat input in the weld increases, which causes dissolution or coarsening of the strengthening precipitates, leading to reduction in tensile strength. A smaller tool shoulder, 17 mm in our case, seems to produce adequate heating and consolidation of the material without deterioration of mechanical properties of the joint.
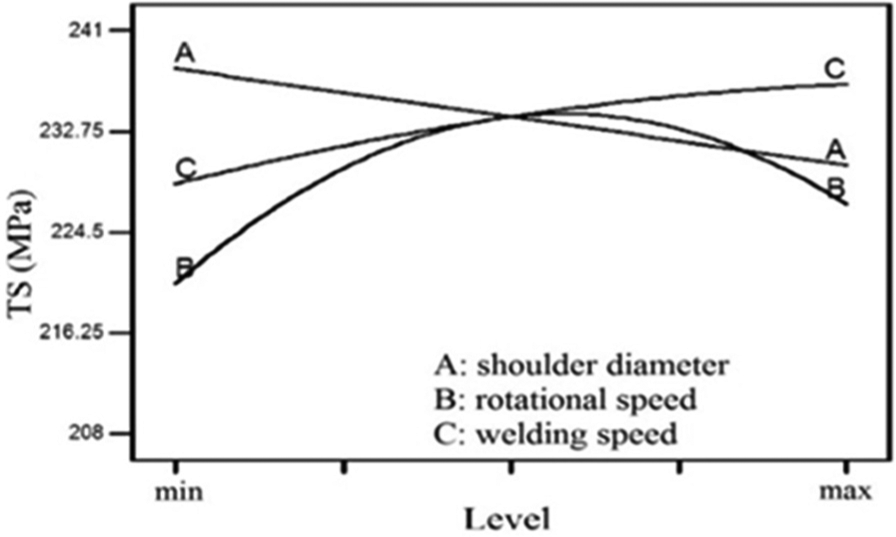
Main effects plot of input parameters.
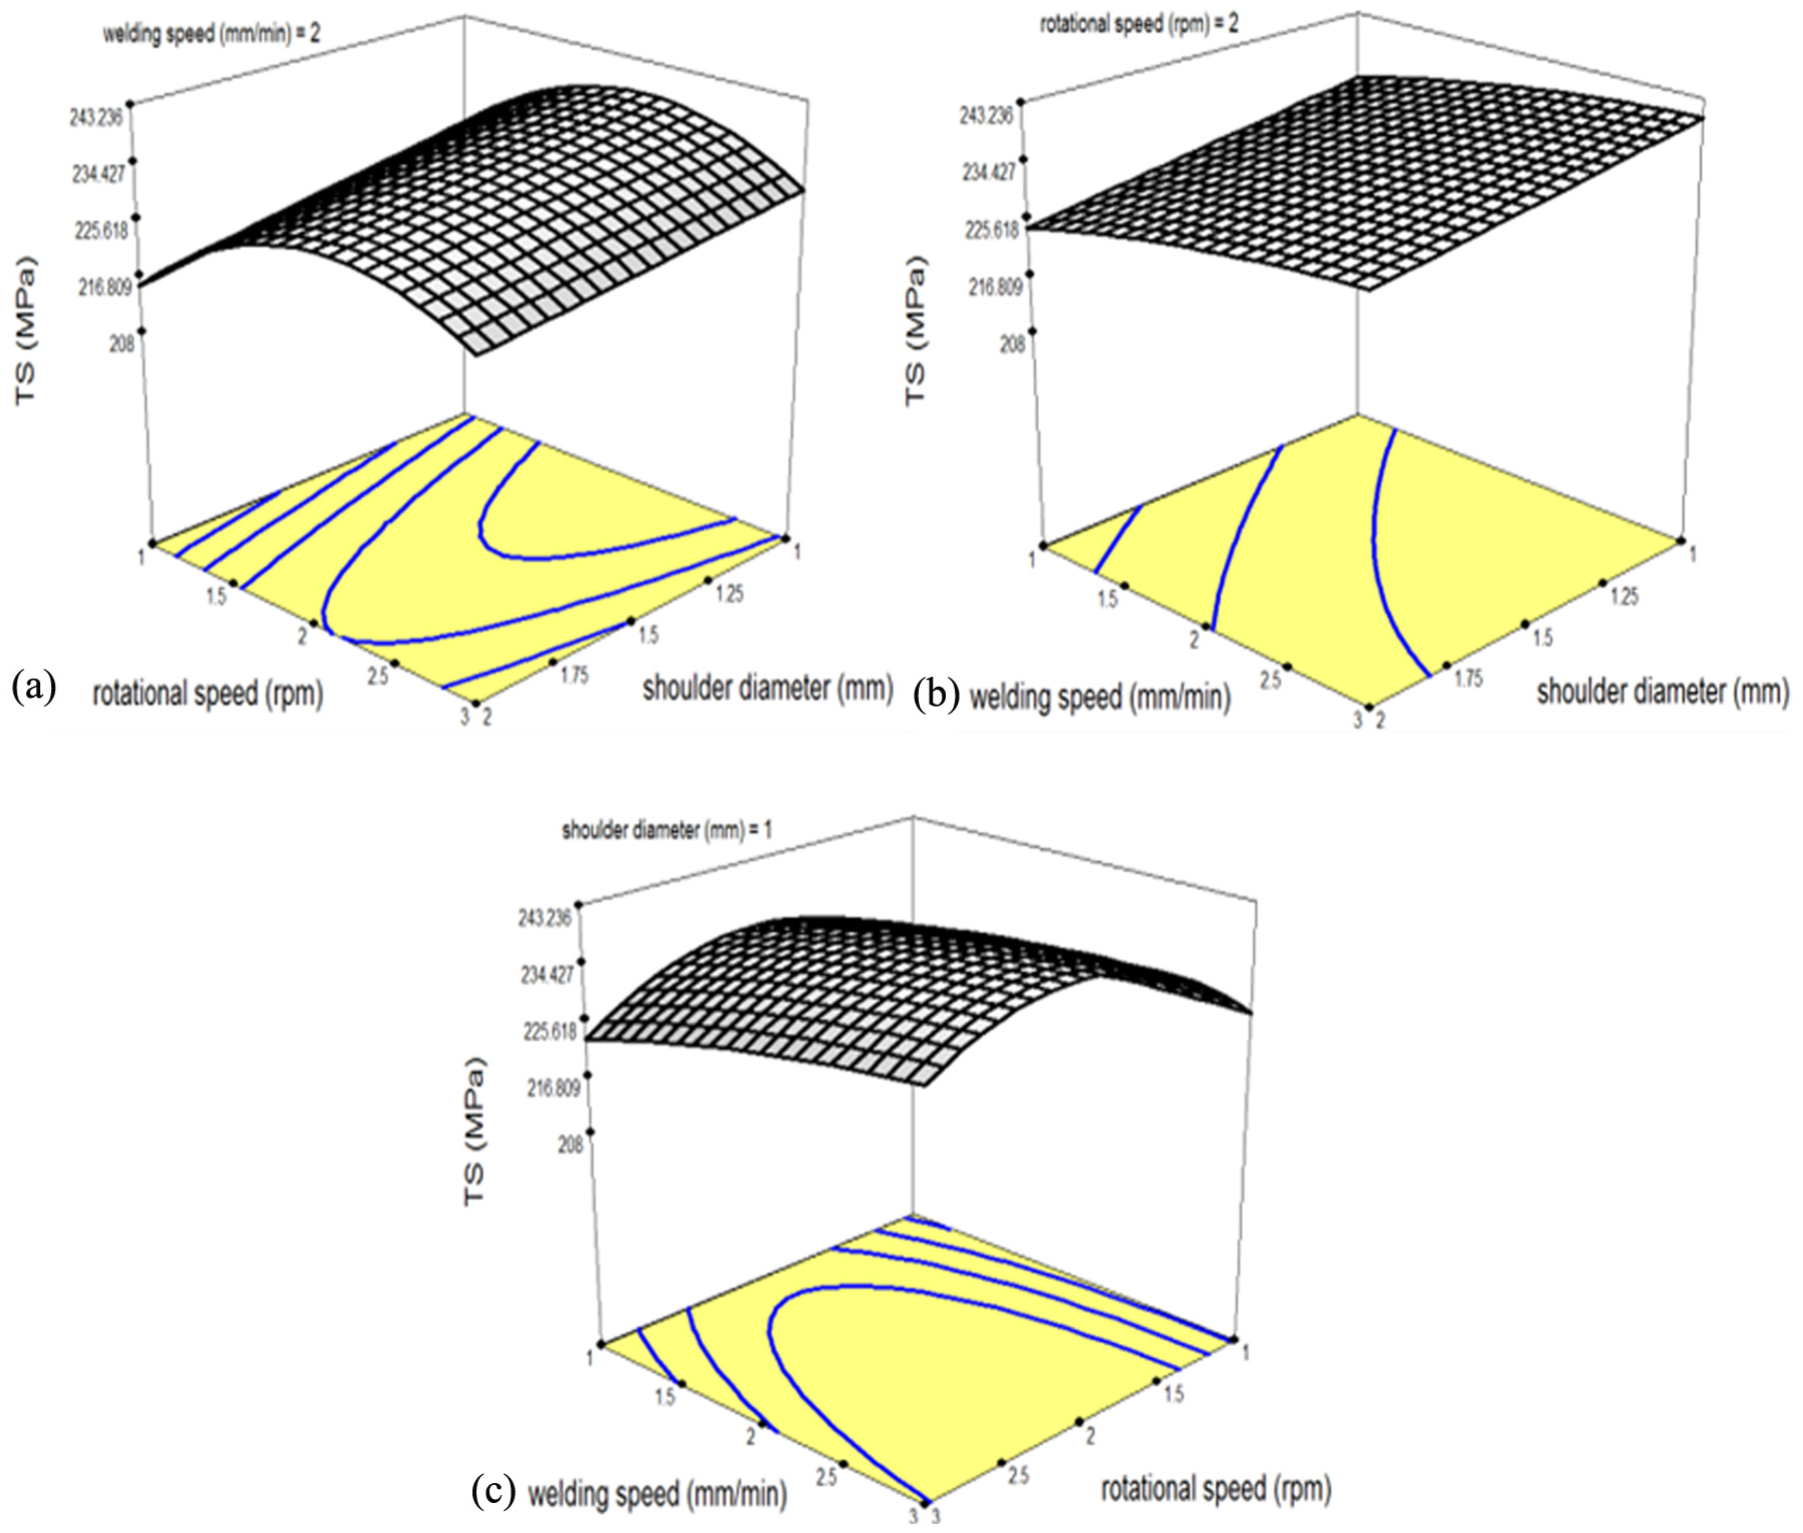
Response surface graphs of (a) rotational speed and shoulder diameter, (b) welding speed and shoulder diameter, and (c) welding speed and rotational speed.
Influence of tool rotational speed
At a fixed tool shoulder diameter or welding speed, increasing the tool rotational speed produces an enhancement in tensile properties of the welds up to a maximum, followed by a decreasing trend as evident in Figures 5 and 6(a)–(c). The rotational speed causes the frictional heating and plastic deformation of the material resulting in mixing and stirring of the material around the pin. At lower rotational speeds, insufficient mixing between the AS and RS might have occurred due to low heat generation and inadequate plastic deformation, culminating in inferior tensile strength. On the other hand, at high rotational speeds, abundant heat produced is the dominating aspect leading to turbulent material flow and localized softening. 19 The excessive heat might also have caused dissolution and coarsening of the precipitates leading to reduction in tensile strength. 13 Welds made with tool rotational speeds in the proximity of 900 r/min tend to have better mechanical properties due to enough heat generation required for adequate softening and mixing of the deformed material.
Influence of welding speed
An increase in welding speed has a tendency to refine the strength of the joint (refer Figures 5 and 6). At lower levels of welding speed, heat generated is high, endangering growth and dissolution of strengthening precipitates in the weld zone. As the welding speed is increased, the influence of thermal cycles reduces, thus enhancing the tensile strength hindering grain growth and precipitate dissolution.
Optimization of welding parameters
In the present investigation, for the chosen dimensions of the base material, a maximum tensile strength of 241 MPa at experimental run no. 12 is obtained. This corresponds to 79% strength of the BM, which was achieved by setting the tool rotational speed to 900 r/min (Level 2), the welding speed to 80 mm/min (Level 3), using a tool shoulder of 17 mm (Level 1). Considering the above-mentioned parameter setting, a conventional FSW run in the air was carried out, wherein a tensile strength of 215 MPa was achieved. Thus, an increment of 10.7% in tensile strength was attained by changing the welding medium from air to water.
Very low peak temperature is observed in UFSW compared to the FSW due to a high heat absorption capacity of water as compared to air. Furthermore, greater heating and cooling rates are also obtained during UFSW leading to shorter dwelling time above a given temperature which also leads to a low peak temperature in UFSW.20,21 The reduced temperature and less thermal gradient due to water cooling limit the coarsening and dissolution of strengthening precipitates leading to improved joint properties. This might be the reason for strength improvement in the optimal UFSWed joint as compared to the conventional FSWed joint.20,21
Temperature distribution in UFSWed welds
For a thorough investigation of the FSW process, comprehensive information of the heat generation and temperature distribution across the different zones of the FSW is vital. The degree of modification in mechanical properties and microstructure during FSW process is dependent upon the temperature history, which is governed by welding parameters used, and the thermal boundary conditions evolved during the welding. 22
The thermal cycle curves of welds formed during UFSW are shown in Figure 7. Figure 7(a) represents the temperature developed in the entire duration of welding. Nearly after 60 s, the tool lies in the vicinity of the test area, where a visible increase in temperature can be observed. As the welding tool passes by the thermocouple T1 and T4, the temperature at this point reaches to 119 °C on the AS. As soon as the tool moves away from the test area, a gradual decrease in temperature is observed, since the rate of cooling exceeds the heat input rate just after the tool passes the thermocouples. This happens because of the substantial decrease in rate of heat input due to the following two reasons. First, the increase in distance for heat conduction after the tool passes the thermocouples. Second, decrease in the temperature gap between the heat source and the thermocouple is more when the tool is advancing toward the thermocouple as compared to the temperature gap when tool is moving away from the thermocouple. Both of these factors contribute to the decrease in temperature gradient. Since heat input rate is directly proportional to the temperature gradient, decrease in the temperature gradient results in lower heat input rate after the tool passes the thermocouples.
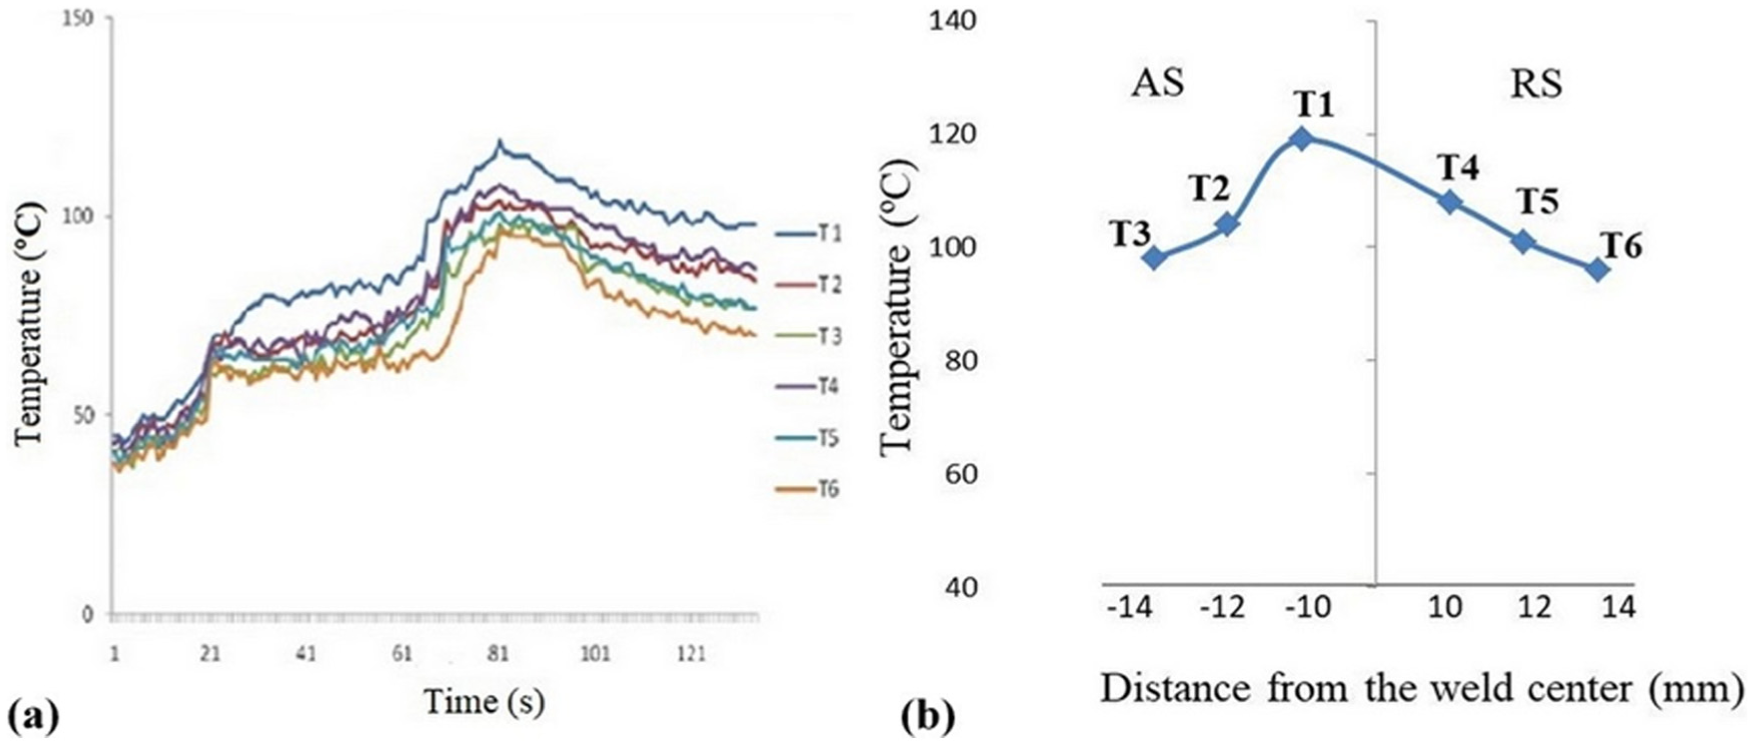
The thermal cycle curves of welds formed during UFSW: (a) temperature rise in AS and RS of the weld for experiment no. 12 and (b) temperature distribution across the width of the weld for experiment no. 12.
The peak temperature developed during UFSW in transverse direction was also compared as shown in Figure 7(b). The distribution of temperature during UFSW showed similar variation with distance away from the weld center both on AS and RS. The maximum temperature measured during UFSW was 119 °C (T1) on the AS closest to the weld center. Furthermore, a noticeable variation in temperature was also observed in the AS/RS. The temperature on AS was found to be higher in comparison to RS, as the AS experiences a greater deformation due to greater relative tool velocity. Higher degree of plastic deformation prompted greater heat input which is accountable for higher temperature on AS. It is vastly believed that reduction in temperature and thermal gradient generally limits the coarsening of precipitates and causes improvement in mechanical properties in FSW. 20
Macrostructure/microstructure evolved during UFSW
Typical macrostructure and microstructures of the BM and the various zones identified using optical microscopy are presented in Figure 8(a) and (b). Due to high heat and intense, deformation experienced during FSW/UFSW development of different texture and precipitate dissolution and coarsening in different zones takes place. Three distinct zones—namely, stir zone (SZ), TMAZ, and HAZ—are visible from the macrostructure. A sharp distinct boundary is clearly seen separating the SZ from TMAZ/HAZ. From the microstructure, it can be concluded that there is a noticeable variation in grain sizes of different zones. The BM consists of non-deformed elongated grains in the rolling direction. Typically, a dynamically recrystallized structure comprising of significantly fine and equiaxed grains was observed in SZ. The reason for the formation of a new set of fine grains in the SZ is due to intense plastic deformation caused by tool stirring and the heat generation due to tool rubbing that promotes the recrystallization process in the SZ. 23 TMAZ region is characterized by upward-oriented highly distorted grains of non-uniform size. The grains in TMAZ are visibly coarser than SZ due to insufficient heat and plastic deformation. 24 The adjacent HAZ experiences only thermal cycles and no deformation takes place. 21 Under-formed coarse grains similar to BM oriented in rolling direction are observed in HAZ. Furthermore, as the temperature experienced at the AS was greater than the RS, the grains were visibly larger in size at the AS as compared to RS due to high heat input present at the AS.
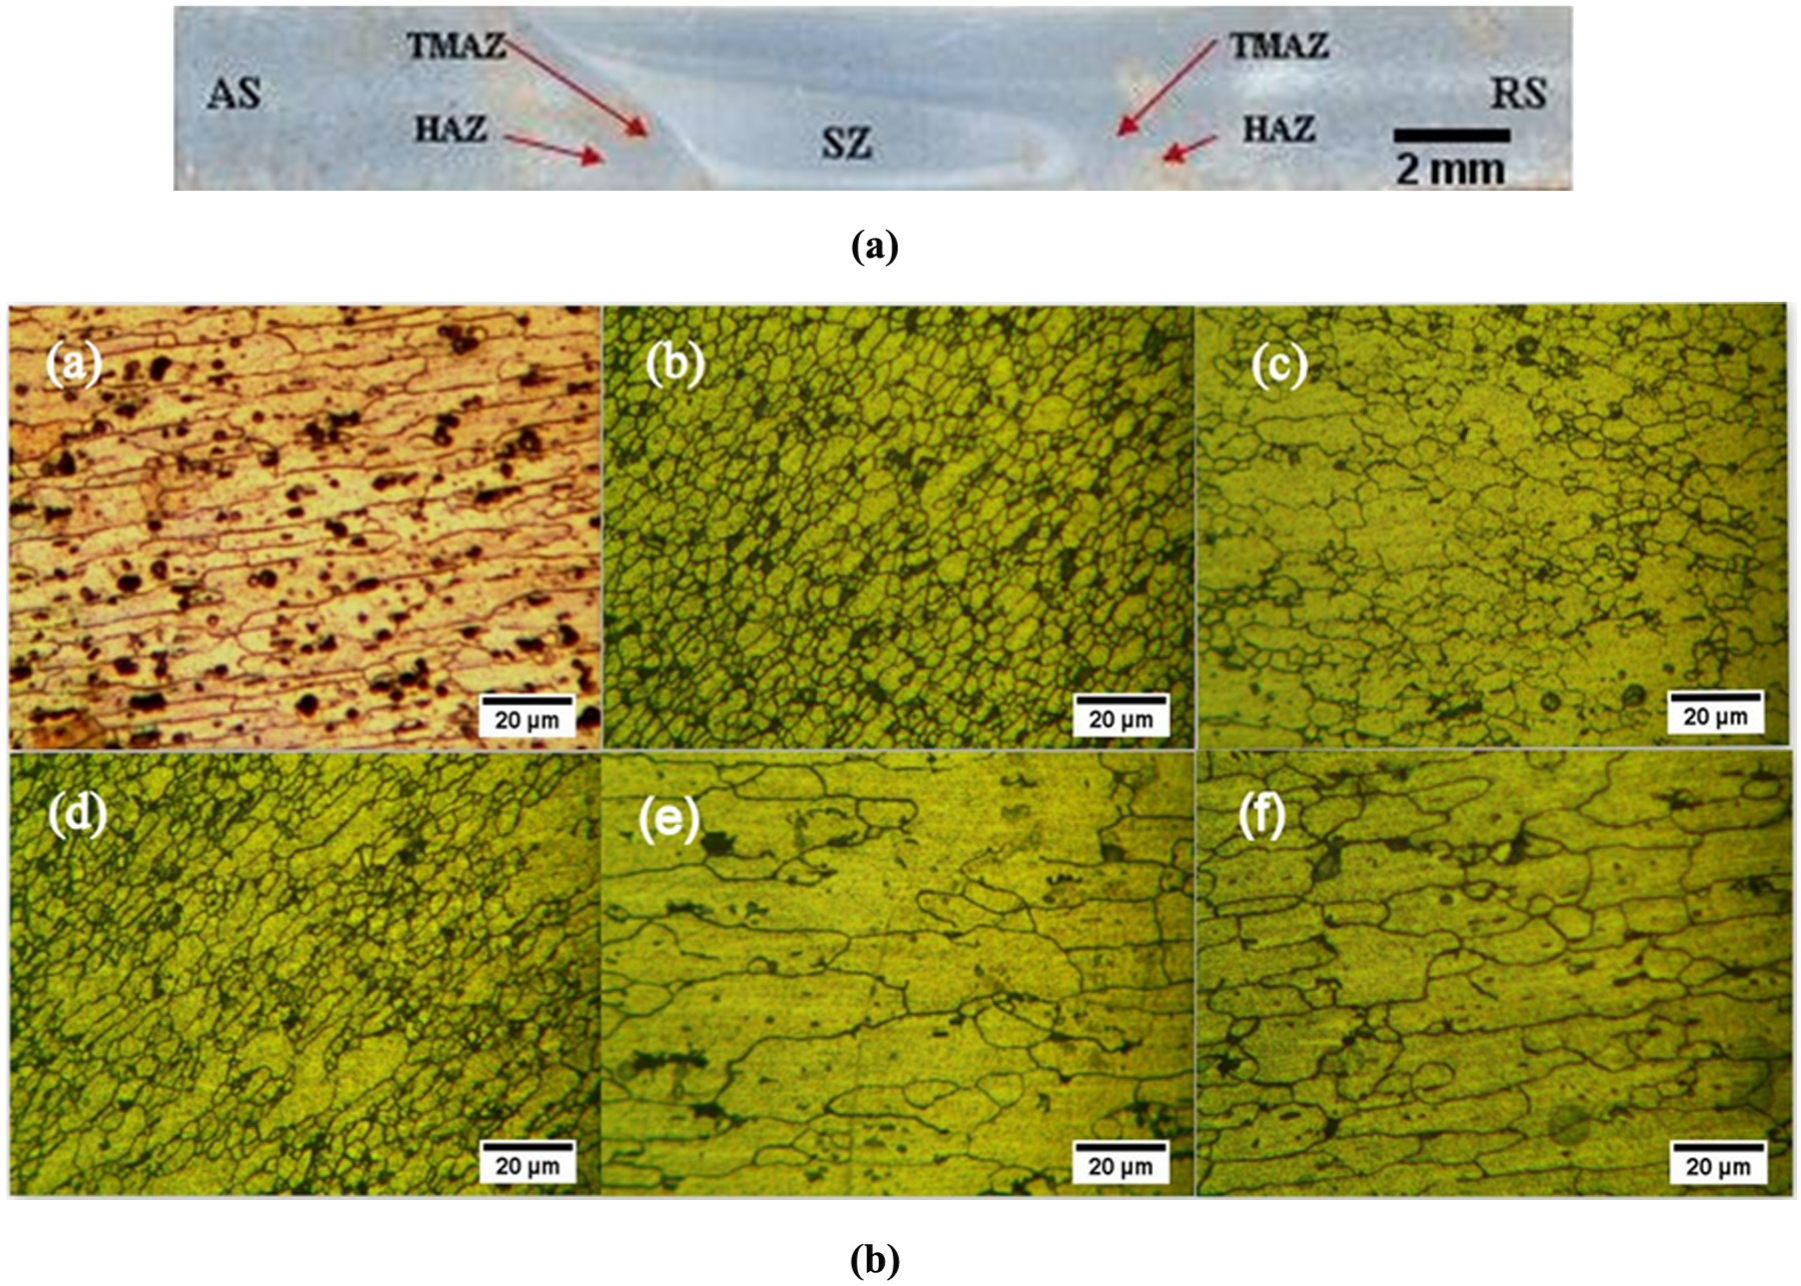
Macrostructure and microstructure of different zones for experiment no. 12: (a) the macrostructure of different zones for experiment no. 12 and (b) the microstructure of different zones for experiment no. 12: (A) BM, (B) SZ, (C) TMAZ-AS, (D) TMAZ-RS, (E) HAZ-AS, and (F) HAZ-RS.
The SEM micrographs show the precipitate distribution in different zones of the welded joint (Figure 9). For HTAAs, strength of welded joint largely depends on the distribution and size of the strengthening precipitates rather than the grain size. A large number of small-sized precipitates were observed in the SEM micrograph of the SZ compared with that of TMAZ and HAZ. Grain refinement and presence of precipitates enhance the strength of SZ. The precipitates are fragmented into a smaller size in SZ due to intensive heat and severe plastic deformation. Grain coarsening and dissolution of precipitates was observed in TMAZ and HAZ.
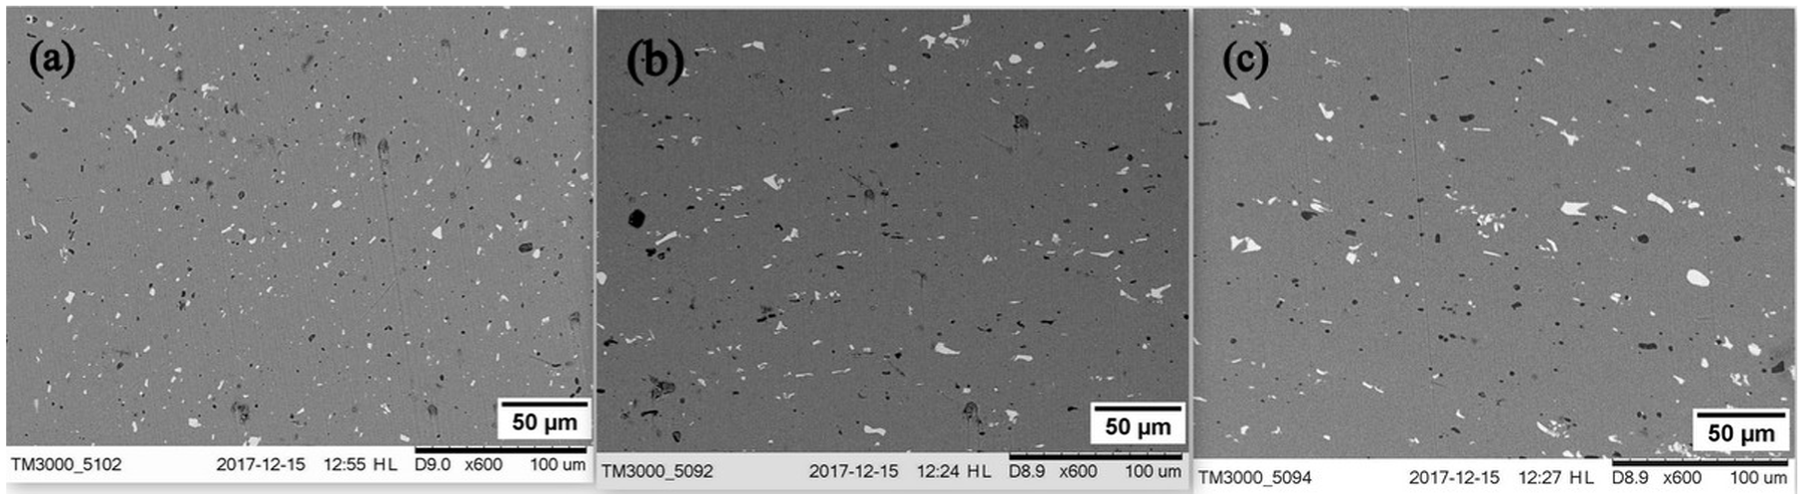
SEM images for experiment no. 12: (a) SZ, (b) TMAZ, and (c) HAZ.
Microhardness
In HTAAs, FSW generally creates a soften area in the weld region. This is due to coarsening and dissolution of strengthening precipitates during FSW/UFSW. 21 The microhardness distributions of the joints of AA6082 showed that the softening region is created in UFSW joints. A characteristic “W” type hardness profile was obtained as observed generally in precipitation-hardened AAs (Figure 10). It was observed that the microhardness in AS (62–83 HV) is less than that in RS (68–86 HV), which can be attributed to high heat input on AS. A maximum hardness of 85 HV was recorded in SZ of RS, which was less than the average microhardness (110 HV) of the BM. A noticeable reduction in microhardness of TMAZ/HAZ as compared to SZ was also observed. From the microstructure analysis, it was inferred that SZ exhibits fine grains and precipitates. The fine grains composed of numerous grain boundaries offer resistance to the motion of dislocations during indentation or loading. Therefore, the SZ exhibits higher microhardness than the TMAZ. The grains in the TMAZ/HAZ underwent grain growth (coarsening). Because of a coarse boundary, the availability of the grain boundaries is very low and so it offers less resistance to dislocation motion. Thus, the grain boundary strengthening in the TMAZ/HAZ is low, leading to the lower hardness. Also dissolution of strengthening precipitates might be the reason for lower hardness in TMAZ/HAZ. Similar results were also observed by following researchers.22,25,26
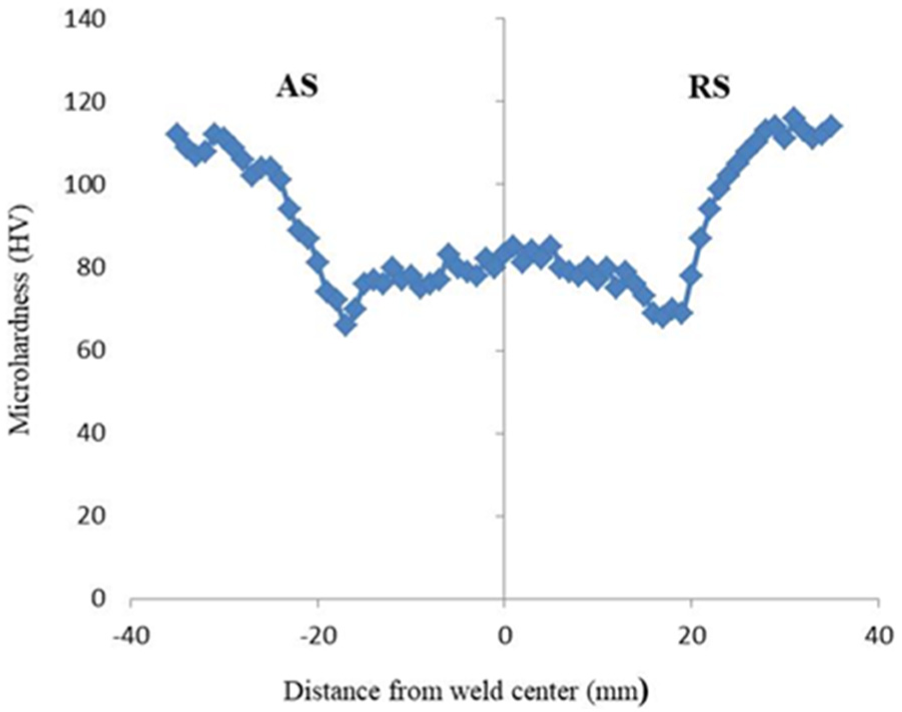
Microhardness variation along the weld for experiment no. 12.
Fracture surface analysis
The fracture position of any welded joint denotes the weakest part of the joint. For a defect-free joint, fracture locations are a measure of hardness distribution. 27 In the present study, the tensile sample fracture took place in the TMAZ/HAZ at the AS of the weld corresponding to the minimum hardness location. The fractograph (Figure 11) of the joints showed mixed-type fracture consisting of ductile fracture feature and grain boundary segregation. Finely populated dimples with no voids were observed, which shows defect-free joint with a normal fracture.
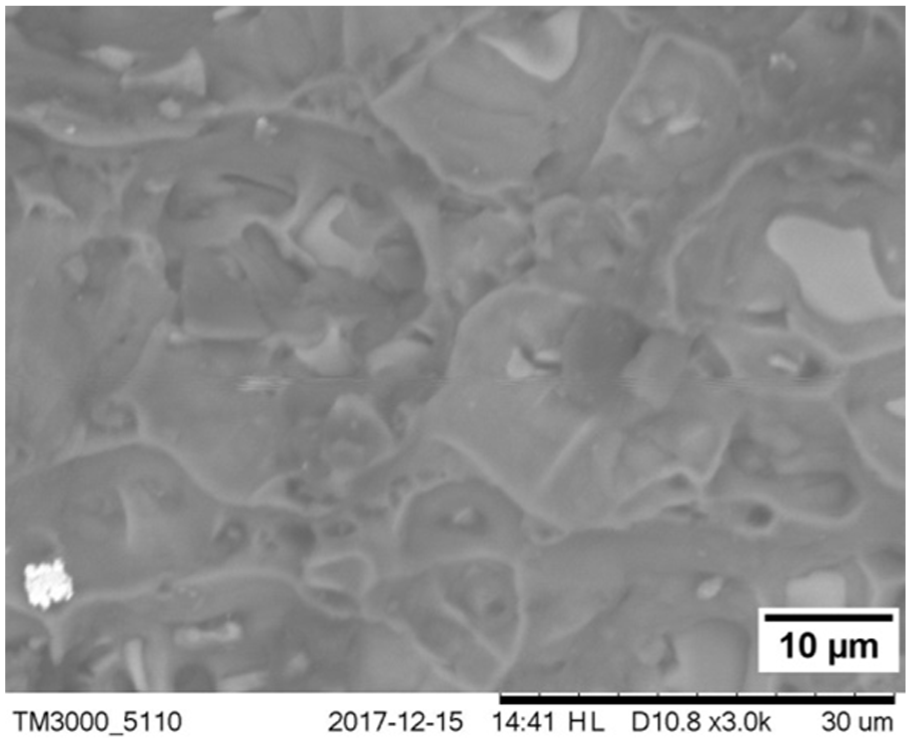
Fractograph of the tensile sample of experiment no. 12.
Conclusion
The study on UFSW of AA6082 can be summarized as follows:
A factorial-based study was successfully used to establish a relationship between the tensile strength of the welded joints and the process parameters in the form of a second-order polynomial regression equation.
Among the significant parameters identified, the second-order term of rotational speed, that is, ω2, was the most influential. Tool shoulder diameter, welding speed, and tool rotational speed were also recognized to have a pivotal role in determining the behavior of the welding process.
The optimum value of tensile strength of the welded samples was 241 MPa, which is equivalent to 0.79 times the tensile strength of the base material. When compared to welds made in FSW at these optimum conditions, a 10% increase in tensile strength was realized.
The low peak temperature and less thermal gradient due to water cooling limit the coarsening and dissolution of strengthening precipitates. This might be the reason for the strength improvement in the optimal UFSWed joint as compared to the conventional FSWed joint.
The distribution of temperature during UFSW showed similar variation with distance away from the weld center both on AS and RS. The maximum temperature measured during UFSW was 119 °C on the AS closest to the weld center. Moreover, the temperature on AS was found to be higher in comparison to RS, as the AS experiences a greater deformation than RS in FSW.
The precipitates are fragmented into a smaller size in SZ due to intensive heat and severe plastic deformation. Grain coarsening and dissolution of precipitates was observed in TMAZ and HAZ.
Finely populated dimples with no voids were observed, which shows defect-free joint with a normal fracture.
Footnotes
Appendix 1
Declaration of conflicting interests
The author(s) declared no potential conflicts of interest with respect to the research, authorship, and/or publication of this article.
Funding
The author(s) received no financial support for the research, authorship, and/or publication of this article.