
Abstract
Evaluating whether a newly configured product can satisfy the customers’ individual requirements or not is crucially important for the modular configuration design. Product performance prediction at the end of the configuration process can estimate the performance parameter values through the soft computing method instead of practical test experiments, which enables fast and accurate evaluation of configuration schemes. In this article, we propose a novel prediction approach based on the integration of grey relational analysis and support vector machine through discovering the knowledge from the historical configuration information. The implementation process of the prediction is established, and the procedure in applying the prediction to the configuration design is presented. There are three key steps to achieve performance prediction. First, the module parameters that affect the performance need to be reduced using the grey relational analysis method and then a module parameter reduction is generated. Second, the relationship between the reduced module parameters and the performance parameter is mined from the limited existing product data. A support vector machine model used for regression prediction is constituted. Third, when the values of the module parameter reduction are determined, the performance value of a newly configured product can be predicted by means of the support vector machine model. This methodology can ensure the performance prediction executed in a short period of time with a high degree of precision, even under the small-sample conditions. A design case of the plate electrostatic precipitator is studied to illustrate and demonstrate the feasibility of the proposed method.
Keywords
Introduction
In today’s changing and competitive market, mass customization is widely used in firms with the advantage of both high production efficiency and a variety of product variants to meet the challenge for increasingly individualized requirements. 1 Product configuration design, as a technology of assembling various components or modules into a valid product, is regarded as a key enabling technology for implementing mass customization.2,3 Given a collection of predefined modular components with standard interfaces, product configuration is a process of selecting suitable and compatible modules for a product and evaluating the compatibility of selection and goal satisfaction. 4 The newly configured product variants should obey a set of constraints and satisfy a set of requirements. Generally, functions and performance of a product are always aspects that customers are concerned about, and they are considered as important criteria in comparing different configuration options. According to this viewpoint, the customers’ requirements can be classified into two types: the functional requirements and the performance requirements. Since the configuration design activity is driven by functions, the developed products can naturally meet the functional requirements. The performance requirements are represented as qualitative or quantitative descriptions of the requirements of the level or quantity relating to some functions. 5 The values of the performance parameters corresponding to the performance requirements have a straightforward impact upon the customers’ purchase activities. Different needs of customers result in different product variants with diverse performance values by choosing various modules. Therefore, in order to speed up the response of product configuration design to the individual requirements, it is necessary to estimate the values of the performance parameters of the newly configured product in advance and evaluate whether it can satisfy the customers’ performance requirements or not. 6 The traditional experimental way to measure the performance values increases the cost and delay delivery period that may lead to loss of market share. In other words, real time and low cost are very important for acquiring the performance values.
Product performance prediction in configuration design, namely, configuration performance prediction, emerges as the times require, which helps to achieve fast and accurate performance estimation and scheme evaluation. The modular product family is the foundation of configuration design. Through discovering the knowledge from the historical modular configuration information, the prediction model can be set up using the soft computing method instead of practical test experiments. Soft computing is an approach to computing, which parallels the remarkable ability of the human mind to reason and is tolerant of imprecision, uncertainty and partial truth. It does not suffer from the brittleness and inflexibility of standard algorithmic approaches as well as the high cost and long duration of practical experiments.7,8 The prediction model can be used to predict the performance parameter values for the new products, which are helpful to decrease the cost and cut down the configuration design time. 6 In addition, the configuration performance prediction can effectively combine the requirement configuration with the engineering configuration. The configuration performance prediction is of great importance to the practical configuration design.
Recently, a number of studies on product configuration have been conducted, ranging from configuration modelling,9–11 configuration solving12,13 to configuration optimizing technology.4,14,15 However, researchers have paid little attention to mapping relations from configuration parameters to product performance parameters and configuration performance prediction. At present, there are only a small number of researches on this topic, which may attract more interests in the near future. Wang et al. 16 proposed an approach to predict configuration performance based on the least square approximation. In their study, the fuzzy values of the configuration performances were determined, which depend on three matrices: the weight matrix between the performance parameters, the structure matrix between the modular instance and the performance parameters, and the mapping matrix between the customers’ requirements and the performance parameters. The relation between the fuzzy values and the true values was fitted using the least square approximation. When a new configuration scheme is developed, the three matrices need to be rebuilt to obtain the new fuzzy performance values, and the new prediction results can be calculated based on the fitting curve. This model could realize the predictability of the configuration design. However, the prediction process is very complex because that the three matrices must be re-computed for each new configuration variant and the historical configuration information is difficult to reuse. Jia et al.17,18 studied on the characteristic forecasting method of assembled products based on multiple-part geometric elements. The law of influence on product performances by geometric elements was acquired. They established two prediction models one after another: a simplified forecasting model of the multilayer perceptron (MLP) network trained by the back propagation (BP) algorithm 17 and a combined prediction model of a hybrid neural network based on the MLP neural network and the radial basis function (RBF) neural network. 18 Their researches focus on the relationship between geometric parameters and product performances that provide valuable references for configuration performance predicting. Wang et al. 19 proposed an approach to predicting newly configured product variants based on the integration of rough set and neural networks for the modular product family. The minimal attribute reduction was introduced first and then the rough set method was adopted to perform the approximate reduction of the condition attributes. They used the MLP neural network to constitute a regression prediction model. Due to the problem of poor generalization ability of the MLP neural network, Zhu et al. 6 conducted further research on the basis of the study by Wang et al. 19 In their study, a genetic algorithm (GA) was designed to perform the approximate reduction of the condition attributes, and a neural network ensemble model used for regression prediction was constituted by meansof thevariant bagging method based on error clustering. This model can obtain better prediction results than that of the former. Ai et al. 20 put forward a rapid design method based on the integration of multidisciplinary collaborative configuration and performance simulation. In their work, the product performance prediction is achieved by simulation of Modelica language–based multi-domain simulation model that is established automatically by mapping transform. This method can provide a visualization of simulation and analysis, which makes the customers directly understand the changes of product performances. At the same time, the simulation models of domains are complex to construct, and the communications of these models under different software platforms are difficult to realize.
The aforementioned configuration performance prediction strategies have been developed using three main methods: mathematical modelling based on the physics of the process, 16 soft computing techniques,6,17–19 and simulation modelling and analysis. 20 These methods have their own advantages and disadvantages in predicting product performances, but the second one is much better in relative terms. Usually, neural network modelling has been adopted for configuration performance prediction, and the most popular two neural networks, MLP neural networks and RBF neural networks, have been used widely. Compared to MLP neural networks, RBF neural networks can be trained faster although requiring more training data. In general, the accuracy of prediction by the trained neural network is not very good, and the need of carrying more experiments for training the network is indispensable. Meanwhile, there are several inherent drawbacks of neural networks such as slow convergence speed, less generalizing performance, arriving at a local minimum and over-fitting problems. 21 The applicability of a particular soft computing technique is dependent on the amount of data/information available, training time required and other requirements the prediction needed. If enough training data are available and the knowledge acquired during the training of the model is explicit, then neural network should be a good selection. However, the historical configuration data of a company are always limited, which are not able to effectively form a characteristic data set needed for the modelling of the neural network. This makes it difficult to obtain stable stability and high prediction accuracy of the network model. Considering the limitation on the number of sample data and inherent noise, this article proposes a new prediction approach that uses small-sized training and testing data sets.
The support vector machine (SVM), proposed by Vapnik, 22 is an important machine learning technique developed on the basis of the structural risk minimization principle in place of the experimental risk minimization principle. The SVM can well solve the practical problems of small sample size, non-linearity, high dimensions and local minimal value, and its generalizing performance is obviously superior to that of the traditional learning methods. Recently, it has been widely used to solve non-linear regression estimation and time series prediction in various fields.23–26 In this article, taking advantage of the features of the SVM (small-sample learning and better generalizing performance), we try to mine the non-linear relations between the module parameters and the product performances and to predict the performance values of the newly configured products. However, there are commonly so many module parameters that the SVM prediction models become complex, leading to increase in learning/training time and reduction of convergence speed. To solve the problem, the grey relational analysis (GRA) approach is considered to compute the relational degree between each module parameter and a certain performance parameter and to determine several dominant module parameters that impact on the performance significantly. Then, a simple SVM model can be constituted based on these reduced parameters. Above all, in this article, we propose a novel prediction approach on the basis of GRA and SVM. The predicted performance values for the new configuration can be directly obtained. The credibility of the prediction results is significantly increased because the data used for model training are all the objective configuration information. The method can ensure the performance prediction executed in a short period of time with a high degree of precision, even under the small-sample conditions. This research provides a new way to quickly and accurately predict the configuration performances.
This article has the following aims: (1) to investigate the feasibility of the SVM model for predicting configuration performances, (2) to explore the relative importance of the factors affecting the prediction by carrying out the GRA method and (3) to compare the performance of the SVM model with that of the neural network models. The rest of this article is organized as follows. In section ‘Methodology for configuration performance predicting’, the formulation of the problem is presented. The implementation process of the prediction is established, and the procedure in applying the prediction to the configuration design is elaborated. In section ‘Reducing the module parameters through GRA’, the module parameters that affect the performance parameter are reduced using GRA and then the module parameter reduction is generated. In section ‘Modelling for configuration performance prediction based on SVM’, the relationship between the module parameter reduction and the performance parameter is mined from the limited existing product data. An SVM model used for regression prediction is then constituted. A design case study is discussed in section ‘Case study’ before conclusions are drawn.
Methodology for configuration performance predicting
Problem formulation
Configuration performance prediction is a form of design activity where the performance values of a configured product are being predicted instead of measured experimentally through analysing the existing modular configuration schemes, thereby achieving rapid response to dynamic customers’ demands and timely adjustments to the design activities of product family.6,19 The prediction aims to estimate the values of the key performance parameters of the product variant in advance and evaluate whether it can satisfy the customers’ individual requirements or not. And the success or failure of the design is determined as a result. The configuration performance prediction changes the traditional mode in which the performance values are experimentally measured after the production of the configured product.
Product family is a group of products with the same or similar functionality. Every product is made up of several modules differentiated by their functions. Functional module is function oriented, which contains several structural modules with the same functionality. Each structural module of a given functional module is considered as a module instance. The functional module may have multiple module instances. The different instances provide the sizes and capabilities that are required by the desired product variety. Let
Suppose that the company has already set up a product family containing o configured products, which can be expressed as
Modular product configuration process considering the performance prediction
In order to achieve the configuration performance prediction, the mapping relationship between the performance parameters of the product family and the module parameters should be established in the first place. Taking
Configuration information table of a modular product family
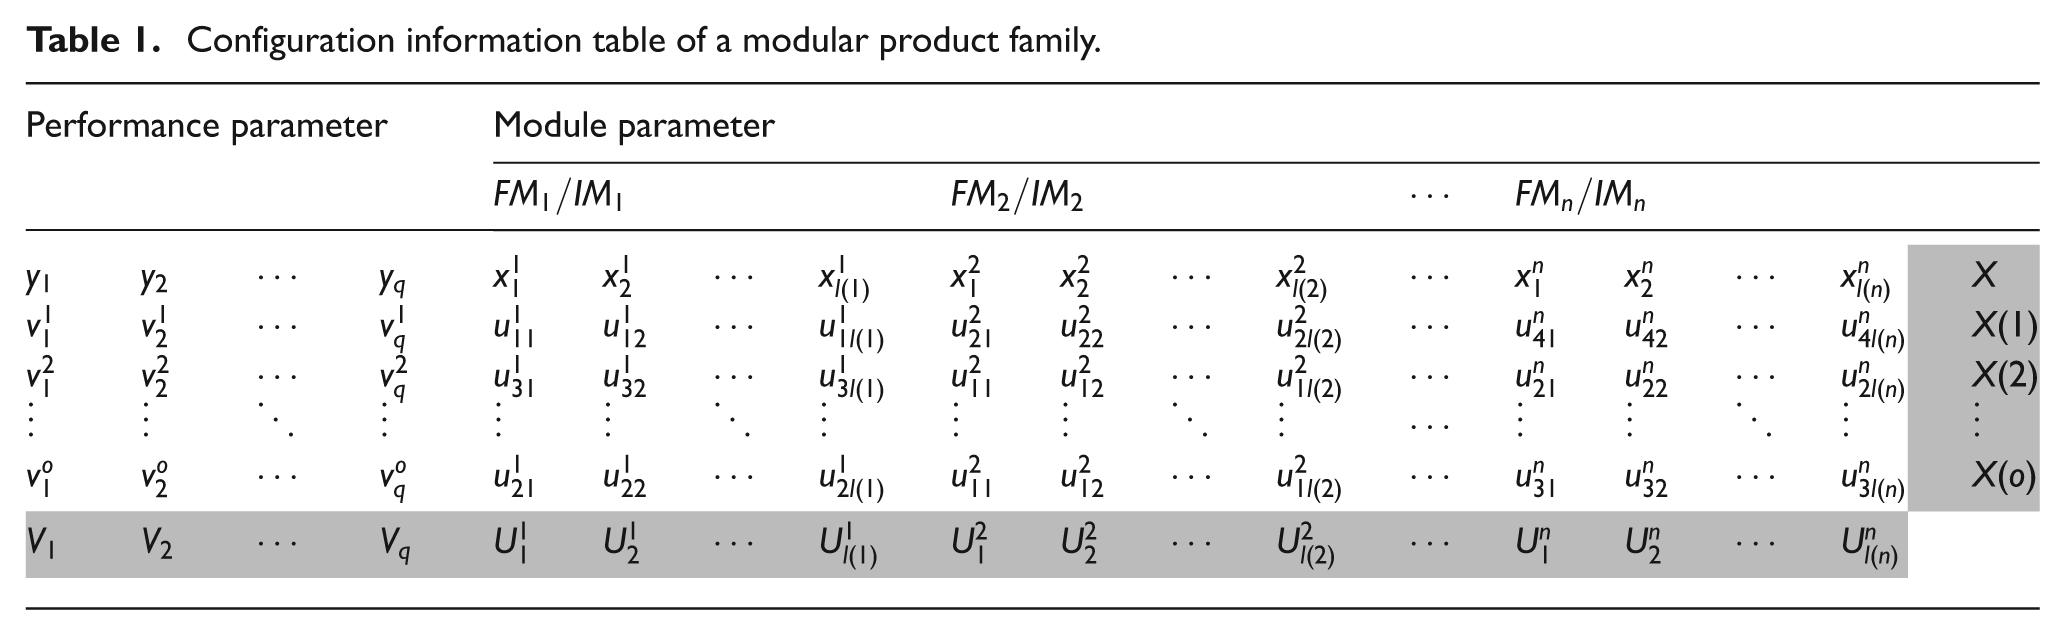
Figure 1 shows the product configuration process on the basis of configuration performance prediction. The process is made up of two big phases, the former is the modelling process of the performance prediction, and the latter is the configuration design process. The task of Phase 1 is to build the prediction model, while the task of Phase 2 is to choose the configuration structure and evaluate its performance. The concrete steps are elaborated below. Steps (1)–(4) belong to the Phase 1, and Steps (5)–(7) belong to the Phase 2.
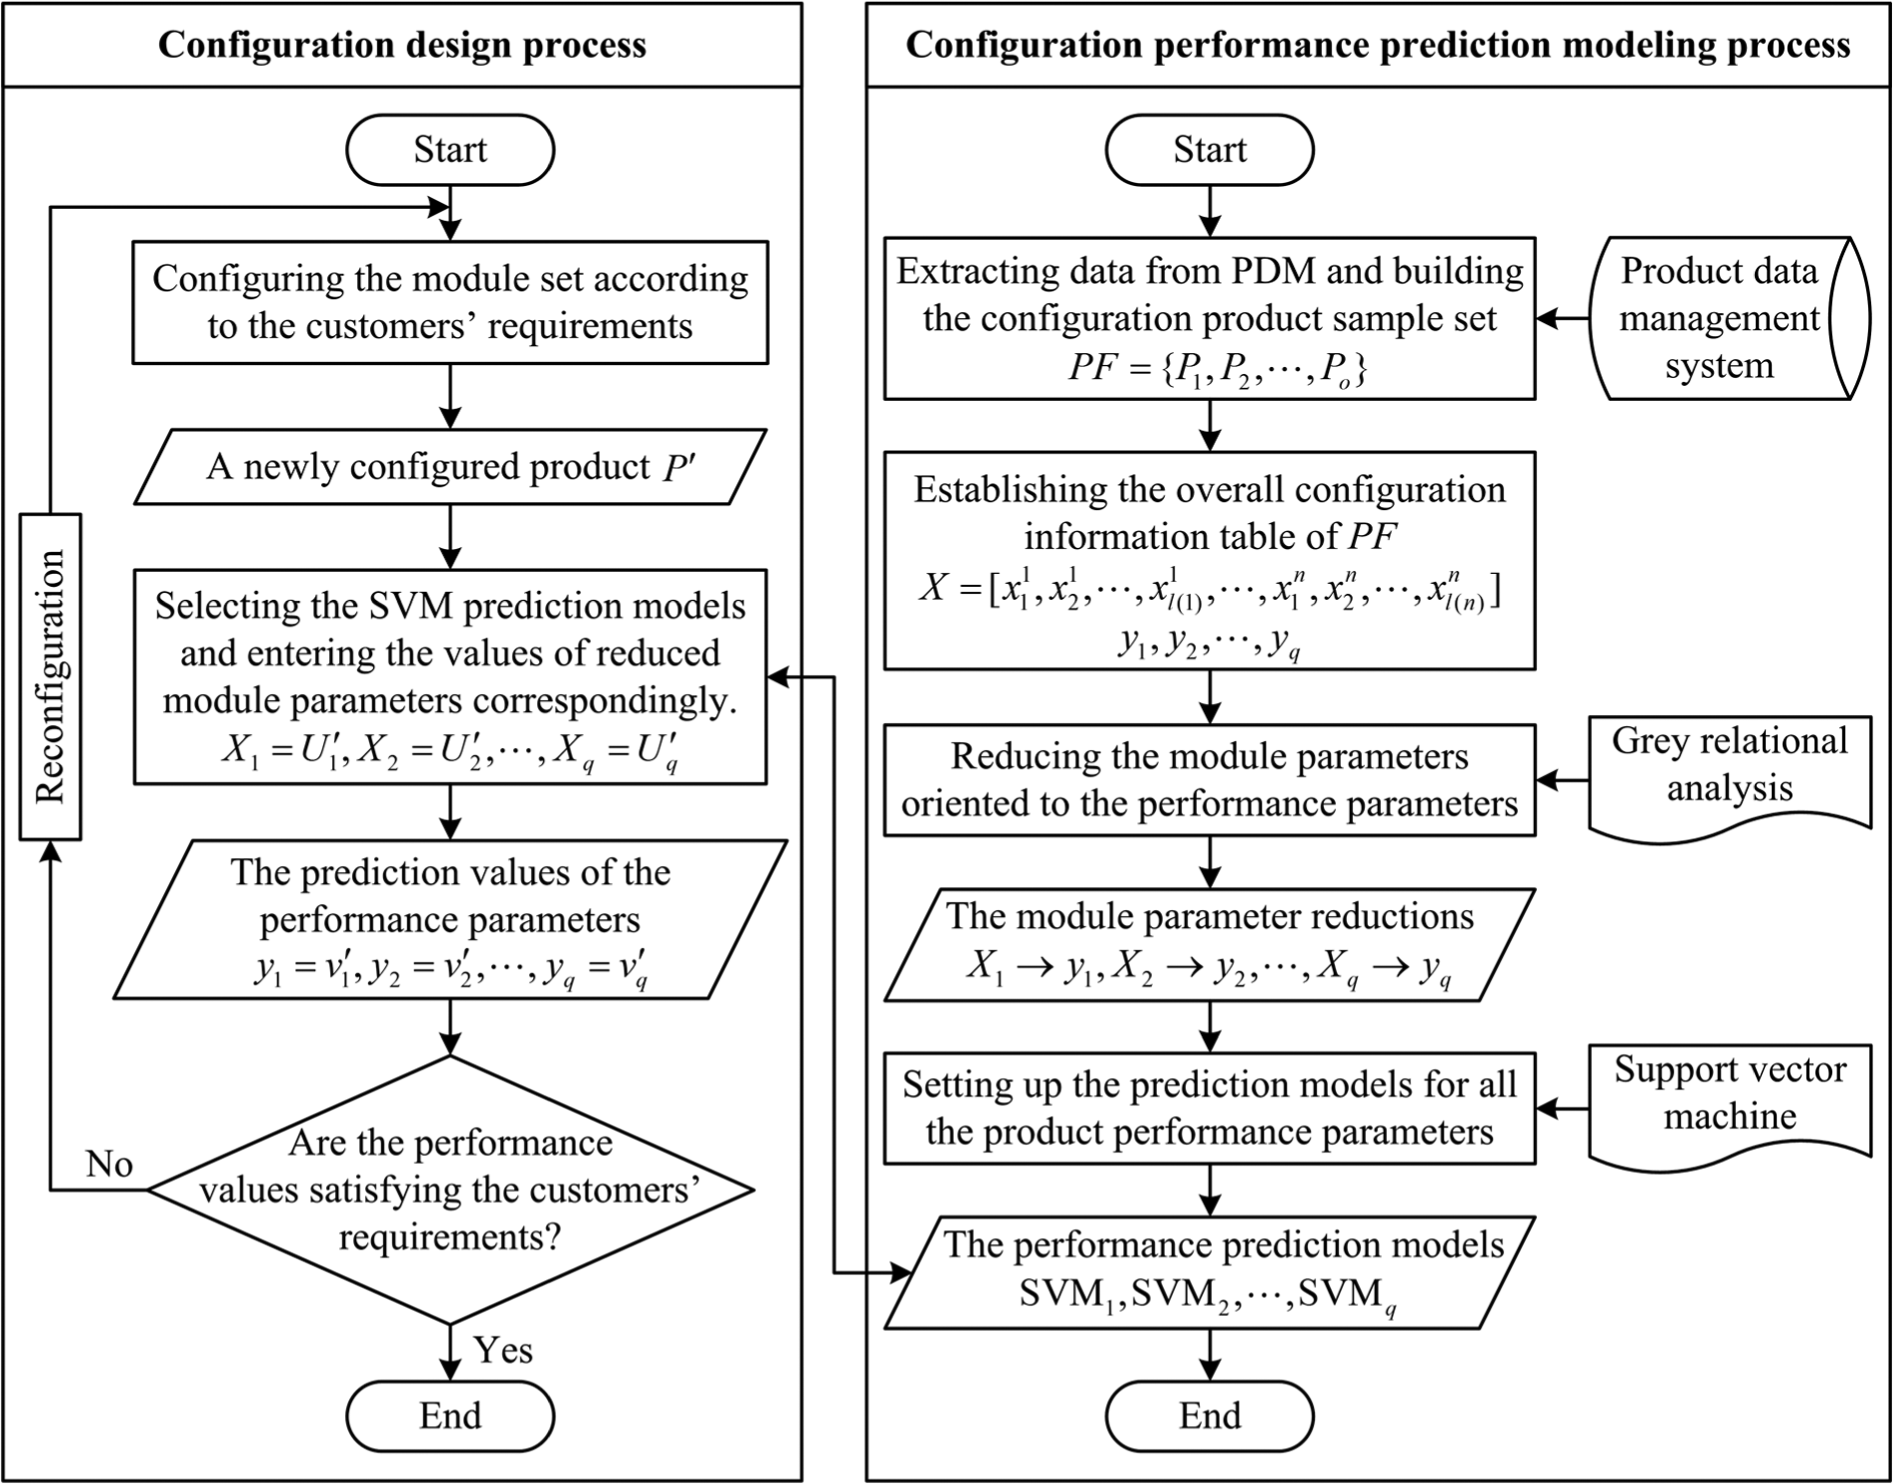
Flowchart of a product configuration process considering the performance prediction.
Extract data from the product data management system of the firm and build a configuration product sample set, denoted as
The overall configuration information table of PF is established by utilizing the historical configuration information. The input is the whole module parameters, that is,
Due to the high number of the elements of X, a reducing operation should be performed. Only the module parameters that have a significant impact on performance deserve attention. Reduce the module parameters oriented to each performance by means of the GRA method and obtain the module parameter reduction
Each configuration information table is used to train an SVM-based prediction model. Finally, we could get q SVM models for all the performances, denoted as
The configuration process proceeds according to the customers’ requirements. A newly configured product variant is developed at last, denoted as
Select the SVM prediction models and enter the values of the corresponding reduced module parameters, that is,
Evaluate whether the performance values are satisfying the customers’ requirements or not. If the evaluation result is satisfactory, this configuration result will be accepted; otherwise, reconfiguration is necessary.
How to build the prediction model is the main concern of this article; it involves three problems: the construction and regularization of configuration information, the reduction of module parameters through GRA and SVM-based prediction modelling.
Reducing the module parameters through GRA
The GRA method was originally developed by Deng 27 and is one of the most popular methods to analyse various relationships among the discrete data sets and make decisions in multiple attribute situations. At present, the GRA has been widely used to solve the uncertainty problems under the discrete data and incomplete information, such as project selection, prediction analysis, performance evaluation and factor effect evaluation. Grey relation refers to the uncertain correlation between two or more factors of a grey system. The GRA uses information from the grey system to dynamically compare each factor quantitatively in order to quantify all influences of various factors and their relation. This process is called the whitening of factor relation. The GRA is based on the level of similarity and variability among all factors to establish their relation. The major advantages of the GRA method are that the results are based on the original data, and the calculations are simple and straightforward.
System characteristics and relevant factors should be determined before the implementation of GRA. In this work, system characteristics are the performances of configured products and relevant factors are the module parameters. The GRA method is used to quantify the grey relation between relevant factors behaviour and characteristics behaviour of the system. A procedure for the GRA, which is appropriate for reducing the module parameters, consists of the following steps.
Step 1. Generate the characteristics behaviour sequence,
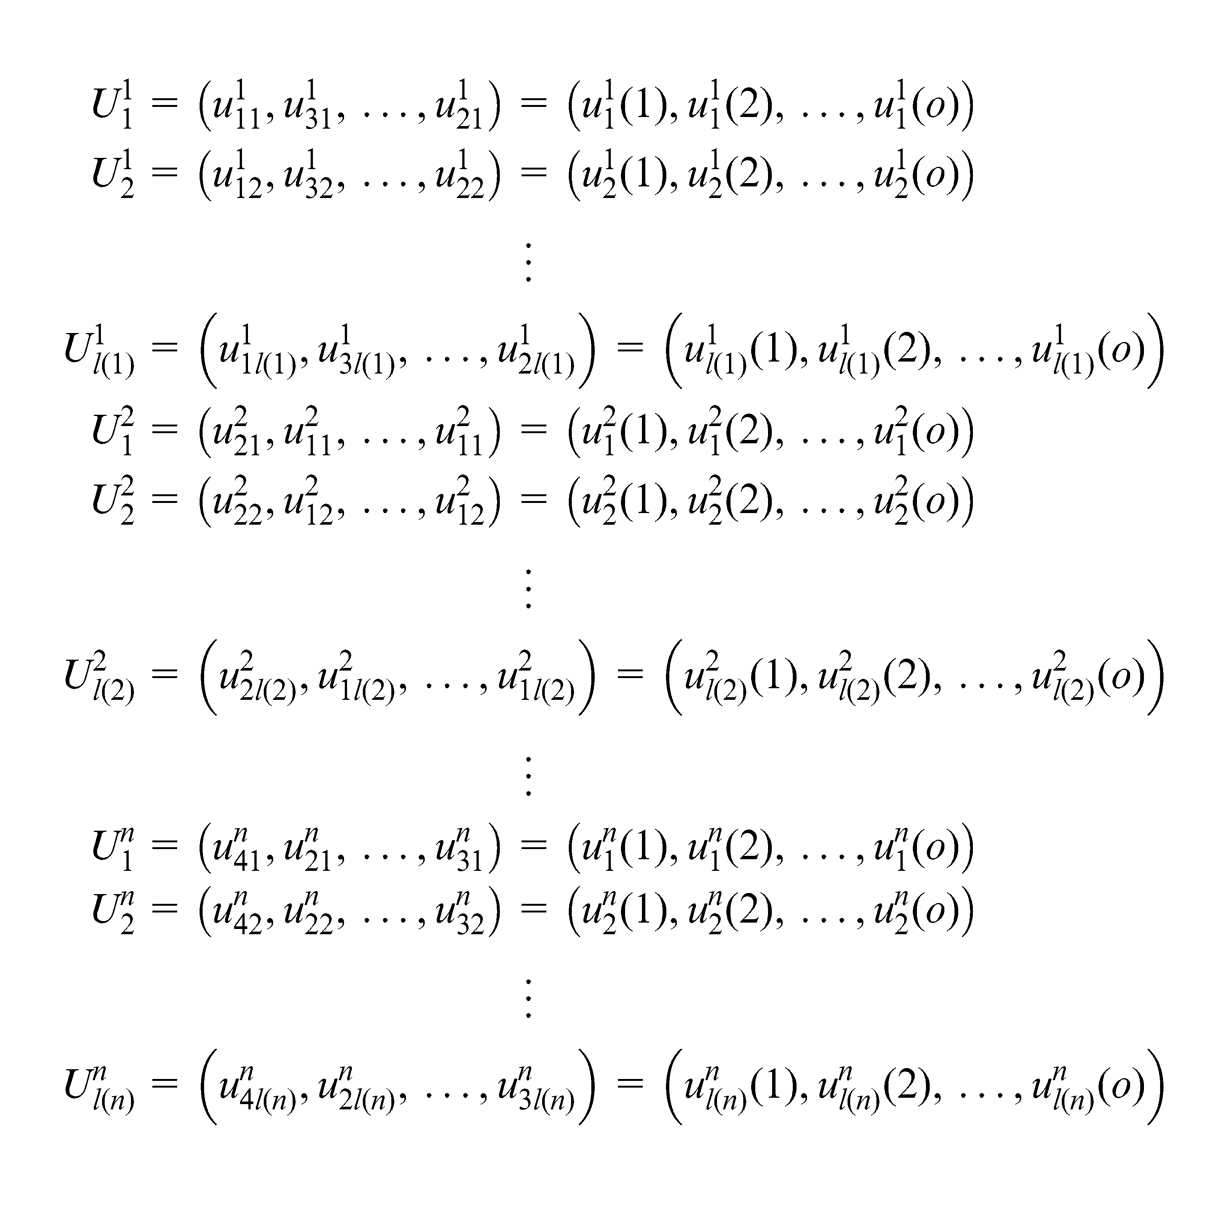
Step 2. Generate the relevant factors behaviour sequence, the so-called comparison data series, which is the sequence of values of each module parameter of the o products. Therefore, there will be
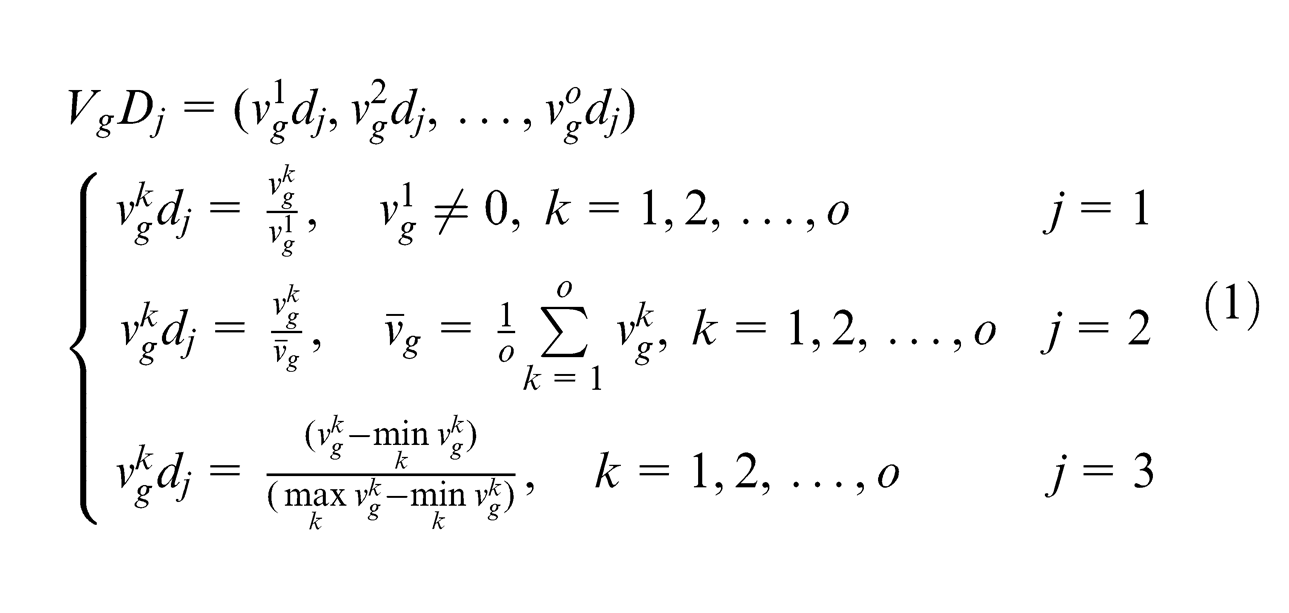
Step 3. Perform data processing. Since the product performances and module parameters usually have different dimensions, dimensionless processing for all the data series should be performed for the sake of comparison. Initialization operator D1, equalization operator D2 and interval-valued operator D3 are the three most commonly used dimensionless treatment methods. Here, we take the reference data series Vg as an example, and the normalization process can be expressed as follows
Step 4. Compute the grey relational coefficient. Let
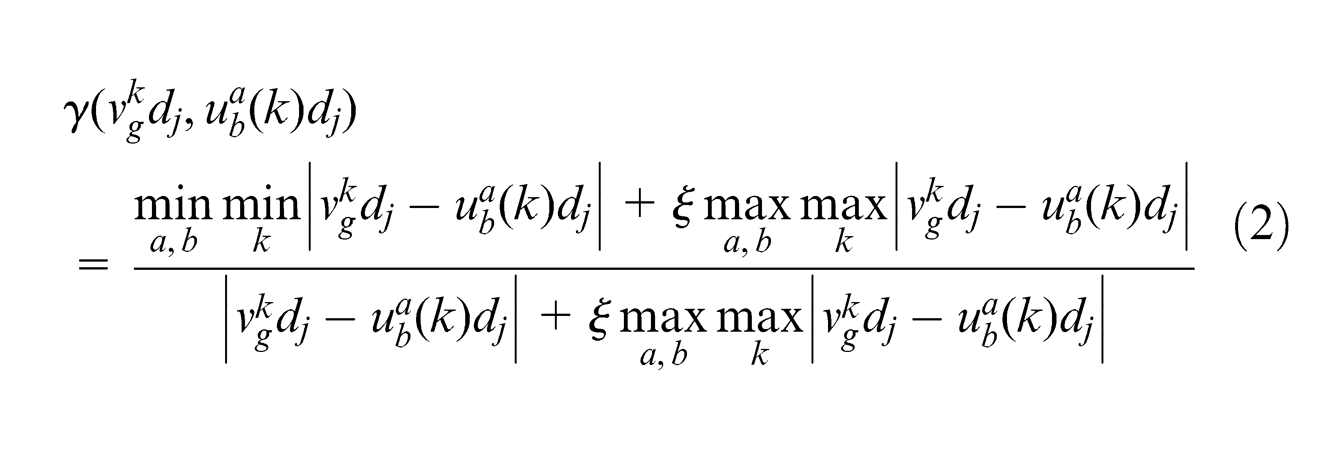
where
Step 5. Compute the grey relational grade. Let
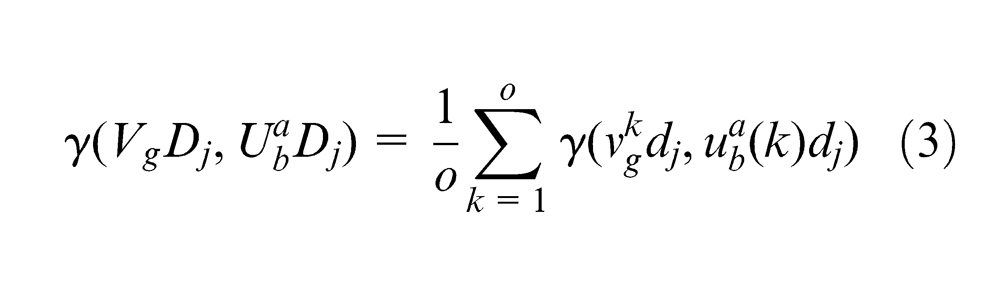
The value of
Step 6. Sort
The reduction of module parameters is achieved using GRA, which can lay the foundation for the construction of the SVM prediction model. To avoid the one-sidedness caused by the normalization by means of a single operator, this article adopts three data processing methods to analyse the original data sets and then conducting comprehensive comparison, analysis and judgment, outputting the optimum result finally.
Modelling for configuration performance prediction based on SVM
The goal of statistical learning is to obtain the dependency relationship between input and output in certain system on the basis of training sample set so as to predict unknown output as accurate as possible. The SVM is a supervised machine learning method based on the statistical learning theory. It is a very useful method for classification and regression in small-sample cases.
With regard to each product performance, we set up a configuration information table. After the reduction process, the number of module parameters is remarkably decreased. In other words, the configuration information tables are further simplified. They can be then used to train SVM models for regression prediction. For each product performance, there is a corresponding module parameter reduction, for example,
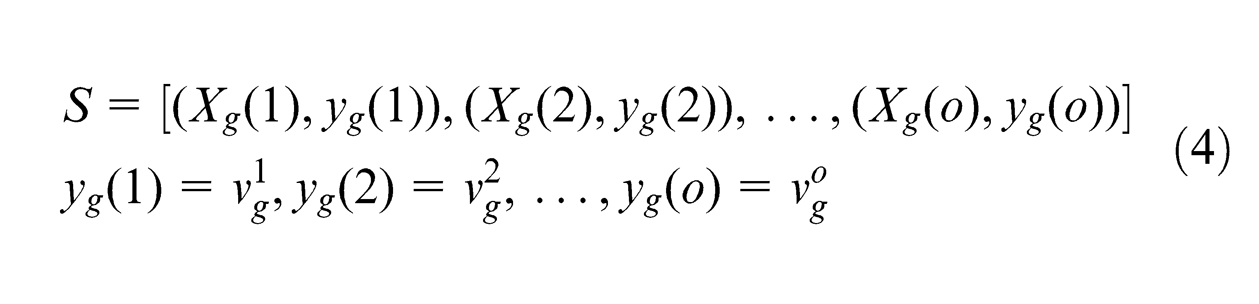
where Xg is the input, yg is the output and o is the total number of samples.
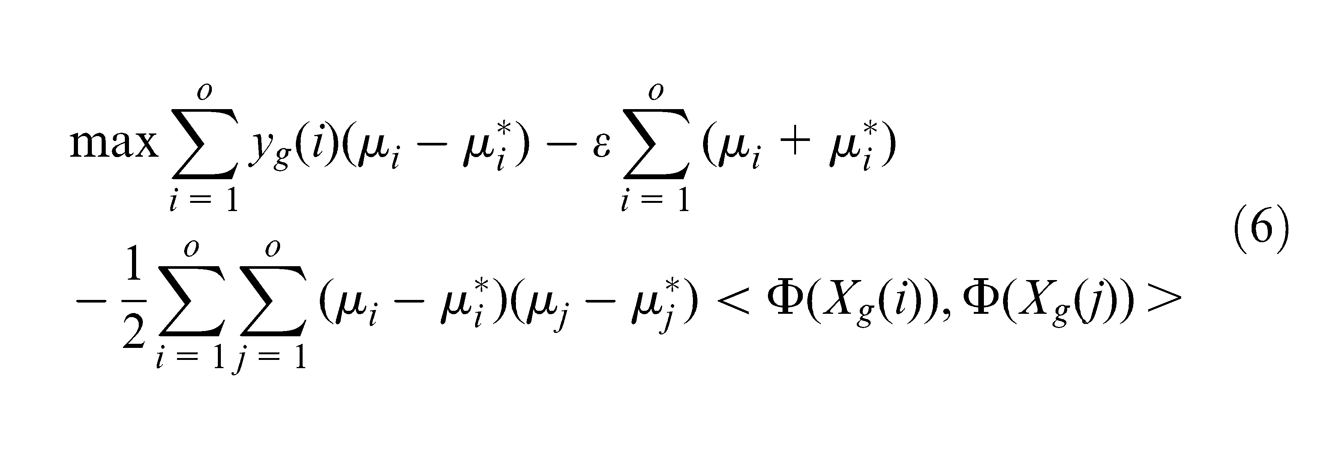
The SVM carries out the regression estimation by risk minimization, where the risk is measured using ε-insensitive loss function. The function defines an ε tube. When the predicted value is within the tube, the loss is zero; otherwise, the loss is equal to the absolute value of ε. The main aim in SVM is to find a function that gives a deviation of ε from the actual output, at the same time, is as flat as possible.
21
We directly take into account the non-linear situation in this work. Let us assume a linear function:
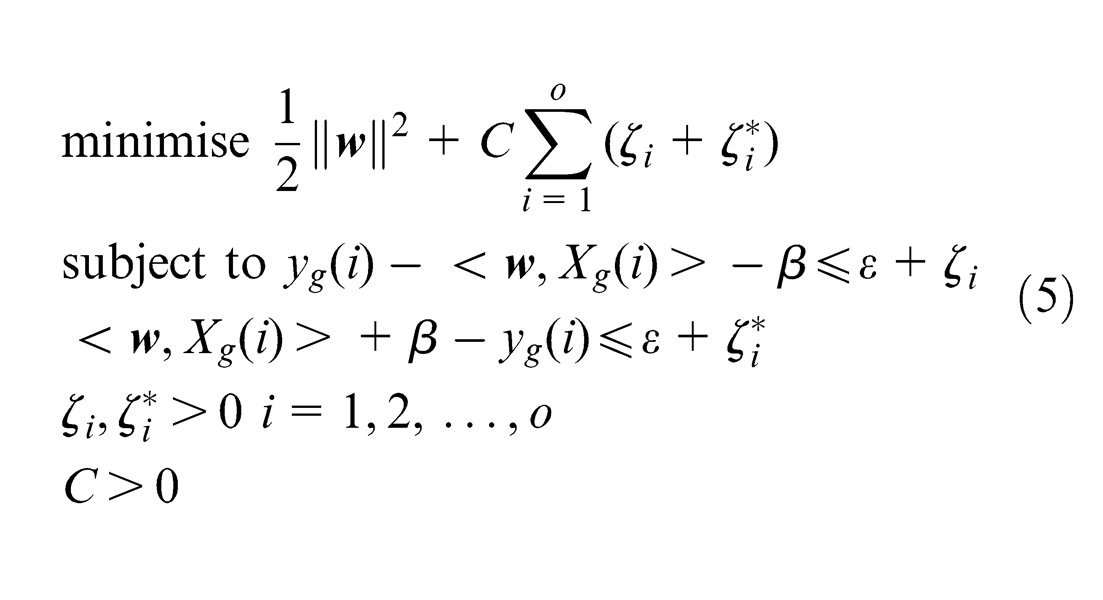
where C is a constant. This is a typical quadratic programming problem, which can be solved by Lagrangian multipliers. By introducing the Lagrangian multipliers,
and its solution is given by
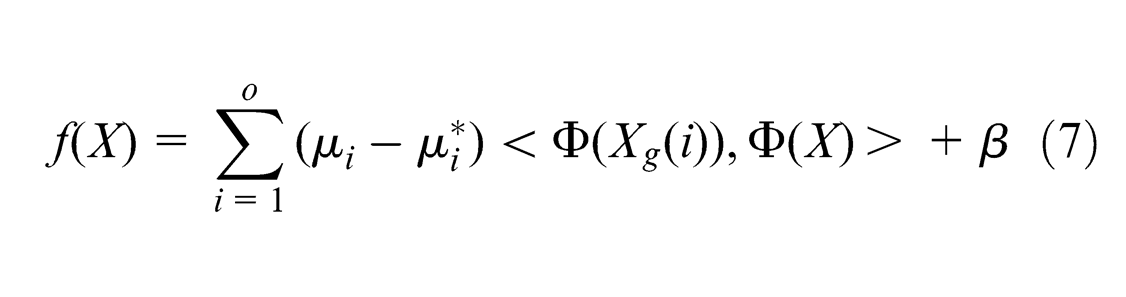
It is noted that some Lagrangian multipliers will be zero, implying that these training objects are considered to be irrelevant for the final solution. The training objects with non-zero Lagrangian multipliers are called support vectors.
21
In the non-linear situation, the input data are mapped onto the feature space by
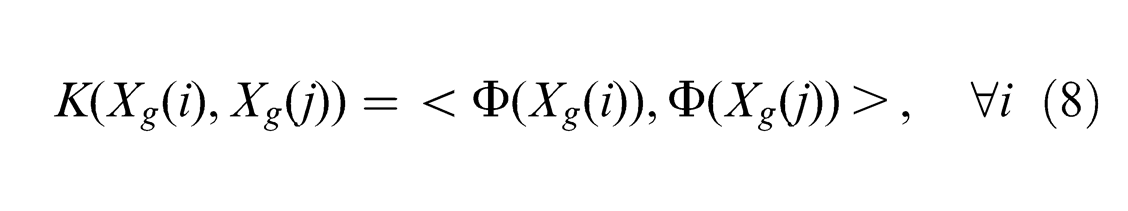
computing implicitly the inner product without mapping onto such a high-dimensional space, is an feasible solution to manipulate the high-dimensional mapping. So, equations (6) and (7) are written as
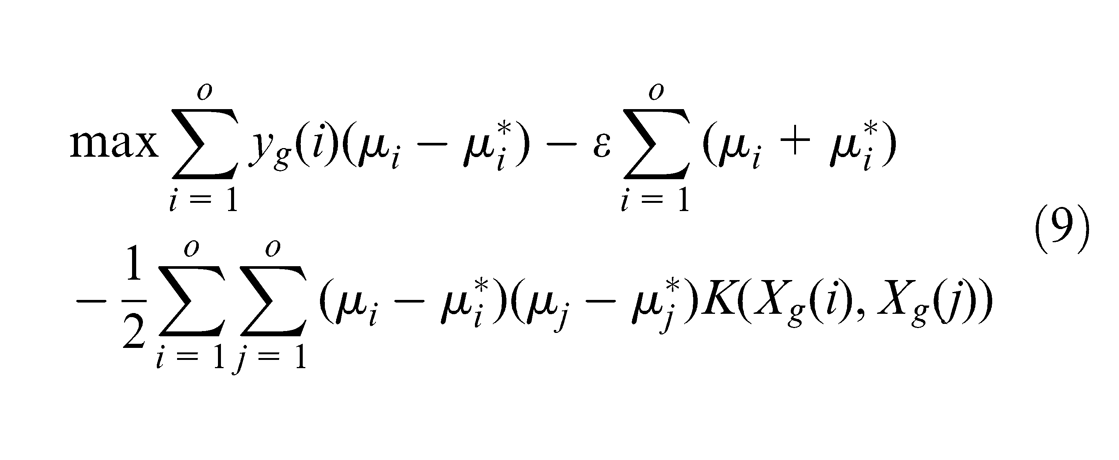
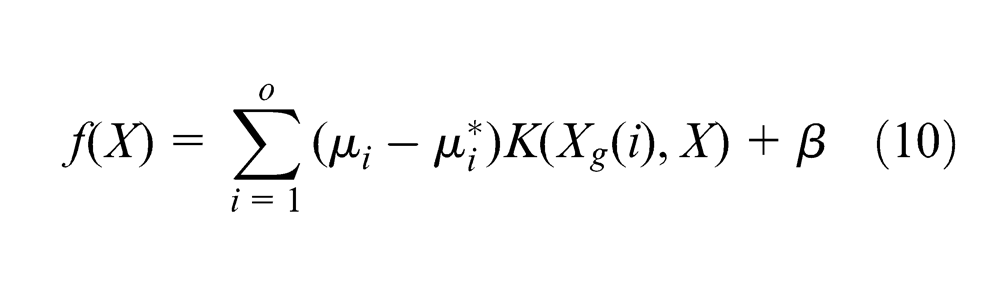
There are five common kernel functions: linear kernel, polynomial kernel, sigmoid kernel, Gaussian kernel and RBF kernel. RBF is capable of dealing with non-linearity and high-dimensional computation and effectively reduces complexity for inputs by adjusting its parameter. RBF kernel is a prior selection in this study and is expressed as
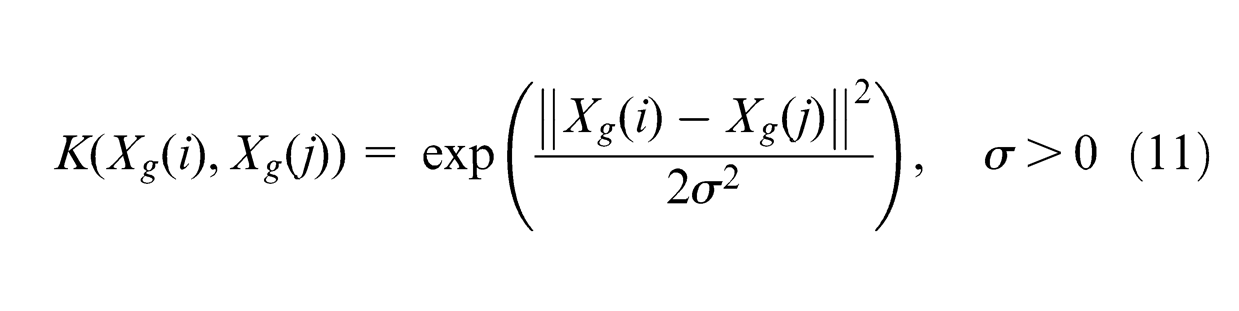
where
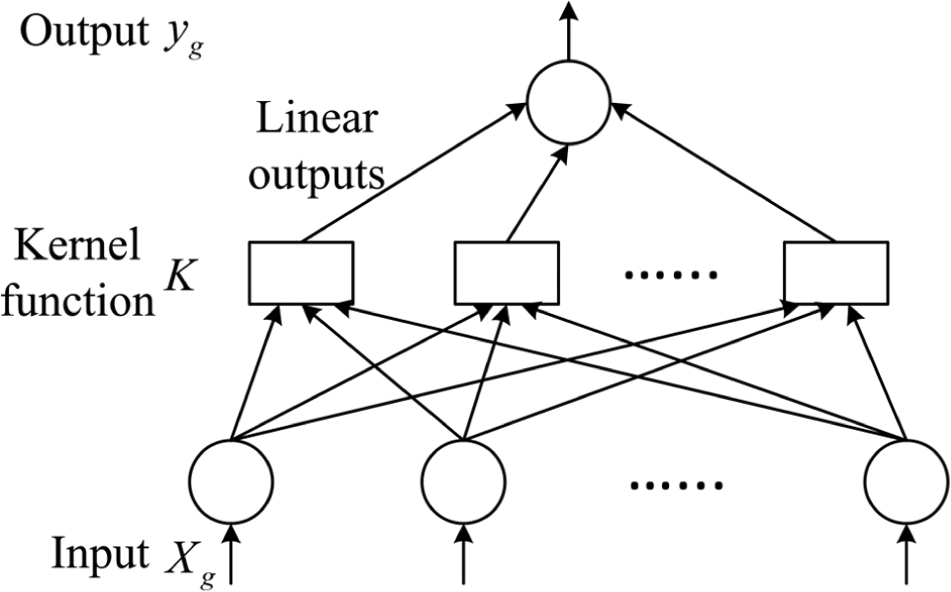
Architecture of the support vector machine.
Case study
In this section, a performance predicting instance regarding the plate electrostatic precipitator (ESP) will be studied to illustrate the whole configuration performance prediction method. The plate ESP is a representative reconfigurable product. The difference of customers’ demands makes the variant configuration necessary, which is realized by the functional module determination and the module instance selection.
The plate ESP consists of six main functional modules, which are the corona/collecting electrode module (FM1), the vibrating mechanism module (FM2), the ash discharging gear module (FM3), the electric hot cupboard module (FM4), the shell module (FM5) and the power supply module (FM6). The performance parameters of the plate ESP include the smog treatment capacity (m2/h), the highest smog temperature (°C), the maximum entry dust concentration (g/m3), the gas velocity (m/s), the pressure loss (Pa) and the dust efficiency (%), denoted as y1, y2, y3, y4, y5 and y6 in turn.
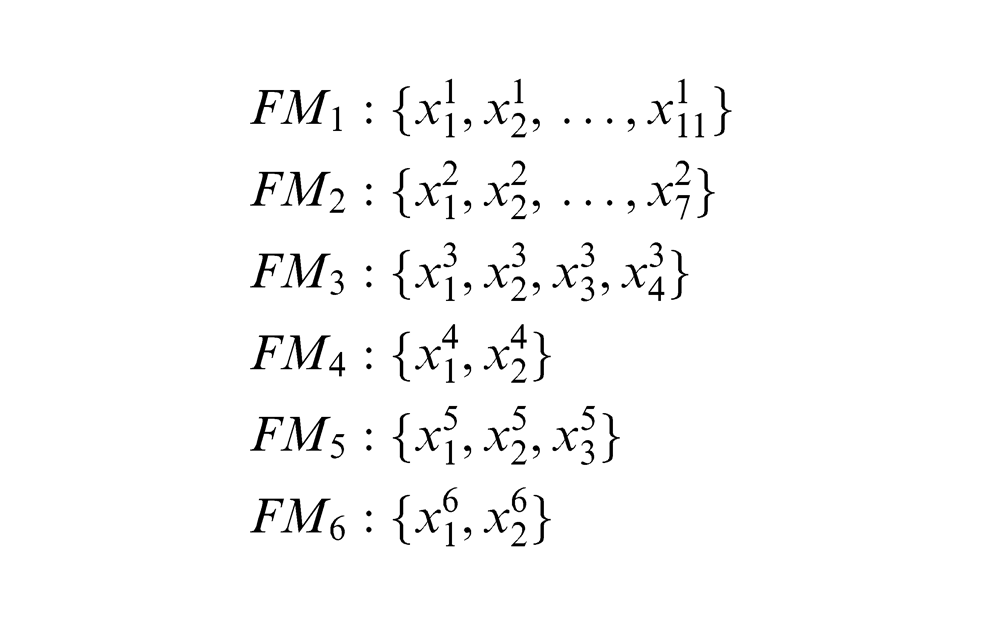
The parameters of the module FM1: the number of chambers, the number of electric fields per chamber, the cross-sectional area of electric field (m2), the homopolar spacing (mm), the anode plate area (m2), the overall length of anode line (m), the available height of anode plate (m), the available length of anode plate (m), the number of cathode plate rows per chamber, the number of cathode line rows per chamber and the number of anode plates per row.
The parameters of the module FM2: the power of anode vibrator (W), the number of anode vibrators, the vibrating way, the power of cathode vibrator (W), the number of cathode vibrators, the power of vibrator on the distribution plate (W) and the number of vibrator on the distribution plate.
The parameters of the module FM3: the number of ash discharging gears, the reducer specifications, the motor power of ash discharging gear (W) and its rotation speed (r/min).
The parameters of the module FM4: the power of the heater (kW) and the number of heaters.
The parameters of the module FM5: the length (mm), the width (mm) and the height (mm).
The parameters of the module FM6: the rectifier specifications (A/kV) and the number of rectifiers.
The above-mentioned parameters of these functional modules can be described as
Each functional module contains a number of module instances with different parameter values, which can be selected on purpose during the configuration design process. In this work, three types of plate ESP, including CDWY, CDWL and CDWM, are chosen and they compose a modular product family of plate ESP. Table 2 lists the overall configuration information of the plate ESP family, which is partially taken from a certain company. There are 13 products; the first 9 products belong to the CDWY series, the products 10 and 11 belong to the CDWL series, and the products 12 and 13 belong to the CDWM series.
Overall configuration information table of a plate ESP family (partly).
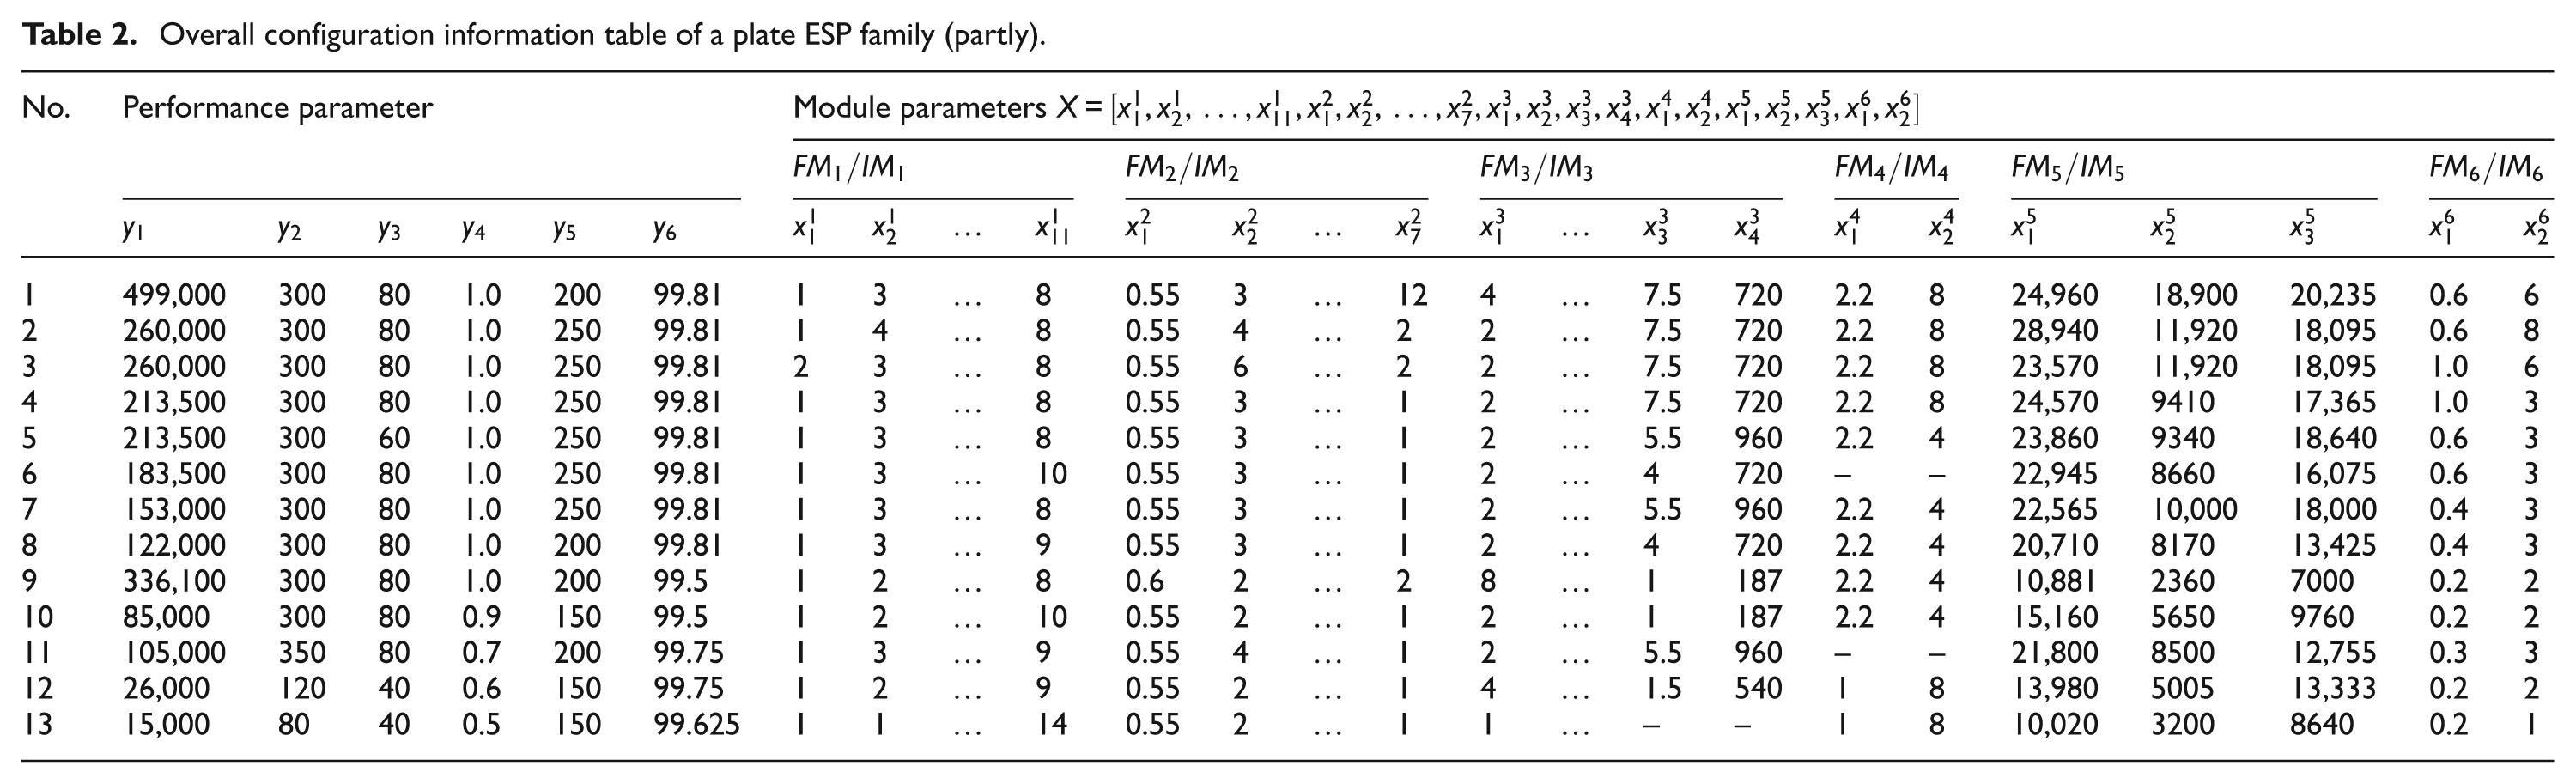
The reference data series and the comparison data series can be extracted from Table 2. Here, we focus on the performance of dust efficiency, y6, to describe the predicting process clearly, and the procedures will be discussed in turn.
For y6, the reference data series and partial comparison data series are
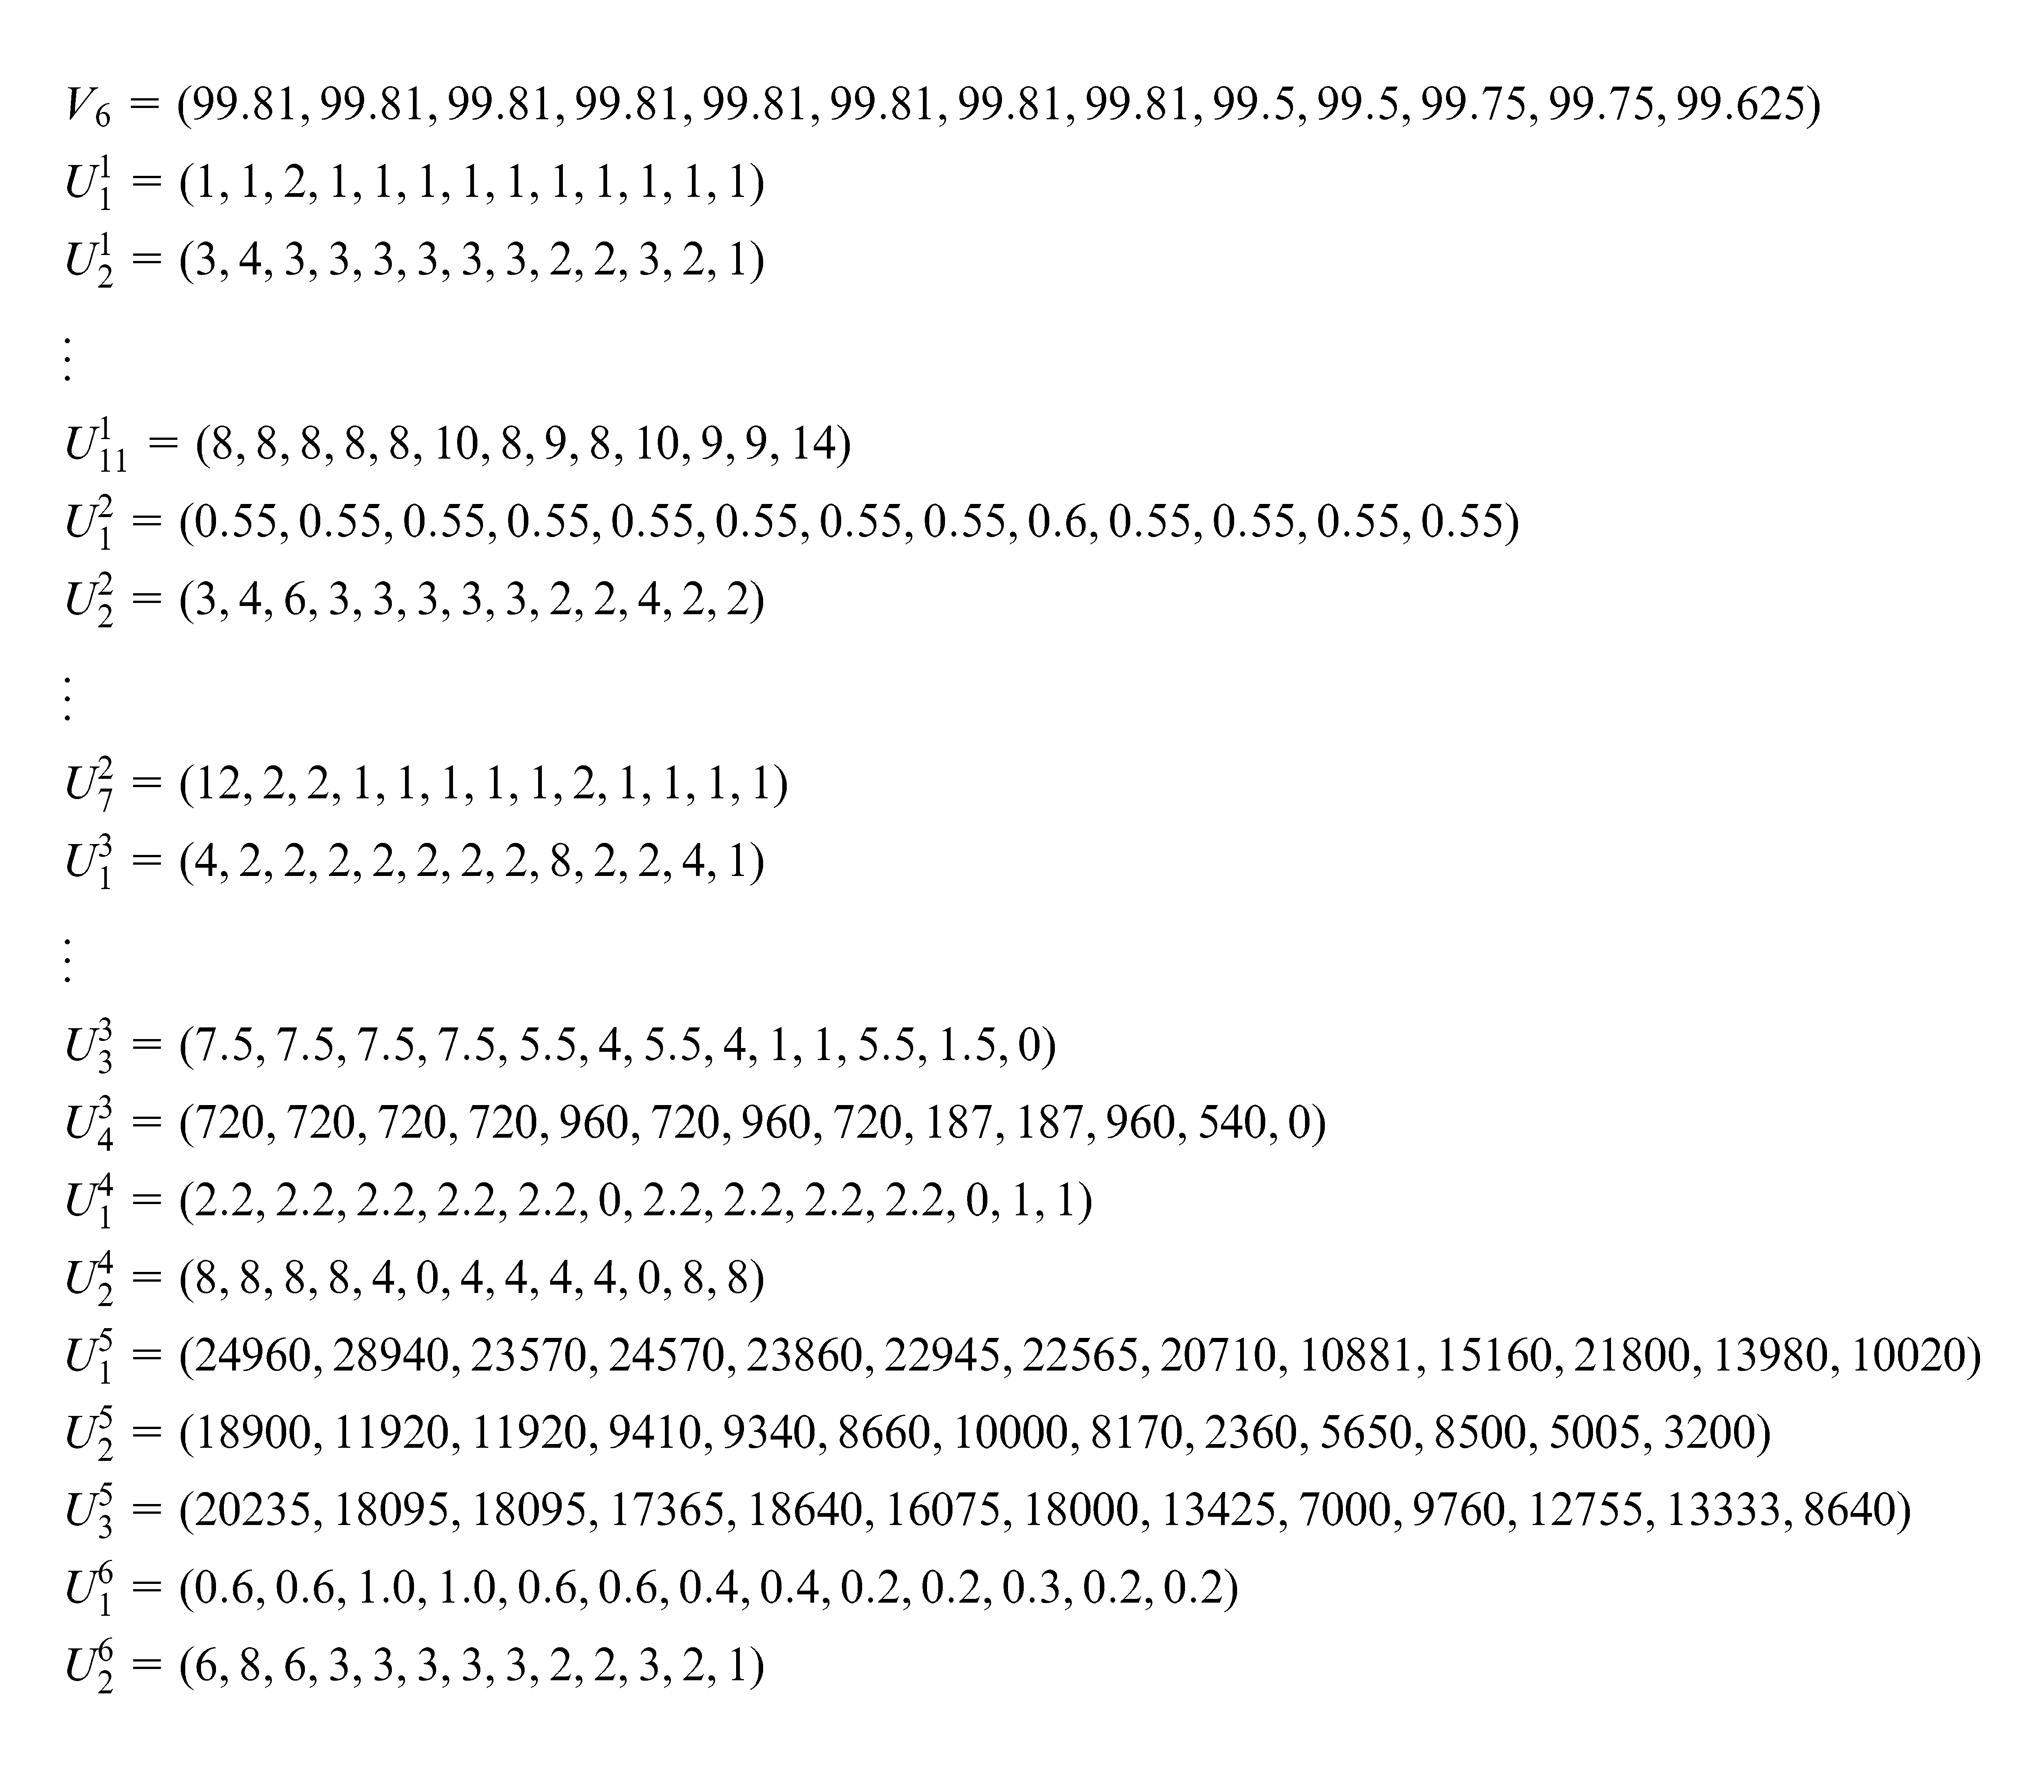
Data processing needs to be performed for these data series with equation (1). Using the initialization operator, the dimensionless data series are listed as follows
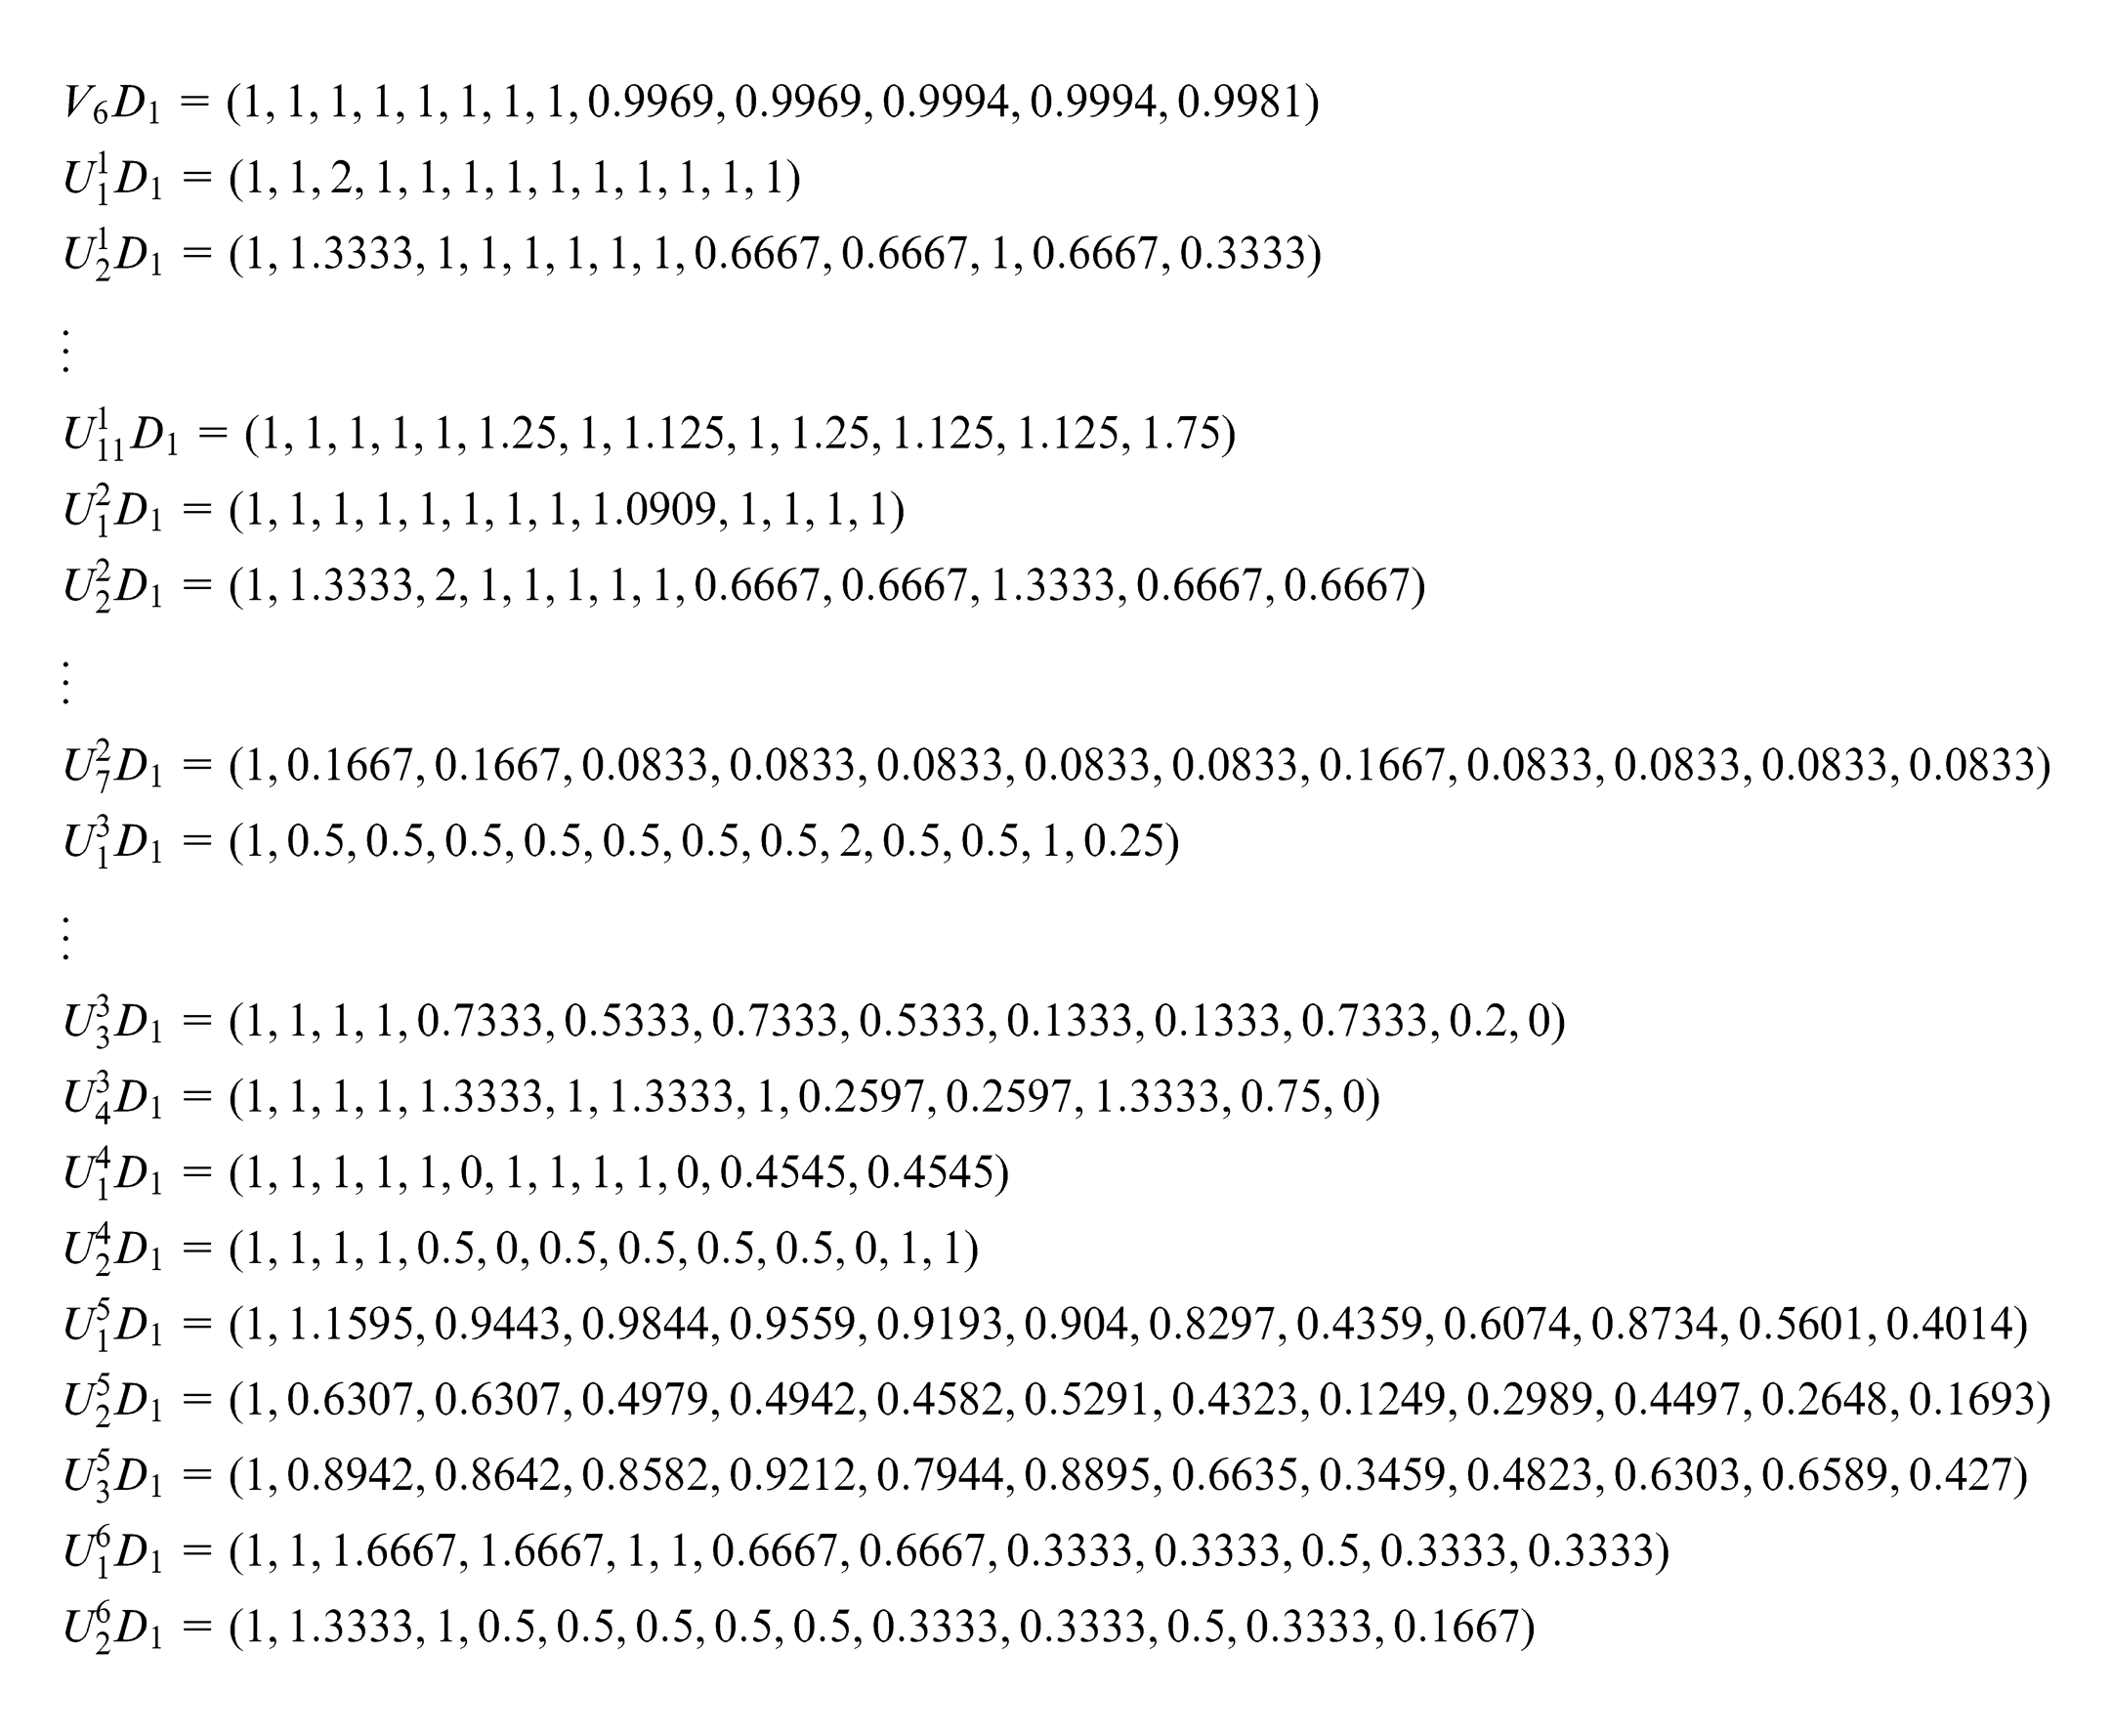
Based on the normalized data, the grey relational grade between each comparison data series and the reference data series can be computed with equations (2) and (3). The three operators, D1, D2 and D3, are all employed, and the results are listed in Table 3. So, three sorted sequences of grey relational grade are gotten
Grey relational grade between the comparison data series and the reference data series.
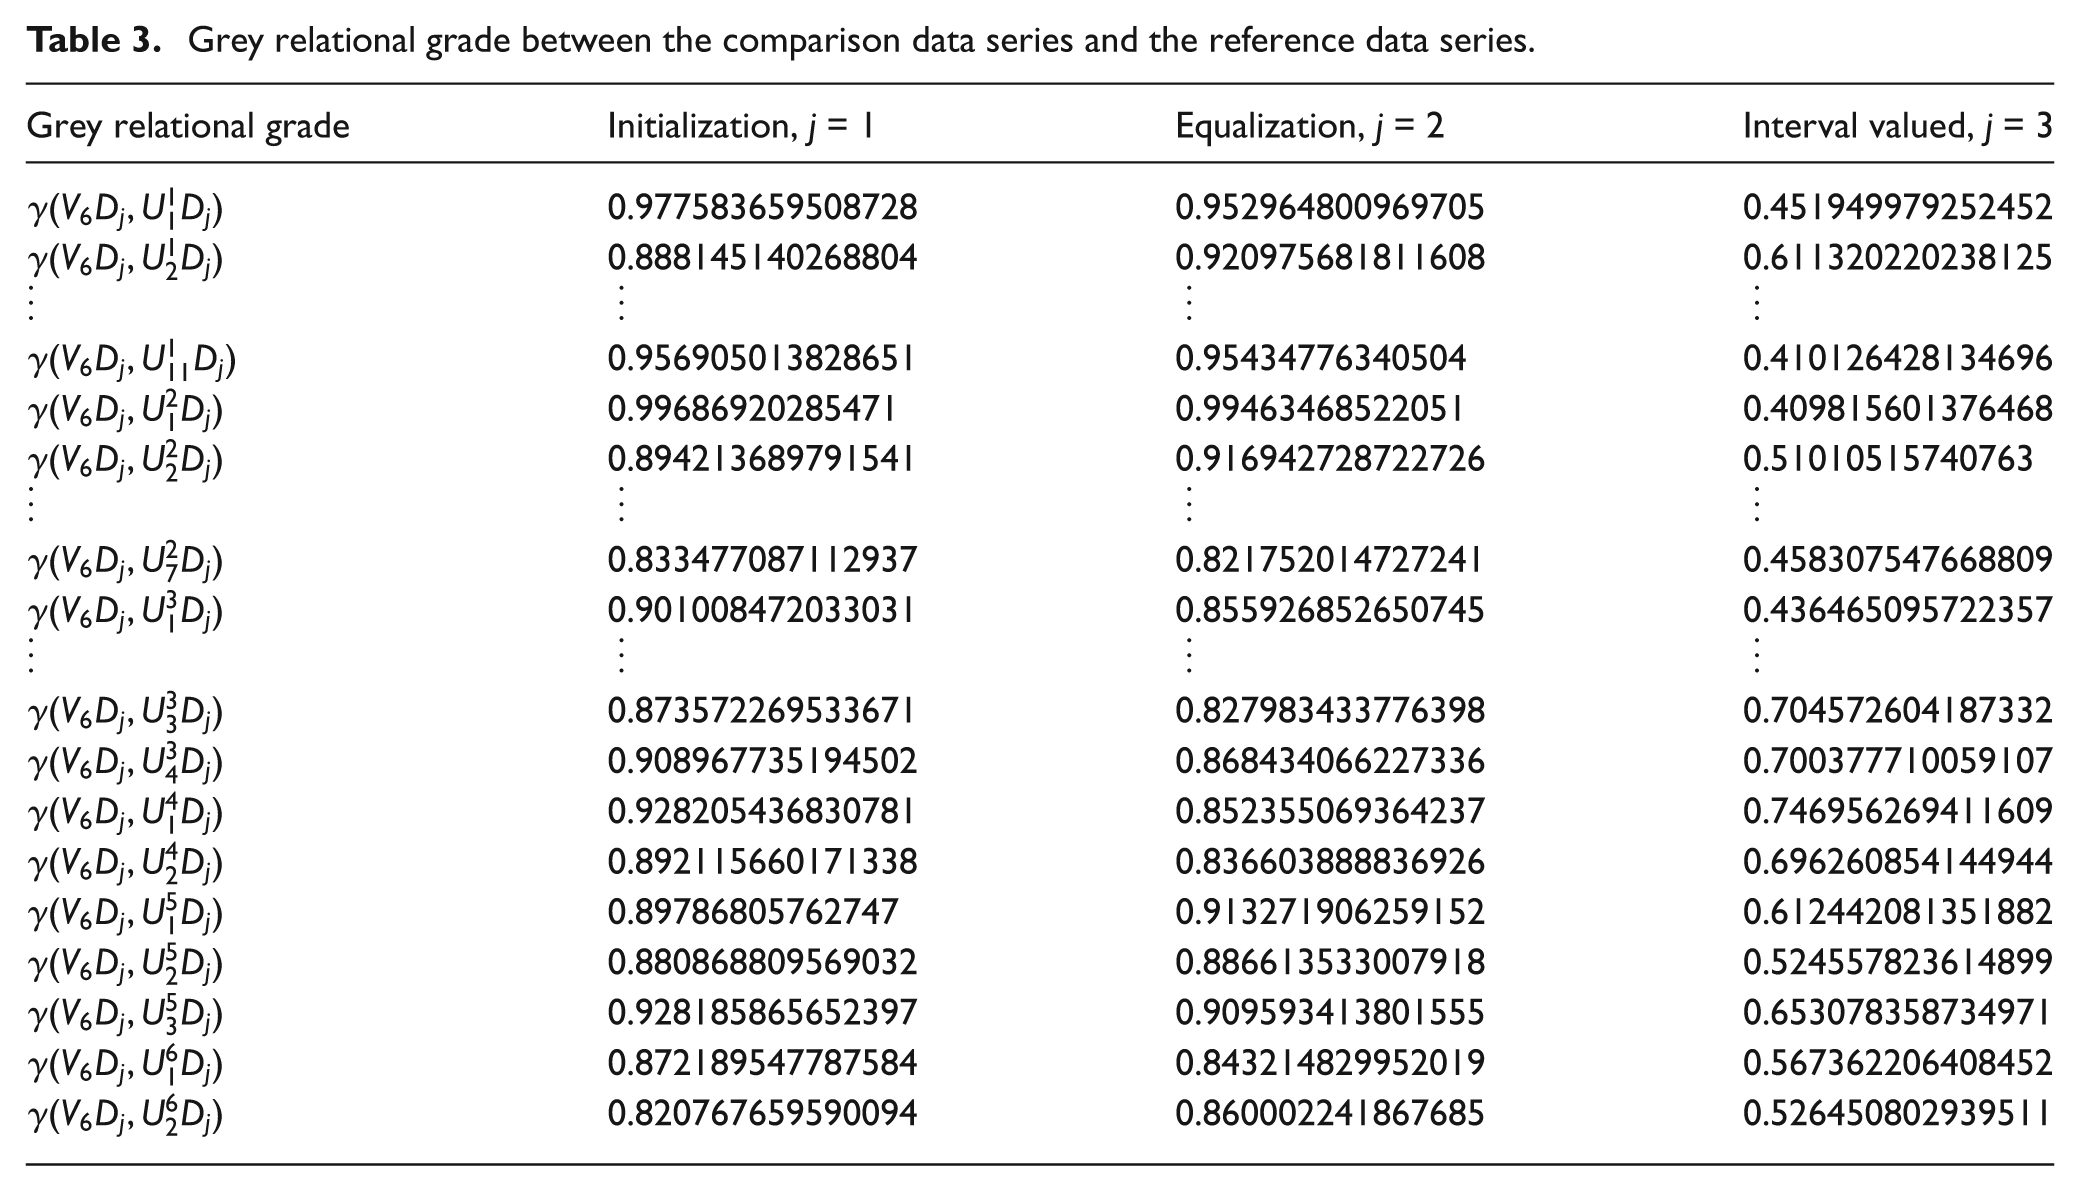
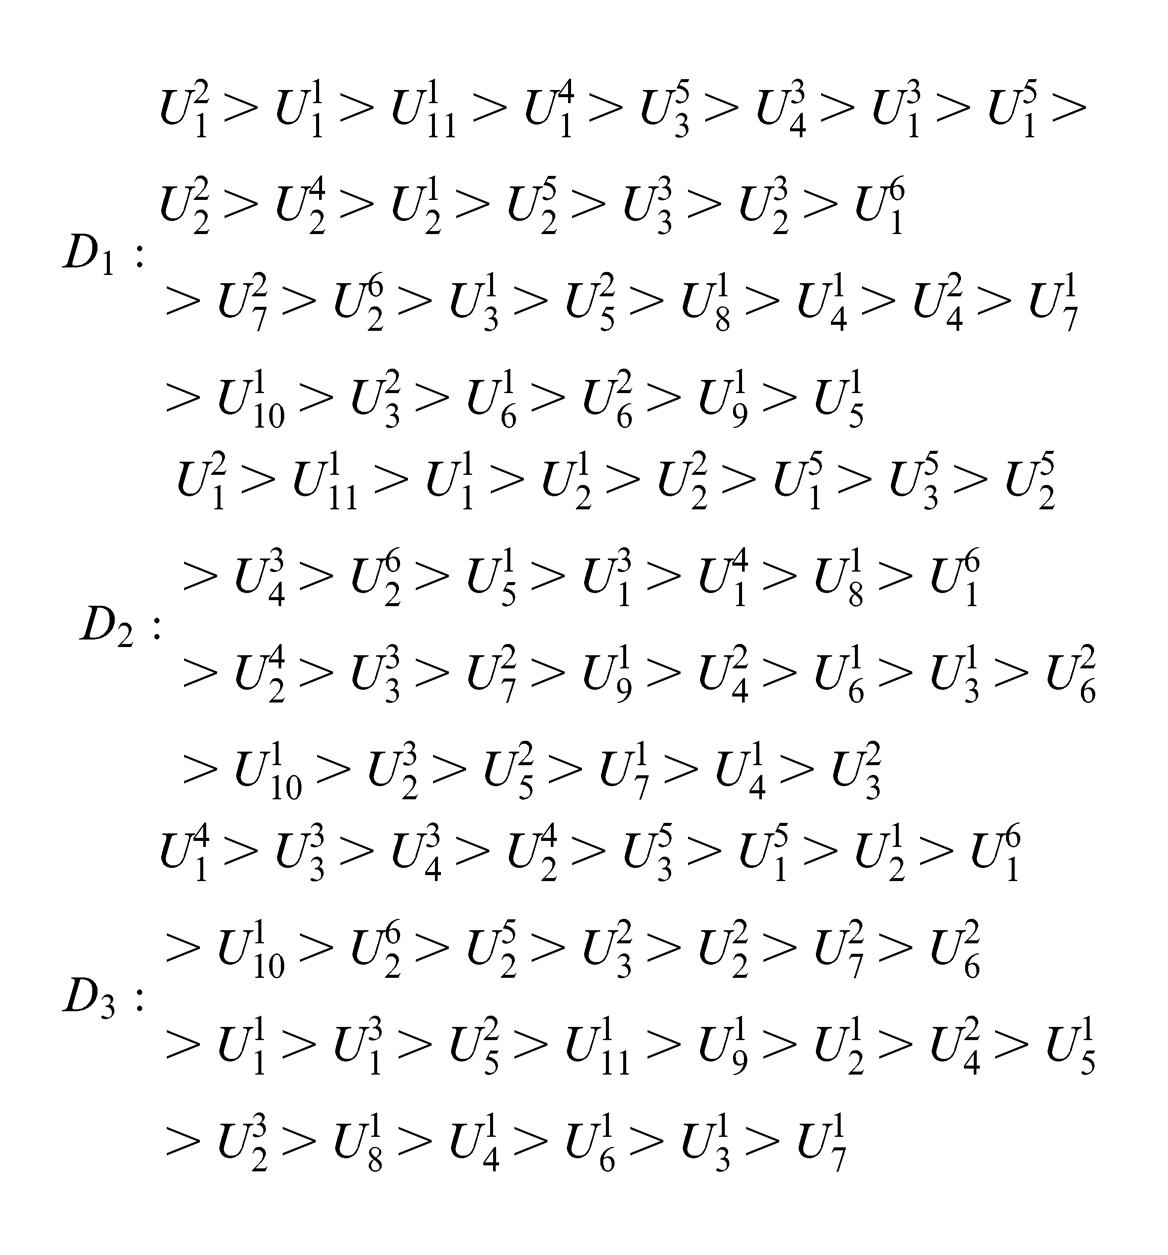
The elements, ranking higher in the sequence, are considered to be the dominants, which impact on the performance significantly. To avoid the one-sidedness caused by the selection from one sequence, we extract the elements that rank higher in all the three sequences and take them as the dominants. So, a module parameter reduction is then formed
Consequently, the eight reduced module parameters
The optimal parameters of the SVM model can be obtained using the GA, whose parameters are set as follows: population size = 200, iteration time = 100, crossover probability = 0.5 and mutation probability = 0.2. The converged process of the algorithm is shown in Figure 3. And then we get the optimal parameters of the support vector regression, which are
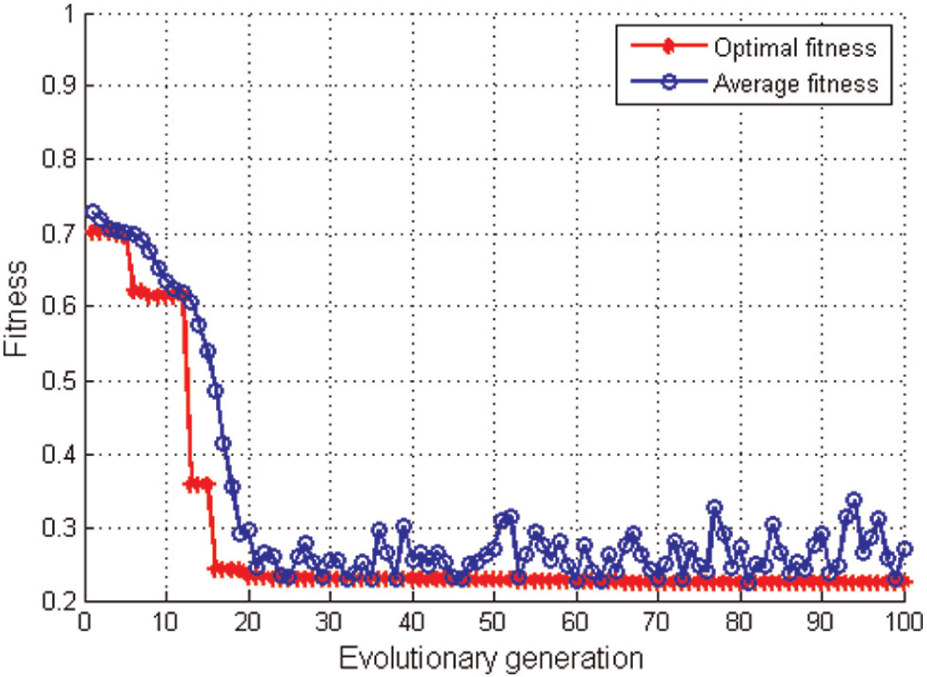
The GA convergence process of the parameters of support vector regression.
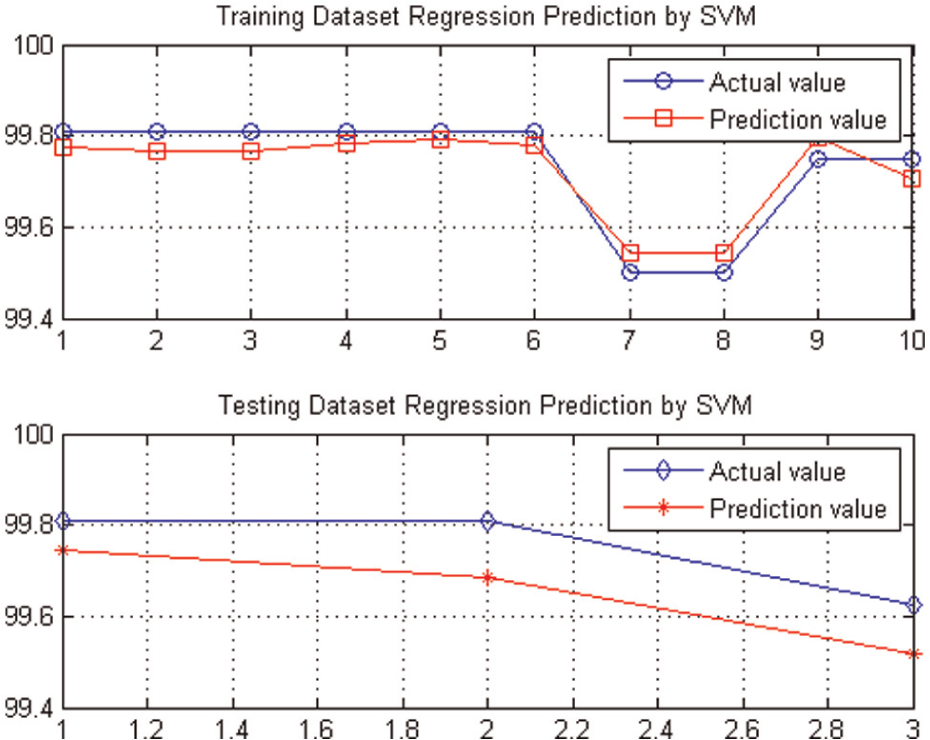
The performance prediction curves of the plate ESP.
Analysis of the prediction performance test.
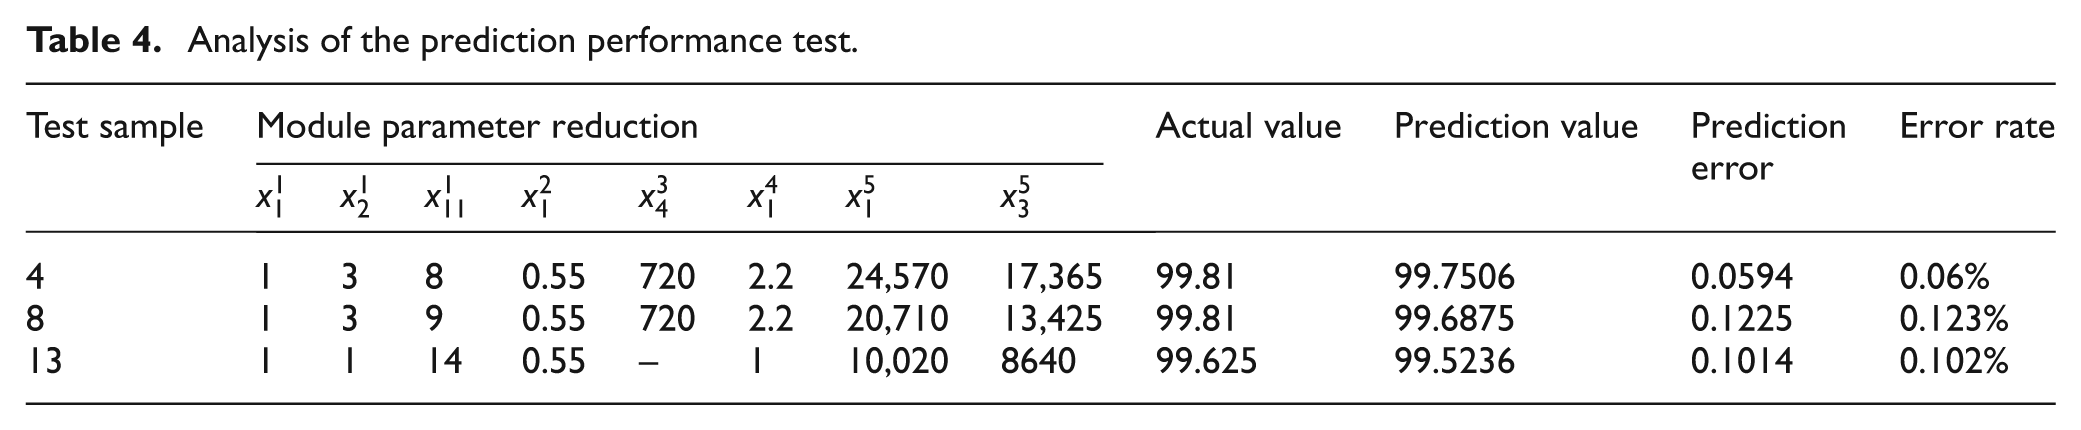
The relative prediction errors are estimated by testing through three individuals. It is shown that the prediction error of the product P4 is minimum, and the products, P8 and P13, have relatively greater prediction errors. The average estimating error rate is only 0.095%, which means the actual values are ideally located near the prediction values. In other words, the prediction accuracy is quite high.
To further verify the effectiveness of SVM in the configuration performance prediction, a contrast experiment is designed to compare the prediction results of the proposed method with those of the neural networks. Previous researchers have employed MLP neural networks. Of late, there have been some applications of RBF neural network as a substitute for MLP neural networks. Compared to MLP neural networks, RBF neural networks can be trained faster although requiring more training data. Here, the MLP and RBF neural networks are selected, which should be trained and tested with the same training and testing data sets. It is experimentally found that every time the algorithm runs, we can get dissimilar curves. Figure 5 shows six performance prediction curves of the plate ESP based on trained neural networks. The sample size is so small that the training of neural networks cannot smoothly and effectively proceed. The developed network structure is unstable and is unable to predict the configuration performances. The major limitation to the use of neural networks is that it requires a large set of experimental data. Therefore, it is because of this limitation, this article proposes a new prediction approach that uses small-sized training and testing data sets.
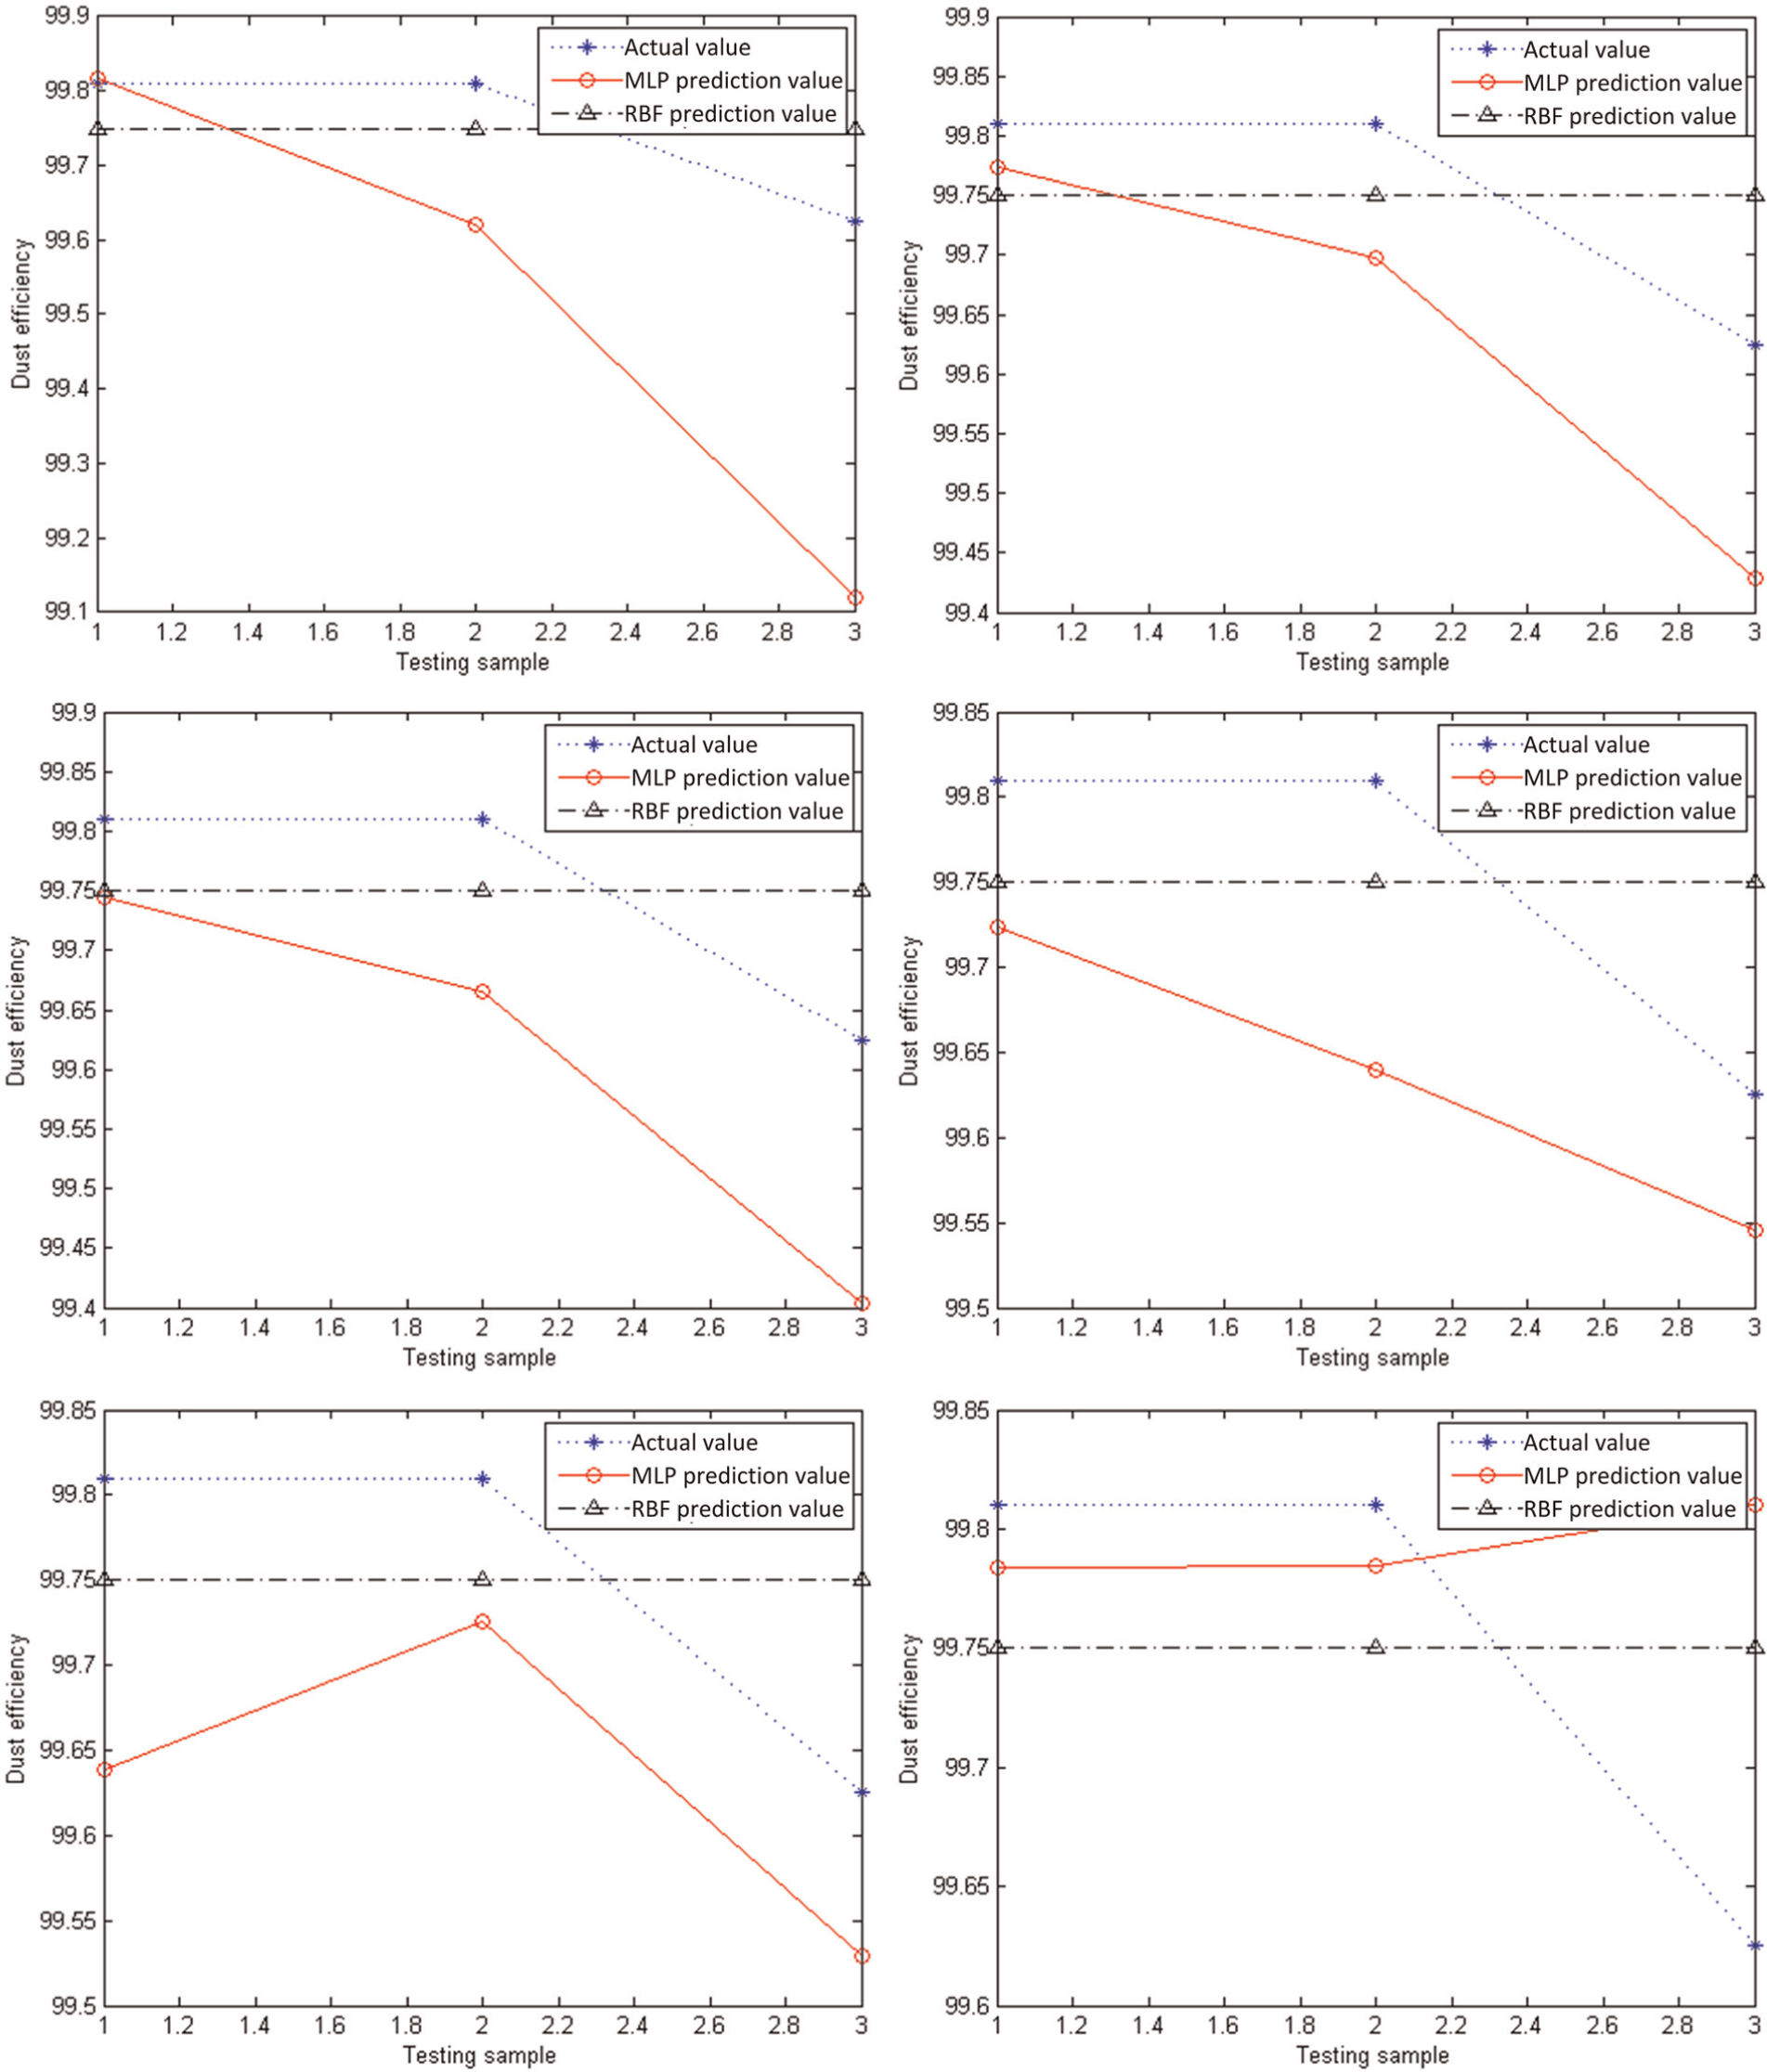
Six performance prediction curves of the plate ESP based on trained neural networks.
The experiments show that the performance prediction model of configured products, established through GRA and SVM, has several advantages such as simple model structure, fast convergence speed and high prediction accuracy. Moreover, it can be applied to the small sample size prediction problem.
Conclusions
This article puts forward a new performance prediction method for the modular configuration design, which is realized by integrating GRA and SVM. The advantages and contributions of the research are listed as follows.
The method extends the process of product configuration design by adding the configuration performance prediction, ensuring that the final schemes developed via the whole process fully satisfy the customers’ demands.
This method estimates the performance values through the soft computing method instead of experiments, which is undoubtedly helpful to decrease the experimental costs and cut down the configuration design time.
Module parameter reduction is a necessary step, not only to remove insignificant or redundant determinants but also to improve computational efficiency. The GRA method, competent for this task, can decrease the complexity of SVM models and expedite the training speed of SVM, and the predicted results are favourable.
The SVM has unique advantage to solve the small sample size problem. So, one of the major advantages of the proposed methodology is its ability to develop a reasonably accurate performance prediction approach with limited amount of training and testing data.
The method can effectively improve the response speed to individual customers’ requirements and provide a new technique or tool for modular product family design.
The methodology has already been applied, tested and validated empirically. When the new configured products are available, the model can be directly used to predict all the performance values. This novel method provides high robustness, reusability and reliability for the configuration performance prediction. Moreover, the SVM model can always be updated to obtain better predicted results by presenting new training examples as newly configured products become available.
Footnotes
Declaration of conflicting interests
The authors declare that there is no conflict of interest.
Funding
This research received no specific grant from any funding agency in the public, commercial or not-for-profit sectors.