
Abstract
There are many complex surfaces in complex products, such as the leading edge of the airplane wing and the blade of a propeller. These quasi-cylindrical surfaces are deliberately designed according to functional requirements. The verification algorithm of quasi-cylindrical surfaces is the foundation for a leading edge shape control. Traditional indices are not fit for the quasi-cylindrical surface verification because there are no distinct features in these surfaces. An efficient and robust verification algorithm based on an equivalent radius and the Gaussian image for a quasi-cylindrical surface verification is proposed in this article. Gaussian image is employed to determine the principal direction of scanned datapoints. Three-dimensional wavelet filtering method is used to conduct datapoints processing because of its excellent three-dimensional information-processing capability. Good performance is obtained in the process of the leading edge verification by the demonstration of principal direction determining and circle fitting. The results of this research will enhance the understanding of the quasi-cylindrical surface evaluation, especially the leading edge verification, and help systematically improving the verification and validation of aerodynamic performance where the as-designed shape of the leading edge is compared with the shape tested in the wind tunnel.
Introduction
One of the prevalent problems existing in complex surface precision control, and especially in the key position with irregular characteristic, is the verification algorithm. The leading edge of the airplane wing and the blade of a propeller is one of the specific representations for complex surfaces. The leading edge region is particularly important in compressor blade rows since the initial development of the boundary layer at the leading edge influences the boundary layer over the rest of the blade surface. 1 Walraevens and Cumpsty 2 studied both elliptic- and circular-shaped leading edges on a flat plate. They found that the circular geometry gave rise to a leading edge separation bubble at zero incidence, while the elliptic geometry only exhibited a bubble at moderate incidences. Wheeler et al. 3 showed that the interaction of the incoming wake with the leading edge region has a significant effect on the performance of compressor blades. Henderson et al. 4 also highlighted the importance of wakes at the leading edge region by showing that it was a key receptivity site for turbulent spot formation. Furthermore, the leading edge radius of a core compressor blade can be as small as 0.2 mm. Therefore, manufacturing processes and in-service erosion can give rise to leading edge shapes that vary significantly from the design intent. 1
The leading edge is a quasi-cylindrical surface, which is deliberately designed according to functional requirements. The verification algorithm of quasi-cylindrical surfaces is the foundation for the verification and validation of aerodynamic performance where the as-designed shape of the leading edge is compared with the shape tested in the wind tunnel. Despite this, it is not well understood how compressor performance is affected by variations in leading edge geometry.
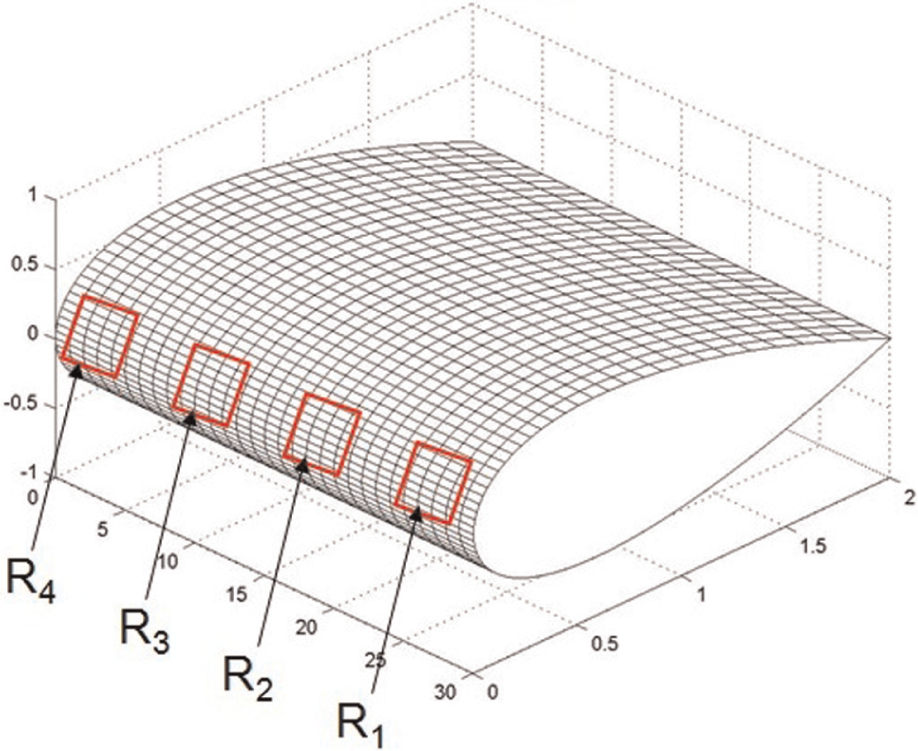
Quasi-cylindrical surface is a kind of idiosyncratic surface. The term “quasi-cylindrical surface” means a surface that is not necessarily cylindrical but that has different section of the surface having different curvature along the surface. Traditional indices of form error include planar surfaces, bosses, holes, surface line elements, axes, median lines, and median planes. 5 The first four features are represented by either a plane (planar surfaces), a cylinder/circle (bosses and holes), or a line (surface line element) in the verification methods. These features are known as surface features because sampled datapoints could be extracted directly from their surfaces. However, the last three features (axes, median lines, and median planes) are known as derived features. It is the most important design parameter in the verification of wing leading edge along which the wing leading edge radius is Ri, i = 1, 2, …, n (Figure 1).
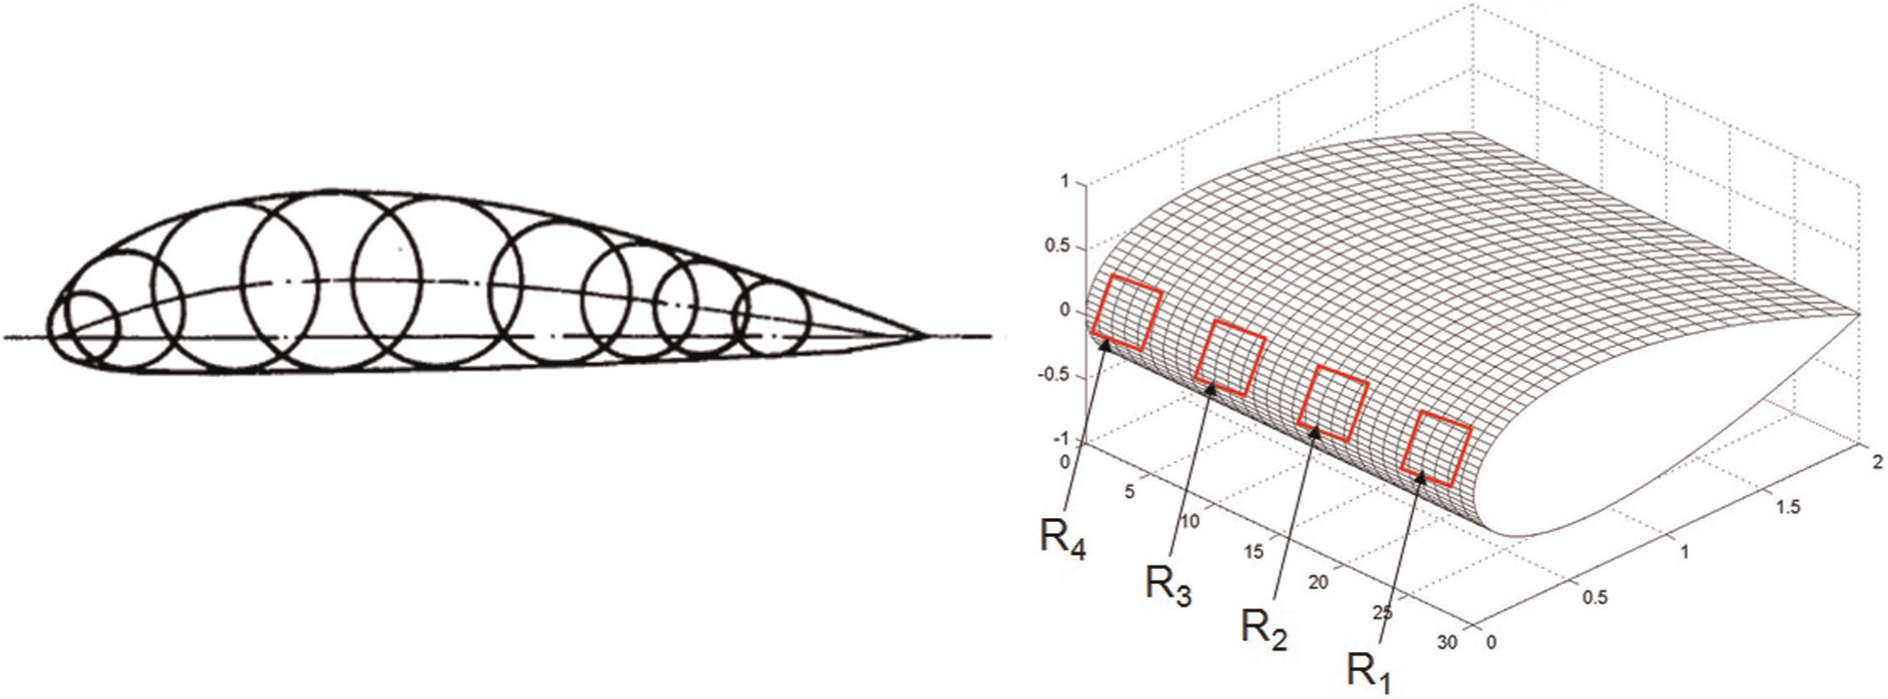
Radius of wing leading edge.
The geometry of leading edges has historically been defined using simple geometric shapes, for example, circles or ellipses with the blade surfaces joining at a tangent point. Spikes in the surface pressure distribution often exist at the leading edge of a compressor blade; these are caused by large changes in surface curvature. 6 Since there are no distinct features in these surfaces, traditional indices are not fit for quasi-cylindrical surface verification. Lack of distinct features causes a lot of difficulties in verification process.
The cross section of quasi-cylindrical surface is a transitional curve. Traditional indices such as planar surfaces, bosses, holes, surface line elements, axes, median lines, and median planes are inferred from cylindrical surface. The cylindrical surface is different from quasi-cylindrical surface. Further research work needs to be done in quasi-cylindrical surface verification.
Smoothing fitting or connecting between curves results in indistinct features. Indistinct features cause orientation deviation, fiducial deviation, and registration deviation in manufacturing and verification, which is a classical problem between design and manufacturing.
Surface scanning is a solution for shape verification and deformation analysis. But point cloud registration error is still difficult to be controlled because of indistinct features of quasi-cylindrical surface.
The goal of this article is to develop accurate, efficient, and robust verification algorithm based on equivalent radius and Gaussian image for quasi-cylindrical surface verification, especially the leading edge. This article is structured as follows: Section “Relevant literature” gives a brief background of curvature definition and estimation, wavelet method, and a widely used noise removing method. Section “Quasi-cylindrical surface verification” presents a whole procedure of the wing leading edge surface verification. Section “Principal direction based on Gaussian image” explains the algorithm of determining the principal direction based on Gaussian image. Section “Curvature estimation and circle fitting” relates the selection of reference point, curvature estimation, and circle fitting. Section “Datapoints smoothing” discusses the datapoints smoothing method based on wavelet filtering and build the criterion of which wavelet filtering level to stop. The results of this research will enhance the understanding of the complex surface evaluation and help systematically enhancing the evaluation efficiency and precision.
Relevant literature
Various systems have been developed for three-dimensional (3D) noncontact measurement, such as laser scanners/trackers and photogrammetry-based systems. 7 All these systems involve the use of structured light to generate part measurements. These 3D noncontact measurement systems offer the flexibility to measure the full part shape (or critical part areas) as well as provide measurements at discrete point locations, which typically are necessary to satisfy data sampling requirements for process capability analysis studies. The measurement point cloud consists of thousands of point measurements meshed together to represent a full part shape. From these measurement data, we may clearly see that while most of the panel is within specification, certain localized areas have large deviations from nominal. But one point’s deviation is not enough for shape evaluation because its information is discrete and partial. Therefore, it is very important to extract the whole distortion characteristics of the scanned datapoints.
Curvature estimation and circle fitting
Differential geometry properties of complex surface are important for surface’s feature detection. 8 Curvature is a key notion in the recognition of objects from digital pictures. The accurate and precise estimation of curvature properties plays an important role in the interpretation of digital binary data such as maps and engineering drawings. Specifically, maxima, minima, and zero crossings of curvature contain much important information. Curvature at any point on the surface is the measurement of how rapid the surface pulled away from the tangent plane is in the neighborhood of that point. Digital curvature is computed from a discrete set of points, either representing a digital line or a discrete boundary of some digital object. In fact, this discrete set of points is a representation of some continuous pre-digitized object.
Several methods9,10 for the estimation of curvature from digital image data are known, which are based on the three different formulations of curvature equivalent in the continuous space but not in the digital space. Resampling method shows a significant reduction of this orientation depending error with approximately equal to standard deviation. The method with the best overall performance is obviously the method based on resampling.
Definition: resampling method. 10
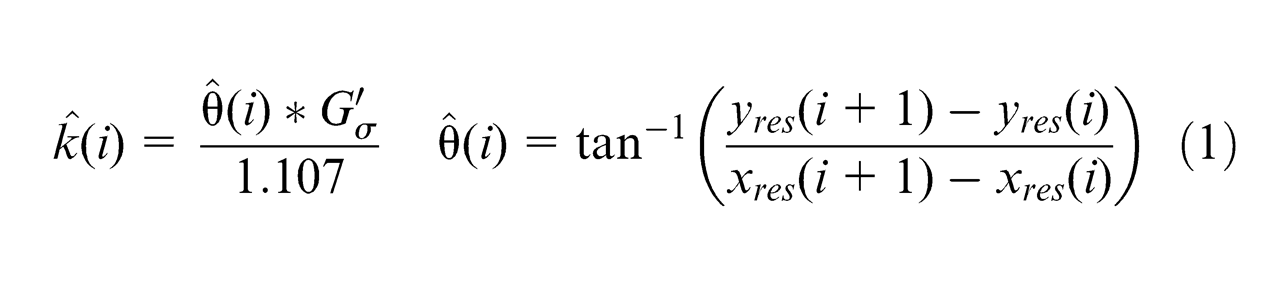
Curvature
The Gaussian kernel is a popular filter used in smoothing. To be used as a digital filter, the Gaussian kernel was truncated to some finite size (2k+ 1). Thus, the discrete Gaussian kernel was given by
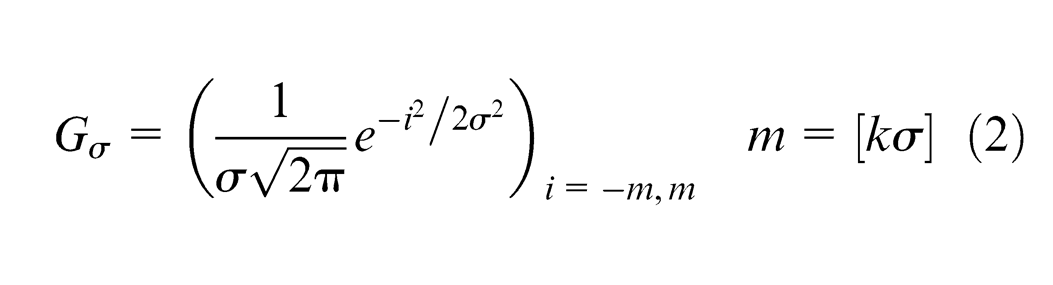
Differentiating kernels based on the Gaussian kernel are defined in a similar way. It is important to consider the truncation of the kernel as a source of error in the curvature estimation. The truncation error is a measure of the deviation of the filter from its ideal shape. The truncation errors in this article are less than 3%. 10
Parameter estimation of a digital arc is to find the best estimation of the center and radius. The importance of unbiased and consistent properties in determining the parameters of circular arc has been studied by Berman. 11 The least square fitting method12,13 and Hough transform 14 are the typical linear-form method in determining arc center and its radius for circle detection.
The need for smoothing
Noises in surface scanning affect the curvature estimation and surface verification precision, and noises must be preprocessed before evaluation. The curvature estimation formulations widely differ, but the central underlying assumption remains similar: the discrete curve corrupted by uncorrelated Gaussian noise. 15 Some curvature estimation methods15–18 can give reasonably good results for images with noiseless, real-valued range measurements. In fact, 3D datapoints are needed to be processed, and these methods concern the information in same cross section and do not concern the information between cross sections.
Wavelet analysis 19 inherited and developed the localization of Gabor window and Fourier analysis. Its transformation window becomes wide when the signal’s frequency is low and becomes narrow when the frequency is high. Wavelet analysis is good at analyzing nonstationary signals with wide-band noise. Excellent time–frequency localization, good approaching property, and multilayer characteristics are standout properties of wavelet analysis.
A classical wavelet-choosing principle is that choosing the wavelet waveform similar to transient signals to be tested and a smooth wavelet function. The quasi-cylindrical surface is a complex surface consisted of smoothed surfaces, and curvatures are changing gradually. Indistinct features and manufacturing deviations bring difficulties in shape verification. Noises in the actual scanning process make things even worse. It is difficult to choose a wavelet waveform similar to transient signals to be tested.
The actual shape of the quasi-cylindrical surface could be obtained by eliminating the noises from the scanning data. Daubechies wavelet is employed to conduct noise elimination because under the same conditions of vanishing moments, Daubechies wavelet has the smallest compact support. The 3D Daubechies wavelet is employed in this article, and practical case demonstrates its effectiveness.
Quasi-cylindrical surface verification
The datapoint information was analyzed to determine whether the measured part is conformed to the tolerance specifications. Different verification algorithms produced different results even with the same set of datapoints. This problem is especially true for form tolerances, which control how close to perfect form a feature must be. 20 The 3D noncontact measurement datapoints are employed to evaluate the quasi-cylindrical surfaces, and the verification procedure shown in Figure 2 is given as follows:
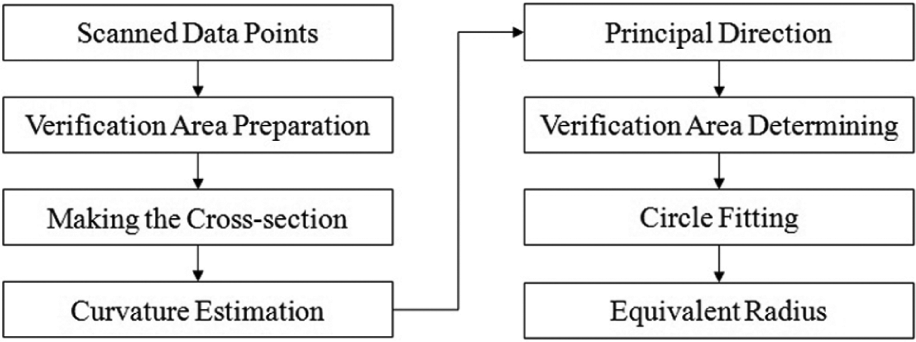
The flowchart of the quasi-cylindrical surface verification procedure.
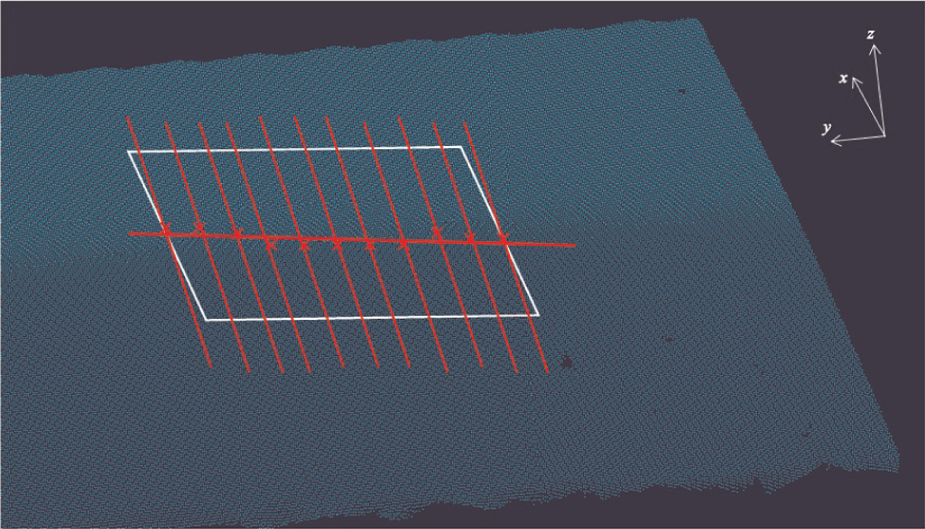
Scanning the evaluation area and obtaining the surface point cloud. Selecting a rectangle, L×W, as an evaluation area (Figure 3). The different rectangle is selected for verification according to the different surfaces of the different objects. Determining the principal direction using Gaussian image from point cloud (section “Principal direction based on Gaussian image” will discuss it in detail).
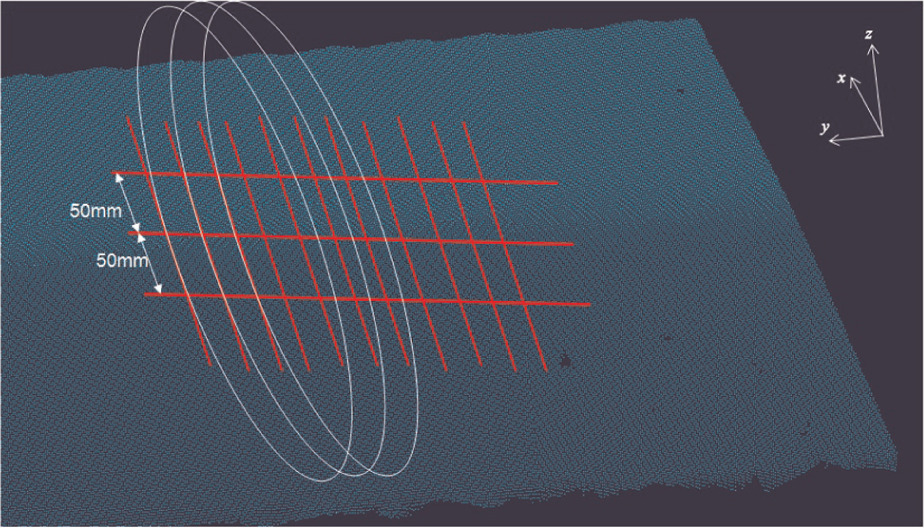
Making the cross sections in the direction perpendicular to the principal direction, the interval between each cross section was ΔL (Figure 4).
Choosing the maximum curvature point as the reference point (Figure 5) according to the evaluation requirements of quasi-cylindrical surface (section “Curvature estimation and circle fitting” will discuss it in detail).
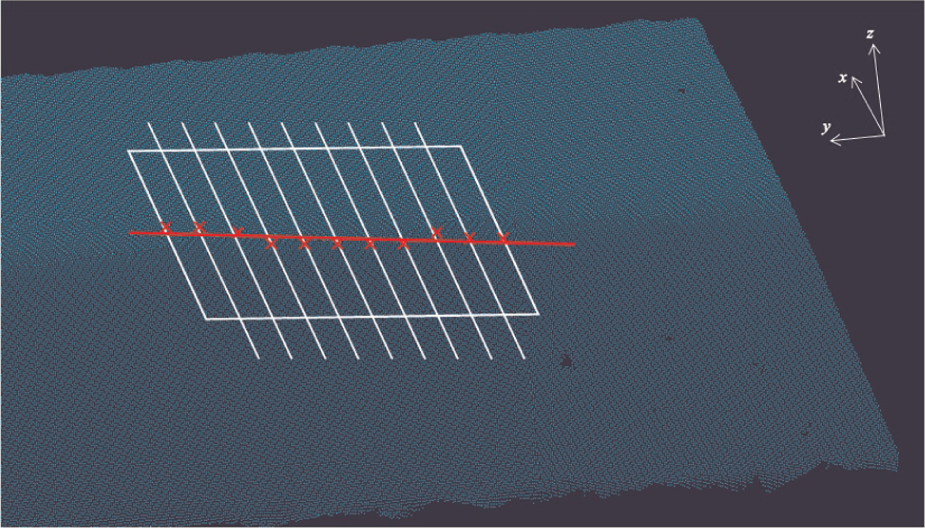
Along the curved surface, parallel to the principal direction, using the least square method to fit the maximum curvature point to get a straight line (Figure 6).
Constructing nine new cross sections in the direction perpendicular to the straight line, the interval between each cross section is fixed to ΔL (Figure 7).
Taking the line as the centerline and expanding the line to both sides, respectively, W/2 (Figure 8), the evaluation width is obtained. Fitting the point cloud within the evaluation width W with a circle, the radius was ri.
Using the average radius r of all ri as the evaluation of quasi-cylinder shape.
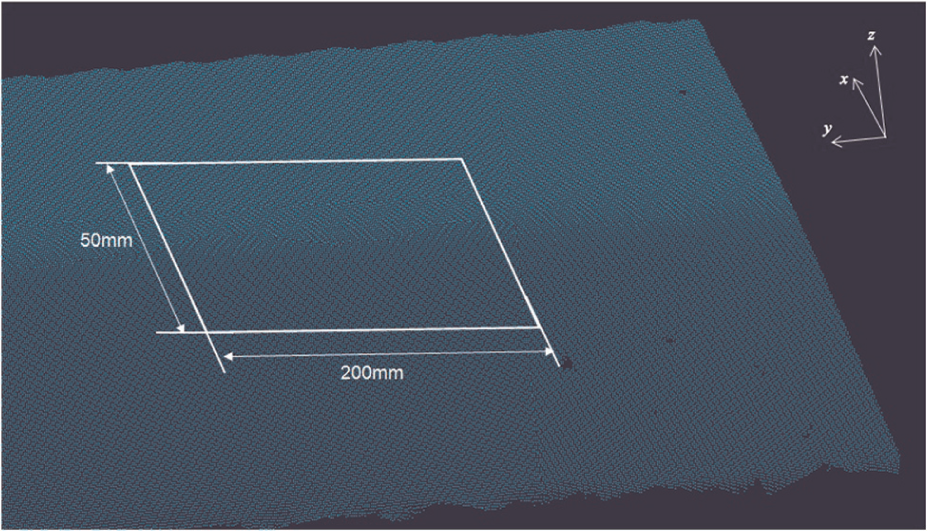
Evaluation area.
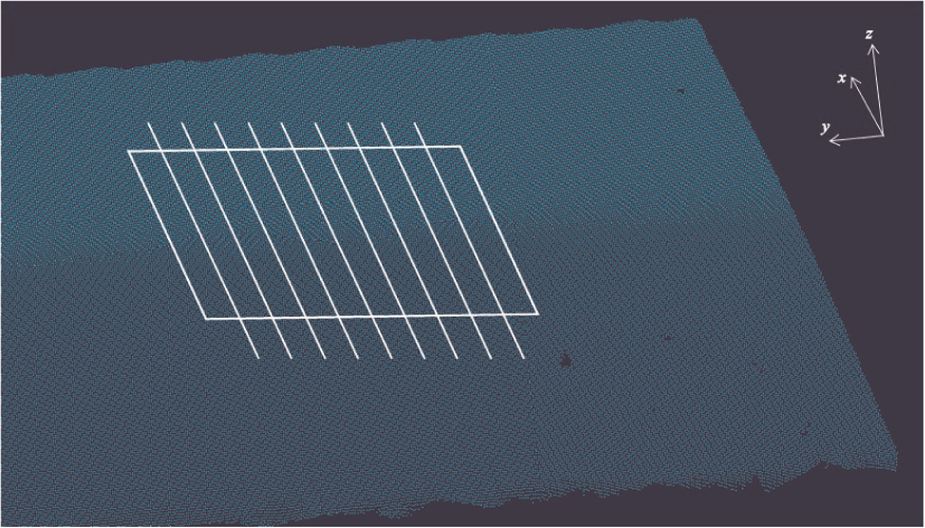
Cross sections.
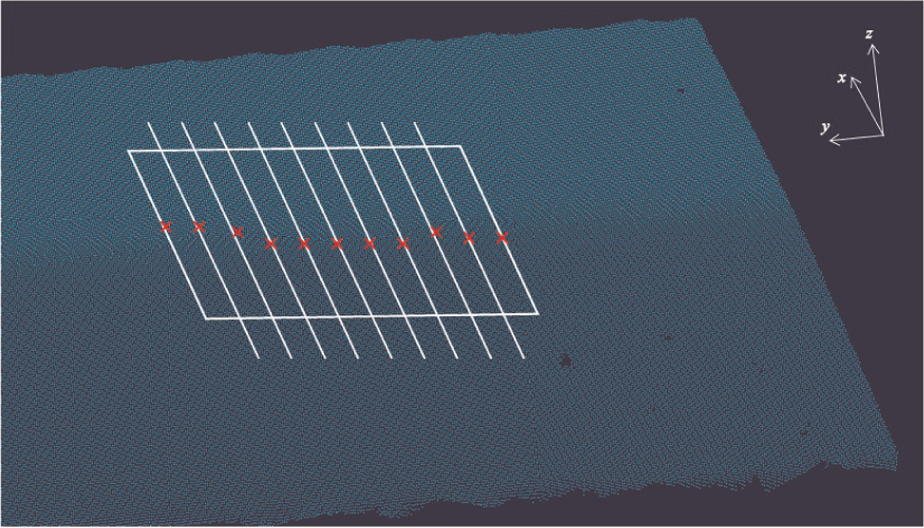
Reference points.
Maximum curvature point.
New cross section.
Fitting width.
The leading edge is a quasi-cylindrical surface. The leading edge radius changes smoothly along the axial direction. Several radii are needed to represent the whole shape of the leading edge. At the same time, the 3D noncontact measurement system could not cover the whole leading edge in one scanning. The registration errors during the course of multiple point clouds are registered together to represent the whole leading edge (Figure 9).
Radius of wing leading edge.
The following sections discuss the detailed problem during the course of quasi-cylindrical surface verification.
Principal direction based on Gaussian image
Gauss introduced the notion of mapping of surface normals onto the surface of a unit sphere by means of parallel normals, 21 where each point on a map is the result of the intersection of the surface normal vector, transferred parallel such that it emanates from the center of the unit sphere, with the surface of the unit sphere. The region on the surface of the unit sphere so produced has come to be known as the Gaussian image.
Definition: Gaussian image
Let
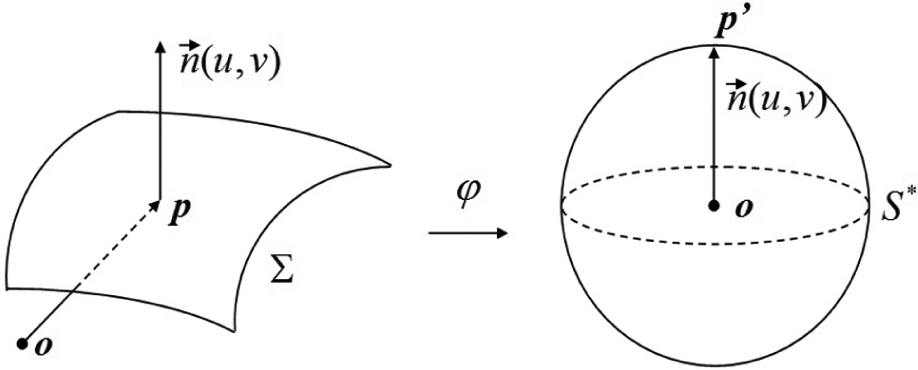
Gaussian image.
The Gaussian image is a representation of the surface normals. The Gaussian image 21 provides information such as the directions that may potentially be used for determining the principal direction of cross section. The principal direction of quasi-cylindrical surface is the direction of its rotational axis. Gaussian image of the points on wing leading edge should be in the great circle of the sphere (Figure 11). Principal direction is defined based on this property. The cross section is determined once the principal direction is found.
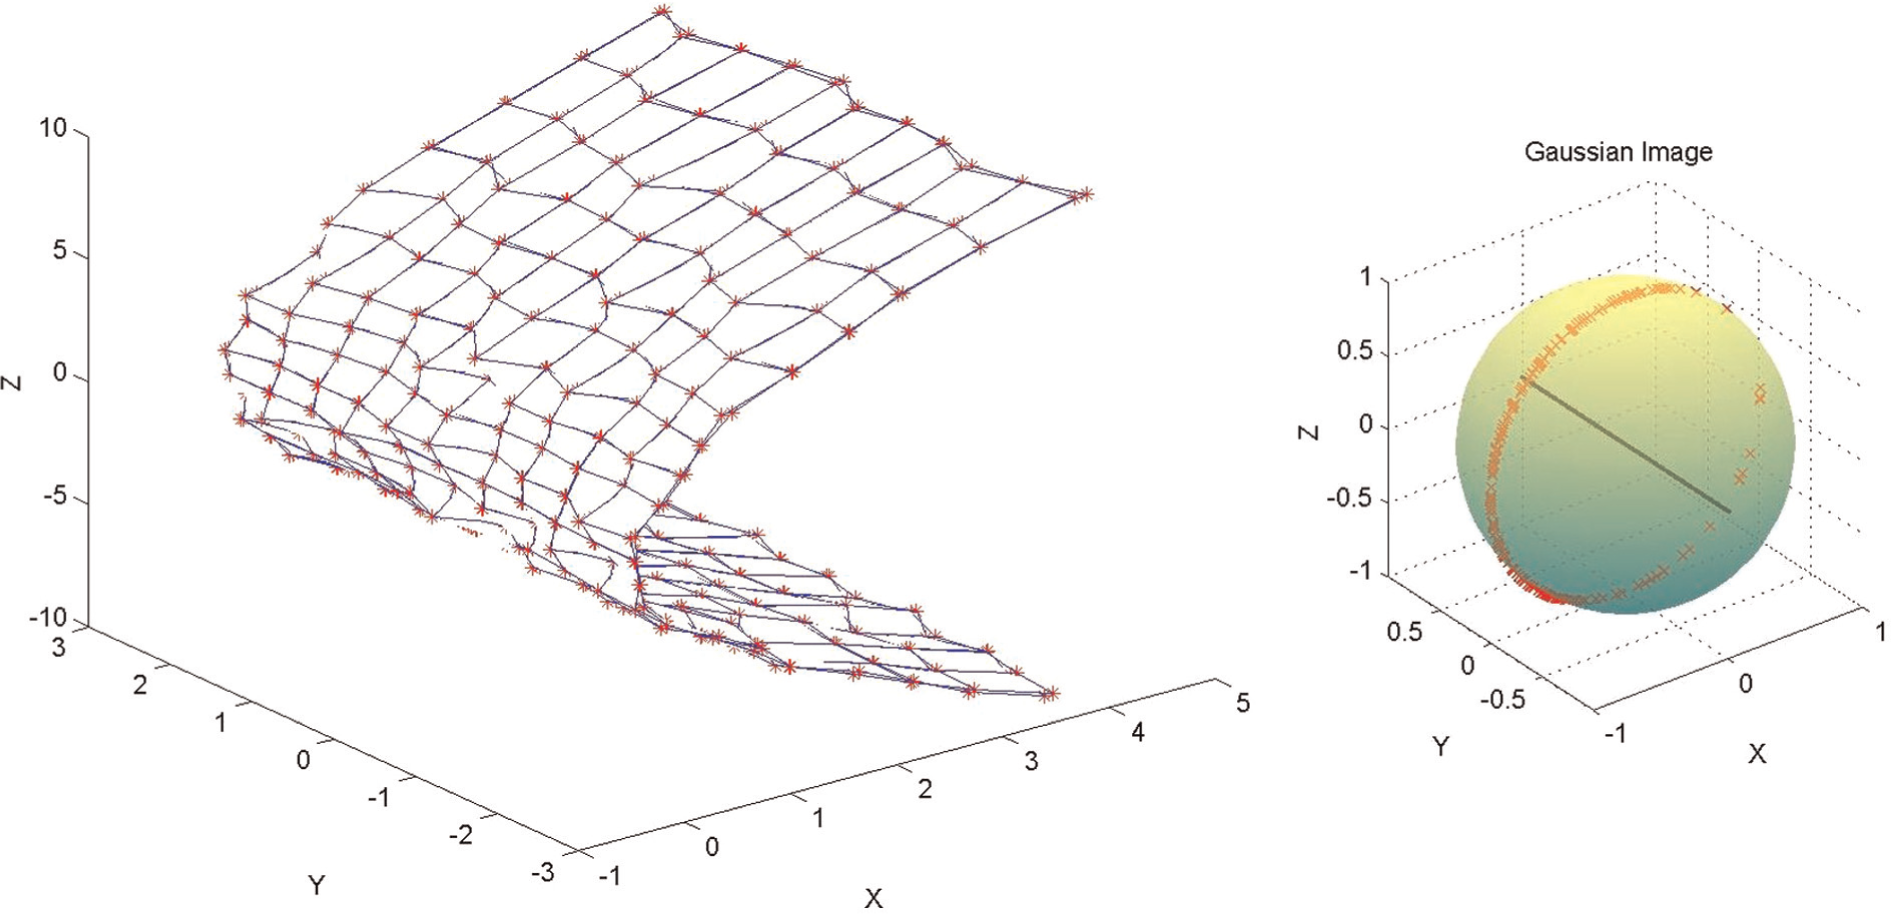
Principal direction determined by Gaussian image.
Datapoints used in Figure 12 are the data filtered with wavelet analysis. Datapoints with noises will reduce the precision of principal direction determining.
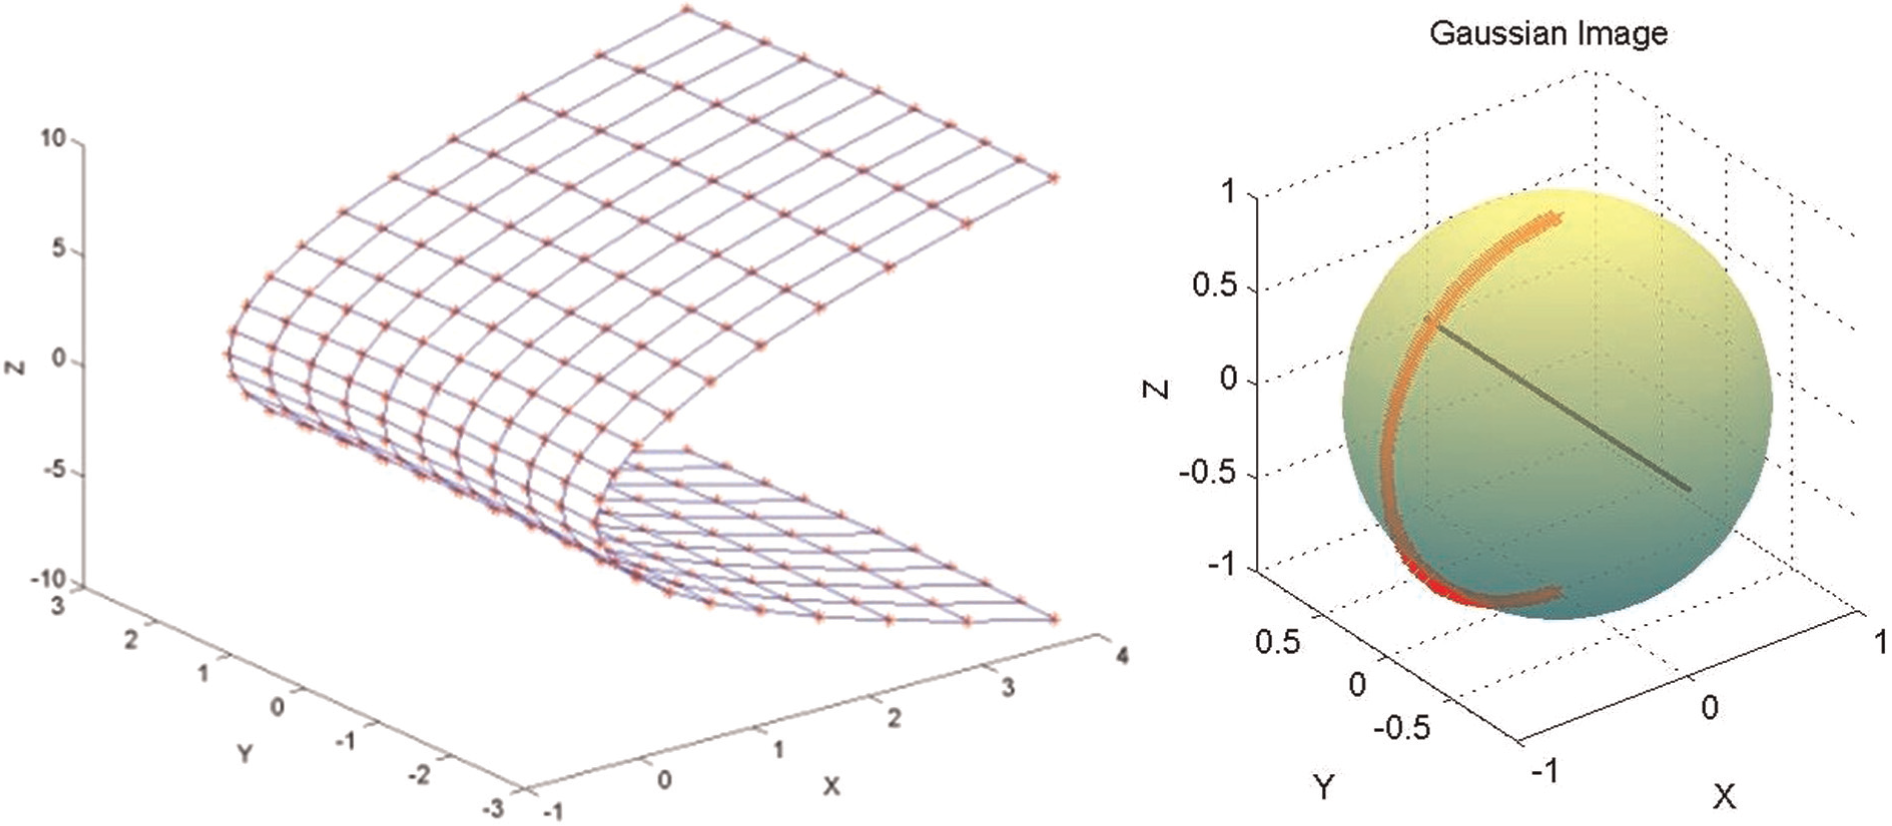
De-noise data and Gaussian image.
It is an input adaptive and feature-based method that determines the principal direction based on Gaussian image. The whole process of finding principal direction is independent of the coordinate system. It improves the practical measurement convenience greatly.
Curvature estimation and circle fitting
Reference point is a key note in quasi-cylindrical surface verification. Vertex of the wing leading edge is the point that has the maximal curvature (Figure 13). Vertex point is chosen as the reference point in quasi-cylindrical surface verification.
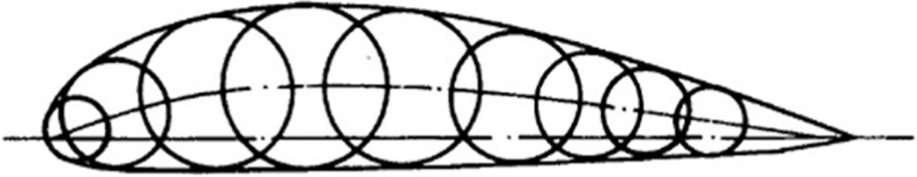
Radius of wing leading edge.
Orientation of the point cloud is important to curvature estimation. Based on the literature concerning curvature estimation, vertex of wing leading edge has been placed in an ideal pose. It should be avoided that the vertex of the wing leading edge be perpendicular to the coordination. That was one reason for Gaussian image selection.
Digital curvature is computed from a discrete set of points. 3D noncontact measurement point cloud is the digital representation of pre-digitized wing leading edge. 10 Measurement direction is important to point cloud registration and curvature estimation. Gaussian image is independent of the coordination during the course of principal direction determination. Good scanning direction could be determined as a need of curvature estimation in order to improve the curvature estimation precision.
Datapoints employed to circle fitting (Figure 14) are the original scanning datapoints and the datapoints filtered by wavelet analysis. Datapoints with noises will deteriorate the precision of reference point determining and circle fitting. The least mean square circle fitting methods12,13 were employed to determine arc center and its radius.
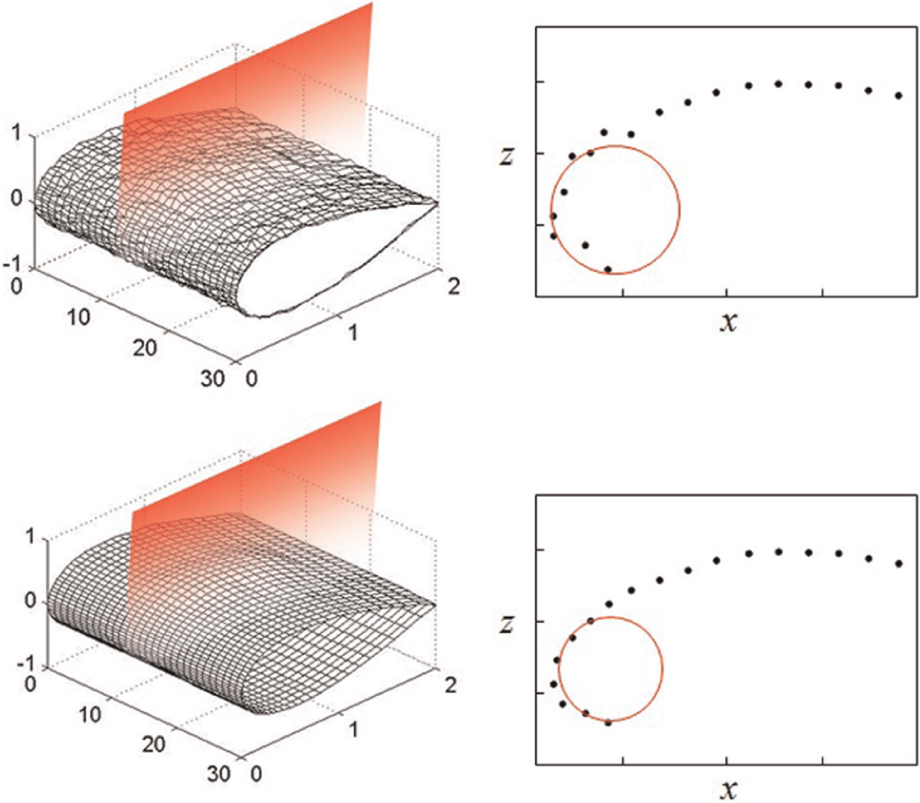
Circle fitting of scanning datapoints.
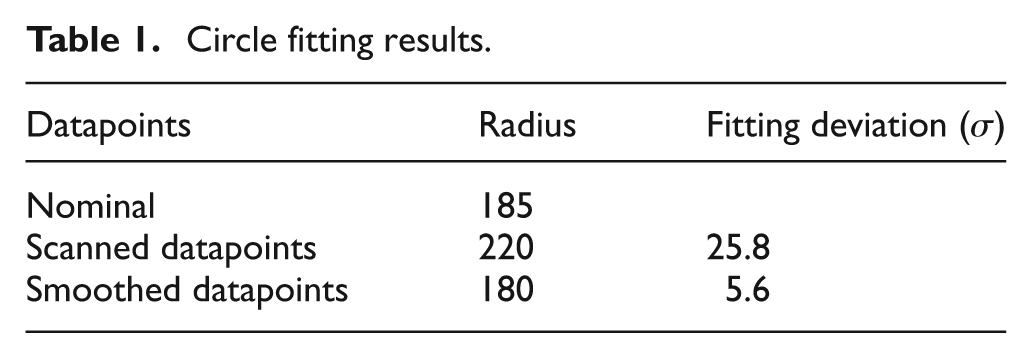
Circle fitting results of the original scanning datapoints and the datapoints filtered by wavelet analysis are given in Table 1. Results given in Table 1 demonstrate the good performance of datapoints smoothing.
Circle fitting results.
Datapoints smoothing
3D wavelet filtering
Noises in the measurement or scanning affect the estimation of the curvature and ultimately bear on the reference point for verification. Datapoints smoothing methods described earlier are only concerned about the information in the same cross section and not the information between cross sections.
The 3D wavelet concerns the information between cross sections and the whole surface features in the 3D space. The 3D wavelet is employed to conduct datapoints smoothing (Figure 15). Principal direction determining and circle fitting have demonstrated the effectiveness of 3D wavelet filtering.
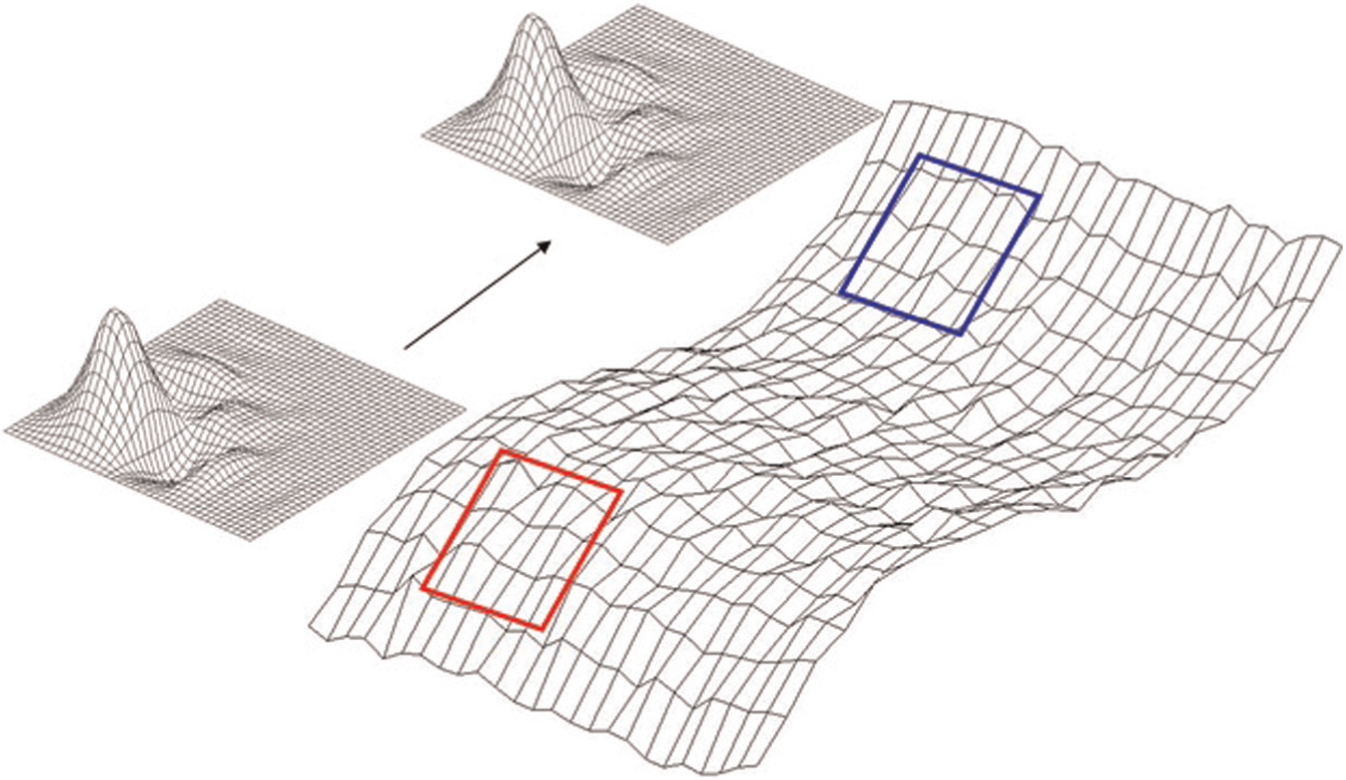
Three-dimensional wavelet filtering.
Daubechies 4-order wavelet is employed to conduct filtering. Original datapoints and filtered datapoints are shown in Figure 16.
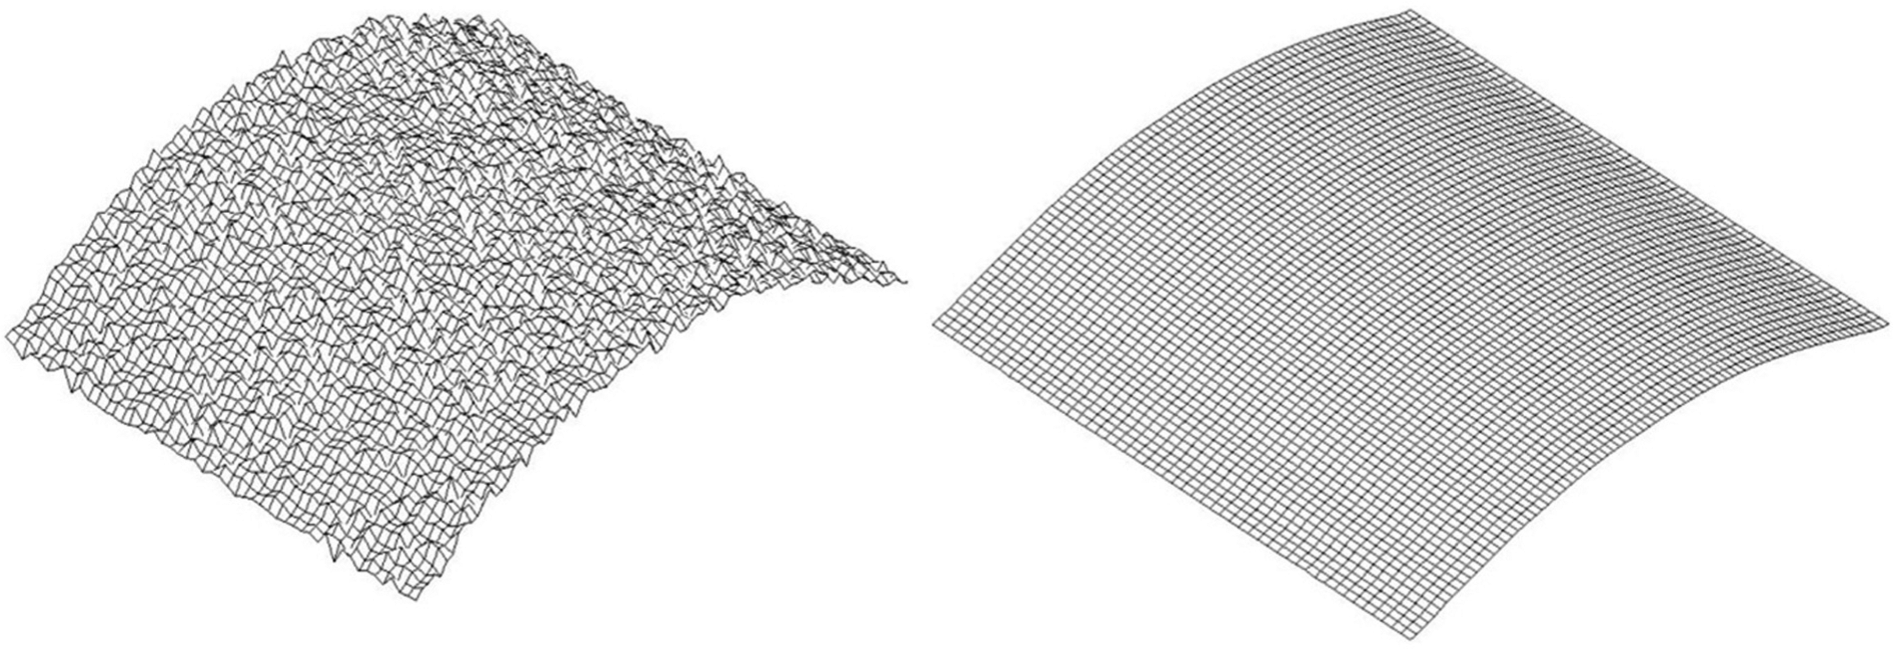
Scanned datapoints and filtered datapoints.
Which wavelet filtering level to stop
The wavelet filtering level is a critical parameter in the wavelet filtering algorithm. It is a critical problem during the course of wavelet analysis in deciding at which filtering level to stop. The difference between original datapoints and wavelet-filtered datapoints is considered as noises in the measurement or scanning, and these noises are normally distributed. Different filtering levels result in different wavelet-filtered noises. Noises that fit normal distribution best might serve as a criterion for which filtering level is to stop.
K. Pearson
22
proposed a parameter
As far as datapoints smoothing in this article is concerned, it is appropriate to use the chi-square test (
Daubechies 4-order wavelet is employed to smooth the practical datapoints. The results of practically smoothed surface after wavelet filtering at levels 1 and 5 are listed in Figures 17 and 18, respectively. The chi-square test is used to verify the goodness of fit of these two variations.
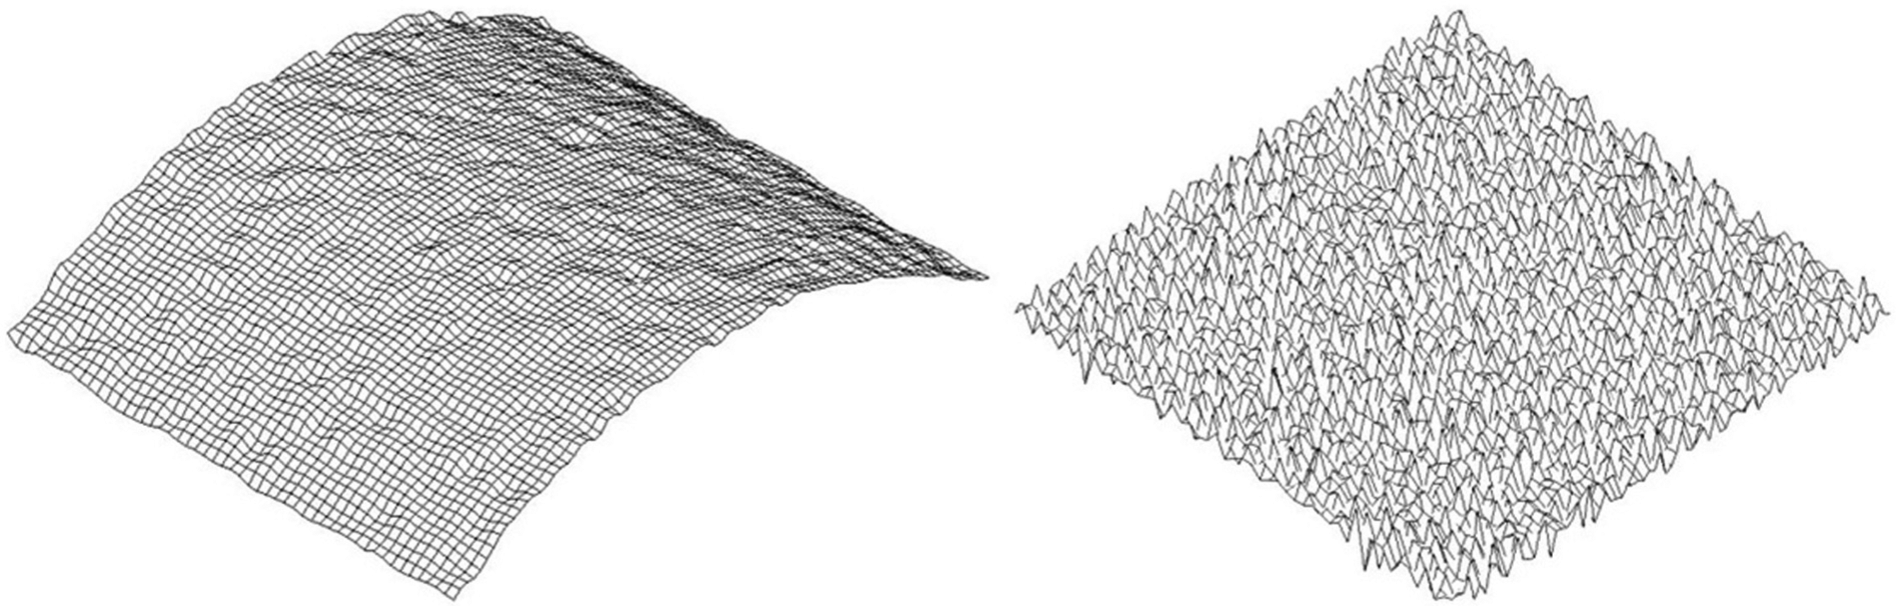
Approximation part and detail part obtained in wavelet filtering level 1.
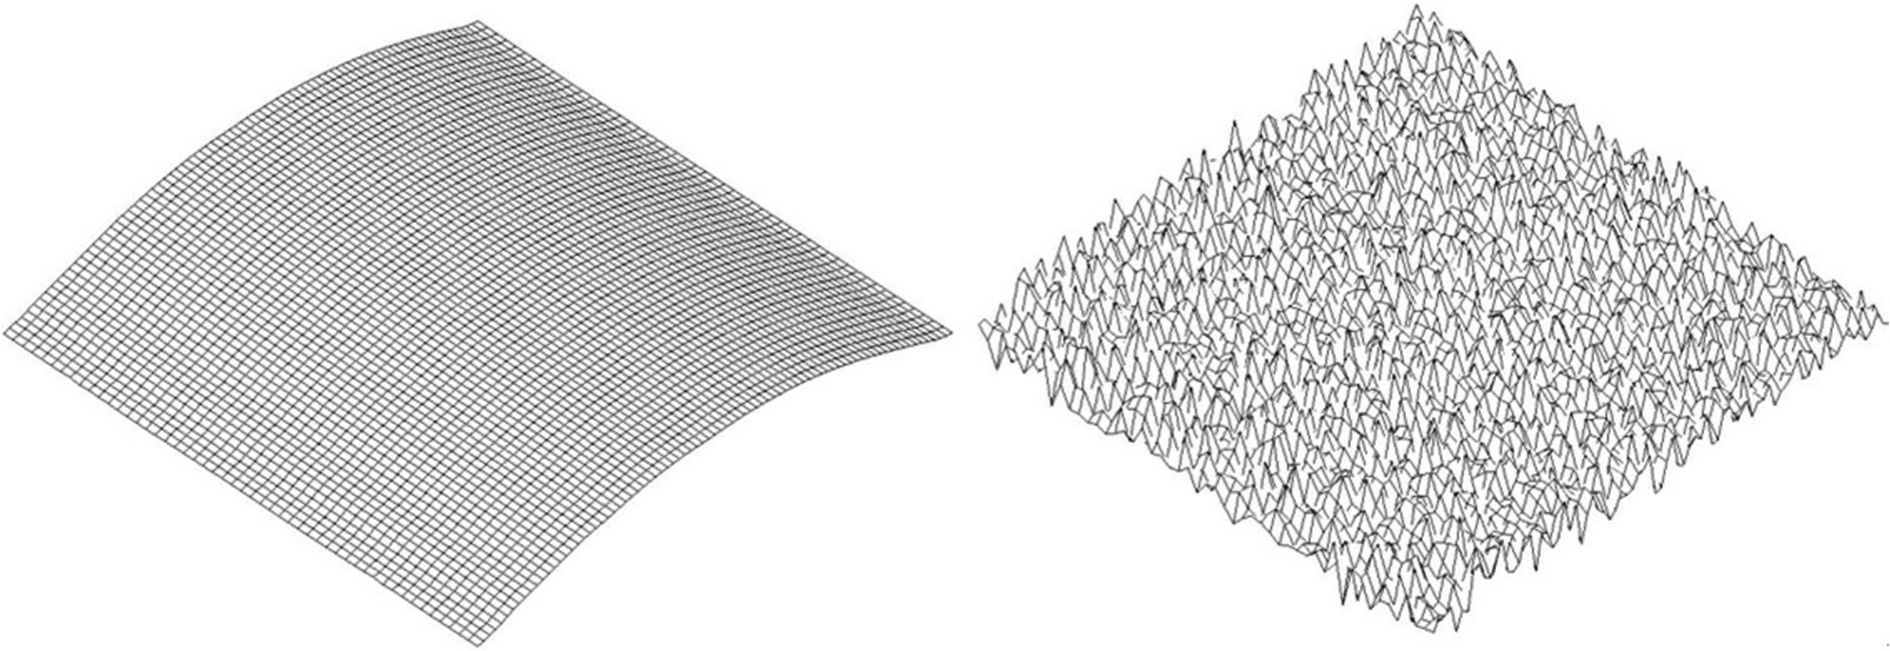
Approximation part and detail part obtained in wavelet filtering level 5.
Chi-square test results are obtained at confidence level
Chi-square test table.
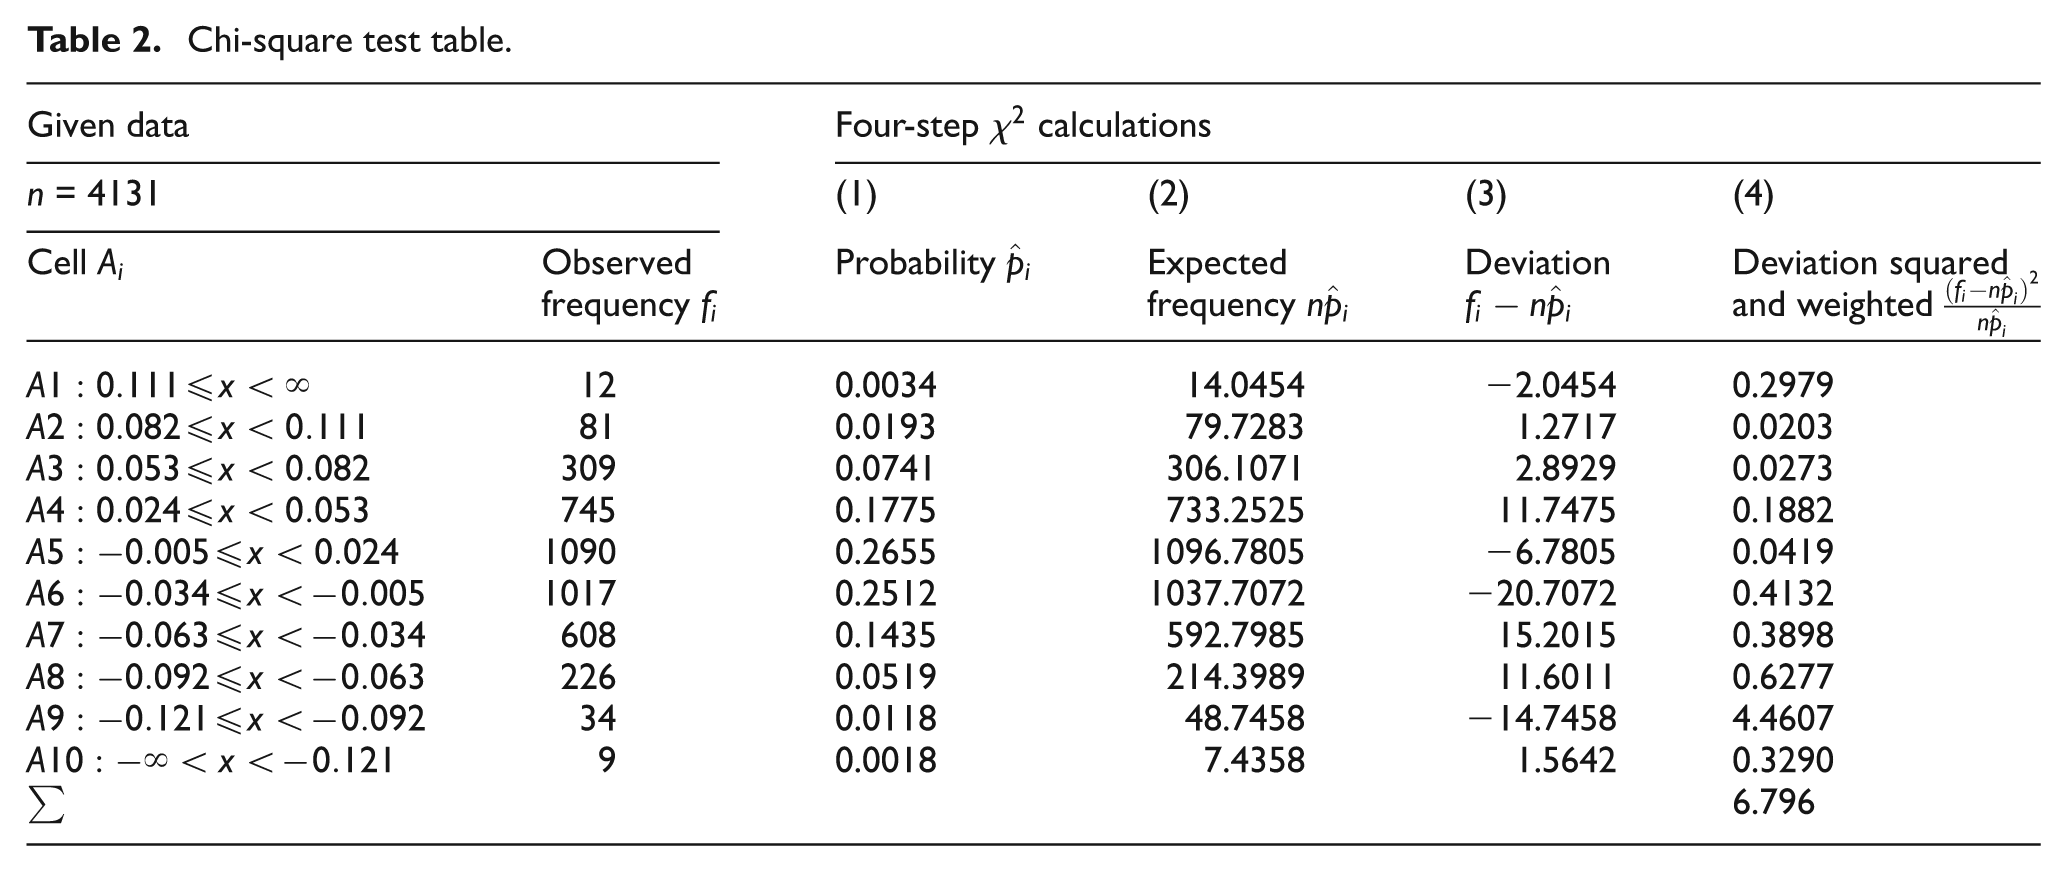
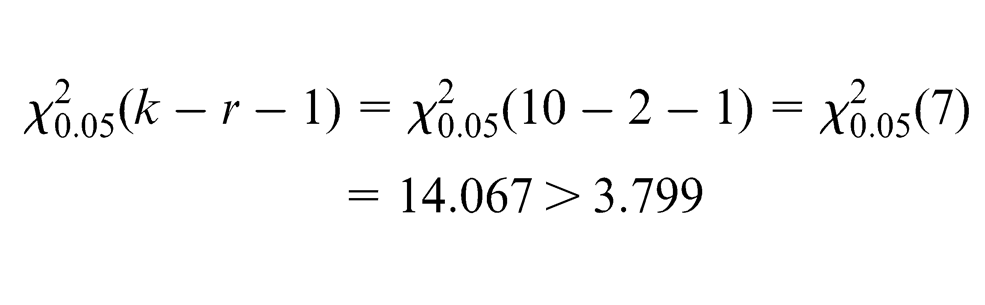
If there are 10 cells during the course of calculation, then k = 10. Two parameters, the mean and the standard deviation, are estimated during the course of calculation and then r = 2. From standard

For detail part at level 2, we get similar result as follows
For detail part at level 3, we get similar result as follows
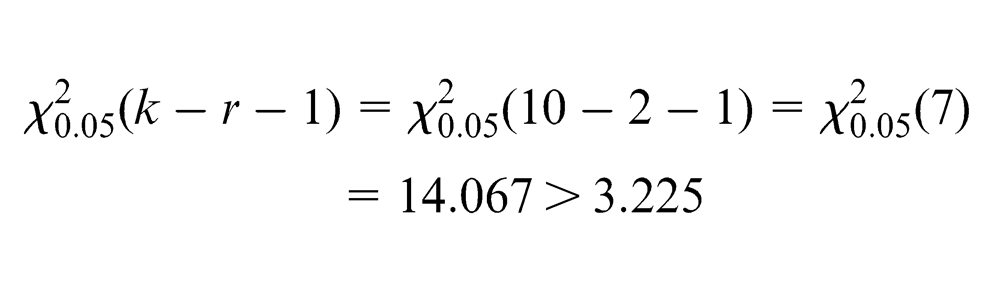
For detail part at level 4, we get similar result as follows
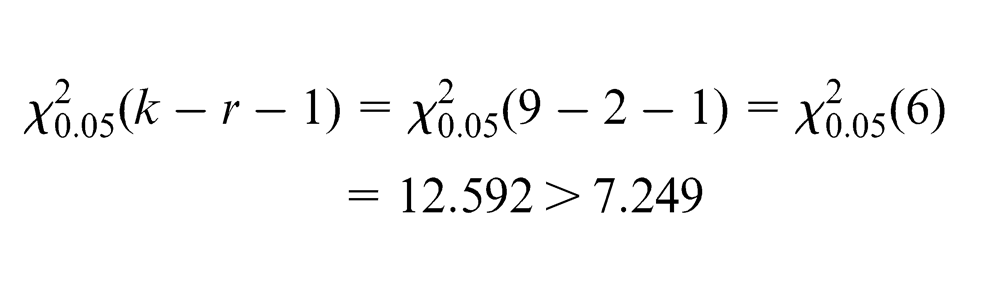
For detail part at level 5 (Figure 4), we get similar result as follows
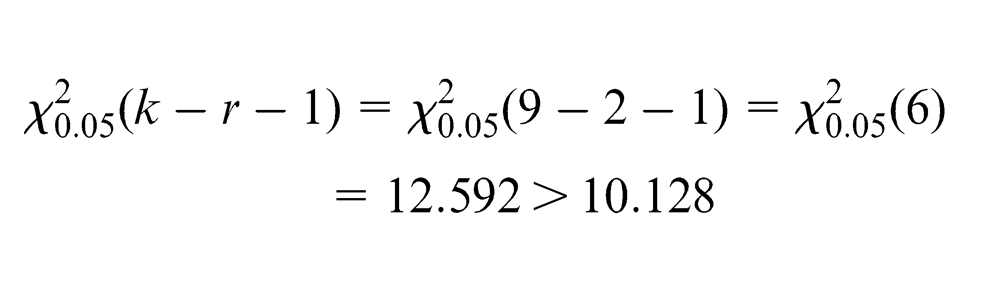
Detail parts at levels 1–5 are all normally distributed at the confidence level
Conclusion
Transitional surfaces and idiosyncratic surfaces in complex product are designed for specific requirements or surface smoothing. The verification algorithm of these surfaces is the foundation for shape control. Quasi-cylindrical surface is a kind of idiosyncratic surface. Quasi-cylindrical surface’s curvature is changing smoothly, which is deliberately designed according to functional requirements. That is, there are no distinct features in these surfaces. Traditional indices are not fit for quasi-cylindrical surface verification. More scanned datapoints are employed in surface verification. There is a strong need to develop new verification algorithm for quasi-cylindrical surface.
An efficient and robust verification algorithm based on equivalent radius and Gaussian image for quasi-cylindrical surface verification is proposed in this article. Gaussian image is employed to determine the principal direction of scanned datapoints. It is the maximum curvature principle that determines the reference point for verification.
Noises in the datapoints are hurdles on the road of the curvature estimation. The 3D wavelet filtering method is employed to conduct datapoints processing because it concerns the information between cross sections or 3D information. Good performance is obtained in the process of surface verification by the demonstration of principal direction determination and circle fitting.
The results of this research will enhance the understanding of the complex surface evaluation, especially quasi-cylindrical surface verification, and help systematically improving the verification efficiency and precision.
Footnotes
Declaration of conflicting interests
The authors declare that there is no conflict of interest.
Funding
This work was supported by the National Natural Science Foundation of China (grant no. 51275308), the National Basic Research Program of China (grant no. 2010CB731703), the Fund of National Engineering and Research Center for Commercial Aircraft Manufacturing, and the Open Fund of Shanghai Key Laboratory of Digital Manufacture for Thin-walled Structures.