
Abstract
Recent research by the authors has resulted in the conception of several methods of accounting for direct electrical effects during an electrically assisted manufacturing process, where electricity is applied to a conductive workpiece to enhance its formability characteristics. This modeling and analysis strategy accounts for both mechanical effects and heat transfer effects due to the applied electrical power. This study presents a sensitivity analysis and explanation of several key material and process inputs during an electrically assisted forming test on Stainless Steel 304 and Titanium Grades 2 and 5 specimens. First, the effect that the specific heat (Cp) value has on the model will be discussed and compared with another lightweight material. Second, the significance of all three heat transfer modes (conduction, convection, and radiation) will be noted, and any possible simplifications to the existing heat transfer model will be highlighted. Third, the general electroplastic effect coefficient profile shape for the Stainless Steel 304 material will be compared to that of titanium alloys. Fourth, a frequency analysis will be done on the data taken during the experiments, by way of a Fast Fourier Transform, and the variation of frequency response with the electric input is studied. Overall, this study provides insight into several factors affecting a material’s electroplastic effect coefficient profile and also compares resulting electroplastic effect coefficient profiles of various materials.
Keywords
Introduction
As continuous pressure is applied to the automotive industry to cut weight, enhance performance, and improve the fuel economy of vehicles, the industry looks for innovative manufacturing technologies to assist in breaking the barriers between material and vehicle design and current manufacturing capabilities. Not only innovative processes and techniques are desired, but modeling strategies, which prove the predictability and sensitivities of these new processes and techniques, need to be devised. In the following subsections, an innovative lightweight manufacturing technology and its modeling capabilities will be explained.
Electrically assisted manufacturing
Electrically assisted manufacturing (EAM) is a metal forming technique where the metal workpiece formability is increased due to the application electricity that is applied simultaneously during plastic deformation. These formability improvements can be described as reduced forming forces, increased elongation percent, and reduced postforming springback effects. Although heating of the workpiece is inevitable, the increase in temperature due to resistive heating from the applied electricity has been proven to only account for up to 20% of the total formability improvements during electrically assisted forming (EAF). 1 More specifically, there are atomic level direct electrical effects that help to transform strong, brittle metals into highly formable blanks. The EAM technique can be applied to various different manufacturing processes, including bulk deformation, sheet metal forming, and joining procedures. 2
EAM research history
In the mid-20th century, early studies by Machlin, 3 Kravchenko, 4 Nabarro, 5 and Troitski 6 all played a role in the conceptualization of what is now termed EAM.3–6 Key works by both Conrad. 7 and Roth et al. 8 helped to highlight this research in the United States. Over the last several years, much experimental study has been done to explore the EAM technique added to different manufacturing processes and applied in various ways.9–14 Salandro et al. 9 explored pulsing the electrical current (rather than applying it continuously) to reduce the flow stress of 5xxx Al alloys deformed in uniaxial tension. Another study investigated the effects of coupling several electrical parameters, including current density (CD) and pulse duration. 10 Green et al. 11 explored the effectiveness of EAM at reducing or eliminating postforming springback effects in Al6111 sheet specimens. Additionally, McNeal et al. 12 investigated post-EAF-formed microstructure of Mg AZ31B-O to determine the effect that EAF had on the metal. Over the last decade, the amounts of researchers and research institutions that have adopted any type of EAM-related research have increased exponentially. One reason for this is that EAM is a technique that can be applied to almost any metal forming manufacturing process. As explained in the study by Salandro and Roth, 2 EAM can be conceptualized for use in bulk deformation processes (forging, extrusion, rolling, and so on), sheet metal forming processes (stamping, stretch forming, and so on), and joining processes (friction welding, friction stir welding, and so on).
Thermomechanical EAM modeling
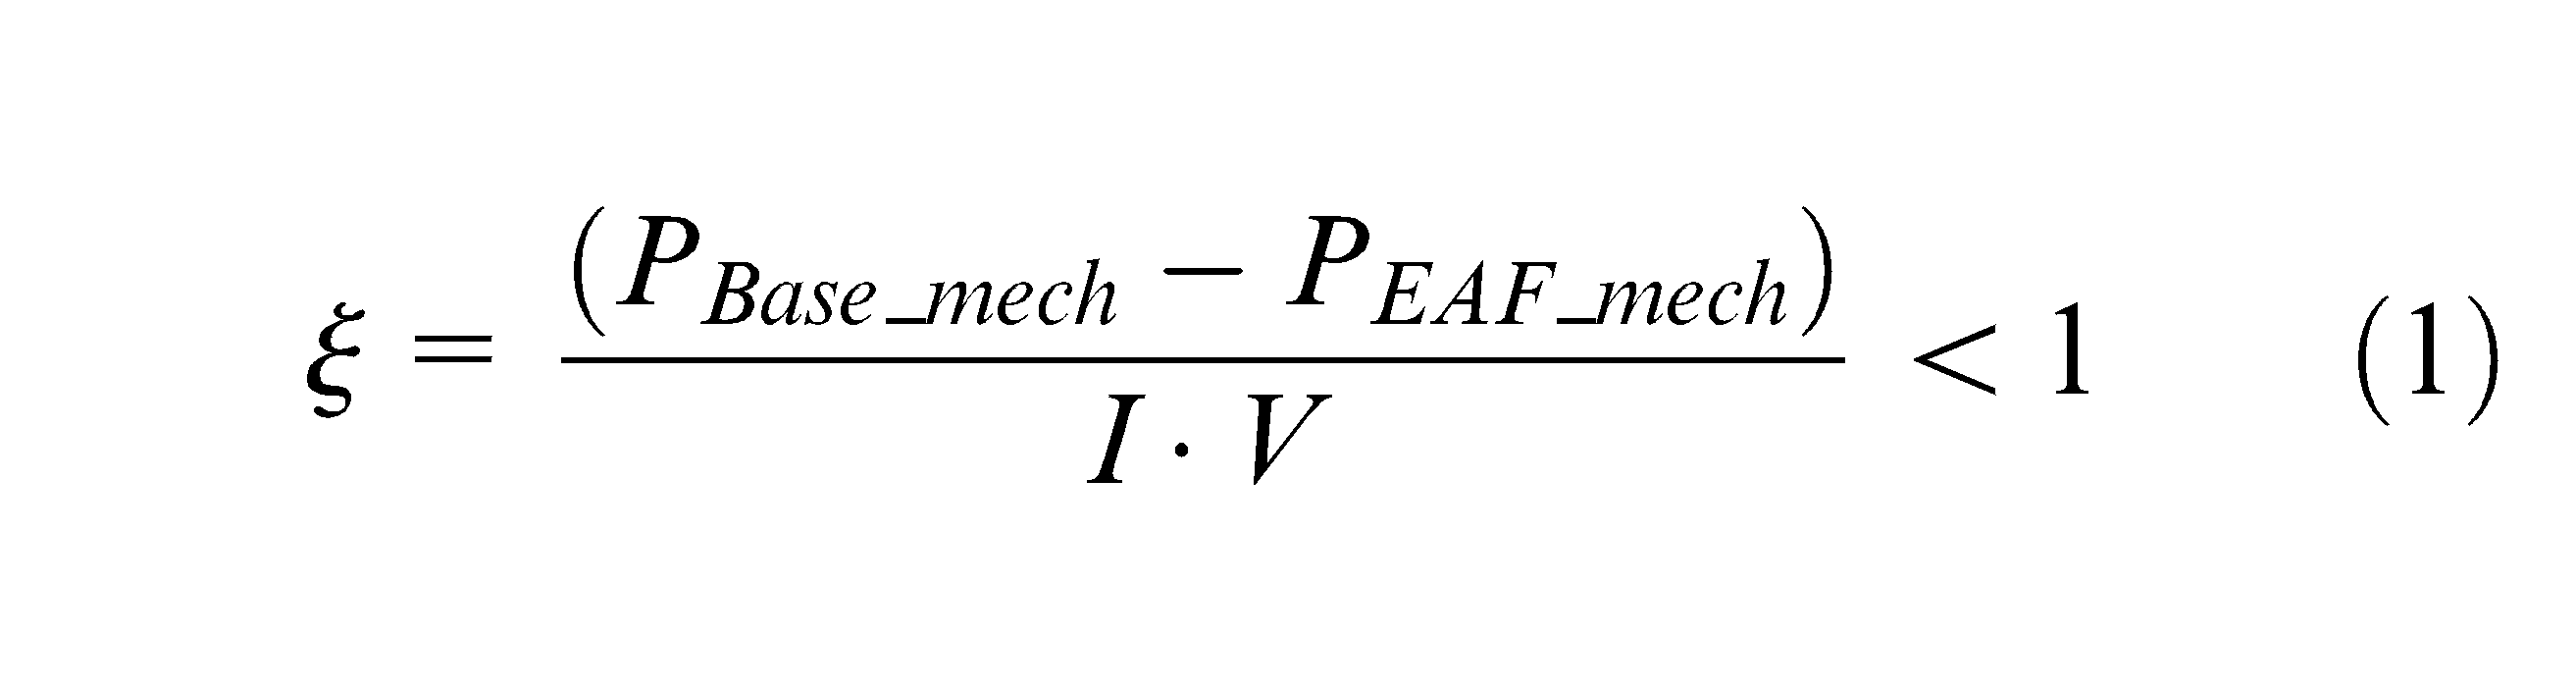
Previous researchers have investigated finite element analysis (FEA) as a method for modeling EAM effects. 15 Previous study by the authors has led to the development of a thermomechanical model for EAM. 16 The basis for the model is that all of the applied electrical power input into the EAM process contributes toward either (1) assisting plastic deformation (i.e. the electroplastic effect) or (2) resistive heating effects. To determine the electroplastic effect coefficient (EEC or ξ) profile (or profile of the “useable” electricity over the test), the authors have devised two methods. The first method involves comparing mechanical power profiles of a non-EAF baseline test (P Base_mech ) and an EAF test (P EAF_mech ) and then normalizing the differences with respect to the magnitude of the applied electrical power. 17 This can be seen in equation (1), where I and V are set current and voltage intensities. The result is normally a second-order polynomial function, as shown in equation (2)

The second method involves thermal profiles of the specimens, rather than mechanical power profiles. Specifically, three sets of tests (non-EAF baseline tests, stationary electrical tests, and EAF tests) were run. Then, a power law approximation was used, and the coefficients were adjusted until the model thermal profile fits accordingly with the experimental thermal profile. 18 The result is a time-dependent EEC profile that can be represented with a power law approximation, as shown in equation (3)

where ξ0 is an initial value, which is dependent on specific material properties and the magnitude of the applied current, t represents the time of deformation, and a is an exponential term. This can be rewritten in terms of strain, as shown in equation (4), where

Objective and approach
The objective of this article is to take the current EAF modeling strategy, conceptualized by Bunget et al., and explain the sensitivities and relationships of the material and process inputs and the resulting EEC profile, which designates the direct electrical effects of EAF. The variation of the specific heat value in relation to the temperature will be analyzed. Additionally, the importance of the three heat transfer modes will be discussed, and any potential simplifications to the current heat transfer modeling strategy will be noted. Furthermore, the general shape of the EEC profile for Stainless Steel 304 will be described and compared to the EEC profile for Ti. Also, a fast Fourier transform (FFT) will be used to conduct a frequency analysis on the experimental data.
Experimental setup and procedure
Both Stainless Steel 304 (ASTM A 351 GR CF8) and Titanium (Grades 2 and 5) compression specimens were used in this study. Both of these materials were chosen because they are lightweight metals that have the potential to influence the transportation industry. The ASTM A 351 GR CF8 material is strong compared to its weight and can be used as a replacement for some plastics or composites, when both strength and durability are needed. 19 Titanium has an extremely high strength-to-weight ratio; however, its formability is very limited and hot forming can only be done at a small temperature window. However, there is a high demand for titanium in the automotive and aerospace industries for lightweight, strong, and fatigue-resistant designs, as long as a manufacturing method can be devised, which allows for easier forming of this material. EAF has been experimentally proven successful on all three of these materials. All of the ASTM A 351 GR CF8 (SS304) specimens were produced from a single 4.61-mm-diameter rod and parted using an electrical discharge machining (EDM) operation. The Ti specimens were each made from a single rod of the respective grade, which was then centerless ground to 4.61 mm diameter. There were three types of tests performed: deformation under conventional conditions (Conv.), electrically assisted deformation tests (EAF), and stationary tests, when electricity is applied under static load and no deformation takes place. The electric input was quantified by the initial CD, or current flux, which can be described as the total current divided by the cross-sectional area of the component it is flowing through, in this case the initial cross-section of the specimen. Starting CDs of 10, 15, 20, and 25 A/mm2 were used, along with die speeds of 12.7 and 25.4 mm/min for the stainless steel specimens. The Ti specimens were tested with a starting CD of about 25 A/mm2 and a die speed of 12.7 mm/min. Let it be known that the focus of this study was EAF behavior of ASTM A 351 GR CF8, and that the Titanium results were solely used to compare the EEC profiles and natural frequencies, as will be explained in the “Results and discussion” section. The summary of the tests is presented in Table 1.
Test combinations for each material.
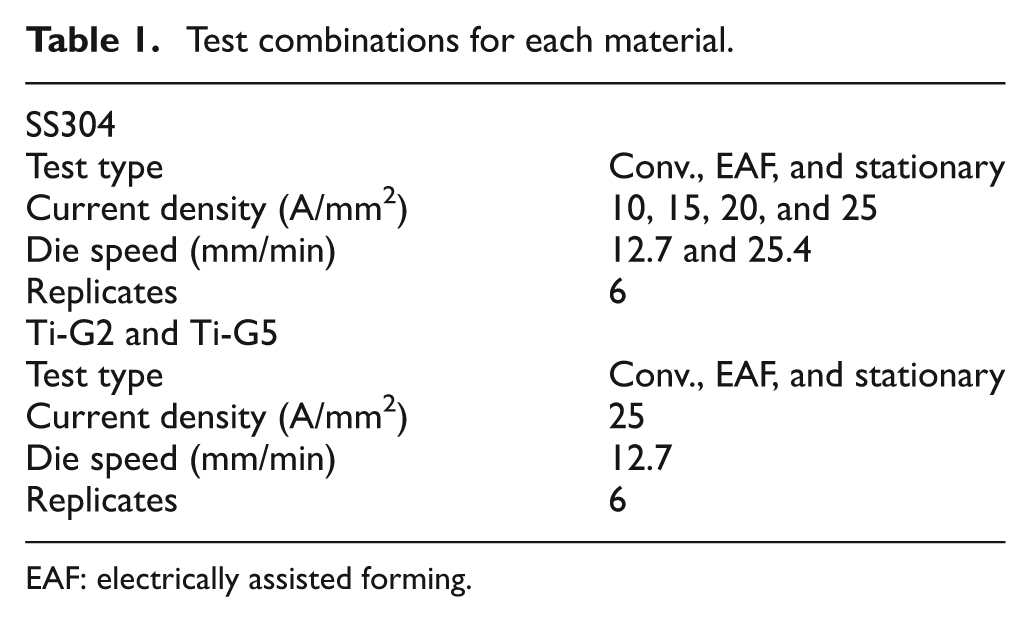
EAF: electrically assisted forming.
The EAF experimental setup can be seen in Figure 1. An Instron Model 1332 machine, equipped with insulated dies, was used to compress the specimens. The workpiece contact points of the dies were composed of A2 tool steel hardened to about 65 HRc. A FLIR A40M infrared thermal imaging camera was used to capture thermal videos of the specimens during the tests. The capacity of the thermal camera is 550 °C, and the resolution is 0.1 °C. Onboard data acquisition software was used to gather the force and position data for each test.
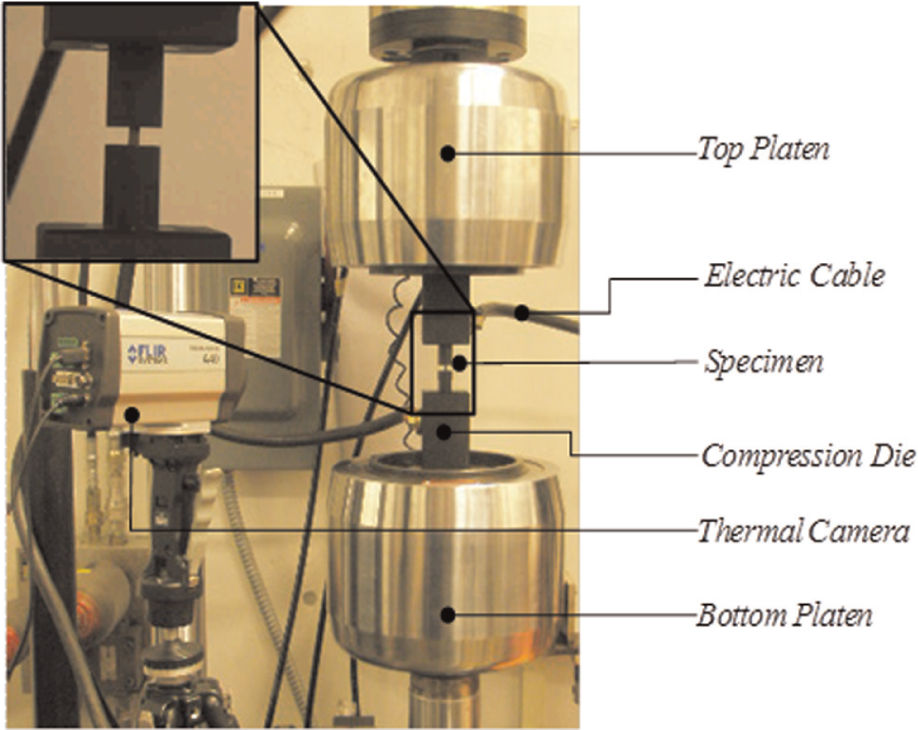
EAF experimental test setup.
Results and discussion
Within this section, there will be four subsections describing the specific heat sensitivity contribution toward EAF, a heat transfer modes analysis, an EEC profile comparison for SS304 and Ti, and finally a frequency analysis based on the same two metals.
Specific heat sensitivity
Although the heating effects from EAF are not a major contributor to the formability enhancements, these effects are utilized in the second EEC-determination method. Therefore, it is important to understand the effect that the temperature has on the specific heat of the material and ultimately on the EEC profile (i.e. the efficiency of the applied electrical power). In this analysis, specific heat sensitivities for both SS304 and Ti-G5 are evaluated at three different temperatures (conventional forming, EAF tests, and stationary tests). Figure 2 displays the relationship between the specific heat values and the temperatures for each metal (note that the maximum temperature that was reached during stationary testing at 25 A/mm2 for each material is denoted by an enlarged dot). Additionally, Table 2 lists the exact specific heat values used for each test description in the model per material. 20 The maximum temperature observed in each type of tests was considered, in order to observe the maximum variability in the results due to variation of Cp with temperature.
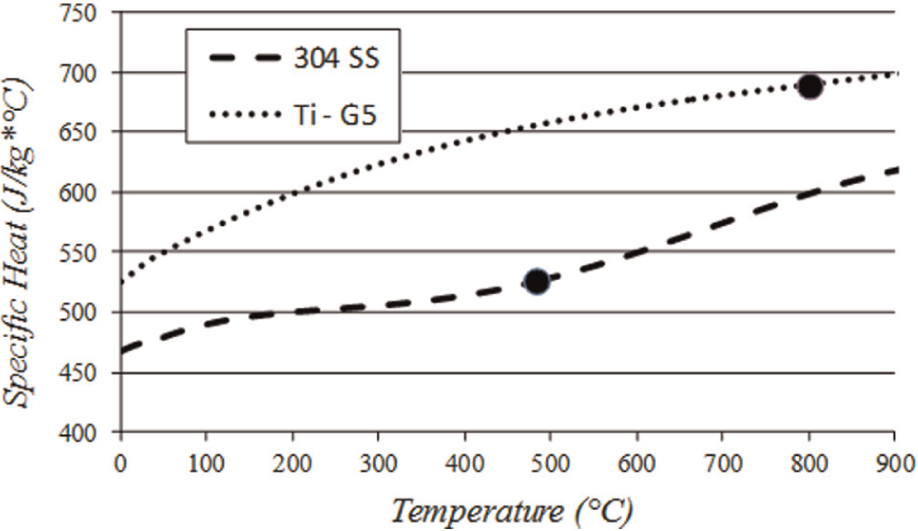
Specific heat profiles (SS304 and TI-G5).
Specific heat values used for analysis.
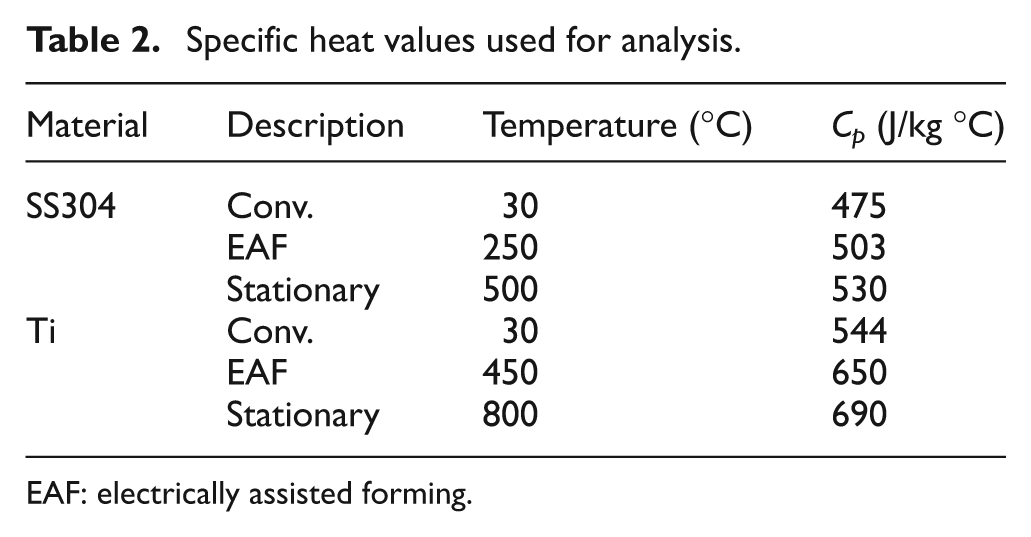
EAF: electrically assisted forming.
To analyze the sensitivities of the specific heat value, stationary electrical tests, where a nondeforming static load is applied to the workpiece and a constant electrical power is applied, were simulated using the thermomechanical predictive model developed by Kravchenko 4 and Troitskii. 6 Figure 3 displays the thermal profiles for stationary electrical tests with specific heat values representative of maximum temperatures witnessed during conventional, EAF, and stationary electrical tests for Ti-G5. Additionally, Figure 4 displays the same information for Stainless Steel 304.
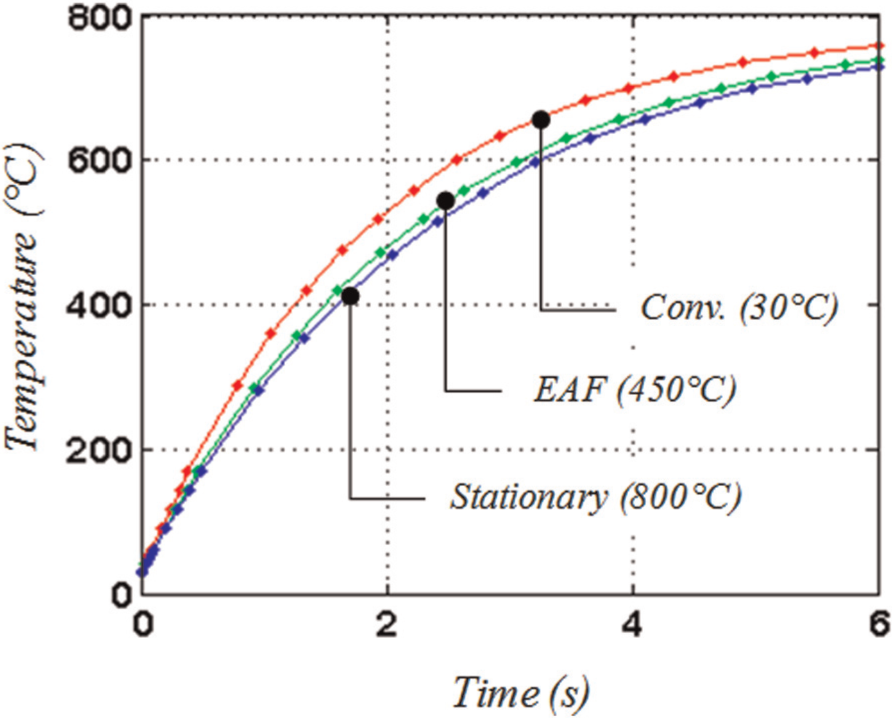
Specific heat sensitivity (Ti-G5).
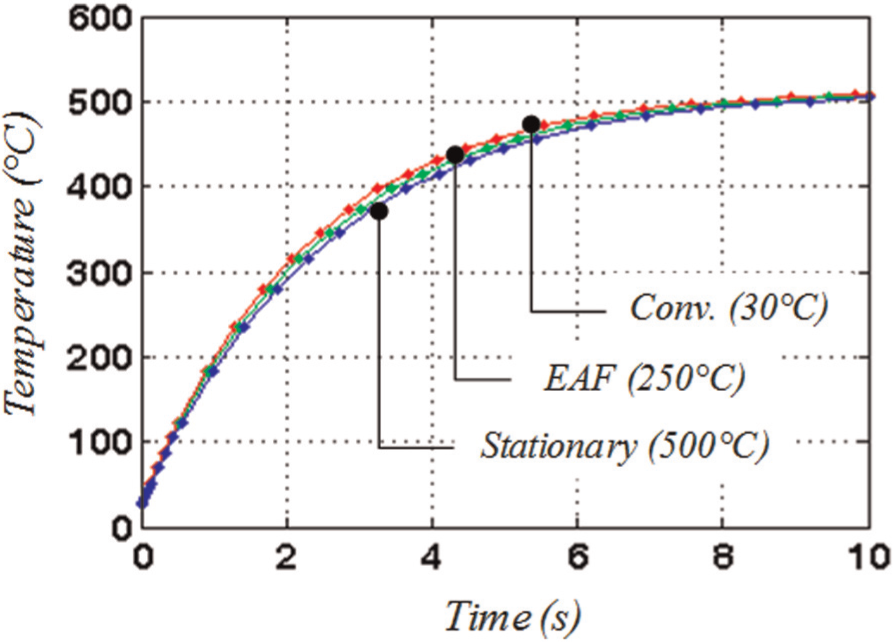
Specific heat sensitivity (SS304).
When comparing Figures 3 and 4, one can see that the specific heat of the Ti-G5 material was more dramatically affected, and this resulted in a larger variance in the specimen thermal profiles when using the three different specific heat values. One possible reason for this is the intrinsic specific heat property of the material and its relationship with temperature (Figure 2), coupled with the temperatures reached during testing. In this case, the Ti-G5 material had a slightly steeper specific heat versus temperature relationship, and the maximum temperature reached during the Ti-G5 testing was about twice the temperature reached during the SS304 testing. In summary, the specific heat of the material needs to be considered when modeling EAF. It is highly dependent on the temperature range reached during forming (between room temperature and the hottest electrical temperature). As the specific heat increases, the energy required to increase the temperature of the workpiece also increases, and this can lead to an overall cooler thermal profile. This is shown in Figures 3 and 4, where the thermal profiles using the highest specific heat values are the coolest.
Heat transfer modes analysis
As electrical power is input into a system, as in the EAM technique, some level of heating will take place. To this extent, heat will be lost by way of the three heat transfer modes (conduction, convection, and radiation). The temperature increase of the workpiece can be represented by
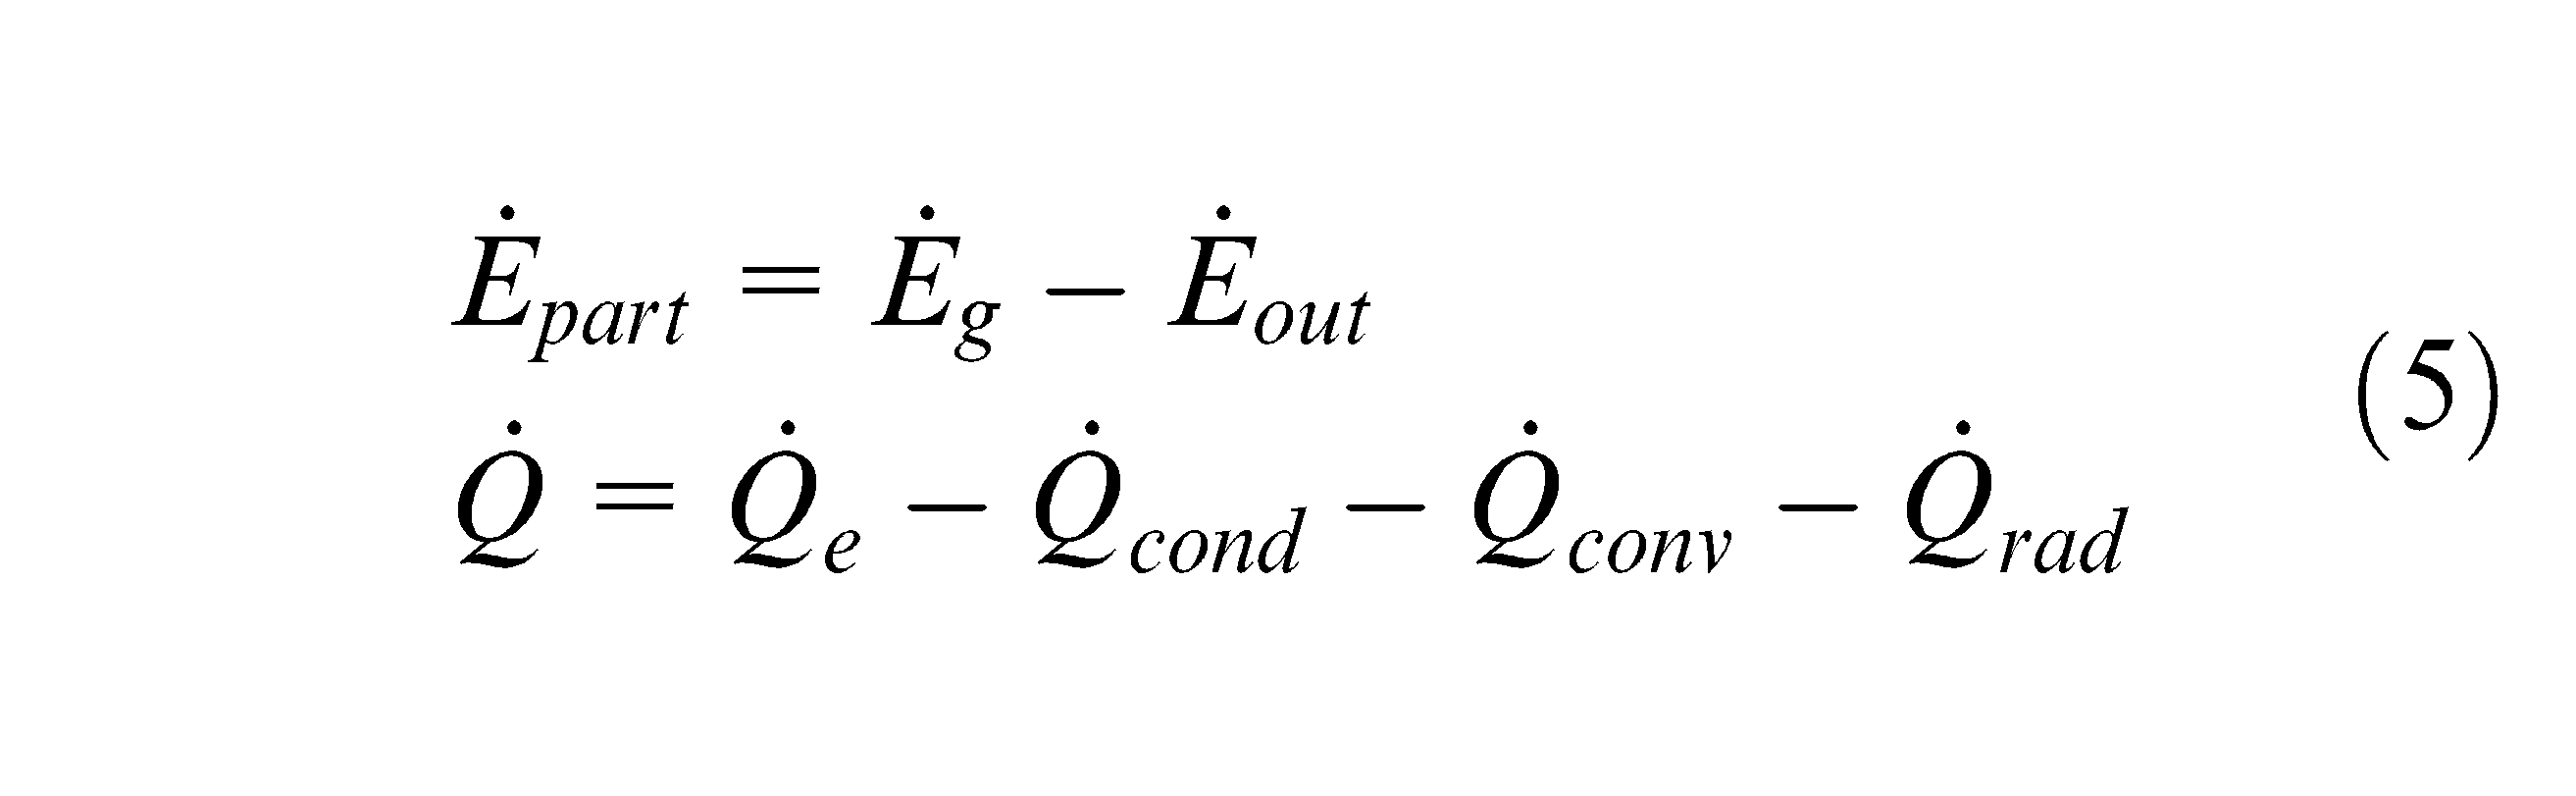
where
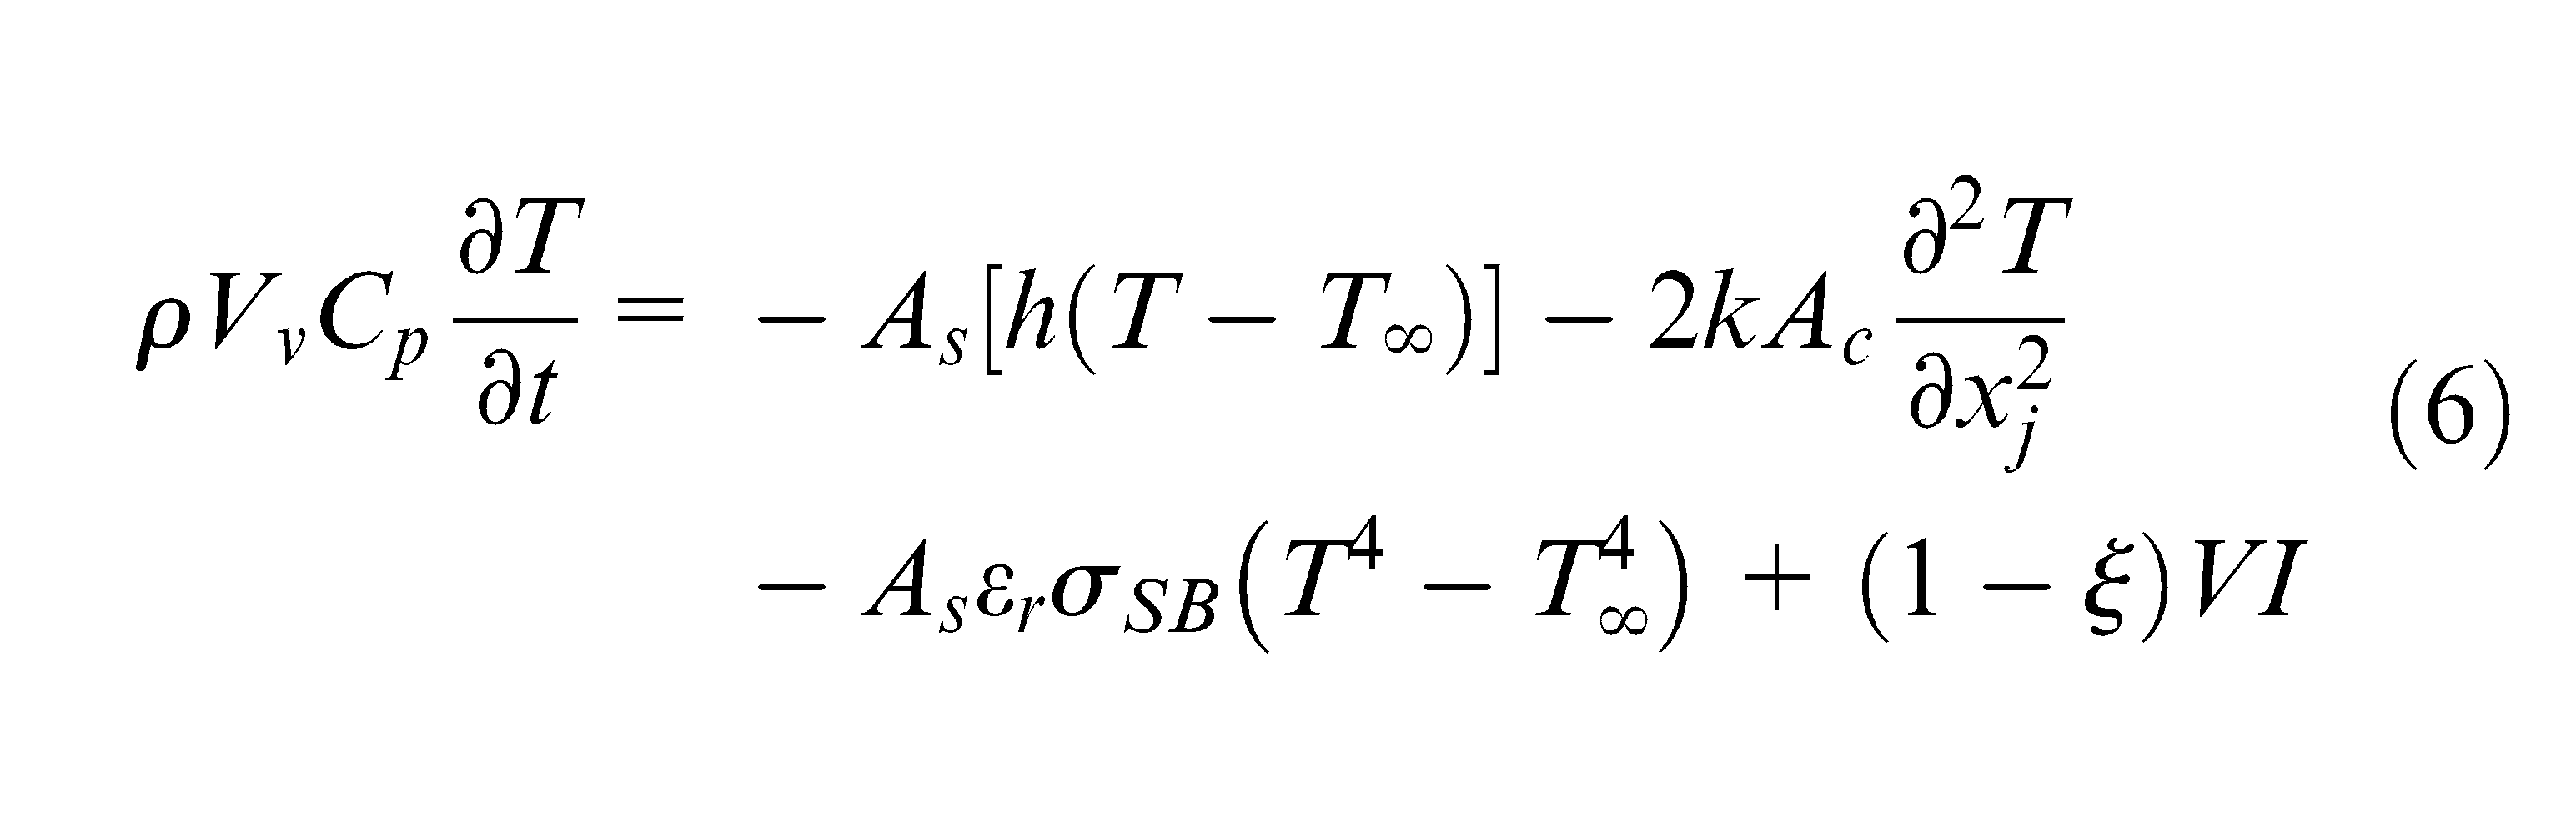
where
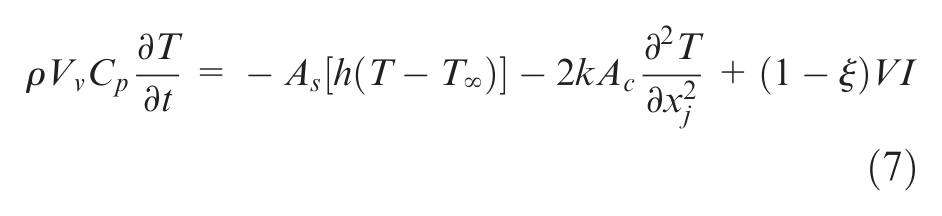
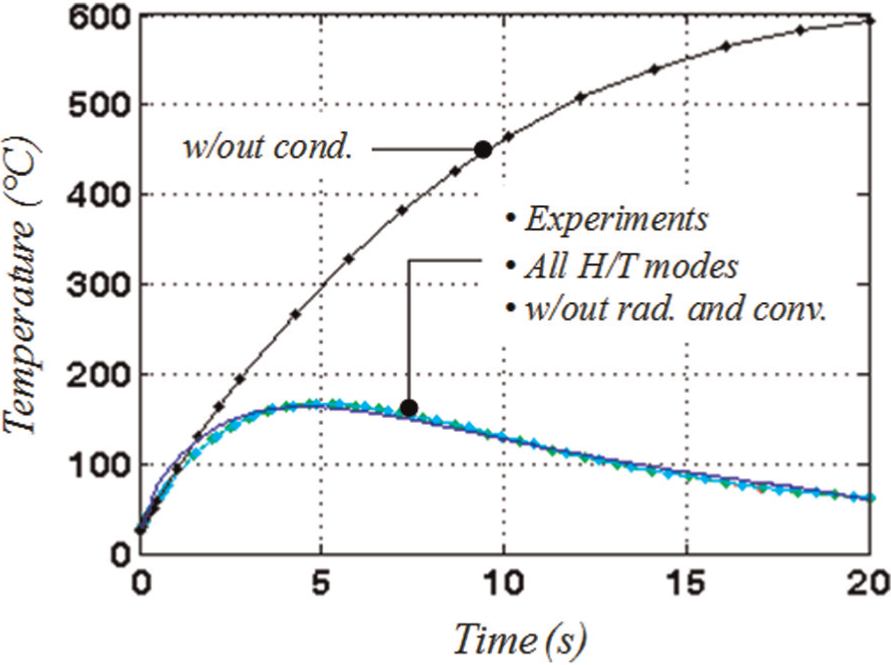
The goal of this subsection is to determine the significance of each of the three heat transfer modes. To determine this, equation (6) was modified in the model to represent the following heat transfer mode combinations and then compared to experimental results
All heat transfer modes except radiation (equation (7))
All heat transfer modes except radiation and convection (equation (8))
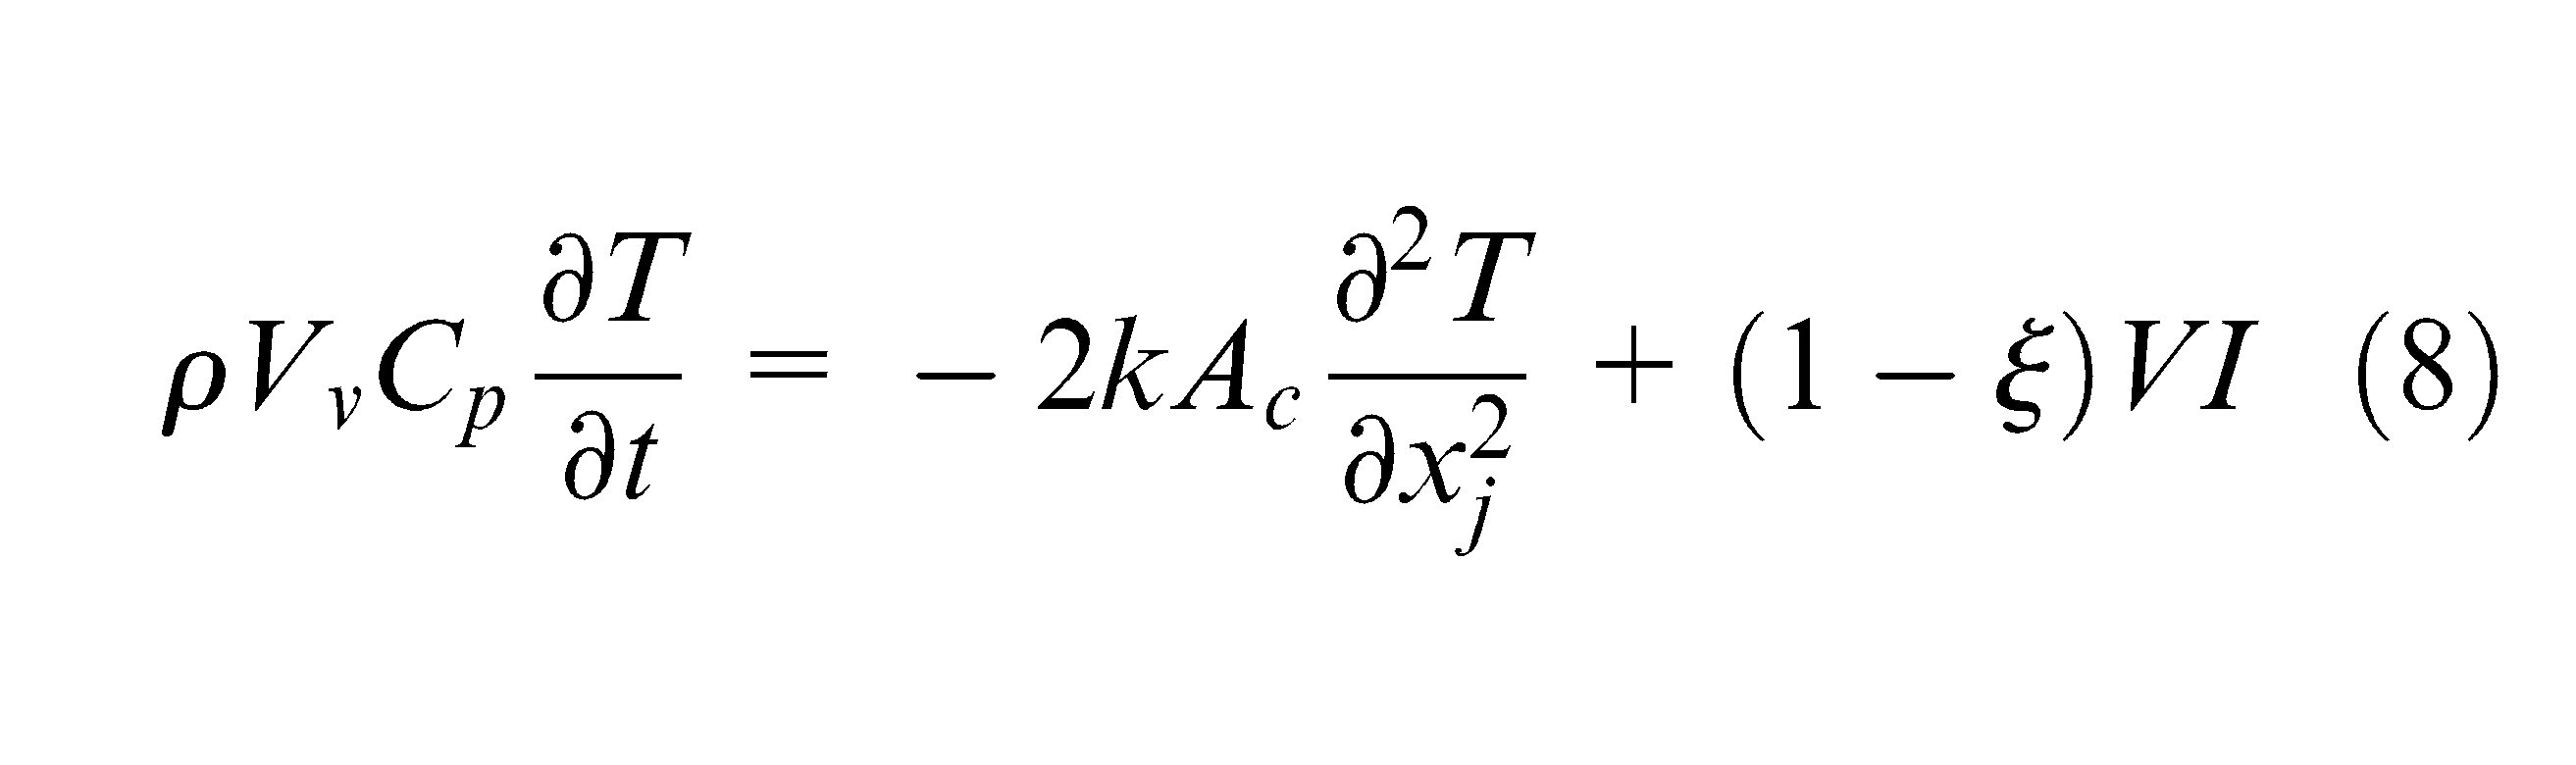
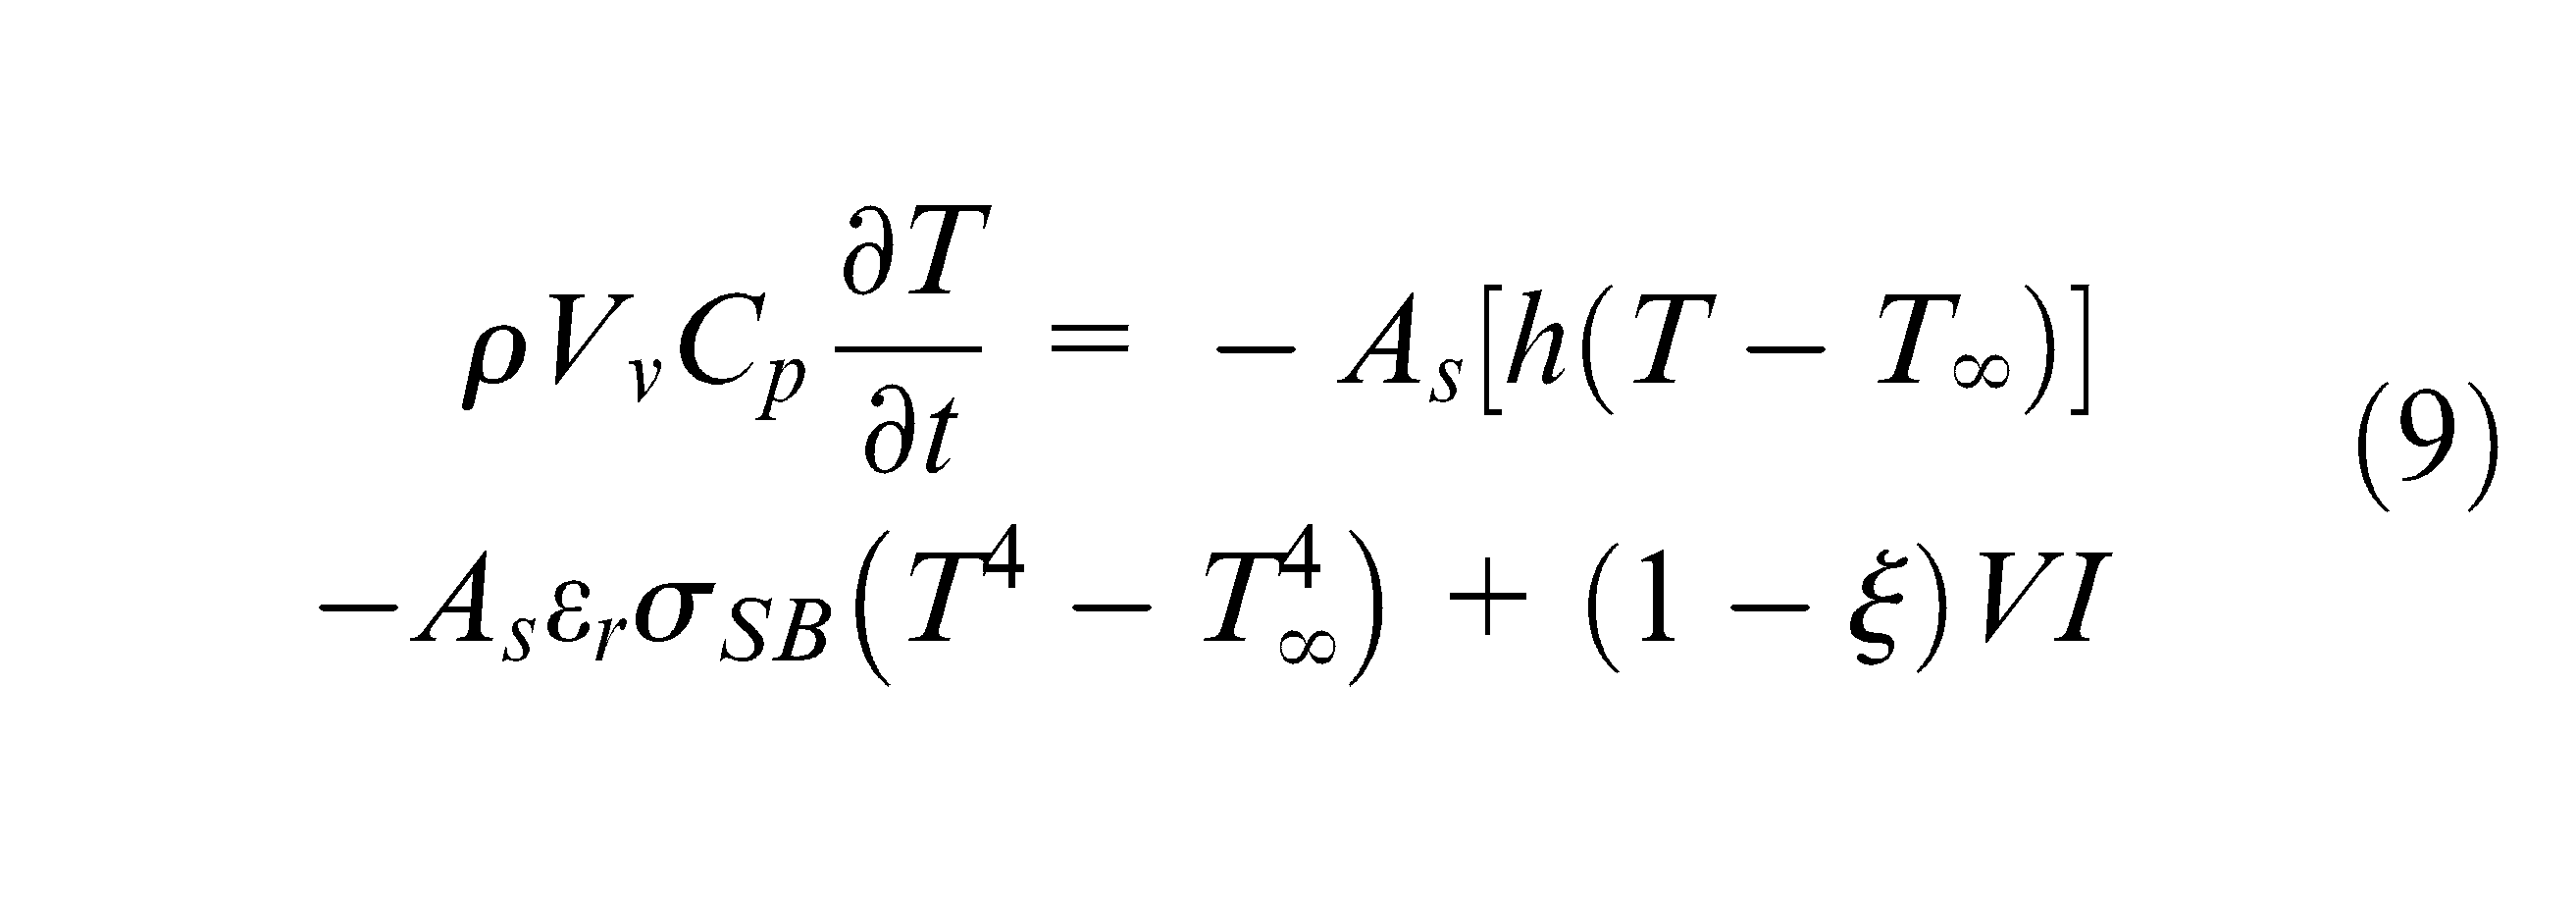
All heat transfer modes except conduction (equation (9))
The resulting thermal profiles for all of the combinations are displayed in Figure 5. Let it be known that at least three repetitions were run for each experimental configuration (i.e. CD and die speed combination). The three experimental repetitions were very repeatable, where the maximum temperatures for the three tests were all within 3 °C, and all of the ending temperatures were within 5 °C. Due to the high repeatability of the tests, one single thermal profile is sufficient to plot in Figure 5. In Figure 5, the experimental temperature profile and the profiles neglecting both convection and radiation are nearly identical. Conversely, the thermal profile neglecting conduction heat transfer is nearly three times hotter than the experimental thermal profile. The fact that there is a large discrepancy between the experimental thermal profile and that without conduction signifies that conduction heat transfer is the major contributor to the magnitude and overall shape of the thermal profile of an EAF test. Furthermore, the fact that the profiles neglecting radiation and convection are very similar to the experimental profile signifies that the effect of these two heat transfer modes is minor. Overall, when modeling the EAF process, the all-inclusive heat transfer model could be simplified by neglecting both the radiation and convection heat transfer (equation (8)). An accurate thermal profile can be generated by assuming only conduction heat transfer is present. For the results presented here, Cp was assumed constant. As presented in an earlier section, the variability of Cp with temperature may result in a difference, which is more significant for Ti.
Heat transfer mode analysis.
Figure 6 displays a thermal image of the workpiece, and the upper/lower dies after electricity have been applied during an EAF test. Figure 6 helps to highlight the notable amount of heat that is transferred from the workpiece into the die by way of conduction, as the dies act as thermal sinks in the system. The fact that conduction is the primary heat transfer mode is important in manufacturing process design because the amount of contact area between the dies and the workpiece will dictate the magnitude of heat transfer into and out of the system.
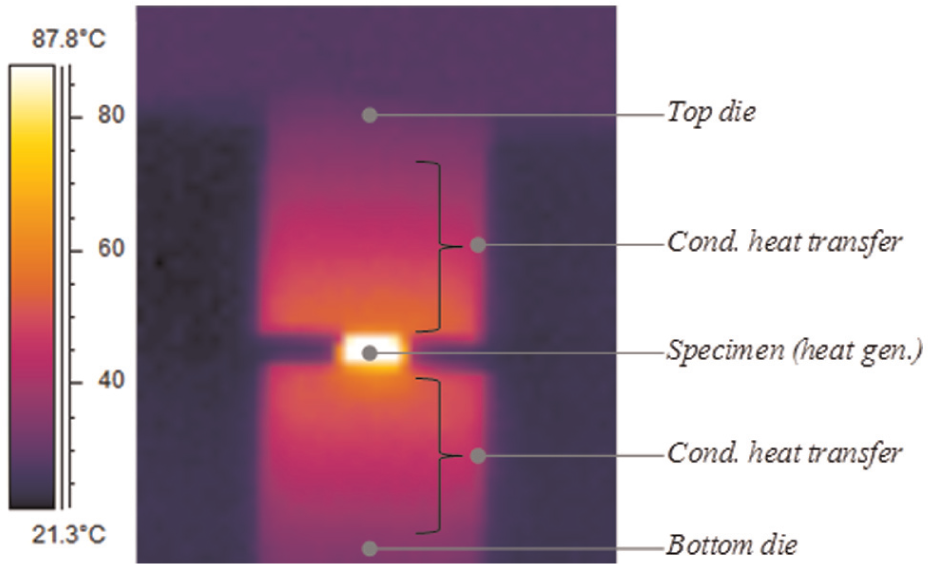
EAF thermal camera image.
Now that conduction was determined to be the primary heat transfer mode for EAF, it is critical to verify any specific sensitivities related to this heat transfer mode. One variable that can drastically change the thermal profile of the workpiece is the die conduction length or the length of the die that contributes toward drawing heat from the workpiece (Ldc). Figure 7 displays workpiece thermal profiles for several different die lengths, along with the actual experimental data for EAF tests run at a starting CD of 20 A/mm2 and a die speed of 12.7 mm/min. The same experimental thermal curve used in Figure 5 was used in Figure 7, which represented high repeatability. Therefore, a single curve was used to represent all of the repetitions. Currently, the authors use the thermal images to estimate the die conduction lengths, where the excessive heating was apparent when electricity was applied. The die conduction length used for the model in this case was 0.0085 m. In Figure 7, where the conduction lengths are moved in increments of 2 mm, the overall thermal profile is extremely sensitive to the die conduction length value. By varying the conduction length by about 4 mm, there is about a 40 °C difference in the maximum temperatures within the thermal plots. Overall, when modeling the electroplastic effect, it is critical to devise a consistent and accurate method of approximating the conduction length.
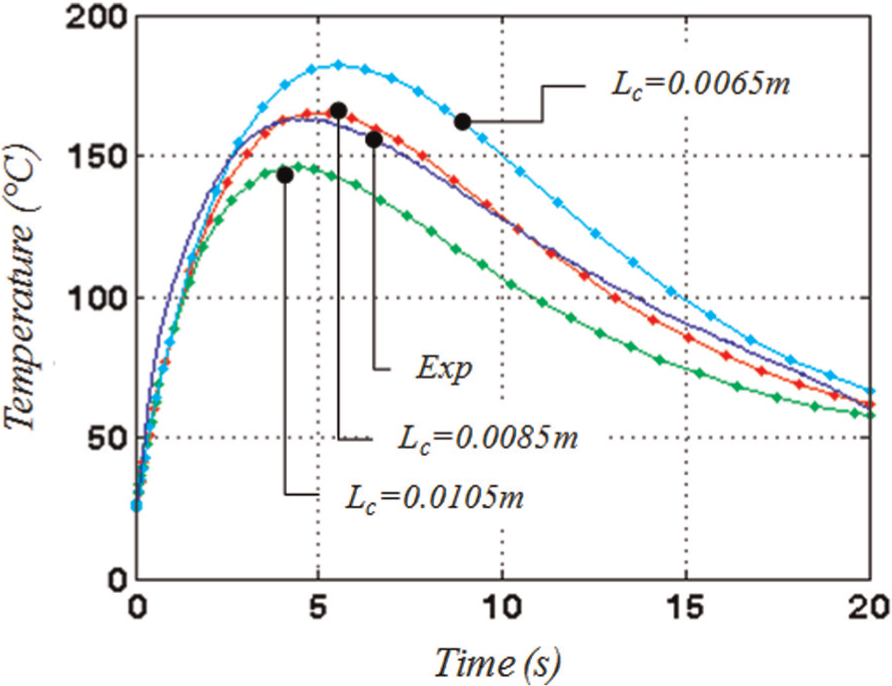
SS304 conduction length sensitivity.
Stainless Steel 304 and Ti-G5 EEC profile comparison
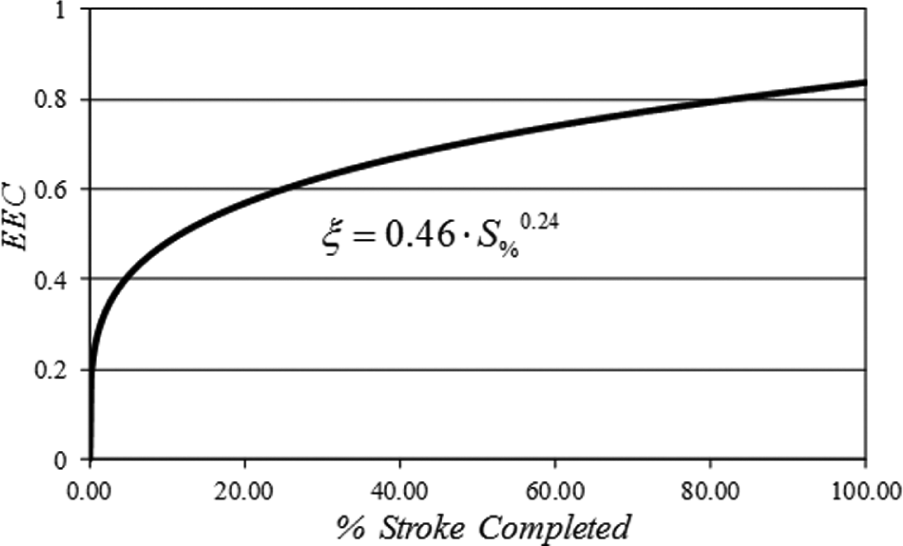
In this subsection, the general shape of the EEC profiles for the Stainless Steel 304 and Ti-G5 specimens will be discussed. Figures 8 and 9 display the EEC profiles for Ti-G2 and SS304, respectively (both tests run at a starting CD of 25 A/mm2 with a die speed of 12.7 mm/min). The EECs are plotted here as a function of stroke. Other parameters could also be used, that is, strain or displacement, but the overall observations are still valid. From Figures 8 and 9, it can be seen that the percentage of “usable” electricity increases throughout the test; however, the increase is different for each material. Specifically, the majority of the EEC profile increase for the Ti-G2 material occurs at the beginning of the test, whereas the majority of the EEC profile increase for the SS304 material occurs toward the end of the test. Both of these EEC profiles were approximated using the power law, and the value of the exponential term is what determines the overall shape of the profile. Specifically, if the exponential term is less than 1, the profile will be convex shaped, and if the exponential term is greater than 1, the profile will be concave shaped.
Ti-G2 EEC example profile (12.7 mm/min).
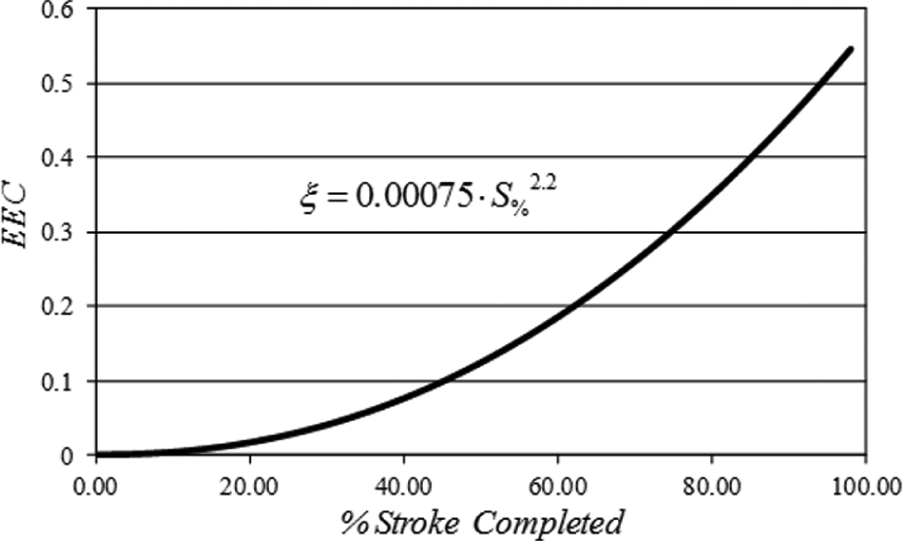
SS304 EEC example profile (12.7 mm/min).
The concave/convex shapes of the profiles can also be explained visually by examining the mechanical power profiles of the EAF tests run on each of the materials. Figure 10 shows the power profiles for the Ti-G2 material. It can be noted from Figure 10 that the difference between the baseline and EAF power profiles, at discrete points, becomes slightly smaller or remains the same as the test progresses. This explains the profile in Figure 8, where minimal increase is seen toward the end of the test, when compared to the increases at the beginning. Figure 11 displays the mechanical power profiles for EAF tests on the SS304 material, for CDs of 10–20 A/mm2. Contrary to the Ti-G2 material, the difference in the baseline and EAF power profiles increases as the tests progress. This leads to the profile in Figure 9, where the largest EEC increase is witnessed toward the end of the tests. The same differences between the conventional compression and EAF compression tests for each material were apparent in the stress–strain plots in the study by Perkins et al. 21
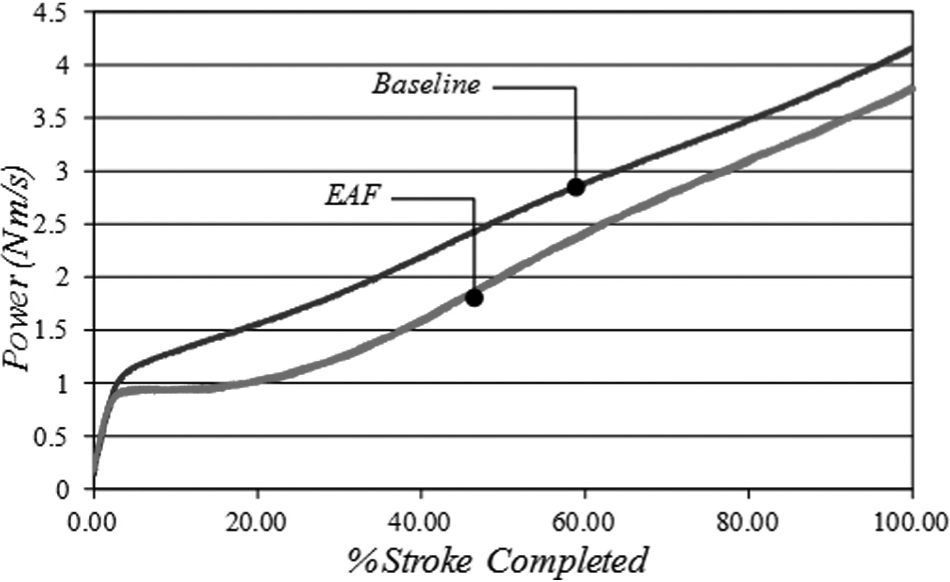
Ti-G2 mechanical power profiles (12.7 mm/min).
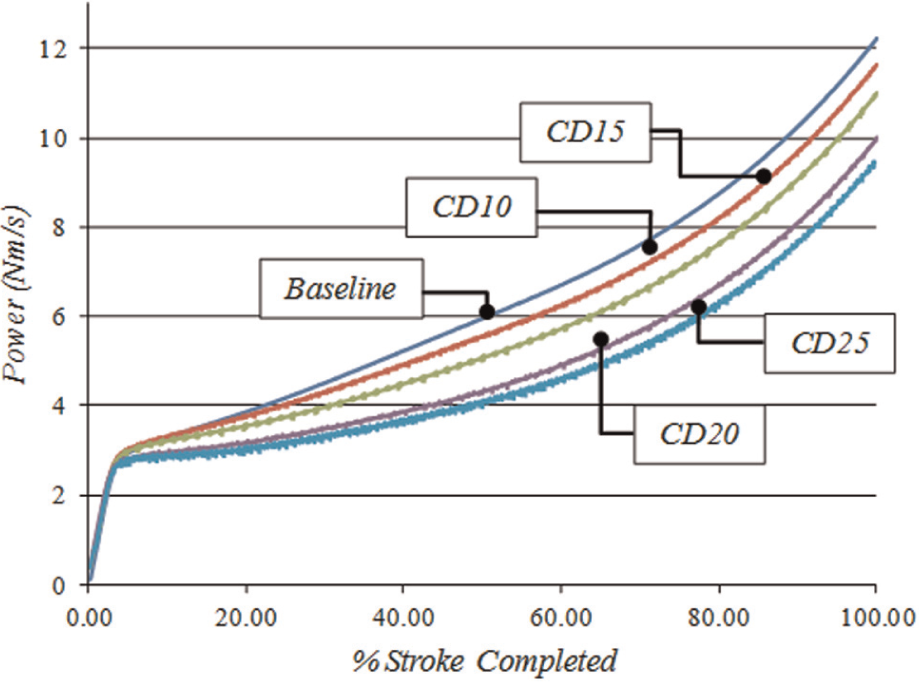
SS304 mechanical power profiles (12.7 mm/min).
Two properties of the metals may be responsible for the difference in the shapes of the EEC profiles: the effect of temperature increase on the strength of the metal and the effect of alloying. The strength of the titanium begins to immediately decrease as temperature is increased, whereas the strength of the stainless steel does not show much of sensitivity to temperature until higher temperatures are reached.22,23 The thermal softening could take place at a faster rate for the titanium due to the temperatures reached during the EAF tests coupled with the sensitivities of this metal’s strength with temperature. The amount by which each metal was alloyed could also have an effect on the EEC profile. The SS304 had up to 20% chromium alloyed into the base iron metal. The chromium was weaker than the iron base metal, and this allows for high ductility of the stainless steels. Also, the titanium was more than twice as resistive as the stainless steel, which contributed to the faster heating profile and higher EAF temperatures.
Frequency analysis
In this subsection, a frequency analysis of the data is presented. A comparison of the load recorded indicated the presence of a “noise” in the data for the EAF test. Figure 12 shows the load for both tests for Titanium G2 at a die speed of 12.7 mm/min and an initial CD of 25 A/mm2. A detailed view of the results is included. Oscillation in the data is observed for the EAF test, while the conventional test is clean. The FFT analysis on the data was performed to rule out the influence from the electricity itself. The analysis for this particular test found frequencies in the spectrum of ∼23 Hz and its multiples (Figure 13).
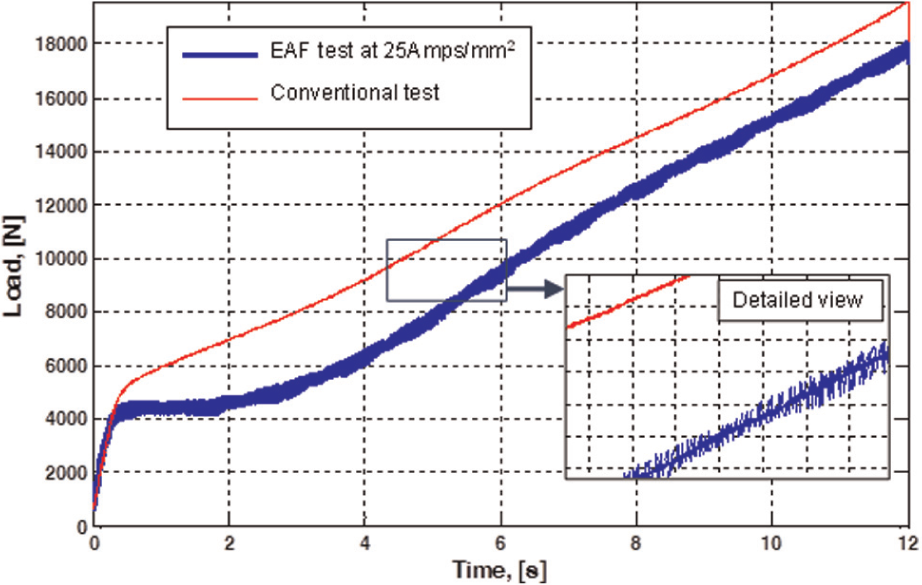
Comparison of forces for conventional and EAF tests and detail on the “noise” (Ti-G2).
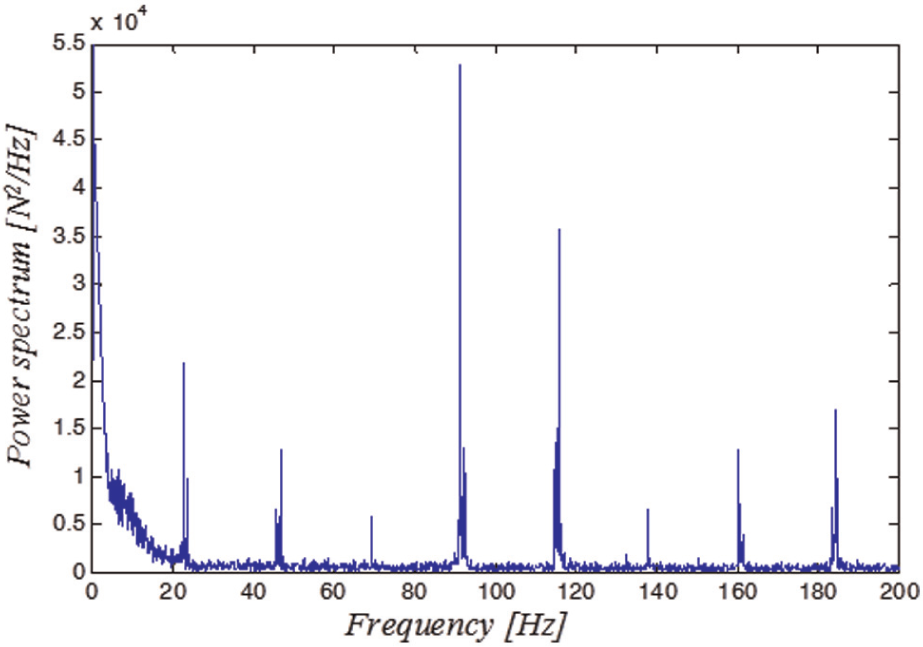
Power spectrum (FFT) for an EAF compression test (Ti-G2).
A careful analysis of the recorded displacement indicated a linear variation with constant speed, as intended; thus, the variation in the data is not due to any inaccuracies in the testing methodology. Moreover, after analyzing the results (loads), for all the tests, it was observed that the frequency response changed with CD. An increase was observed in the frequencies, which means a decrease in the period, or time of one oscillation. Figure 14 plots the frequency as a function of initial CD and corresponding current for the tests performed on stainless steel (SS304) at a die speed of 12.7 mm/min. Note that the first peak frequency was considered here.
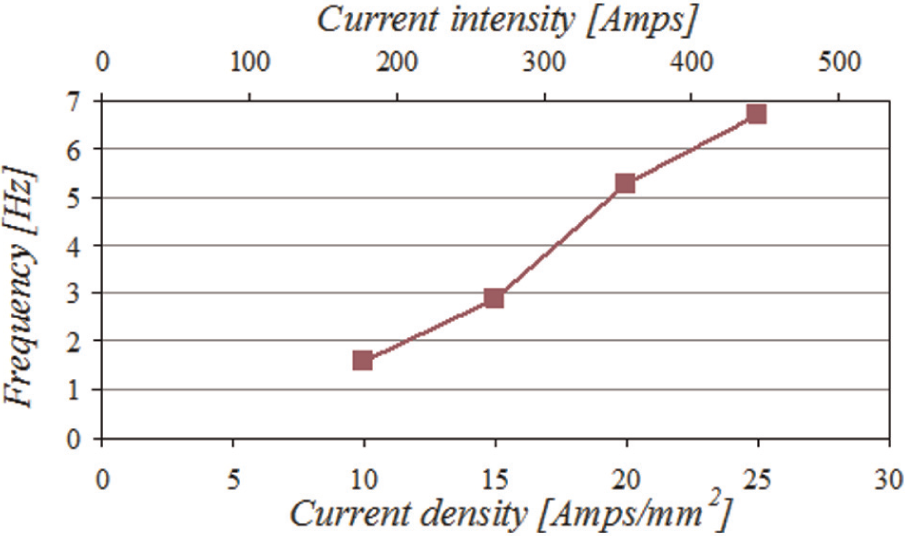
Frequency response for EAF loads for SS304 as a function of current and initial current density.
A first observation is that these values are lower than for titanium (G2, Figure 13). That may be related to the differences in the lattice structure. Also, based on these results, one may speculate that there is a cyclic softening/hardening phenomenon present during EAF. The input of electric energy results in alternating of electroplastic softening of the material, when the electric energy helps the dislocation to surmount obstacles and move, and hardening of the material due to deformation. Figure 15 shows the theorized impact that the flowing electrons from the electricity have on mobilizing the dislocations. The softening results in lowering the forming load, while the hardening contributes to an increase in load, until there is enough energy for dislocation movement again. The larger CD is equivalent with more electric energy input; thus, the oscillation or variation in load occurs faster and the frequency is higher.
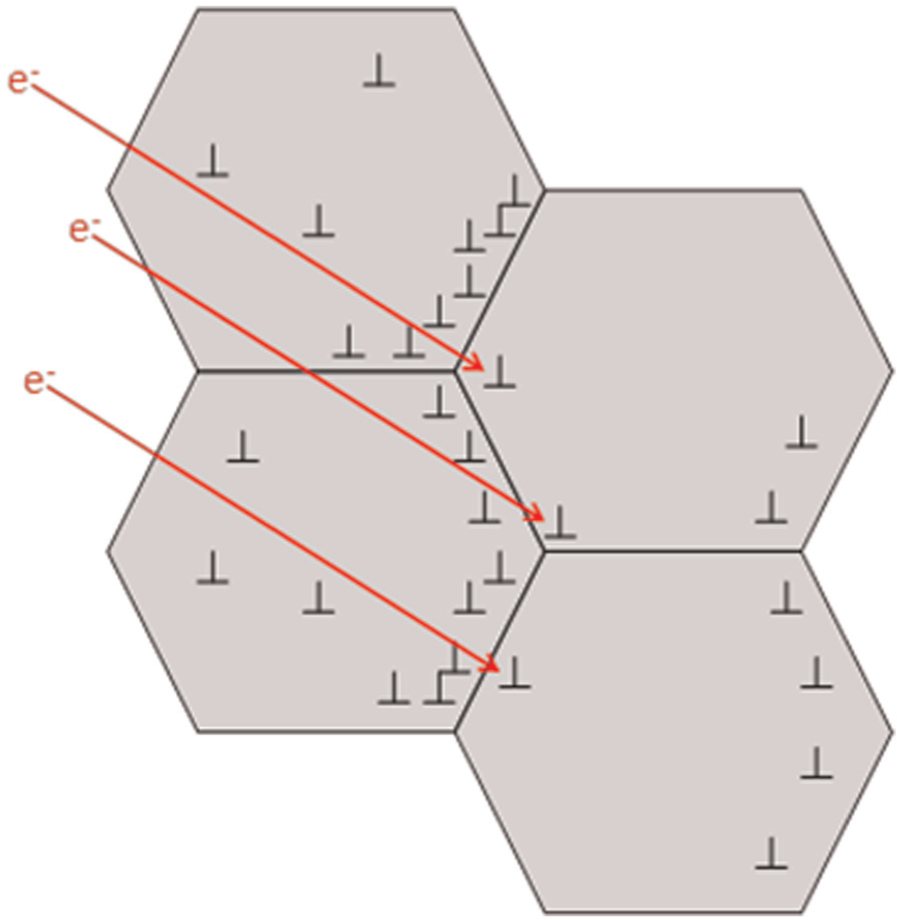
Grain boundaries, dislocations, and applied electricity.
The amount of electric energy contributing toward helping the deformation (PEAF-def) was defined earlier as being a fraction of the total electric energy, where the fraction is the EEC. Equation (10) writes this relation as a product of two terms
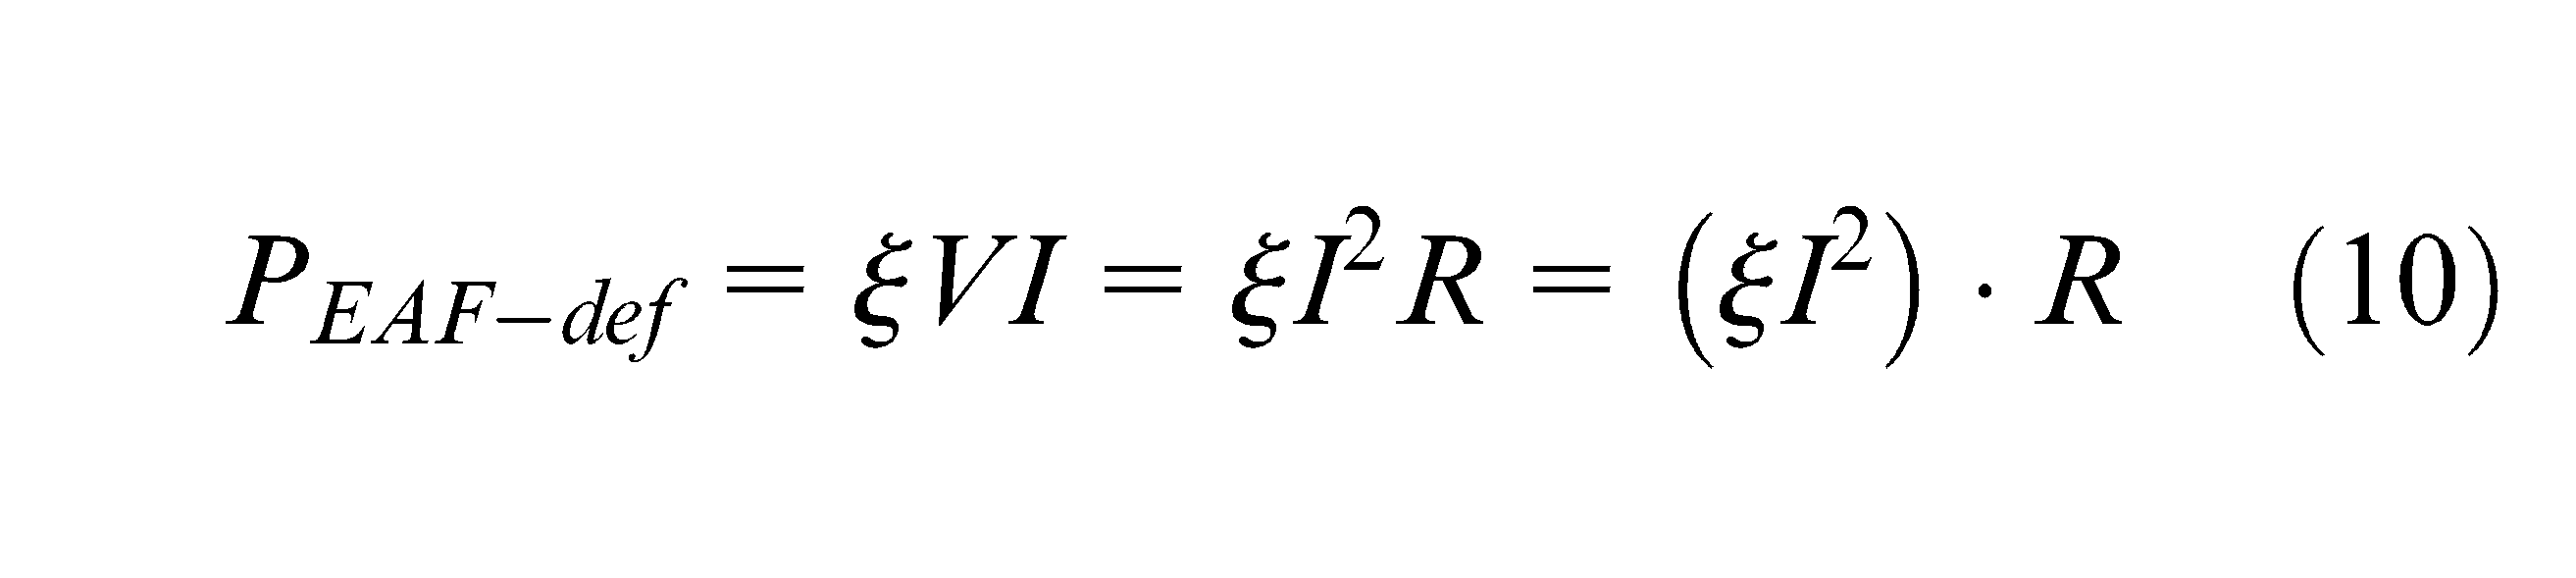
where R is the resistance. Figure 16 plots the variation of the first term with the current by considering the EEC determined earlier for SS304 from the EAF tests at a die speed of 12.7 mm/min. If this component is compared with the frequency, a good proportionality is found. The difference may be due to the change in the resistivity, and thus resistance, of the part with the change (increase) in temperature due to the applied electric field.
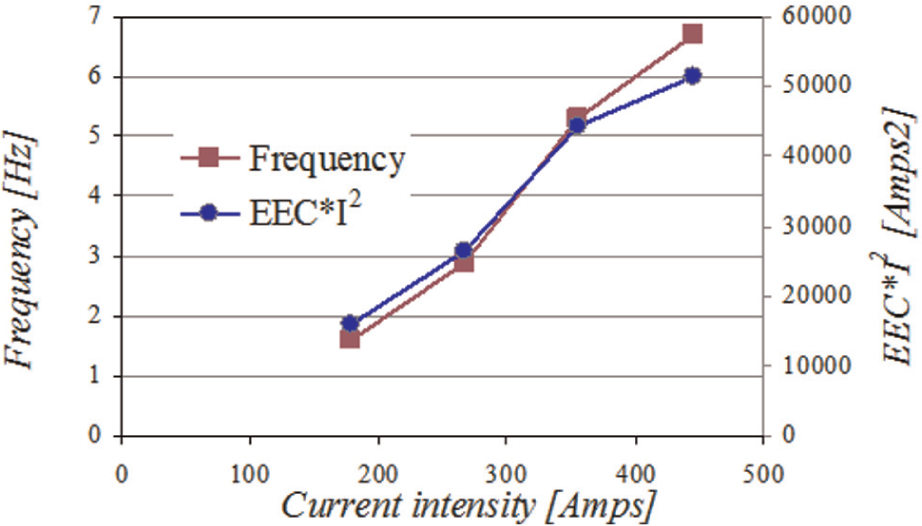
Variation of frequency response and the electric energy component.
The cyclic aspect of the load recorded during the EAF test and the apparent proportionality of the frequency with the energy input need to be further investigated. Some similarity is found with the serrated flow observed at temperature tensile tests, mainly for steels and aluminum, named as the Portevin–Le Chatelier (PLC) effect. 24 When explaining this effect, the oscillation in the load is attributed to an unstable plastic flow and depends on temperature and strain rate. The commonly accepted explanation for the PLC effect is based on a dynamic strain aging model and is due to the interaction between the moving dislocations and diffusing solute atoms. In addition to temperature and strain rate, the PLC depends also on alloy composition, crystal lattice, dislocation density, and grain size. Since all these are parameters that also influence the electroplastic effect, further tensile tests need to be performed, and a possible correlation between the PLC and electroplastic effects needs to be investigated.
Conclusion and future study
This article analyzes the effects of specific heat values and various heat transfer modes on the effectiveness of EAF. Additionally, observations are provided for the different EEC profiles for certain materials. Also, a frequency analysis was performed on the force versus position data acquired from the testing machine. The following conclusions can be drawn from the research:
The specific heat of a material must be considered when modeling EAF. The effect that the specific heat has on the ability to model EAF is proportional to the sensitivity of the specific heat value with respect to temperature.
When considering relevant heat transfer modes for EAF, conduction must be included, whereas radiation and convection can be neglected.
The conduction length of the dies has a significant effect on the overall temperature profile of the specimen.
The EEC profile for SS304 is concave (large increase toward the end of the test), and the EEC profile for Ti-G2 is convex (large increase toward the beginning of the test).
The frequency analysis indicated that there are oscillations in the forming load recorded during the EAF tests for all the tests performed. The frequency increases with the current, thus with energy input. This may be an indication of a cyclic softening/hardening phenomenon present during EAF.
The frequency observed for titanium is higher than the one for steel and may be related to the crystal lattice microstructure.
Future study can include a more thorough investigation in the fundamentals of the electroplastic effect by studying the influence of the crystal lattice microstructure and the cyclic softening/hardening effect. Moreover, performing the tests and analyzing the frequency may allow for the estimation of the EEC using a relatively simple method.
Footnotes
Appendix 1
Acknowledgements
The authors would like to thank Ionic Technologies, Inc., for heat treating the EAM compression dies and InsulFab Plastics, Inc., for providing insulation material used in the dies. In addition, research from this article was also acknowledged in an ASME conference article (“Sensitivities when modeling electrically-assisted forming” by Cristina J. Bunget, Wesley A. Salandro, and Laine Mears, Proceedings of the ASME 2012 International Manufacturing Science and Engineering Conference, paper number MSEC2012-7334).
Funding
This research received no specific grant from any funding agency in the public, commercial, or not-for-profit sectors.
Declaration of conflicting interests
The authors declare that there is no conflict of interest.