
Abstract
In this article, a point in time at which tool change should take place and a program to monitor tool condition are proposed for microscale milling processes. The response surface method, which is one of designs of experiments, was used to determine cutting conditions. The independent variables were the spindle speed, axial depth of cut, and feed per tooth; each variable was divided into five levels. After tool life measurement experiments were performed with the determined cutting conditions, a second-order tool life equation was derived, and optimal cutting conditions were obtained by means of the tool life equation. A point of tool change time for the microscale milling process was proposed by analyzing the characteristics of cutting force signals and acoustic emission signals acquired during the experiments. Then the values were determined by analyzing the experimental results and were used to determine the tool change time in a machining monitoring program. The results of this study may be used to enhance machining efficiency in microscale milling processes.
Keywords
Introduction
Recent advances in the electronics, optical, biomedical, aerospace, and automotive industries have led to increasing miniaturization of products. 1 As a result, the demand for microscale parts has rapidly increased. High-precision manufacturing processes of microscale parts are core technologies for future industries. Photolithography is generally used in the fabrication of microscale parts. 2 However, this method requires considerable production time and expensive manufacturing facilities. Moreover, photolithography is limited to silicon-based materials and products with essentially planar geometry. 3 The microscale milling process enables various materials such as metals, polymers, and ceramics, and three-dimensional microscale parts with complex shapes to be machined.2,3 In addition, this method enables microscale components to be produced cost-effectively. 4
In general, the microscale milling process is similar to a conventional milling process. However, there are some differences between them related to the size effect. 5 The effect of the cutting edge radius should be considered in the microscale milling process. In a conventional milling process, the effect of the cutting edge radius is neglected because the ratio of the cutting edge radius to the feed per tooth is small. However, in the microscale milling process, when the feed per tooth is smaller than the minimum uncut chip thickness, the material is plowed by the cutting edge, and elastic recovery of material occurs because the ratio is high. 5 For this reason, the quality of the machined surface and the dimensional accuracy decrease. The minimum uncut chip thickness is the thickness at which a chip can be formed, and this is found in the range of 20% and 40% of the cutting edge radius. 6 Therefore, in the microscale milling process, it is very important to determine the minimum feed per tooth at the point at which stable machining can be conducted.
Tool wear occurs as the cutting proceeds. If tool wear reaches a critical point, the quality of the machined surface and the dimensional accuracy decrease significantly. In the microscale milling process, the cutting force acting on the micromilling tool increases because of tool wear. As a result, the micromilling tool is finally broken. Thus, the micromilling tool should be changed prior to breakage to maintain the quality of the machined surface and the dimensional accuracy and to improve productivity.
Dynamometers, accelerometers, and acoustic emission (AE) sensors are widely used for machining monitoring. 7 Cutting force is one of the most effective variables for indirectly observing the machining process 8 and estimating the tool wear condition. 9 AE is the phenomenon in which an elastic wave transformed from strain energy is emitted when a material is deformed or destructed. Because the bandwidth of AE is in the range of kilohertz to megahertz, it is very effective at monitoring the machining process in high-speed machining. AE sensors have been applied in various studies on tool condition monitoring, such as tool wear and cutting edge breakage.10,11 A dynamometer and AE sensor, which were selected after analysis of the literatures, were applied in this study to achieve effective machining monitoring and analysis of tool life. Moreover, signal analysis was conducted to obtain more accurate machining monitoring and to establish a standard for determining the tool change time point.
In this study, an effective and appropriate point of tool change time was investigated by means of tool life experiments with micromilling tools. This study was conducted not only for the investigation of tool life but also for producing a machining monitoring program for observing the micromilling process effectively by applying the results of analysis for a point of tool change time. An equation for the tool life was also derived. The response surface method for design of experiments was used to determine the cutting conditions. The independent variables were the spindle speed, the axial depth of cut, and the feed per tooth. Each variable was divided into five levels. Tungsten carbide, which is used in high-speed machining, was selected as the material for the micromilling tool, and AISI 1045 was selected as the workpiece material. Tool life experiments were performed with the determined cutting conditions. A tool life equation was derived, and the optimal cutting conditions were obtained from the tool life equation. The point of tool change time in the microscale milling process was determined by analyzing the characteristics of the cutting force signals and the AE signals acquired during the experiment. Moreover, a machining monitoring program for the microscale milling process was developed to improve the effectiveness and efficiency of tool condition monitoring and tool changing. The resultant cutting force and AE root mean square (RMS), which were determined by analyzing the experimental results, were used as a standard for determining tool change with a machining monitoring program. Therefore, the findings of this study may be used in microscale milling processes to enable more efficient machining. Moreover, the results of this study will contribute to research to develop machining monitoring programs and to determine suitable tool change time points.
Machining experiments for analyzing the life of micromilling tools
Experimental design
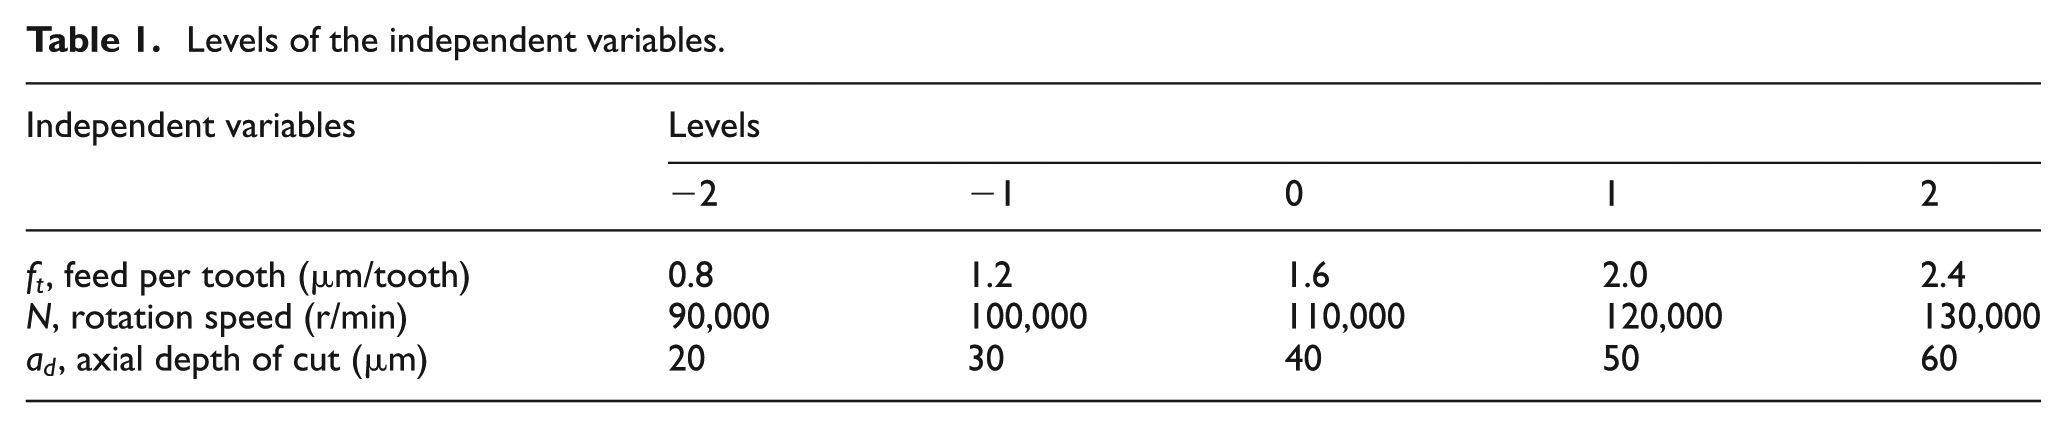
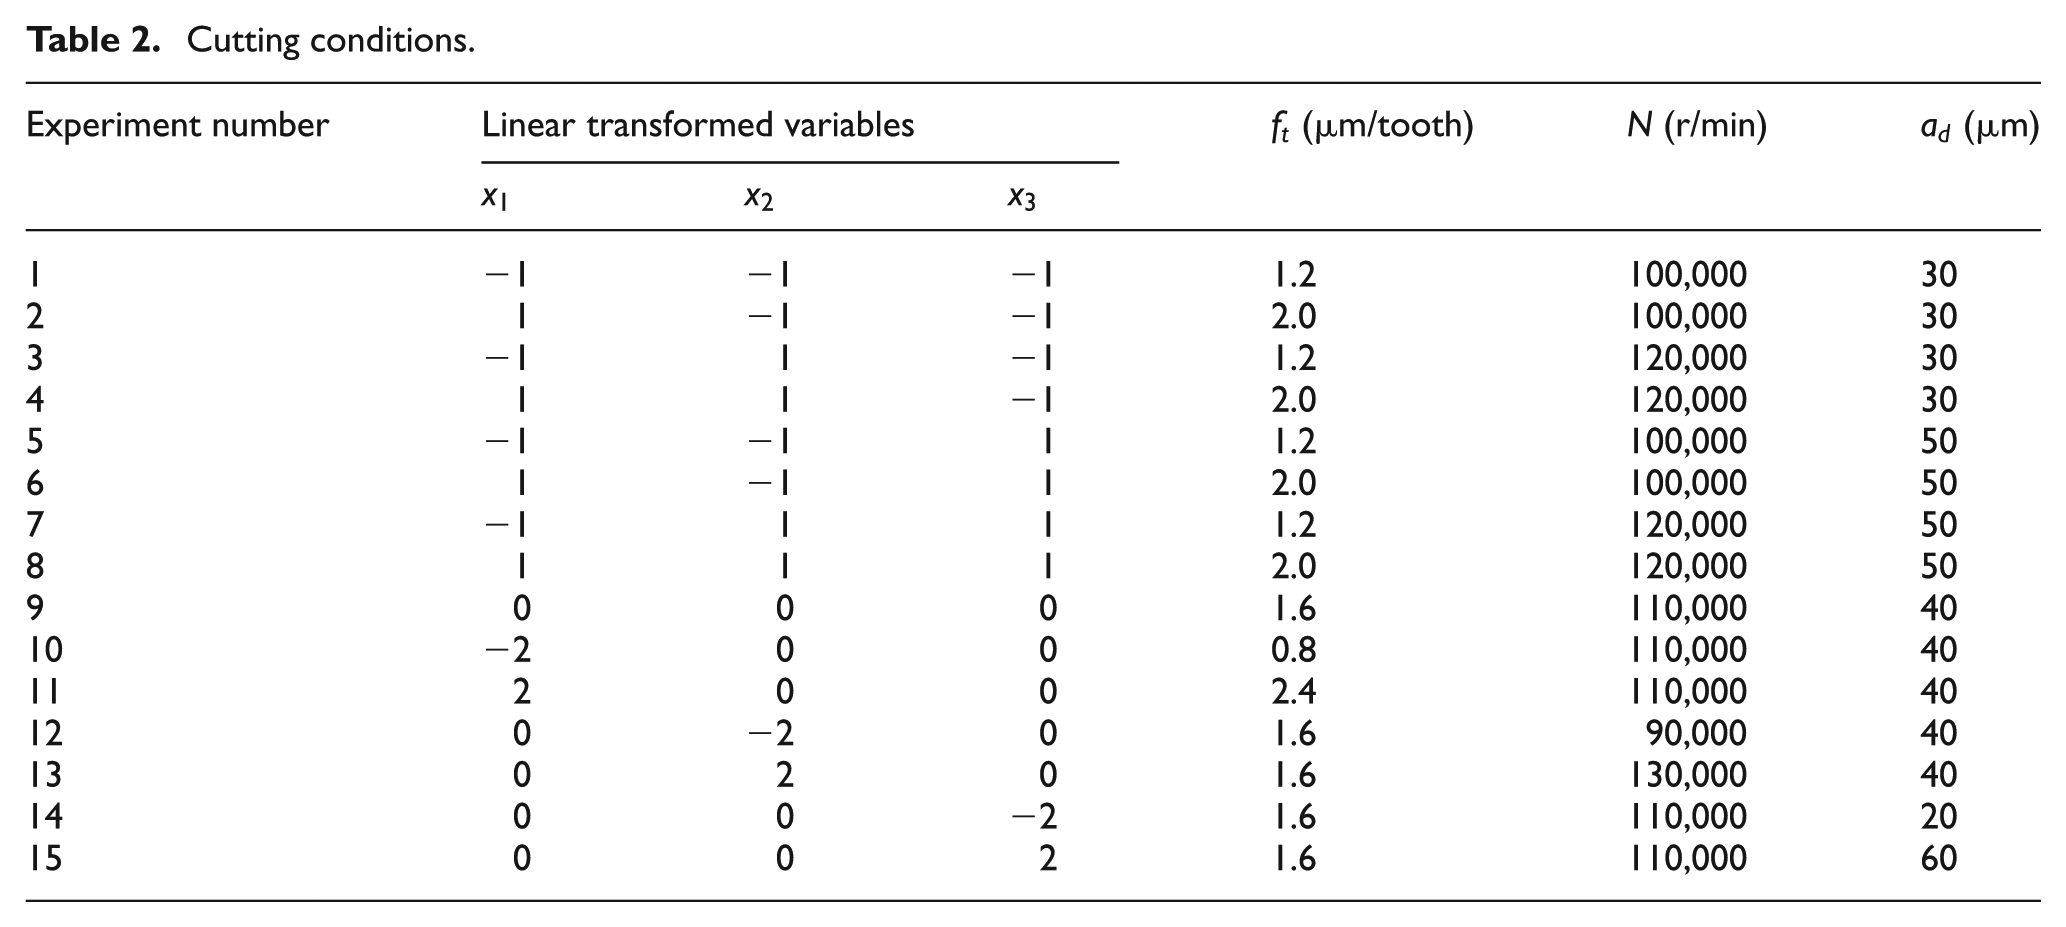
To obtain efficient and effective results from a few experiments, the design of the experiments is important. 12 In this study, the cutting conditions of a microscale milling process were obtained by means of the central composite design of the response surface method. The independent variables were the feed per tooth, the rotation speed, and the axial depth of cut. Each variable was divided into five levels. The number of experiments was 15, based on the results of the experimental design. These 15 experiments consisted of eight corner points and one center point.
The variables were linearly transformed into new variables to express the levels. The linear transformation was conducted using the following equation

where
The feed per tooth, rotation speed, and axial depth of cut (the independent variables) were transformed into the new variables using the following equations


where
Levels of the independent variables.
Cutting conditions.
Experimental microscale milling process
Experimental setup
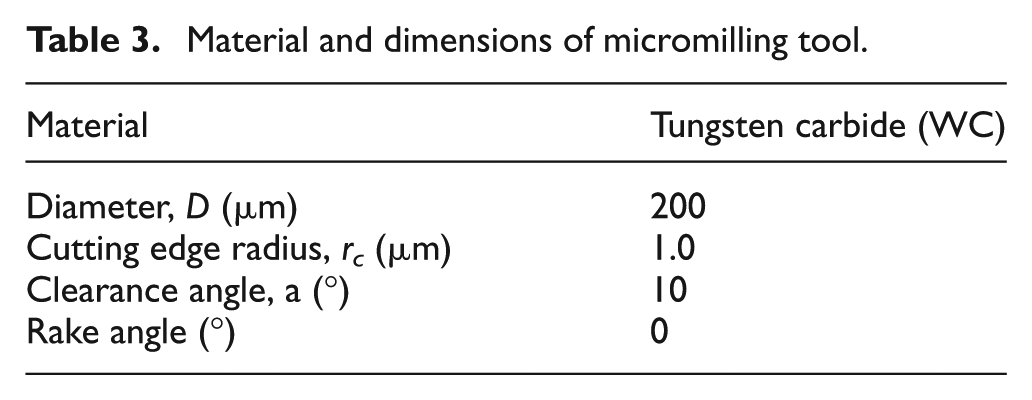
A micromachining stage equipped with an air turbine high-speed spindle was used in the experiments. A system equipped with a force sensor (9251A; Kistler, Switzerland) for measuring the cutting force was installed on the x–y stage to acquire the cutting force signals, and the workpiece was fixed on the system. Then an AE sensor (4126; PICO, USA) was attached to the side of the workpiece. LabVIEW (Version 8.2; National Instruments, USA) was used to acquire and process the cutting force signals and the AE signal. Fast Fourier transform (FFT) of all the signals was calculated in real time for better monitoring efficiency. All signals were processed using a band-pass filter to acquire signals between 100 and 5000 Hz. To prevent the aliasing phenomenon and to obtain high resolution signals, the sampling rate for each signal was set to 20,480 Hz. Figure 1 shows the experimental setup. Figure 2 shows a scanning electron microscope (SEM) image of the micromilling tool. The material and dimensions of the micromilling tool are listed in Table 3.
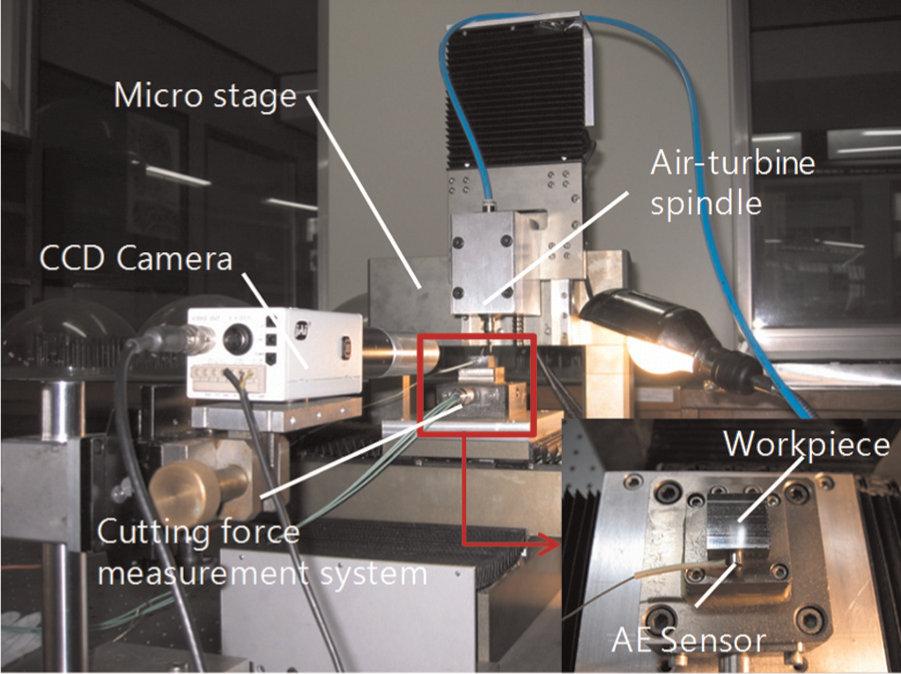
Experimental setup.
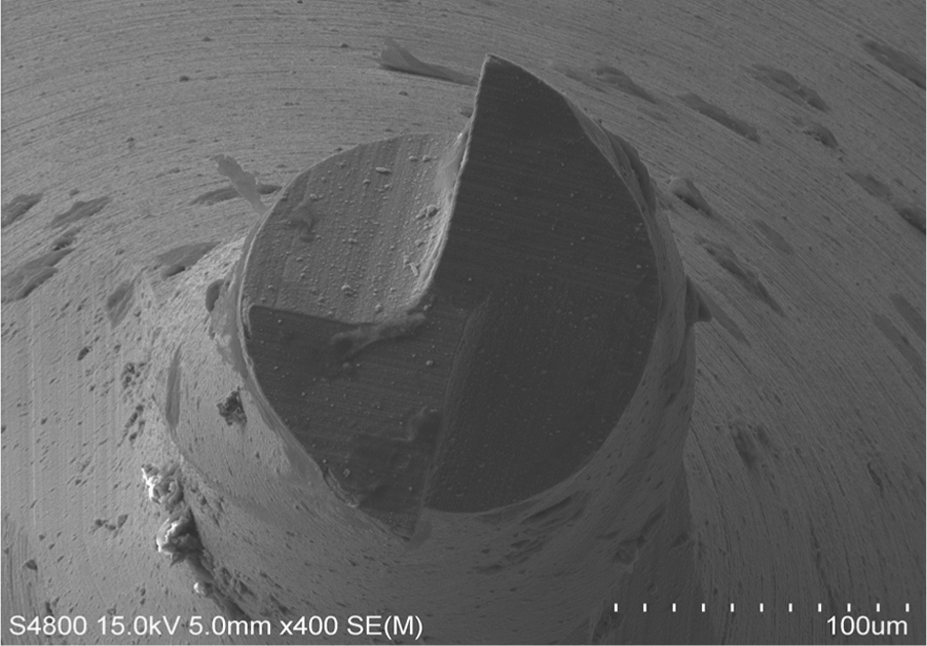
SEM image of the micromilling tool.
Material and dimensions of micromilling tool.
Experimental results and discussion
Unlike during macroscale milling, it is difficult to observe tool wear visually during the microscale milling process because of the size of the microscale milling tools and the limitations of the sensors. Therefore, it is important to monitor signals such as the cutting force signal and the AE signal. 13 In this study, an analysis of cutting force signals (which are effective in monitoring tool wear 14 ) and AE RMS signals was conducted to analyze the characteristics of tool wear and breakage and to measure tool life.
Cutting force and AE RMS
The changes in cutting forces and AE RMS signals observed during the experiments are shown in Figure 3. The cutting forces and AE RMS signals increased with increasing cutting length in all the experiments.
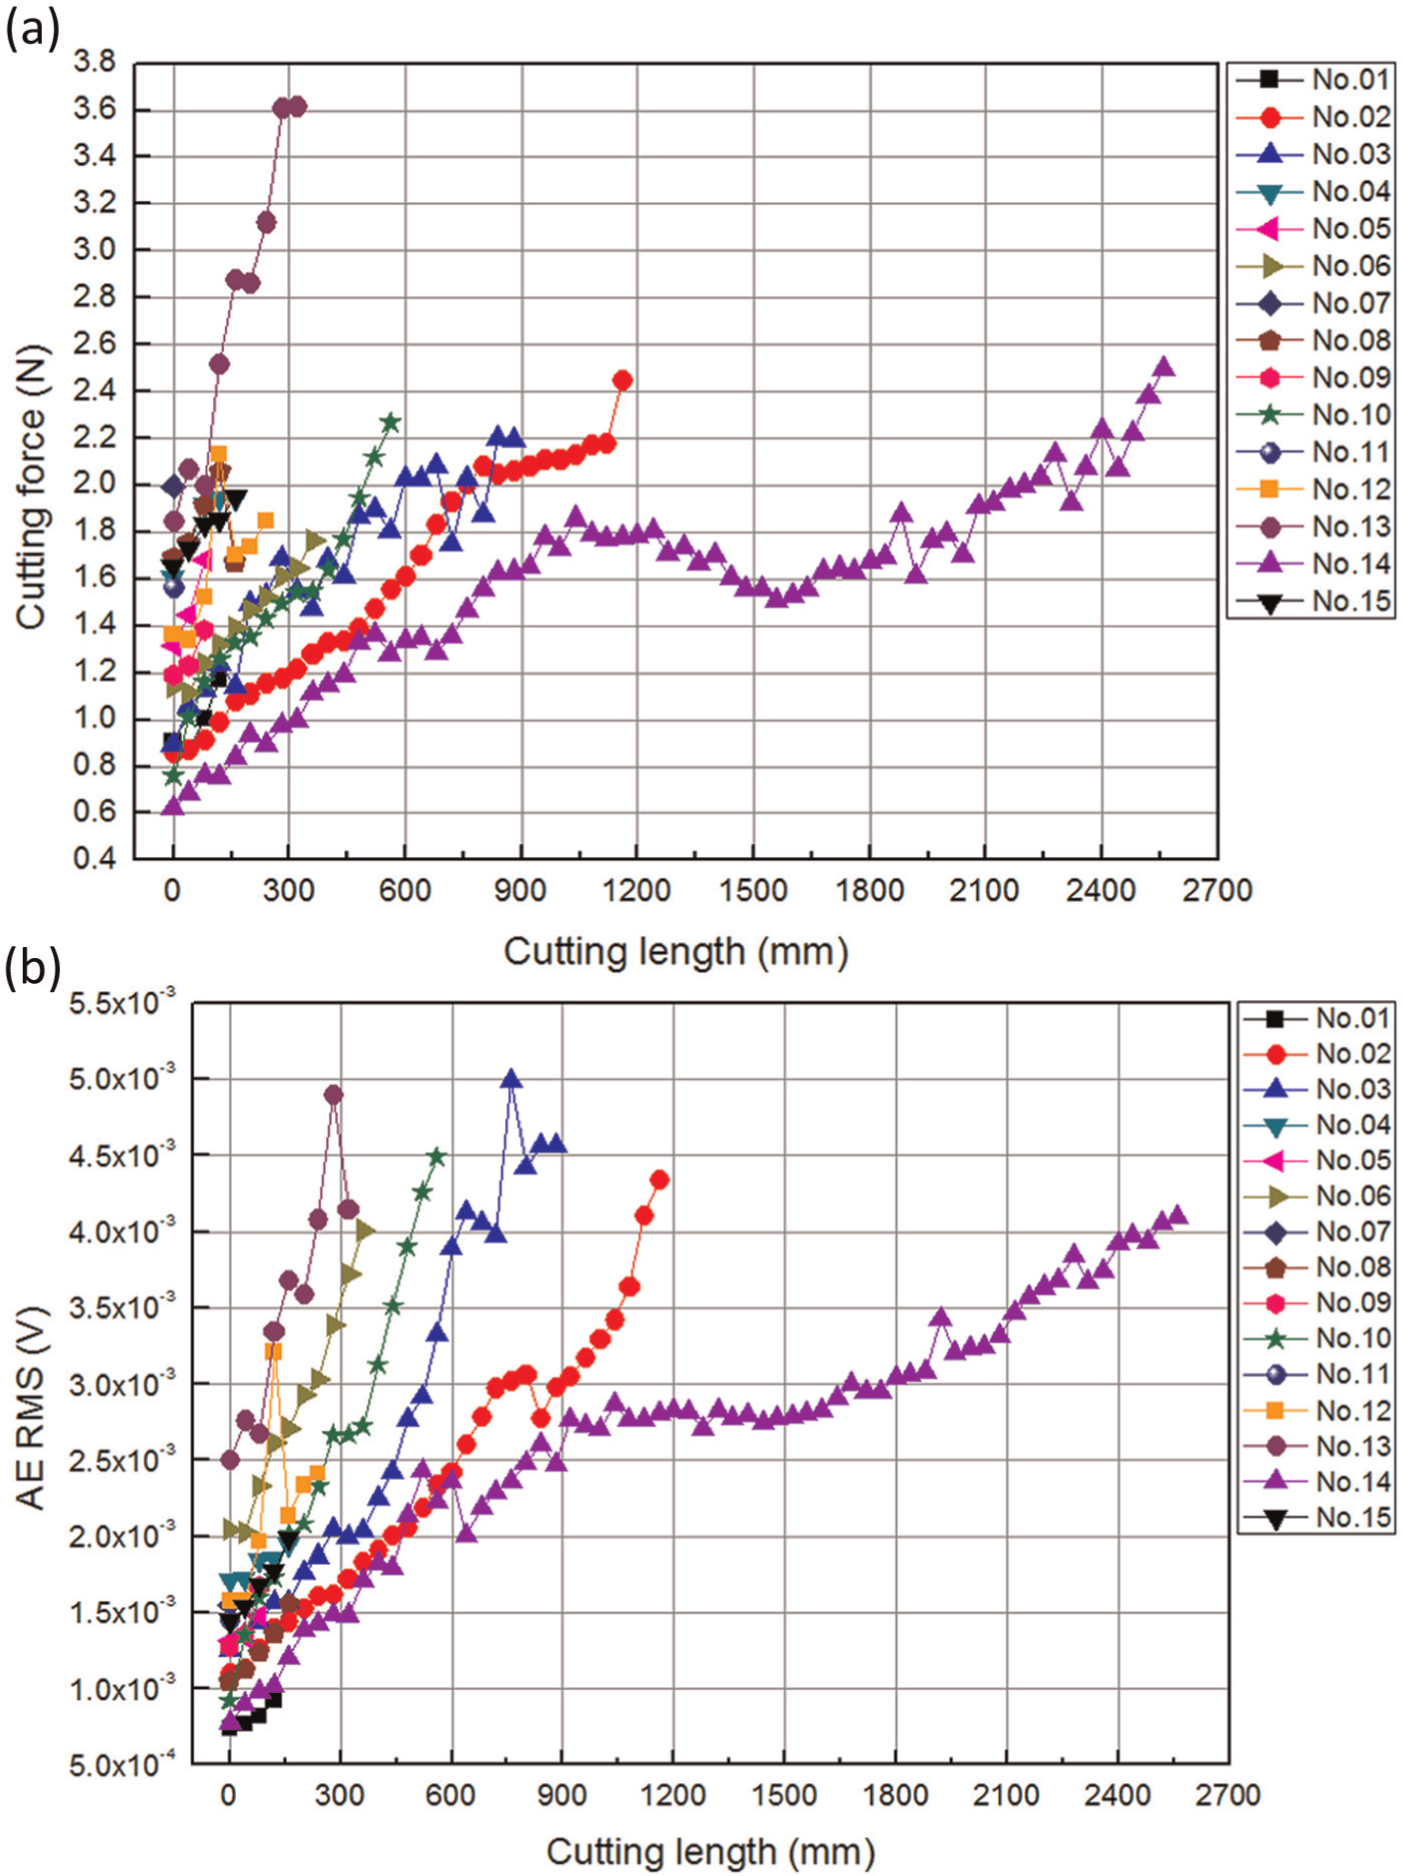
Change in the cutting force and AE RMS according to cutting length: (a) cutting force and (b) AE RMS.
It was difficult to identify the effect of feed per tooth and spindle speed on the tool life after relative comparison of feed per tooth, spindle speed, and depth of cut. However, a linear relationship was observed between the depth of cut and the tool life in most of the experimental results. Moreover, as the depth of cut increased, early cutting force and AE RMS increased. Thus, compared with the other variables, depth of cut had a stronger effect on the tool life.
Figure 4 shows the cutting forces at the beginning of the microscale milling process and at the point of breakage of the micromilling tool. In all the experiments, the cutting forces increased compared to the corresponding values at the beginning of machining. In experiments 2, 3, 6, 10, 13, and 14, the breakage of micromilling tool occurred by normal tool wear; the cutting force was more than 2.0 N except in experiment 6 at the point of tool breakage.
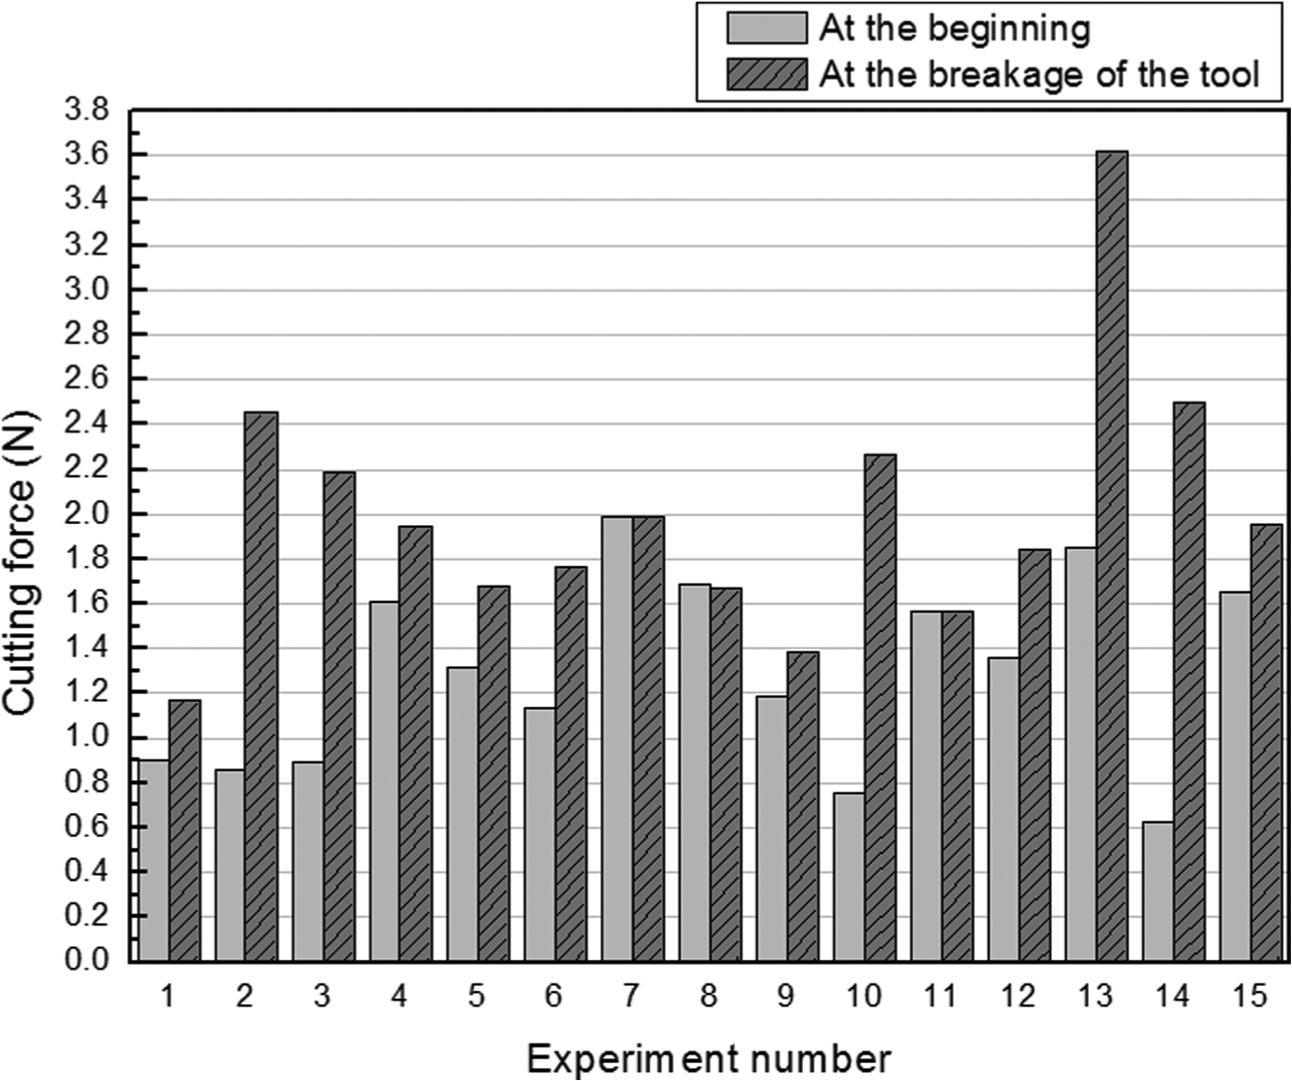
Cutting force at the beginning of the microscale milling process and at the breakage of the tool.
Figure 5 shows the AE RMS at the beginning of the microscale milling process and at the point of breakage of the micromilling tool. In all the experiments, the AE RMS signals increased in comparison with the values at the beginning of machining. In experiments 2, 3, 6, 10, 13, and 14, the AE RMS was greater than 4.0 × 10⁻³ V at the breakage point of the tool. The characteristics of the AE RMS signal were similar to that of the cutting force. However, the change in value of the AE RMS signal at the breakage point of the tool was clearer than that of the cutting force. Based on these results, the cutting force and the AE RMS signal were used to establish a standard for determining a suitable tool change time point.
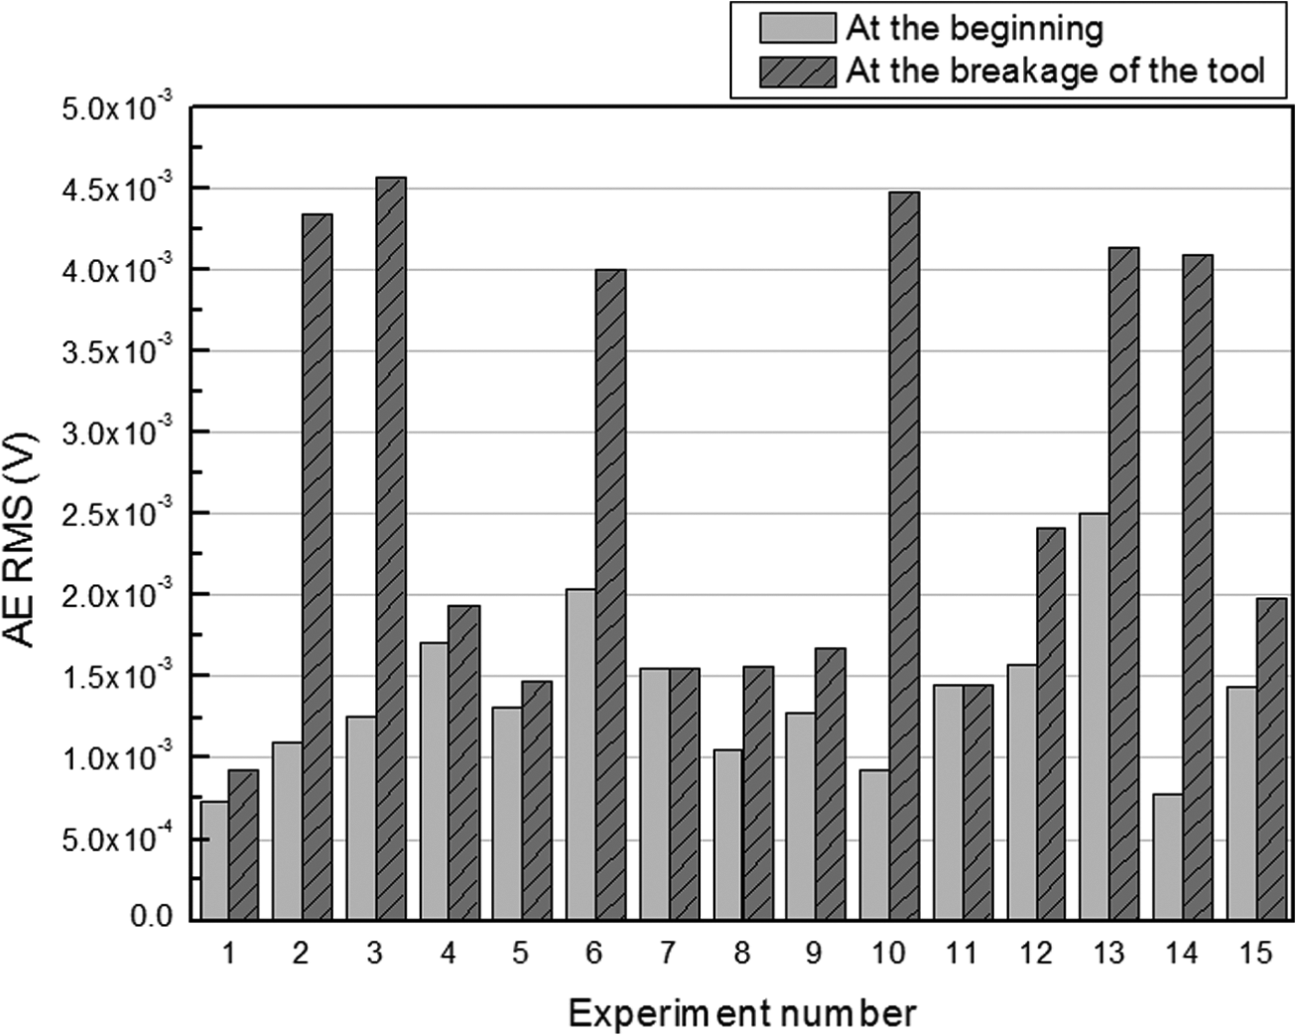
AE RMS at the beginning of the microscale milling process and at the breakage of the tool.
Tool wear and breakage
As shown in Figure 6, the micromilling tool was worn by machining a material, and the tool finally broke. Figure 7 shows graphs of the FFT of the AE signal at various cutting lengths obtained in experiment 2. At the beginning of machining and a cutting length of 400 mm, the shapes of the graphs are relatively similar. However, at a cutting length of 800 mm, the peak values and the peak width between 1500 and 1750 Hz, those between 2250 and 2750 Hz, and those between 3000 and 3500 Hz increased in comparison with the corresponding values for the case in which the cutting length was 400 mm. At a cutting length of 1180 mm, which was immediately before the breakage of the tool, the peak values and the peak widths between 1500 and 1750 Hz and those between 2250 and 2750 Hz increased. These results suggest that the values of the cutting force and the AE RMS increased and that the peak value and the peak width of the graph of the FFT changed as the tool wear grew until the tool was broken by wear.
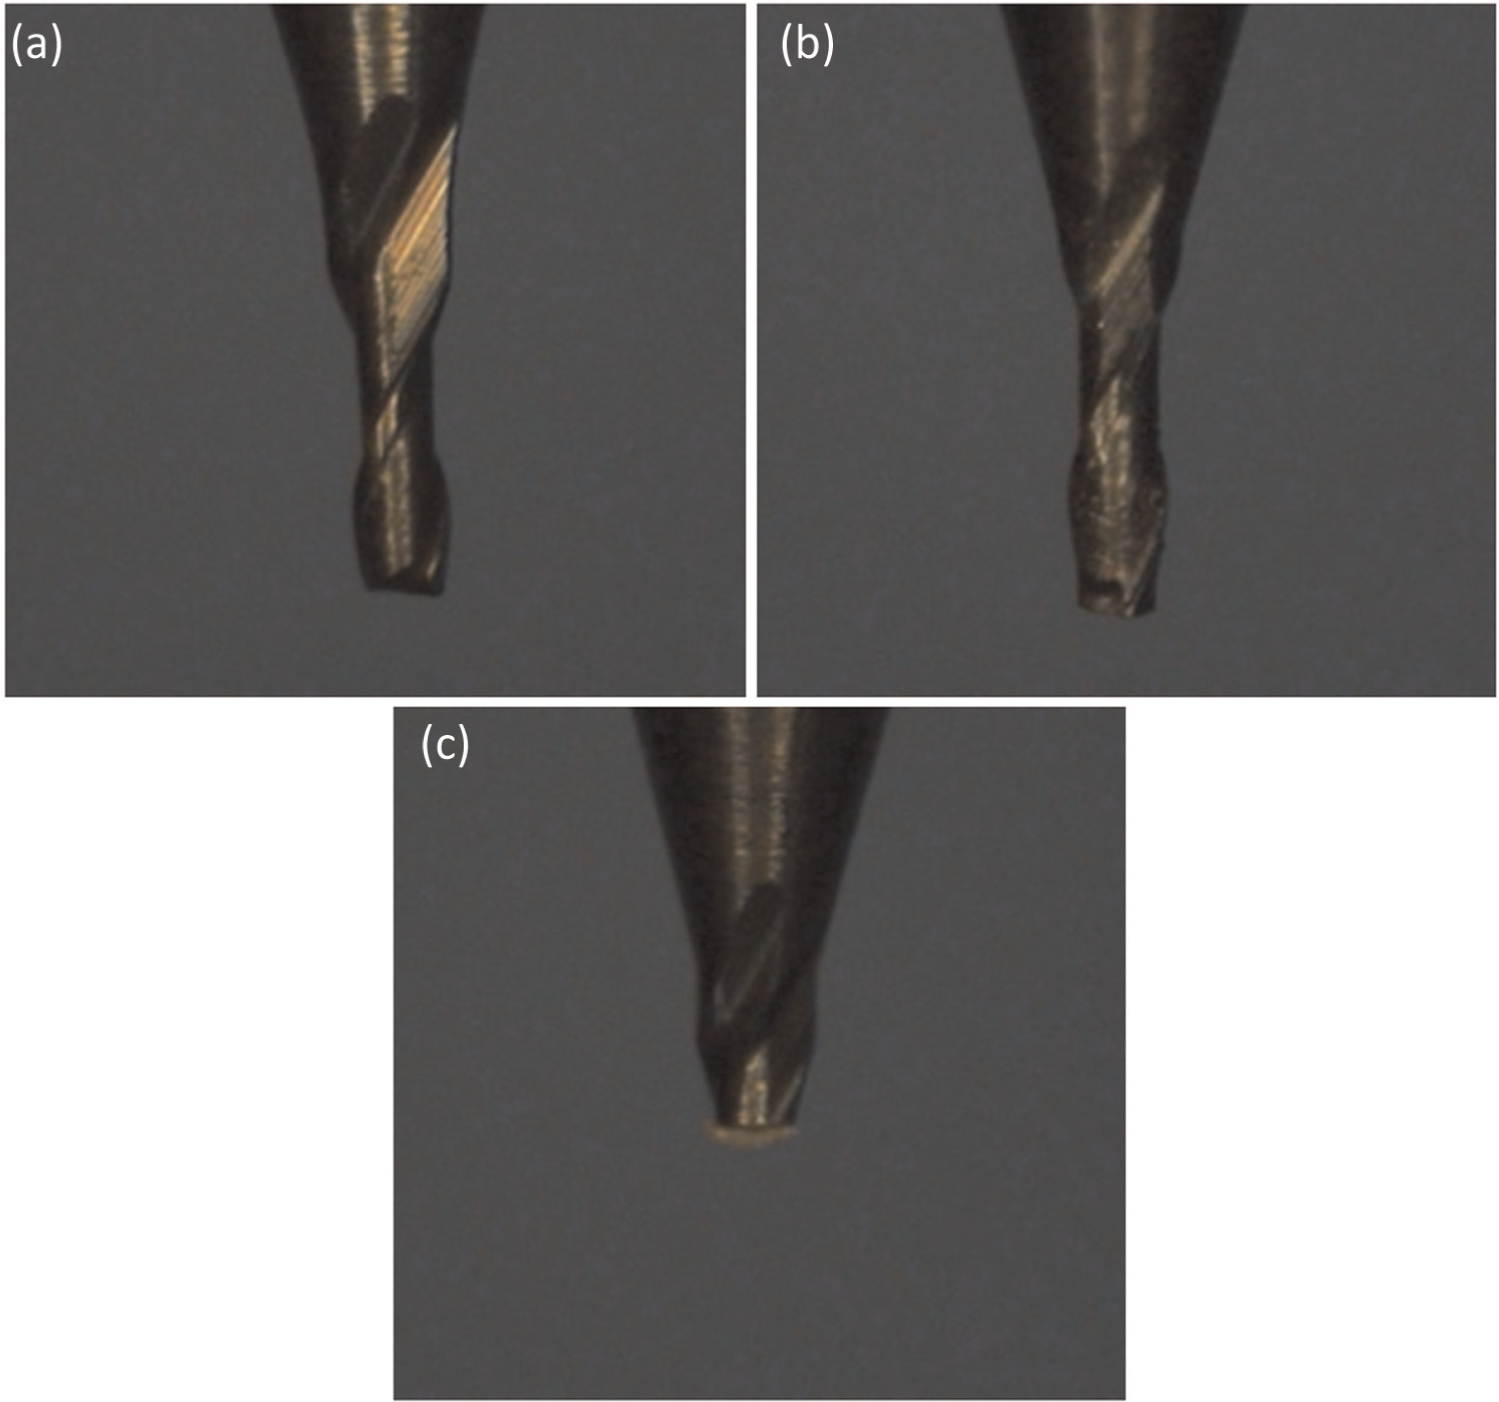
Conditions of micromilling tool: (a) new tool, (b) worn tool, and (c) broken tool.
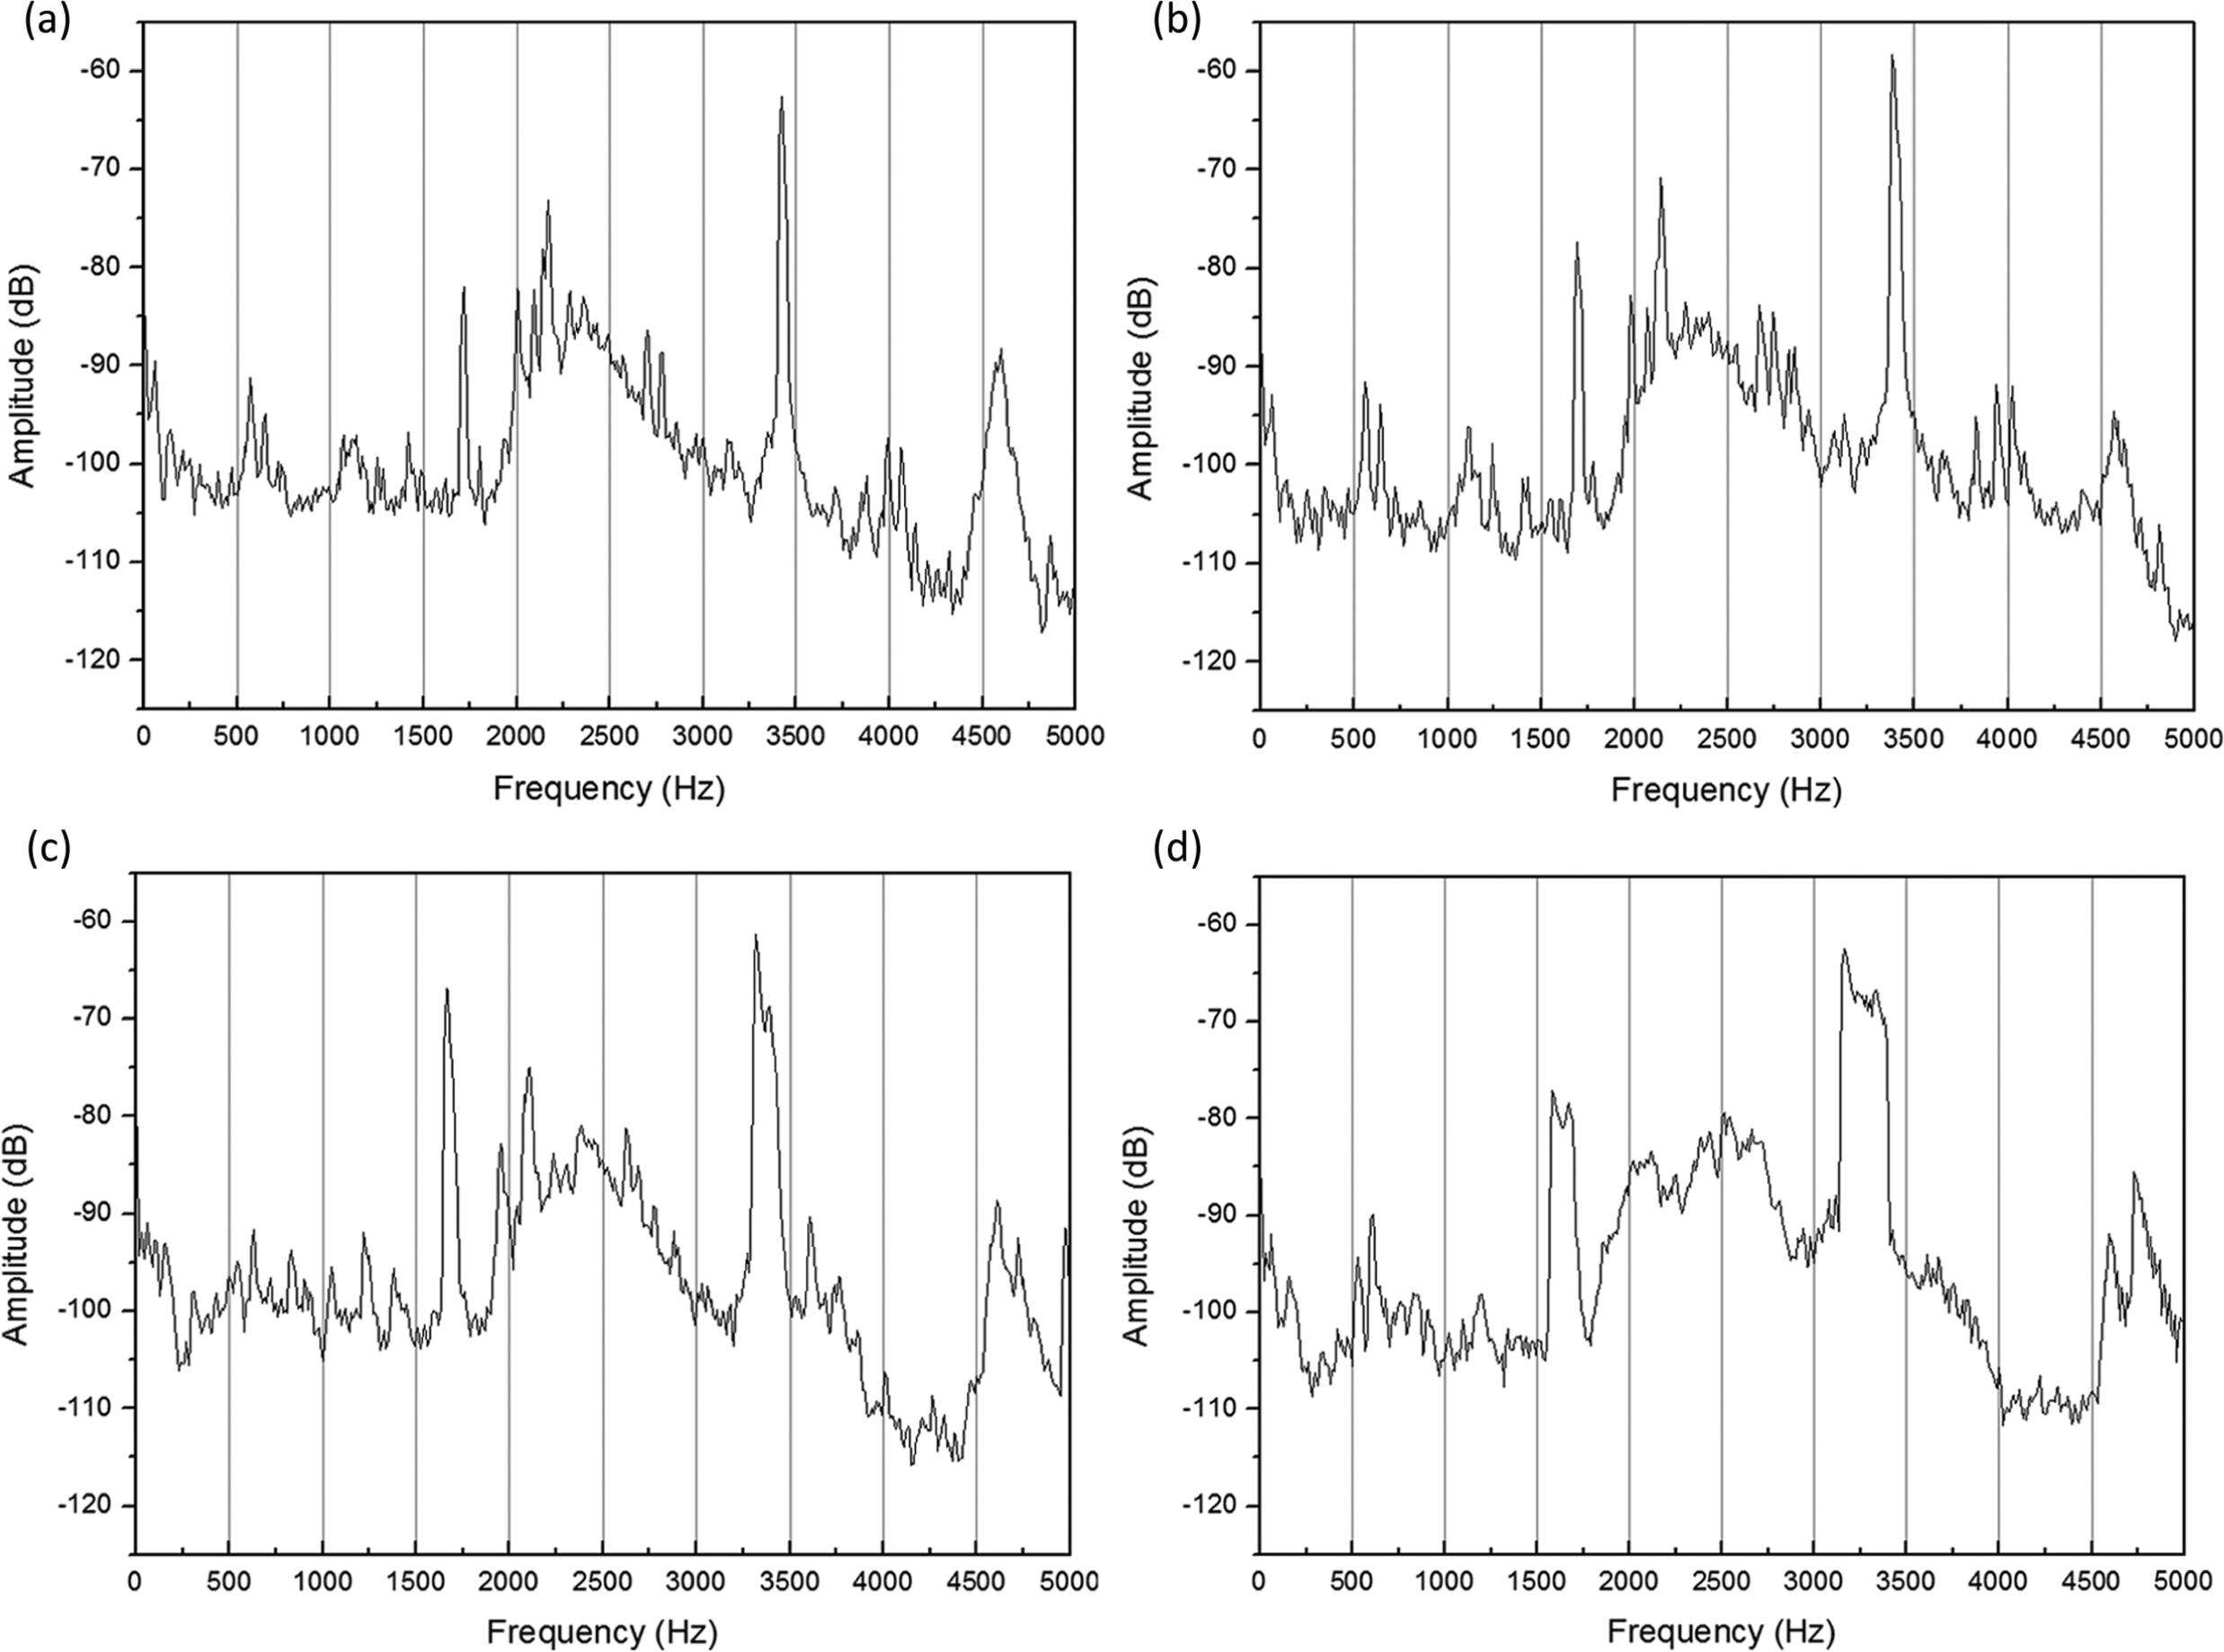
The graphs of the FFT of the AE signal: (a) the beginning of machining, (b) the cutting length of 400 mm, (c) the cutting length of 800 mm, and (d) the cutting length of 1180 mm.
The life of the microtool that was measured in these experiments is shown in Figure 8. In each pair of experiments 2 and 6, 3 and 7, 4 and 8, and 14 and 15, cutting conditions were the same, except for the depth of cut. Tool life was shorter in the experiments with a greater depth of cut. In particular, in experiments 2 and 4, cutting conditions were similar except for the depth of cut, but the tool life in experiment 14 was approximately twice that in experiment 2. It is thought that not only the depth of cut but also the higher feed rate had an effect on the tool life.
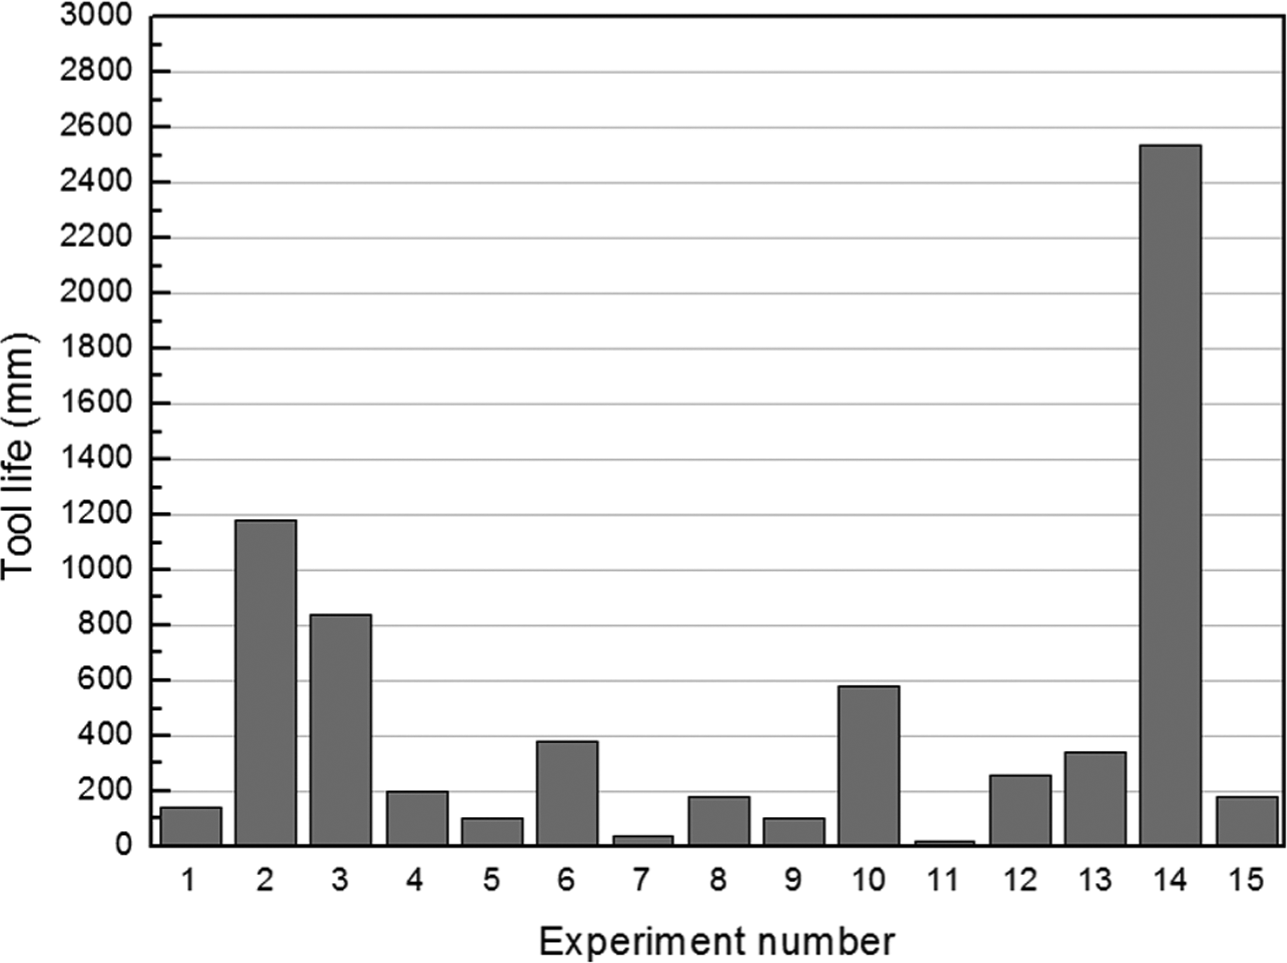
The tool life of micromilling tool.
Development of the tool life equation
A second-order regression model was used to obtain the tool life equation. The second-order regression model is given by equation (5)

To estimate the regression coefficients, the following equation was used

where
Hence, the second-order tool life equation is given as follows from the result of equation (6)
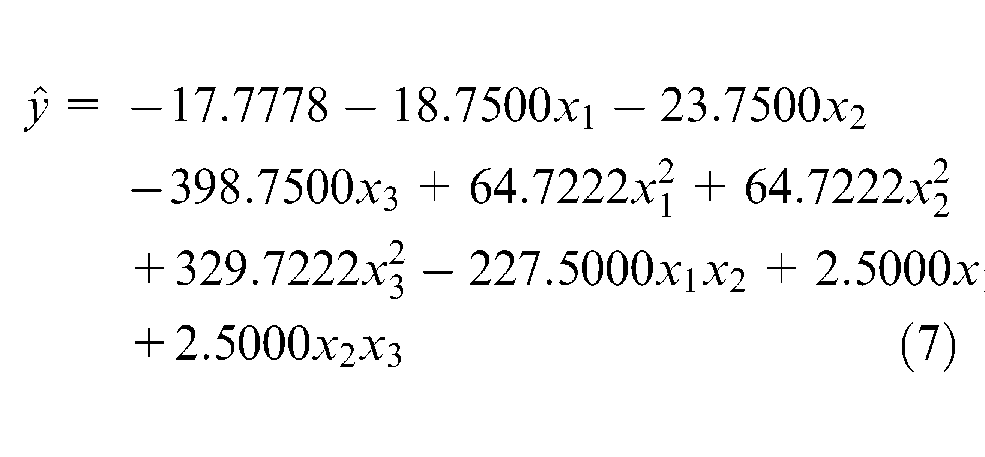
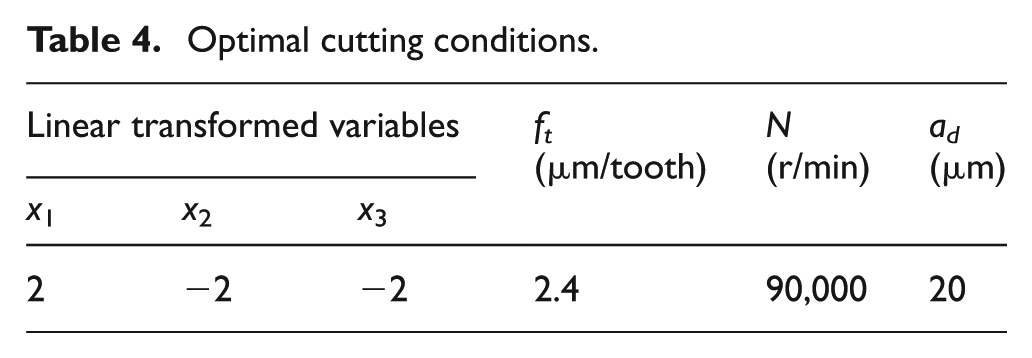
The optimal cutting conditions were then obtained by means of equation (7) in terms of tool life as given in Table 4.
Optimal cutting conditions.
Monitoring of the micromilling process
Microscale milling experiments were conducted to determine how to monitor the microscale milling process efficiently and to guide the development of a machining monitoring program to determine tool change time more accurately and effectively. An analysis of the experimental results was carried out.
Experimental setup
The machining equipment, sensors, and signal processing methods used for implementing the microscale milling process were the same as those described in section “Machining experiments for analyzing the life of micromilling tools.” The cutting conditions listed in Table 4 were applied in the experiment.
Experimental results and discussion
Figure 9 shows the change in cutting force with the cutting length. The change in AE RMS is shown in Figure 10. It was possible to identify that the cutting force and AE RMS increased because tool wear proceeded with the increase in cutting length. In Figures 9 and 10, the slope of the curve is steep until a cutting length of approximately 500 mm, after which the curve is gradual up to a cutting length of 2000 mm. The slope becomes steep again from 2000 mm to the point at which the tool broke. These results indicate that it is possible to classify the grade of tool wear and determine the point of tool change time. When the tool broke, the cutting force was approximately 2.6 N and the AE RMS was approximately 4.4 × 10⁻³ V.
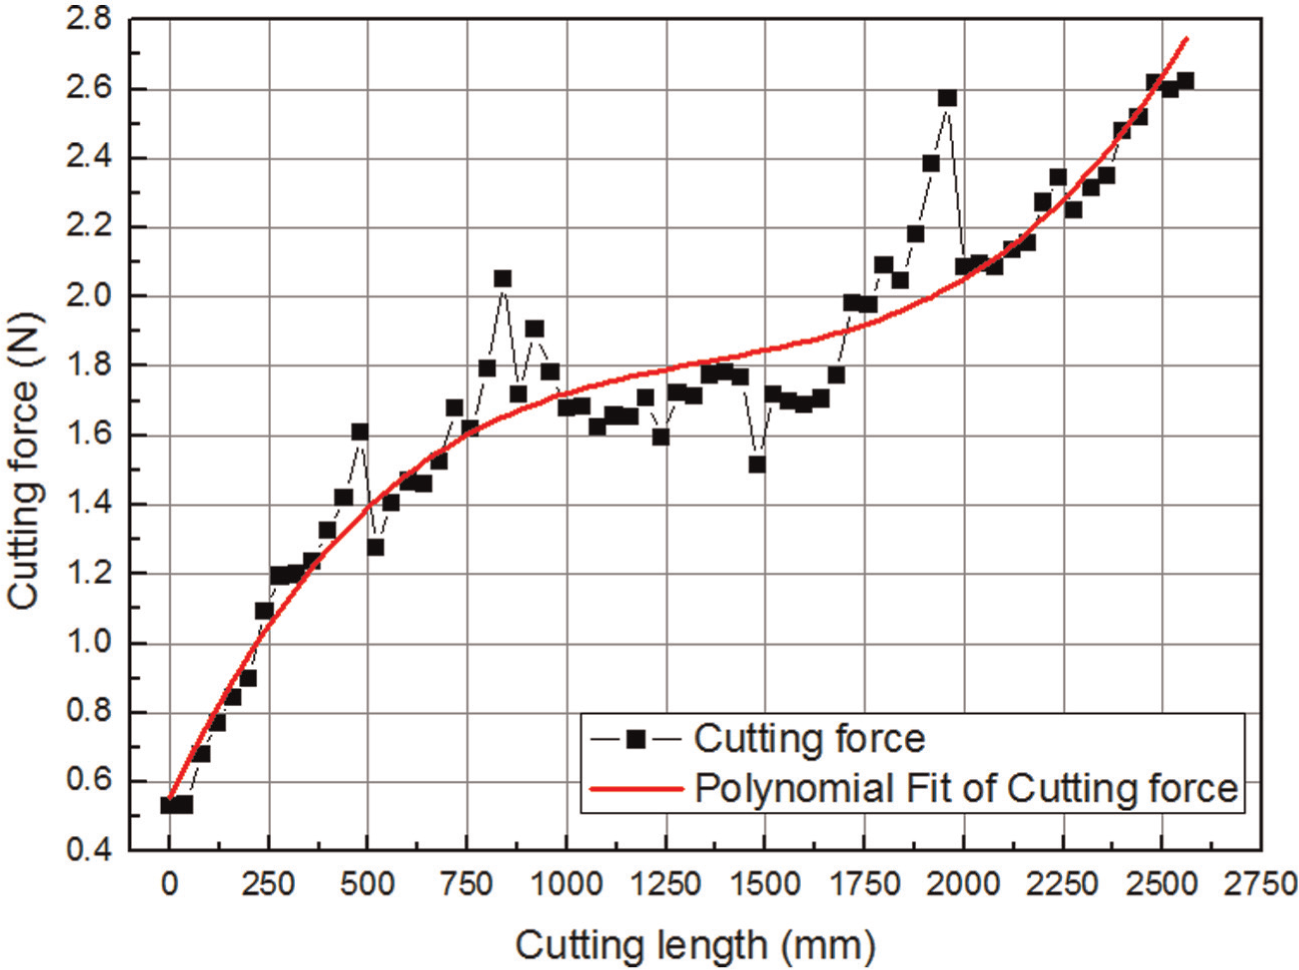
Cutting force according to cutting length.
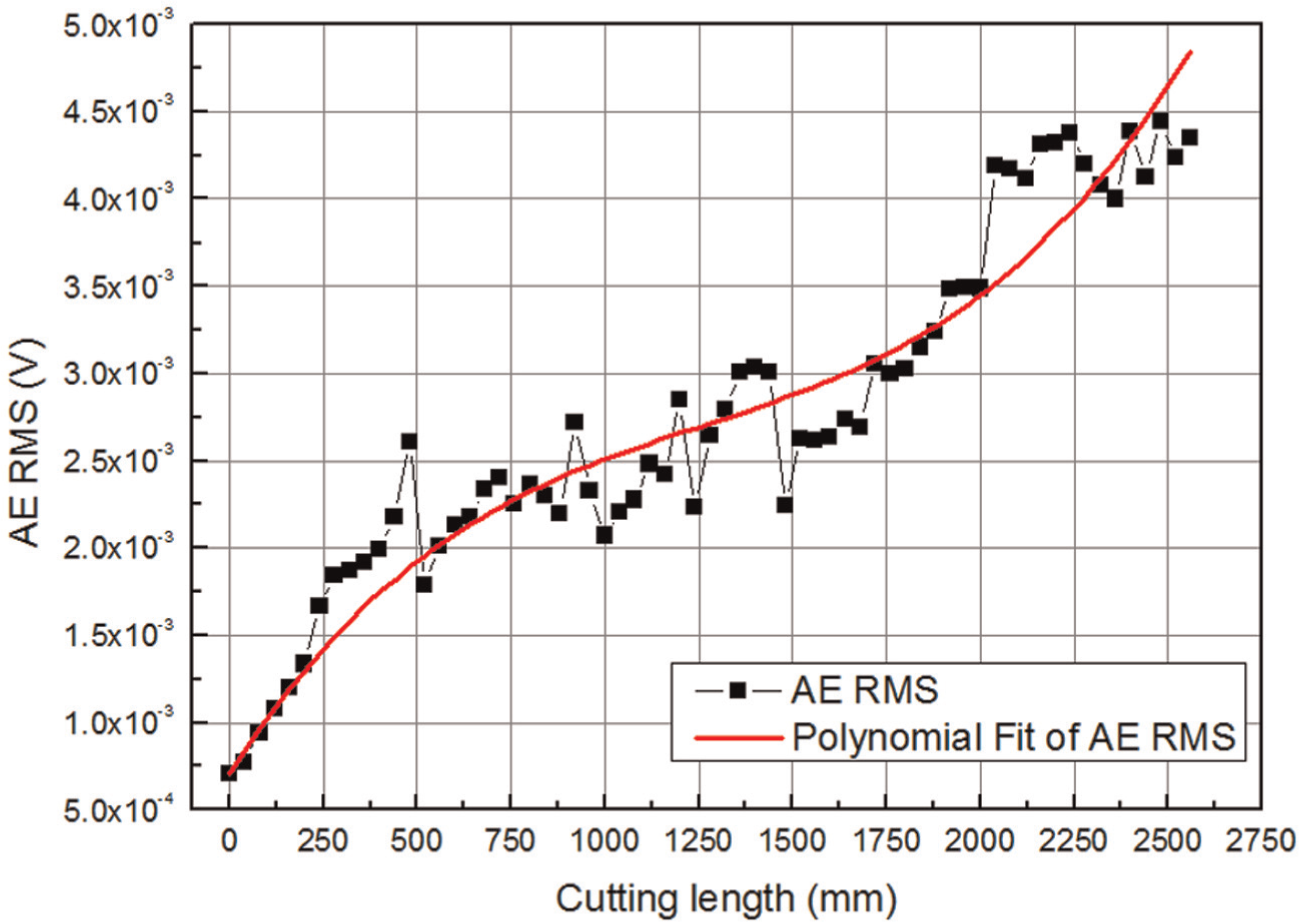
AE RMS according to cutting length.
Figure 11 shows graphs of the FFT of the AE signal at various cutting lengths. At the beginning of machining and at the cutting length of 500 mm, the shapes of the graphs are relatively similar. However, at the cutting length of 2000 mm, the peak values and the peak width between 1500 and 1750 Hz, those between 2250 and 2750 Hz, and those between 3000 and 3500 Hz increased in comparison with corresponding values for the case in which the cutting length was 400 mm. At the cutting length of 2560 mm, which was immediately before breakage of the tool, the peak values and peak widths between 1250 and 1750 Hz and those between 2750 and 3250 Hz increased further.
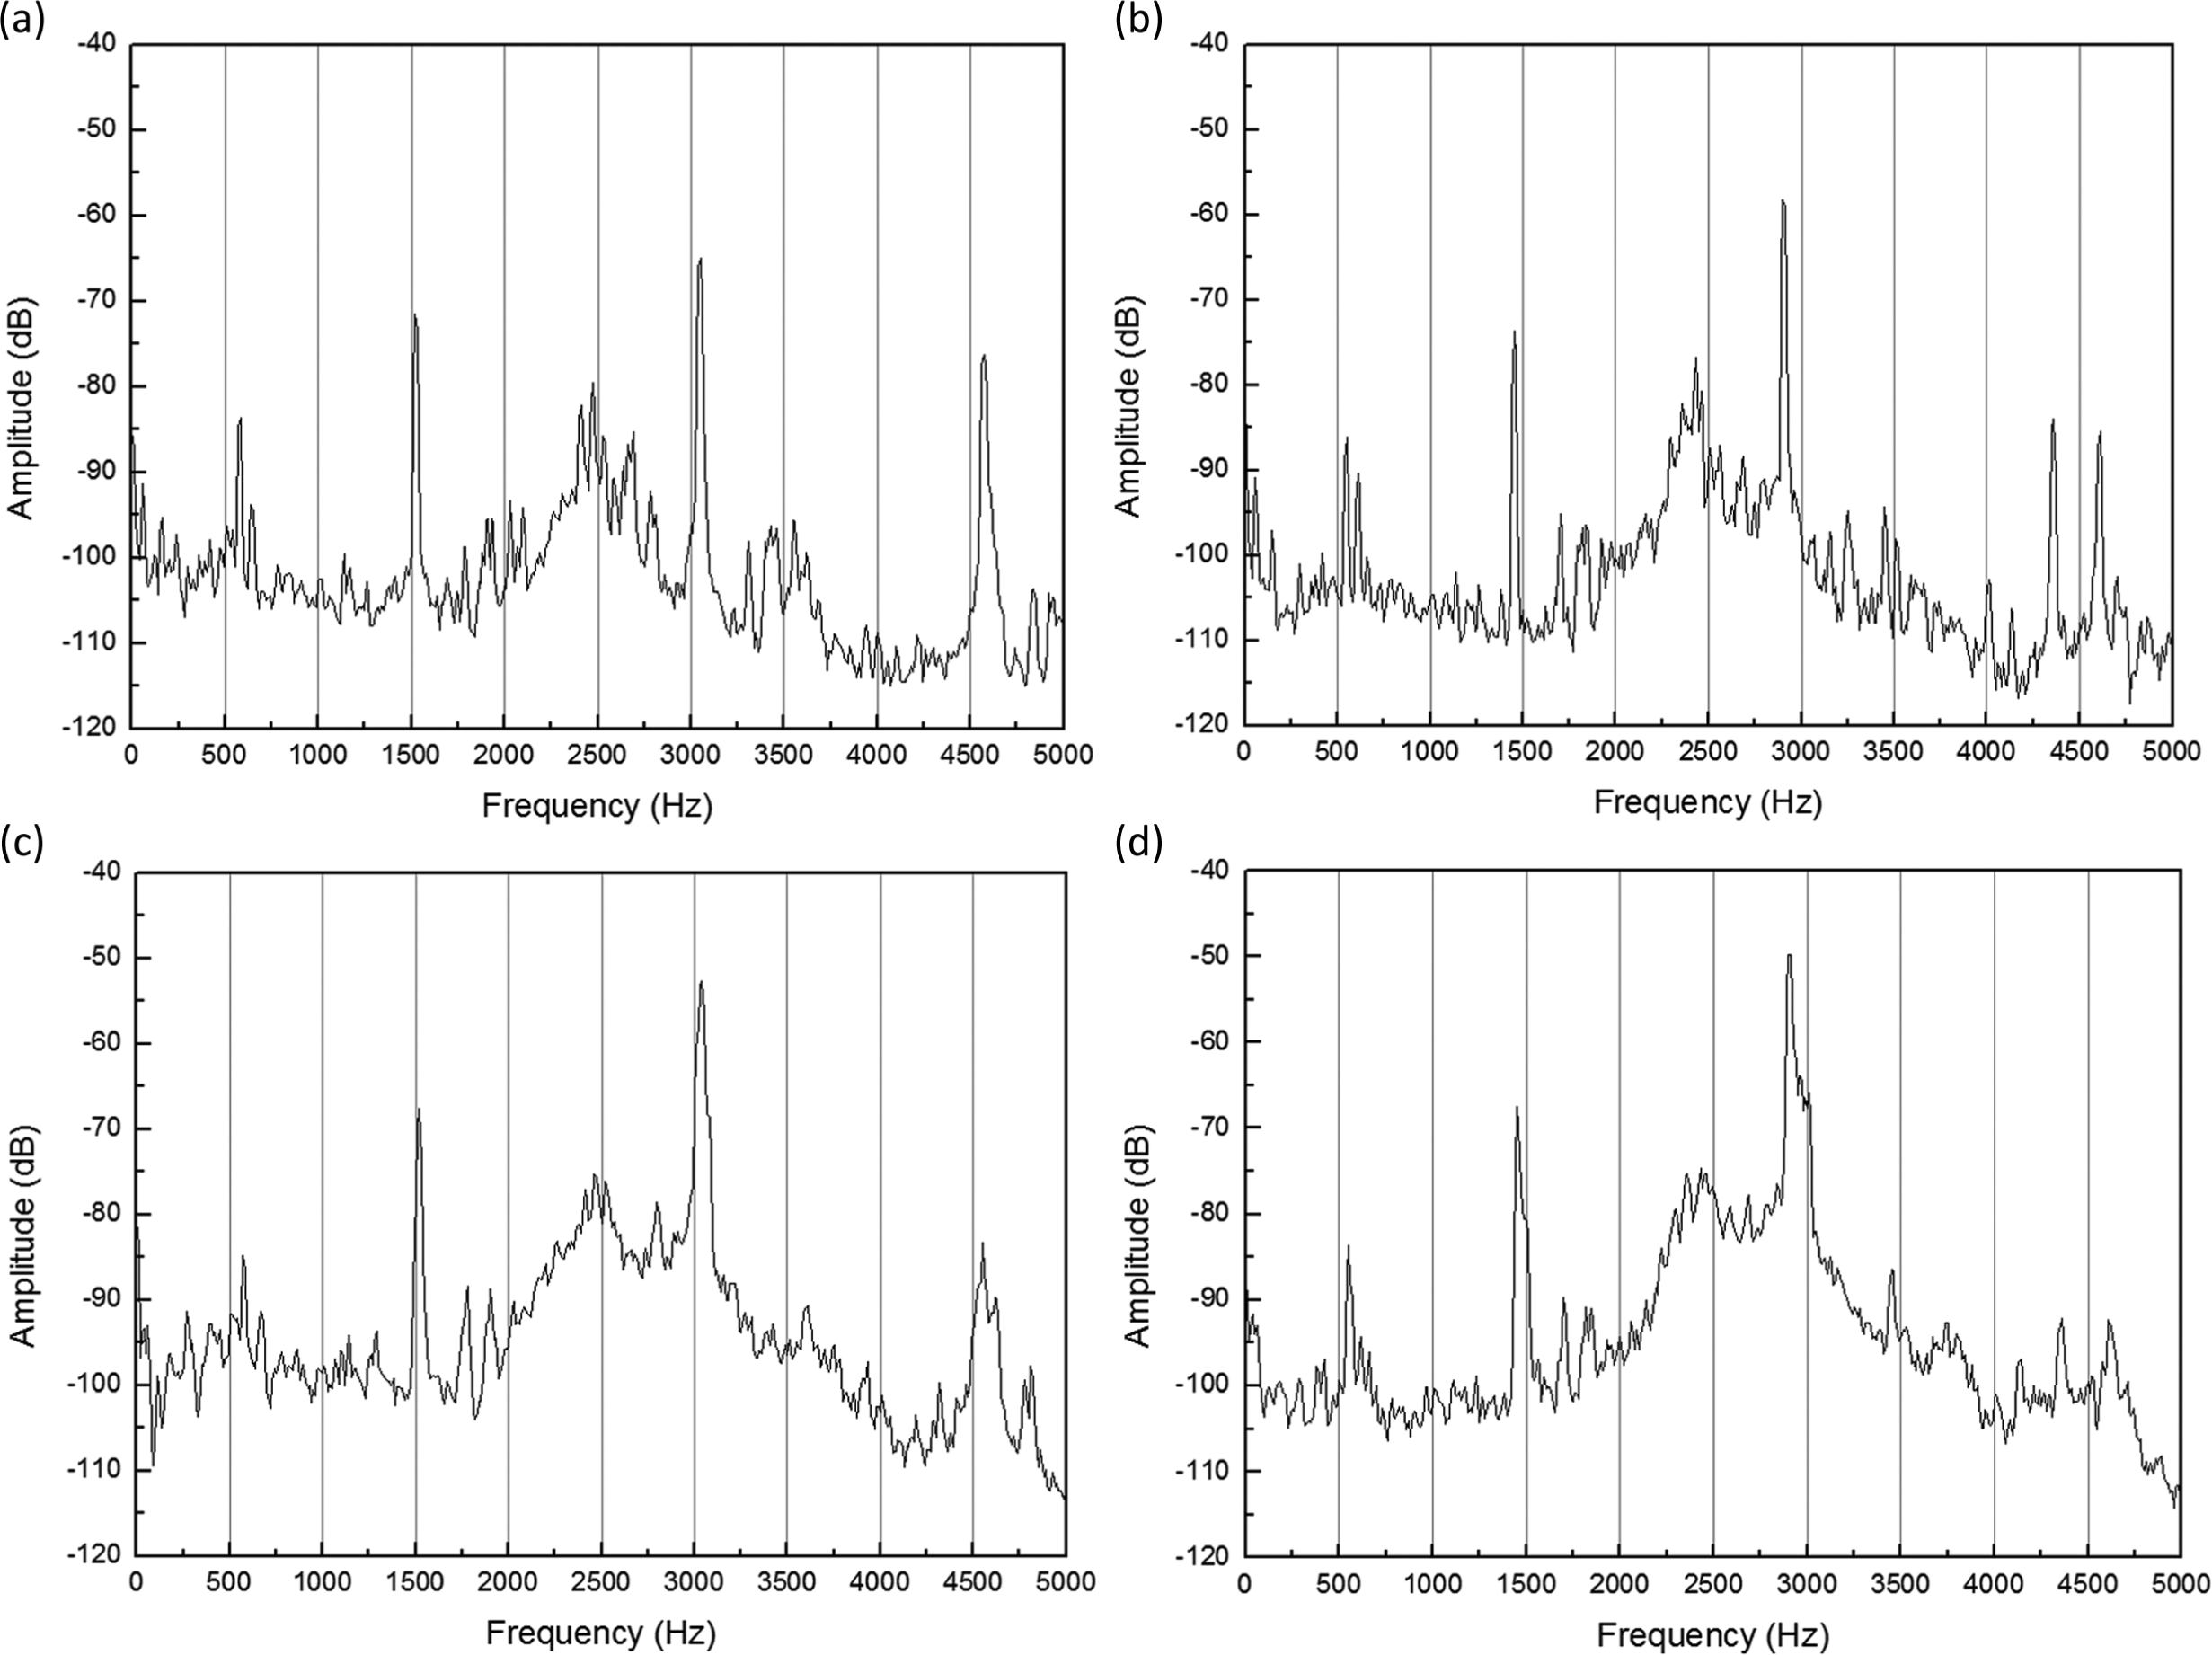
Power spectrum of AE signal according to cutting length: (a) the beginning of machining, (b) the cutting length of 500 mm, (c) the cutting length of 2000 mm, and (d) the cutting length of 2560 mm.
Figure 12 shows SEM images of machined surfaces for each cutting length determined by analyzing the changes in cutting force and the AE RMS signal according to cutting length. Prior to the cutting length of 500 mm, the surface condition was relatively good. However, at the cutting length of 2000 mm, the surface condition became poor and the quantity and size of burrs increased. At the cutting length of 2560 mm (which was immediately before breakage of the tool), the condition of the surface and the shapes of the burrs worsened. This phenomenon may have arisen because material separation was abnormally done and shear plastic deformation occurred at the primary shear region owing to blunting of the cutting edge by flank and clearance wear in relation to increase of cutting length.
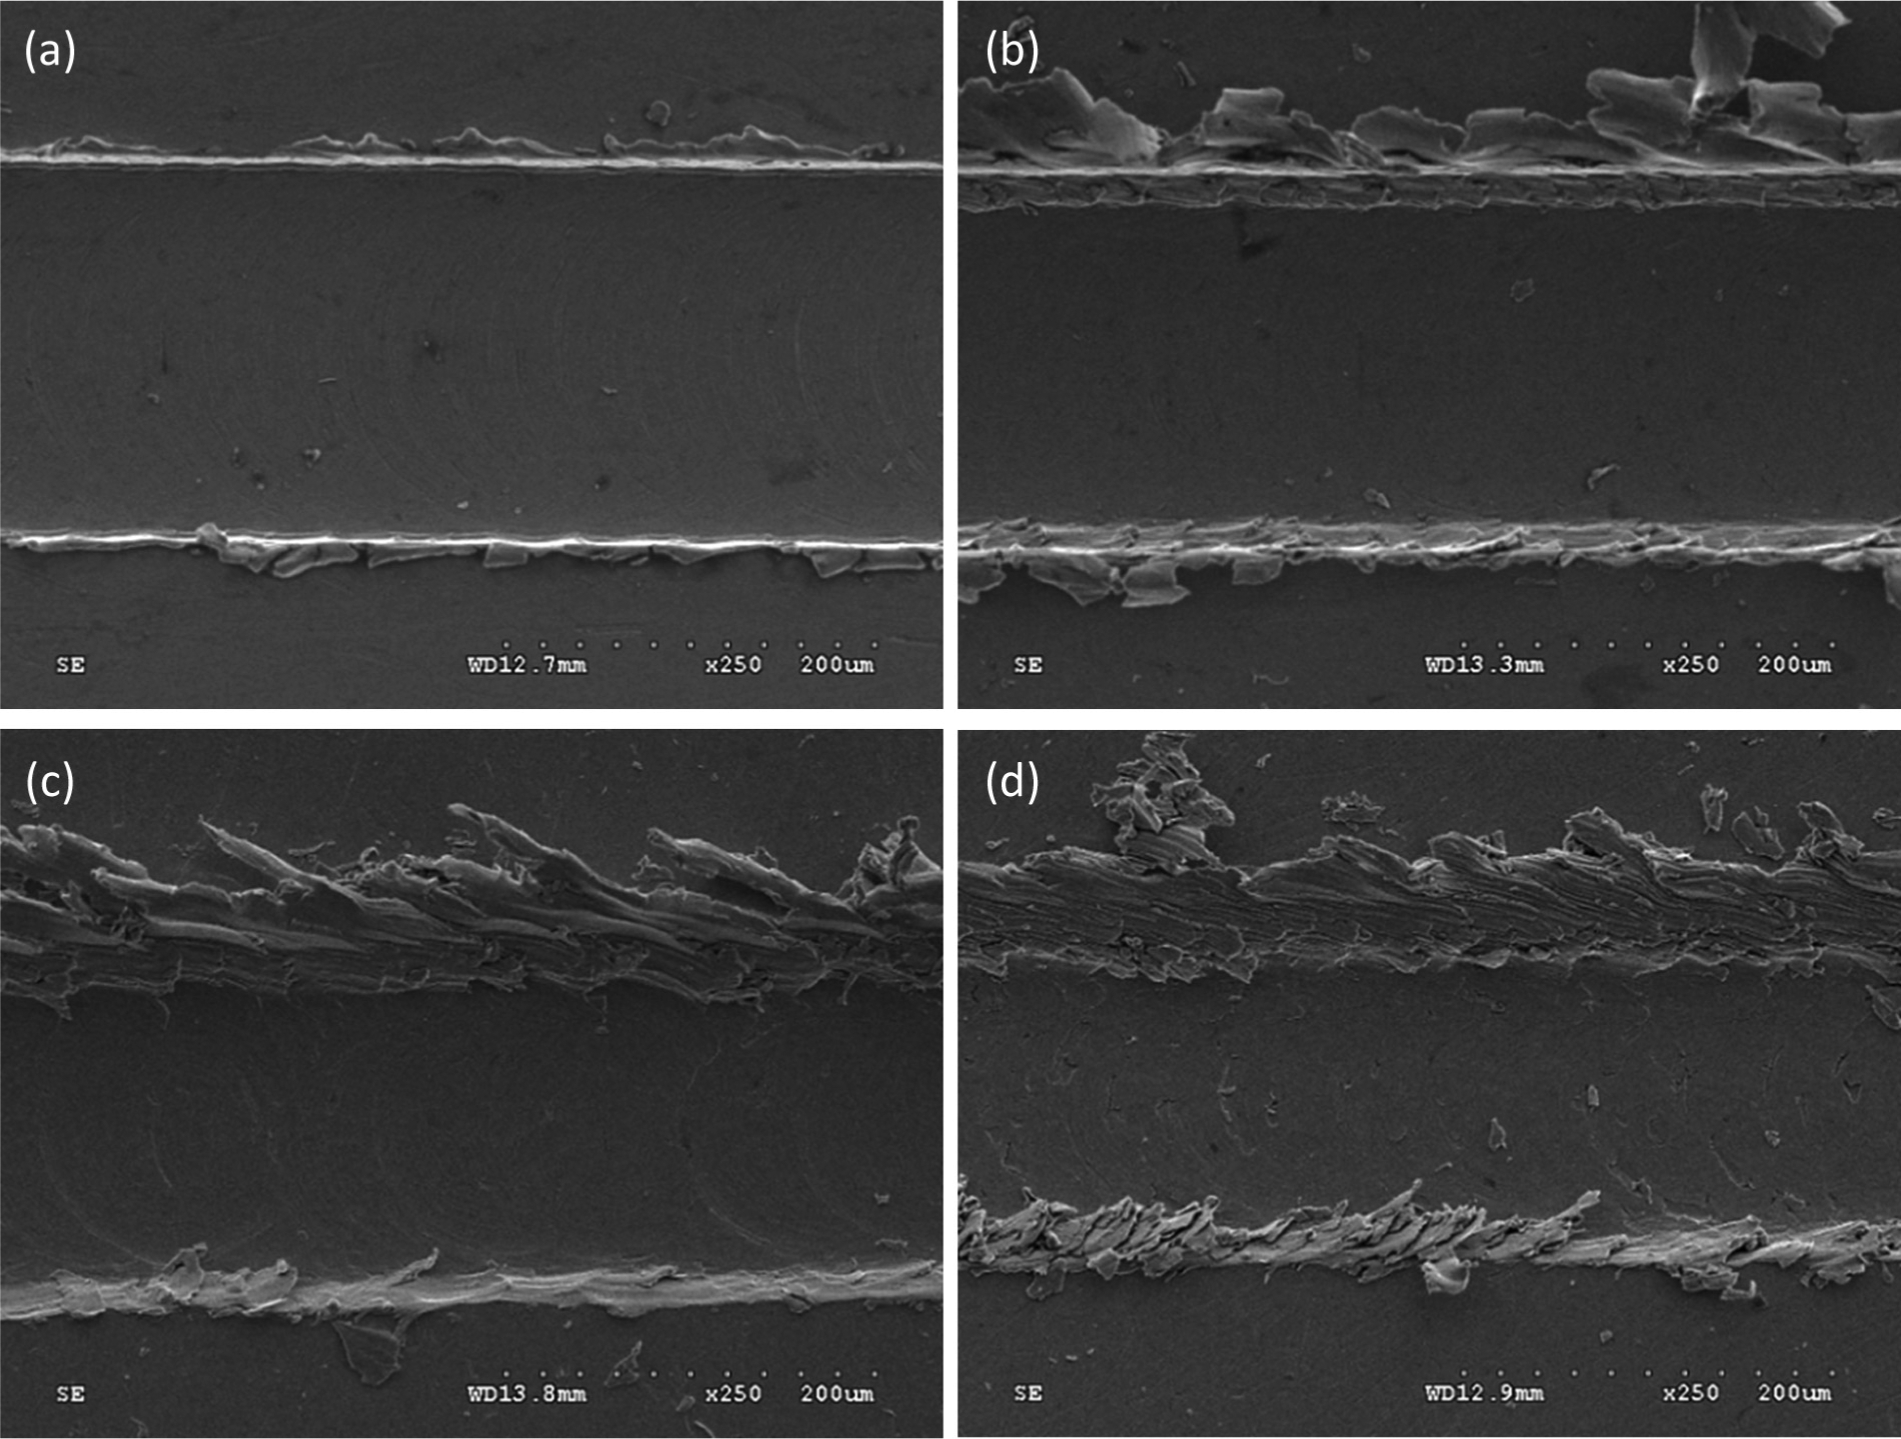
SEM images of machined surface: (a) the beginning of machining, (b) the cutting length of 500 mm, (c) the cutting length of 2000 mm, and (d) the cutting length of 2560 mm.
These results suggest that the cutting force and AE RMS between cutting lengths of 2000 and 2560 mm, which were immediately before breakage of the tool, are appropriate for use as standard points to determine a point of tool change. Moreover, the values of the cutting force and AE RMS increased, and the peak value and the peak width of the graph of the FFT changed, while tool wear increased until the tool broke.
Monitoring program for microscale milling process
In a microscale milling process, tool breakage occurs as the cutting force increases because of tool wear. Therefore, the condition of the tool should be checked by means of continuous machining monitoring. To ensure the accuracy, machined surface quality, and productivity of products, it is essential to change the machining tool before tool breakage occurs. However, it is difficult to determine the point of tool change time by means of general machining monitoring. Hence, it is necessary to enhance the quality and efficiency of machining monitoring by using a machining monitoring program with a standard for judging when tool change should take place, established by analyzing cutting forces and AE RMS values acquired during the experiments.
Point of tool change
In the experiments, the cutting forces and AE RMS increased because of increased tool wear with increasing cutting length and showed a similar tendency. Therefore, the cutting force and AE RMS at the point at which the tool broke were used as a standard for judging when tool change should be undertaken. The cutting force was more than 2.2 N, and the average cutting force was approximately 2.5 N when tool breakage occurred. The AE RMS was more than 4.0 × 10⁻³ V, and the average AE RMS was approximately 4.3 × 10⁻³ V when breakage occurred.
Because all cutting forces and AE RMS average values were calculated between cutting lengths of 2000 and 2560 mm (which were immediately before tool breakage), these values are suitable as a standard for determining the tool change time.
Monitoring program
Figure 13 shows a block diagram indicating the flow of signal processing procedures. The cutting force signal and AE signal were processed using a band-pass filter. Then FFT processing was conducted for the cutting force signals and the AE signal was filtered in real time. For the AE signal, an RMS calculation was implemented in real time. In the case of the cutting force signals, an average calculation using the simple moving average method was performed in real time to monitor the change in values more effectively and to maximize the efficiency of monitoring the microscale milling process.
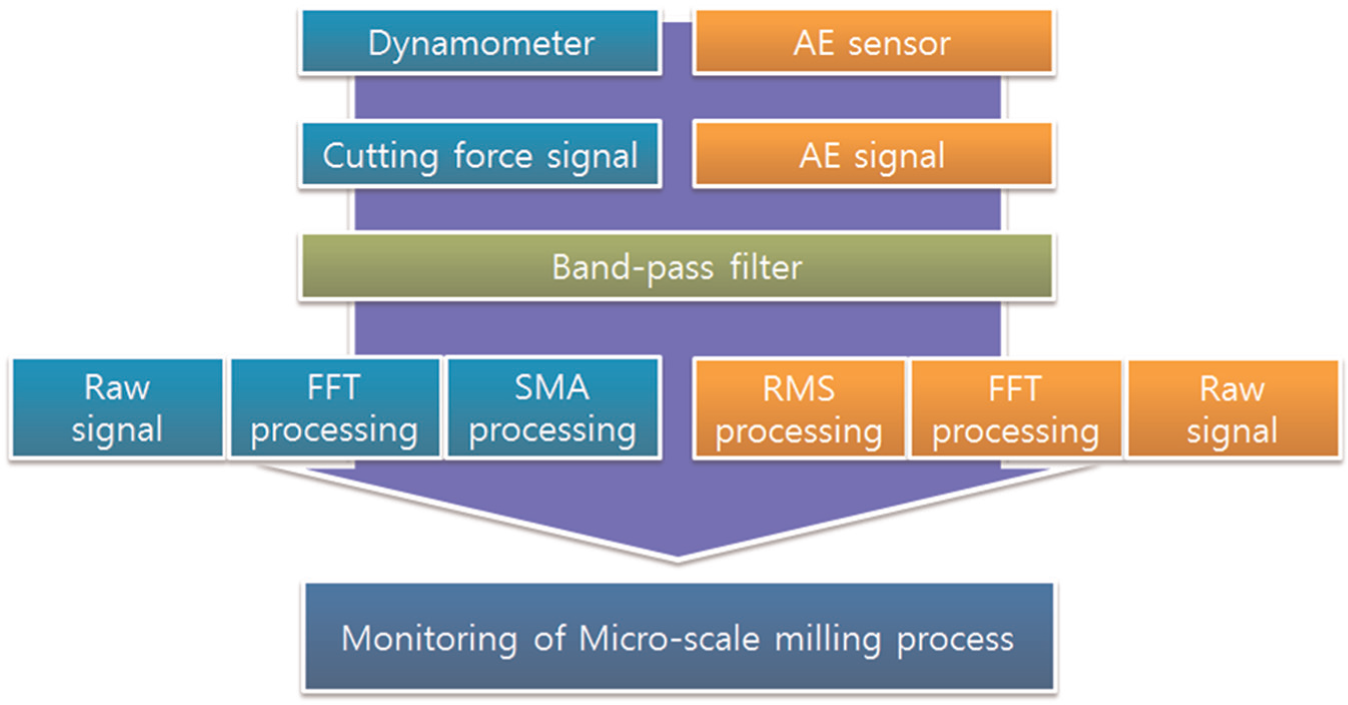
Block diagram of monitoring program for the microscale milling process.
Figure 14 shows a panel of the machining monitoring program made using LabVIEW. In this panel, raw signals of each axis acquired by a dynamometer and a raw signal acquired by an AE sensor are displayed. Moreover, taking the FFT of all the cutting force signals and AE signal in real time makes the observation of machining conditions more effective and easier.
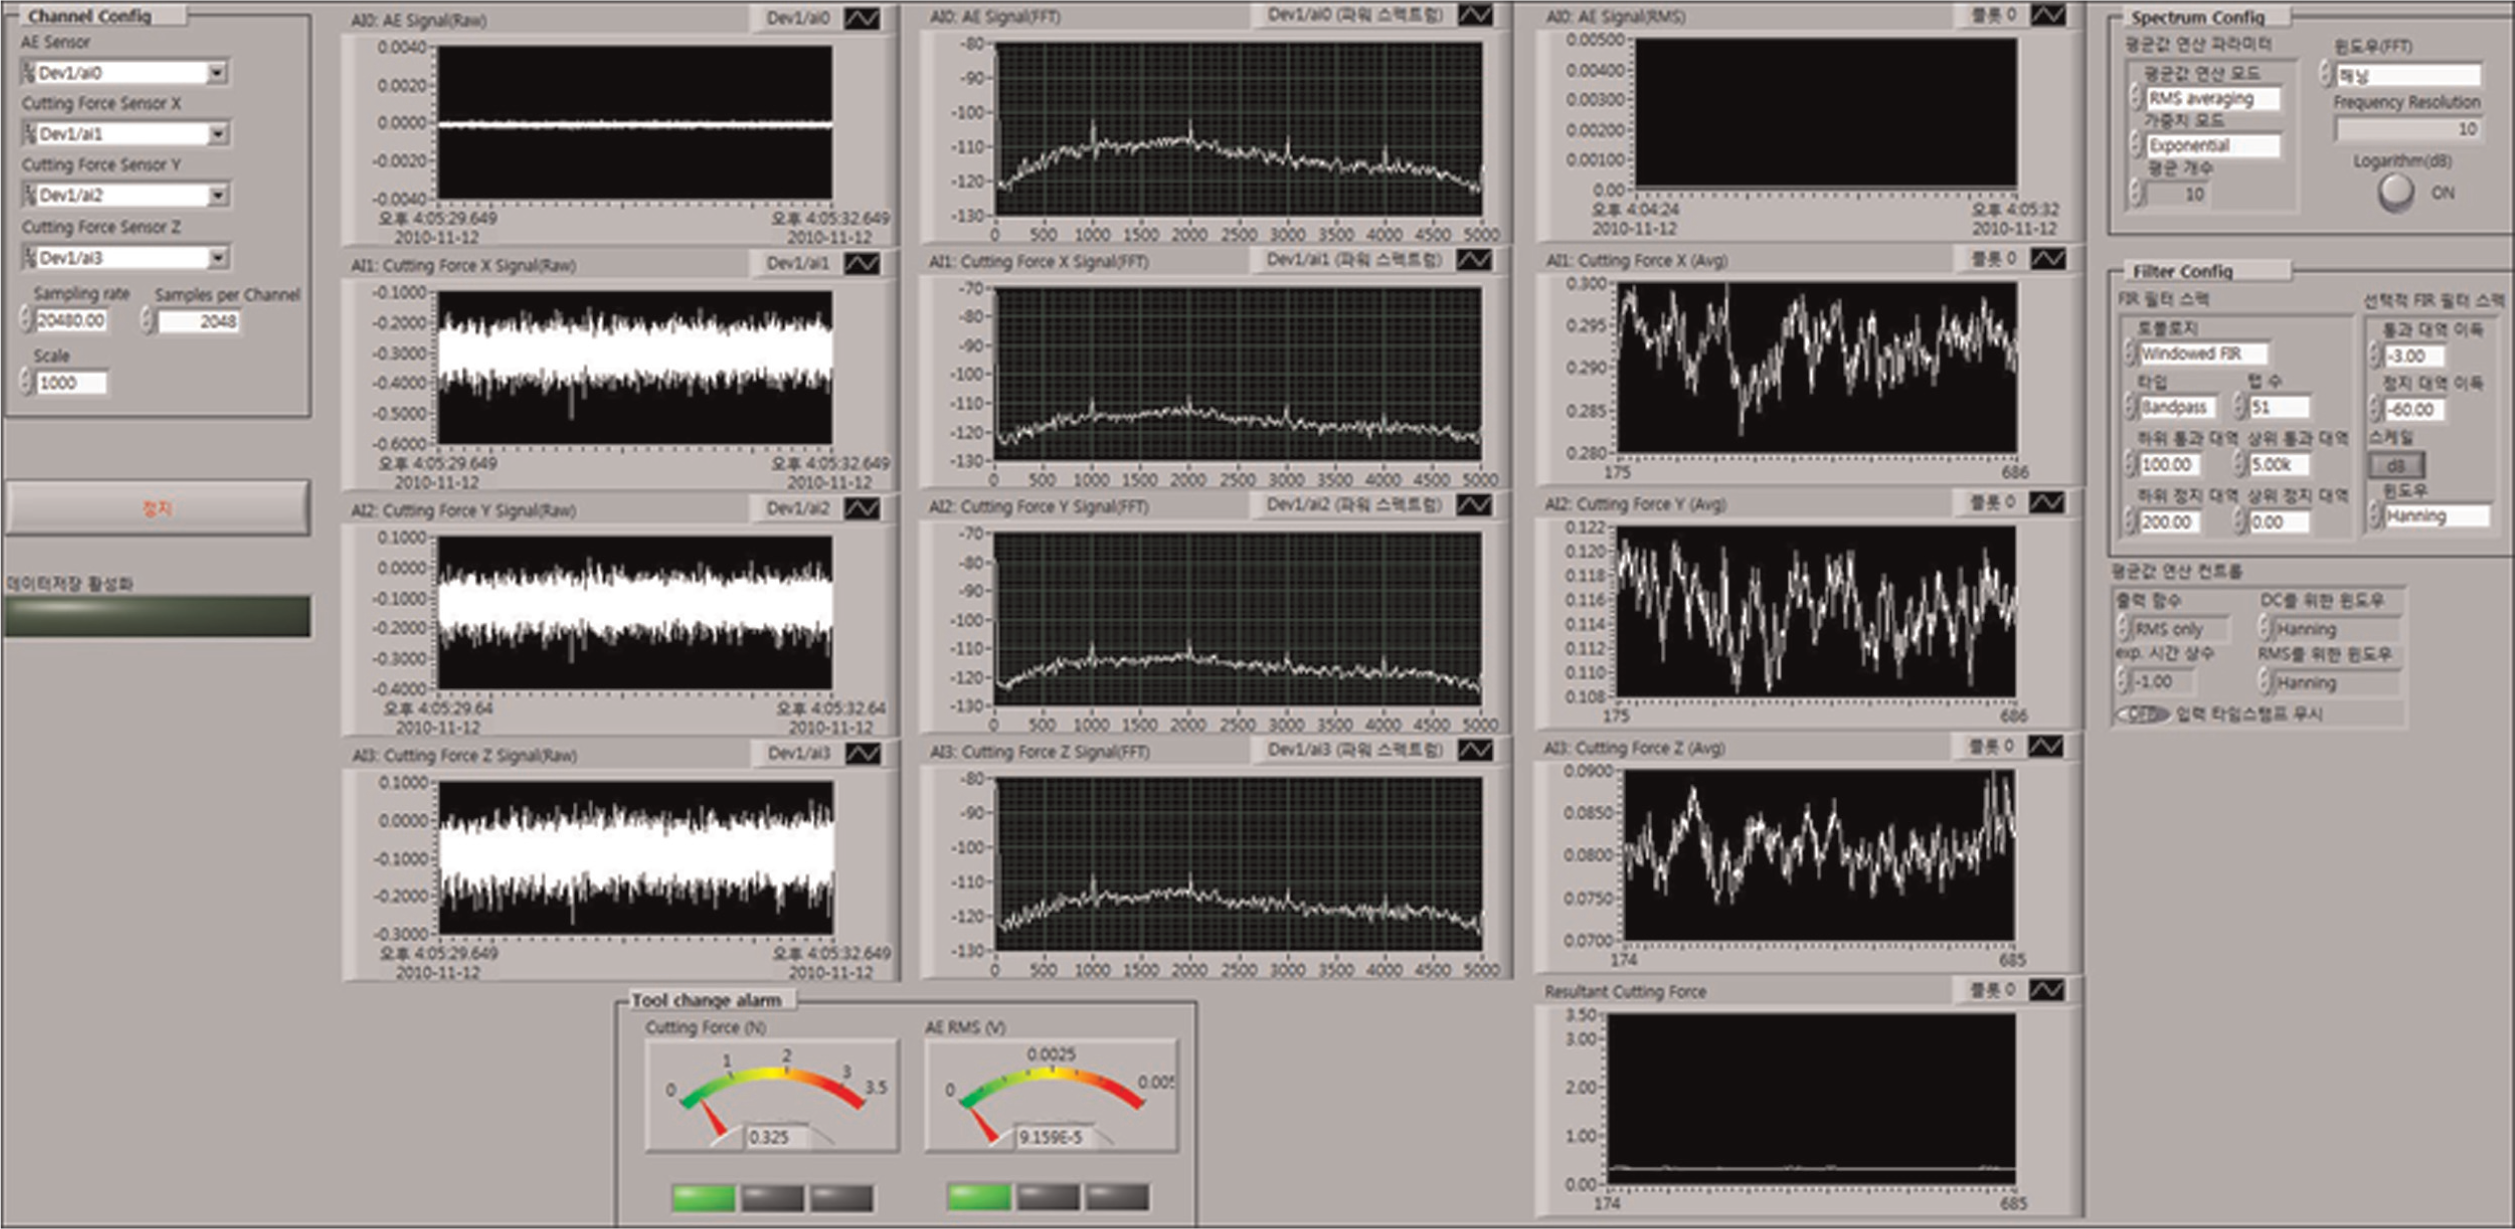
Monitoring program for the microscale milling process.
By using the standard obtained by analyzing the results of the experiments on tool life, when a resultant cutting force reaches 2.2 N and the AE RMS value reaches 4.0 × 10⁻³ V, the first warning for tool change is raised. Then when the resultant cutting force exceeds 2.5 N and the AE RMS value exceeds 4.3 × 10⁻³ V, an alarm is raised to notify the operator that the tool change time has been reached. This function enables more effective and accurate determination of the point of tool change time.
The essential part of the micromilling process is not described in this article. Many studies on the machining monitoring of cutting processes have been conducted by analyzing the signals acquired using sensors such as dynamometers, AE sensors, and accelerometers. However, this study was conducted to acquire for a standard and a method to determine the point of tool change time in addition to analyzing acquired signals, and the investigated data were applied to a machining monitoring program used to help to determine the point of tool change time more accurately. In a future study, measurement of tool wear according to the cutting length will be conducted. Moreover, artificial intelligence will be utilized to improve the accuracy of machining monitoring and to aid decision making about the point in time at which a tool should be changed.
Conclusion
In this study, a microscale milling process was conducted to determine an appropriate point of tool change time and to develop a tool condition monitoring program. Based on the results, the following conclusions are reached:
The cutting force and AE RMS increased because of tool wear, and the peak values and the peak widths of some bandwidths of the graph of the FFT increased until breakage of the micromilling tool.
When the cutting force was greater than 2.0 N and the AE RMS was greater than 4.0 × 10⁻³ V, breakage of the micromilling tool occurred. This result indicates that the cutting force and the AE RMS can be used as a standard for the determination of a suitable tool change point.
Based on the results of the experiments, a second-order tool life equation was obtained, and optimal cutting conditions were obtained by means of the tool life equation.
A monitoring program was developed for tool condition monitoring that utilizes both the average of the resultant cutting force and the average of the AE RMS at which tools break. As a result, it is now possible to monitor the microscale milling process and determine the point of tool change more efficiently and appropriately.
Footnotes
Funding
This research was supported by Basic Science Research Program through the National Research Foundation (NRF) funded by the Ministry of Education, Science and Technology (No. 2010-0008804).