
Abstract
The condition of a cutting tool is an important factor for manufacturing processes. Tool wear has a strong influence on the cutting forces, resulting in poor surface roughness and dimensional accuracy of the workpiece. Therefore, the use of a dynamometer to measure cutting forces is a well-known approach, but it has several limitations such as high cost, poor performance in harsh industrial machining environments and possible interference with cutting dynamics. This article presents a novel smart cutting tool using a separate single-layer piezoelectric film as the sensing unit to detect the orthogonal cutting force. Simulations were performed to validate the feasibility of the proposed design, and the model was also able to detect better force measurement sensitivity. Furthermore, cutting trials were carried out to validate cutting tool performance experimentally.
Introduction
In modern day manufacturing, it is essential to monitor cutting forces with high precision because a change in the cutting force is directly related to the cutting conditions and thus have direct effect on the machining outcome.1,2 Wear and breakage of the cutting inserts can increase the cutting forces and vibrations of the tool holder, resulting in poor surface roughness and loss of dimensional accuracy of the machined workpiece. 3 In order to avoid such damage, some devices have been specially developed and applied to measure the cutting forces. A number of different types of dynamometer have been developed by many companies to measure the cutting forces accurately. Additionally, dynamometers measuring cutting forces as part of condition monitoring systems have been widely used in laboratory environments. However, there are some limitations in their use, such as the reliability of the sensors is decreased in harsh environment. Moreover, due to the size and weight of the dynamometers, they are not applicable for all layout constrained machines and would also interfere with cutting performance because of stiffness reduction on the tooling system. 4
Recent innovations have cutting tools with integrated thin film sensor designed to detect wear. 5 Also, to reduce temperature at the cutting tool tip with internal coolant, the cutting inserts have been developed with micro-channels. 6 This trend for additional smart features in the cutting inserts has led to the development of a smart cutting tool embedded with a single-layer piezoelectric film to measure the orthogonal cutting force. This article also describes the ANSYS coupled-field simulation used to prove the feasibility of the proposed design concept. Second, the ANSYS model can also be used to detect the force measurement sensitivity in several force measurement strategies. Third, the proposed smart cutting tool with a simple and compact configuration was calibrated using the Kistler dynamometer, and its cross-sensitivity effect was also tested using an impact hammer. Finally, with the preliminary cutting trials in dry machining, the calibrated smart cutting tool used to detect the orthogonal cutting force showed good agreement with the Kistler force measurement readings.
Design and analysis of the smart cutting tool
Force measurement strategy
A force can be generally measured by three methods, namely, force shunt, direct and indirect force measurement. With the direct force measurement, a sensing unit has to be mounted directly in the load path to measure the entire process force. Conversely, the indirect force measurement measures a strain proportional to a process force. The force shunt method measures a fraction of the process force passing through the sensing unit. By considering the three force measurement strategies, force shunt measurement was adopted for the smart cutting tool development due to the following three reasons. First, it is difficult to mount a sensor fully in line with the force path, and this force may result in the fracture of the piezoelectric element. Second, with the indirect method, the measured strain is only a small proportion of the force and the measurement sensitivity may well be limited. An analysis of the measurement sensitivity between the indirect force measurement and force shunt method will be studied using the ANSYS model. Finally, with the indirect method, there are practical difficulties in mounting the piezoelectric film onto the surface of the cutting insert and establish a reliable electrical contact. 7
Smart cutting tool configuration
A smart cutting tool proposed comprises a cutting insert, a single-layer piezoelectric film, a metal shim and two pieces of insulation tape, as shown in Figure 1(a). The piezoelectric film PIC181 purchased from PI Ceramic, functioning as a piezoelectric sensor, with dimensions of 3 mm × 3 mm × 0.26 mm, is placed on the top surface of the metal shim. The two pieces of insulation tape are placed on the top of the piezoelectric sensor and the bottom of the metal shim, which are used as insulation and used to fix the piezoelectric sensor into position. A wire is soldered onto the metal shim that functions as the output electrode of the piezoelectric sensor. The integral sensing unit is placed, 6 mm away from the cutting tip, between the cutting insert and spacer, as shown in Figure 1(b) and (c). Although the wire and part of the metal shim are exposed from the surface of the cutting insert, it is still a distance away from the cutting tip, as shown in Figure 1(b). It is necessary to put the other piece of piezoelectric film at the back in order to level the insert up, as shown in Figure 1(c).
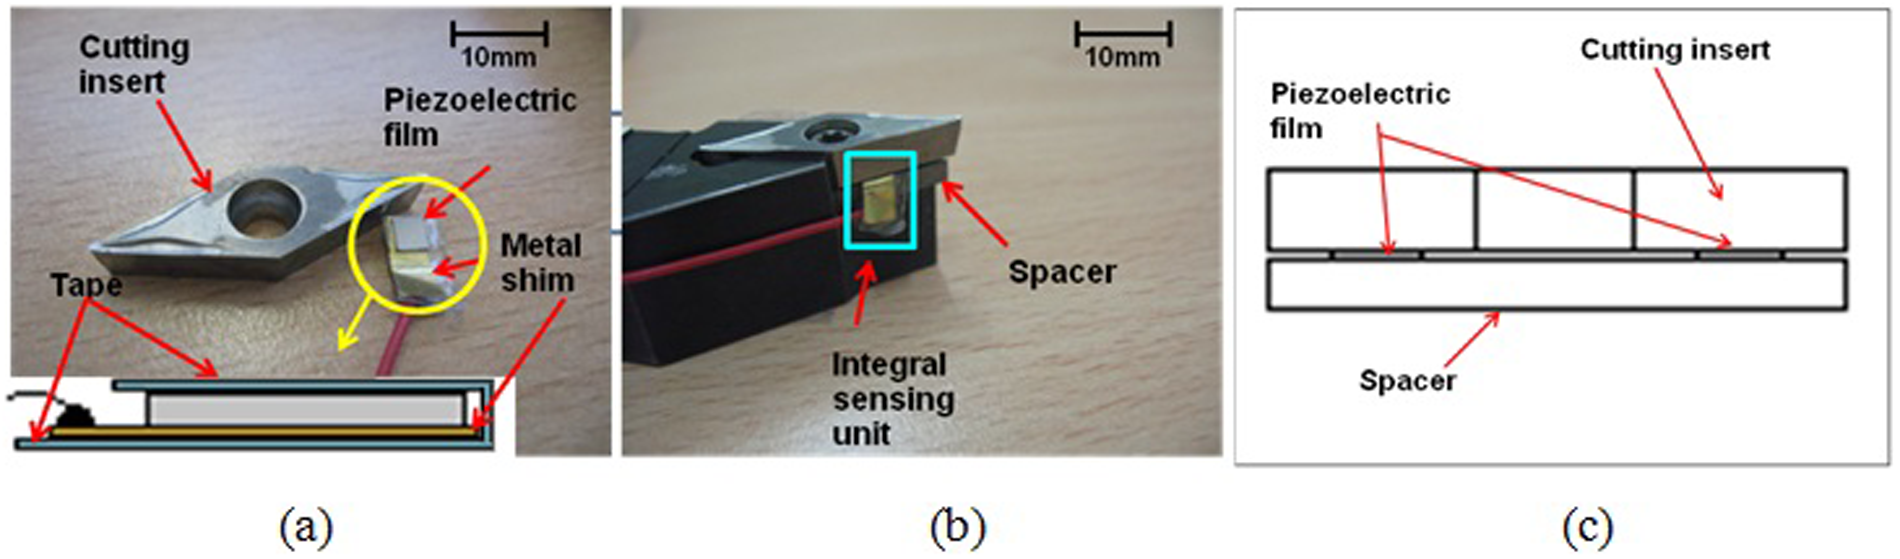
(a) Components of smart cutting tool, (b) integral configuration of smart cutting tool and (c) cross-sectional drawing.
The Kistler 5011 charge amplifier was used to convert a charge into an equivalent voltage determining transducer sensitivity and transducer scale. The LabVIEW programme was written to collect these output signals through the NI DAQ 9234 card.
Piezoelectric ceramics are multifunctional devices used in many applications. When the piezoelectric film is used as a sensor in this application, it is capable of generating a signal only when it experiences a change in the applied force. If a constant force is acting on it, no signal will be produced. 8 The proposed smart cutting tool configuration introduces a pre-stress onto the piezoelectric film by tightening the insert and spacer through a screw with a maximum torque of 1000 N mm. The pre-stress has been consistently applied to reduce any unwanted hysteresis effect, giving a better linear relationship between an applied force and a voltage output; moreover, it would enhance the piezoelectric sensor performance by establishing a firm contact between the two elements.
Cross-sensitivity should be considered in the design of force sensors because it significantly affects the accuracy of the force measurement result. 9 Ideally, only when a force is acting in the sensitivity axis of a sensor, there should be a signal output but no signal output when a force is applied normal to that axis. However, there is always some cross-sensitivity in reality. In order to minimise the cross-sensitivity, the piezoelectric film with the d33 sensing mode was chosen. As a result, the piezoelectric film should only be able to detect the orthogonal cutting force, which is acting perpendicular to the top surface of the cutting insert.
Modelling and simulation of the smart cutting tool
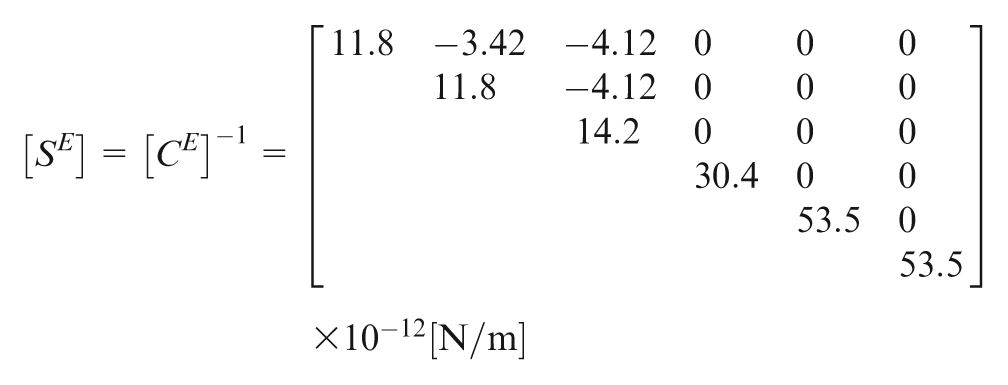
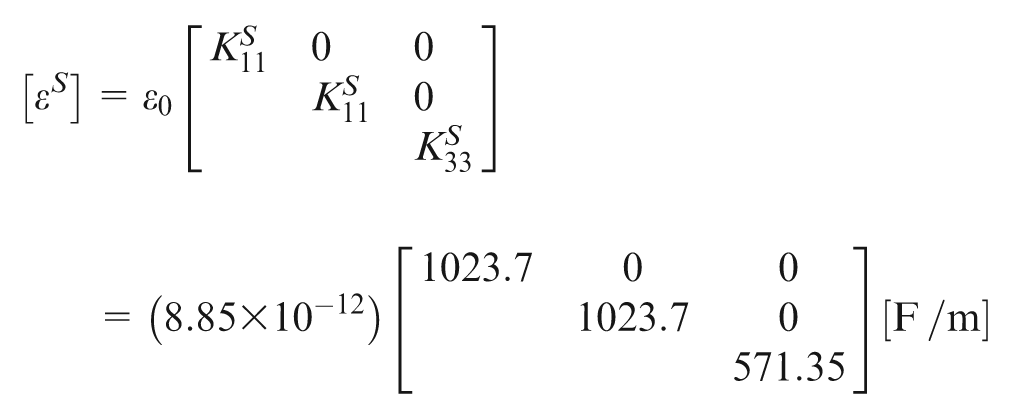
The piezoelectric effect, converting a force into an electric voltage, can be simulated in ANSYS in terms of a stiffness matrix (or compliance matrix), dielectric matrix and piezoelectric constant matrix. All the elements of the above three matrices can be derived from the known parameters supplied in the manufacturer’s data, as shown in the in equations (1) and (2), to calculate the voltage output.
Stiffness matrix
Dielectric matrix
Piezoelectric constant matrix
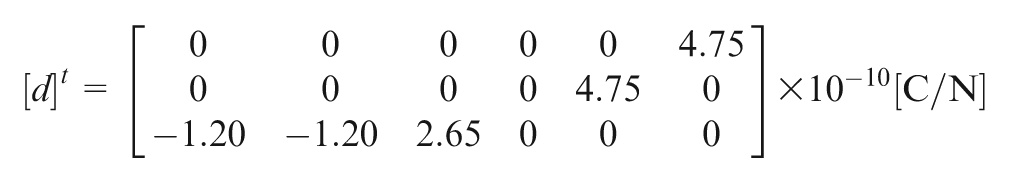
where {T} is the stress vector; {S} is the strain vector; {D} is the electric displacement vector; {E} is the electric field vector; [CE] is the stiffness matrix evaluated at constant electric field, that is, short circuit; [e] is the piezoelectric matrix relating stress/electric field; [e]
t
is the piezoelectric matrix relating stress/electric field (transposed) and
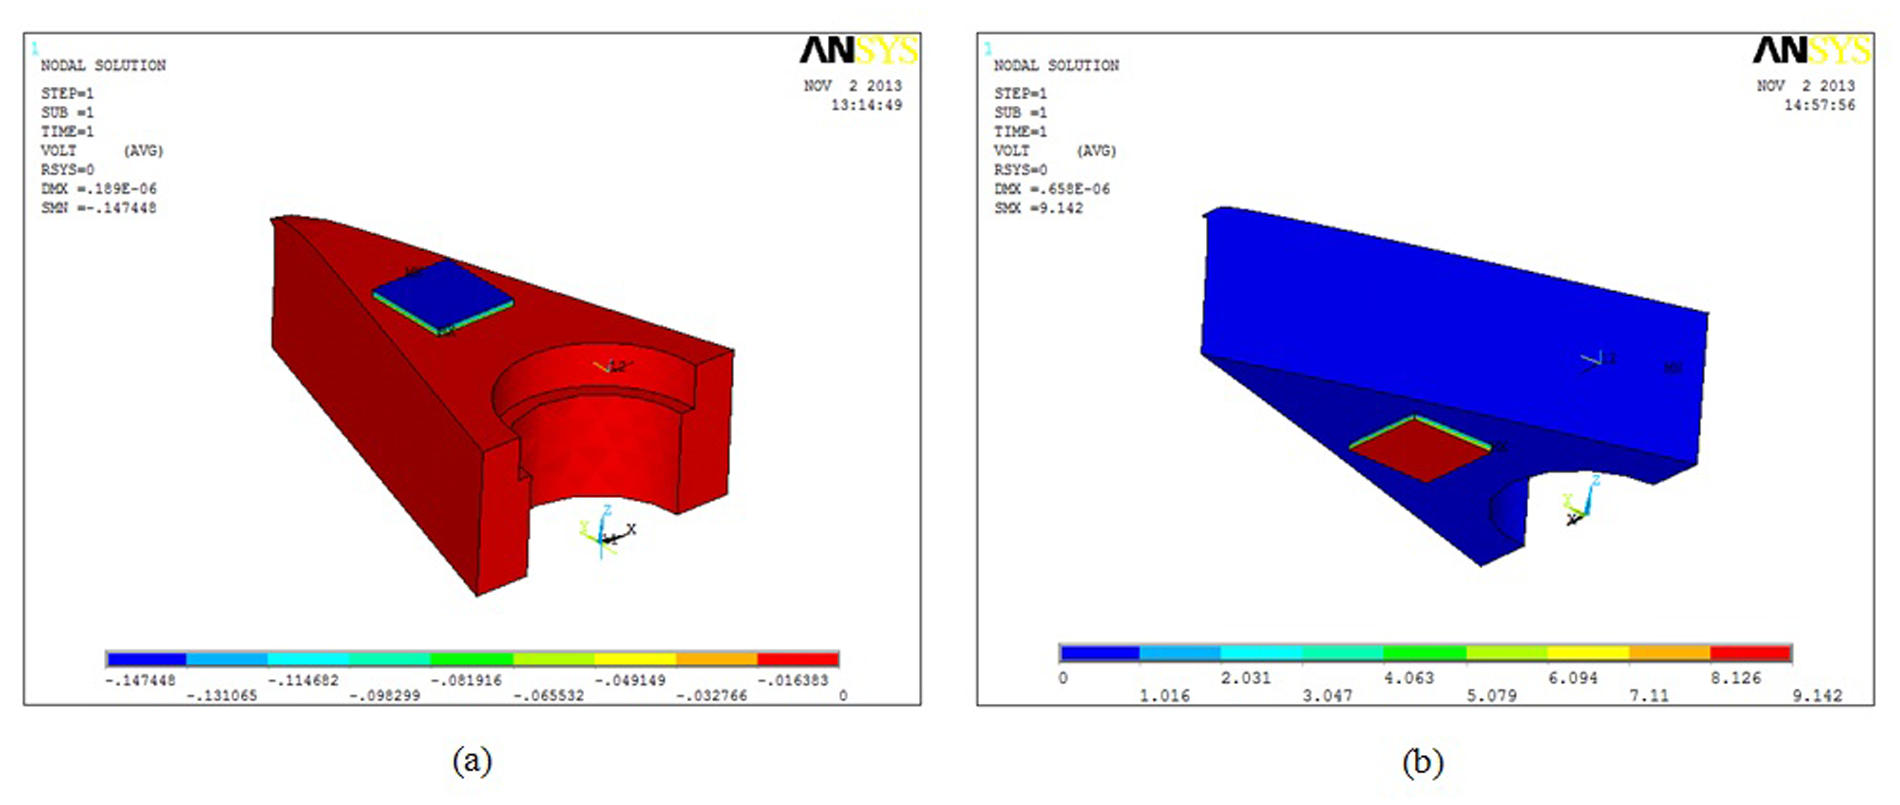
An ANSYS coupled-field model was built to simulate the smart cutting tool performance when a static force is applied to it. To simulate its performance with the force shunt method, the model includes a half size of the cutting insert and a piece of the piezoelectric film, as shown in Figure 2(a). With the indirect force method, the only change is the position of the piezoelectric film placed on the top surface of the insert. In the ANSYS simulation, the boundary conditions of the cutting insert and the piezoelectric film need to be defined. In the force shunt method, based on the area number system, as shown in Figure 2(b), the corresponding boundary conditions are given in the following. The areas of A23 and A24 are defined as symmetrical (UY = 0) because only the half size of the cutting insert is modelled. The A21 and A22 are constrained in all degrees of freedom (all DOF = 0). The cutting insert is fixed onto the spacer by the screw, as shown in Figure 1(b); so the area A25 (area with red colour) is constrained along the Z direction (UZ = 0). Both the A17 and A18 do not have any constraint due to bolt clearance. For the piezoelectric sensor, the area, in contact with the insert, is defined as the ground, and the other side of the area is defined to be constrained along the Z direction. With the indirect method, the only change is to define the bottom area of the cutting insert to be constrained along the Z direction (UZ = 0).

ANSYS coupled-field model of piezoelectric sensor and cutting insert in the force shunt arrangement.
Smart cutting tool used for machining trails
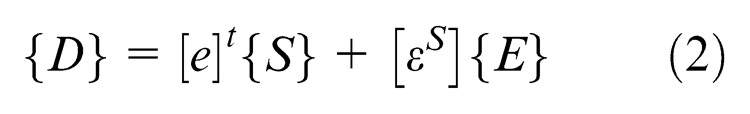
Several cutting trails were carried out on the computer numerical controlled (CNC) lathe (RK International Machine Tools’ ALPHA 1350XS). Both the proposed smart cutting tool and the Kistler dynamometer 9257B were used to measure the orthogonal cutting force. Figure 3 shows the smart cutting tool installed onto the Kistler dynamometer through a tool holder. The dynamometer was used to calibrate the smart cutting tool before using it as a force measurement sensor. The charge, generated from the piezoelectric sensor, inputs into the Kistler 5011 charge amplifier with the transducer sensitivity and transducer scale set as 265 pc/N and 1.38 N/V, respectively, based on the manufacturer’s data. The workpiece is made from AL6082 and machined in dry cutting condition. The cutting conditions are a constant feedrate of 0.15 mm/rev and a constant cutting speed of 330 m/min, and the depth of cut increased from 0.1 to 0.8 mm in increments of 0.1 mm for each pass.
Smart cutting tool and Kistler dynamometer on the lathe.
Results and discussions
Measurement sensitivity comparison
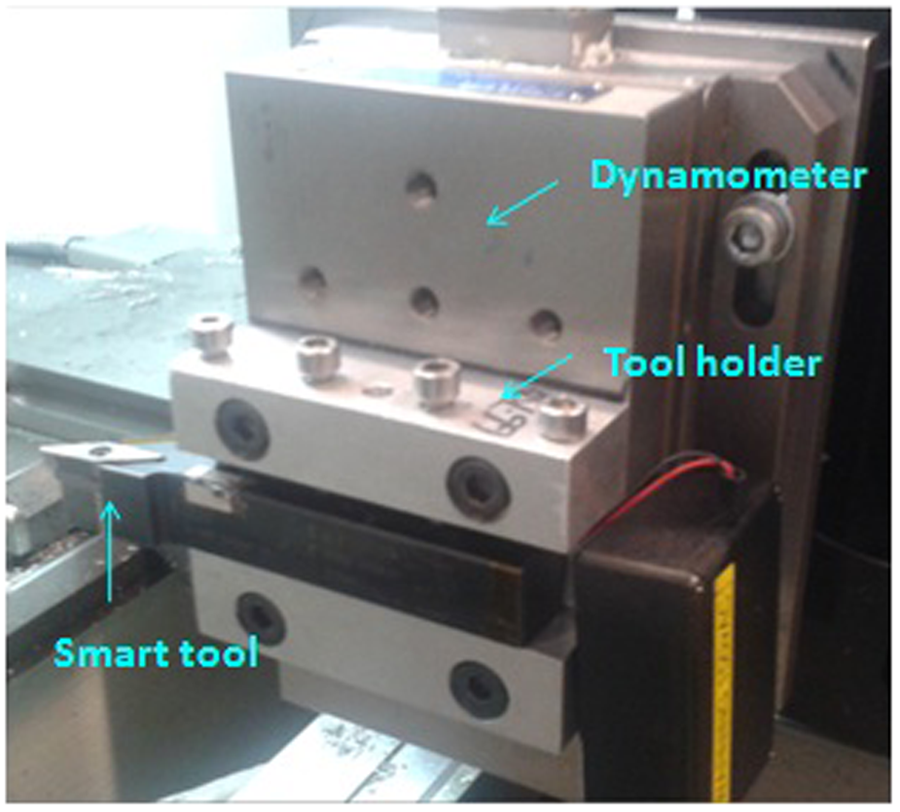
As mentioned in section ‘Force measurement strategy’, both the force shunt and indirect force measurement methods are capable of predicting the cutting force, but their measurement principles and methodologies are different in the fact that the former measures a fraction of the process force and the latter measures strain proportional to the process force. As a result, even with the same loading, the voltage output response may be different when compared to each other due to the different measurement sensitivities produced by the above two methods. Figure 4 shows the voltage outputs with a force of 10 N applied on the tool tip. With the indirect method, the voltage output is −0.147 V represented by blue colour, as shown in Figure 4(a); with the force shunt method, the voltage output is 9.142 V represented by red colour, as shown in Figure 4(b). The above-mentioned two voltage outputs are strikingly different, meaning that much higher measurement sensitivity can be achieved using the force shunt method. Moreover, in practical terms, in the indirect method, it is not a good idea to expose the piezoelectric sensor, protruding from the surface of the cutting insert, without any protection from the long swarf generated during machining.
Voltage output with a force of 10 N applied on the tool tip: (a) with indirect force measurement method and (b) with force shunt measurement method.
Static calibration
A known static force, measured using a FT 200 force gauge (Force gauges), is applied on the tool tip in order to find a corresponding voltage output. The known force is applied on the tool tip for a few seconds and then removed. This procedure produces a voltage output step due to that loading. Figure 5 shows a linear relationship between the force and the voltage output, with a maximum deviation of 4.6% of the measured output signal curve from the ideal, within the full range from 0 to 90 N. The possible reasons for explaining the linear relationship holding between the voltage output and the applied force are because the insert’s deformation is in its elastic region, and the other reason is that the voltage generated from the piezoelectric film has a linear relationship with force. As a force of 10 N is applied onto the tool tip, a maximum voltage output of 9.142 V is predicted in the ANSYS simulation, but only 0.09956 V was measured in the experiments.
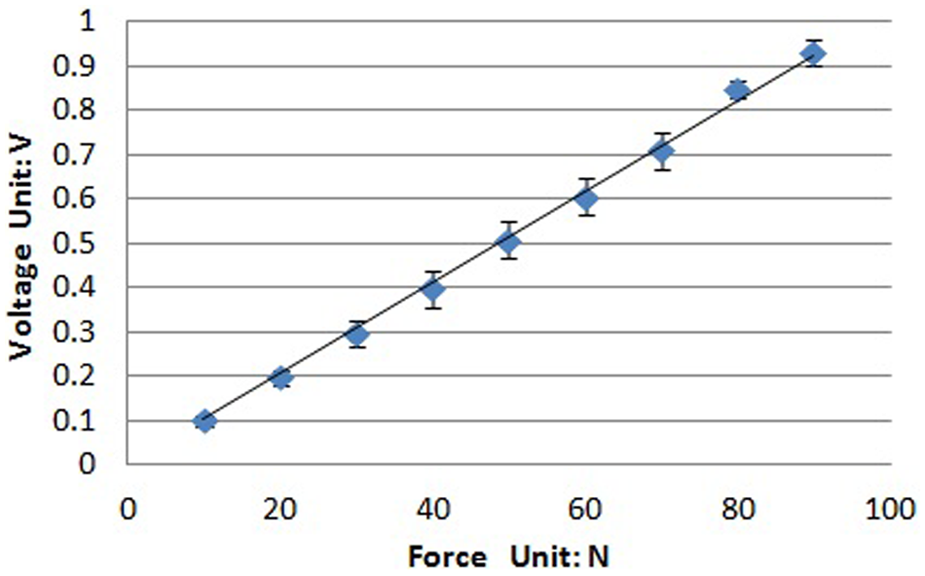
Linear relationship between static force and voltage output.
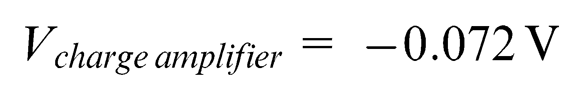
In order to explain the difference between the theoretical and the experimental results, only the piezoelectric film with a 10 N force applied on its top surface will be considered. Both equation (3) and ANSYS simulation give the voltage output to be −7.22 V. In the experimental setup, the piezoelectric sensor was placed in a flat surface, and a known force was applied using a force gauge FT 200. Also, a constant 10 N force was acting vertically on the piezoelectric film through a solid block that was placed on the top of the piezoelectric film to ensure that the force is uniformly acting on it. As a result, only a voltage output of −0.072 V was obtained. Based on the two voltage outputs, the constant gain can be derived to be approximately 100 using Vcharge amplifier/VPZT. In equation (4), due to the introduced capacitance of the charge amplifier Cr, the voltage output decreased 100 times. So, multiplying the experimental voltage output results with the gain factor shows a close agreement to the theoretical results, as observed in Figure 6.
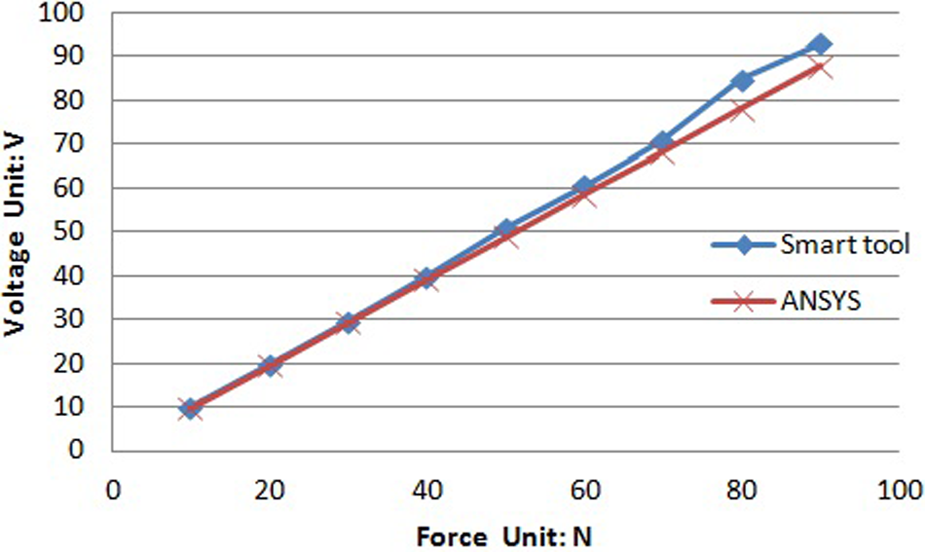
Comparison of voltage outputs in terms of applied forces between smart cutting tool and ANSYS simulation.
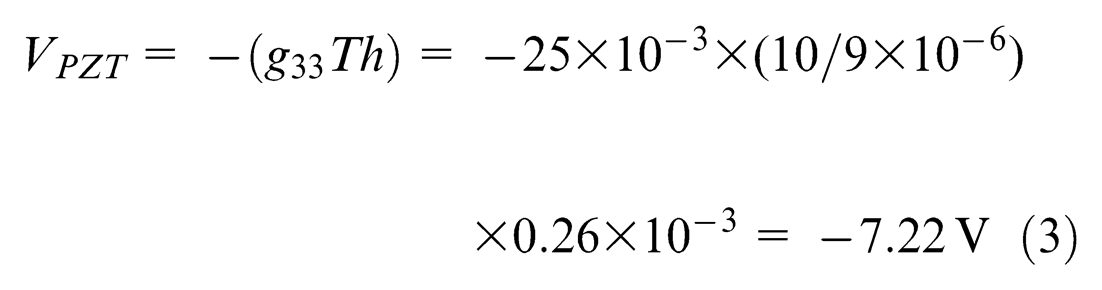


where g33 is the piezoelectric voltage constant (V m/N); h is the height (thickness) of the ceramic element (m); T is the stress on element (Pa); Cr is the capacitance of the charge amplifier (F) and Q is generated charge (C).
Cross-sensitivity
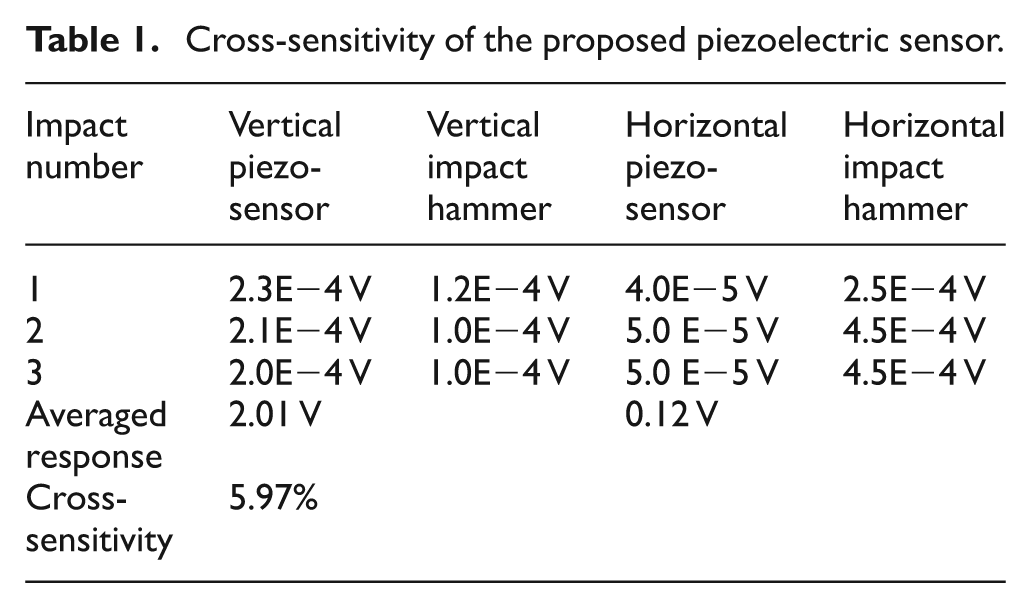
The impact hammer testing technique was used to detect the cross-sensitivity in the proposed piezoelectric sensor configuration. The Kistler impact force hammer (Type 9722A), with the force range of 0–500 N and the sensitivity of 10 mV/N, has been used to impact the cutting tip of the insert vertically and horizontally. Moreover, a plastic tip head of the impact hammer has been used in order to produce a strong signal around the low-frequency range. Both signal outputs of the impact force hammer and the piezoelectric sensor were converted from the time domain into the frequency domain. In the frequency domain, only the low-frequency components from 0 to 50 Hz are considered; Table 1 tabulates the responses from the piezoelectric sensor and the impact hammer when the impact forces were applied vertically as shown in columns 2 and 3 and horizontally as shown in columns 4 and 5. The next procedure includes the technique to normalise the responses of the two impacts by dividing the dynamic response of the piezoelectric sensor with the one from impact hammer. The technique was repeated three times for the three replications of the impact tests, and the averages of the normalised values are denoted accordingly for the vertical and horizontal impacts. These values are then divided with each other to compute the cross-sensitivity, which gives 5.97% in this piezoelectric sensor configuration.
Cross-sensitivity of the proposed piezoelectric sensor.
Force prediction in machining
The smart cutting tool was used to indicate the cutting force in dry turning process when the depth of cut increases from 0.1 to 0.8 mm in increments of 0.1 mm for each pass, with a constant feedrate of 0.15 mm/rev and cutting speed of 330 m/min. Figure 7(a) shows the voltage output during cutting in LabVIEW; the circled steps on the waveform indicate the cutting force. The slow changing part of the waveform, indicated in Figure 7(a), is unrelated to the cutting force but is most probably due to the pyroelectric effect of the piezoelectric ceramic material. The cutting trials were carried out four times for each depth of cutting. In Figure 7(b), the orthogonal cutting forces are the averaged value of four cutting trials, and the error bars were plotted based on the standard error. Using the above cutting conditions, the corresponding cutting forces were measured by both the Kistler dynamometer and the piezoelectric sensor, as shown in Figure 7(b); the difference is small, and the narrow extent of the error bars suggests good measurement repeatability and high precision of the obtained cutting forces, except that the last data point showing much deviation from the dynamometer measurement may suggest the limitation on force measurement range for the proposed smart cutting tool.
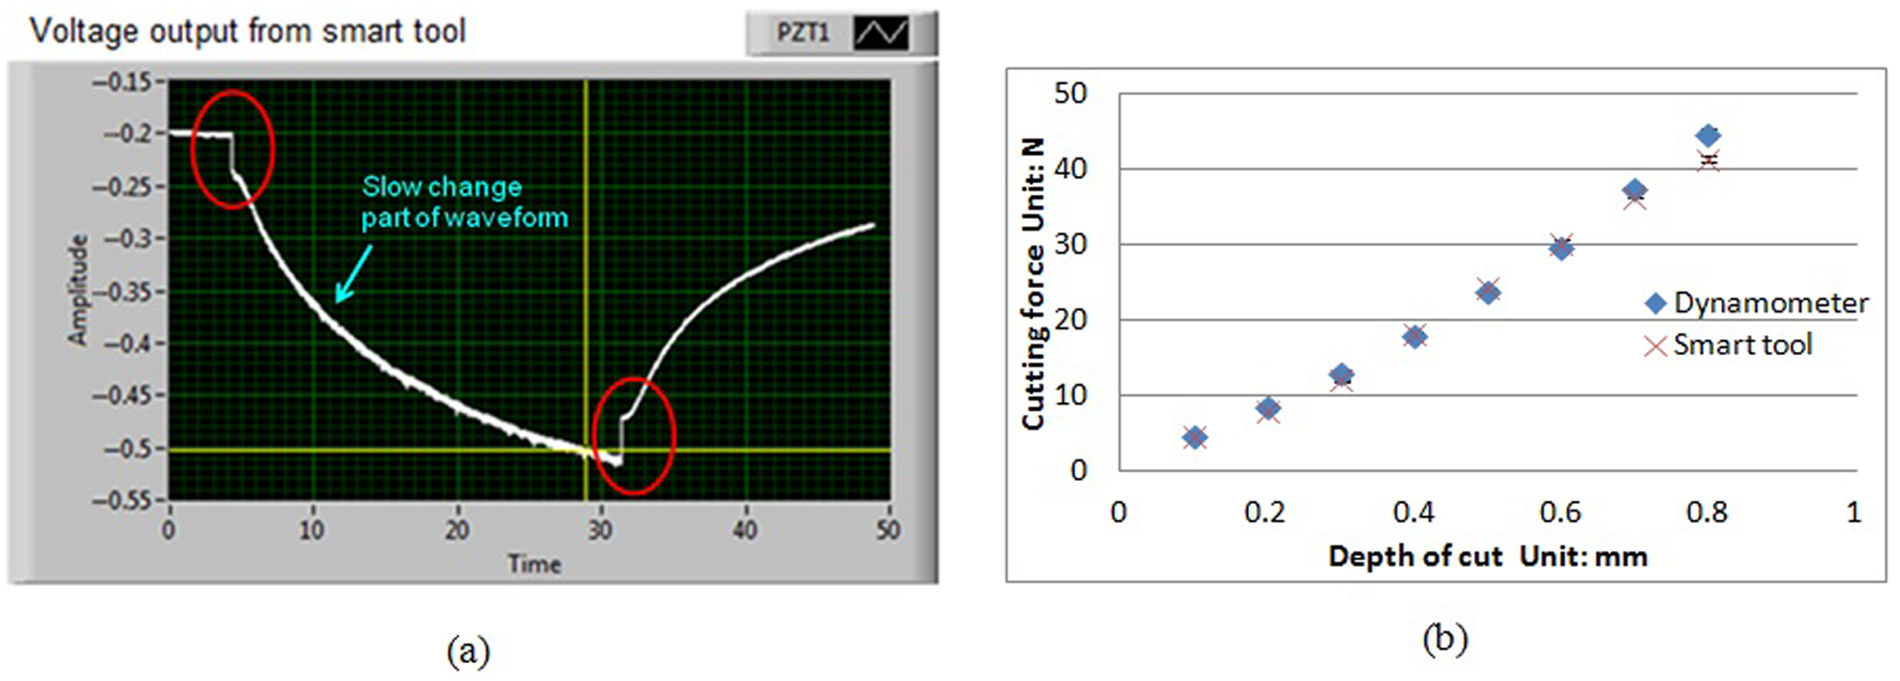
(a) Voltage output waveform from the smart cutting tool sensor and (b) cutting force prediction by smart cutting tool compared to that of a dynamometer for various depths of cut.
Conclusion
A novel smart cutting tool using a piezoelectric film to measure the orthogonal cutting force in a dry cutting machining process was outlined in this article. Based on the simulation results and the preliminary cutting trials, some conclusions can be drawn as follows:
The proposed smart cutting tool shows a linear relationship between the applied force and the voltage output, as shown in Figure 5; it also gives a low cross-sensitivity effect based on the type of piezoelectric element chosen. Moreover, the pre-stress introduced in the setup procedure can reduce unwanted hysteresis effect.
The piezoelectric effect, converting a mechanical force into a voltage, was simulated in an ANSYS coupled-field analysis to validate the feasibility of the proposed design. Additionally, the model was also able to detect better force measurement sensitivity between the force shunt and the indirect force measurement methods. At the gain factor calculated, a close agreement on the voltage output was obtained between the smart cutting tool and the ANSYS simulation, as shown in Figure 6.
The orthogonal cutting force during dry machining can be predicted using the smart cutting tool. It was proven by a close agreement on the orthogonal cutting force measurement between the Kistler dynamometer and the proposed smart cutting tool, as shown in Figure 7(b).
Footnotes
Acknowledgements
The authors would like to thank the UK Technology Strategy Board (TSB) for discussions within the SEEM project consortium. The authors also extend their thanks to Mr Paul Yates for the assistance in undertaking machining trials and Dr Joe Au and Dr Feng Jiao for some helpful discussions.
Funding
This research project was supported by the UK Technology Strategy Board (TSB; SEEM Project, contract no. BD266E).