
Abstract
The present article is the first study on and identifies the different process parameters that affect the cutting speed and surface roughness in wire electric discharge machining of titanium 6-2-4-2. Box–Behnken designs are used to plan and analyse the experiments. Mathematical models are developed for cutting speed and surface roughness using regression technique and are utilized for simultaneous optimization of cutting speed and surface roughness. As the influence of process parameters on cutting speed and surface roughness is opposite, the problem is formulated as a multi-objective optimization problem. Non-dominated sorting genetic algorithm-II is then applied to obtain Pareto optimal set of solutions. Confirmatory experiments indicate that the model is suitable for predicting the response parameters. These Pareto optimal sets of solutions can be used as guidelines by manufacturing engineers to select optimal combination of parameters depending upon the job requirements.
Keywords
Introduction
Accompanying the development of mechanical industry, use of advanced materials such as ceramics, titanium, stainless steel, nimonics and fibre-reinforced composites is gaining importance in aerospace, nuclear and automotive industries. Titanium and its alloys are extensively used in aerospace and automotive applications such as manufacturing of airframe and aircraft engine parts, reactor vessels, heat exchangers, automotive engine parts and turbine blades. These alloys possess high strength, toughness as well as high strength to weight ratio. Conventional machining of titanium and its alloys is difficult owing to very less thermal conductivity of titanium. The heat generated during cutting process is not properly dissipated and remains concentrated in the cutting zone leading to failure of the tool. 1 In addition, the ability of titanium and its alloys to maintain strength at high temperatures further impairs machinability of these. Titanium has an upper speed limit, that is, 300–350 surface feet per minute, after that the tool turns red. Thus, as cutting speed (CS) increases, tool life drastically decreases. 2 Thus, high-speed machining of titanium alloys is not possible except when performing light finishing cuts. Moreover, surface generated after machining shows a greater deformed subsurface layer. 3
As Ti and its alloys are difficult to machine conventionally, an attempt can be made to machine it using non-conventional machining such as ultrasonic machining, electrical discharge machining (EDM) and wire electrical discharge machining (WEDM). The present study is an attempt in this direction and presents the optimization of process parameters for Ti 6-2-4-2 using WEDM. WEDM is found to be an extremely potential electro-thermal process in the field of conductive material machining and is widely used in the manufacturing of cam wheels, stators for stepper motors, press tools, dies, and so on. It is a thermo-electric process that erodes materials from work piece by a series of discrete sparks occurring between the work and the tool electrode immersed in a dielectric medium. These electrical discharges melt and vaporize small amounts of work material, which are then ejected and flushed away by the dielectric. The selection of optimum machining parameter combinations for obtaining higher cutting efficiency and other dimensional accuracy characteristics is a challenging task in WEDM due to the presence of large number of process variables and complicated stochastic process mechanism. Generally, machining parameter tables provided by the machine tool manufacturers do not meet the operator requirements and sometimes even do not provide efficient guidelines to manufacturing engineers. 4 Hence, there is a need to find out optimum parameter settings to achieve maximum process yield criteria such as maximization of CS for different classes of materials.
Review of past research work
This section presents the review of the literature on machining of Ti alloys as well as other materials using WEDM. Liao and Yu 5 studied the effect of specific discharge energy on WEDM characteristics of Ti-6Al-4V and Inconel-718. A quantitative relation between machining characteristics and machining parameters was derived using regression analysis. It was observed that two most significant factors affecting the discharge energy (η) are discharge on time (pulse on time) and servo voltage. Moreover, discharge on time and work piece height have a significant effect on machined groove width. Sarkar et al. 6 studied WEDM of γ titanium aluminide alloy. A feed forward back propagation neural network (BPNN) model was developed to predict the response parameters, namely, CS, surface roughness (SR) and wire offset as a function of six different control parameters, namely, pulse on time, pulse off time, peak current, wire tension, dielectric flow rate and servo reference voltage. Twenty-seven optimum parametric combinations were presented that can be utilized as technology guidelines for effective machining of this alloy. Experimental results demonstrated that the machining model is suitable to satisfy the practical machining requirements. The literature indicates that classical methods of optimization, such as min–max and weighted sum methods, change the multi-objective problem into a single objective, with the corresponding weights based upon their relative importance. These methods suffer from a serious drawback that decision maker must have sufficient knowledge of ranking of objective functions. 7 The literature also reveals that traditional methods of optimization such as weighted sum methods are not adequate for handling multi-objective optimization problems because they cannot find all solutions in a single run, thereby requiring them to be applied as many times as the number of desired Pareto optimal solutions. Also, they may not be robust and stay to obtain a local optimal solution. 8 Poroś and Zaborski 9 investigated the volumetric efficiency in WEDM of Ti-6Al-4V taking into consideration both process parameters and material properties. A semi-empirical model was developed to examine the variation of WEDM efficiency by using different wire materials and different process parameters/material properties by applying dimensional analysis. Table 1 lists the details of works carried out by various researchers in machining of titanium alloys using WEDM. Tzeng et al. 10 analysed the impact of process parameters in WEDM of pure Tungsten on metal removal rate and work piece surface finish. A hybrid method consisting of BPNN and genetic algorithm (GA) was utilized to determine optimal parameter settings of WEDM process. Although neural network is applied to model the process, it has certain drawbacks. It has a black box–like working feature. It cannot establish the quantitative relationship between input variables and output parameters. Therefore, precise selection and control of input variables for optimal performance are not established. 11
Studies carried out on machining of titanium alloys using WEDM.
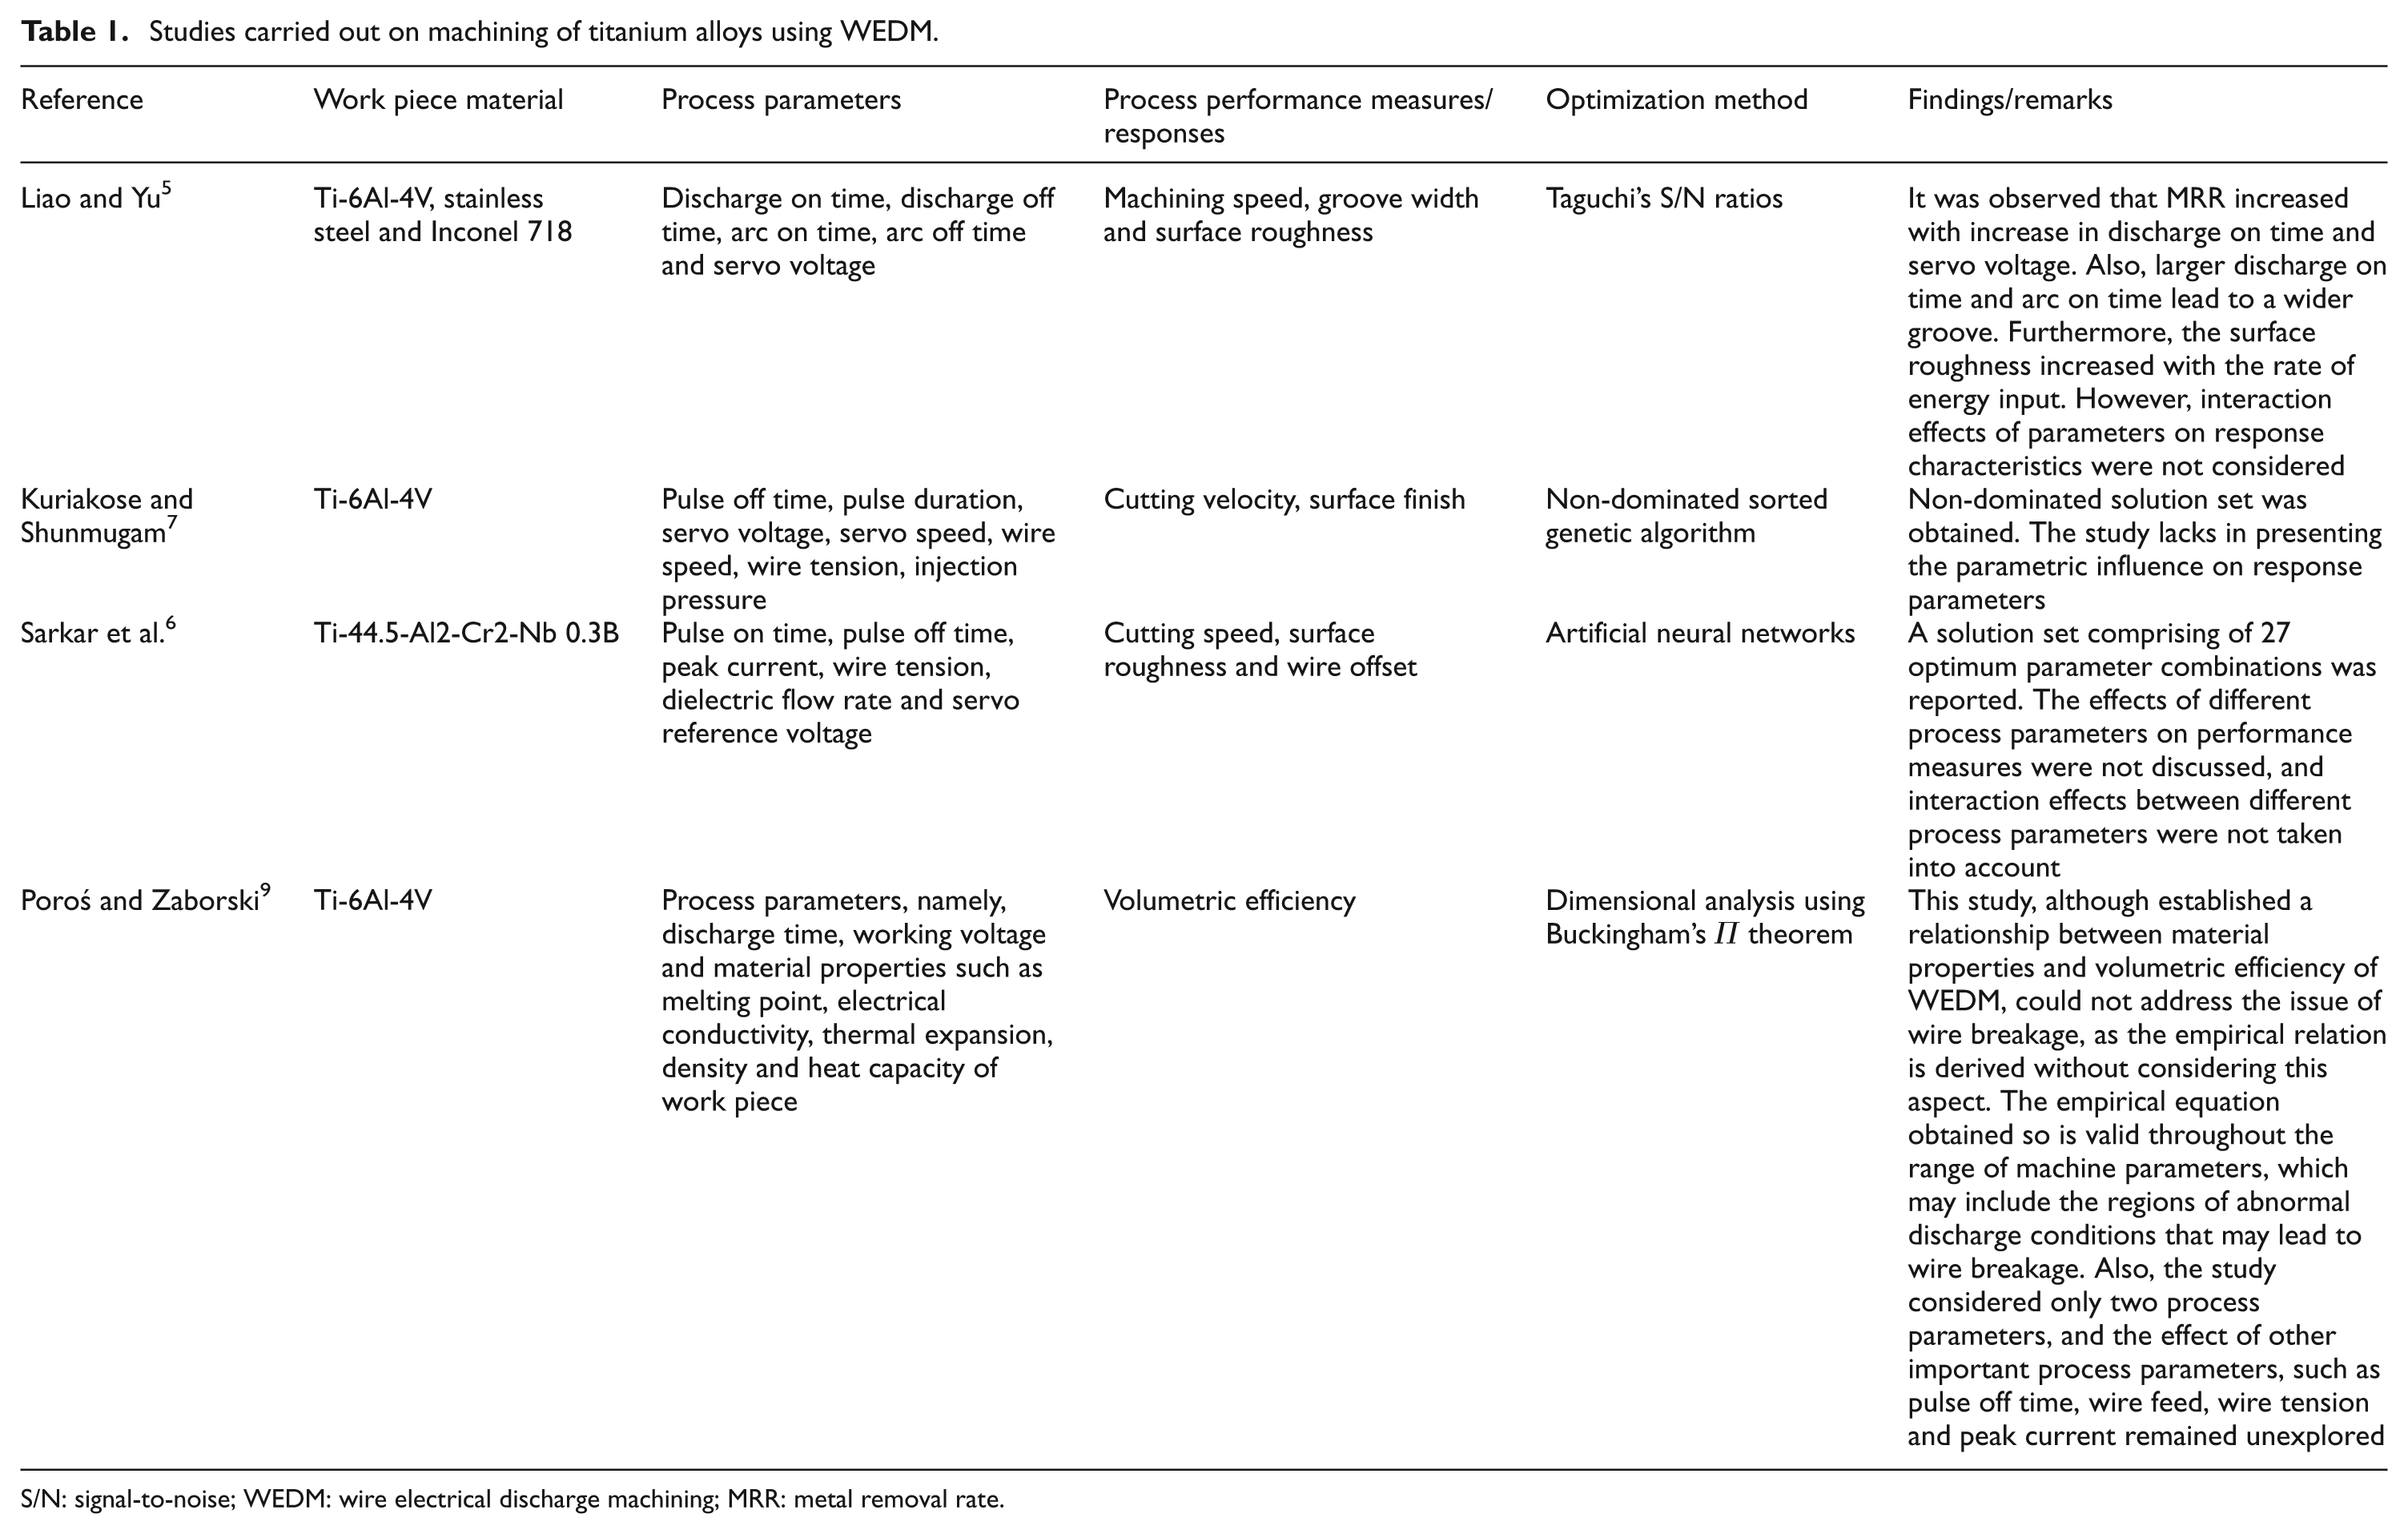
S/N: signal-to-noise; WEDM: wire electrical discharge machining; MRR: metal removal rate.
The above-mentioned problems with the classical methods of optimization are eliminated in evolutionary algorithms such as GA. GA-based optimization methodologies have been widely utilized in the literature and proven their effectiveness in finding well-distributed and well-converged sets of near Pareto optimal solutions. Kuriakose and Shunmugam 7 developed a multiple regression model to establish relationship between input and output variables, and a multi-objective optimization method based upon non-dominated sorting genetic algorithm (NSGA) was utilized to optimize WEDM process. The authors considered cutting velocity and surface finish as the output parameters, which decide the cutting performance. The WEDM process parameters have been optimized, and a non-dominated solution set has been obtained and reported for machining of Ti-6Al-4V. Mandal et al. 12 have attempted to model and optimize the complex EDM process using soft computing techniques. Artificial neural network (ANN) was used to model the process, and non-dominated sorting genetic algorithm-II (NSGA-II) was employed to optimize the process. Testing results demonstrate that the model is suitable for predicting the response parameters. A Pareto optimal solution set based upon NSGA-II was obtained. Kanagarajan et al. 13 investigated the effectiveness of EDM process in machining of tungsten carbide and cobalt composites. Effect of machining parameters such as pulse current, pulse on time, electrode rotation and flushing pressure on metal removal rate and surface finish was studied. The experimental results were used to develop the statistical models based on second-order polynomial equations. NSGA-II was used to optimize the processing conditions. A non-dominated solution set was obtained and reported. Prasad et al. 11 investigated WEDM of AISI D3 steel. Mathematical models were developed for metal removal rate and SR in terms of input variables using response surface methodology. The developed mathematical models were utilized for multi-objective optimization. As the influence of machining parameters on metal removal rate and surface finish is opposite, the problem is formulated as multi-objective optimization problem. NSGA was applied to obtain the Pareto optimal solution set. Analysis of the results indicated that none of the solutions are better than the other in terms of the two responses simultaneously. Kumar et al. 14 discussed electrochemical machining (ECM) of LM 25 Al/15%SiC composites. A multiple regression model was used to represent relationship between input and output variables. Multi-objective optimization method based upon NSGA-II was then used to optimize the ECM process. A solution set comprising of 31 solutions was presented, and selected experiments were performed to validate the optimization results. Table 2 lists the GA parameters used by various researchers.
GA parameters used in the literature.
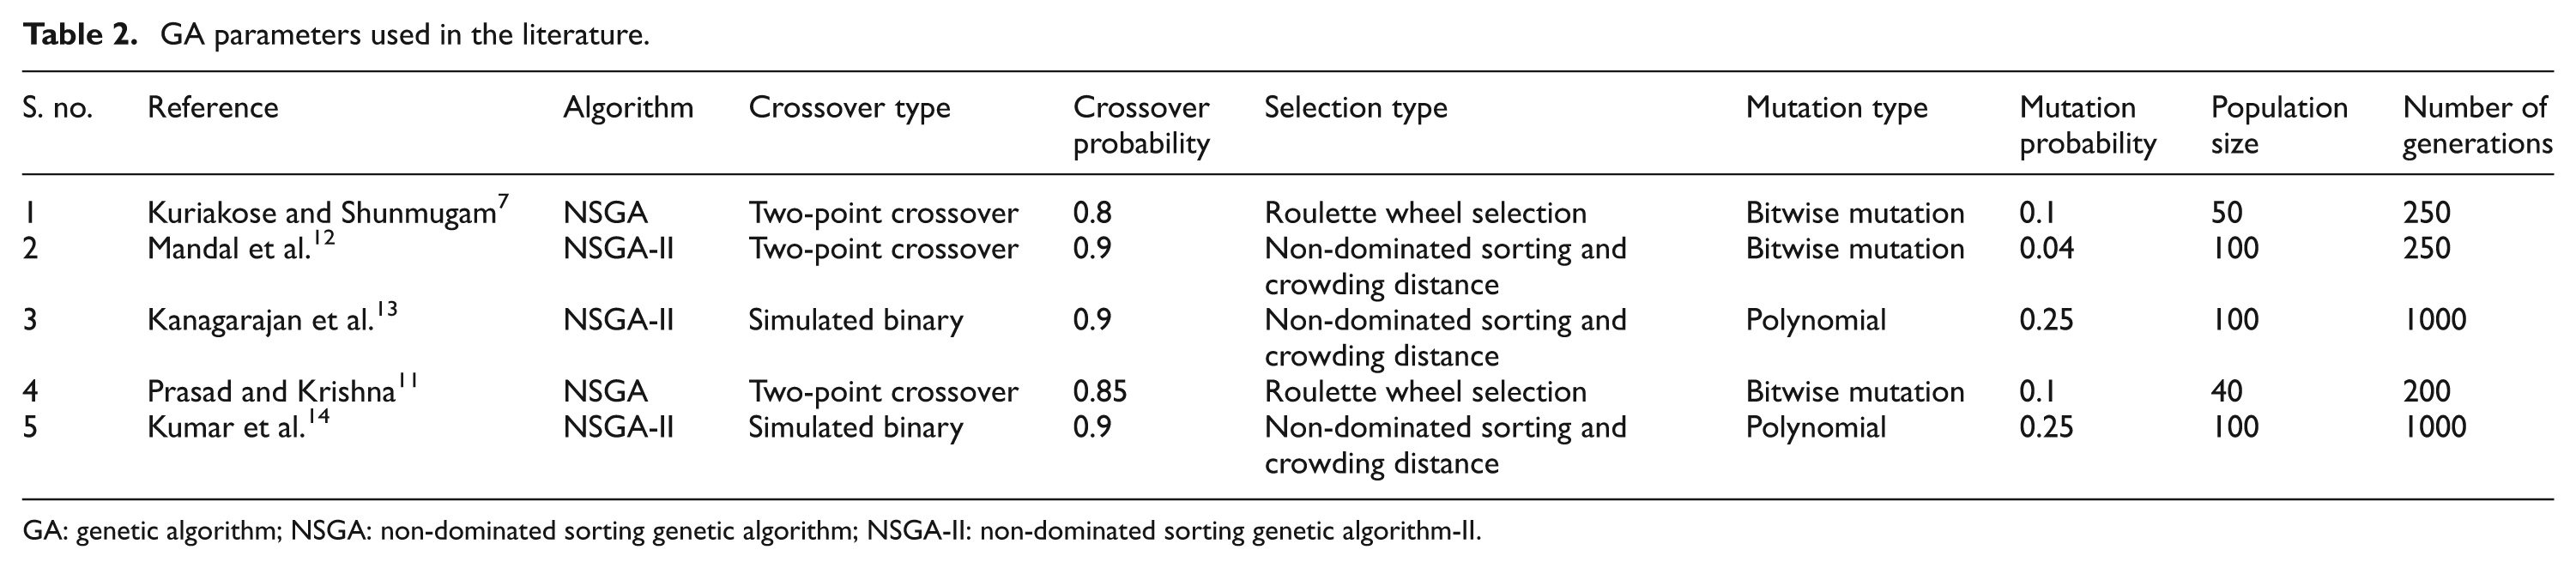
GA: genetic algorithm; NSGA: non-dominated sorting genetic algorithm; NSGA-II: non-dominated sorting genetic algorithm-II.
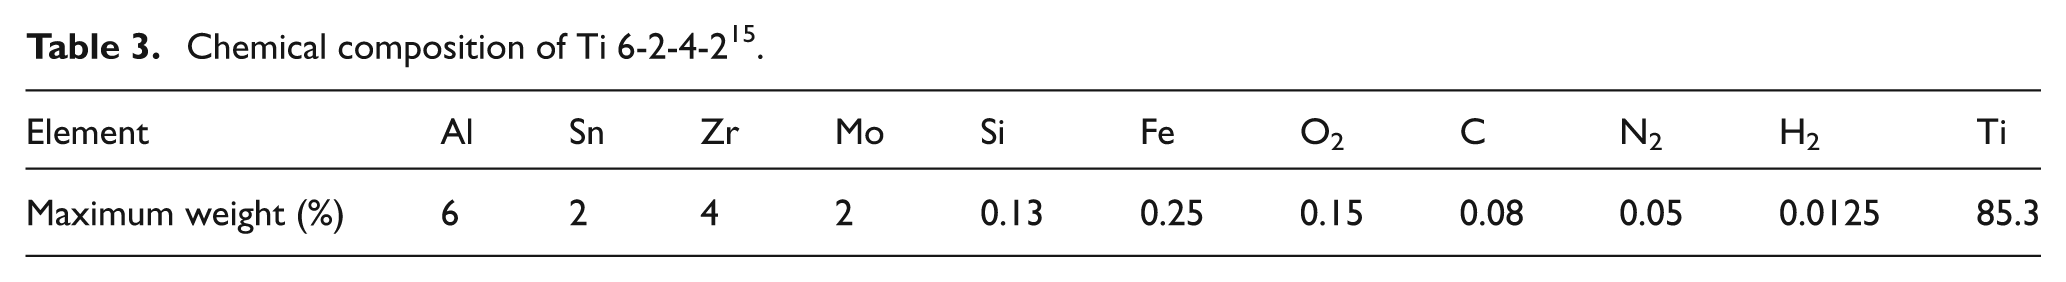
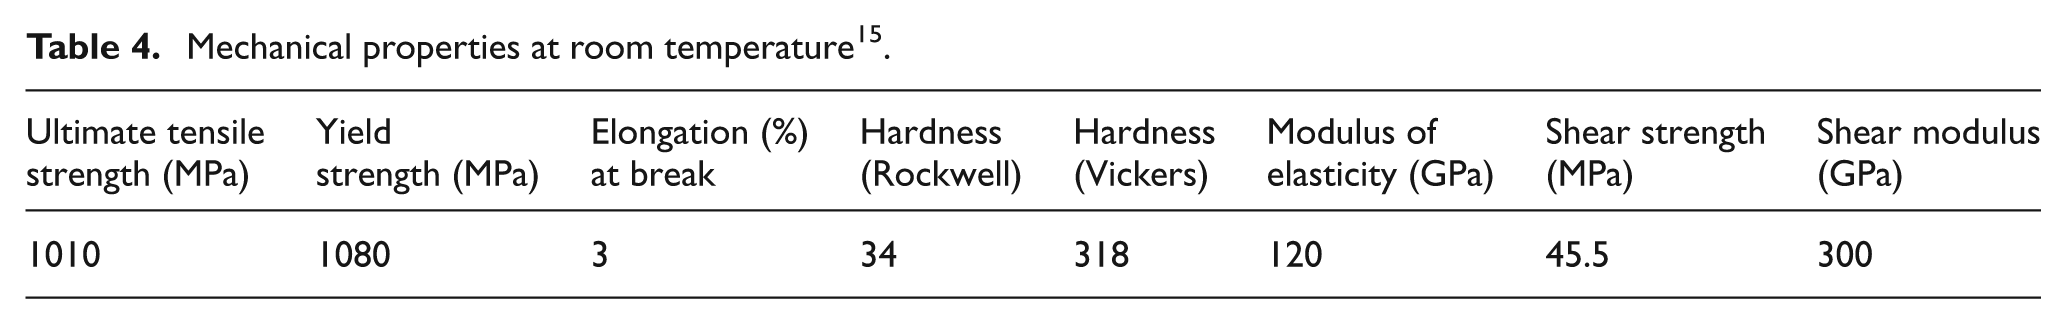
The literature review clearly indicates that a little work is reported on WEDM of titanium and its alloys. A few authors have reported the effect of process parameters on performance measures, such as CS and SR, that too considering very less number of process parameters, as observed from Table 1. Most of the works are focussed on machining of Ti-6Al-4V, and there is no study on WEDM of Ti 6-2-4-2 alloy. As Ti 6-2-4-2 alloy is used for engineering applications, such as machining of engine ducts, exhaust nozzles, gas turbine blades and engine discs, and WEDM is used for their manufacturing, there is a need to optimize process parameters of WEDM for machining of Ti 6-2-4-2. Moreover, manufacturer’s catalogue supplied with WEDM machine does not recommend any parameter setting for machining of Ti 6-2-4-2 material. Table 3 shows the chemical composition of Ti 6-2-4-2, material used for experimentation, and Table 4 shows its mechanical properties. The literature review also reveals that evolutionary algorithms such as GAs can be used to find well-converged sets of near Pareto optimal solutions. Hence, this study formulates machining of Ti 6-2-4-2 using WEDM as multi-objective problem as determination of optimal machining conditions involves a conflict between maximizing the CS and minimizing the SR and utilizes an efficient evolutionary algorithm called as NSGA-II developed by Deb et al., 16 to obtain optimal parameters of WEDM.
Chemical composition of Ti 6-2-4-2 15 .
Mechanical properties at room temperature 15 .
Experiment set-up and design
Experiments are performed on a Electronica 4 axis Sprintcut-734 CNC Wire Cut machine manufactured by Electronica India Limited, Pune, India. A diffused brass wire of 0.25 mm diameter (Nikunj HH, Nickunj EDM Wires & Consumables Pvt Ltd, India) is used as tool material and deionized water as dielectric. A rectangular plate of Ti 6-2-4-2 with size of 200 mm × 200 mm × 20.4 mm is taken as the work piece. A 10 mm × 10 mm rectangular cut is taken on the work piece. Figure 1 shows path followed by a wire. The wire enters the work piece at point O (5, 0). It moves along OABCDO and exits the work piece from O (5, 0). The computer numerical control (CNC) code for cutting is generated using ELAPT software supplied by the manufacturer. It is important to mention that wire offset is set at zero during machining.
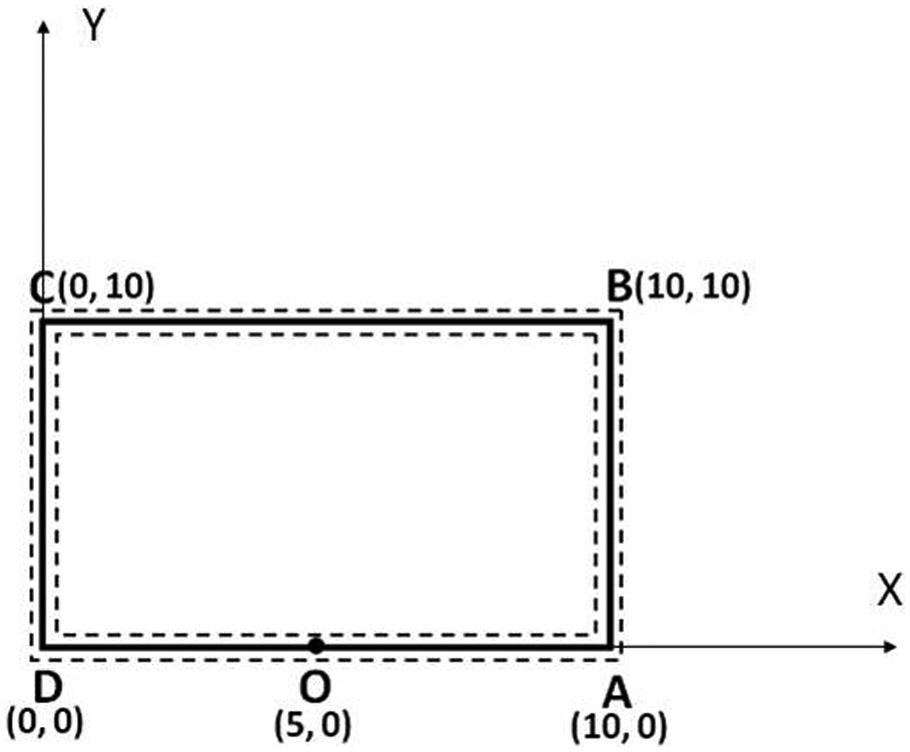
Work piece profile.
In order to compute average CS, instantaneous CS is noted at a distance of 2.5, 5 and 7.5 mm from the initiation of cut along a particular axis along AB, BC and CD. On side DA, it is noted at a distance of 2.5 and 7.5 mm from D. This is done to ensure that readings are noted only when the cutting is stabilized properly. Instantaneous CS data are directly displayed on the monitor of machine tool, and mean of the readings provides average CS. SR of the piece that is cut from the work piece plate is measured using portable Mitutoyo SR Tester SJ-301 (Mitutoyo Corporation, Japan). Eight readings of SR perpendicular to direction of cut are taken along OABCDO, and mean of these readings gives SR.
This study utilizes six process parameters, namely, pulse on time (TON), pulse off time (TOFF), peak current (IP), spark gap set voltage (SV), wire feed (WF) and wire tension (WT), and they have been chosen on the basis of the literature review as well as preliminary study. 17 Table 5 provides the details of these process parameters as well as other fixed parameters that are used in the present study. It is important to mention that TON, TOFF as well as WT values mentioned in the brackets in Table 4 show the actual settings in microseconds and grams, respectively, whereas values outside the brackets indicate the machine control panel settings.
Fixed and control factors with their settings/levels.
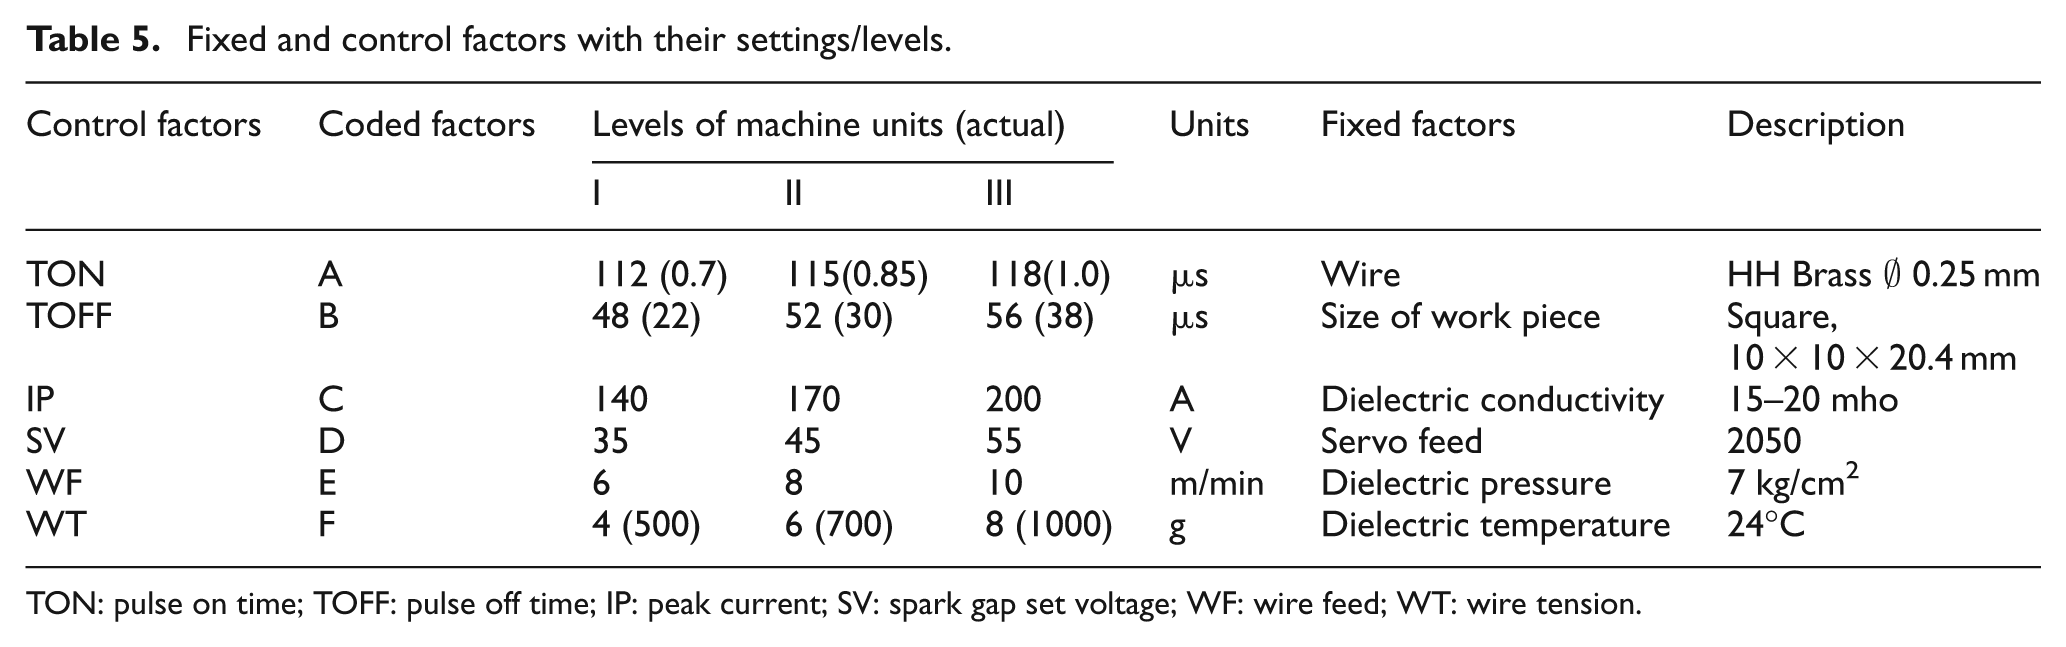
TON: pulse on time; TOFF: pulse off time; IP: peak current; SV: spark gap set voltage; WF: wire feed; WT: wire tension.
The present study utilizes the Box–Behnken experimental design approach as it plans experiments within identified search space (assuming α = 1). This is due to the fact that in WEDM, loss of productivity occurs due to wire breakage. Thus, if pilot study is done before actual experimentation, then range of parameter combinations, where wire breakage takes place, can be identified and isolated. This approach is in contrast to central composite design, which tends to explore the space beyond the identified search space (taking α > 1, depending upon number of independent parameters), where chances of wire breakage are quite high. Earlier studies on WEDM of Ti alloys5–7,9 could not highlight this issue of wire breakage while selecting the design of experiments. The Box–Behnken designs are rotatable or nearly rotatable second-order designs based on three-level incomplete factorial designs. Output response (y) in the Box–Behnken design can be modelled as given in the following 18
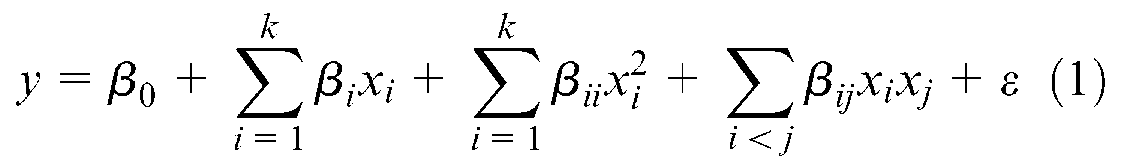
where xi and xj are input or independent process parameters; β0, β
ii
and β
ij
are regression coefficients and
As the present study considers six control factors at three levels, 54 experiments need to be performed according to the Box–Behnken designs. Table 6 summarizes various parameter combinations for 54 experiments as well as run order. It is planned to carry out one replication of each experiment, and thus, a total of 108 experiments are to be conducted.
Design matrix and results for wire EDM output response.
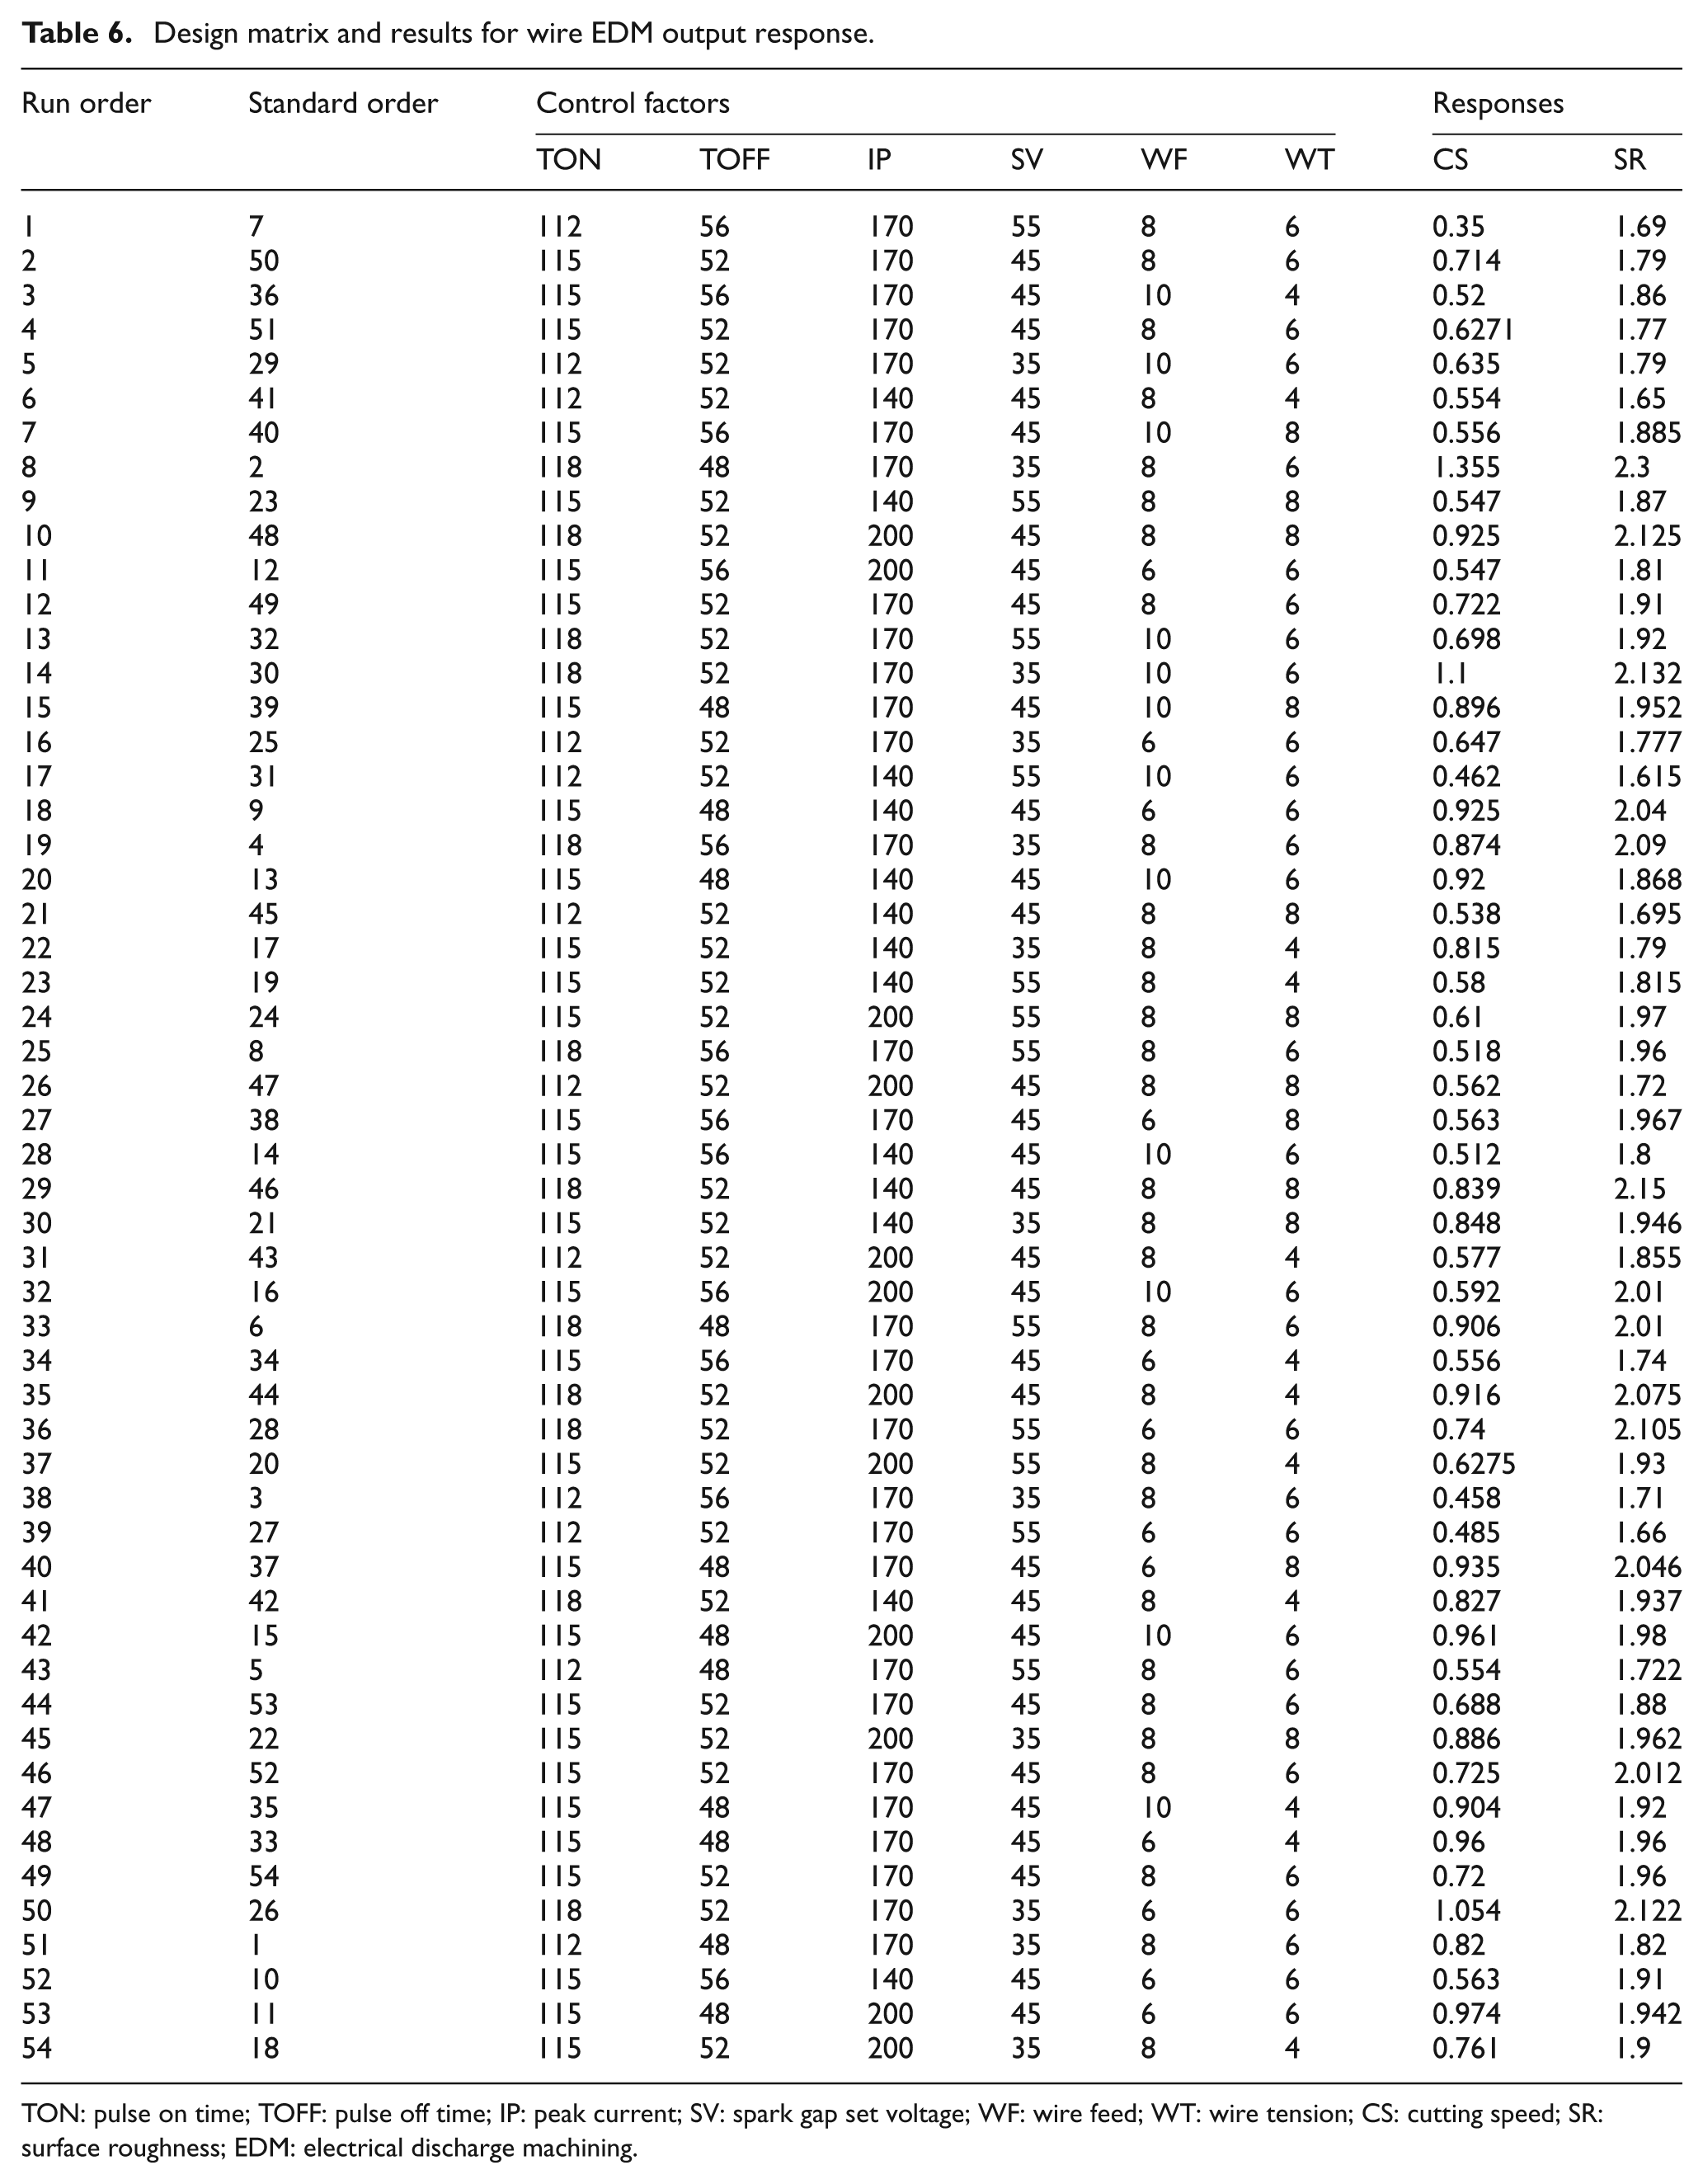
TON: pulse on time; TOFF: pulse off time; IP: peak current; SV: spark gap set voltage; WF: wire feed; WT: wire tension; CS: cutting speed; SR: surface roughness; EDM: electrical discharge machining.
Experimental results and mathematical modelling of CS and SR
Experiments are conducted on Electronica 4 axis Sprintcut-734 CNC Wire Cut machine. Each time, an experiment is performed; a particular set of parameter combination is chosen and work piece is cut as per Figure 1. Table 6 summarizes the results obtained for 54 experiments with one replication. CS and SR indicated in Table 6 are averages of values obtained in both runs.
Influence of process parameters on CS
First step towards identifying the effect of control factors on CS is to find goodness of fit of the given data. Quadratic model for CS is recommended by the Design expert 6.0 software. Table 7 shows analysis of variance (ANOVA) for the quadratic model at 95% confidence level.
ANOVA for response surface of reduced quadratic model of cutting speed.
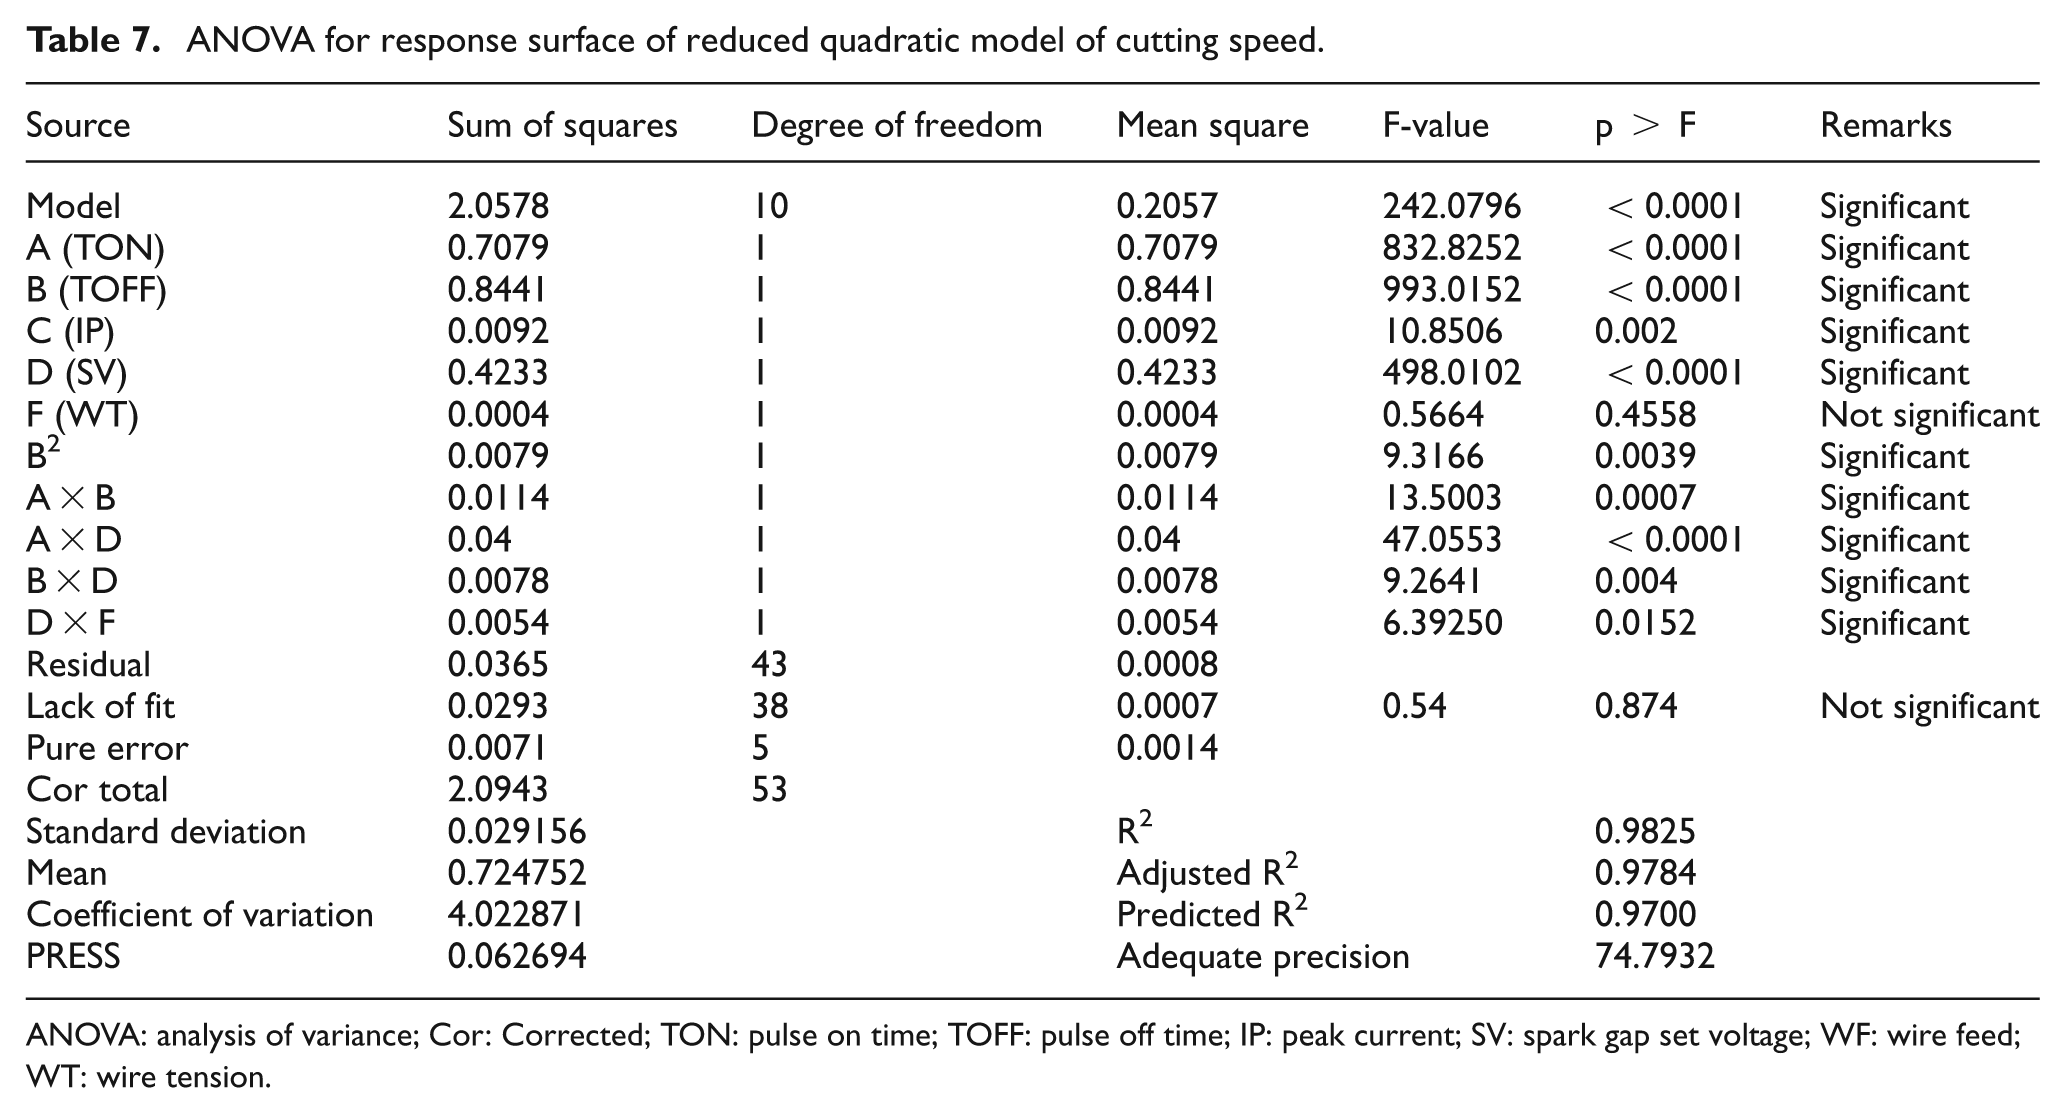
ANOVA: analysis of variance; Cor: Corrected; TON: pulse on time; TOFF: pulse off time; IP: peak current; SV: spark gap set voltage; WF: wire feed; WT: wire tension.
It indicates that the F-value of the model is 242.07 and the corresponding p-value is less than 0.001. Thus, quadratic model is significant at 95% confidence level. Moreover, lack of fit of 0.54 implies that it is not significant relative to pure error. R2 of 0.9825 indicates that 98.25% of the variation of CS is attributed to control factors, and only 1.75% of the total variation cannot be explained by the quadratic model. This indicates that the accuracy and general ability of the polynomial model are good. Moreover, predicted R2 of 0.97 is in reasonable agreement with adjusted R2 of 0.9784, which indicates a high correlation between observed and predicted values. Figure 2 shows normal probability plot of residuals for CS. It clearly indicates that errors are normally distributed as most of the residuals are clustered around a straight line. It is observed that regression model is fairly well fitted with observed values. As adequate precision is 74.793, it suggests that the quadratic model can be used to navigate in the design space.
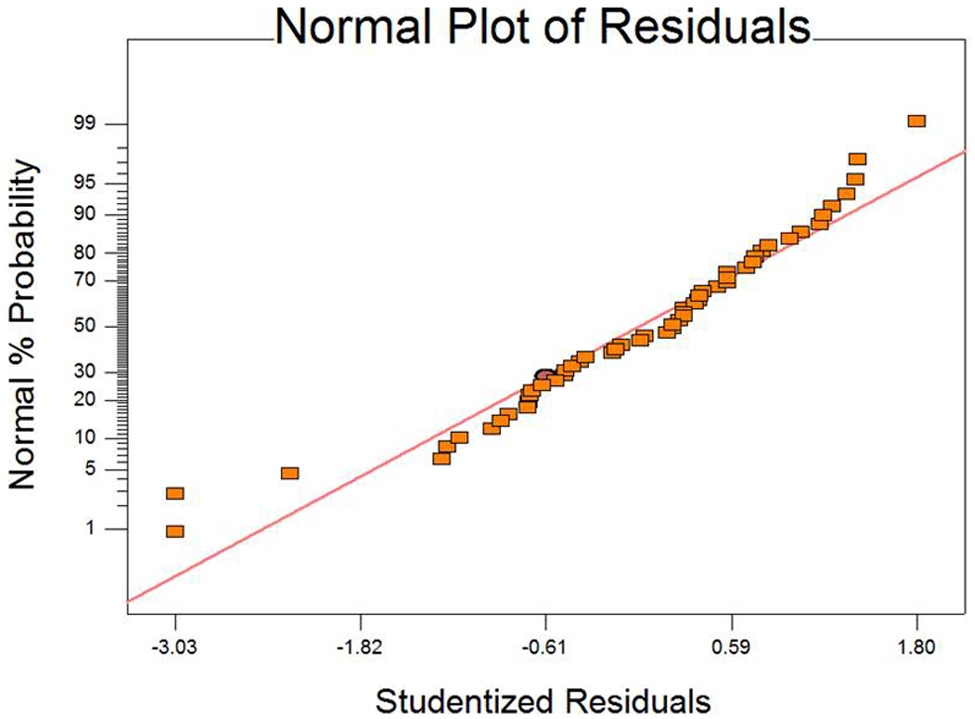
Normal probability plot of residuals for cutting speed.
Equation (2) represents the relation between CS and control factors that is obtained by applying multiple regression technique
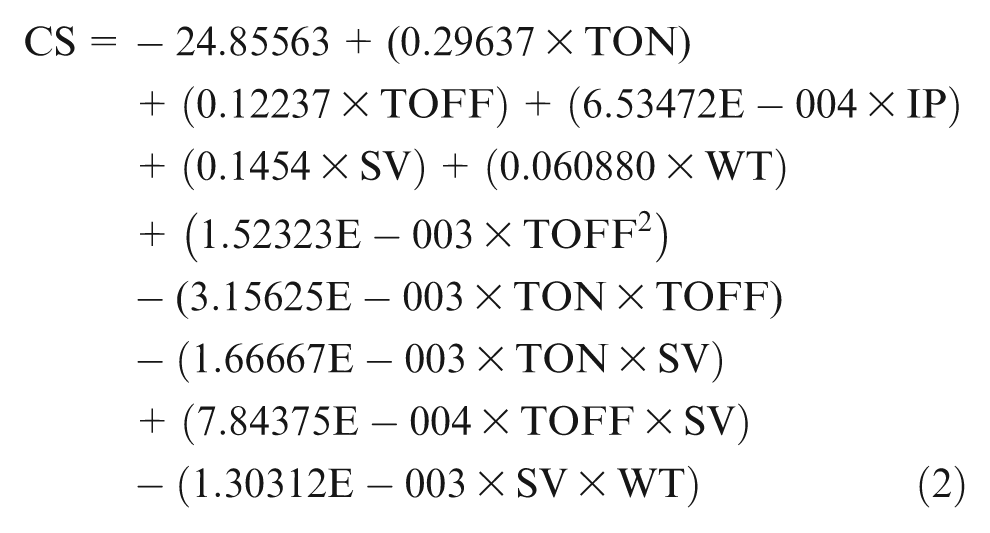
Figure 3(a) shows the interaction effect of pulse on time and pulse off time on CS. It clearly shows that CS attains a peak value of 1.13 mm/min at a higher value of TON (118) and a lower value of TOFF (48) due to their dominant control over the energy input. A longer pulse duration (pulse on time) leads to high discharge energy on the work piece per unit spark that penetrates deep into the material removing large chunks of metal. This is inconsistent with the findings of Lia and Yu. 5 A lower pulse off time gives a higher number of discharges in a given time, which further compounds the effect of impingement of large discharge energy on work piece surface and causes faster erosion of the material. 19 Interaction effect of pulse on time and spark gap set voltage is shown in Figure 3(b). A high value of spark gap set voltage increases the gap between two consecutive sparks. Higher the spark gap set voltage, longer is the discharge waiting time. To obtain the longer discharge waiting time, CS needs to be reduced by the control system. 20 A lower value of pulse on time further reduces the discharge energy impinged on the work piece. A high value of SV (55) together with a lower value of TON leads to smaller CS (0.46 mm/min). On the other hand, a larger CS of the order of 1.068 mm/min can be attained at lower value of SV (35), together with larger value of TON (118) as indicated by Figure 3(b). The interaction between pulse off time and spark gap set voltage is shown in Figure 3(c). It depicts that a larger CS (0.9298 mm/min) can be obtained at lower values of TOFF (48) and SV (35) owing to the reasons cited earlier. Table 7 shows that a weak interaction is also present in between spark gap set voltage and wire tension. This interaction plays a little part in contribution to CS as indicated by a smaller F-value (6.3925) and corresponding larger p-value (0.01).
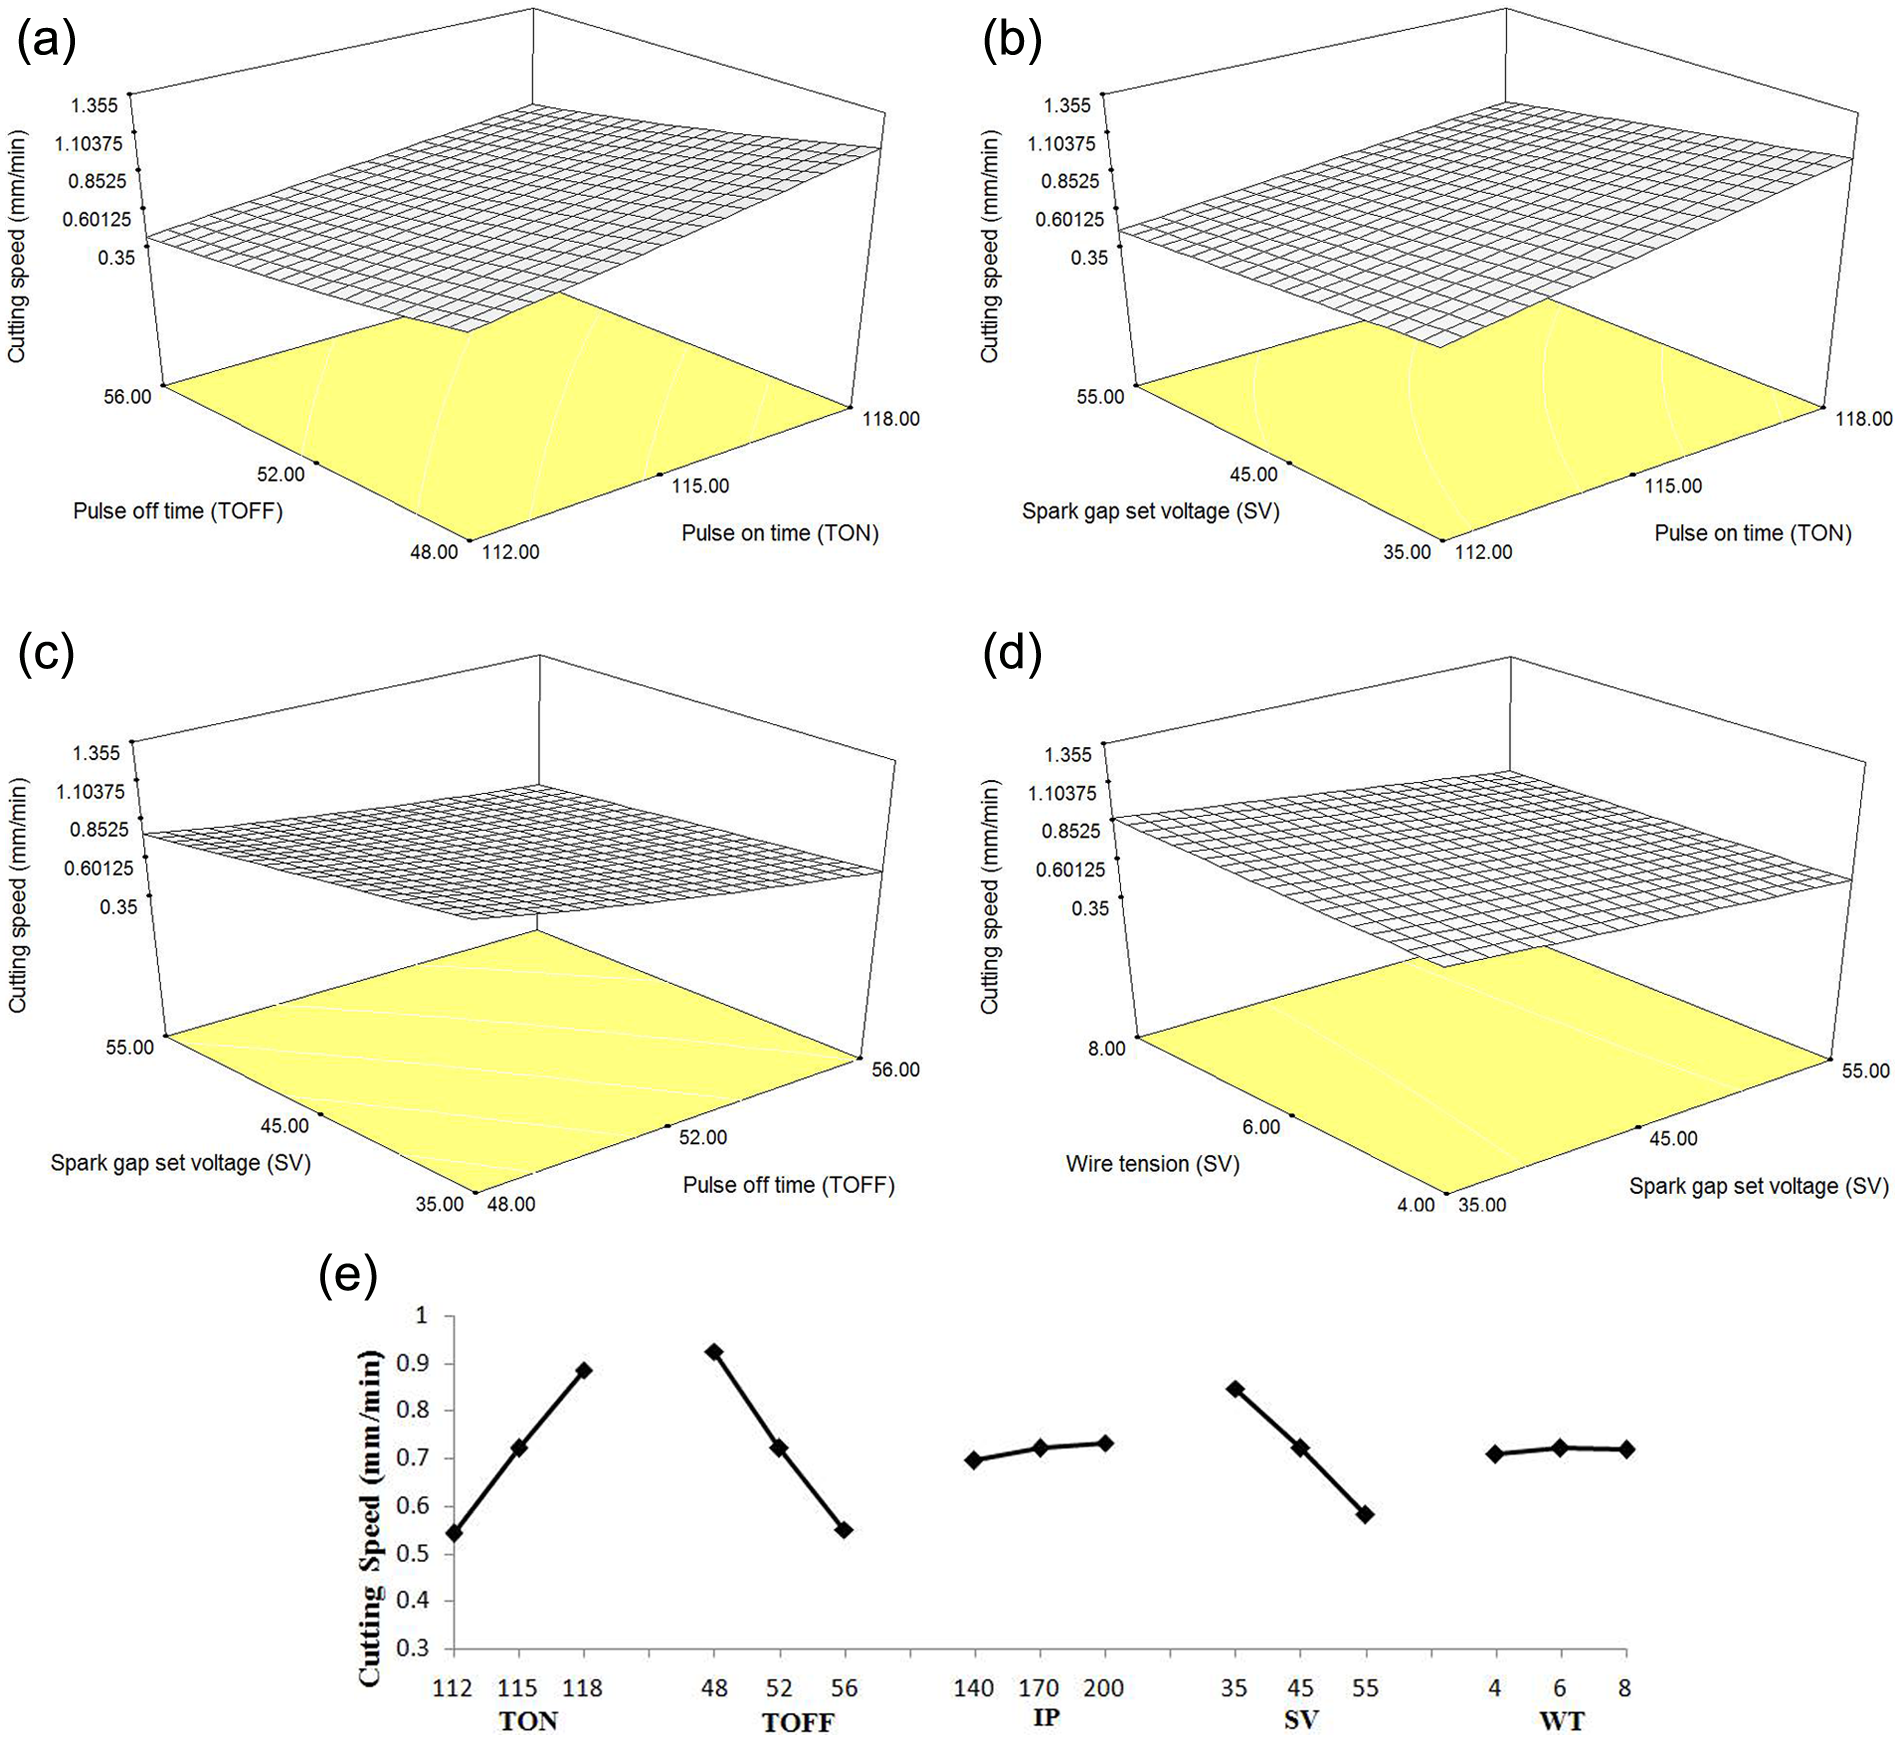
(a) Interaction effect of pulse on time and pulse off time on cutting speed, (b) interaction effect of pulse on time and spark gap set voltage on cutting speed, (c) interaction effect of pulse off time and spark gap set voltage on cutting speed, (d) interaction effect of spark gap set voltage and wire tension on cutting speed and (e) main effect of process parameters on cutting speed.
Figure 3(e) illustrates the main effects of parameters on CS. It can be deduced from the figure that the main effects also follow the same trend as exhibited in the case of interactions.
Influence of process parameters on SR
For SR, fit summary of Design Expert 6.0 recommends that the two-factor interaction (2FI) model is statistically significant for analysis. Table 8 presents ANOVA for 2FI model of SR. The associated p-value for the model is lower than 0.05, indicating that the model is significant. Moreover, lack-of-fit term is not significant as desired. Predicted R2 and adjusted R2 values indicate that the model provides an excellent relation between control factors and response (SR). Figure 4 shows the normal probability plot of residuals for SR. Most of the residuals are falling on the straight line, implying that errors are normally distributed. It also shows that the regression model is fairly well fitted with the observed values. During preparation of the model, non-significant terms are eliminated by backward elimination, and the following response surface equation in actual factors is obtained
ANOVA for response surface of reduced 2FI model of surface roughness.
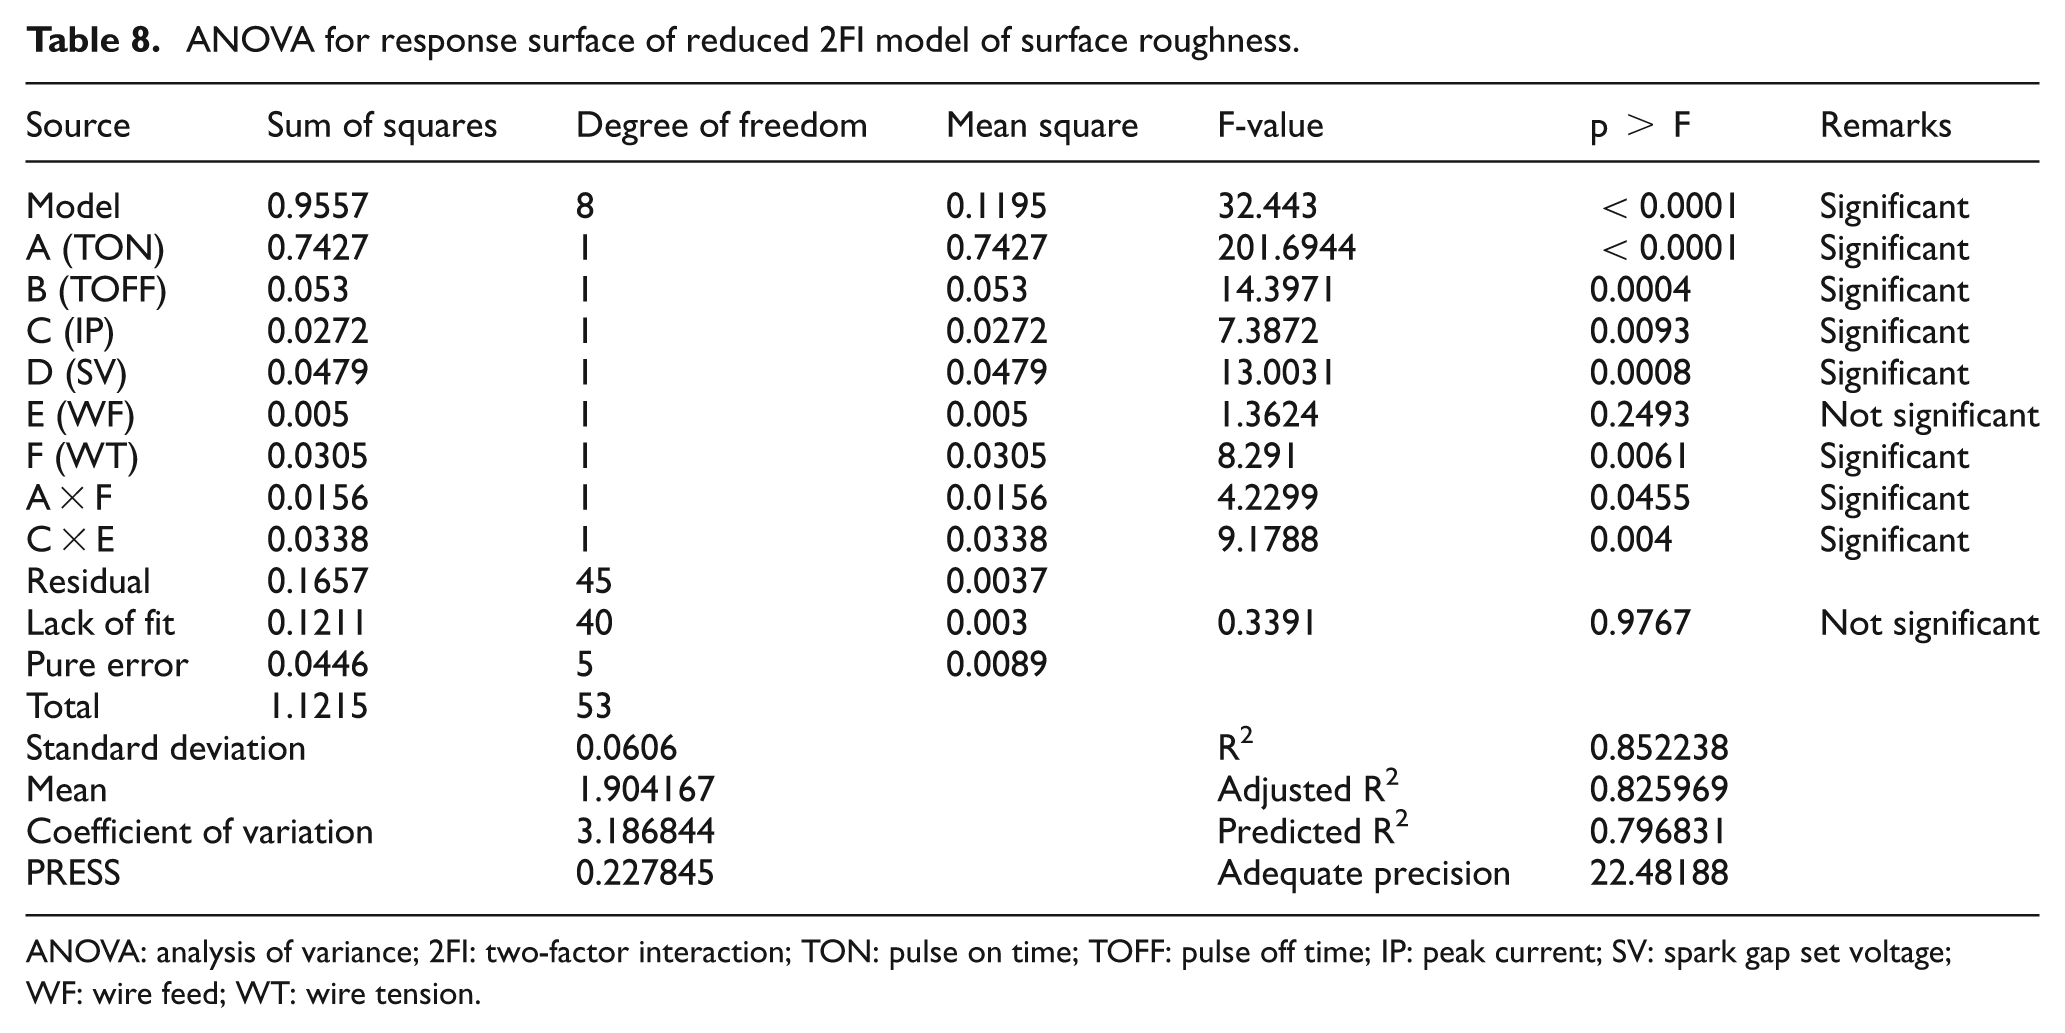
ANOVA: analysis of variance; 2FI: two-factor interaction; TON: pulse on time; TOFF: pulse off time; IP: peak current; SV: spark gap set voltage; WF: wire feed; WT: wire tension.
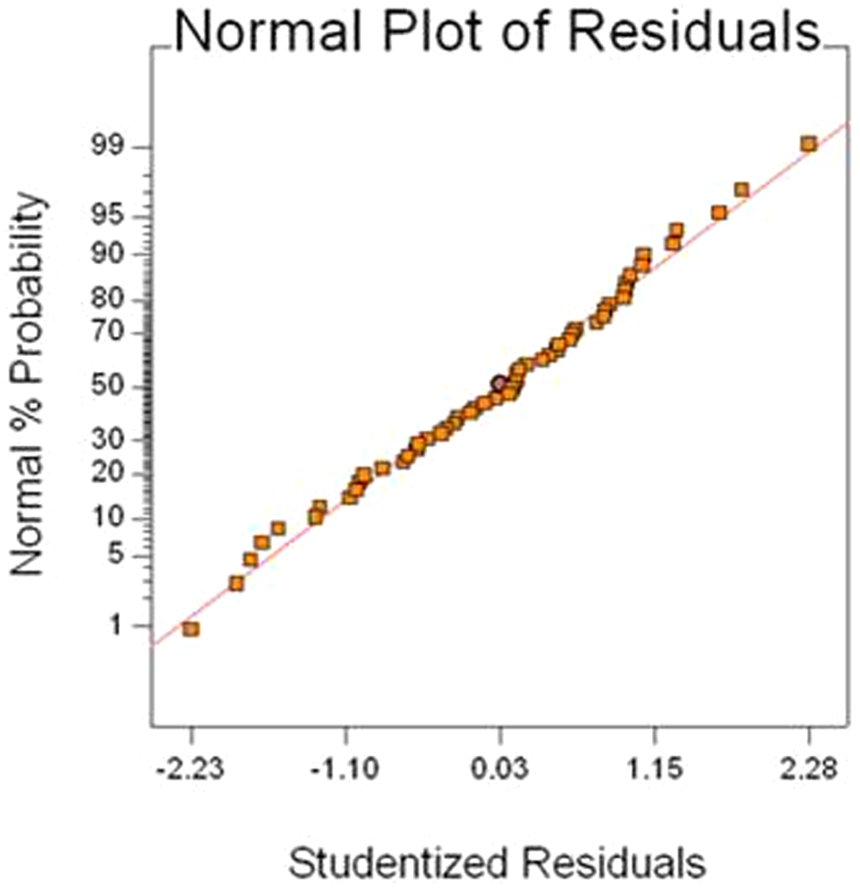
Normal probability plot of residuals for surface roughness.
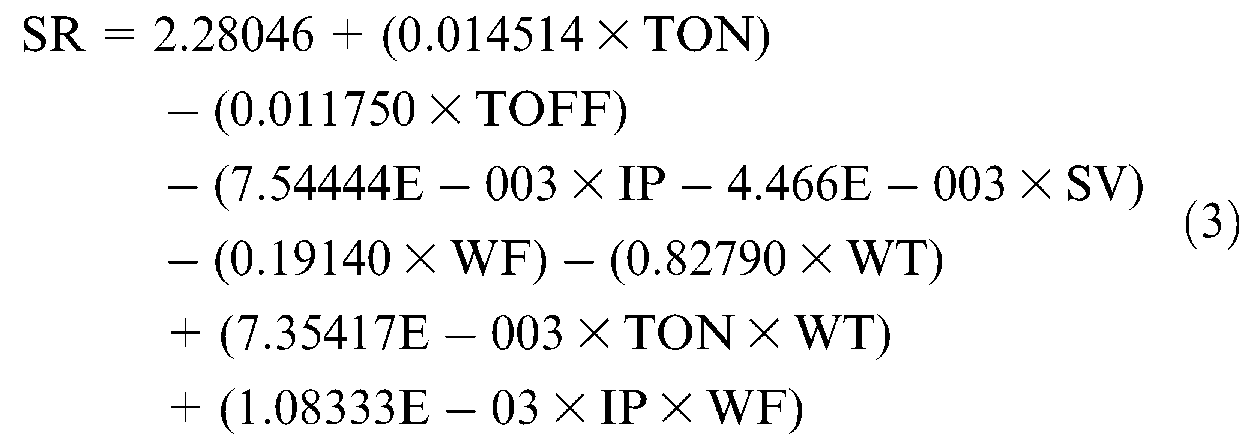
Figure 5(a) shows the interaction effect of wire feed and peak current on SR. It shows that smaller SR (Ra) of the order of 1.791 µm can be obtained at a larger value of wire feed (10 m/min) and smaller value of peak current (140 A). Lower the peak current, the smaller the discharge energy per unit spark. Figure 6(a) and (b), scanning electron microscope (SEM) micrographs clearly illustrates the effect of peak current on SR of machined surface at different values of peak current. At lower peak currents (140 A), the surface is characterized by shallow craters and pockmarks produced on it due to lower intensity discharge (Figure 6(a)). A clear trend of increase in diameter and depth of crates as well as the formation of microcracks is noticed with increase in peak current from 140 to 200 A on the machined surface owing to an increase in discharge energy in the discharge zone, as shown in Figure 6(b). A rough surface at the periphery of the crater is obtained due to residual remains of debris (debris globules) deposited on it because of the cooling process employed for spilling of debris. Because of the increase in discharge energy, a pool of molten metal is formed that gets overheated. The overheated molten metal evaporates forming gas bubbles. When the discharge is ceased, explosion of gas bubbles takes place, and molten metal is dislodged from the work surface forming larger and deeper craters on the surface, which is associated with more SR. An increase in wire feed leads to the reduction of SR, as each spark occurs between a comparatively fresher piece of wire and work piece resulting in stable discharge conditions. When the wire feed is less (around 6 m/min), the same portion of the wire experiences multiple sparks, which produces unstable discharge conditions because of the deformation of the wire due to the previous sparks. Therefore, lower values of wire feed (6 m/min) together with higher values of peak current (200 A) result in higher SR (1.988 µm). This is in agreement with the findings of Ramakrishna and Karunamoorthy. 21
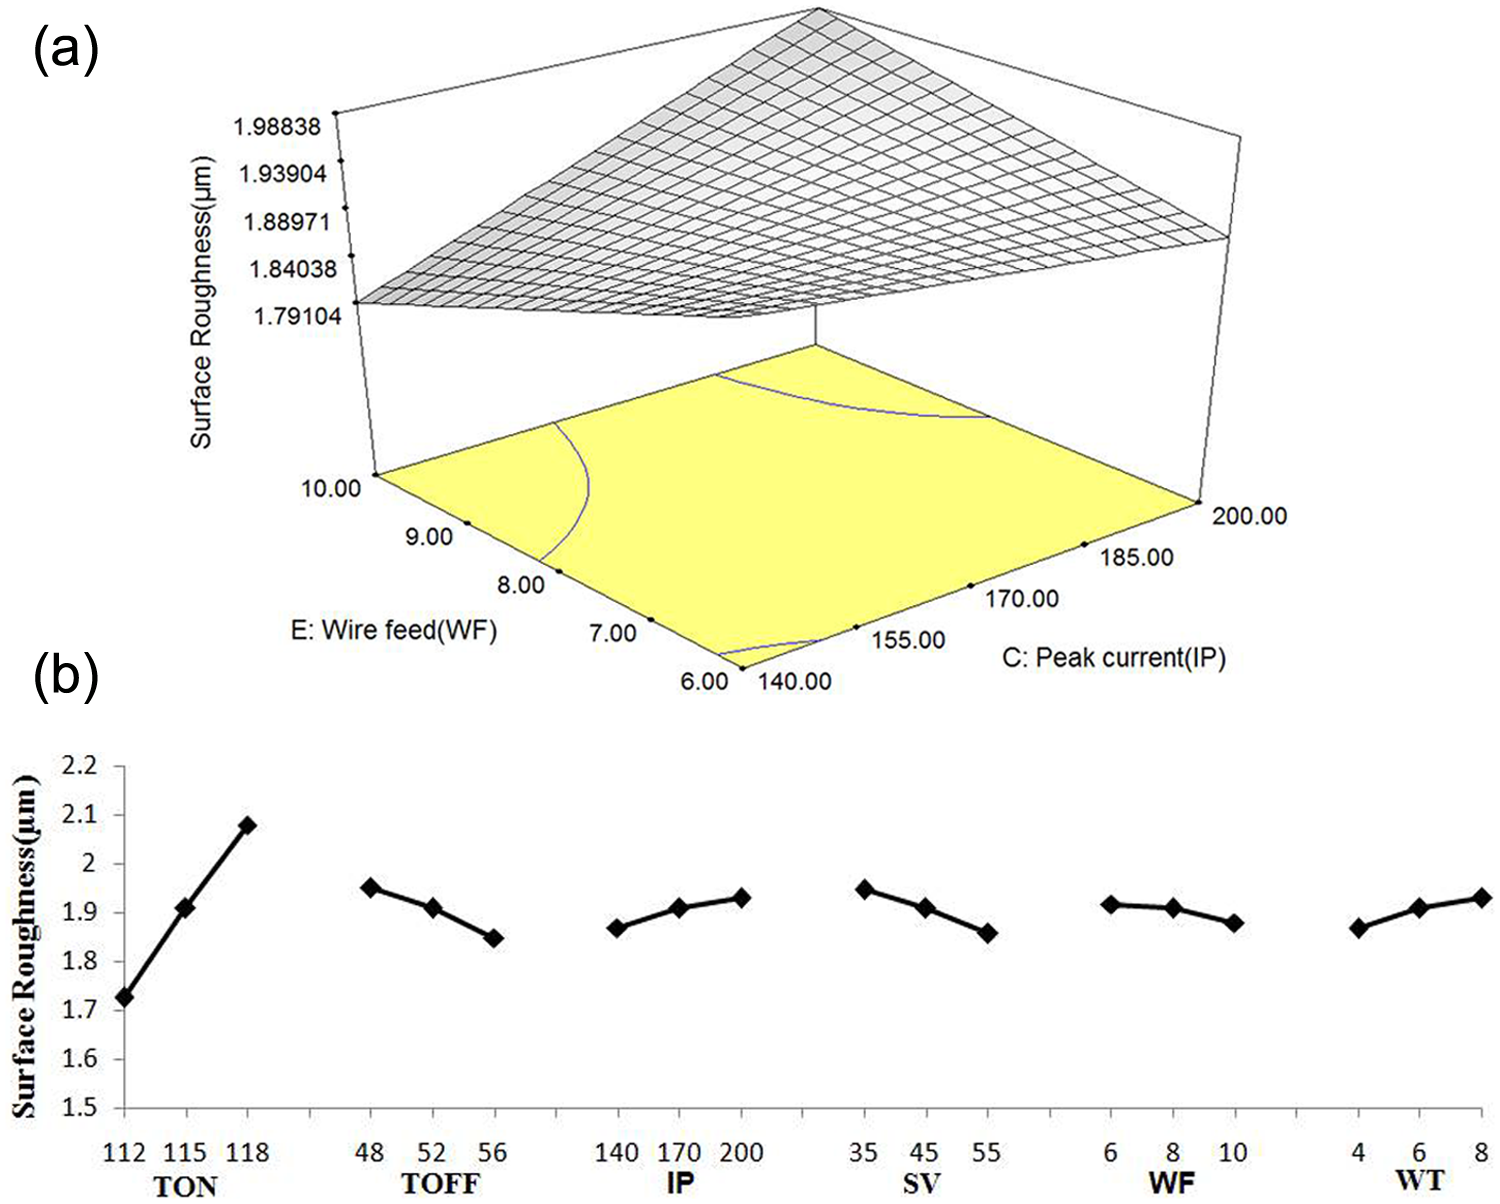
(a) Interaction effect of peak current and wire feed on surface roughness and (b) main effects of process parameters on surface roughness.

(a) SEM micrograph at peak current of 140 A (TON = 115, TOFF = 56, SV = 45, WF = 10, WT = 6), (b) SEM micrograph at peak current of 200 A (TON = 115, TOFF = 56, SV = 45, WF = 6, WT = 6), (c) SEM micrograph at pulse on time of 118 (TOFF = 56, IP = 140, SV = 45, WF = 10, WT = 6) and (d) SEM micrograph at higher spark gap set voltage of 55 V (TON = 115, TOFF = 52, IP = 140, WF = 8, WT = 4).
Table 8 indicates that a weak interaction also exists between pulse on time and wire tension. ANOVA table 8 shows that p-value of this interaction is very less, that is, 0.045, which is closer to 0.05, at which a factor becomes insignificant. So, this interaction plays a little part with regard to its contribution towards SR.
Main effect plots as shown by Figure 5(b) indicate that a higher value of pulse on time (118) results in larger SR. This is attributed to the fact that a higher pulse on time results in large discharge energy per spark impinged on the work piece surface that penetrates deeper into the work piece and removes large pieces of material, thereby producing larger and deep craters on it, and hence, a rough surface is obtained. The effects of pulse on time and peak current on the SR of machined surface are similar, but the sensitivity of pulse on time is more stronger than peak current as indicated by ANOVA table. The machined surface is characterized by larger craters and microcracks as displayed by Figure 6(c) at higher values of pulse on time. A machine setting with higher value of pulse off time (56) yields smaller SR of the order of 1.8 µm. A lower pulse off time (48) leads to an increase in the number of discharges per unit time, resulting in the formation of deep craters on the surface. Obviously, larger craters result in more SR. A high value of spark gap set voltage (55 V) leads to wider discharge gap. Therefore, the discharge conditions become more stable, but the number of discharge cycles gets reduced within a given time. Therefore, sparking between the wire and work piece removes fine microparticles from the work piece surface creating small microcavities on work surface, which is associated with the smaller SR, as shown in Figure 6(d). The effect of peak current follows the same trend as discussed in the case of interaction between peak current and wire feed.
It can be concluded from the earlier discussion that among the chosen six process parameters, only pulse on time, pulse off time and spark gap set voltage and peak current have considerable effect on CS and SR. Wire feed and wire tension as main effects are found insignificant with regard to their contribution towards CS, whereas for SR, wire tension plays some part. Interactions between process parameters also play a moderate role in determining CS and SR.
Multi-objective optimization
The present study considers simultaneous optimization of CS and SR, which are conflicting in nature. In order to convert the first objective (CS), it is to be modified. The objective functions used for evaluation of fitness values are given in the following


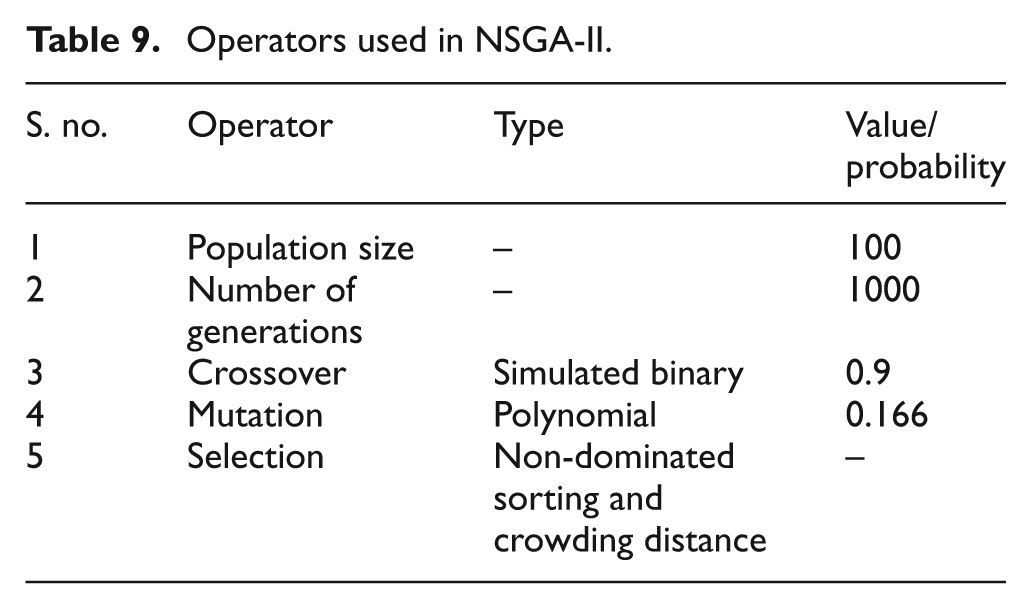
This study utilizes NSGA-II proposed by Deb et al., 16 as a multi-objective optimization algorithm. It is a fast elitist multi-objective optimization algorithm and modified version of NSGA proposed by Srinivas and Deb, 22 which was criticized for its computational complexity, lack of elitism, and for choosing the optimal parameter value for sharing parameter σshare. NSGA-II has a better sorting algorithm, incorporates elitism and needs no sharing parameter to be chosen a priori. Table 9 shows the different operators and their values used in the present study, which are selected on the basis of the literature review, as shown in Table 1.
Operators used in NSGA-II.
The major steps involved in the algorithm are as follows:16,23
Step I
population initialization
Population is initialized based upon the problem range and constraints if any.
Step II
non-dominated sorting
The initialized population is sorted based upon the domination. In a non-dominated set, no member cannot be said to be better than any other member with respect to all the objectives.
For each solution p in the population P,
Find domination count (np), that is, number of solutions that dominate the solution p.
Find a set of solutions that solution p dominates (Sp).
For each individual q in P
If p dominates q, then add q to set Sp else if q dominates p, then increment np by 1.
If np = 0, that is, no solution dominates p, then p belongs to first front F1 and assign rank 1 to individual p. Update the first front set F1 by adding p to F1.
This is carried out for all individuals in the population P.
For each solution p with np = 0, visit each member (q) of its set Sp and reduce its domination count by 1. If for any member np = 0, put it in a separate list Q. These members belong to the second non-dominated front F2.
This procedure is repeated till all fronts are defined.
Step III
crowding distance
An evolutionary algorithm should maintain a good spread among the obtained set of solutions. The NSGA-II approach does not require any user-defined parameter for maintaining diversity among population members. It computes crowding distance based upon density of solutions surrounding a particular solution in the population. The crowding distance computation requires sorting the population according to each objective function value in the ascending order of magnitude for each front. The solutions with the smallest and largest function values are assigned infinite distance values, for each objective function. All other intermediate solutions are given distance values equal to absolute normalized difference in the function values of two adjacent solutions. The overall crowding distance value is calculated as sum of the individual distance values, corresponding to each objective.
Step IV
selection
Every individual in the population has two attributes, namely, non-dominated rank (irank) and crowding distance (idistance). Individuals are selected using the following relation

that is the solutions with better rank or having equal rank and greater diversity are selected.
Step V
genetic operators
Simulate binary crossover (SBX) is used for reproduction. It works with two parent solutions and creates two offspring. It simulates the working principle of single-point crossover on binary strings. SBX operator has the following two properties:
The difference between the offspring is in proportion to parent solutions.
Near parent solutions are monotonically more likely to be chosen as offspring than solutions distant from parents.
The need for mutation is to keep diversity in the population. A polynomial mutation is utilized in the algorithm, which makes use of a random number generated based upon the small mutation probability pm. For polynomial mutation, pm is computed by 1/n, where n shows the number of process variables (n = 6 for the present study). The generated random number is then multiplied with the difference of lower and upper bounds of the parents to introduce changes in the offspring.
Step VI
recombination and selection
The offspring population is combined with the current generation population, and the selection is performed to set the individuals of next generation. Since all the previous and current populations are included in the new population, so elitism is ensured. The new generation is filled by each front subsequently until the population size exceeds the current population size.
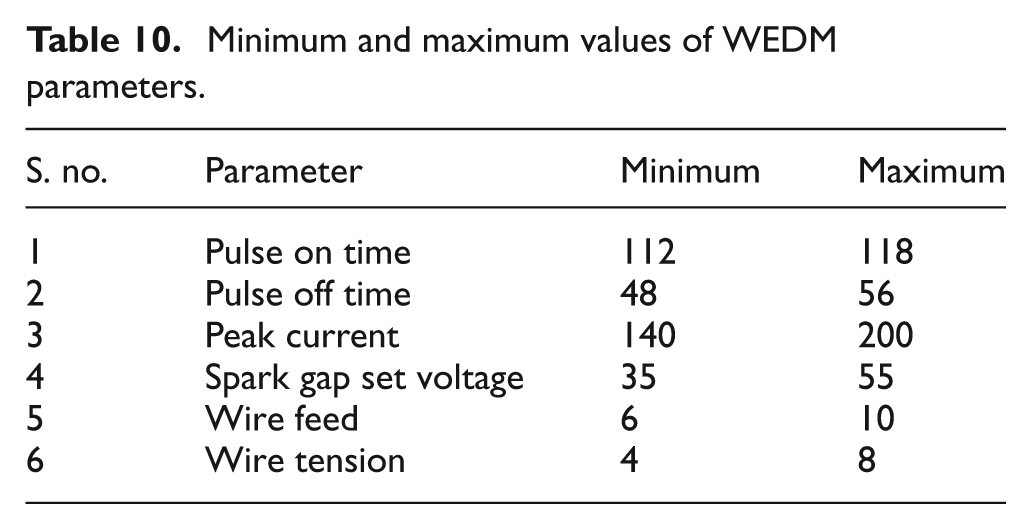
The empirical models for CS and SR are obtained using regression analysis as given by equations (2) and (3), respectively. These models are utilized in multi-objective optimization using NSGA-II as fitness functions. The present algorithm is implemented in MATLAB, and Table 10 indicates minimum and maximum values of WEDM parameters taken into account as boundary conditions for evaluation of objective functions. Figure 7 shows the flow chart of NSGA-II.
Minimum and maximum values of WEDM parameters.
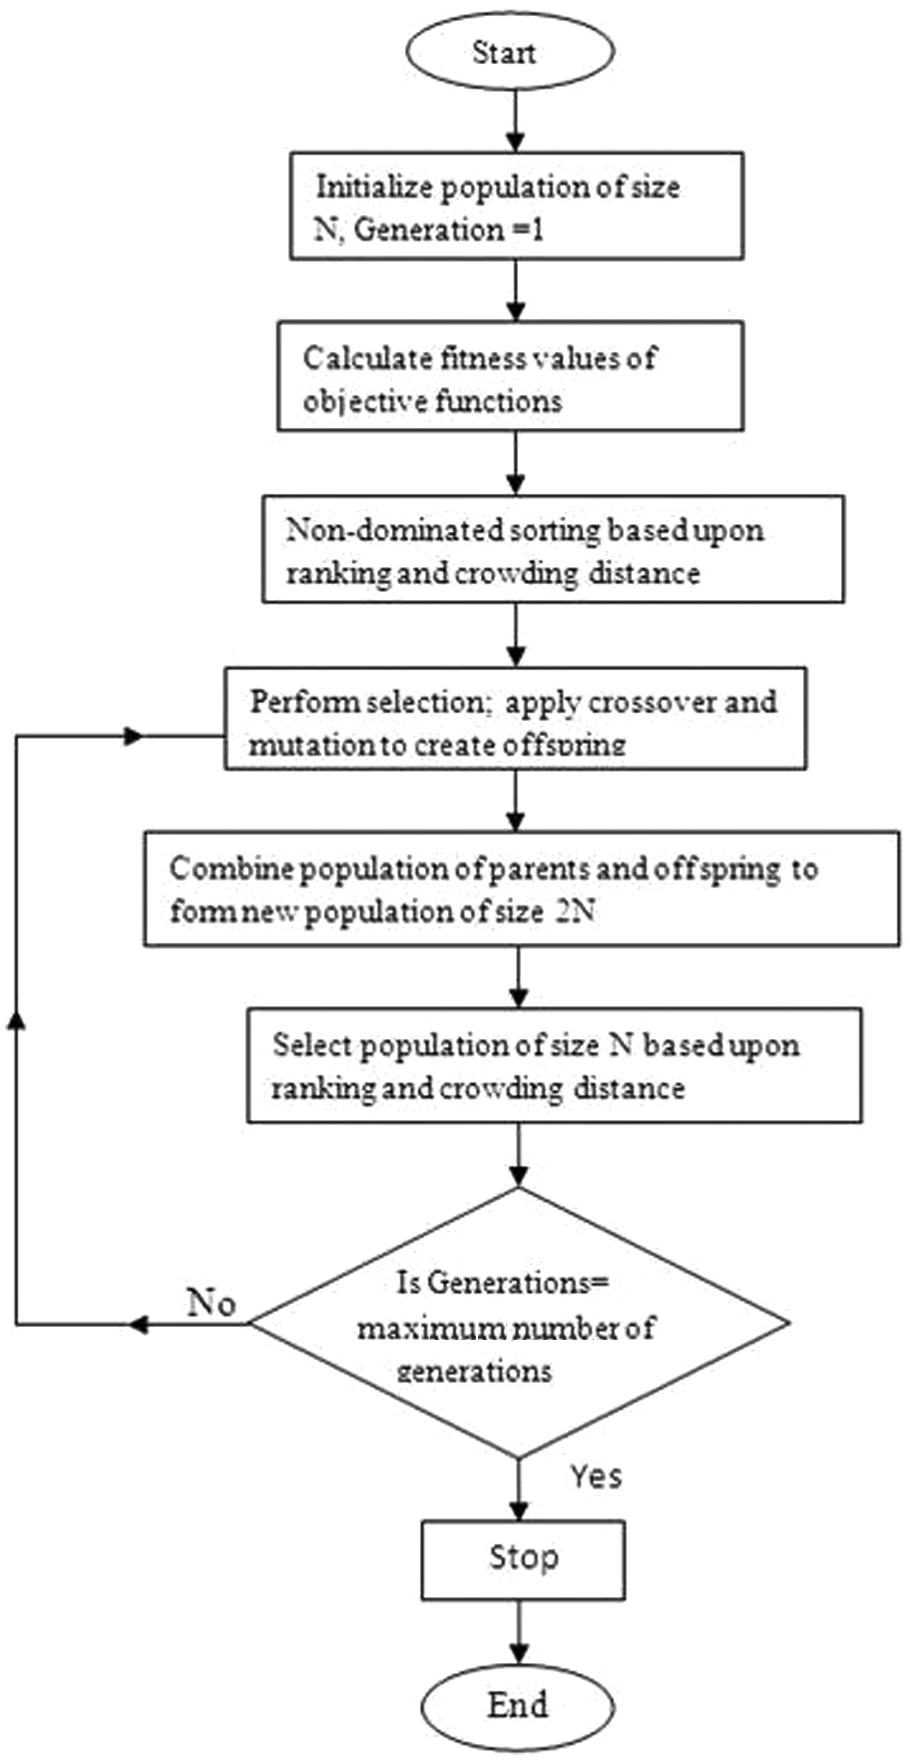
Flow chart of NSGA-II.
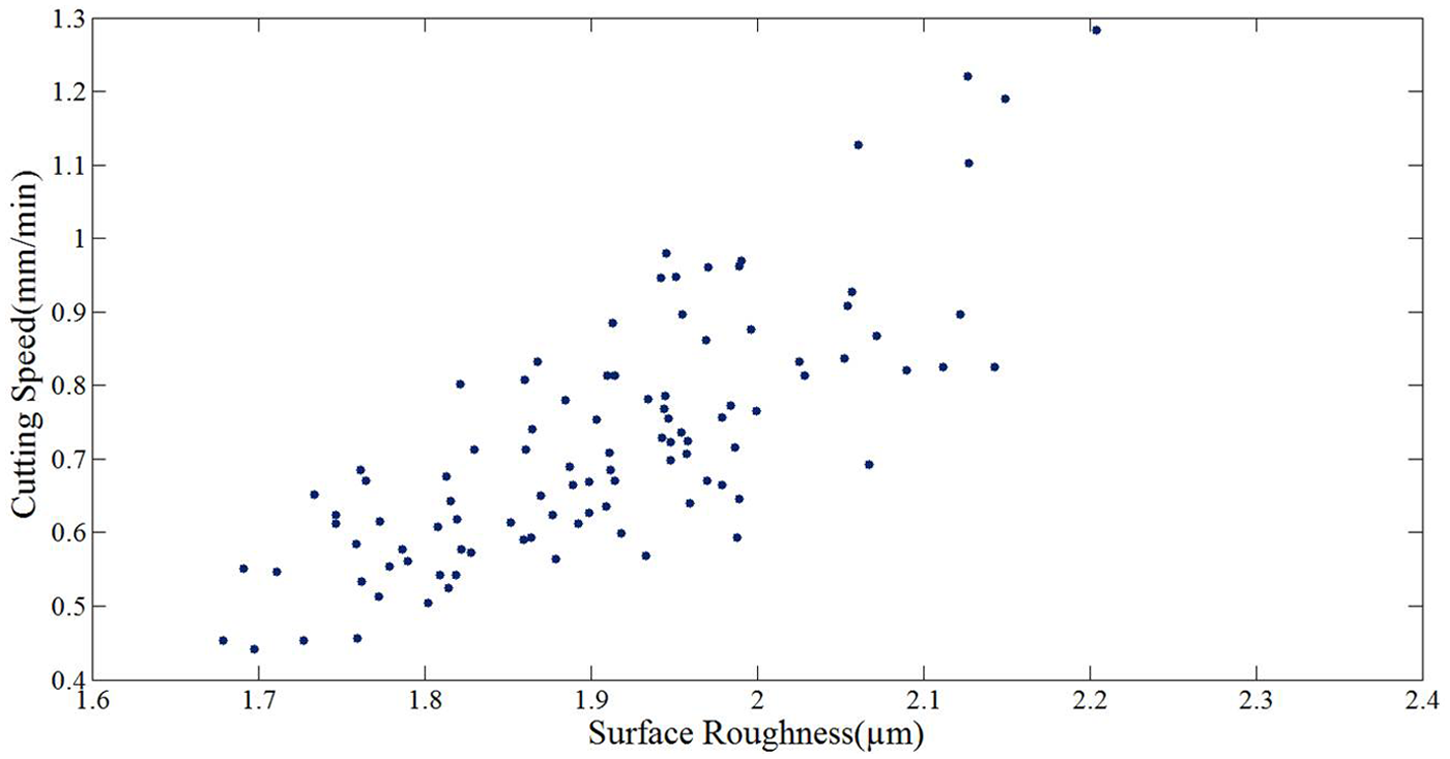
Figure 8 shows the initial solution set. The non-dominated solution set obtained at the end of 1000 generations is shown in Figure 9. This shows the formation of Pareto optimal front leading to the final set of solutions. Thirty solutions out of 100 sets along with the corresponding parameter settings are shown in Table 11. It indicates that none of the solutions in the non-dominated set are absolutely better than any other; anyone of the solution is the ‘better solution’. Therefore, the best solution can be selected based upon individual product requirements.
Initial solution set.
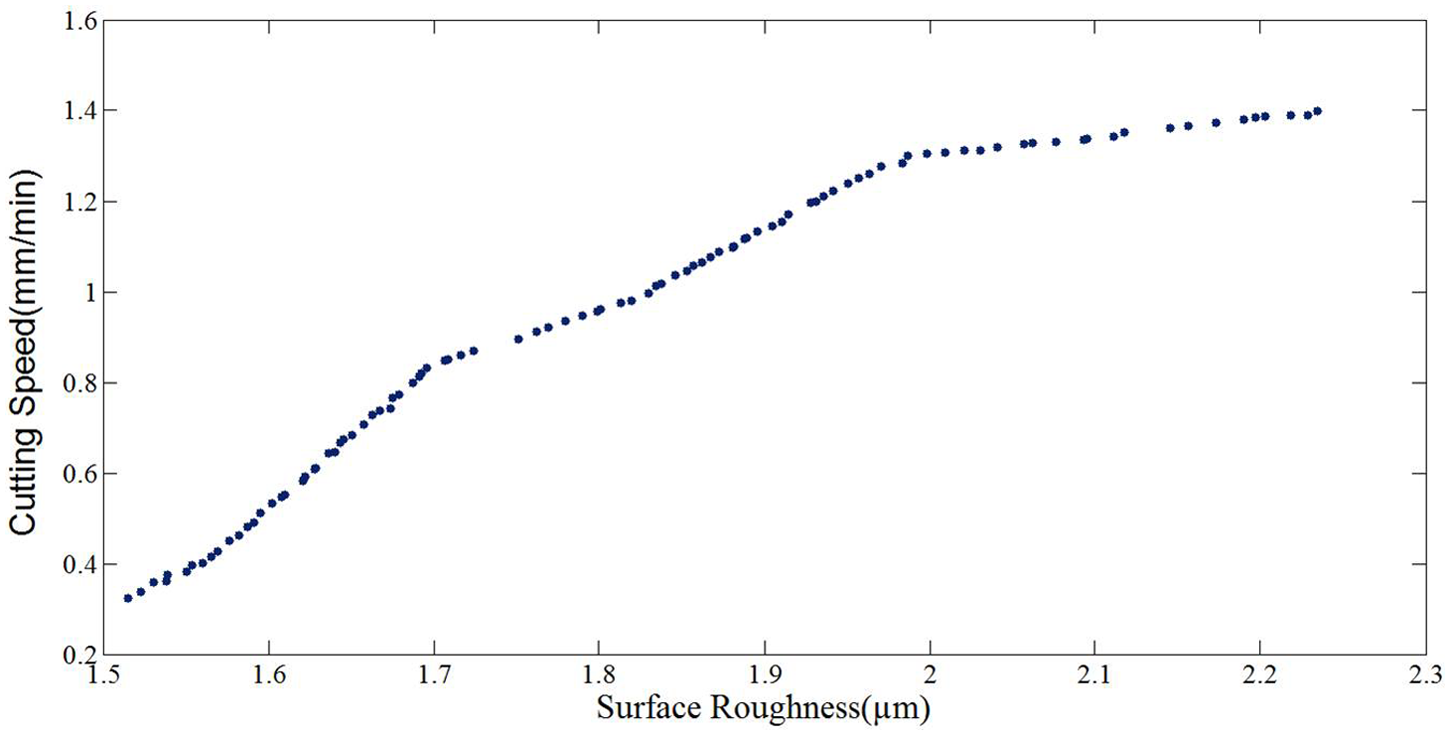
Pareto optimal solutions after 1000 generations.
Optimized process parameters and corresponding objective function values.
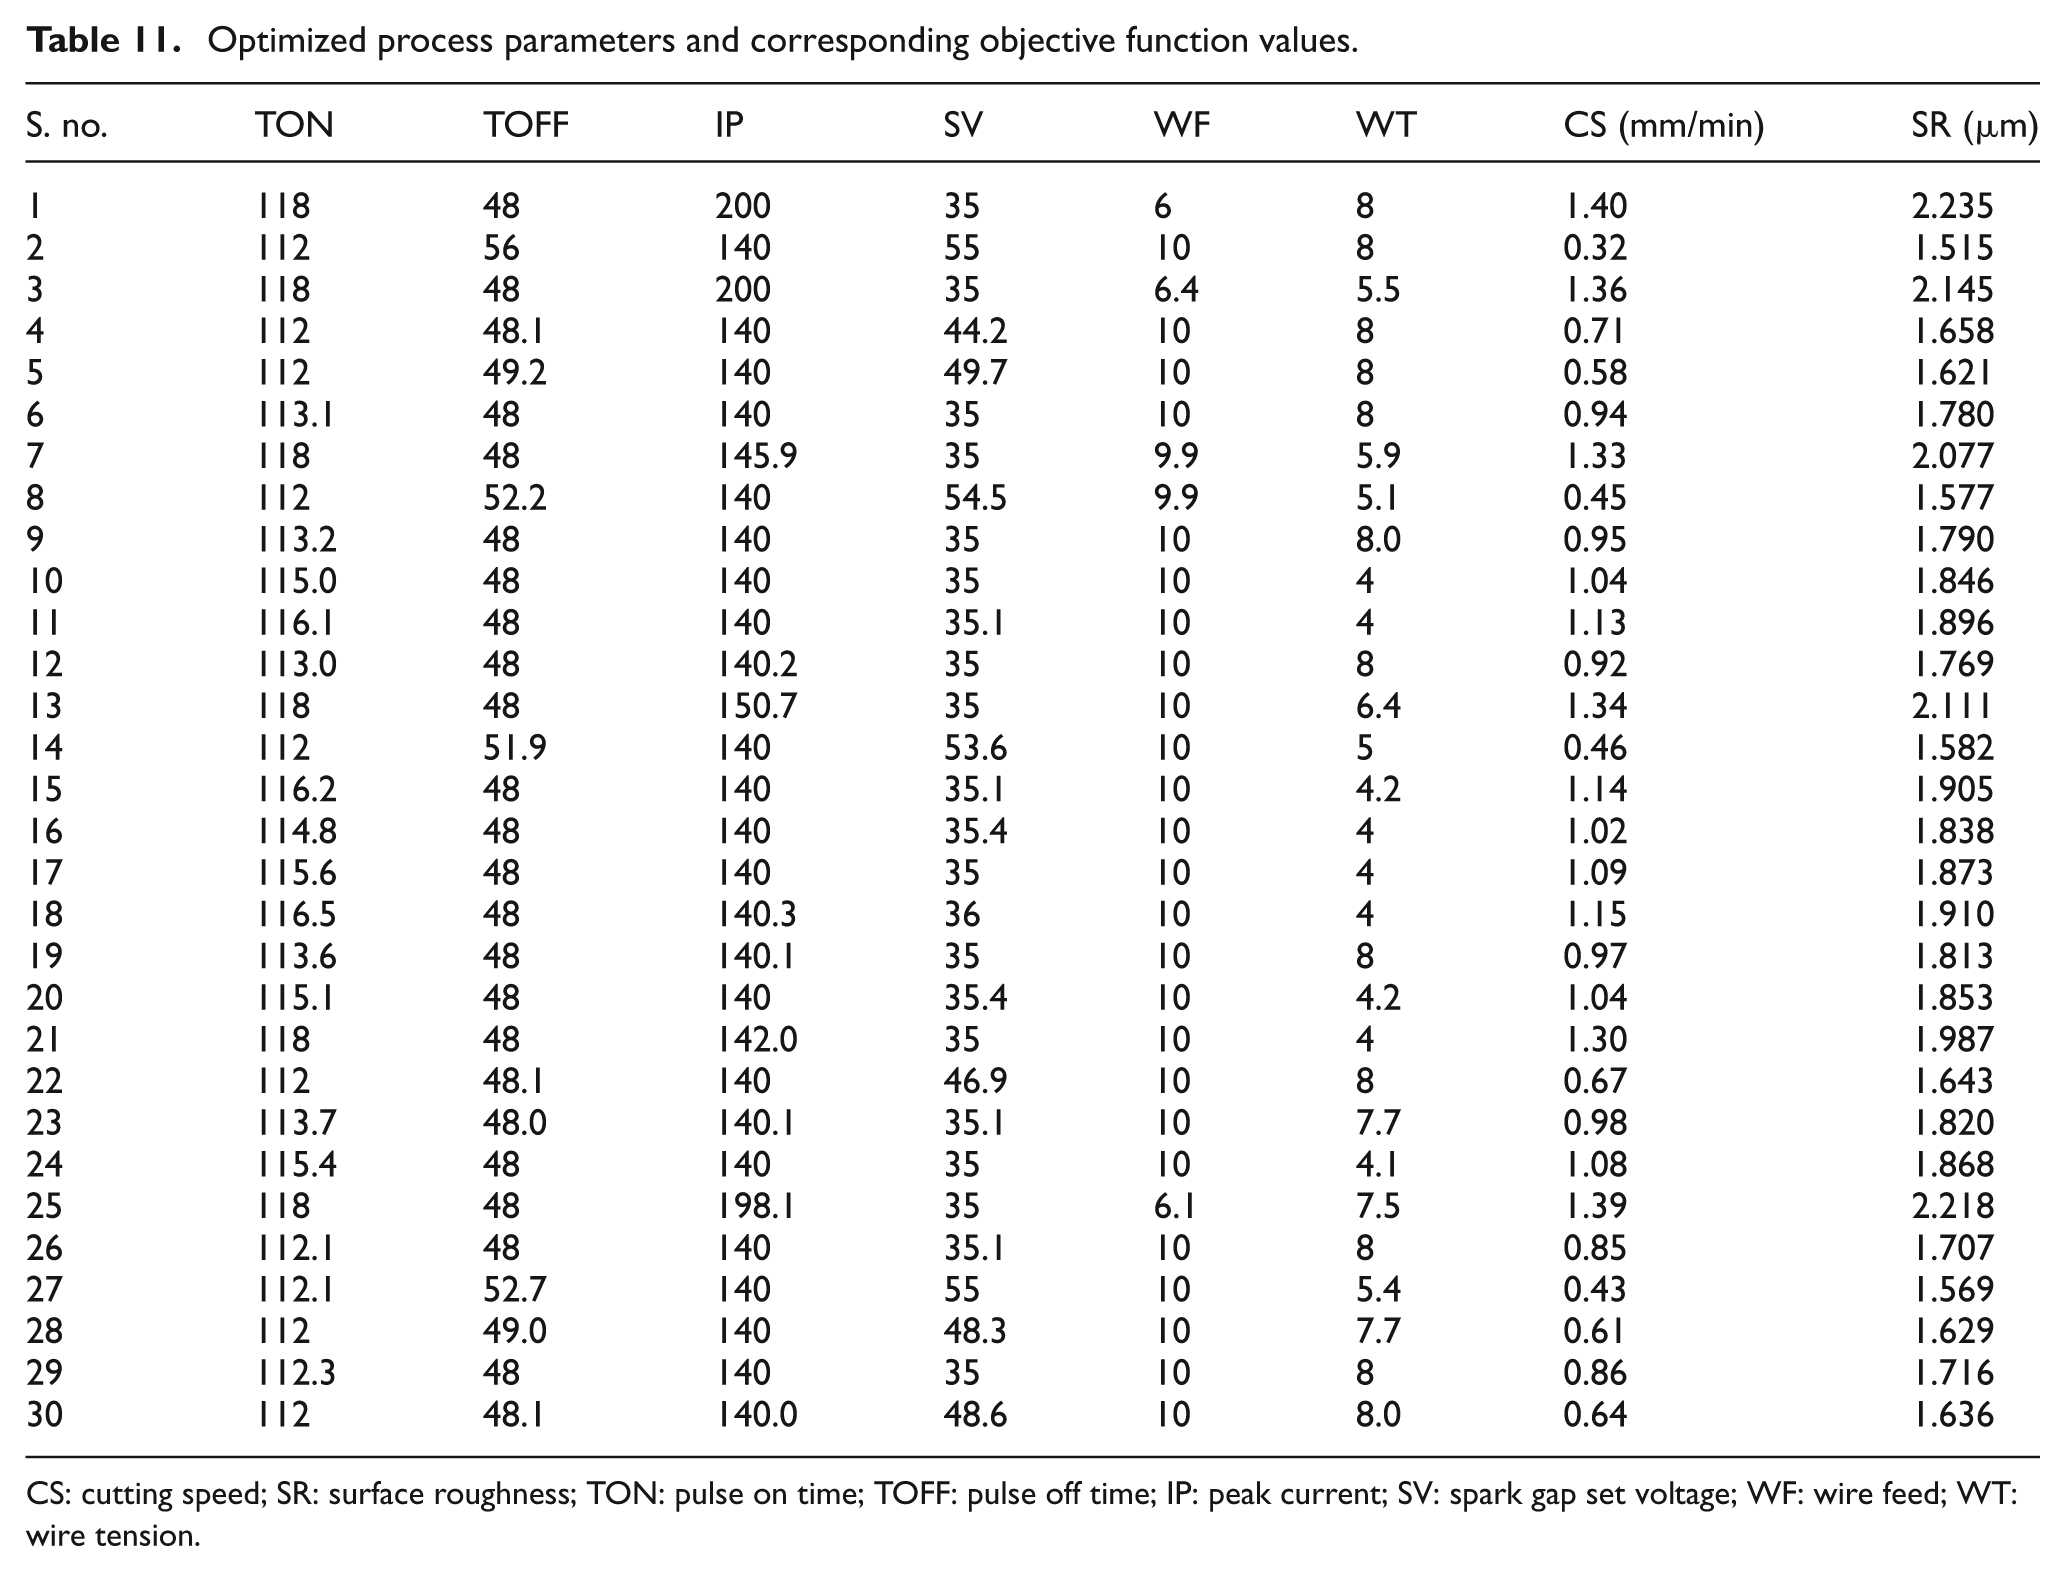
CS: cutting speed; SR: surface roughness; TON: pulse on time; TOFF: pulse off time; IP: peak current; SV: spark gap set voltage; WF: wire feed; WT: wire tension.
Confirmatory experiments are carried out to check the validity of optimization results. Five solutions are randomly picked from Table 11, and they are at serial numbers 1, 22, 2, 23 and 18, respectively. Experiments are carried out with the optimized process parameter settings, as shown in Table 11, for serial numbers 1, 22, 2, 23 and 18, respectively. It is important to mention that parameter values shown in Table 12 are rounded off to the nearest integer values that are permitted by the machine tool as input. Table 12 provides the values of process parameters at which confirmatory experiments are carried out along with the actual CS and SR. Table 12 clearly shows that error between confirmatory results and predicted values is less than 5%. It confirms excellent reproducibility of the results. Furthermore, from Table 6, for experiment having run order 17, CS and SR are 0.462 mm/min and 1.61 µm, respectively, for process parameter setting of TON, TOFF, IP, SV, WF and WT at 112, 52, 140, 55,10 and 6, respectively. Table 11 shows that for solution shown at serial number 8, CS and SR are 0.45 mm/min and 1.577 µm, respectively, for process parameter setting of TON, TOFF, IP, SV, WF and WT at 112, 52.2, 140, 54.5, 9.9 and 5.1, respectively. This also confirms that optimized process parameters and response values are in close agreement with the experimentally obtained values.
Confirmation experiments and results.
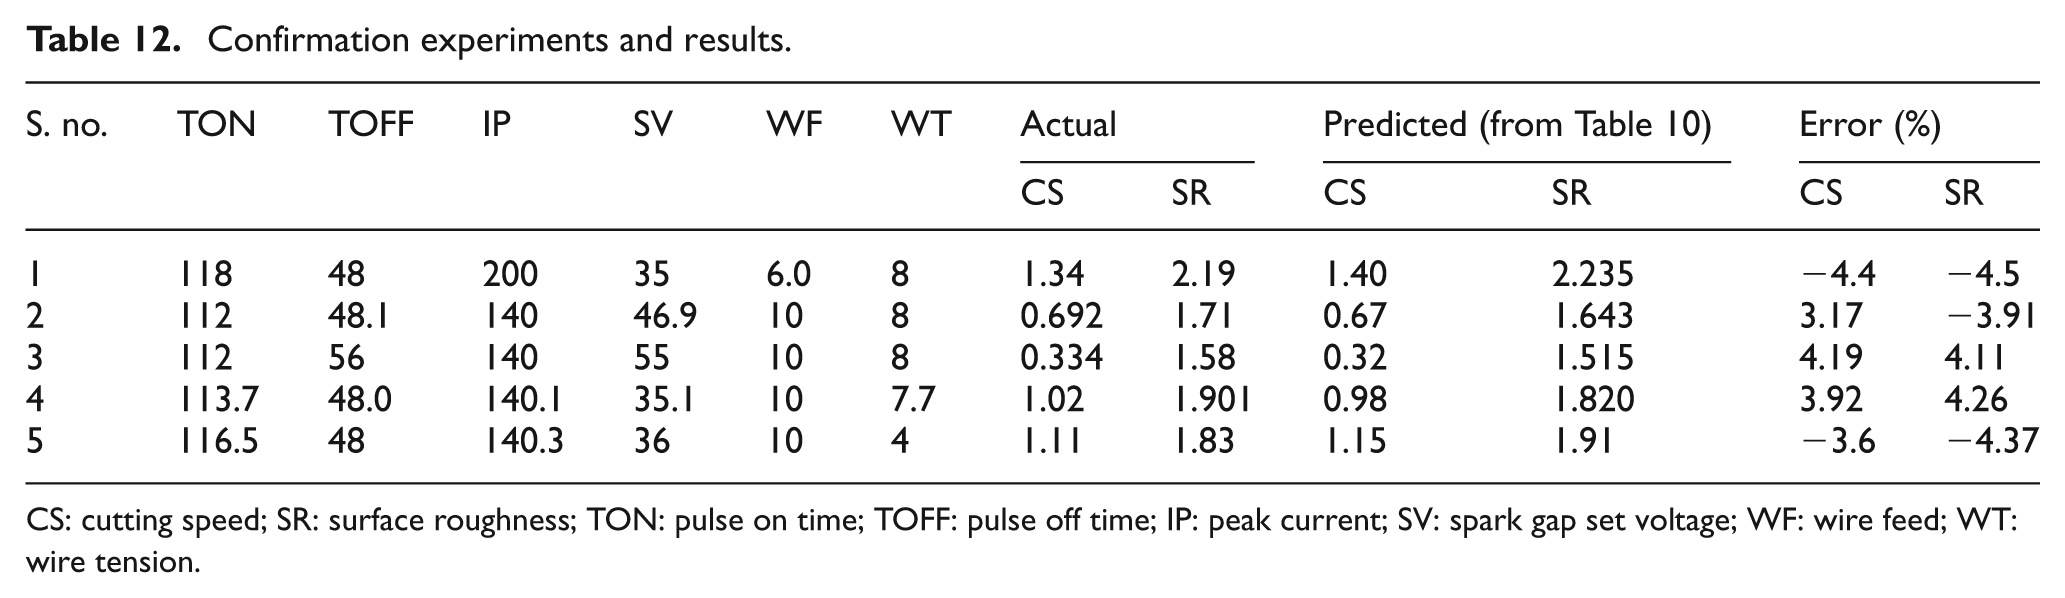
CS: cutting speed; SR: surface roughness; TON: pulse on time; TOFF: pulse off time; IP: peak current; SV: spark gap set voltage; WF: wire feed; WT: wire tension.
From Table 6, it is observed that for experiment having run order 42, CS and SR obtained are 0.961 mm/min and 1.98 µm, respectively. By optimization using NSGA-II, it can be seen that CS can be increased to 1.3 mm/min for the same SR (s. no. 21, Table 11), with a increase of 26.07% in CS.
Conclusion
The present article investigates multi-objective optimization of process parameters of WEDM in machining of Ti 6-2-4-2 alloy using the Box–Behnken designs and GAs. Empirical relations are obtained for CS and SR using regression analysis. Multi-objective optimization of CS and SR is carried out using NSGA-II algorithm. Verification experiments are carried out to check the validity of results. From the study, the following conclusions can be drawn:
For CS, main effects of pulse on time, pulse off time, peak current, spark gap set voltage, 2FI between pulse on time and pulse off time, pulse on time and spark gap set voltage, pulse off time and spark gap set voltage and quadratic function of pulse off time play a significant role. Wire tension and wire feed as main effects have negligible effect on CS. In general, CS is found to increase with increase in pulse on time and decrease in pulse off time and spark gap set voltage due to higher discharge energy produced in the machining zone.
SR is primarily affected by the main effects of pulse on time, pulse off time, spark gap set voltage, peak current and interaction between peak current and wire feed. A high value of pulse on time, peak current and lower values of spark gap set voltage and pulse off time promotes the SR owing to the increase in discharge energy subjected on work piece.
A non-dominated solution set is obtained, to be presented as guidelines for manufacturing engineer to select optimal combination of parameters. The choice of one solution over the other depends upon the manufacturing engineer’s requirements. If the choice is better SR or higher CS, a suitable combination of process parameters can be selected.
From the validation experiments, it is observed that the predicted and observed values are quite close, which indicates that the developed model can be effectively used to predict CS and SR.
Footnotes
Funding
This research received no specific grant from any funding agency in the public, commercial or not-for-profit sectors.