
Abstract
Single-point incremental forming is the most economical process to make the sheet metal prototypes and low volume production without any dedicated dies and simple tooling. The surface finish of the parts produced in this process gets affected by various process parameters. To get the proper quality of parts for functional applications, it is important to understand the effect of various process parameters on part quality. Another drawback with this process is long processing time, which also gets affected by different process parameters. Thus, the first objective of this article is to study the effect of various process parameters on surface roughness and manufacturing time. Second objective is to carry out the multi-objective optimization to get optimum process parameters. For this, detailed experiments are conducted using Box–Behnken design. The effects of step depth, tool diameter, wall angle, feed rate and lubricant type on surface roughness and processing time have been investigated. Based on experimental data, mathematical models have been developed for both the response variables, namely, surface roughness and manufacturing time. Since the response variables are mutually exclusive in nature, multi-objective optimization algorithm (non-dominated sorting genetic algorithm-II) has been used to get optimum process parameters. The Pareto front obtained from this algorithm helps the manufacturing engineer to select optimum process parameters in single-point incremental forming process.
Keywords
Introduction
Flexibility and customized production became a necessity in today’s automotive, aerospace and biomedical industry. Unfortunately, conventional production methods for sheet metal forming such as deep drawing and stamping cannot meet these new demands from manufacturing sector. Many new processes were introduced to meet these demands in the last decade. The research in incremental sheet forming (ISF) shows that it is a most potential process to meet the requirements of sheet metal prototyping and low volume production. Possibility to carry out this process on conventional computer numerical control (CNC) milling machine and very simple tooling without any dedicated dies are the most attractive features of this process. 1
In ISF, the vice on the CNC machine table is replaced with a simple fixture to hold the sheet. The cutting tool in the machine tool spindle is replaced with a hemispherical headed tool. The tool moves over the sheet in the specified path to deform the sheet into complex three-dimensional shapes. The tool moves in small increments, and plastic deformation is very much localized in nature. The tool trajectories for ISF applications are generally generated using computer-aided design (CAD)/computer-aided manufacturing (CAM) softwares used for generating tool paths in machining. The basic elements in CNC incremental forming are shown in Figure 1. Tool diameter, step depth, feed rate, spindle speed, wall angle, tool path, blank material, thickness, friction and lubrication are some of the important parameters that affect the mechanics of ISF process.
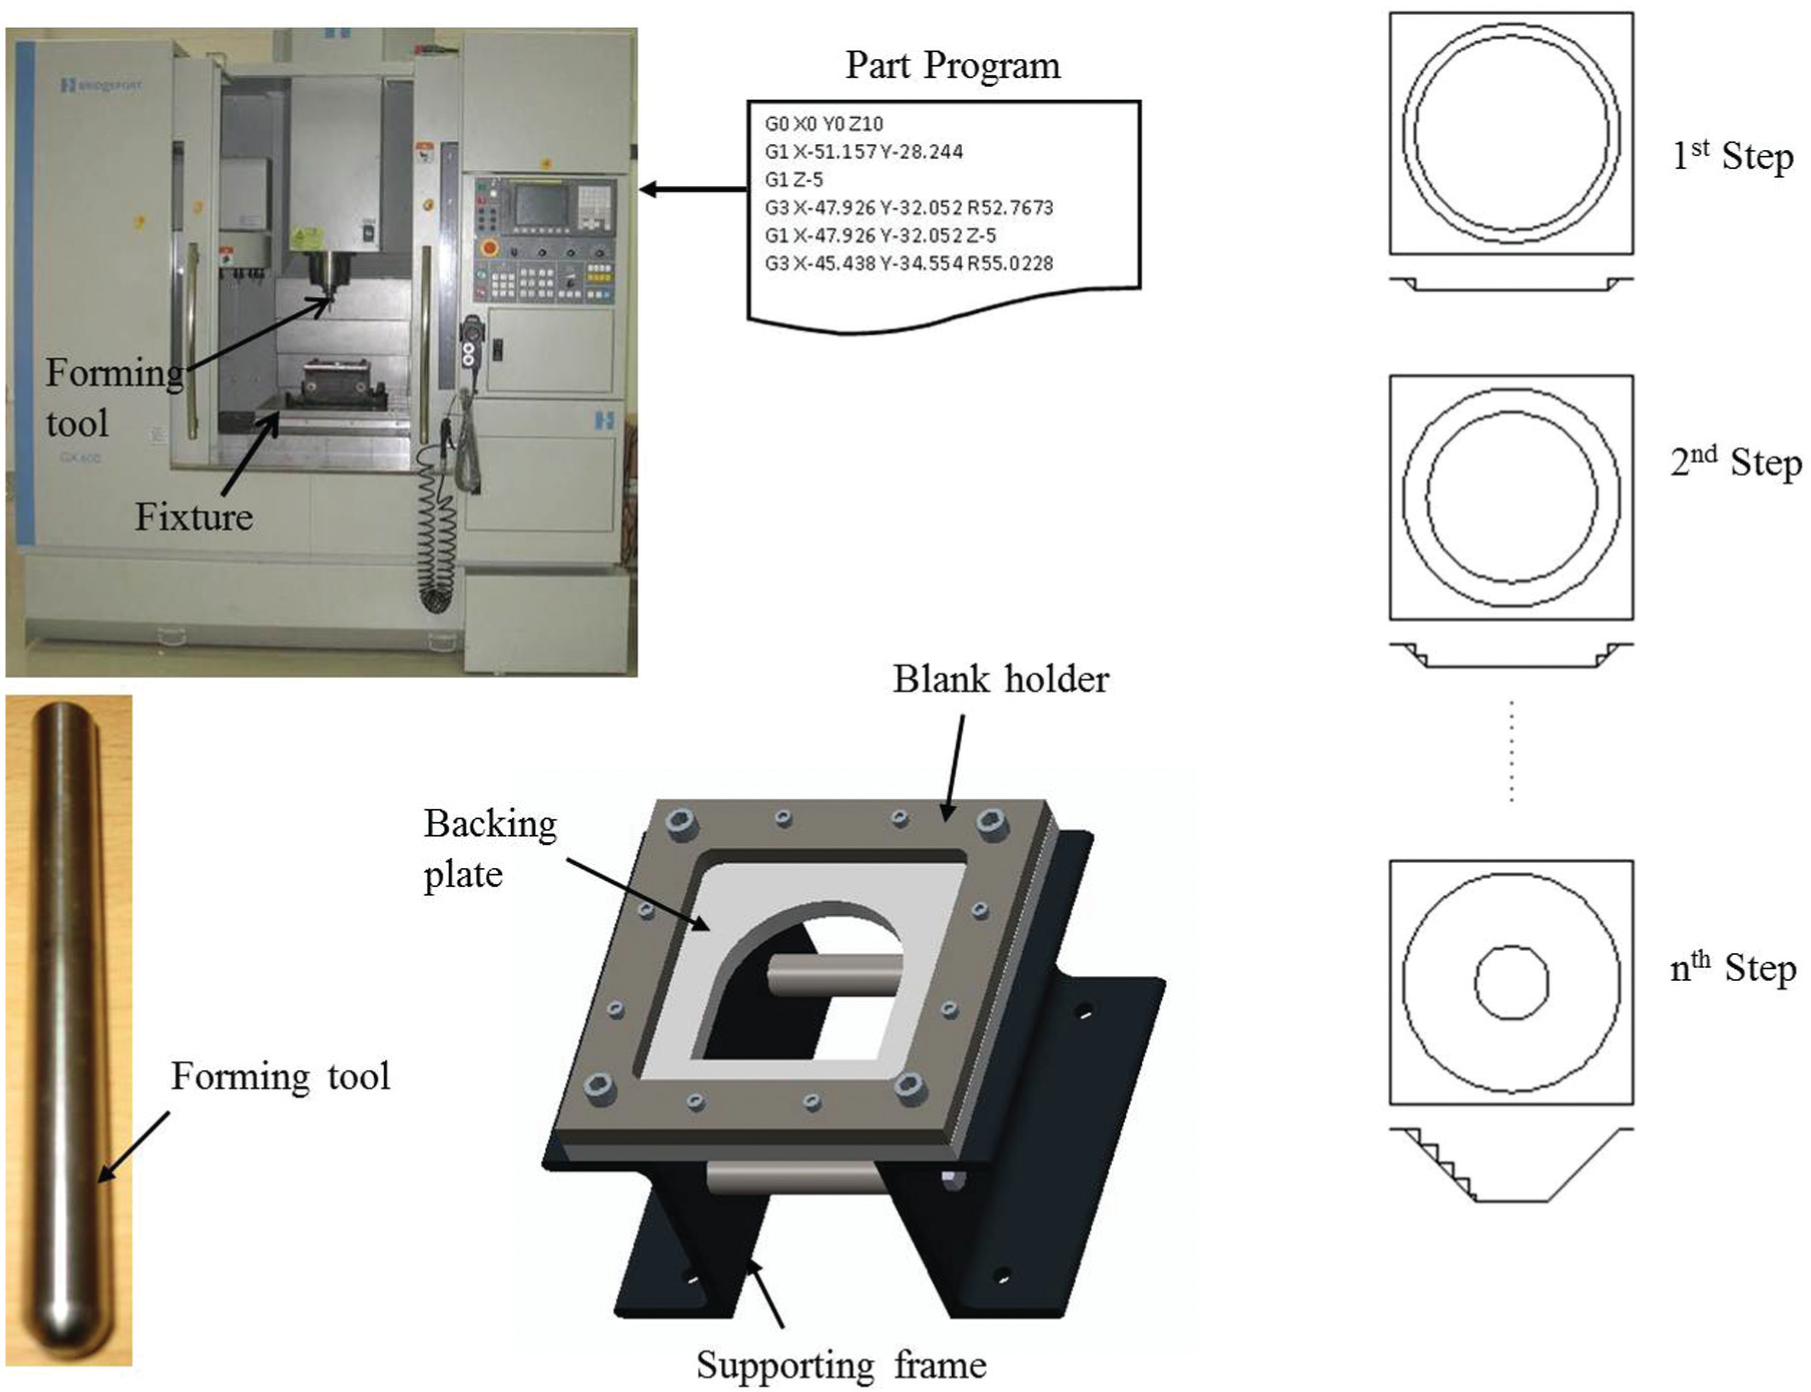
Basic elements of incremental forming process: (a) CNC machine with fixture and forming tool and (b) steps in forming the geometry in ISF.
Along with the advantages, ISF has its limitations in terms of part quality, dimensional accuracy and processing time. The surface finish and processing time will get affected by various process parameters, namely, tool diameter, step depth, wall angle, feed rate and lubrication. Good surface finish and less production time are the most important requirements for high productivity and low manufacturing cost. There was extensive literature related to studies on the effect of process parameters on surface roughness in conventional machining processes such as turning and milling.2–5 However, the studies on surface roughness of parts produced in incremental forming are limited.
Hagan and Jeswiet 6 studied the effect of step depth and spindle speed on mean peak-to-valley height in incremental forming, by forming Al 3003 sheet into 45° wall angle conical frustum. They observed an exponential increase in the mean peak-to-valley height with step depth, but spindle speed had a very little effect. They also proposed an analytical model (equation (1)) to predict the peak-to-valley height (Rt) in CNC incremental forming based on available equation for shear forming
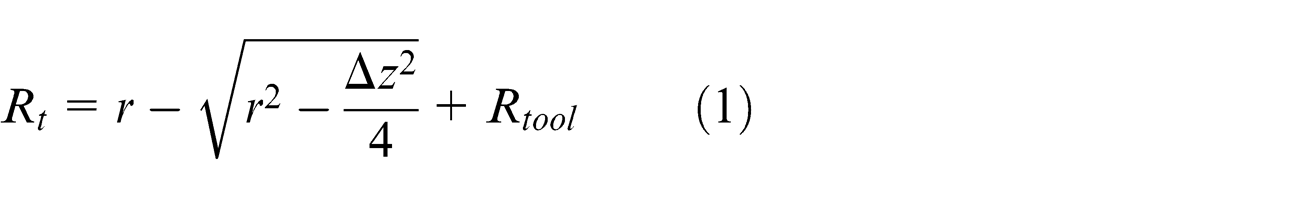
where Δz is the step depth, r is the tool radius and Rtool is the profile left by the tool after all waviness has been removed.
Attanasio et al. 7 studied the effect of tool path on surface quality and dimensional accuracy in two-point incremental forming. For this study, they have chosen two different tool paths: (1) tool path with constant step depth and (2) tool path having variable step depth with imposed restriction on scallop height. Bhattacharya et al. 8 studied the effect of process parameters on formability and surface finish in single-point incremental forming (SPIF) of Al 5052. They observed a decrease in surface roughness with an increase in tool diameter and decrease in surface roughness value with increase in wall angle for all step depths. Surface roughness increased first with an increase in step depth up to a certain wall angle and then decreased. Cavaler et al. 9 studied the effect of process parameters and tool coating on surface roughness in SPIF of AISI 304L austenitic stainless steel. They observed a decrease in surface roughness with an increase in step depth. Also, higher surface roughness was observed with uncoated tools compared to coated tools. Rattanachan and Chungchoo 10 studied the effect of tool radius on surface roughness in SPIF of dome shape using DIN 1.0037 steel. The radius of the tool was varied from 2.5–5 mm and good surface finish was observed with larger diameter tool.
Durante et al. 11 studied the effect of tool rotational speed and direction of tool rotation on friction, forces, temperature and surface roughness. They found that these parameters had a negligible effect on surface roughness. Hamilton and Jeswiet 12 investigated the effect of high feed rates and spindle speeds on orange peel effect, microstructure and thickness distribution. They proposed a mathematical model to predict the orange peel effect in ISF using measured roughness values and using forming parameters. Durante et al. 13 developed analytical models for predicting average roughness and maximum roughness of incrementally formed parts. They validated the developed models by forming pyramidal frustums with AA7075 T0 aluminum alloy.
Hussain et al. 14 investigated suitable tool material and lubricant for negative incremental forming of pure titanium sheet. From the studies of surface roughness, scanning electron microscopy and energy dispersive spectroscopy, they found that high-speed steel (HSS) tool with molybdenum disulfide (MoS2) with petroleum jelly in a specific proportion is producing good surface quality. De Bruyn and Treurnicht 15 investigated the effectiveness of different solid-state lubricants in incremental forming of Ti-6Al-4V. They found that molybdenum disulfide and graphite are good choices for significant improvement in surface finish of the parts.
Apart from surface finish, another major limitation in incremental forming is the processing time. Very few studies were done on the effect of process parameters on processing time. Sarraji et al. 16 studied the effect of process parameters on manufacturing time using L18 Taguchi orthogonal array. Hussain et al. 17 investigated the effect of various process parameters on form accuracy of parts in SPIF. They used central composite rotational design to plan the experiments and developed the regression equation. They further optimized the objective function for minimum profile error using Derringer–Suich multi-criterion algorithm for numerical optimization.
The literature review revealed that very few studies were made to understand the effect of process parameters on surface roughness and processing time in ISF. Most of the investigations focused on studying the effect of two or three process parameters on selected response variables in incremental forming of aluminum alloys. In this article, five different process parameters, namely, tool diameter, step depth, wall angle, feed rate and type of lubricant are considered as input process parameters after detailed literature review. The experiments are planned using Box–Behnken design, and each parameter is varied over three levels. Some trial experiments are performed before to set limits of the process parameters. The experiments are performed to study the effect of process parameters on average surface roughness (Ra) and manufacturing time (T). Regression equations are developed for the response variables using response surface methodology. Furthermore, the developed models are used for multi-objective optimization using non-dominated sorting genetic algorithm-II (NSGA-II). The algorithm provides feasible input sets to minimize the surface roughness and processing time.
Experimental work
Design of experiments
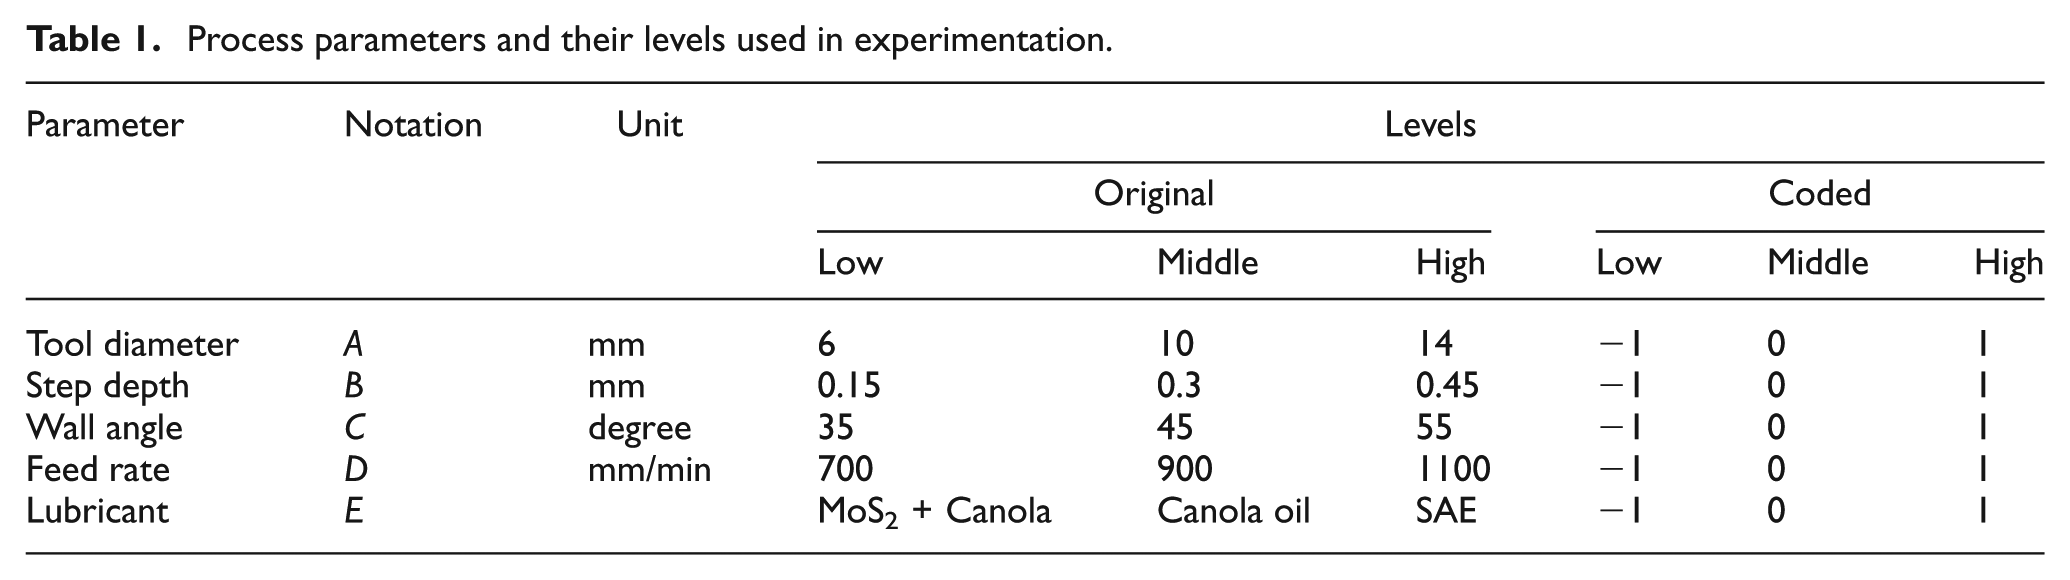
Design of experiment (DOE) is an effective and efficient tool to understand the effect of process parameters and to optimize the manufacturing processes with minimum number of experiments. Factorial designs, Taguchi orthogonal arrays and response surface methodology are widely used DOE techniques in literature to study the performance of various machining operations.18–20 In this study, Box–Behnken design was used to plan the experiments. This is one of the most widely used response surface designs when factors are 4 or more. In this design, each factor is varied over three levels and can fit a quadratic model. Three-dimensional representation of Box–Behnken design is shown in Figure 2. The five-factor Box–Behnken design involves 10 blocks, and in each block, two factors are varied through the four possible combinations of high and low, while the other factors are kept at the central values. This gives totally 40 experiments; in addition to this, six repetitive experiments are performed, with settings corresponding to the center of the process space. The repetitive experiments are useful in estimating the variance (standard deviation) in the responses. The process parameters along with their limits are shown in Table 1.
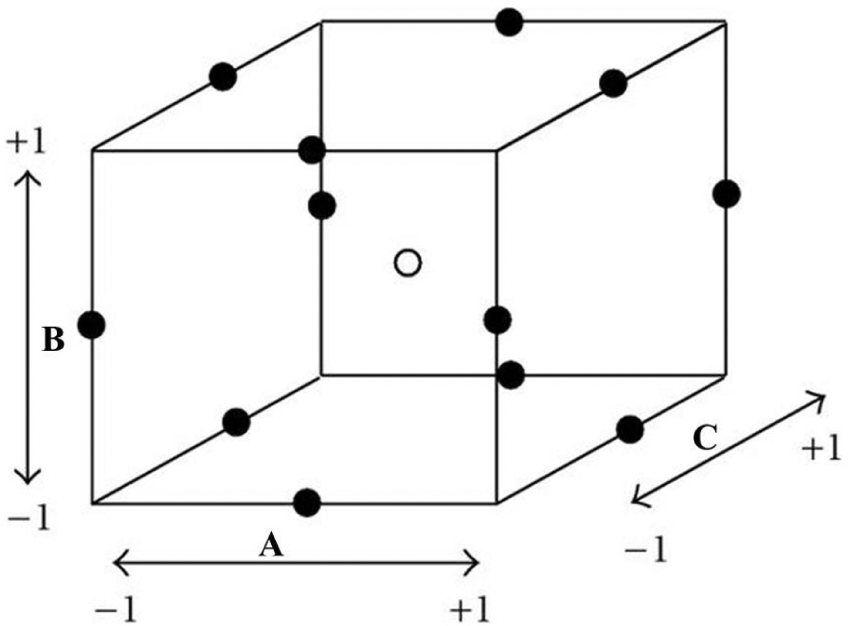
Three-dimensional representation of five-factor Box–Behnken design.
Process parameters and their levels used in experimentation.
Experimental procedure
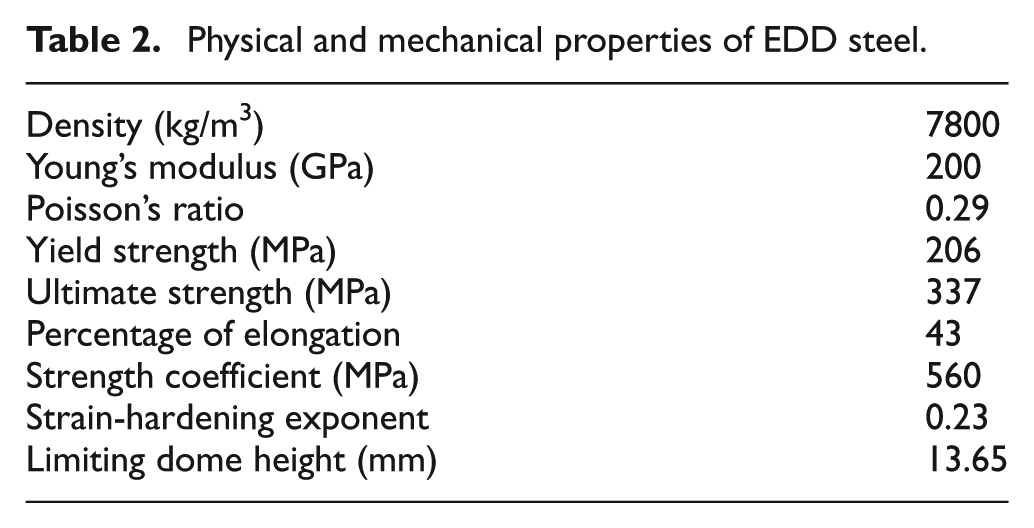
The incremental forming experiments were carried out on Hardinge 3-axis CNC milling machine. The machine has a spindle speed range of 1–8000 r/min and maximum feed rate of 12,000 mm/min. In this work, extra deep drawing (EDD) steel sheet of 250 mm × 250 mm × 1 mm was used as a blank material. This material has good formability and dent resistance and widely used in automotive industry. The mechanical and physical properties of the material are given in Table 2. The geometry of the part used for analyzing the surface roughness and manufacturing time is shown in Figure 3. The blank was formed into the required shape using hemispherical headed tools made of EN-36 material. The tools are heat treated to 60 HRC to reduce the wear and abrasion. The forming tools are polished with fine grade abrasive paper and lapping paste to minimize the friction and plowing action between the tool and blank interface. Furthermore, three different lubricants are used to minimize the friction and to improve the surface finish of the part. These three are as follows: (1) canola oil, which is derived from natural canola seeds; (2) mixture of 5% (w/v) of molybdenum disulfide (MoS2) powder of particle size 100 µm or less in canola oil and (3) commercially available SAE-40 oil. The required tool trajectories to deform the sheet into the desired shape are generated using pro-manufacturing software. The roughness of formed parts was measured by Surtronic 25 instrument of Taylor Hobson-make shown in Figure 4. The surface roughness was measured at five different locations on the formed geometry to improve the accuracy of measurement. The average value was reported as the surface roughness of the formed component. For all the measurements, the evaluation length is taken as 4 mm and cut-off length as 0.8 mm. The manufacturing time of all the formed geometries was measured using stop watch. The formed parts are shown in Figure 5.
Physical and mechanical properties of EDD steel.
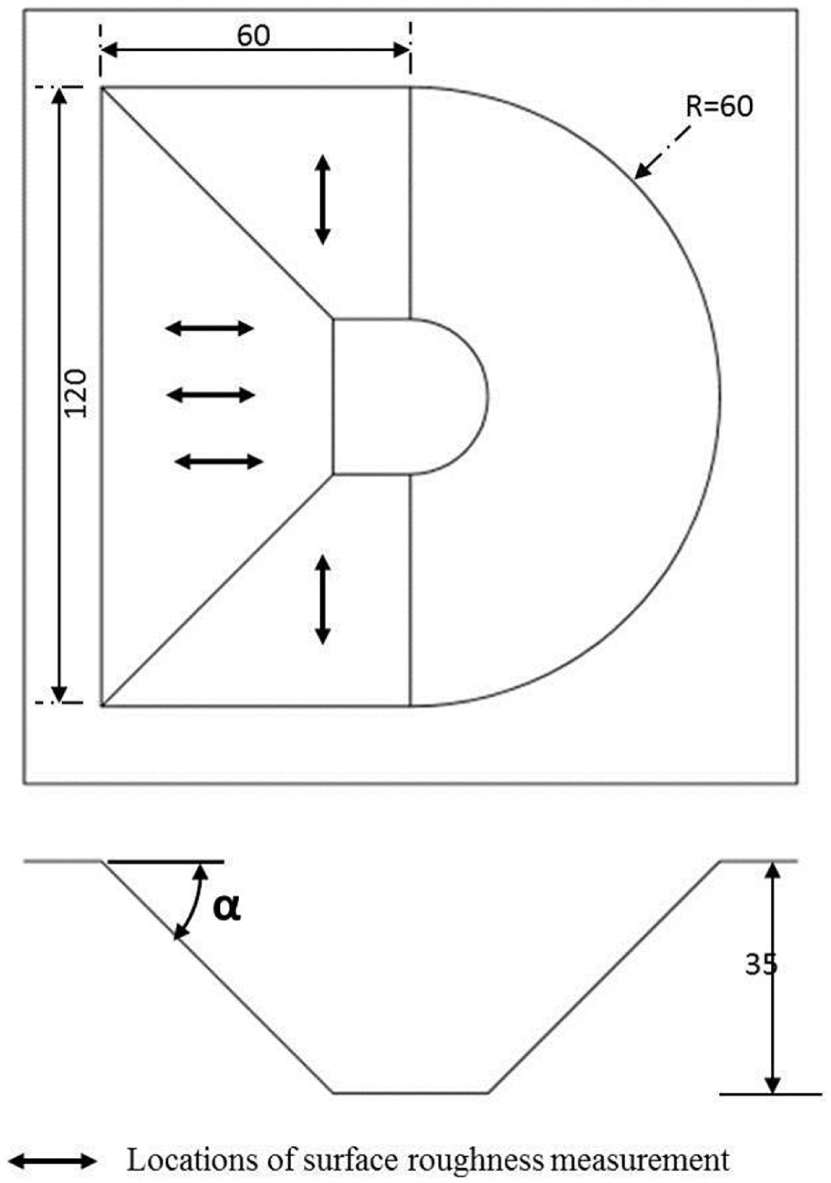
Geometry of the part formed for the analysis of surface roughness and manufacturing time.
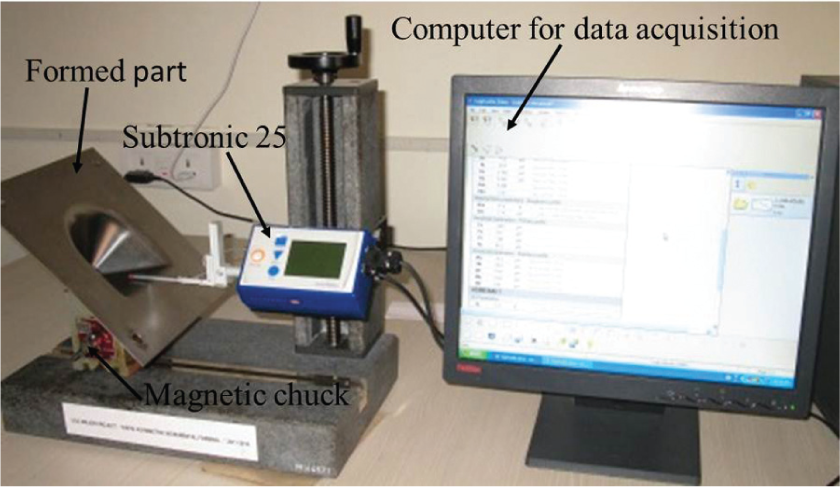
Experimental setup for surface roughness measurement.
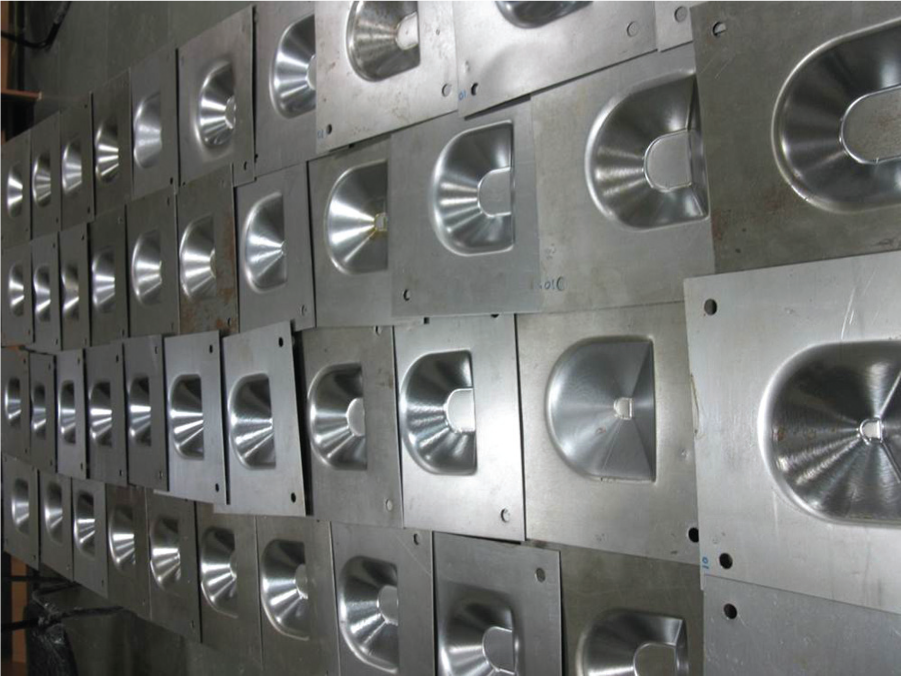
Formed parts with different process parameters.
Results and discussions
Mathematical modeling
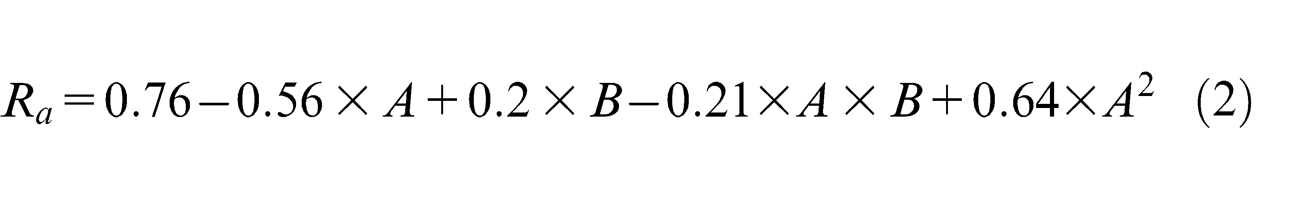
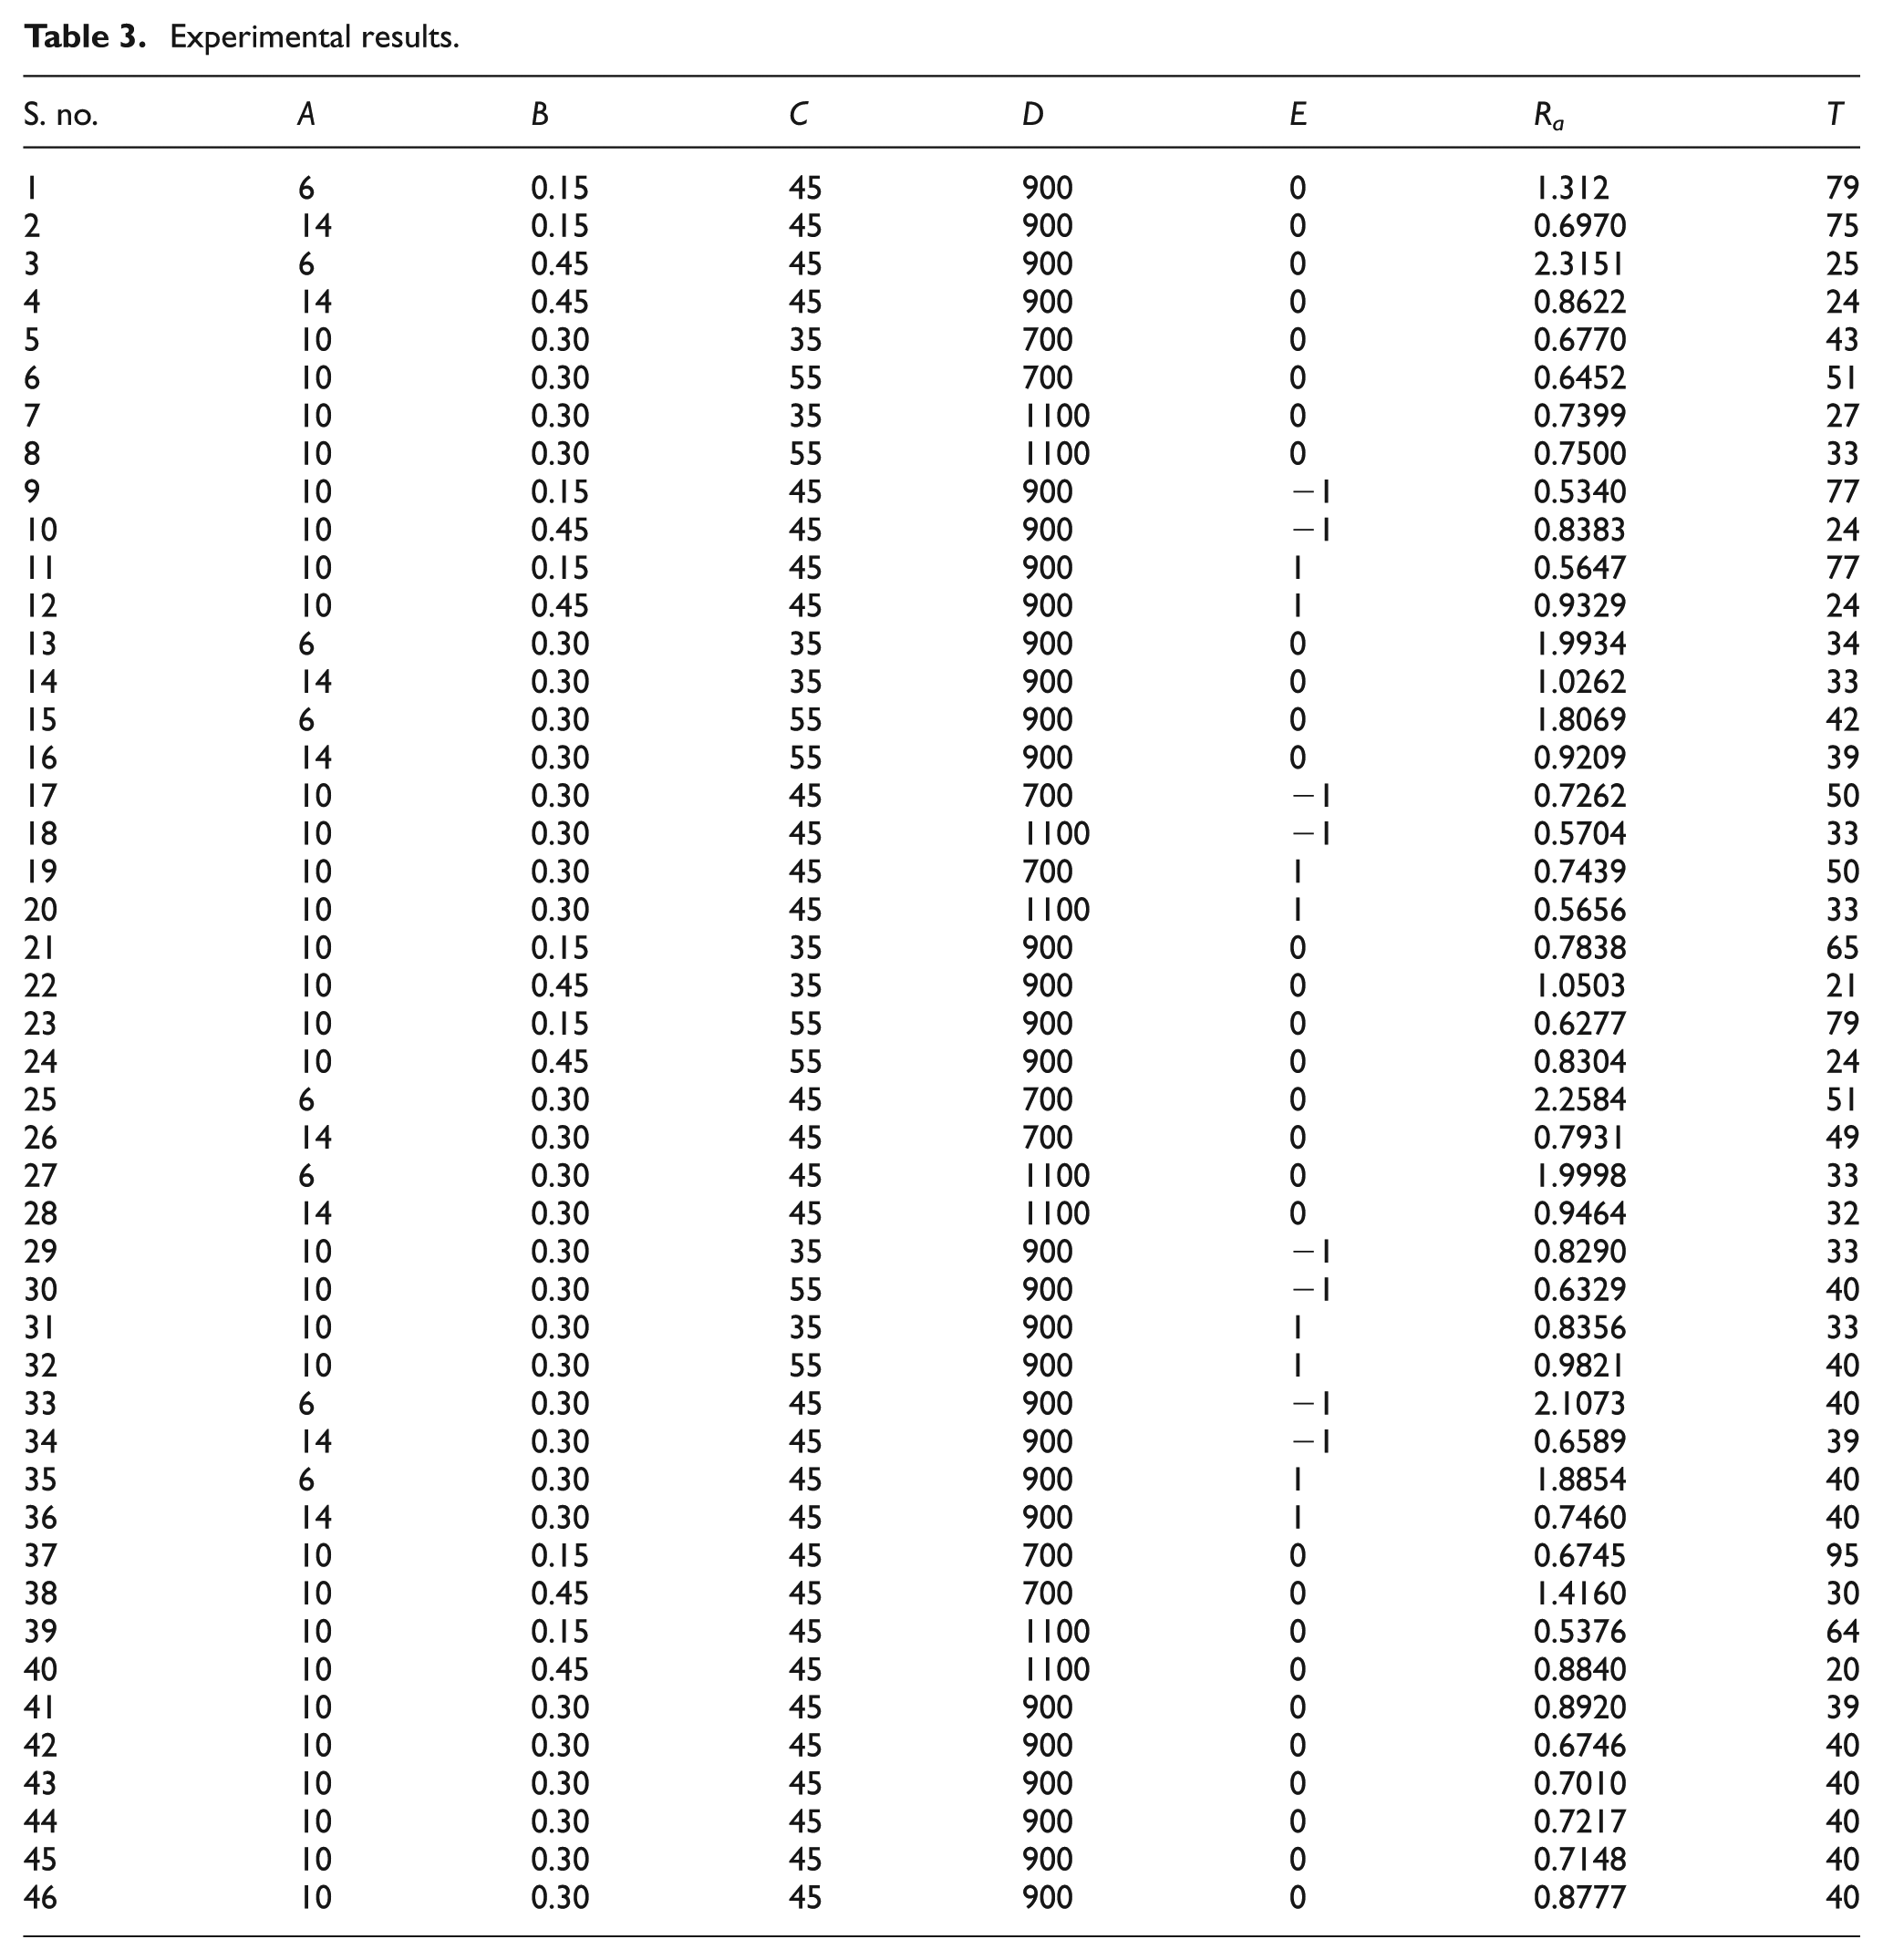
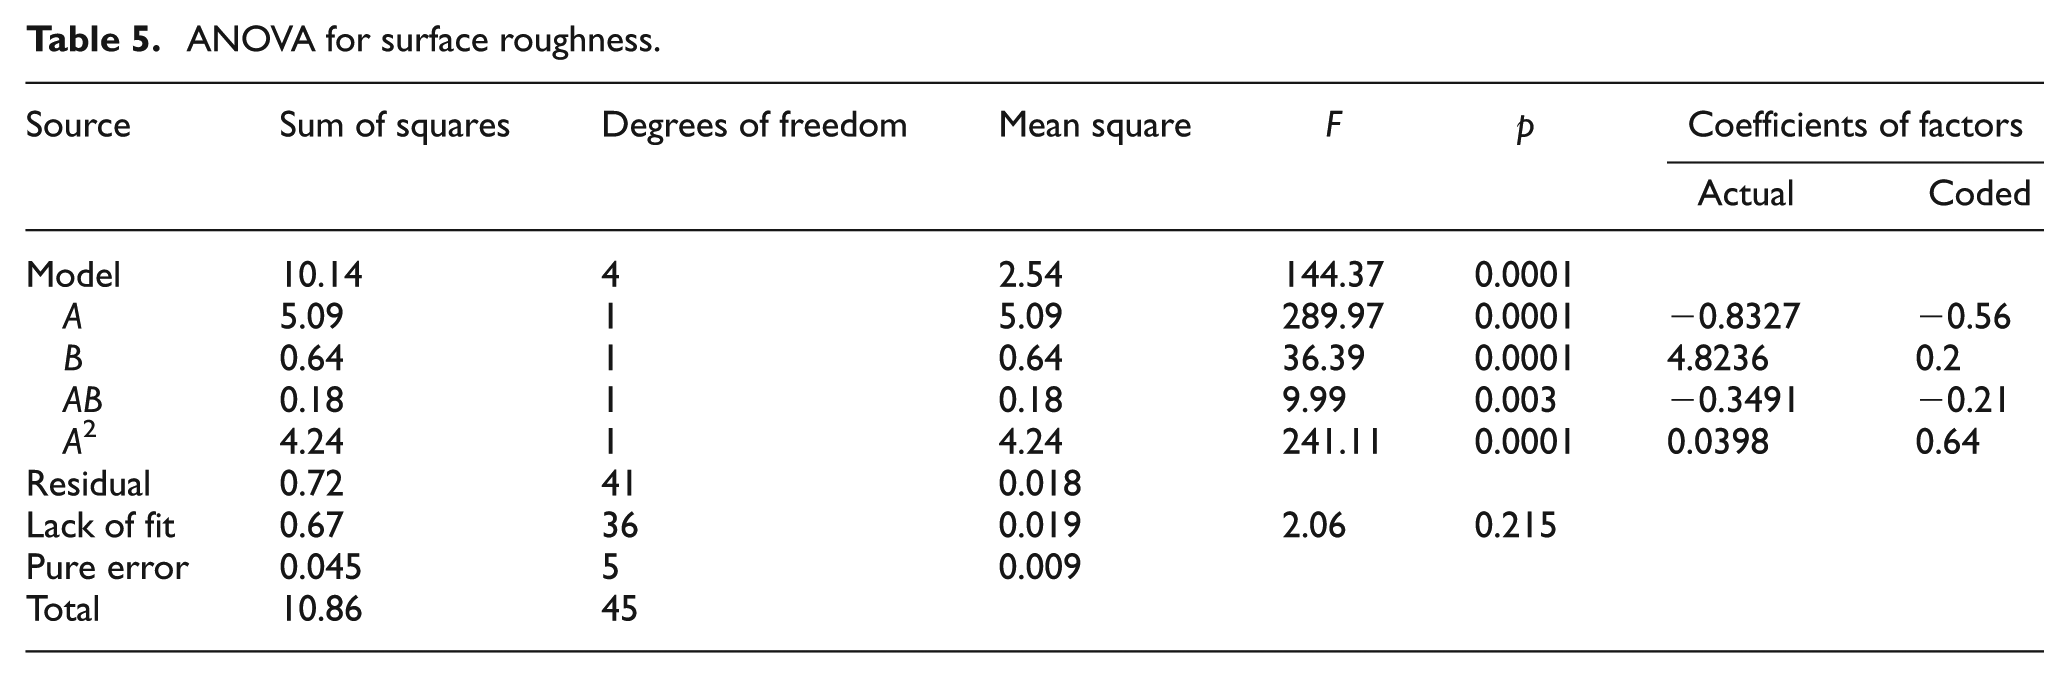
The surface roughness and manufacturing time data obtained from incremental forming experiments using Box–Behnken design (Table 3) have been analyzed using Design-Expert software. The summary of model statistics is given in Table 4. The results reveal that the quadratic model is the most appropriate to analyze the surface roughness as well as the manufacturing time in ISF. The analysis of variance (ANOVA) table for quadratic model of Ra was shown in Table 5. The value of p in the ANOVA table is less than 0.05—this indicates that the regression model is statistically significant with a confidence interval of 95%. In the quadratic model, linear, quadratic and interaction terms are significant as their p value is less than 0.05. Estimated coefficients of regression equation for Ra were given in Table 5 in coded and uncoded units. From this table, the most significant factors that influence the surface roughness are found to be A, B, AB and A2. The ANOVA results reveal that there are more number of insignificant factors in the model. Reducing the number of insignificant factors from the model can improve the accuracy of prediction. Thus, the model has been reduced using backward elimination algorithm. The response surface equation of Ra after model reduction is given by equation (2). The high correlation coefficient value (R2 = 0.9337) of the developed model indicates that the developed regression equation provides a very good relationship between the input parameters and response (Ra). Furthermore, the adequacy of model has been tested with normal probability plot of the residuals. The normal probability plot shown in Figure 6(a) reveals that the calculated residuals (difference between the experimental and predicted values of response variable) are falling along a straight line. This indicates that the errors are following normal distribution and the developed model is reasonably acceptable
Experimental results.
Summary of model statistics.
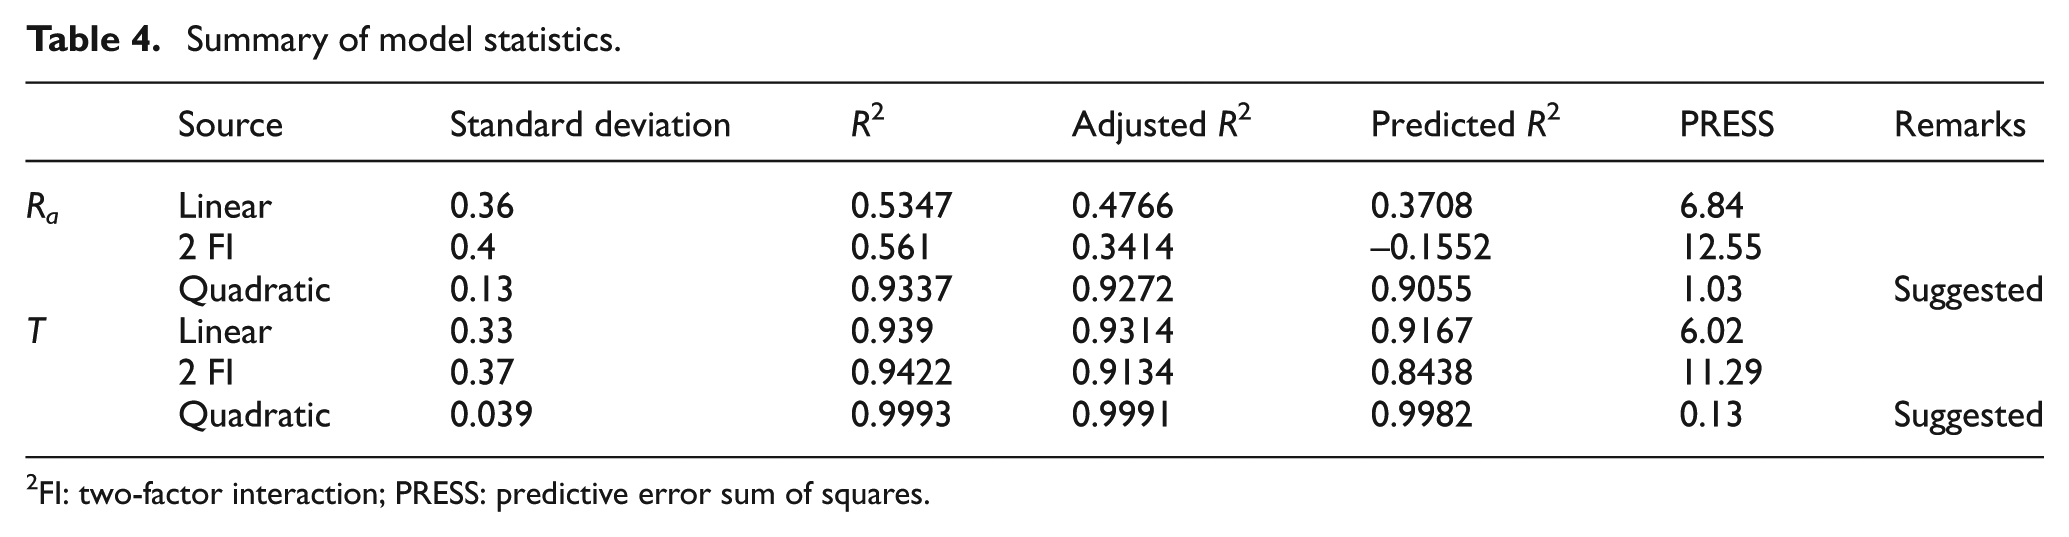
FI: two-factor interaction; PRESS: predictive error sum of squares.
ANOVA for surface roughness.
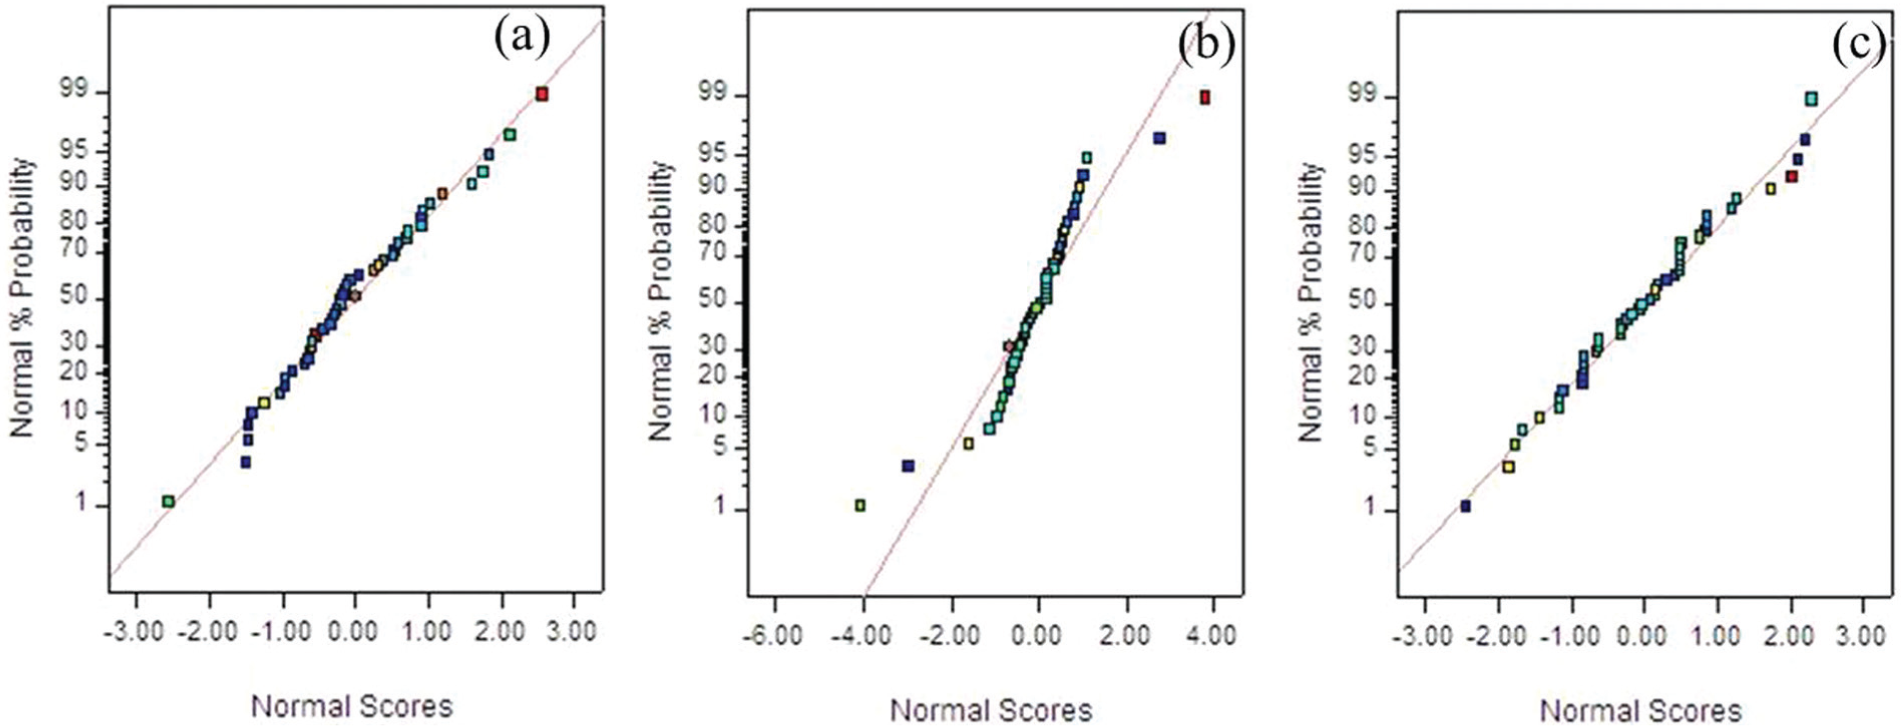
Normal probability plot of residuals for (a) Ra, (b) T and (c) T after transformation.
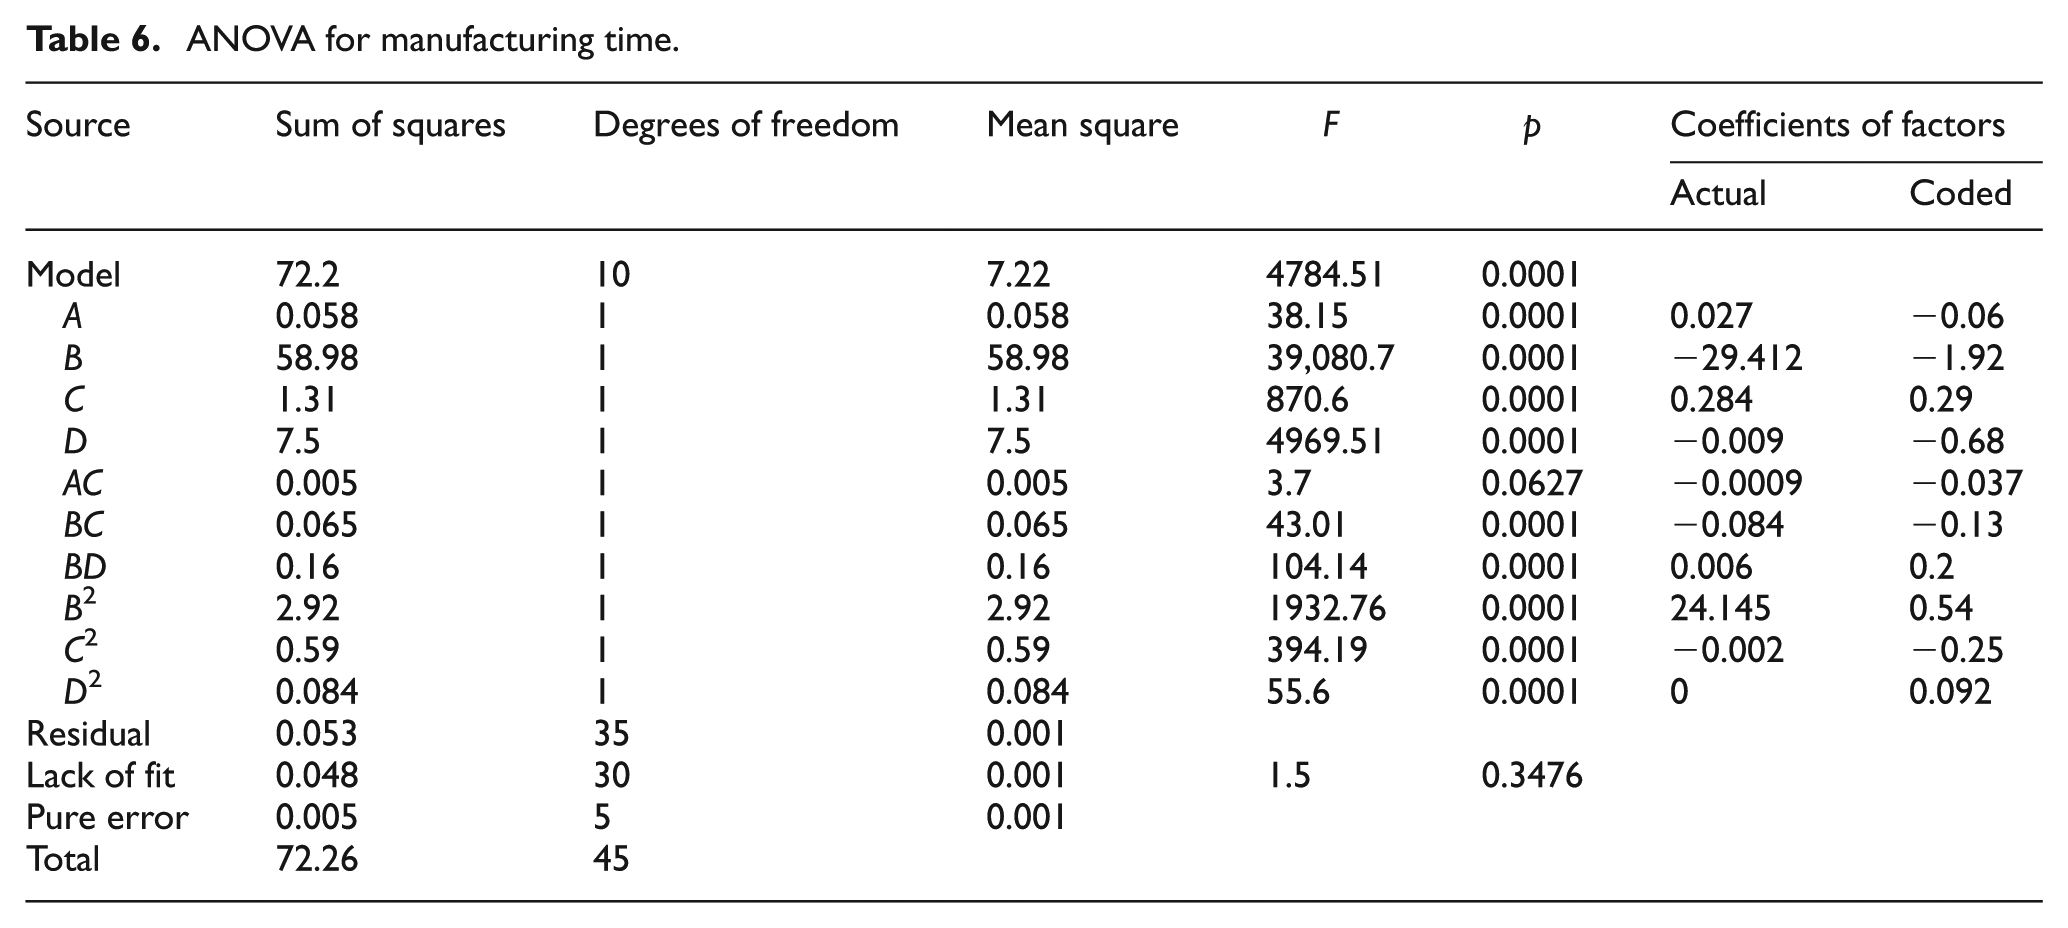
The ANOVA results for quadratic model of manufacturing time are given in Table 6. The results indicate that the developed model is suitable for predicting the manufacturing time (p < 0.05) and lack of fit is insignificant (p > 0.5). However, the normal probability plot of the residuals shown in Figure 6(b) indicates that the residuals are deviating more from the straight line. This shows that the residuals are not following the normal distribution. It is also a fact that the processes involving time metrics (cycle time, waiting time in queue, calls per hour, etc) may not follow normal distribution. The most common method to deal with the non-normal data is transforming the data. Thus, the manufacturing data have been transformed using Box–Cox power transformation. In Box–Cox power transformation, an appropriate exponent lambda is used to transform the data to normal distribution. The lambda value indicates the power to which all data have to be raised, and its value varies from −5 to 5. The Box–Cox plot of manufacturing time (Figure 7) suggested the lambda value of 0.5 (square-root transformation). The normal probability plot of residuals after square-root transformation is shown in Figure 6(c). All the data points are falling along the straight line indicating that the residuals are following normal distribution, and the model is acceptable for predicting the manufacturing time in ISF.
ANOVA for manufacturing time.
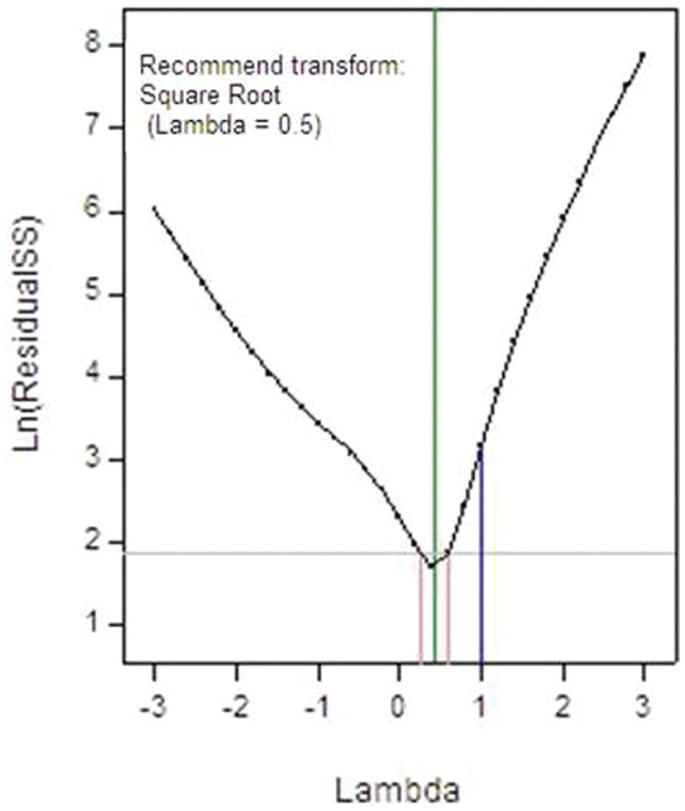
Box–Cox plot for manufacturing time.
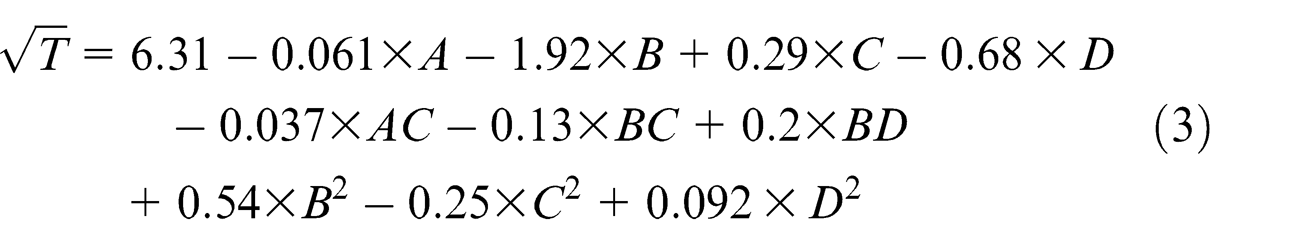
The calculated values of regression equation coefficients for square root of manufacturing time (T) are given in Table 6. The values in the table reveal that the parameters A, B, C, D, AC, BC, BD, B2, C2 and D2 (parameters with p < 0.05) are having significant effect on manufacturing time. To improve the model accuracy, the model has been reduced using backward elimination approach. The response surface model of manufacturing time for reduced quadratic model is given by equation (3). The high R2 value of the model indicates that the developed model establishes a good relation between the input and output parameters. Furthermore
The equations (2) and (3) are subjected to following constraints

Effect of process parameters on surface roughness
Effect of tool diameter on surface roughness
The response surface plot (Figure 8) shows the variation of surface roughness with tool diameter varying from 6–14 mm. From this figure, it can be noted that the surface roughness increases and then decreases with increase in tool diameter. The highest roughness was observed with 6-mm-diameter tool, and it is decreased to a minimum value of 0.633 µm (Figure 9(a)) and again increased with increase in tool diameter. While forming with 6-mm-diameter tool, small wear particles are observed in the forming zone. When the diameter is increased, the overlap between the successive tool path contours is more due to larger contact area, and thus, surface roughness is decreased. However, with increase in diameter beyond a certain value, the larger surface strains are causing the increase in surface roughness. The surface patterns of the formed parts with different diameter tools are shown in Figure 10.
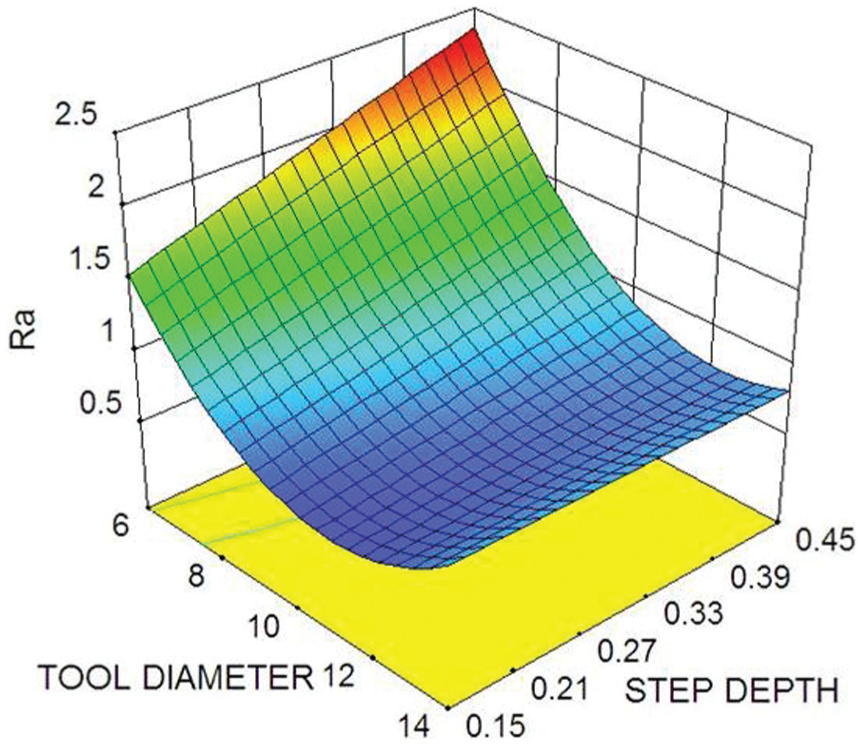
Response surface plots of surface roughness.
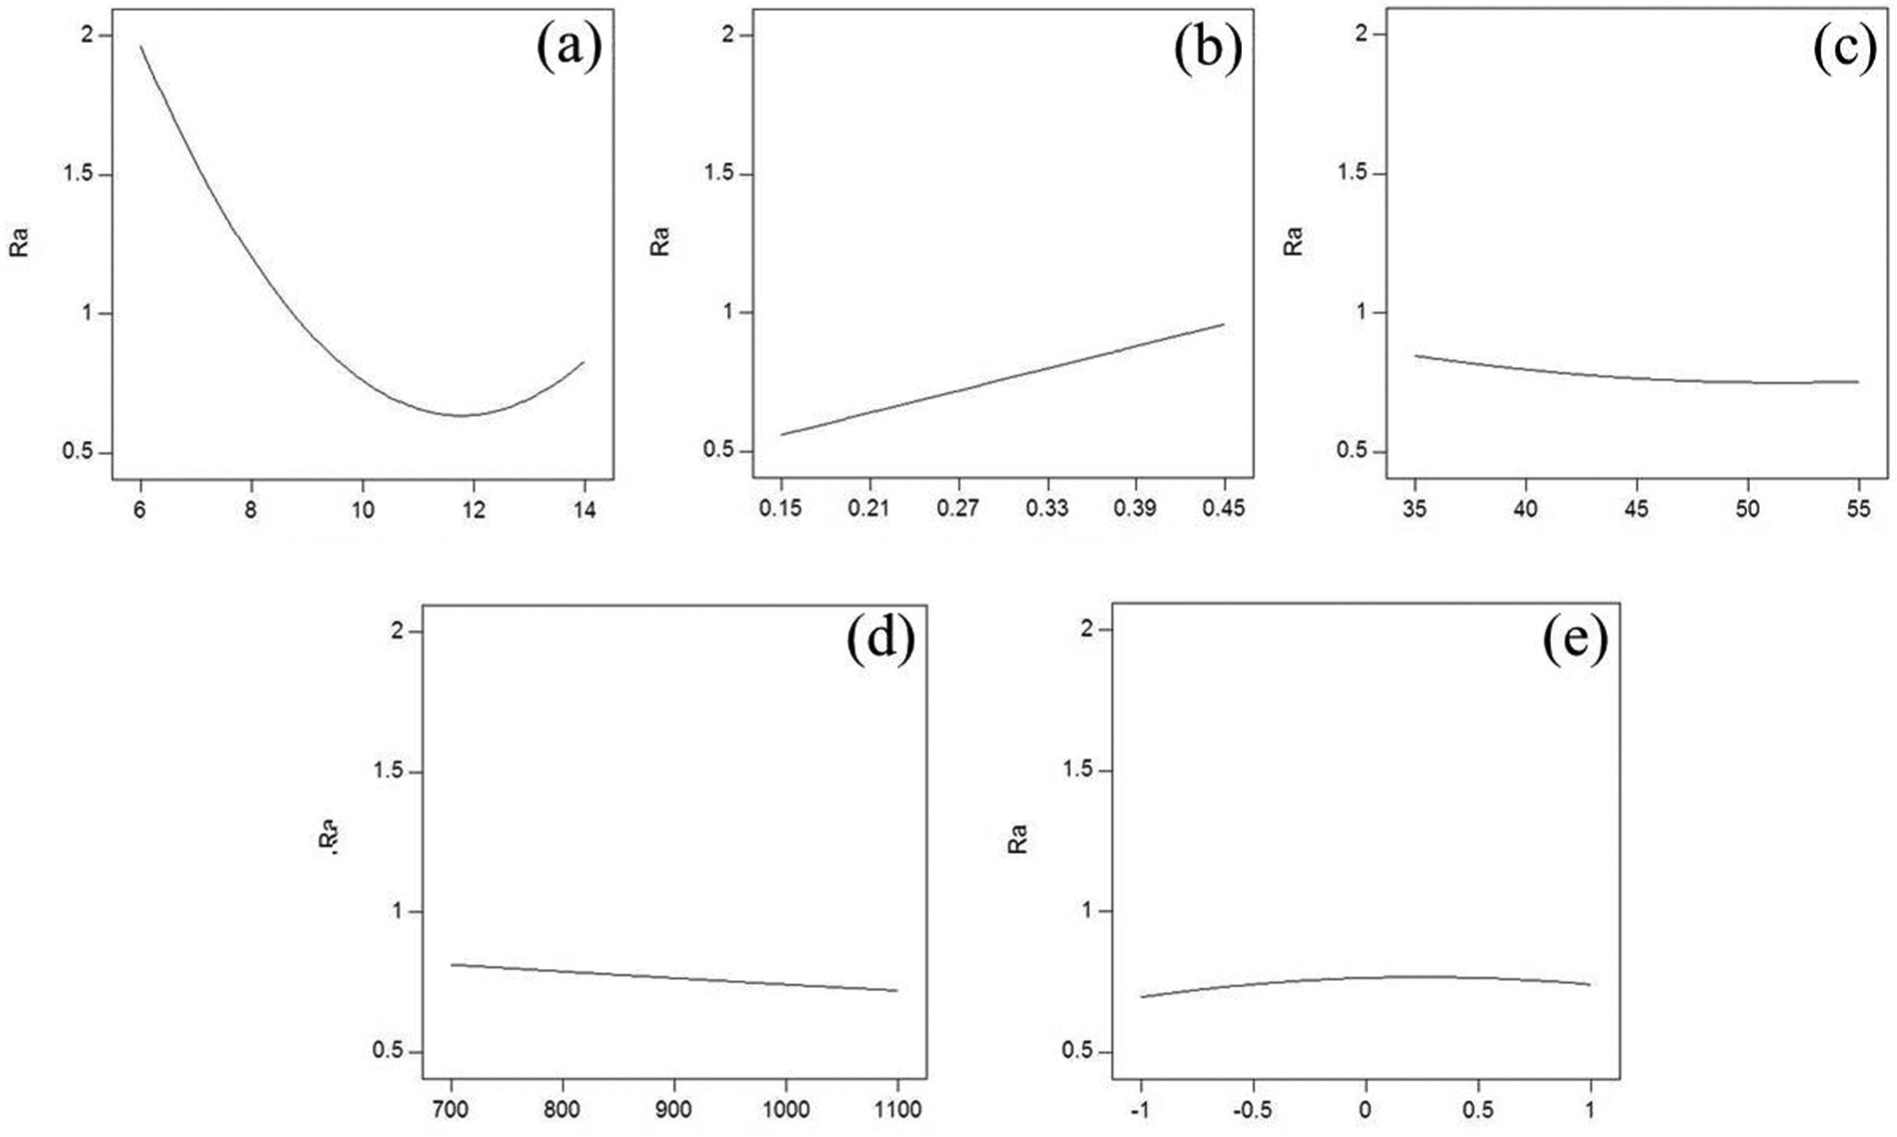
Single-parameter effects on surface roughness: (a) tool diameter (mm), (b) step depth (mm), (c) wall angle (degree), (d) feed rate (mm/min) and (e) lubricant.
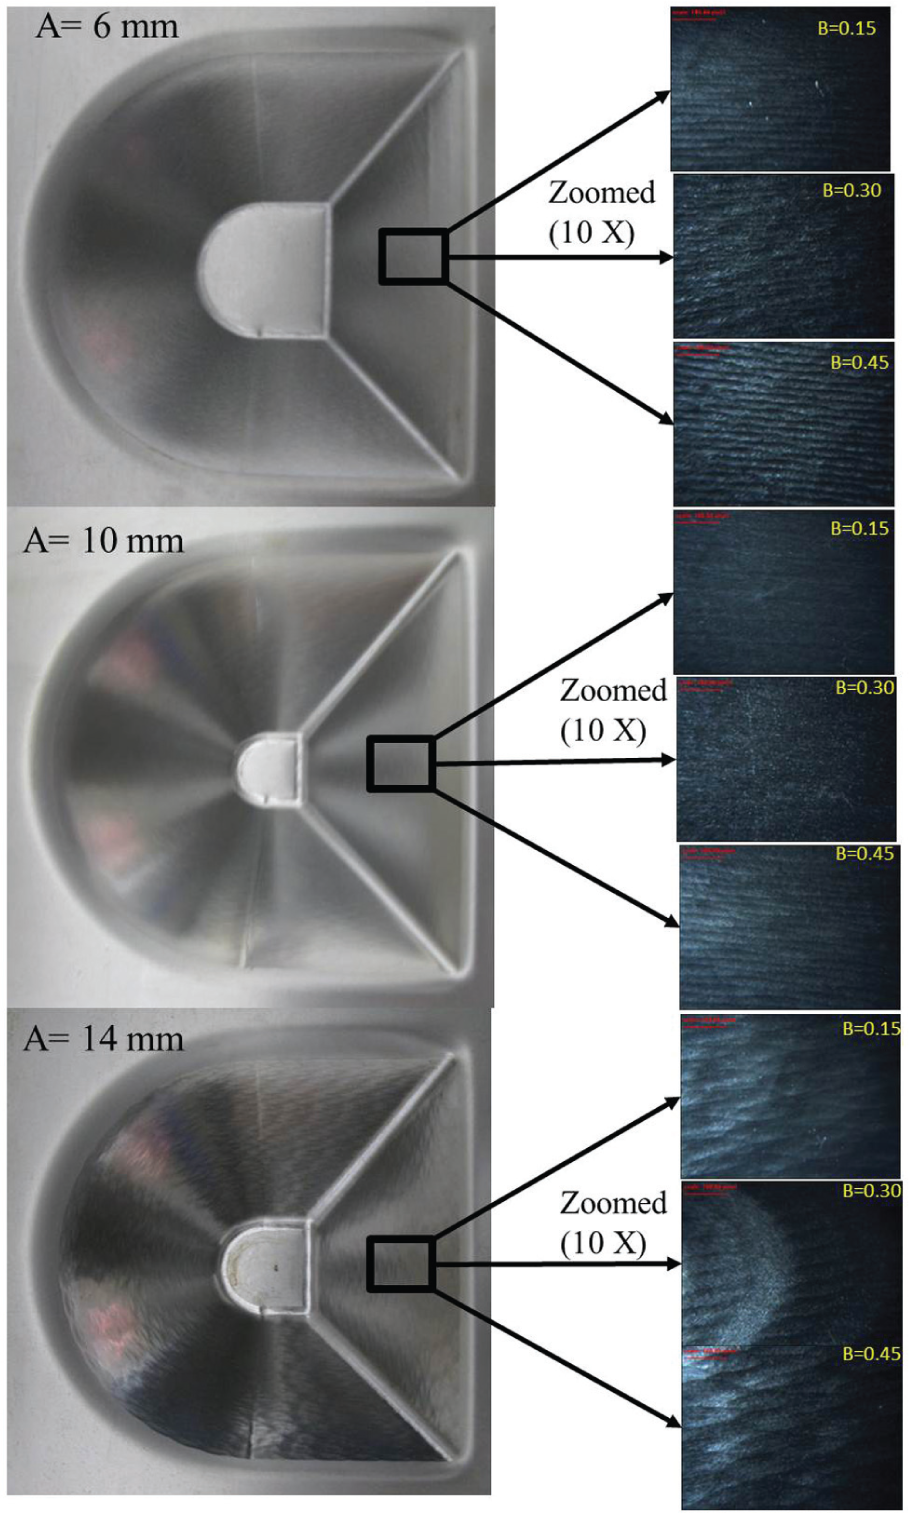
Formed part geometries with tool diameter A and step depth B.
Effect of step depth on surface roughness
In ISF, the tool moves in successive contours to deform the sheet into the required shape. The distance between successive contours is called as step depth. The effect of step depth on surface roughness was shown in Figures 8 and 9(b). From the response surface plots shown in Figure 8, it can be observed that the surface roughness is continuously increasing with the increase in step depth. At smaller step depths, there is more overlap between the successive contours which leads to better surface finish. With increase in step depth, the metal is partially undeformed by the forming tool between successive contours which leads to increase in surface roughness. The surface roughness increased from 0.558 to 0.956 µm over a step depth range of 0.15–0.45 mm keeping other factors at their medium level (Figure 9(b)). Similar observations were made during forming aluminum sheets.6,9 However, Cavaler et al. 9 observed a decrease in roughness with increase in step depth.
Effect of wall angle on surface roughness
To study the effect of wall angle, the angle of the formed part was varied from 30° to 55°. Figure 9(c) shows the effect of wall angle on surface roughness. The increase in wall angle can increase the height of scallop and consequently surface roughness. However, the experimental results reveal that within the selected range of wall angle, it does not have a significant effect on surface roughness of the part formed with EDD steel sheets. This could be due to the more predominant effect of tool diameter and step depth on scallop height than the wall angle. This can be observed clearly in Figure 9(a) showing the maximum roughness of 2.452 µm at tool diameter of 14 mm and step depth of 0.45 mm.
Effect of feed rate on surface roughness
The increase in feed rate generally causes an increase in temperature at tool–sheet interface that leads to an increase in wear rate and surface roughness due to breakage of lubricant film. However, Figure 9(d) indicates that the feed rate in the selected range has insignificant effect on the surface roughness of EDD steel sheets in ISF. When the parts are formed with constant tool diameter, step depth and wall angle of 10 mm, 0.3 mm and 45°, respectively, the surface roughness changed from 0.85 to 0.732 µm for a feed rate range of 700–1100 mm/min.
Effect of lubricant on surface roughness
The lubricant is very essential to minimize the friction between tool–sheet interface and the tool wear in ISF, which consequently deteriorates the surface quality of the formed parts. The effect of lubricant type has been studied with three different lubricants. The results show that the type of lubricant has no significant effect on surface roughness, the maximum variation in surface roughness with different lubricants was found to be 0.045 µm (Figure 9(e)). However, in case of forming high-strength material, the type of lubricant plays a very vital role on surface quality of parts.14,15 In high-strength materials, the lubricant film could break due to high-forming forces and high temperatures. This leads to variations in surface roughness with different lubricants. However, in case of EDD steel sheets, such types of problems were not observed due to low-forming forces and less chance of heat accumulation due to high thermal conductivity of material. Even though the lubricant type does not have major effect on surface roughness, some kind of lubricant is very essential in deformation zone to reduce the friction at tool–sheet interface and consequently to improve the surface finish and formability.
Effect of process parameters on manufacturing time
After surface roughness, another major limitation with ISF process is the long manufacturing time. The effect of process parameters on manufacturing time while forming the part shown in Figure 3 has been studied in this article. The variation of manufacturing time with different process parameters has been shown in Figure 11. A large reduction in manufacturing time was observed with high step depths. This is due to the great reduction in number of contours and consequently total length of the tool path. The manufacturing time varied from 76.89 to 24.34 min for a step depth range of 0.15–0.45 mm (Figure 12(b)). Even though the increase in step depth decreases the manufacturing time, it has negative effect on surface roughness and formability of material. After step depth, feed rate has significant effect on reducing the manufacturing time. Due to high speed of the tool, the manufacturing time was reduced from 50.16 to 32.66 min (Figure 12(d)) for feed rate variation from 700 to 1100 mm/min. The increase in wall angle has increased the forming time due to long tool paths. The length of the tool path was varied from 3 to 4 m for a wall angle change of 35°–55° of the selected geometry. The manufacturing time increased from 34.33 to 40.29 min in the selected range of wall angle keeping all other parameters at their medium level (Figure 12(c)). The increase in diameter of the tool decreased the processing time, but the change is small (Figure 12(a)). The lubricant type has no effect on processing time of the part in ISF.
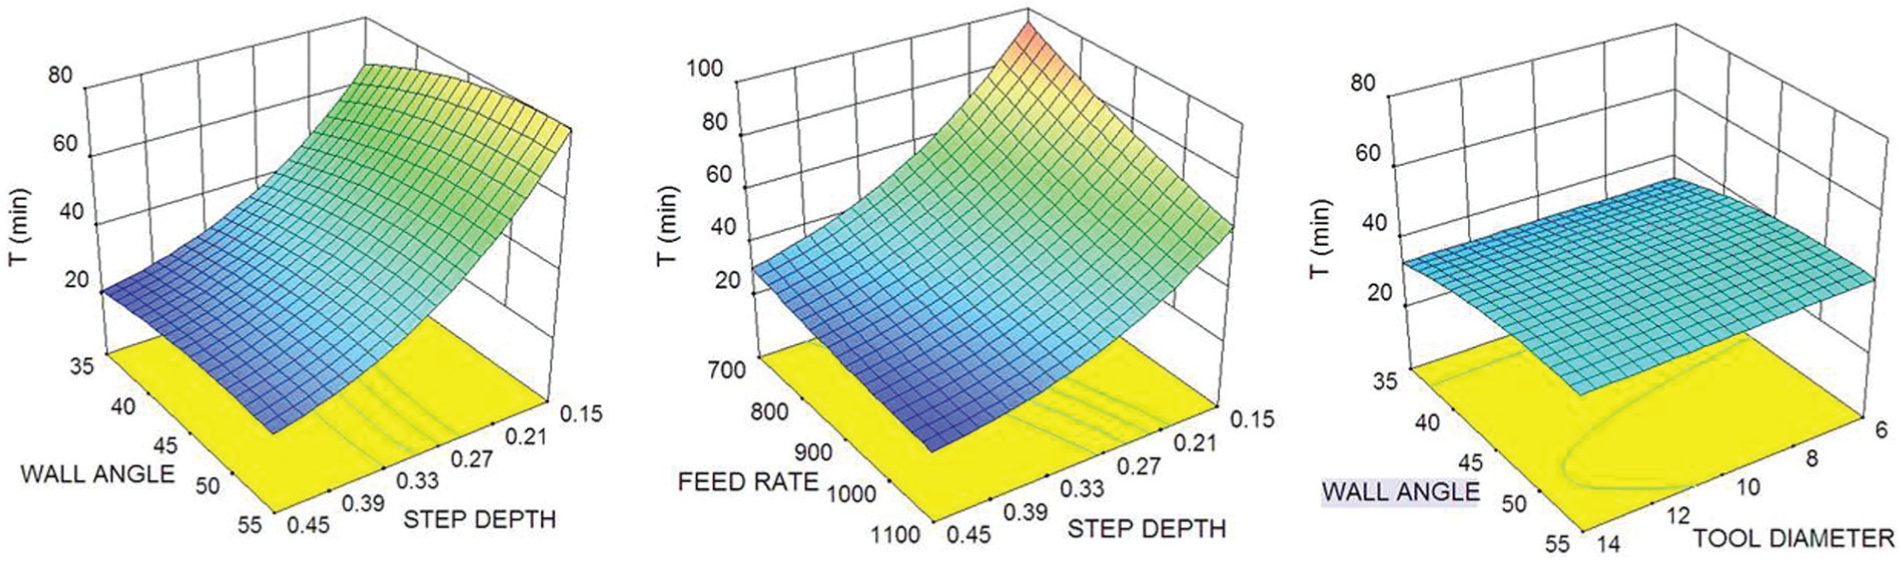
Response surface plots of manufacturing time.
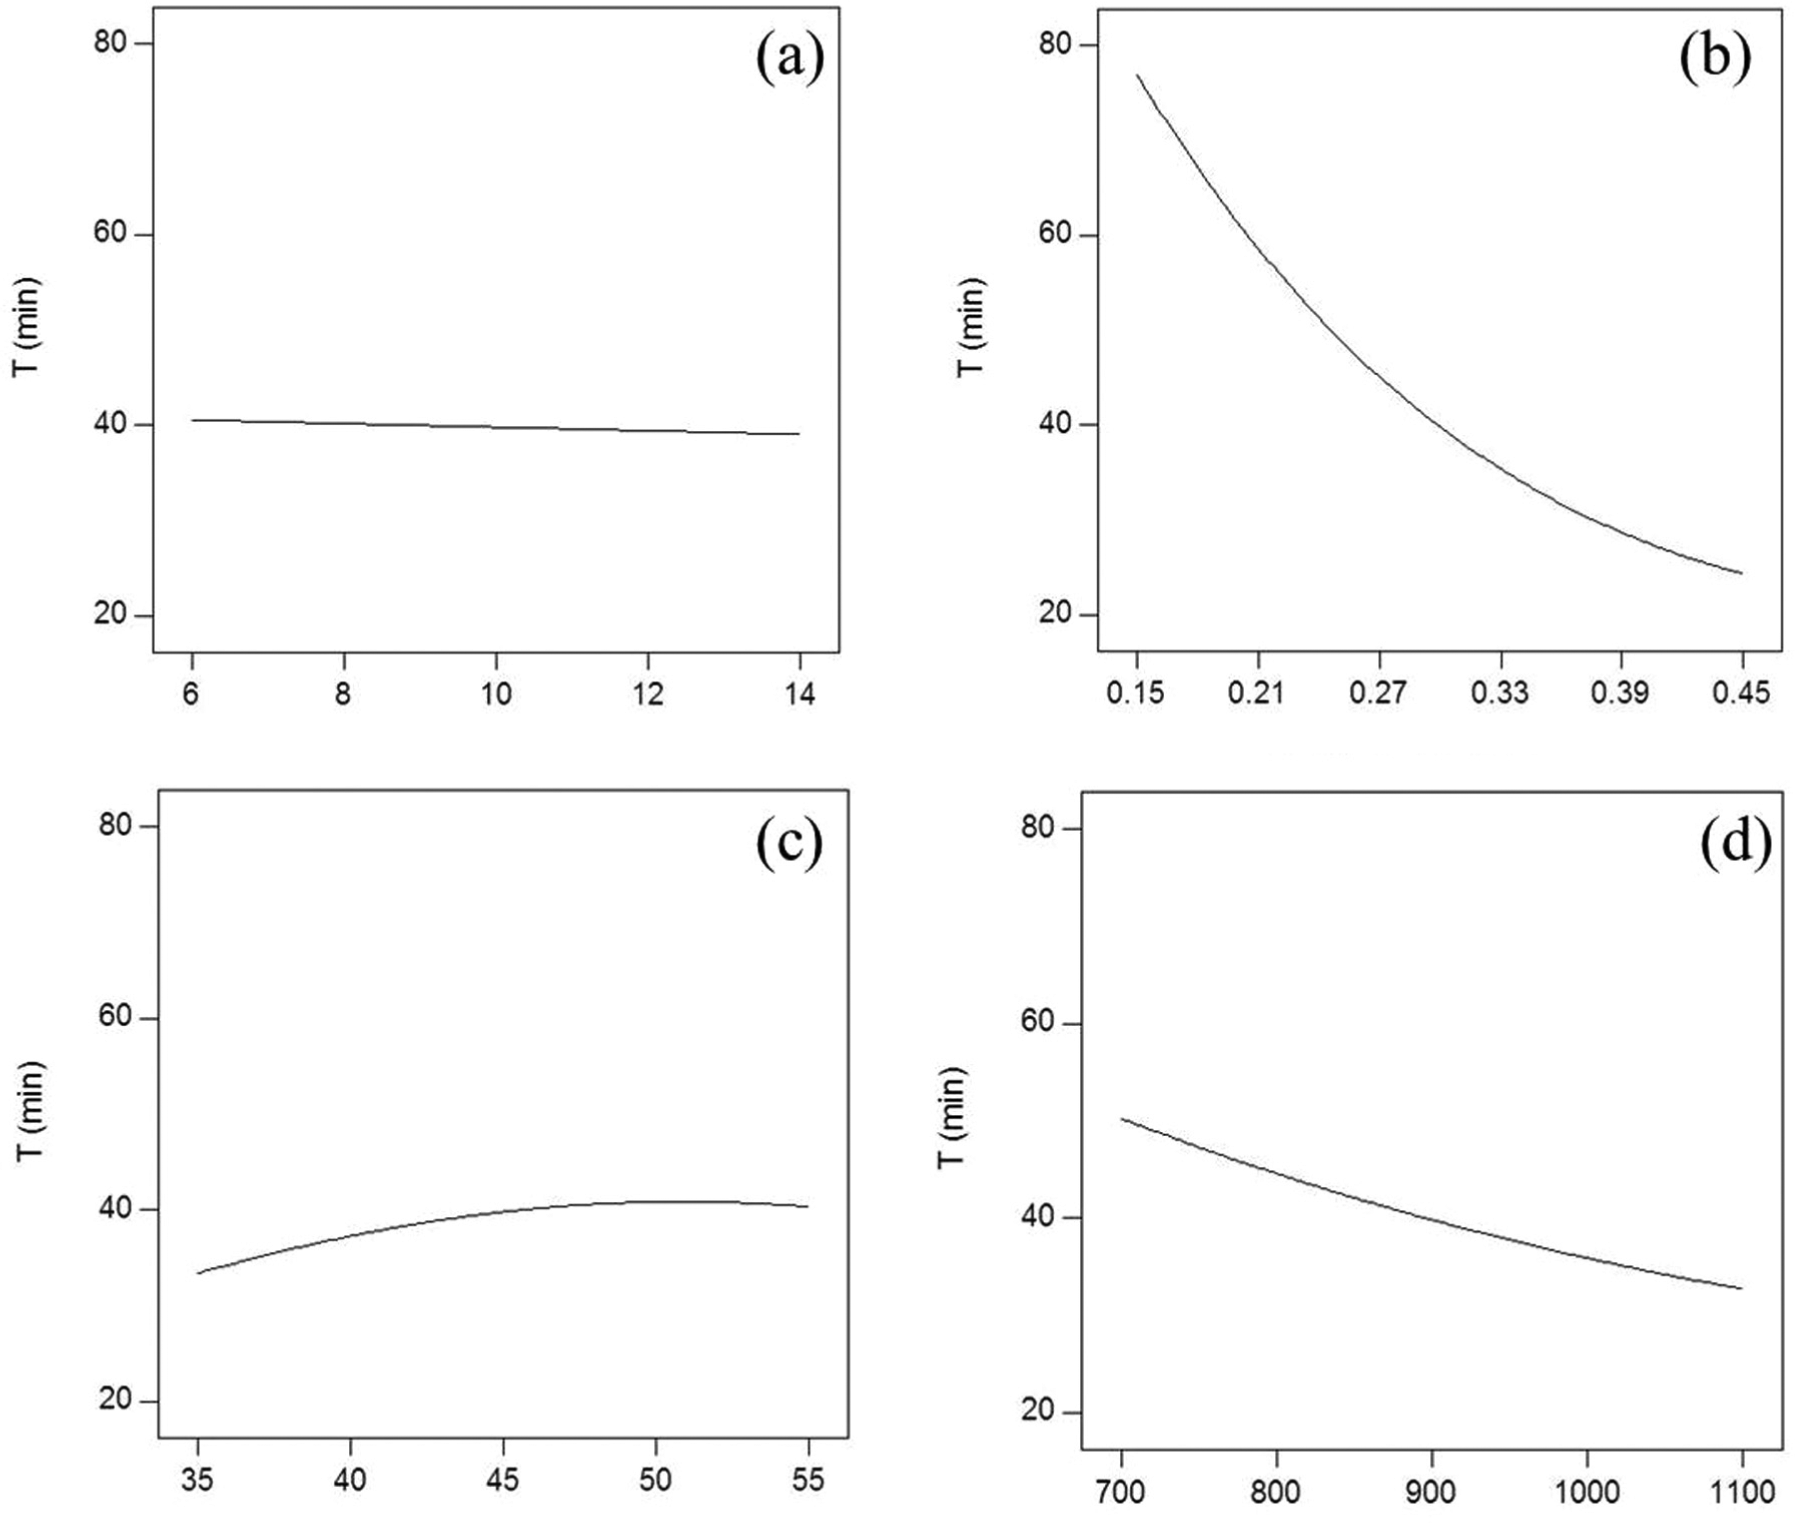
Single-parameter effects on manufacturing time: (a) tool diameter (mm), (b) step depth (mm), (c) wall angle (degree) and (d) feed rate (mm/min).
Multi-objective optimization
In this study, the multi-objective optimization problem was formulated to minimize the surface roughness and manufacturing time in ISF process. For this, tool diameter, step depth, wall angle, feed rate and lubricant type are considered as decision variables. The objective functions and constraints for optimization are given by equations (2)–(4). The two objective functions are optimized simultaneously using NSGA-II algorithm in MATLAB. The values of various parameters used in NSGA-II are shown in Table 7. The NSGA-II generally gives a set of trade-off solutions between the two objective functions. The trade-off solution set obtained from the optimization is shown in Figure 13; in this, x-axis represents surface roughness and y-axis represents manufacturing time.
Control parameters for NSGA-II.
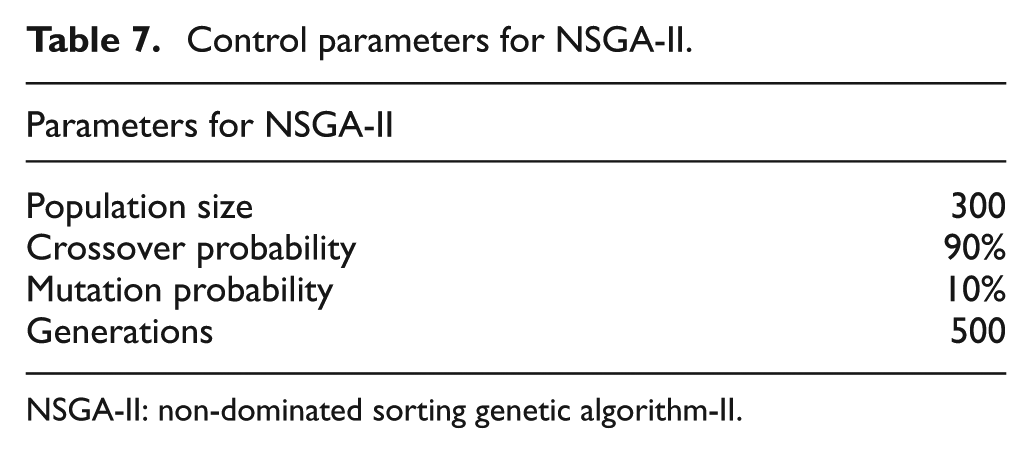
NSGA-II: non-dominated sorting genetic algorithm-II.
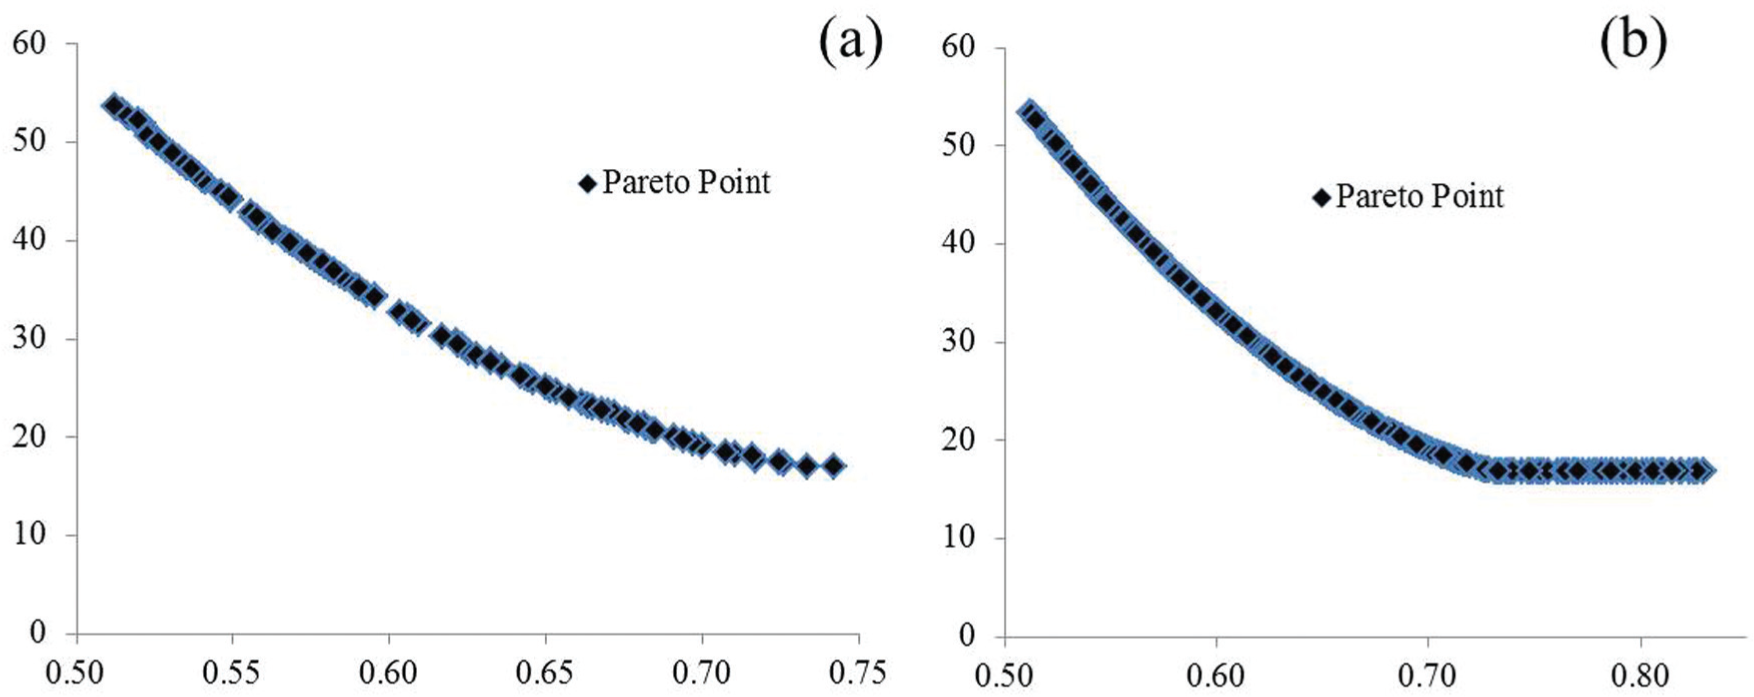
Solution sets at different generations: (a) after 100 generations and (b) after 500 generations.
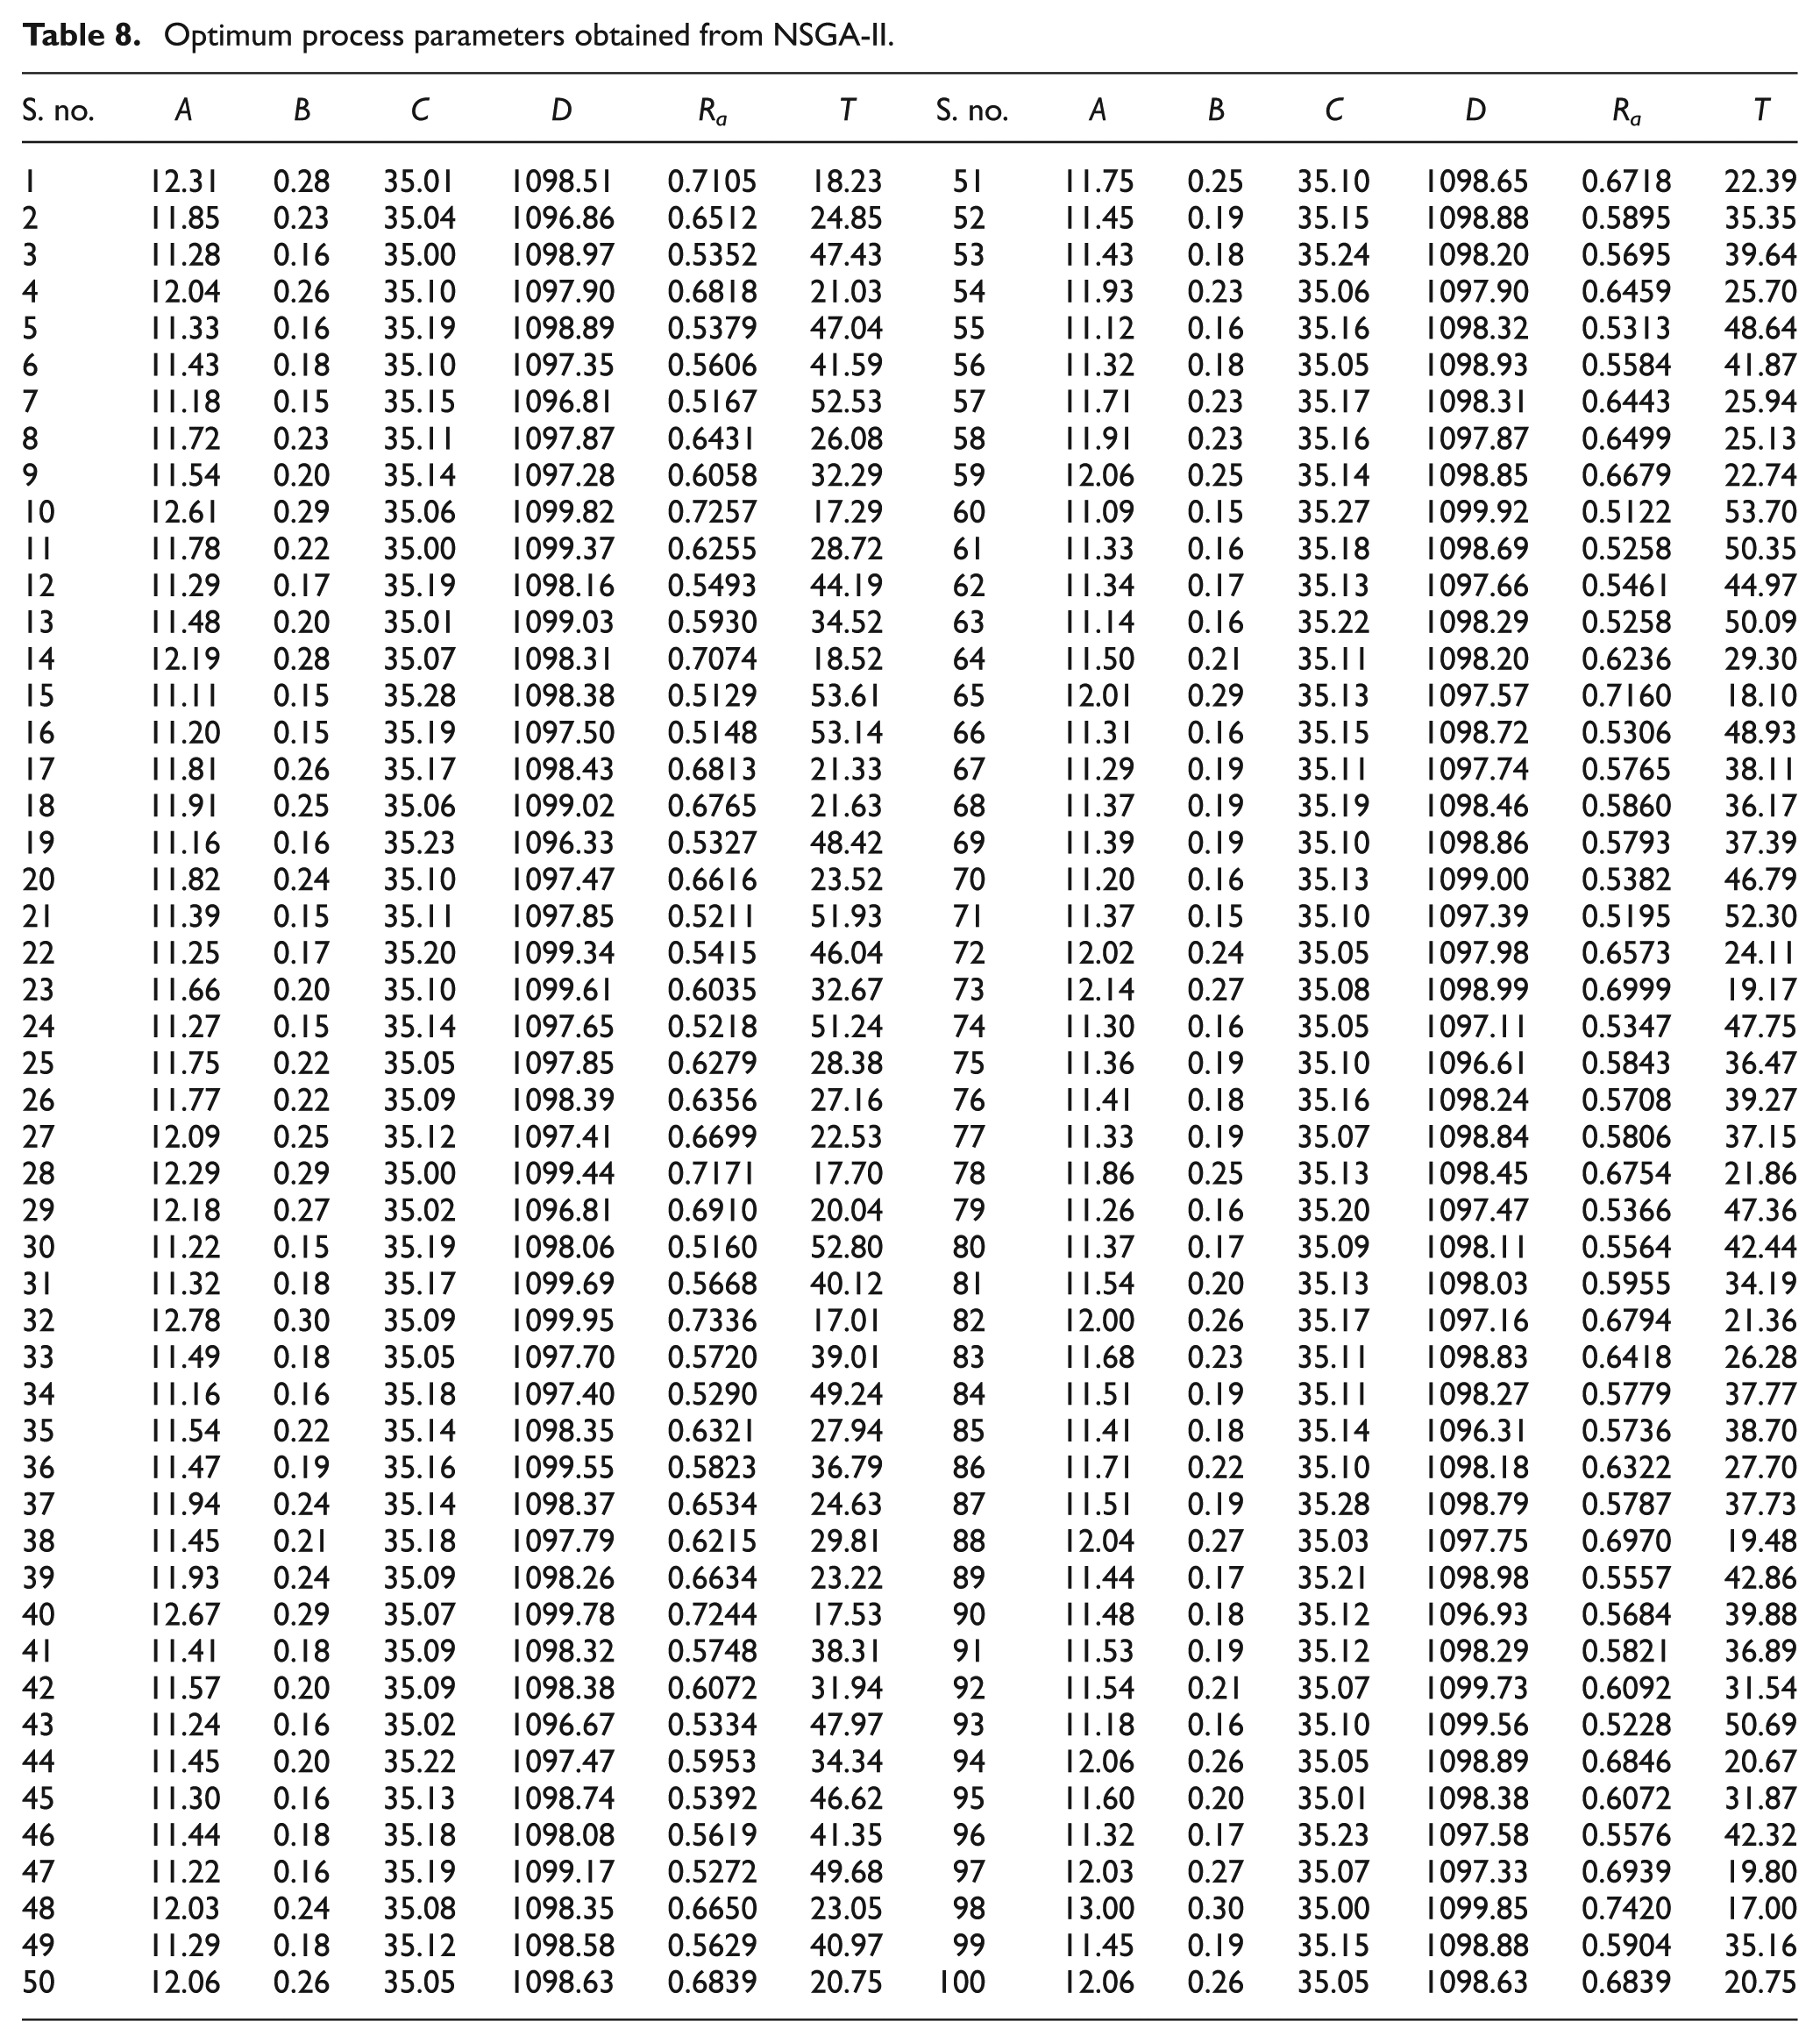
The point 1 in Figure 13 represents the optimum process parameters for minimum surface roughness and point 2 corresponds to optimum process parameters for minimum manufacturing time. Among the 300 non-dominated optimal solutions at the end of 500 generations, 100 optimal solutions along with the decision variables and objective function values are given in Table 8. All the solutions in the non-dominated set are acceptable solutions. However, the production engineer has to select appropriate process parameters based on the process requirements. A very low surface roughness of 0.5122 µm is possible with process parameters A = 11.04 mm, B = 0.15 mm, C = 35.26° and D = 1100 mm/min, and the corresponding manufacturing time is found to be 53.70 min. The minimum manufacturing time of 17 min is possible with process parameters of A = 13 mm, B = 0.289 mm, C = 35° and D = 1100 mm/min, and the corresponding surface roughness is found to be 0.742 µm.
Optimum process parameters obtained from NSGA-II.
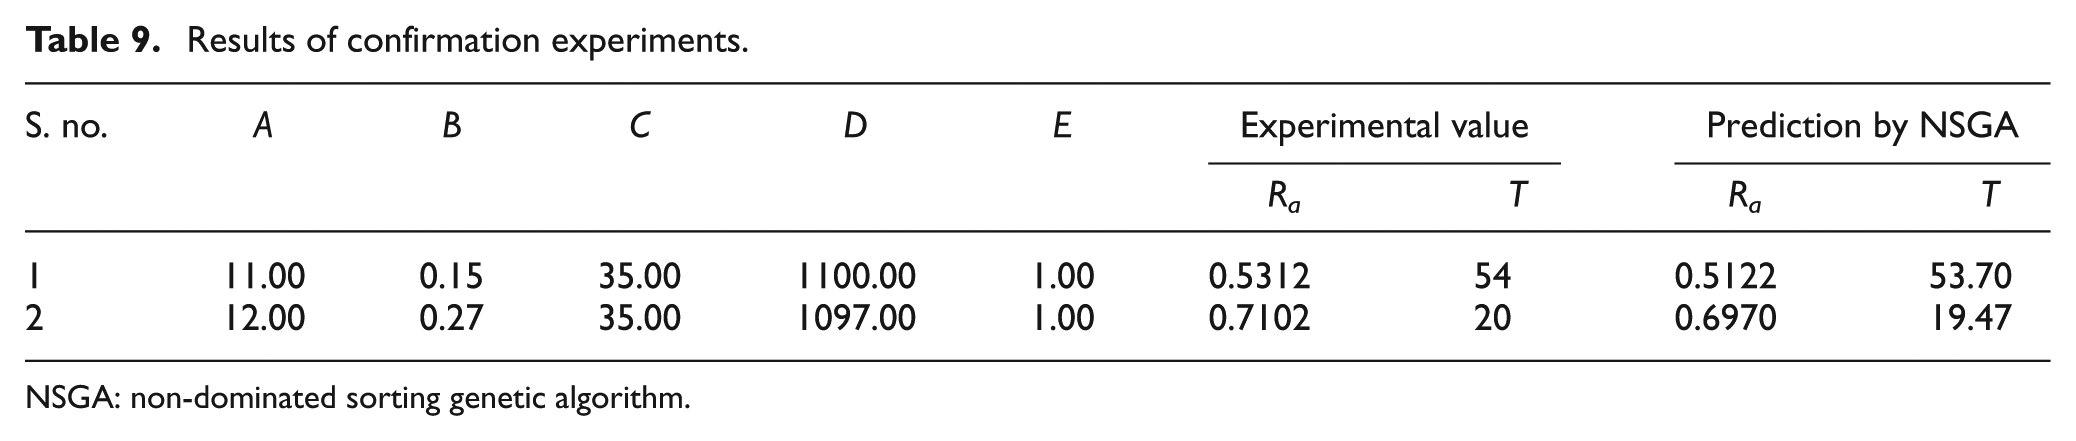
To verify the accuracy of results obtained from NSGA-II, two confirmation experiments have been performed. The process parameters for confirmation experiments have been chosen from Table 8 corresponding to S. nos 60 and 88. The experimental and predicted values of surface roughness and manufacturing time are given in Table 9. The results in Table 9 reveal that the error percentage is within the permissible limits and the process parameters provided by NSGA-II can be used to enhance the performance of ISF process.
Results of confirmation experiments.
NSGA: non-dominated sorting genetic algorithm.
Conclusion
In this article, the surface roughness and manufacturing time in incremental sheet metal forming have been analyzed by systematic experimental plan using Box–Behnken design. The process was further optimized using multi-objective optimization algorithm (NSGA-II). The results of this study are as follows:
The quadratic model was found to be more appropriate to relate the surface roughness and manufacturing time with process parameters in ISF process of EDD steel sheets.
Step depth and tool diameter are having a significant effect on surface roughness, while step depth, feed rate, wall angle and tool diameter are having predominant effect on manufacturing time. In case of interaction effects, AB and A2 are having major influence on surface roughness, while BC, BD, B2, C2 and D2 are having significant effect on manufacturing time.
The increase in step depth increases the surface roughness. The surface roughness value is decreased with increase in tool diameter up to some value and again increased with increase in diameter. The manufacturing time is decreased with increase in step depth, feed rate and tool diameter.
Pareto front obtained from optimization can be used to select appropriate set of process parameters for better surface finish and minimum manufacturing time depending upon the requirement of process engineer. The confirmation experiments show that the results obtained from NSGA-II algorithm can be used to improve the performance of ISF process effectively.
Future work involves the study on effect of high feed rates and variation in tool paths on surface roughness and manufacturing time in ISF of steel sheets.
Footnotes
Declaration of conflicting interests
The authors declare that there is no conflict of interest.
Funding
This study was financially supported by the University Grants Commission (UGC), New Delhi, through major project no. 39-905/2010 (SR).