
Abstract
The blank temperature and blank holding force (Bf) are important parameters affecting the formability in the hot deep drawing process. Also, the interfacial heat transfer coefficient has a great influence on the temperature distribution in the drawing process. This study examined the effect of the blank holding force (Bf) on the formability of boron sheets. The evaluation was carried out by considering the interfacial heat transfer coefficient and friction coefficient (µ) between blank and punch. A J-stamp relative computer simulation was employed to model the experimental process and examine the interfacial heat transfer coefficient and µ values. Moreover, experiments by applying different Bf were carried out to verify the simulation result. By matching the simulation data with experimental results, the appropriate friction coefficient according to Bf for hot deep drawing was evaluated. The results showed that the µ values between blank and punch decreased with increasing Bf. Based on the evaluated values of interfacial heat transfer coefficient and µ, the forming depth, maximum punch load, thickness, thinning rate and equivalent strain according to Bf were examined, respectively. The result shows that a larger Bf has a more significant effect on the variation of the thickness, thinning rate and equivalent strain of the samples during the drawing process. Furthermore, the thinning rate and equivalent strain variations for samples in fracture and without fracture state were also examined, respectively. The thinning rate did not show a larger difference according to Bf. However, the equivalent strain, both in fracture and without fracture state, decreased sharply when increasing the Bf.
Keywords
Introduction
Hot deep drawing is an effective method for producing ultra-high-strength steel (UHSS) in the automotive industry. This process can not only attain high-strength stamping parts, but can also reduce the springback under high-temperature forming and achieve good formability. The low springback attributed to in-die cooling gives boron steel an unparalleled edge in dimension control and subsequent assembly process. 1 Boron steel is currently the standard high-strength steel, and is used widely in the automotive industry for manufacturing hot-formed parts. The use of hot forming boron steels significantly increases the passenger safety, and reduces the vehicle weight and its fuel consumption. Generally, in hot deep drawing, the blank is heated to 850–950 °C in a furnace and maintained at this temperature for 5 min to give the sheet material an austenitic microstructure over the entire blank.2,3 The hot steel is then transferred for the drawing process under certain conditions and quenched in the die.
The sheet metal deep drawing has been introduced on drawing cylinder, elliptic, square and rectangular cups.4–8 It was found that many parameters, such as the blank initial temperature, the friction coefficient and blank-holding force, etc., have a significant effect on the formability in the hot forming process. 9 By decreasing Bf, wrinkling turns out as the principal failure mode, whereas the increase of Bf results in splitting and fracture.10–11 Sezek et al. 12 presented that the die radius has the greatest influence on the deep drawing of the stainless steel blank sheet, followed by the Bf and the friction coefficient. Also the friction coefficients differ according to the radial positions and drawing time.13–14 Menezes et al. 15 studied the effect of friction on metal forming by simulating compression tests on cylindrical Al–Mg alloy using the finite element method (FEM) technique, in which a constant coefficient of friction was employed at the upper die–work-piece interface. It was concluded that the variations in the coefficient of friction between the dies and the work-piece directly affect the stress distribution and shape of the work-piece and the microstructure of the material being processed.
Computer simulation is widely used to study the drawing behavior, as well as examine the thermal coefficient and friction coefficient under a range of process parameters during the deep drawing process. On the basis of numerical simulation, Zhang et al. 16 presented that temperature has the greatest effect on the friction coefficient, followed by Bf, but no significant effect of lubrication on the friction coefficients. Turetta et al. 17 investigated the mechanical characteristics of boron steel at different temperatures and strain rate. On the basis of these data, he presented a novel test based on the Nakazima concept at elevated temperature, and evaluated the influence of punch speed and temperature on the specimen microstructure evolution. Rosochowska et al. 18 developed a new method for determining the thermal contact conductance to measure the dependence of thermal contact conductance on the pressure and surface texture, and presented some experimental results on the dependence of interfacial heat transfer coefficient (IHTC). The results showed that the thermal contact conductance increases with increasing pressure and decreases with increasing surface roughness of the work material. 19 Using the FEM, Takuda et al. 20 examined the deformation behavior and the temperature distribution in cylindrical deep drawing of an aluminum alloy sheet at elevated temperatures. They clarified that the appropriate distribution of flow stress depending on temperature must exist in the sheet for the higher limiting drawing ratio. Computer modeling has become a standard tool in the development of most components and its importance to the forming process is clear. Based on the finite element methodology and temperatures, the time-dependent IHTC can then be studied by inverse heat-conduction analysis. A J-stamp relative simulation was performed in this study.
However, there were no more details about how Bf affects the friction coefficient and IHTC under various Bf in hot deep drawing, as well as the influence of Bf on the formability. The purpose of this study is to investigate the effect of Bf on the formability of boron sheets. The difference between this study and previous work is that the punch and dies were kept at a temperature of 300 °C. During experiments, temperature distribution can be measured by thermocouples. 21 Thus, at the first step of this study, IHTC values according to Bf were evaluated through numerical simulation, when friction coefficient was first assumed as a constant. These evaluated IHTC values were input as boundary conditions in simulation and then a serial of friction coefficients were executed in simulation in order to evaluate approximated values. After the optimal parameters were obtained, the forming depth, forming force, thinning rate and equivalent strain on fracture phenomena in hot deep drawing, were examined. Moreover, experiments were carried out to verify the simulation results.
Experimental work
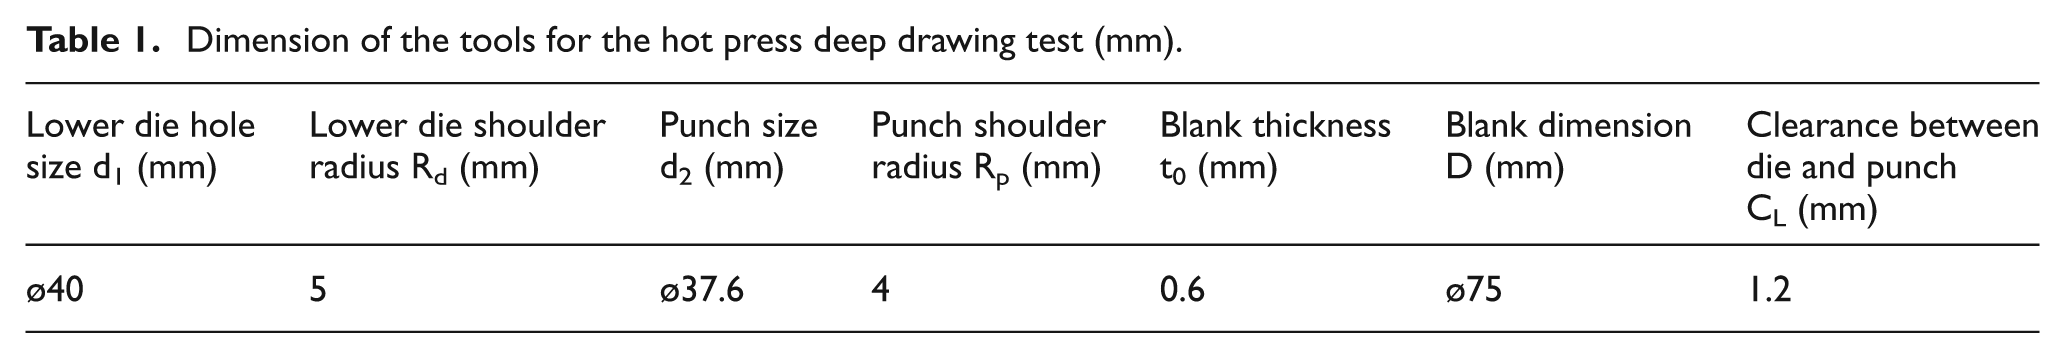
Table 1 lists the dimensions of the tools and blanks for hot deep drawing. The boron steel used in this study was Ø75 mm in diameter and 0.6 mm in thickness. The clearance between the punch and die was 1.2 mm. Figure 1 shows a photograph of the experimental system. As shown in Figure 1(a), the deep drawing equipment used in this study consisted of a 50-ton hydraulic cylinder for moving the forming punch, a 30-ton load cell that was capable of measuring the forming load, a 20-ton hydraulic cylinder that clamped the upper die, and another 5-ton load cell for measuring the clamping force. Also, the equipment had a computer with a linear variable differential transformer (LVDT). When the steel sheet was formed in this equipment, the LVDT measured the punch load according to punch stroke. As shown in Figure 1(b), there were several cartridge heaters in the upper die, lower die and punch. Hereby, a constant tool temperature for the dies and punch can be obtained.
Dimension of the tools for the hot press deep drawing test (mm).
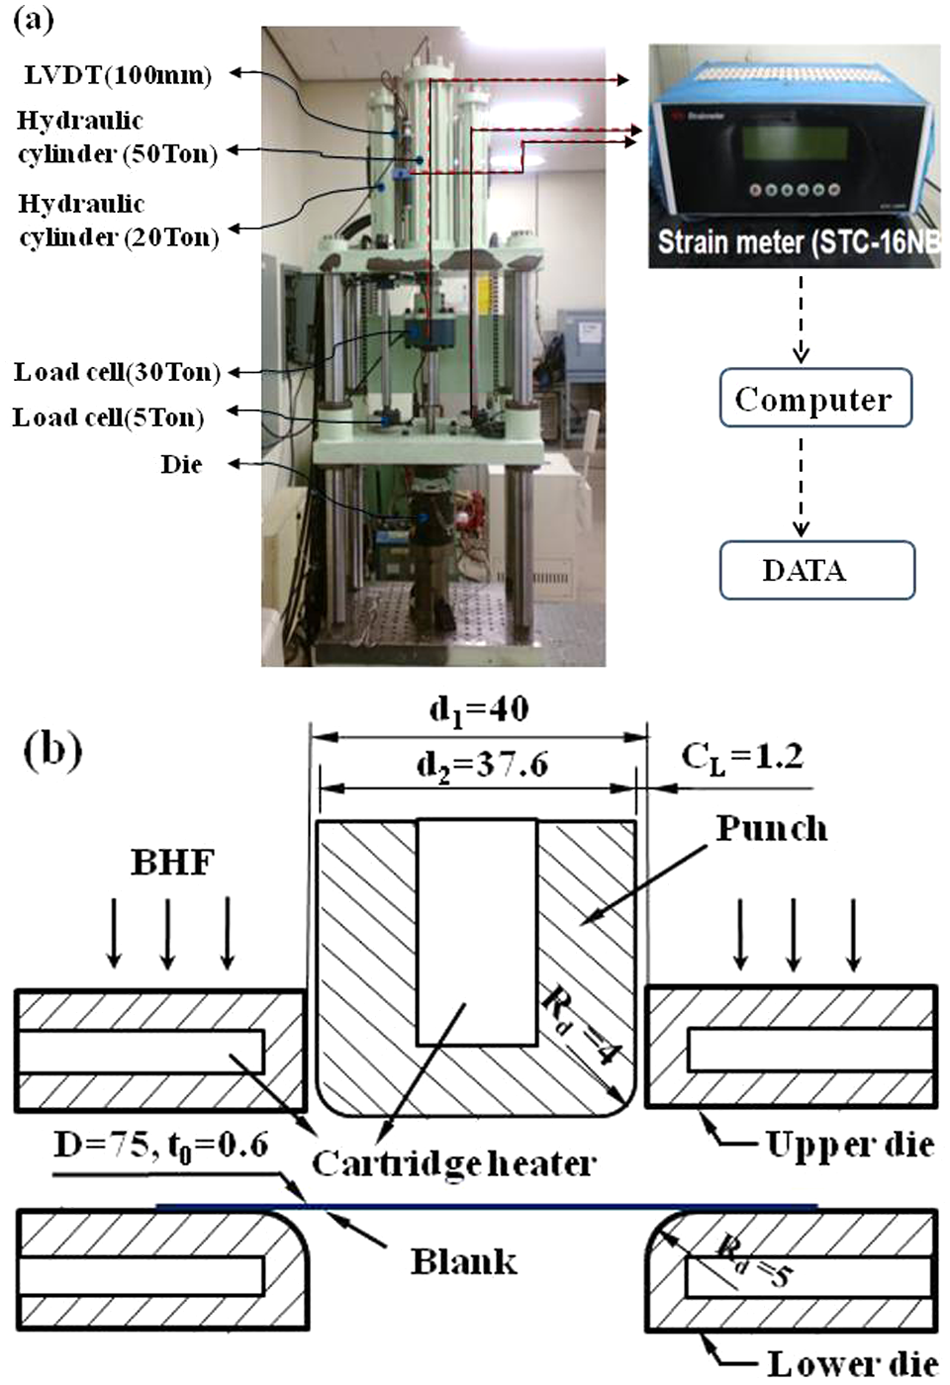
The equipment for deep drawing experiments: (a) apparatus of hydraulic press machine; (b) schematic diagram of the deep drawing system.
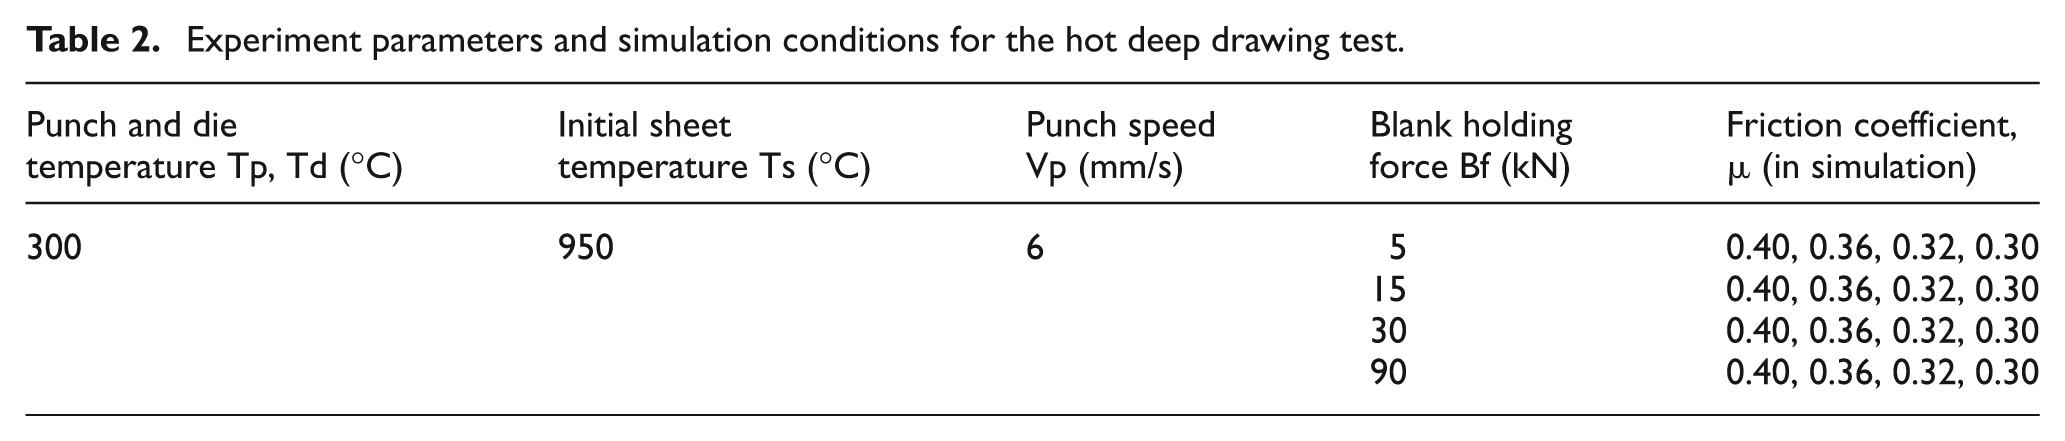
Table 2 lists the experimental and simulation parameters for hot deep drawing. The blank was first heated to 950 °C (initial blank temperature, Ts) in the furnace and held at that temperature for 5 min to give the sheet material an austenitic microstructure over the entire blank.2,3 Then the heated blank was transferred to the die. Immediately after the blank was positioned, the blank holder moved downward to hold the blank, which is called the binding process and the Bf was set to be 5 kN, 15 kN, 30 kN and 90 kN, respectively. When the Bf increased, the forming depth was smaller and forming time became much shorter, thus 90 kN was set after 30 kN as a critical condition. After the blank holder was placed in contact with the blank with a constant Bf, the forming process was promptly performed at a punch velocity of 6 mm/s until fracture occurred.
Experiment parameters and simulation conditions for the hot deep drawing test.
The temperature decreased during the drawing process. In order to measure the temperature during the deep drawing process, thermocouples were set at the central positions of the blank, as shown in Figure 2(a). The thermocouple was supposed to check the blank temperature of the central position attached to the punch. In hot deep drawing, the punch was first moved down until it contacted the blank at the central position and drawn, and then the actual drawing process was executed. Because of the high temperature (700 °C∼800 °C) and pressure in the drawing process, it’s easy to cause the breakage of the thermocouple cannula and the temperature sensor, and then fail to measure the temperature. Therefore, in temperature measuring experiments, the punch was stopped at the position when it contacted the blank in order to protect the thermocouple, and the temperature was continually measured by using the thermocouple and recorded by the data logger. Because the heat transfer conditions almost stay the same after the punch contacted the blank, the measured temperature can be assumed to be the temperature variation during the drawing process. In this study, the data logger TDS-602 was applied to record the temperature change, as shown in Figure 2(b). The data logger TDS-602 is an electronic device that measures strain, d.c. voltage and thermocouple/Pt resistance temperature detector (RTD) temperature with high accuracy through an original correction technique. The data logger can start automatically with timers and monitor comparators and measure up to 1000 channels. Thus, the temperature variations under different Bf during the deep drawing process were recorded by the data logger TDS-602.
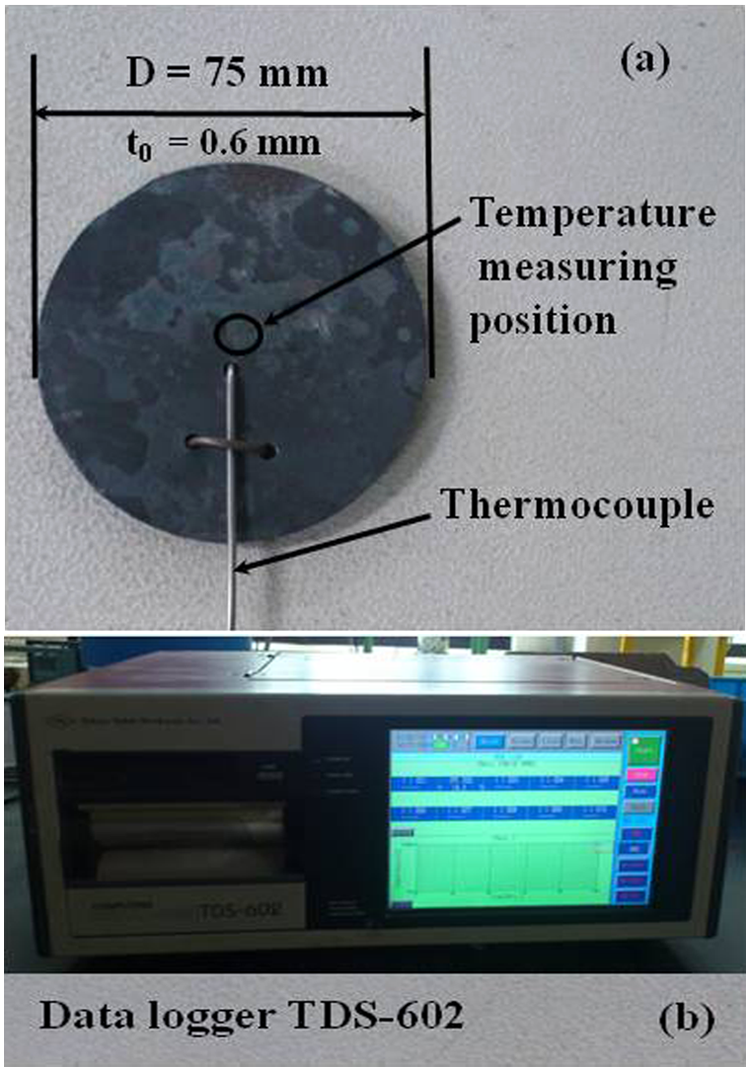
Temperature measurement: (a) the position of the thermocouple on boron steel; (b) data logger.
Numerical simulation
Material properties
In this study, a Al–Si coated boron steel with a thickness of 0.6 mm was used in these experiments. Table 3 lists the chemical composition and mechanical properties of the specimen. Many previous articles presented detailed investigations about the material properties of boron steel under various parameters, such as rolling direction, temperature, strain rate and cooling rate. Naderi et al. 22 explored the compression behavior of the 22MnB5 boron steel at temperatures between 600 °C and 900 °C, and strain rates of 0.1, 1.0 and 10.0 s−1. Merklein et al. 23 introduced an experimental setup and presented investigations on the thermo-mechanical flow properties of the quenchable, UHSS 22MnB5 in dependency of the temperature, the strain and the cooling rate, etc. The experimental results showed that at a high temperature (usually above 650 °C) the 22MnB5 exhibits a great strain rate sensitivity of the flow stress owing to the dynamic temperature-dependent annihilation and recovery processes. Fan et al. 24 studied the influence of high temperature deformation on the final microstructure, hardness and mechanical properties, after the aluminized 22MnB5 hot press forming steel was deformed isothermally in the temperature range 600–800 °C and at a strain rate of 0.5−1. The sensitivity of the forming behavior of the aluminum coated boron steel on temperature was also investigated by Jang et al. 25 in hot press forming in two different strain rates of 0.02 and 0.2 s−1. They studied the influence of flow curve characteristics at various temperatures for boron steel. In general, increasing the test strain rate leads to an appreciable increase of the stress level and the slope of the curve as a consequence of an enforced work hardening of the material. The stress–strain curves go down as the temperature increased. On the other hand, the elongation increased with increasing temperature to 600 °C and 700 °C.
Chemical composition and mechanical properties of the tested material.
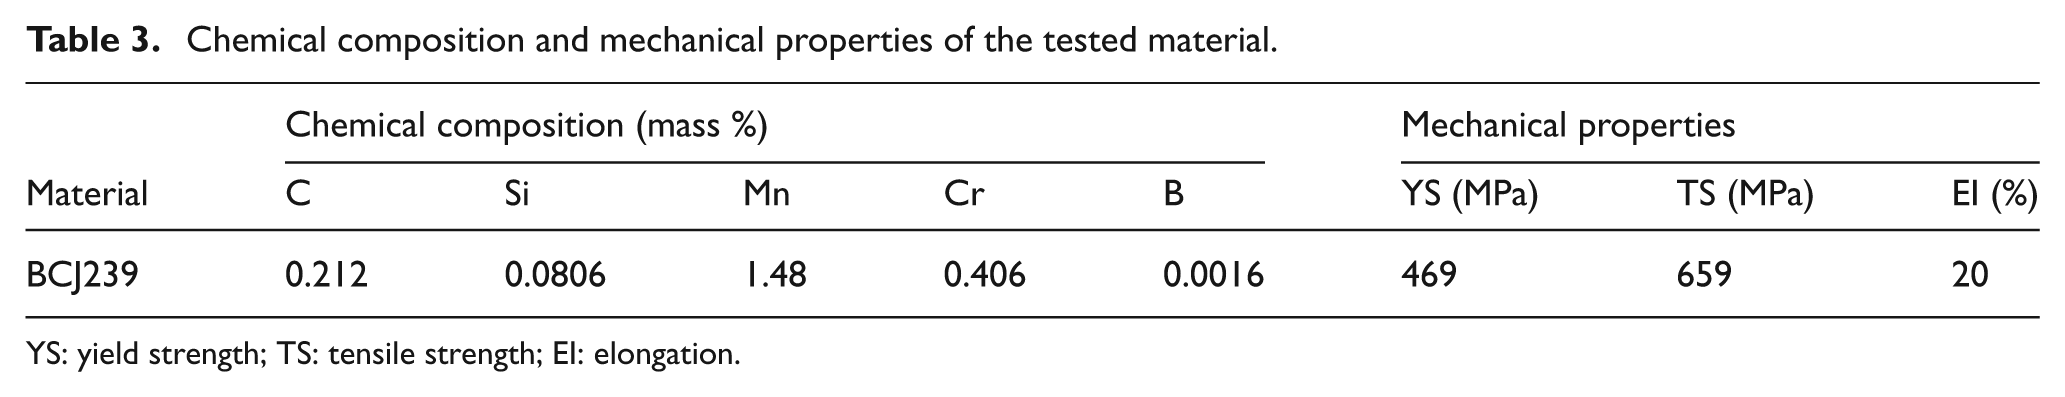
YS: yield strength; TS: tensile strength; EI: elongation.
Numerical work setup
A J-stamp simulation was employed to evaluate the IHTC in the deep drawing process. Different heat transfer coefficients for each step (H) were then attempted in the simulation to estimate the approximate value by matching the temperature decrease in the experimental results and simulation results. After obtaining the initial conditions and boundary conditions, numerical simulations were executed and friction coefficients (µ) were estimated. Then thinning and equivalent strain behaviors on the fracture phenomena were investigated.
The total time elapsed before the start of the actual forming process, including the transfer time (tr) and blank-holder moving time (tb), was approximately 4.5∼5 s. Because of heat transfer in tr and tb, which were approximately 2.5 s and 2 s, respectively, the blanks lost heat and showed a temperature decrease in this period.
The main factors affecting the IHTC were coating layer, blank and tool initial temperature, and strain rate. Malinowski et al. 26 used temperature measurement and a FEM technique to develop an empirical relationship, which gave the IHTC as a function of time, temperature and interfacial pressure in the hot/warm forging process. Arthur 27 presented a finite element methodology for the continuous press hardening of car components using UHSS. He discussed the conduction, convection and radiation heat transfer coefficients, and illustrated the tool-to-part contact conductance as a function of the interface pressure.
On the other hand, there was no direct method currently existing for the exact determination of IHTC. It was often tuned to force an agreement between experimental observations and FEM predictions. 28 Nshama et al. 29 developed a technique that could enable accurate measurements of the contact resistance. This technique involved direct temperature measurements at the blank–die interface during deformation and the subsequent use of an inverse heat transfer model to calculate the IHTC. Chang and Bramley 30 assumed the IHTC as a constant for the rest-on-die stage and examined the IHTC at the workpiece–die interface by comparing the die surface temperature in the forging process between FEM results and experimental measurements.
Since the thermal flow and friction coefficient were different from time and position in the hot deep drawing process, it was more complicated to consider all of the factors in numerical simulation. Simulation using a constant IHTC or friction coefficient is unavoidably flawed. Either running a large number of simulations under different conditions or periodically interrupting the simulation and manually adjusting the conditions can improve the accuracy somewhat.
In order to try a different IHTC in the drawing process, the simulation of the deep drawing process was divided into four steps, namely heating, transferring, binding and drawing. In this present study, the friction coefficient between the blank and tool was first assumed to be a constant of 0.36, which was an adjacent value in the drawing process according to companion’s work. Then different IHTC values for each step were attempted in the numerical simulation, until the temperature in the simulation and experiment reached an agreement. After the IHTC values were predicted under different Bf, a series of simulations with these coefficients were implemented to examine the friction coefficient (µ) according to Bf. Then the thickness, thinning and equivalent strain behaviors were studied.
Result and discussion
Interfacial heat transfer coefficient (IHTC)
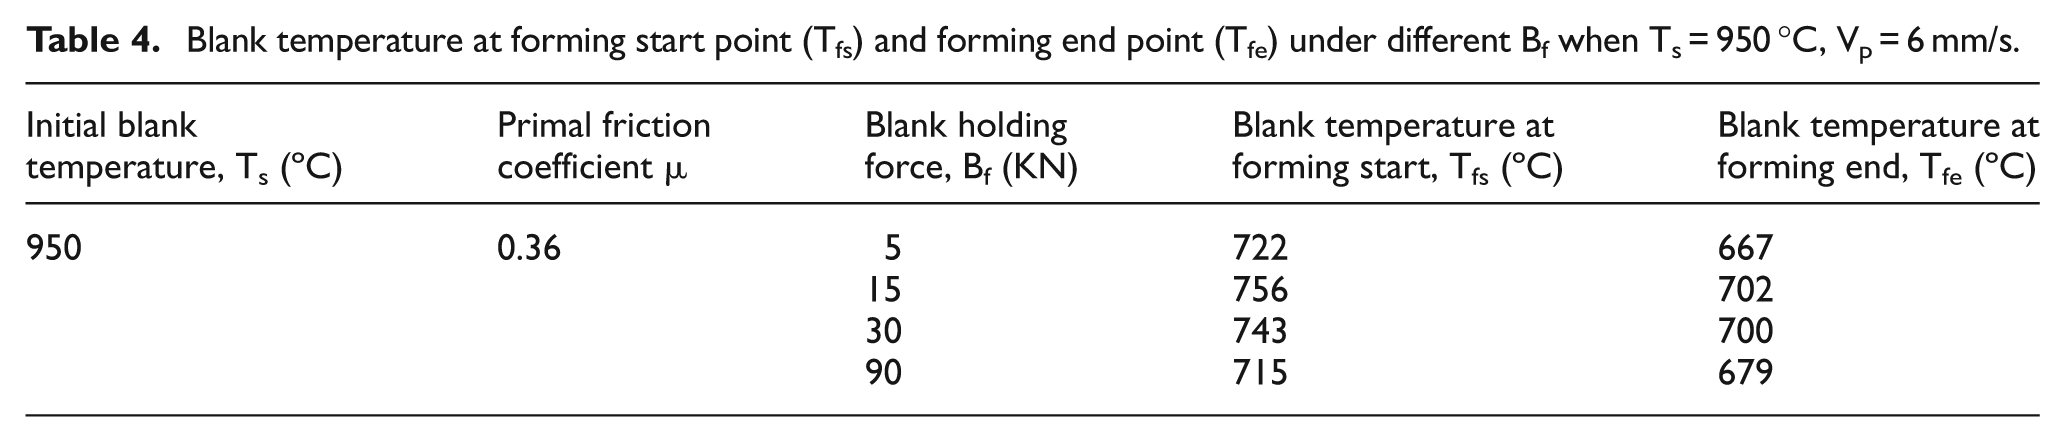
Experiments were carried out to measure the blank temperature. Figure 3 shows the schematic diagram of the drawing process and blank temperature–time relationship. As shown in Figure 3(a), in hot deep drawing, the blank lost heat from the step when transferring the hot blank (950 °C) from the heating furnace to the lower die, called the transfer step. In this step, the blank lost heat by convection and radiation to the environment, which was assumed to be 25 °C. h1 was used to represent the heat-transfer coefficient and was given by h1 = hconv + hrad. After transferring the blank to the lower die, the upper die (blank holder) was moved down to hold the blank and the real forming process was then started, which were the binding and forming steps, respectively. In this article, h2 and h3 represent the IHTC in the binding and forming step, respectively. Deep drawing experiments with different Bf were carried out and a data logger was used to record the temperature at the blank center during the experimental drawing process. Figure 3(b) shows the experimental blank temperature according to the drawing time at various Bf. The blank temperature at the forming start point (Tfs) and forming end point (Tfe) are listed in Table 4. The temperature distributions were different according to Bf. When the Bf was 15 kN and 30 kN, the temperature decreased more gently than when Bf was 5 kN and 90 kN. However, the temperature under various Bf did not differ greatly and this was partly owing to the short time needed to finish the forming process (0.8∼1.4 s).
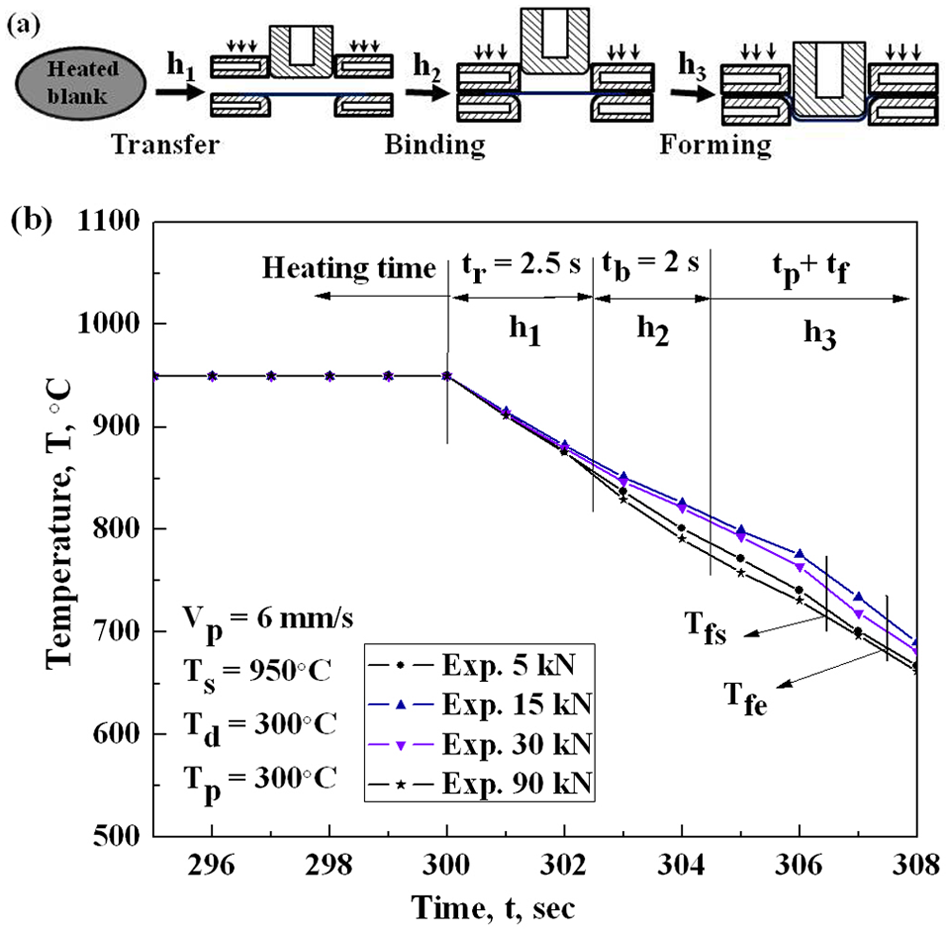
Schematic diagram of drawing process and blank temperature versus time in experiments: (a) schematic diagram of drawing process; (b) temperature according to time.
Blank temperature at forming start point (Tfs) and forming end point (Tfe) under different Bf when Ts = 950 °C, Vp = 6 mm/s.
In the transferring process, heat-transfer coefficient h1 = hconv + hrad. Some inaccuracies in calculating the convection coefficient did not significantly alter the results and in this article it was assumed that hconv ≈ 8.3 W/m2 K (Arthur 27 ). The radiation conductance can be calculated using
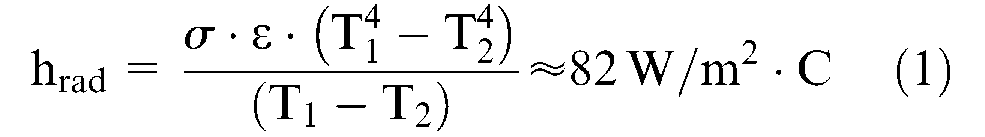
where T1 and T2 represent the heating-blank temperature and environment temperature (k), respectively. In this study, T1 = 1223 K (950 °C), T2 = 298 K (25 °C), σ is the Stefan–Boltzmann constant (σ = 5.67 × 10⁻⁸ W/m2 K4), ε is the radiative property of the surface and is termed as the emissivity (0 ≤ ε ≤ 1).The value of ε provides a measure of the efficiency with which the surface emits energy relative to a blackbody, which depends strongly on the surface material and finish. Chang and Bramley 30 measured the temperatures and then used it to determine the convection heat transfer coefficient hconv. In their presented article, the emissivity was assumed as 0.7 and hconv was estimated to be about 45 W/m2 K. In this study, when ε is 0.6, the temperature in the simulation results agreed well with the experimental results. And hrad can be calculated by using equation (1). Therefore, the relation, h1 = hconv + hrad, ≈ 90 W/m2 K and was given by hrad ≈ 82 W/m2 K. In the transfer process, when the input h1 was 90 W/m2 K, the temperature in the numerical simulation was in good agreement with the experimental data.
In the binding step, when the hot blank (∼860 °C) began to contact with the lower die (∼300 °C), the top surface lost heat to the air by convection and radiation, whereas the bottom surface lost heat to the tool by conductance. Because the metal-to-metal conductance at the bottom surface (∼1500 W/m2 K) was much larger than convection (∼8.3 W/m2 K) and radiation (∼90 W/m2 K), these modes of heat transfer became negligible. Arthur reported that the conductance was a function of the interface pressure. If the pressure was set from 0 to 30 MPa, the heat transfer conductance scaled from 750 W/m2 K to 2500 W/m2 K. 27
Therefore, in this study, a series of IHTC values within this range were executed in numerical simulations and approximate IHTC values were estimated. Figure 4 compares the temperature between experimental and simulation data, at different Bf. As shown in Figure 4(a), for which Bf was 5 kN, the temperature in the simulation showed good agreement with the experimental result when h2 = h3 = 800 W/m2 K. Similar to Figure 4(b)–(d), the approximate heat transfer coefficients were estimated as h2 = 1500 W/m2 K, h3 = 800 W/m2 K when Bf was 15 kN and 30 kN. When Bf was 90 kN, h2 = 1500 W/m2 K, h3 = 1500 W/m2 K. IHTC increased with increasing Bf. The temperature distribution in simulation showed an agreement with the experiment result.
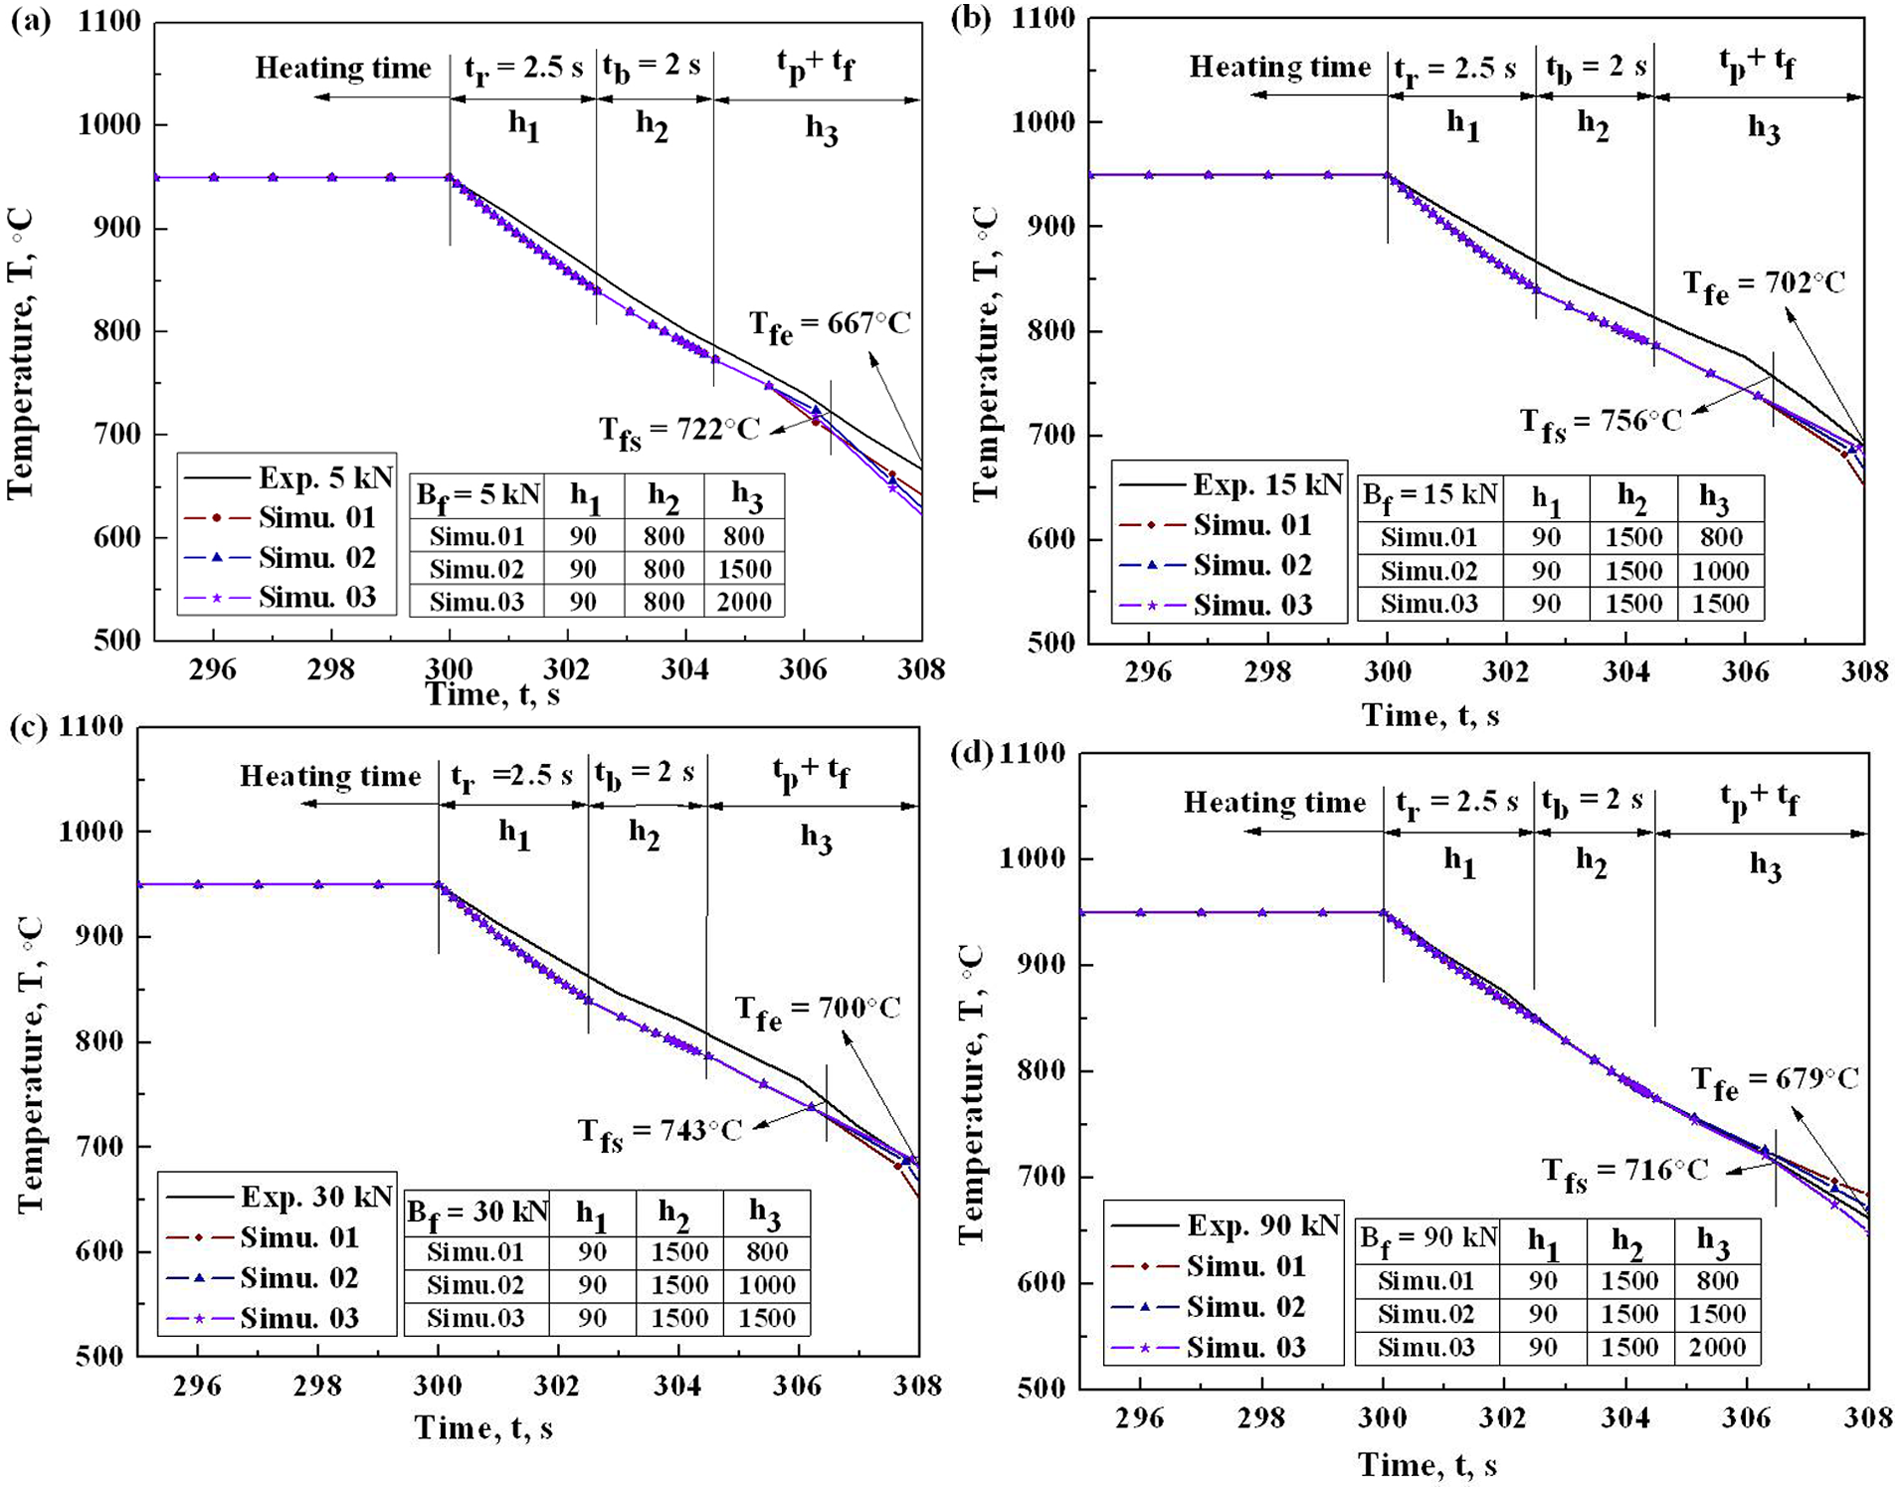
Blank temperature variation according to time in experimental and simulation results at different Bf: (a) Bf = 5 kN; (b) Bf = 15 kN; (c) Bf = 30 kN; (d) Bf = 90 kN.
Chang and Bramley 30 presented that the IHTC value varies significantly from 395 W/m2 K to 7790 W/m2 K for boron steel in the hot deep drawing process. However, it didn’t indicate the relationship between h and pressure. From a more detailed analysis, Merklein and Lechler 31 examined thermal properties for 22MnB5 steel at various temperatures and pressures. The result showed that when the initial steel temperature was 550 °C, h value for contact heat transfer conductance was found from a low of 750 W/m2 K to 2500 W/m2 K when interface pressure increases from 0 to 20 MPa. Shvets calculated the heat transfer conductance as a function of interface pressure, roughness parameter and rupture stress. 32 The data showed that the heat transfer conductance was found from 750 W/m2 K to 2520 W/m2 K when interface pressure increased from 0 to 20 MPa, which was almost the same as Merklein’s study.
The differences between this study and the previous works in this review are attributed to the measuring devices used in the experiments and the method of processing the experiment data. Furthermore, the experimental conditions, such as testing material, initial temperature, pressure, etc., were not completely the same as each other. However, the trend of h values estimated in this study showed a correspondence to the previous work.
Friction coefficient
After h values were estimated, simulations were executed using these results to estimate the friction coefficient (µ) between blank and punch. In simulations, serial values of friction coefficient were tried under the Bf of 5 kN, 15 kN, 30 kN and 90 kN, respectively. The initial blank temperature was heated to 950 °C and punch velocity was fixed at 6 mm/s. Die and punch temperature were kept at 300 °C during the drawing process. In the experiment, by using load cells, data of punch load according to forming depth were recorded for every drawing process. It was observed that the fracture happened to occur around the point where the punch load reaches to the maximum value.
Figure 5 compares the relationship of the punch load and forming depth between experimental results and simulation data, in which various µ values were attempted in simulations. The fracture occurrence time, as well as the forming depth, can be predicted in numerical simulation. It showed that the forming depth in simulation results had an agreement with the experimental results. Cracks occurred at the point when the punch loads nearly reached the maximum value. As observed in Figure 5(a), in which the Bf = 5 kN, the forming depth (δ) showed significant differences at different µ values. The forming depth (δ) and the maximum punch load decreased with an increasing µ value. When µ increased to 0.4, there was a correspondence in the forming depth between the experimental results and simulation, and the maximum punch load was 25 kN near to the fracture point. Also, as shown in Figures 5(b)–(d), by comparing the experimental and simulation data, the approximate values of µ were estimated at 0.36, 0.32, and 0.30 when Bf = 15 kN, 30 kN, and 90 kN, respectively.
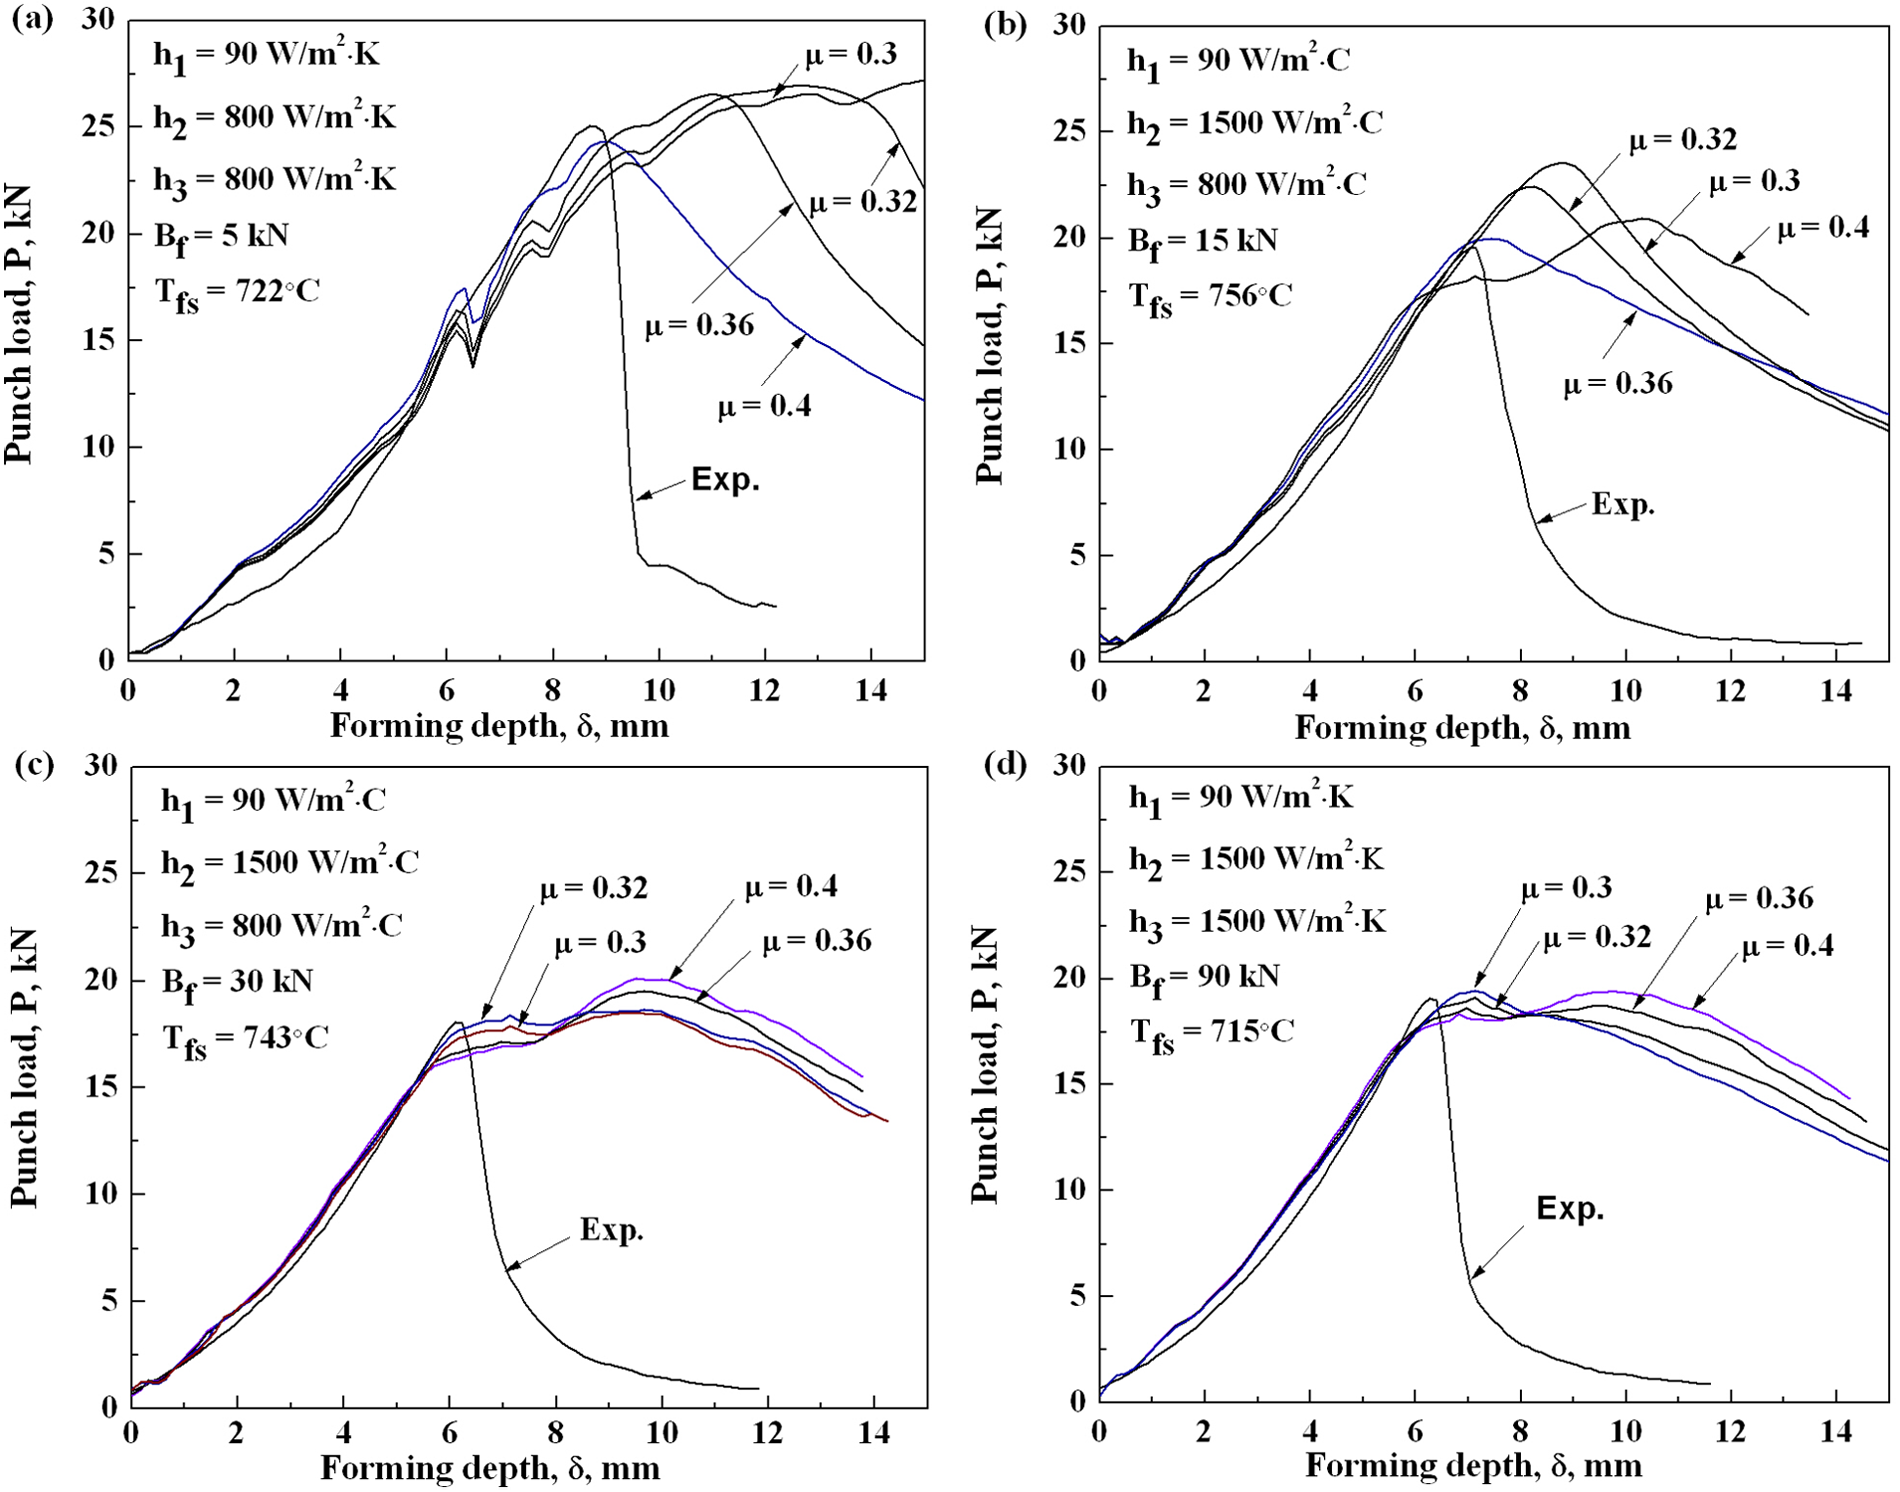
Relationship between punch load and forming depth by varying µ at different Bf in hot deep drawing: (a) Bf = 5 kN; (b) Bf = 15 kN; (c) Bf = 30 kN; (d) Bf = 90 kN.
The figures show some difference before the fracture point between the experimental and simulation results, which was mainly because µ was assumed to be a constant in the J-stamp numerical simulation. However, when two solids were pushed together, they do not make atomic contact everywhere within the apparent contact area, and contact happens only on peak asperities of the surfaces. 33 Indeed, the value of µ between the blank and tools varied according to the contact position and processing time in practical deep drawing. 13 Some uncontrollable factors also affect µ, such as the skill level in the transfer process with which the time elapsed were different, temperature of measuring position in the blanks and the environment, and the drawing position in the blanks, etc. These factors caused differences of IHTC values and, consequently, affected the punch load.
On the other hand, the curves became significantly different after reaching the maximum punch load (fracture point), and can be explained as follows. The state of the drawing process after fracture, for the simulation and experiment, was significantly different. In the simulation, once deep drawing begins, the blank comes into contact with the punch before and after cracking. In the practical drawing process, after blanks cracking, the contacting position between punch and blank changed, and sometimes the fractured part of the drawn cup moves separately downwards from the punch. This separation changed the contact point between the punch and the blank and leads to a rapid temperature decrease in the center of the blank, which caused a steeper negative slope for the punch load after fracture in the experiment.
Consequently, according to the simulation, the relationship between µ and Bf for hot deep drawing was deduced, as shown in Figure 6. As can be seen, µ between blank and punch decreased with increasing Bf. Obviously, µ showed a steeper negative slope at Bf < 30 kN and the decrease rate for µ became moderate at Bf > 30 kN. In previous work, friction values determined for Al–Si coated 22MnB5 specimens were calculated and the results show a significant decrease of the friction coefficient with rising temperature, with the values ranging from 0.6 to 0.3. 34 Friction coefficients between blank and punch were also significantly different by testing material. Thiruvarudchelvan and Loh 14 compared the theoretical and experimental values of the maximum draw force and the results showed that a coefficient of friction of between 0.15 and 0.20 appears to apply when drawing aluminum cups, while for copper cups a coefficient of friction of about 0.05 seems appropriate. In contrast, this study used boron steel as a testing material, in which the friction coefficient decreased from 0.40 to 0.30 when Bf increases from 5 kN to 90 kN.
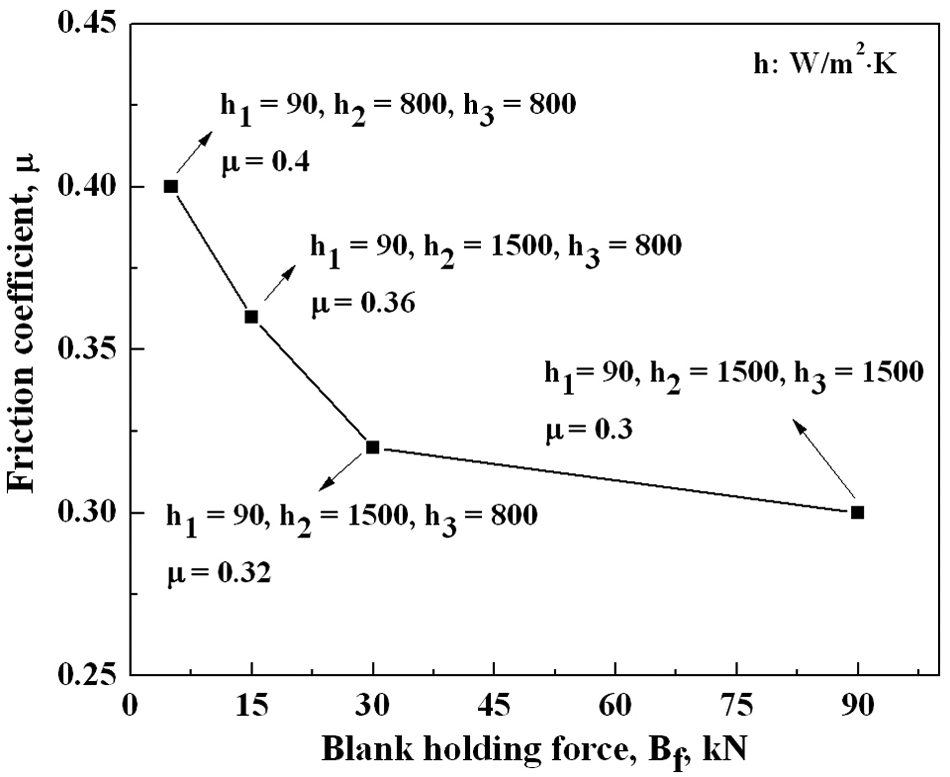
Relationship between friction coefficient (µ) and Bf when Vp = 6 mm/s, Ts = 950 °C.
Formability
As listed in Figure 6, the approximate IHTC (h values) and friction coefficient (µ) between blank and punch were estimated at different Bf. Then thickness, thinning behavior and equivalent strain versus forming depth were analyzed based on the simulations under these IHTC and µ values. The blank thickness and thinning values at critical points were measured from thickness map and thinning map in numerical simulation. Also, thinning values in the x-, y-, z-axes were obtained from the thinning map, using ε x , ε y , ε z as presented, respectively. Thus, the equivalent strain can be calculated by using equation (2). Then all of these data were fitted and the variation trends can be deduced

Figure 7 shows relationship between the thickness and forming depth according to Bf. When at the same forming depth, the thickness became thinner with increasing Bf. When δ increased to 4 mm, the thickness had a sharper decrease than at a smaller forming depth (δ < 4 mm). Figures 8 and 9 show the thinning and equivalent strain change according to δ with varying Bf, respectively. The thinning rate and equivalent strain increased with increasing Bf. In addition, when Bf increased from 30 kN to 90 kN, the thickness, thinning rate and equivalent strain according to Bf did not show a big difference. The thinning and equivalent strain increases rapidly when δ was smaller than 4 mm. The fracture phenomenon can be observed from simulations, the maximum thinning occurs at the punch profile portion. When the forming pressure increased, thinning of the sheet metal propagated from the punch profile portion to the side wall. 35
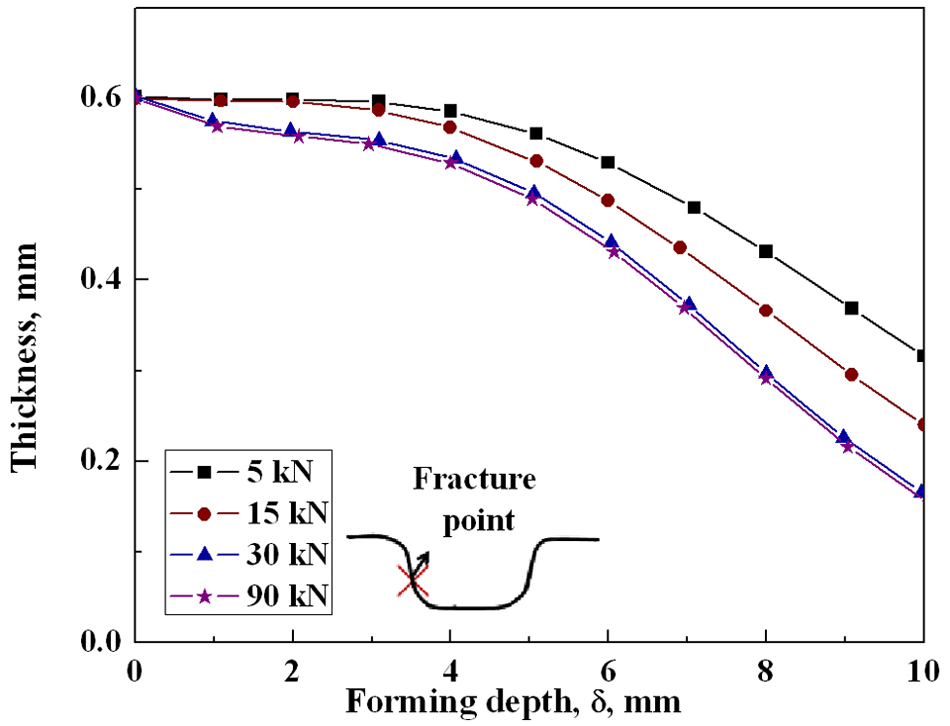
Relationship between thickness and forming depth at different Bf when Vp = 6 mm/s, Ts = 950 °C.
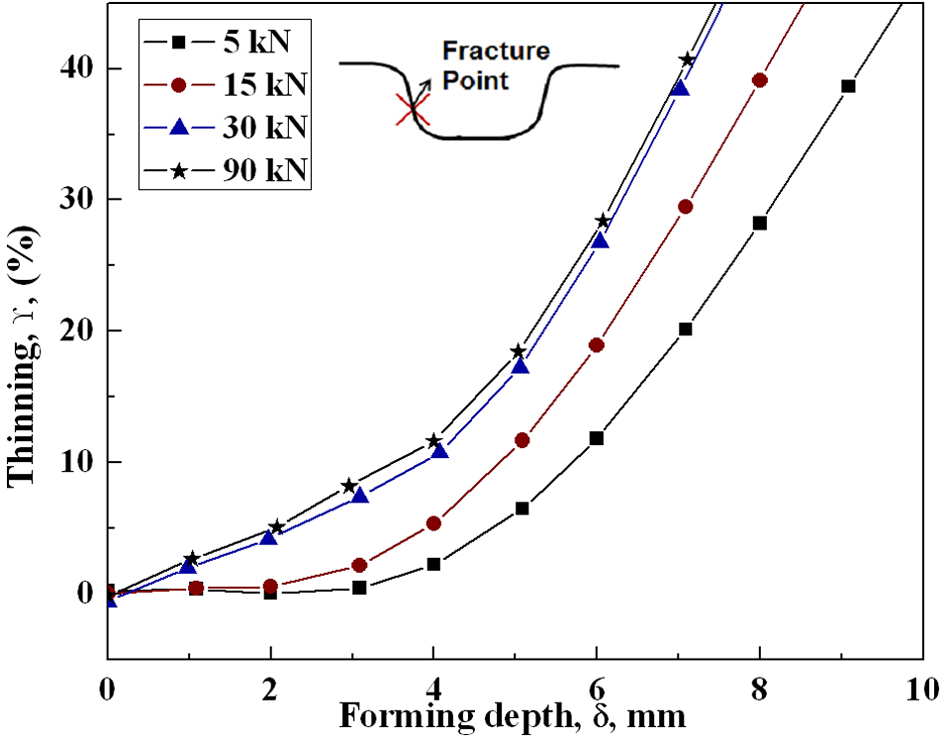
Relationship between thinning and forming depth at different Bf when Vp = 6 mm/s, Ts = 950 °C.
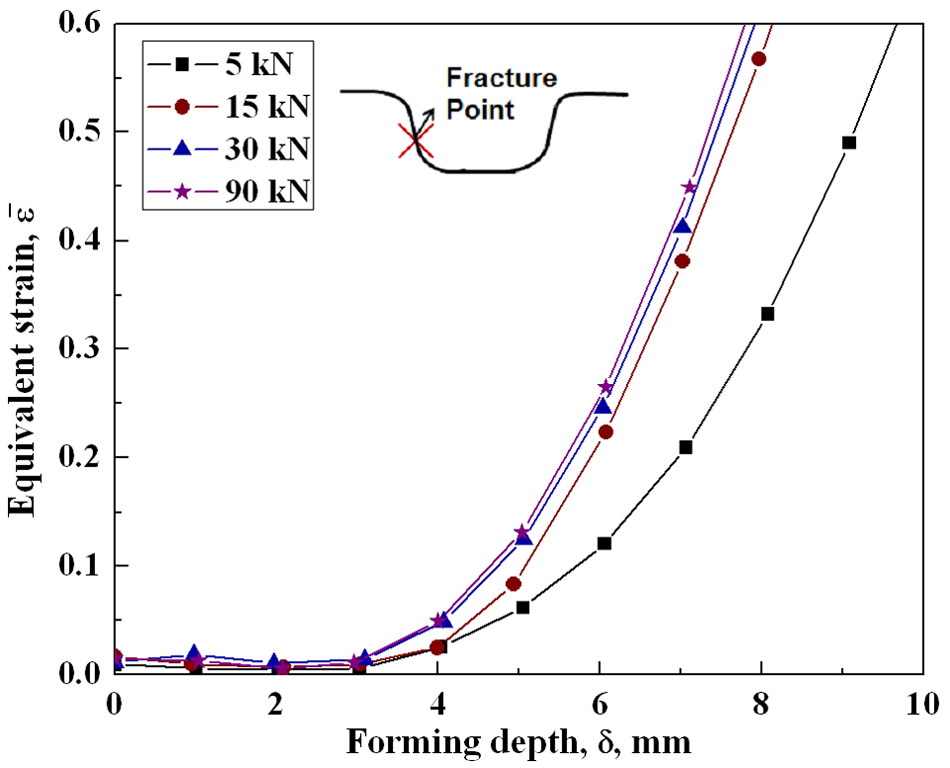
Relationship between equivalent strain and forming depth at different Bf when Vp = 6 mm/s, Ts = 950 °C.
Therefore, the thinning and equivalent strain distributions with fracture behavior according to Bf were evaluated. Figures 10 and 11 present the thinning and equivalent strain distribution in the safety and fracture region, respectively. As can be seen from Figure 10, thinning distributions according to Bf did not have a big difference. The largest thinning rate without fracture was 20.1% when Bf was 5 kN, and fracture began to occur when the thinning rate was 26.8% with a Bf of 5 kN. The blank will be in a critical region for a thinning rate of 20.1%–26.8%. As shown in Figure 11, the equivalent strain distribution decreased as Bf increased. The equivalent strain for samples without fracture (
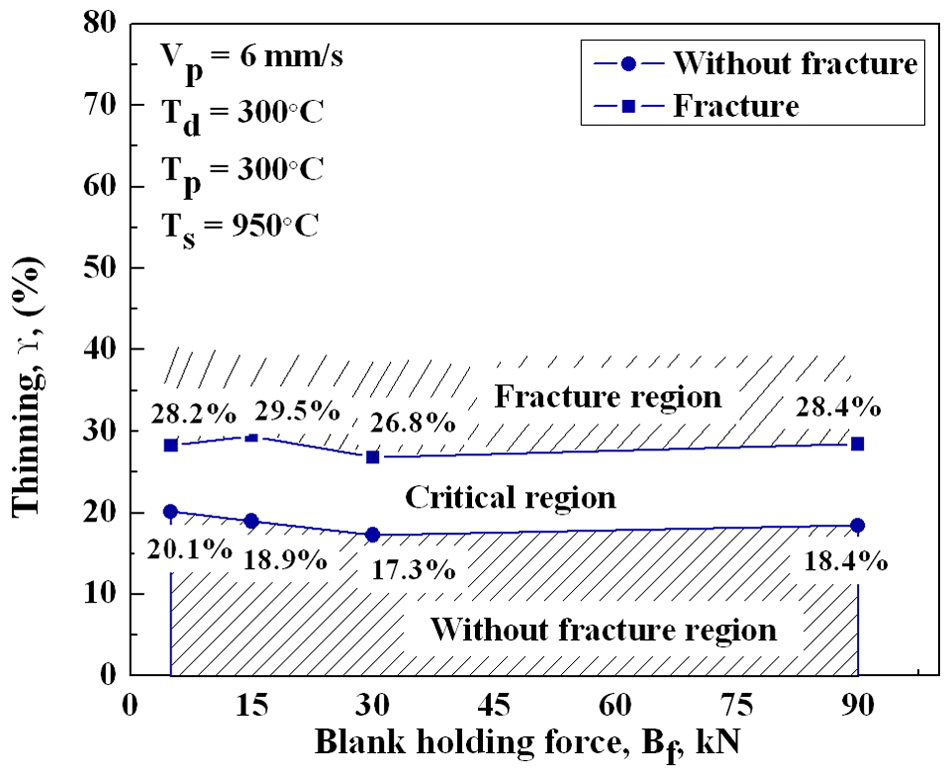
Thinning rate versus Bf in hot deep drawing.
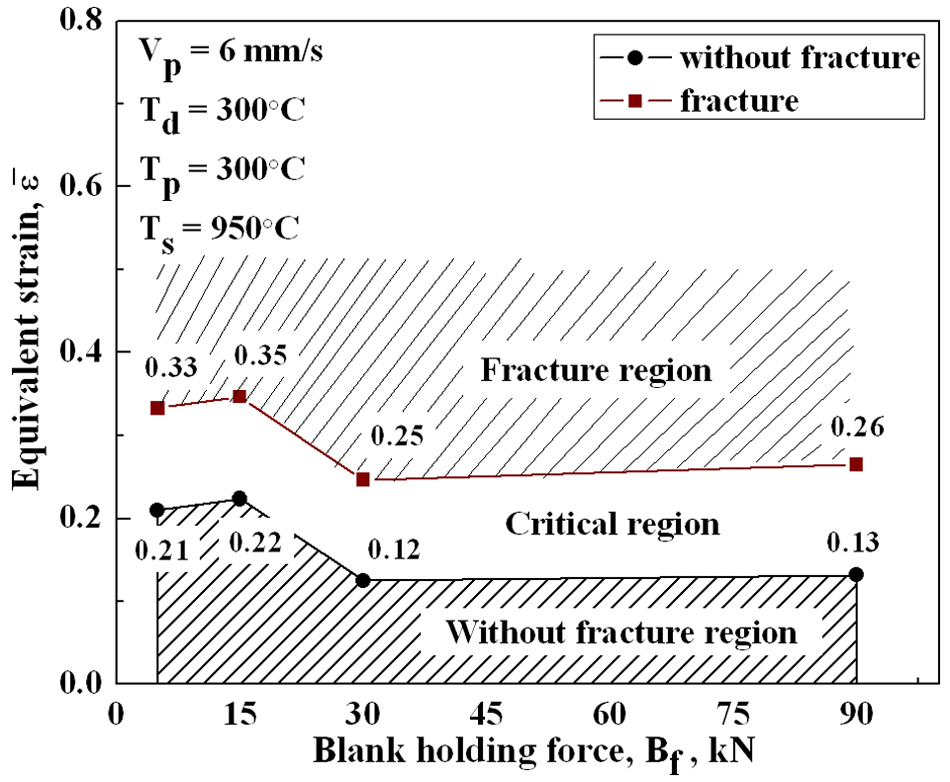
Equivalent strain versus Bf in hot deep drawing.
Furthermore, experiments were carried out to verify the simulation results. The forming depth obtained from the experiments was in agreement with the simulation results. Figure 12 shows the forming depth (δ) versus Bf. As can be seen, the forming depth (δ) without fracture was 7 mm, 6 mm, 5 mm and 5 mm for Bf values of 5 kN, 15 kN, 30 kN and 90 kN, respectively. Hence, the forming depth decreased as Bf increased. Figure 13 shows the maximum punch load versus Bf. The maximum punch load in simulation was in good agreement with the experimental results. The maximum punch loads were 25 kN, 19 kN, 18 kN and 18 kN, when Bf were 5 kN, 15 kN, 30 kN and 90 kN, respectively. Clearly, as the same trend with forming depth, the maximum punch load decreased with increasing Bf. When Bf was 5 kN, the maximum punch load was much higher than under a larger Bf. This was because the forming time was longer when Bf was 5 kN. A longer time will cause a greater reduction in the temperature of the blank and consequently needs a higher forming force.
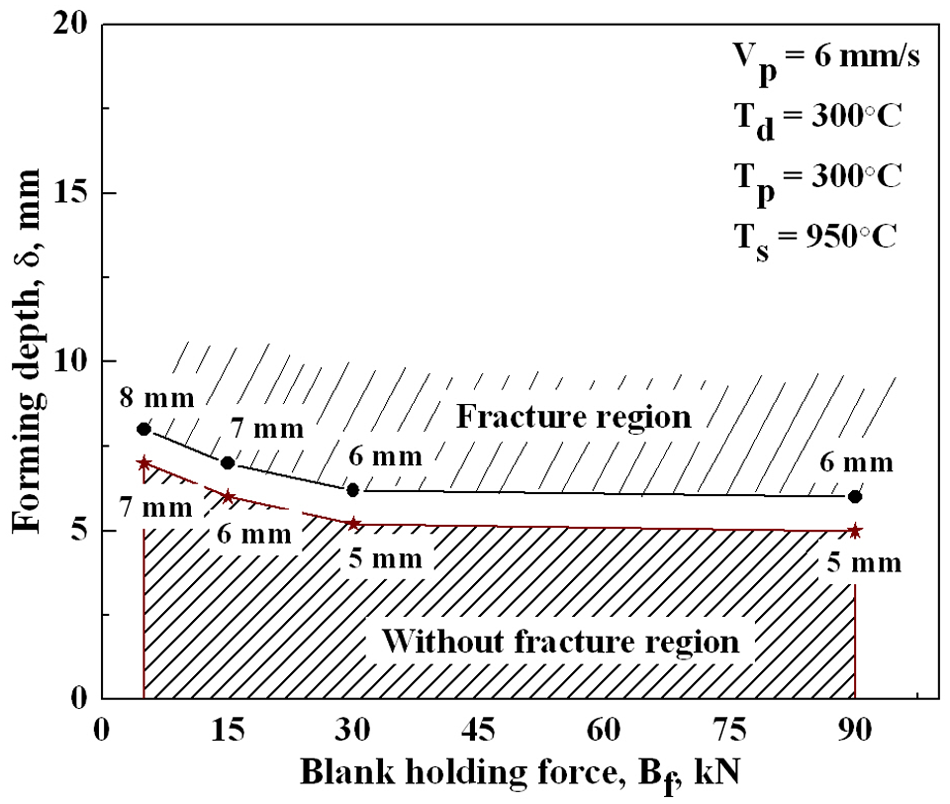
Forming depth versus Bf in hot deep drawing.
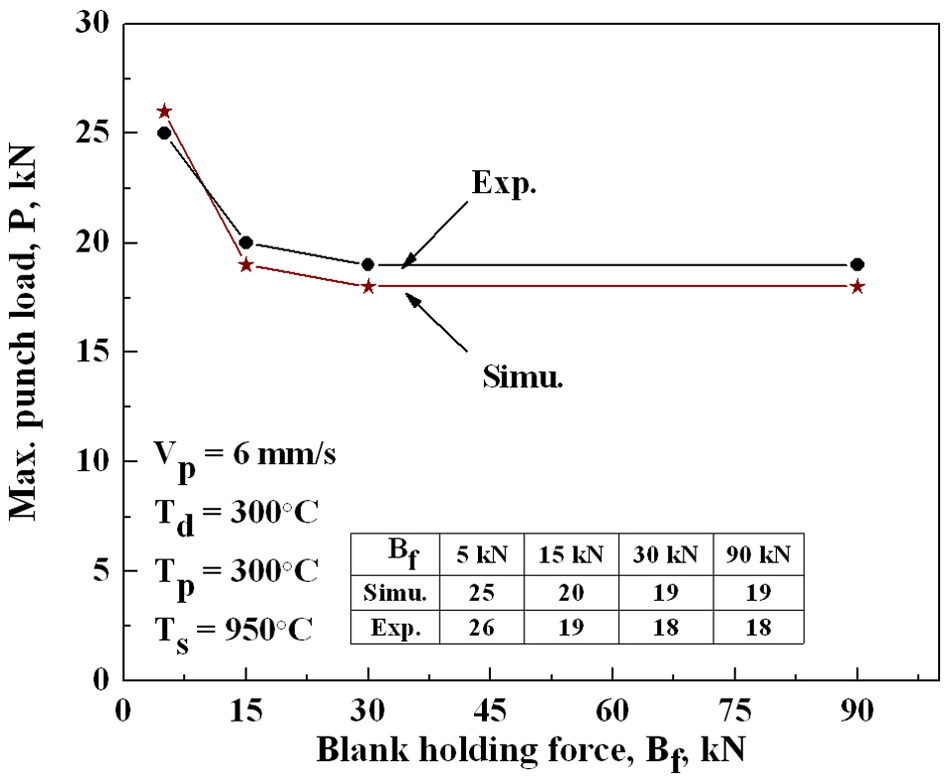
Maximum punch load versus Bf in hot deep drawing.
Figure 14 shows drawn cups without and with fracture by varying Bf obtained from numerical simulation and experimental results. As can be seen, the shape of the cups with fractures were significantly different for simulation and experimental results. Because the thickness was assumed to reach an infinitesimal amount in simulation, it can always keep a cup shape during the drawing process. However, it was totally different in the experimental conditions, in the experiments, when the thickness decreased to a certain value, cracking occurred and then the bottom part of the cups separated from the punch and no longer contacted with it. This can also explain the reason for the larger difference between the punch load-forming curves obtained from simulation and experiment after the fracture occurred.
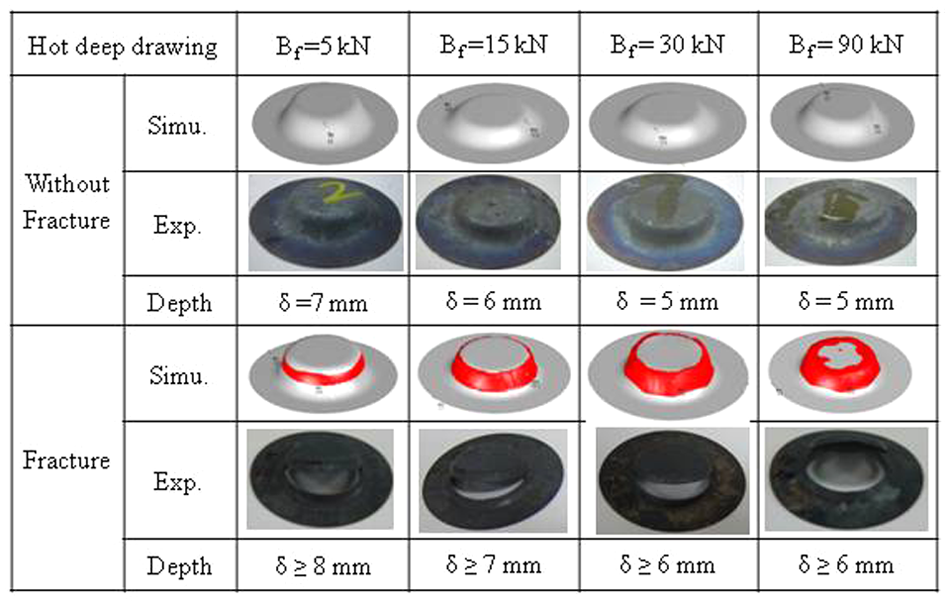
Drawn cups in fracture and without fracture state in simulation and experiments under different Bf when Ts = 950 ºC, Vp = 6 mm/s.
Figure 15 compares the thinning distribution between simulation and experimental results. As can be seen, the thinning variation trend, both in fracture and without fracture state, has an agreement between simulation and experimental results. On the other hand, the critical region obtained from simulation data, which was generated by the thinning rate in fracture and without fracture state, was narrower than that from experimental data. It means a more accurate result was obtained through simulation and the simulation result can predict a critical condition of thinning rate value in safety and fracture state in hot deep drawing, and this is mainly because the conditions in numerical simulation can be controlled in an ideal condition during the hot deep drawing process. Thus, by comparing the thinning rate distribution educed from the simulation and experimental data, it’s available to judge the appropriateness of each parameter, such as the blank and tool’s temperature, blank holding force, transfer time of the blank and ambient temperature, etc. Further study can focus on how the parameters affect the thinning distribution, respectively, and establish an accuracy level for the simulation data. Furthermore, by minimizing the difference between simulation and experimental conditions, for example controling the ambient temperature and transfer time properly, fracture occurring time can be predicted by analyzing the thinning behavior distribution curve and this can reduce the fraction defect and then reduce the manufacturing cost.
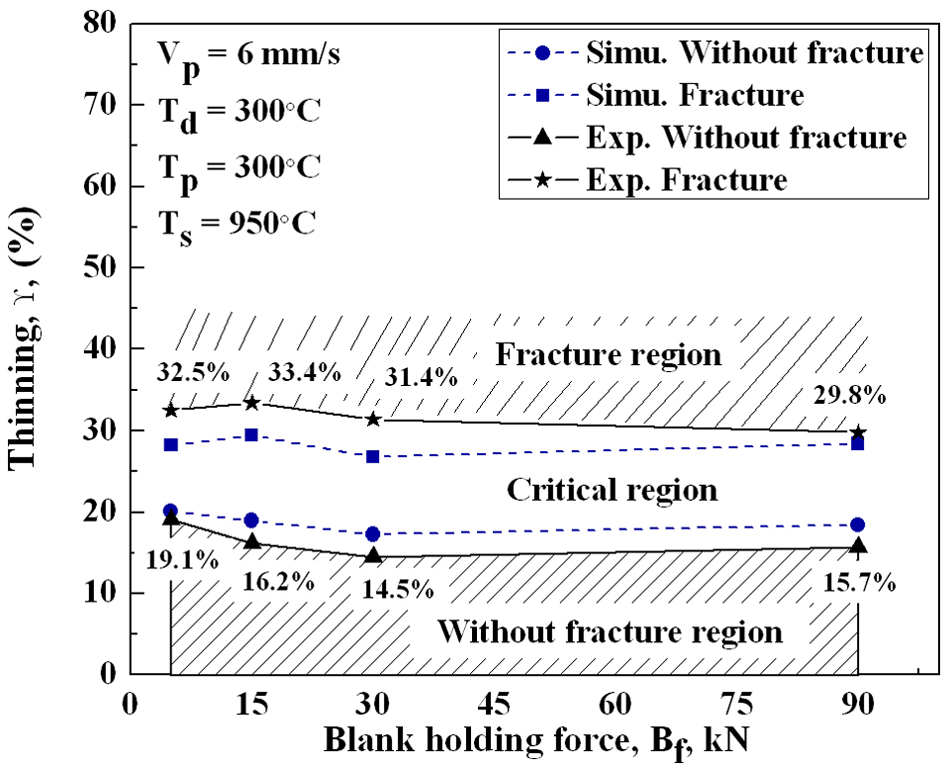
Thinning rate versus Bf in experimental and simulation results in hot deep drawing.
Conclusions
This study examined the effect of Bf on the formability of boron sheets. A J-stamp relative computer simulation was employed to model the experimental process and examine the IHTC and µ values between blank and punch. Therefore, based on the evaluated IHTC and µ values, the forming depth, maximum punch load, thickness, thinning rate and equivalent strain were examined. Accordingly, the major conclusions were obtained as follows.
The friction coefficient (µ) between blank and punch decreased with an increasing blank holding force (Bf). Specifically, µ showed a steeper negative slope when Bf < 30 kN, whereas the rate of decrease for µ became moderate when Bf > 30 kN. As observed from simulation results, a different µ value caused different forming depth and maximum punch load.
In hot deep drawing, the forming depth and maximum punch load decreased as Bf increased and the experimental result shows an agreement with the simulation results.
A larger Bf has a more significant effect on the variation of the thickness, thinning rate and equivalent strain of the samples during the drawing process. When Bf increased, the thickness of the samples decreased faster, whereas the thinning rate and equivalent strain increased more rapidly.
For samples in fracture and without fracture state, the thinning distribution did not show a large difference according to Bf. However, the equivalent strain, both in fracture and without fracture state, decreased sharply by increasing the Bf (from 5 kN < Bf < 30 kN). On the other hand, when the Bf increased to a higher value (Bf > 30 kN), the thinning rate and equivalent strain almost stay the same according to Bf.
As stated above, in hot deep drawing, the boron steel has a better formability under lower Bf (5 kN∼15 kN). However, in this study, the experiments were carried out under dry lubrication conditions and with a fixed punch velocity. As observed from the numerical simulation results, different µ values between blank and punch also have great influence on the forming depth and maximum punch load. Further study needs to be carried out for the hot deep drawing with different parameters, such as initial blank temperature, lubrication conditions and punch velocity, etc., and investigate the influence of these parameters on thinning rate distribution and establish an accuracy level for the simulation data. Thus, by comparing the thinning rate distribution educed from the simulation and experimental data, we are able to judge the appropriateness of the parameters.
Footnotes
Appendix
Funding
This research was supported by the National Research Foundation of Korea (NRF) grant funded by the Korea government (MEST) through GCRC-SOP (Grant No. 2012-0001204); by Korea Institute of Energy Technology Evaluation and Planning funded by 2010 Ministry of Knowledge Economy (No. 20104010100540); and by Korea Industrial Technology Foundation (KOTEF) through the Human Resource Training Project for Strategic Technology.