
Abstract
The measurement and evaluation of spindle errors is an important task in the assessment of the accuracy of machine tools. The commonly followed capacitive-sensor-based measurement technique requires a comprehensive error separation method for the identification of the unwanted contributions of centering error, the form error of the artifact and thermal drift. This paper presents a method for form error separation that is suitable for the evaluation of the radial error of high-speed spindles. In the present work, a fixed sensitive radial error motion test is conducted using a capacitive sensor and a cylindrical artifact at different spindle speeds. A mathematical model consisting of a second-order polynomial and Fourier series function is used to interpret the data measured in the time domain. The form profile of the artifact is measured separately in a roundness tester using a capacitive sensor. A harmonic analysis method is proposed to identify and separate the dominant harmonic components in the form profile of the artifact. A mathematical description of the proposed method is described and experimental results are presented. Application of the proposed method to the evaluation of the synchronous radial error of a high-spindle is provided for measured data. The proposed method analyzes the data measured in the time domain and is suitable for the identification of the spindle errors at high-speed conditions.
Introduction
Miniaturization is a major driving force in current manufacturing operations. Various micromachining technologies such as mechanical micromachining, electro-discharge machining, laser beam machining and electrochemical machining have been developed to manufacture micro-sized parts. 1 Among these techniques, mechanical micromachining using miniaturized machine tools has the unique advantage of producing three-dimensional miniaturized components using micro-sized cutting tools. 2 In a miniaturized machine tool, the spindle provides an axis of rotation to the tool or workpiece and its performance is an important consideration in achieving the desired accuracy of the miniaturized components. 3 As the size of the micro tools is in the sub-millimeter region, the typical spindle speed needs to be maintained close to 100,000 r/min to obtain the required cutting speed. Modern spindles in miniaturized machine tools must meet both the required high-accuracy requirements and the ever increasing order of spindle speed. However, in a typical spindle system the axis of rotation is affected by radial, axial and tilt error motions. 4 These errors lead to inaccurate positioning of the edge of the cutting tool which creates machining errors in the form and surface finish of the machined parts. 5 Consequently, the measurement and evaluation of spindle errors is essential to ensure the machining accuracy of miniaturized machine tools.
Attempts have been made to measure spindle error motion under high-speed conditions using laser-based measurement systems. A rotation fixture consisting of a laser diode and position-sensitive detectors has been developed for the measurement of radial and tilt error motions of a CNC machine tool spindle. 6 It is difficult to install the rotational fixture in a miniaturized machine tool spindle due to size limitations. An optical measurement system based on the auto-collimation principle of a laser beam has been developed for the measurement of the radial runout of a miniaturized machine tool spindle. 7 The output characteristics of the laser beam is non-linear with respect to the displacement of the spindle due to the reflectivity of the target surface installed in the spindle. Also, this method requires longer set-up times for the installation of the precision instrumentations such as optical lenses and photodiodes in the miniaturized machine tool.
Capacitive sensors uniquely meet the demanding requirements of spindle error measurement such as non-contact measurement, small size, high resolution, adequate sensing range and high bandwidth. 8 Traditionally, a master sphere or flat is mounted on the spindle and its surface is used as a reference for measuring the error motions of the spindle. This method requires very few accessories and has a shorter set-up time. However, the accuracy of the spindle error measurement is affected by inevitable contributions from the thermal drift of the spindle, centering error and form error of the master artifact. 8 Mathematical models have been developed for the estimation of the thermal drift errors using the temperature distributions at the specific locations of a high-speed machine tool spindle. 9 The contribution of the thermal drift of the spindle affects the measurement data which can be removed by least-squares fitting using a second-order polynomial function. 10
Error separation techniques to eliminate the contributions of centering error and form error of the master artifact in spindle error data have been reported in the literature. The centering error of the master artifact causes a sinusoidal component in the measured data, hence the fundamental component in the spindle error data is removed using a Fourier-transform-based filtering technique. 11 However, the level of accuracy that can be obtained using the Fourier transform method is affected by speed variations during the measurement of the spindle errors. The best-fitting sine wave for the measured data is determined to allow the interpretation of the contribution of the centering error of the artifact. 12 Unfortunately this method is not suitable for the interpretation of the other harmonic components of the measurement data.
Form error separation is an important issue in the measurement and evaluation of spindle error motions. A variety of methods have been proposed to isolate and remove the contribution of the form error of the artifact from spindle error measurements. A comprehensive survey of the error separation techniques widely used in spindle error measurement has been presented by Evans et al. 13 Principles and measurement configurations have been provided for several error separation techniques including the reversal method, the multi-step method and the multi-probe method. 14 These methods have been widely adopted for use with rotary spindles in roundness measuring instruments and conventional machine tool spindles operating at low speeds. Implementation of existing error separation techniques requires precise measurement setups involving multiple sensors, rotary tables and indexing mechanisms. It is difficult to implement existing error separation techniques in miniaturized machine tool spindles due to aspects such as high spindle speeds, space limitations and speed variations.
Considering the practical difficulties encountered in implementing the existing error separation methods, attempts have been made to perform the spindle error separation process using imprecise artifacts. An external master taper is attached to the spindle system and used as a reference in the measurement of error motions of the spindle. 15 This method requires an additional proximity sensor for the measurement of the displacement of the master artifact. A simple technique that is based on the averaging of measured data has been proposed for the evaluation of the spindle error motion. 16 In this method, the measured data obtained in odd and even revolutions of the spindle are separated and averaged for the determination of the error motion of the spindle. However, the averaging method cannot eliminate the contribution of asynchronous components due their change in magnitude in each revolution. Use of imperfect references for on-machine measurement of cylindricity and roundness of the workpieces has been demonstrated using a laser-based measurement system in a cylindrical grinding machine. 17 However, it requires longer set-up times due to the alignment of the laser beam and requires precise optical components. A frequency domain filtering method is applied to remove the contribution of the form error of the artifact based on the selection of a harmonic cutoff value. 3 The accuracy of the results obtained using a frequency domain analysis is affected by spectral leakage due to speed variations at high-speed conditions.
From the presented literature review it is clear that form error separation process is a difficult task in spindle error measurements. Existing methods require angular domain sampling using a rotary encoder, additional measurement set-ups and a large number of sensors. It is difficult to implement these methods in a miniaturized machine tool due to space limitations. Fourier-transform-based frequency domain analysis methods are not suitable for analyzing time sampled measurement data. This paper presents a new approach to the separation of the form error of an artifact in spindle measurement data. A mathematical model consisting of a second-order polynomial and a Fourier function is used to identify the harmonics of the components in the measured data. In the proposed method, the form error of the artifact is analyzed separately in a roundness tester. The dominant harmonic component is identified in the form profile and it is separated from the spindle error measurement data. The proposed method is applied to data obtained from a high-speed spindle and the results are presented in this paper.
Measurement of radial errors of a high-speed spindle
In the present work, a fixed sensitive radial error motion test was conducted to measure the radial errors of a high-speed spindle. The testing procedure was adopted from the widely used ANSI/ASME B.89.3.4M standard. 4 A cylindrical artifact was used as the target in the measurement of the radial errors of the high-speed spindle. A capacitive sensor was placed in the fixed sensitive direction of the spindle using the probe holder. The capacitive sensor was supplied by Lion Precision (Saint Paul, Minnesota, USA) and its specifications are given in Table 1.
Technical details of the capacitive sensor used in the spindle radial error measurement.
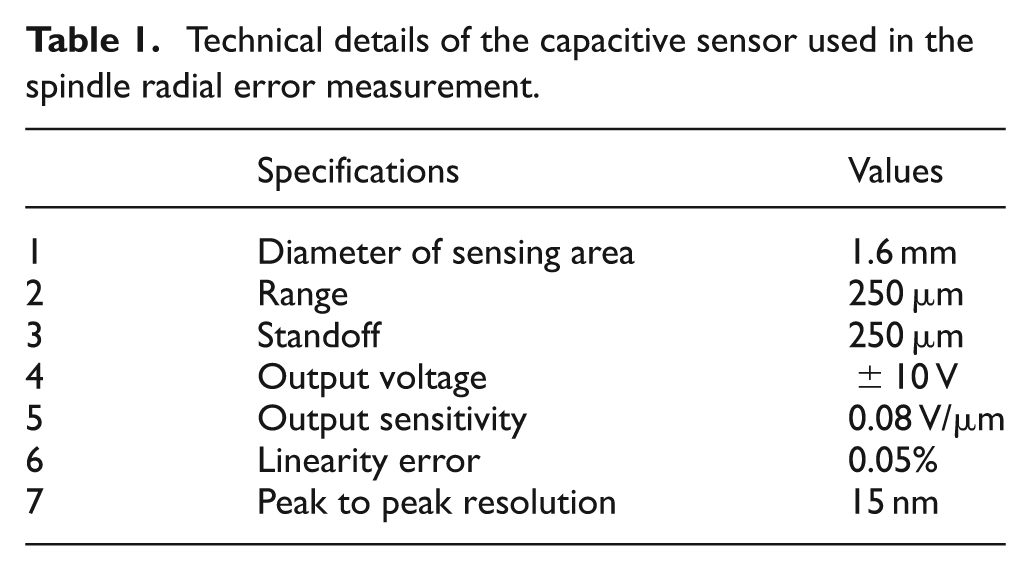
Figure 1 shows a schematic representation of the setup used to measure the spindle’s radial error. The surface of the artifact was used as the reference surface in the measurements on the error motions. However, in practice, the surface profile of the artifact deviates from a perfect circle due to manufacturing irregularities such as form error of the artifact. It is also difficult to align the axis of rotation of the spindle and the geometric axis of the artifact. This results in a centering error of the artifact as shown in Figure 1. The contributions due to centering error and form error of the artifact are inherent and inevitable in spindle error measurement. 4
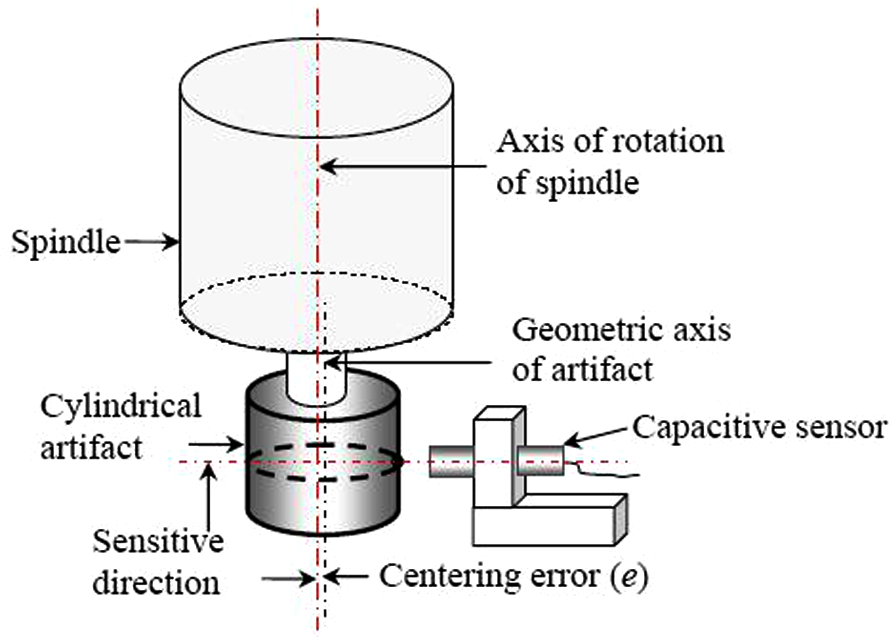
Schematic representation of the measurement setup.
The actual experimental arrangement used in the measurement of the radial error for a high-speed spindle is shown in Figure 2(a). A close-up view of the miniature spindle used in the tests is presented in Figure 2(b). This spindle system was manufactured by Alfred Jager GmbH (Ober-Mörlen, Germany).

Experimental setup used in the spindle radial error measurements (a) the miniature machine tool and (b) a close-up view of the high-speed spindle.
The spindle rotates about the vertical axis and is supported by hybrid ceramic ball bearings. The measurements of the spindle’s error were carried out at a controlled temperature of 25 °C for spindle speeds in the range between 5000 and 70,000 r/min.
Discrete time interval sampling of data
A computer-controlled data acquisition system was used to sample the data at discrete time intervals. In order to avoid the aliasing effects, the sampling frequency (fs) was fixed using the Nyquist criteria so that it was at least twice the product of the desired harmonic cutoff (H) and the spindle’s rotational frequency (fr), as given by equation (1)

where H represents the desired harmonic cutoff in undulations per revolution (UPR) and fr corresponds to the spindle’s rotational frequency for the specified spindle speed (N). In the present work, the harmonic cutoff value was selected to be 30 UPR.
Measurement data was sampled at discrete time intervals for numerous revolution speeds of the spindle and stored in the computer for further analysis. Figure 3 shows measured data obtained at a spindle speed of 30,000 r/min. It shows a repetitive sinusoidal pattern with superimposed periodic components, which is due to the contribution of the centering and form errors of the artifact in each spindle revolution.
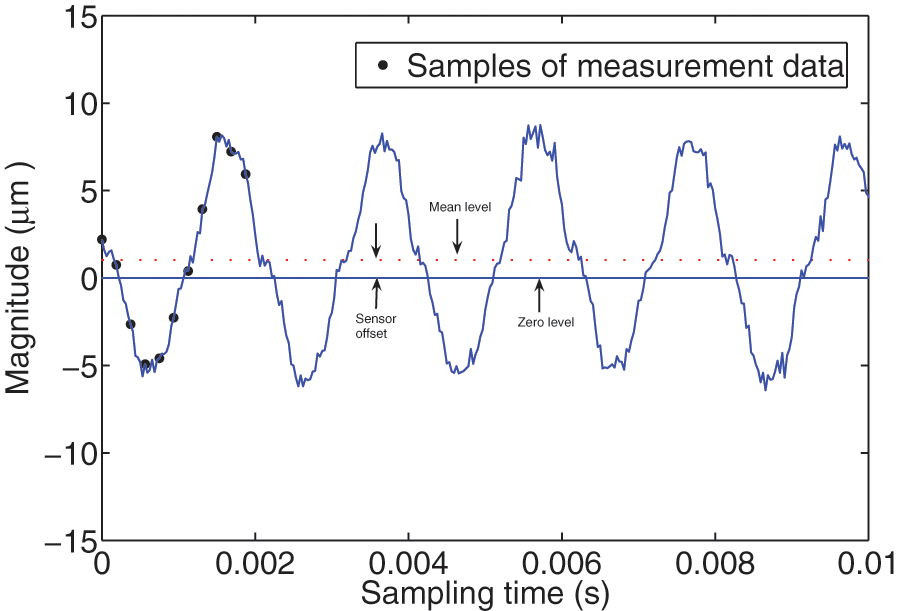
Measurement data obtained at a spindle speed of 30,000 r/min.
There is a deviation between the zero level and mean of the measured data which is indicated as sensor offset in Figure 3. It is a result of the offset between the mean position of the artifact and the range center of the sensor. The spindle also exhibits thermal drift due to the friction between the bearing elements during rotation which causes a non-linear trend in the measured data. Accurate evaluation of the spindle’s radial error motion requires preprocessing of measured data to remove the unwanted contributions of centering error, form error of the artifact and thermal drift of the spindle.
Modeling and interpretation of the measured data
The measured data is considered to be a composite signal that contains contributions from the sensor offset, thermal drift of the spindle, centering error, form error of the artifact, along with synchronous and asynchronous radial errors of the spindle. Let


It was observed that the measured data contains repeating periodic components in each spindle revolution. In this work, a Fourier series function was used to model the repeating components in each spindle revolution. It refers to the synchronous components of the measured data and includes the combined contribution of centering error, form error and synchronous radial error of the spindle. A second-order polynomial function was used to represent the behavior due to the thermal drift of the spindle. The contributions of thermal drift (mt i ) and synchronous components (ms i ) can be represented by equations (4) and (5)

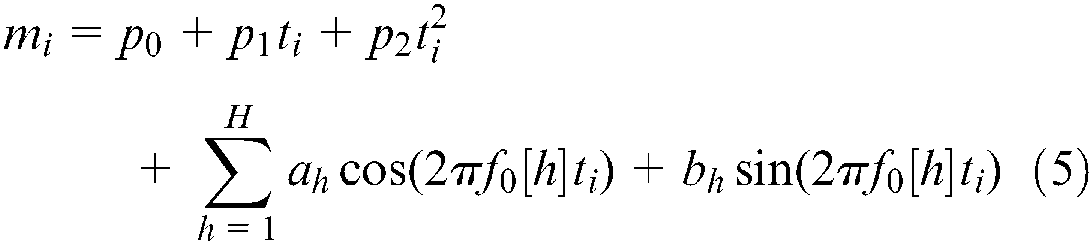
where p0 represents the mean value of the measured data, p1and p2 represents the coefficients of the second-order polynomial function, ah and bh are coefficients that represent the magnitude of the harmonic components in the measured data, f0 is the fundamental frequency of the radial error data, H is the number of harmonic components to be included in the model in units of UPR and ti is the sampling time of the measured data.
The asynchronous radial error of the spindle is not explicitly considered in the proposed model. However, it is reflected in the residual values between the measured data and the estimated values using the model.
Estimation of model parameters
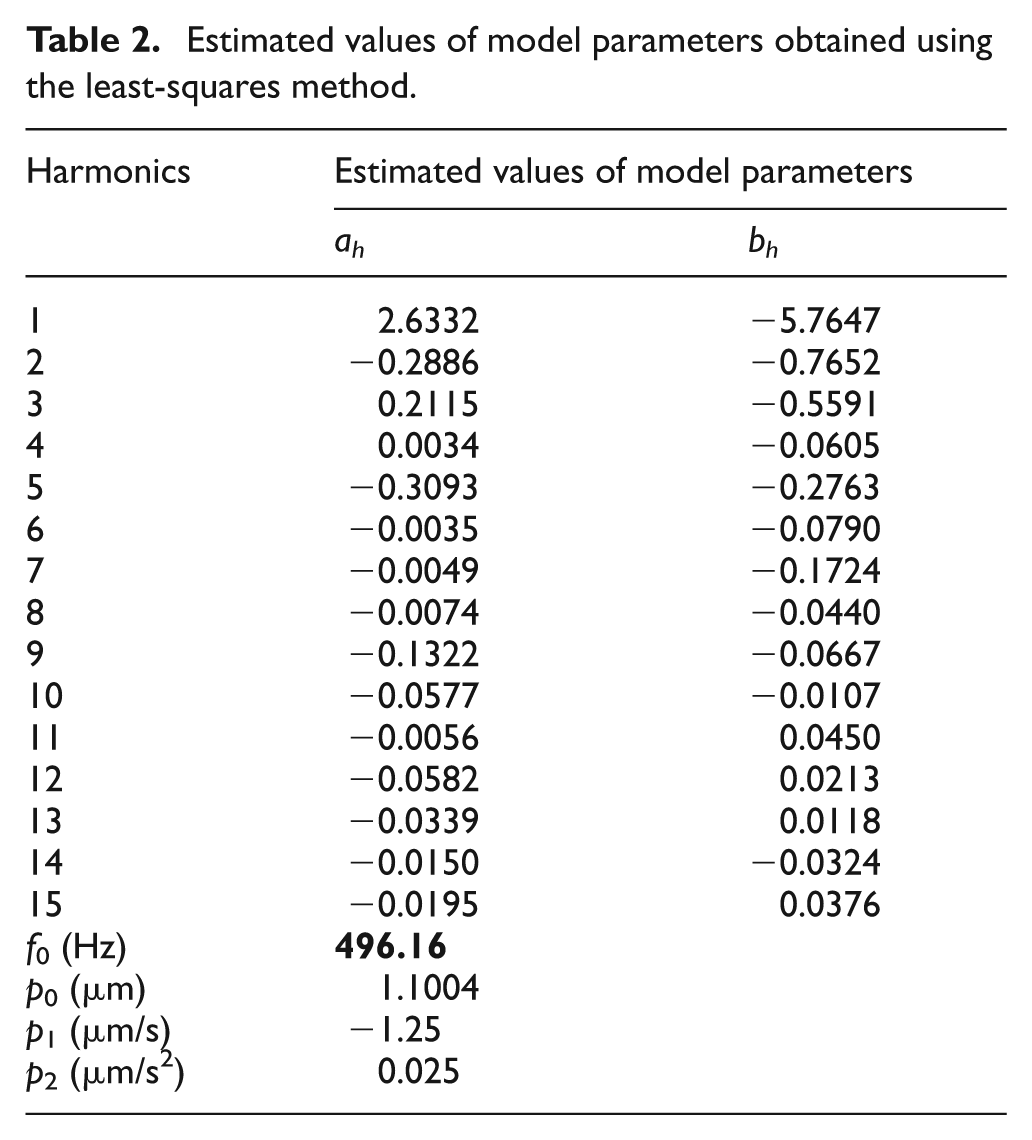
In order to isolate the different contributions to the measured data, the best-fitting harmonic curve to the measured data was determined by estimating the parameters of the mathematical model. In equation (5), p0, p1, p2, ah, bh are linear parameters and f0 is the non-linear parameter of the model. An iterative least-squares method was used to estimate the parameters of the model which minimized the sum of the squared residuals of the mathematical model. A description of the proposed least-squares method for estimating the model parameters is given in Appendix 2. A grid search iteration method was used to determine the fundamental frequency of the measured data. In this method, a set of frequency values are selected for the best-fitting harmonic curve around the spindle’s rotation frequency and the corresponding sum of squared residual values is estimated using a least-squares method. Figure 4 shows the results obtained for the estimation of the fundamental frequency of the measured data obtained at a spindle speed of 30,000 r/min. Here the frequency range was selected to be around 30,000/60 = 500 Hz. The minimum value for the sum of squared residual was found be 62.01 µm2at a frequency of 496.19 Hz, as highlighted in Table 2. Figure 5(a) shows the best-fitting harmonic curve for the measured data and it was found to have a correlation coefficient of 0.987. The best-fitting harmonic curve represents the combined contribution of the mean level of the measured data, the thermal drift of the spindle, the centering error, the form error of the artifact and the synchronous radial error of the measured data. Figure 5(b) shows the residuals which are the differences between the measured data and the estimated values obtained using the proposed model. Only small values were obtained for the residuals and no obvious pattern can be discerned in Figure 5(b). These results demonstrate the suitability of the proposed model and method for analyzing data measured in the time domain.
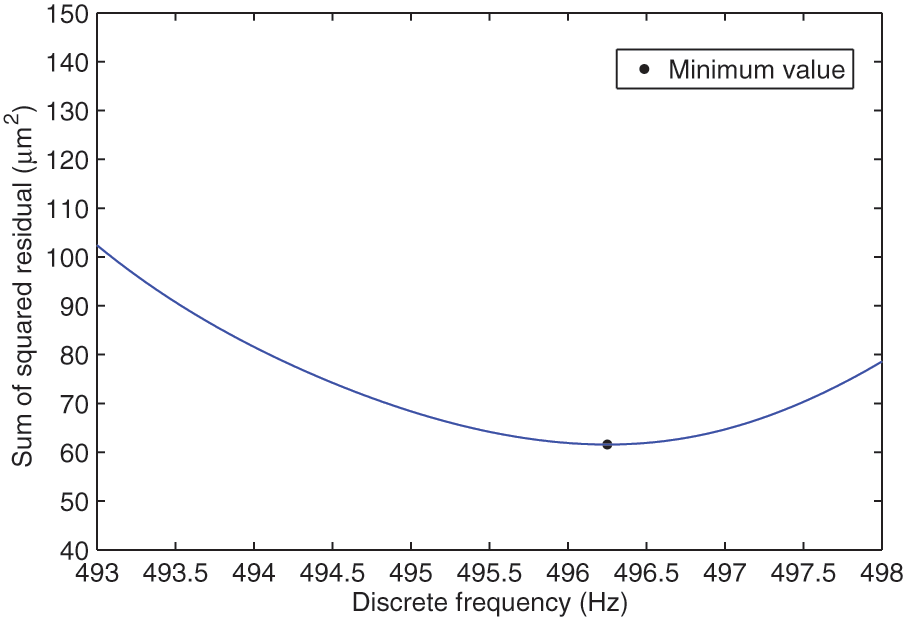
Estimation of the fundamental frequency of the measured data.
Estimated values of model parameters obtained using the least-squares method.
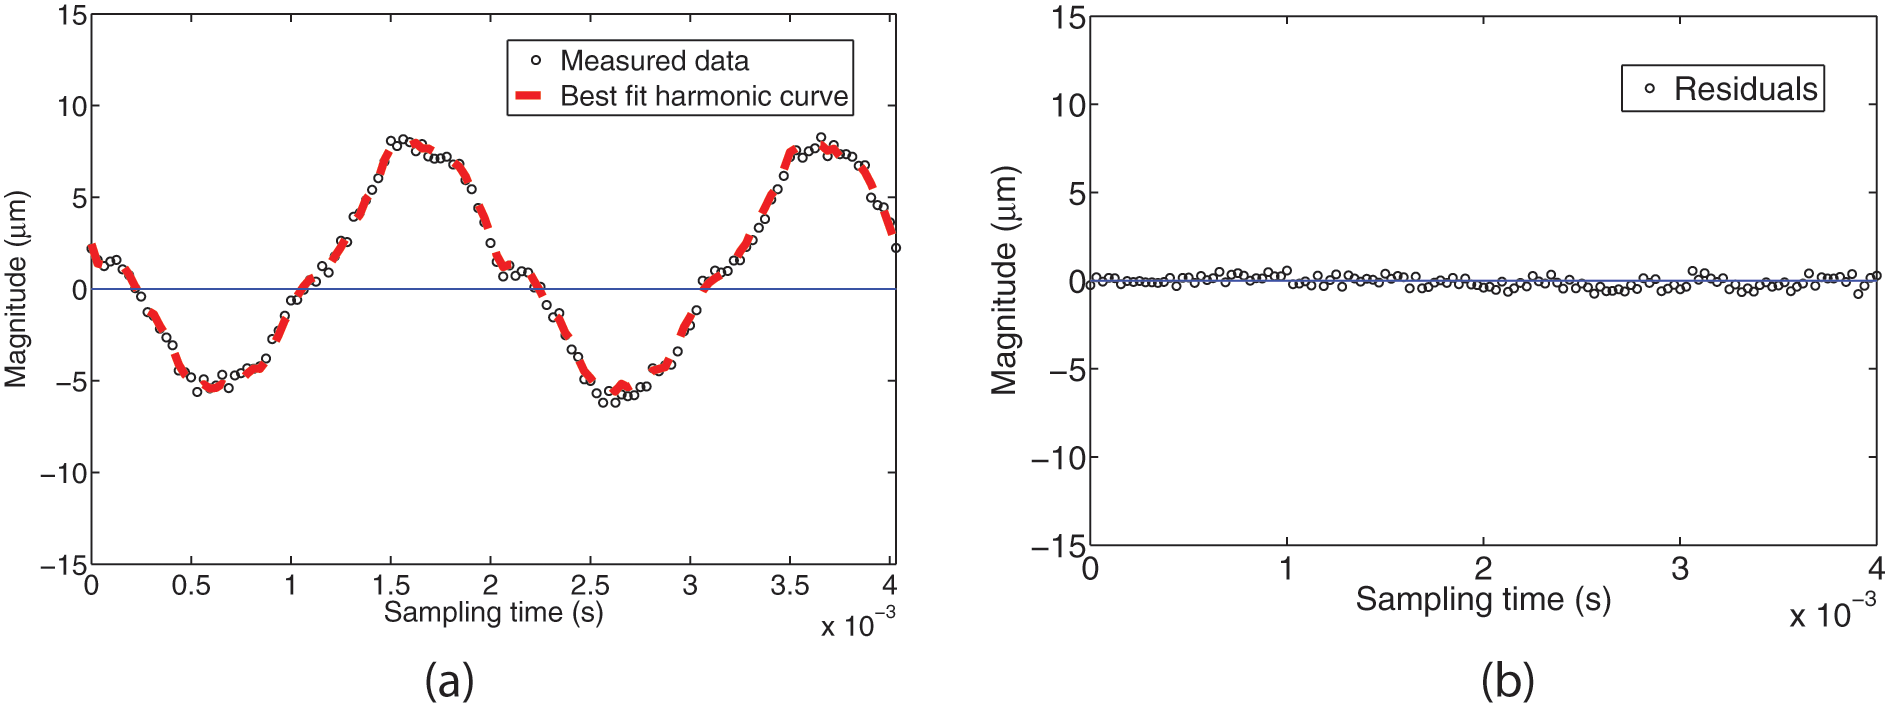
(a) Best-fitting harmonic curve for the measured data obtained at a spindle speed of 30,000 r/min and (b) the residuals which are the differences between the measured data and the estimated values obtained using the proposed model.
Table 2 shows the estimated values for the model parameters and the Fourier coefficients obtained using the least-squares method. It can be observed that the magnitude of the first harmonic component (h = 1) is higher than the other components and it represents the contribution of the centering error of the artifact. Other harmonic components (h > 2) require furthur analysis since they contain the combined contribution of the form and synchronous radial errors of the spindle.
Estimated values of the model parameters used to obtain the individual contributions of the thermal drift of the spindle, centering error of the artifact, synchronous components, asynchronous components and their mathematical description is provided in Appendix 3. The decomposed components of the measured data for the spindle error are given in Figure 6 and sample values are listed in Table 3.
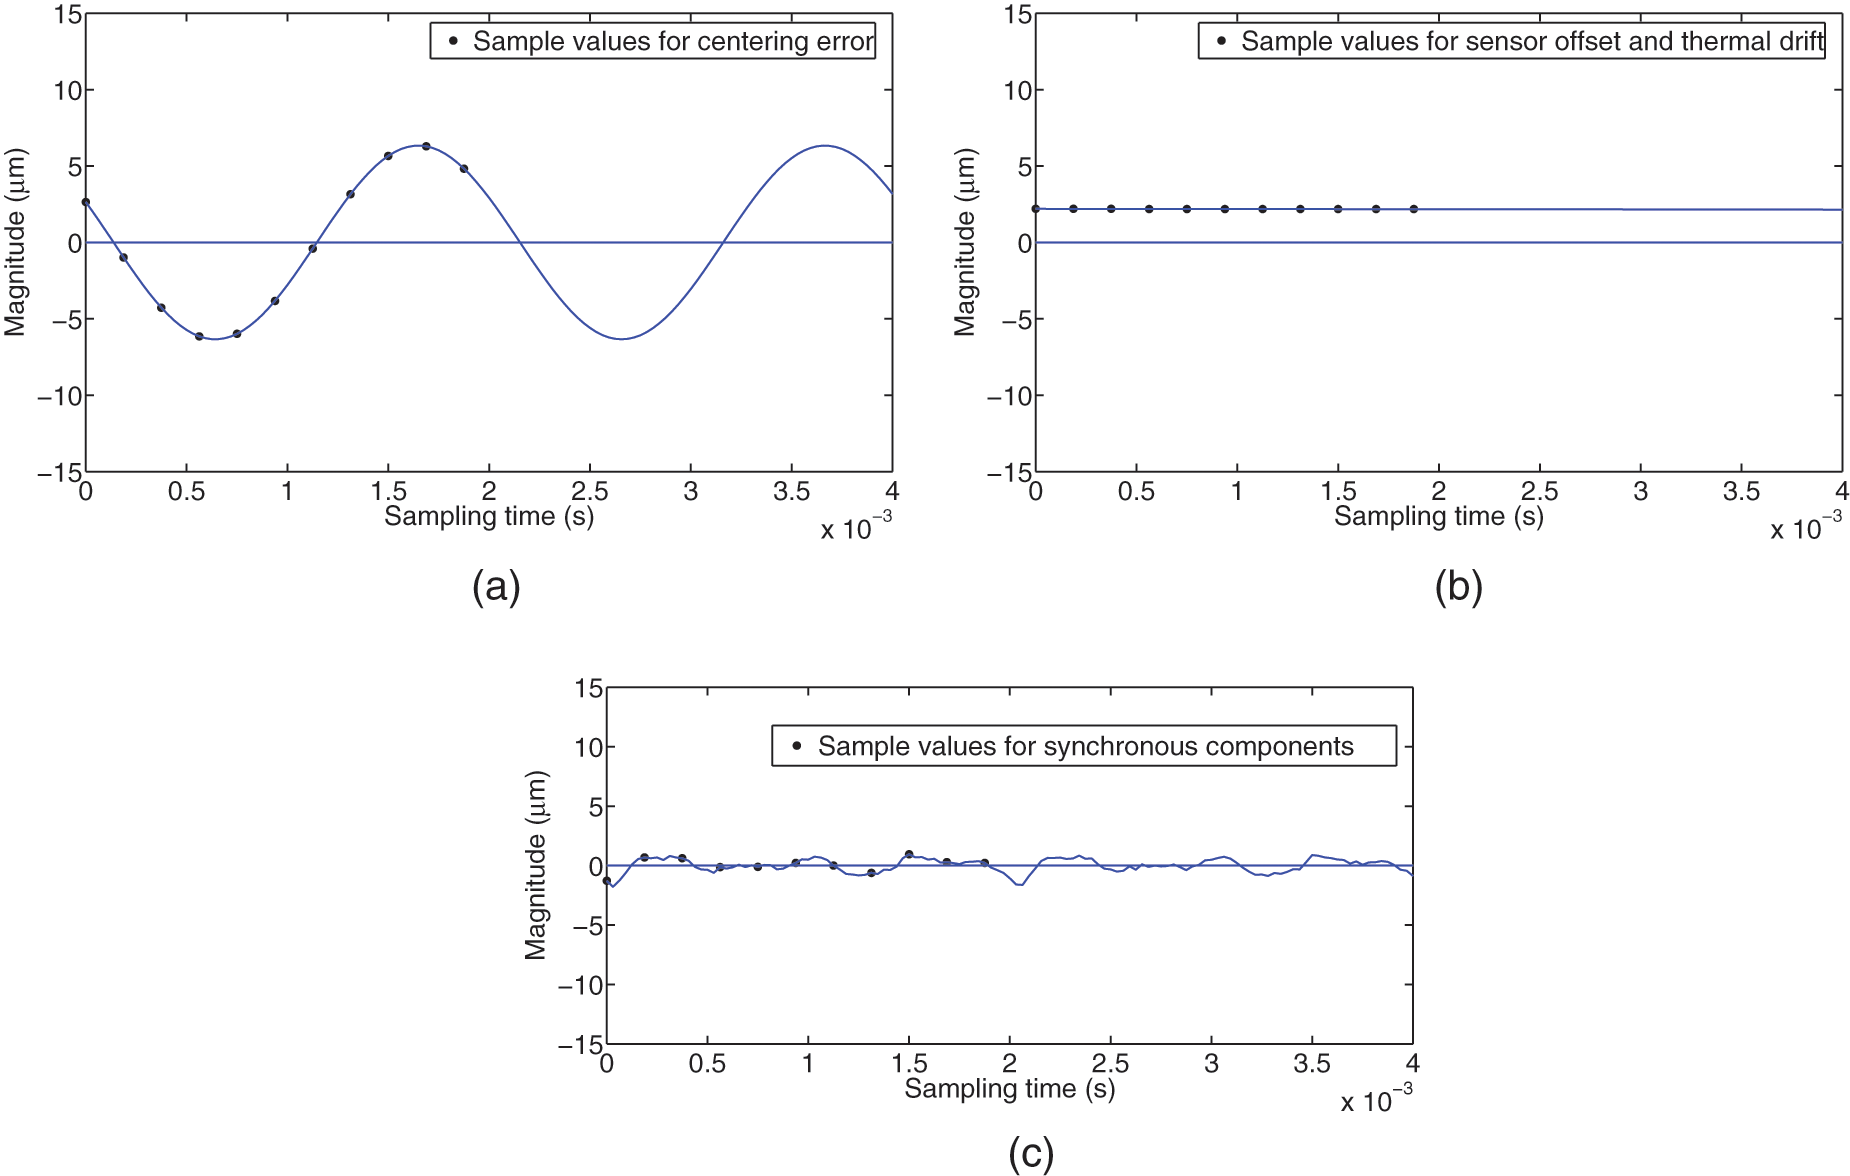
Decomposed components of the measured data obtained at a spindle speed of 30,000 r/min (a) centering error of the artifact, (b) sensor offset and thermal drift of the spindle and (c) synchronous components.
Sample values for the decomposed components of the measured data.
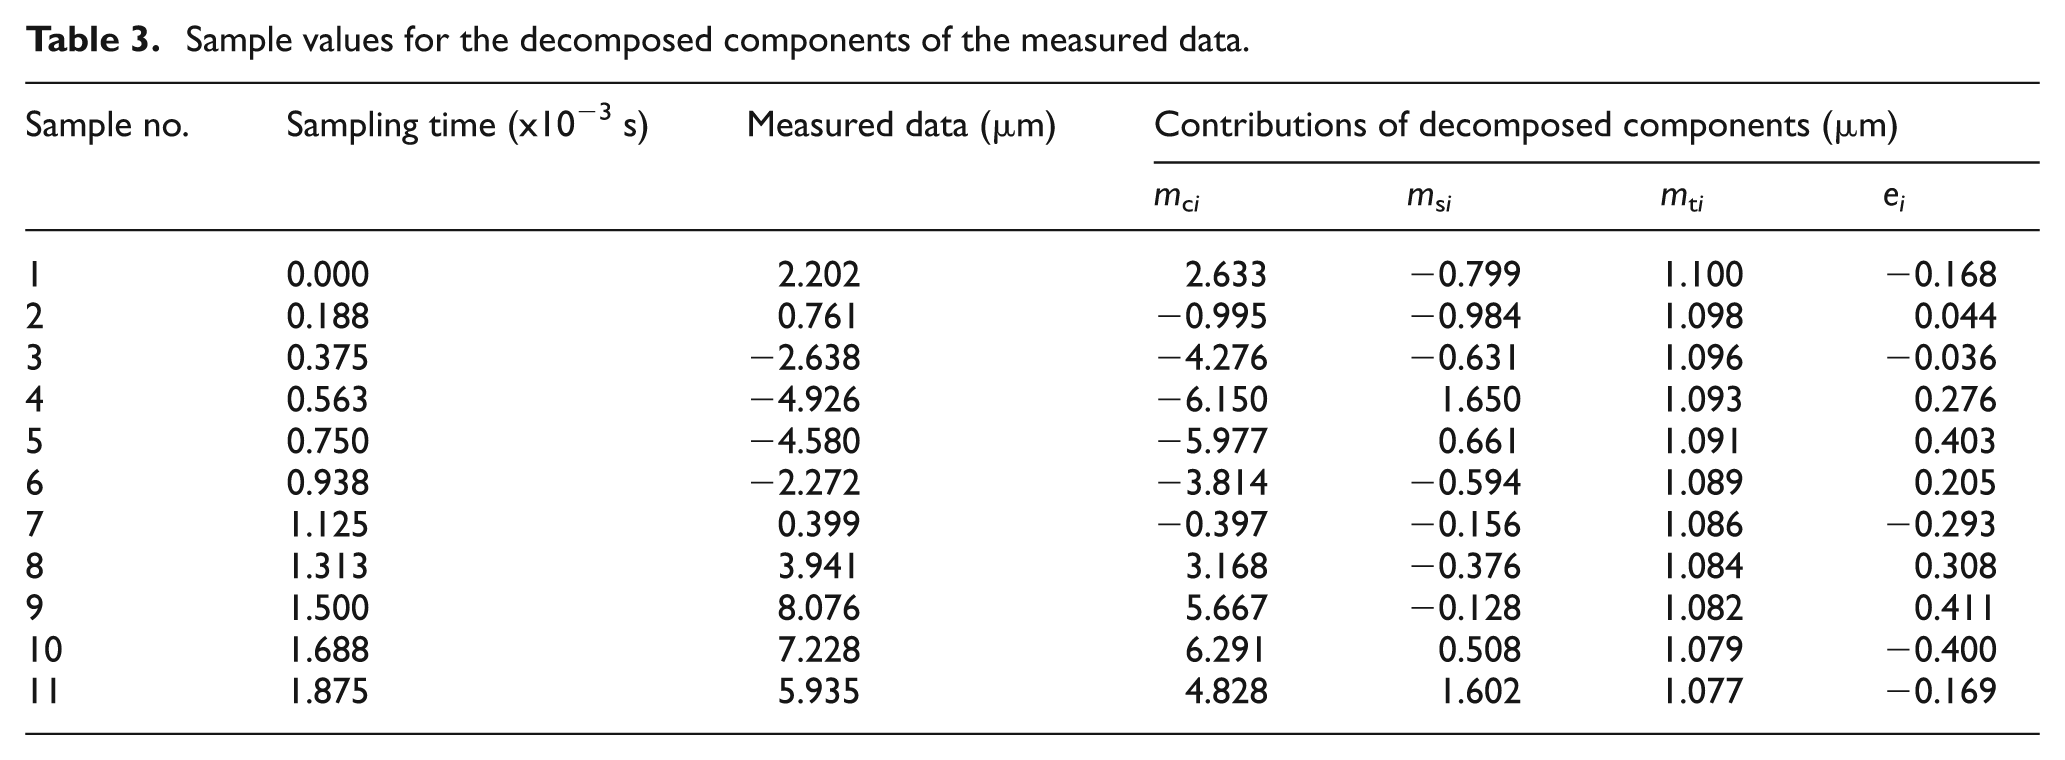
Figure 6(a) shows the contribution of the centering error of the artifact and it represents the first harmonic component of the measured data. The combined contribution of the mean of the measurement data and thermal drift of the spindle is given in Figure 6(b). The contribution of other harmonic components (h > 2) corresponds to the synchronous components of the measured data and they are shown in Figure 6(c). It contains the combined contribution of the form error of the artifact and the synchronous radial error of the spindle. In this paper, an approach is proposed for the isolation of the contribution of the form error of the artifact and it is explained in the following section.
Proposed method for form error isolation
In the proposed method, the form profile of the artifact is measured by a roundness tester using a capacitive sensor. Harmonic components in the form profile of the artifact are analyzed comprehensively in order to indentify their contribution to the measured radial error of the spindle. The dominant harmonic components in the form profile of the artifact are identified and removed from the synchronous components of the measured spindle error data. The steps involved in the proposed method are outlined in Figure 7 and it is explained in detail in the following subsections.
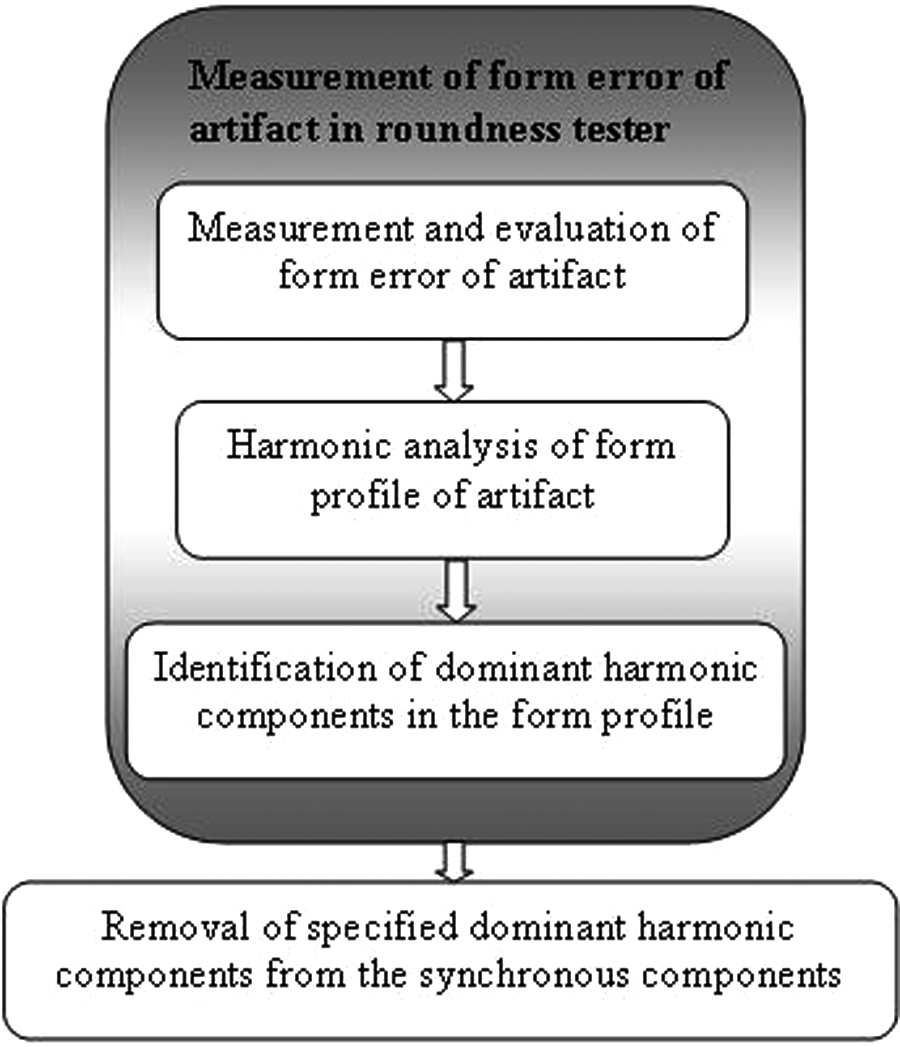
Outline of the proposed method for form error separation.
Measurement and evaluation of the form error of the artifact
The form profile of a cylindrical artifact was measured in a roundness tester using a stylus probe and capacitive sensor. The experimental arrangement used for the form error measurement is shown in Figure 8.
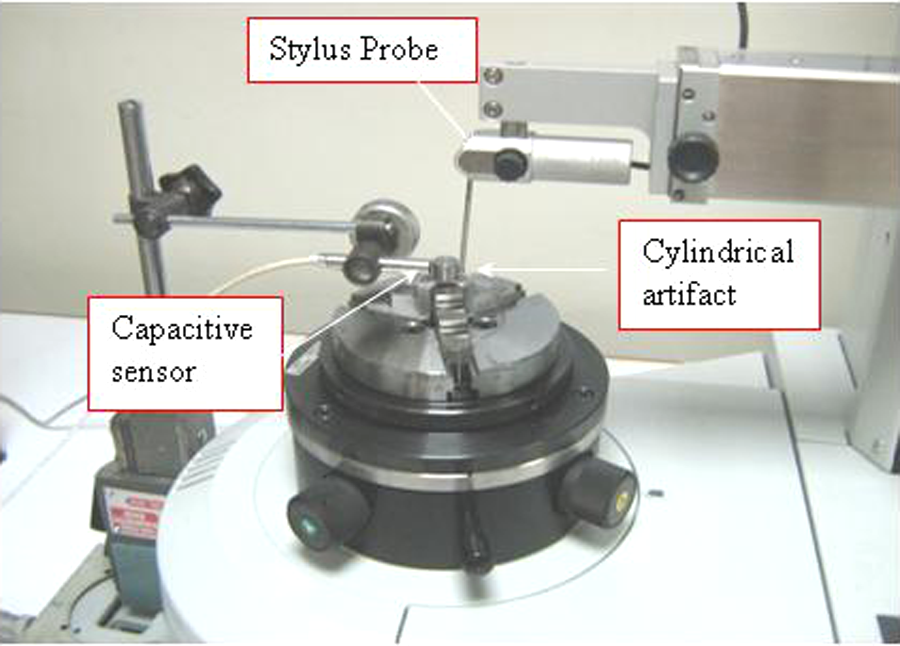
Experimental arrangement used in the measurement of the form error of the artifact.
Figure 9(a) shows a polar plot of the form profile of the cylinder measured by the stylus probe. Here the deviations are shown for a plotting circle with a radius of 22.5 µm. Easy form analysis software was used to assess the roundness error with a harmonic cutoff value of 30 UPR and it was found to be 5.430 µm. Figure 9(b) shows the harmonic components in the form profile of the cylinder. It can be observed that the magnitude of the second harmonic component is higher than the other harmonic components.
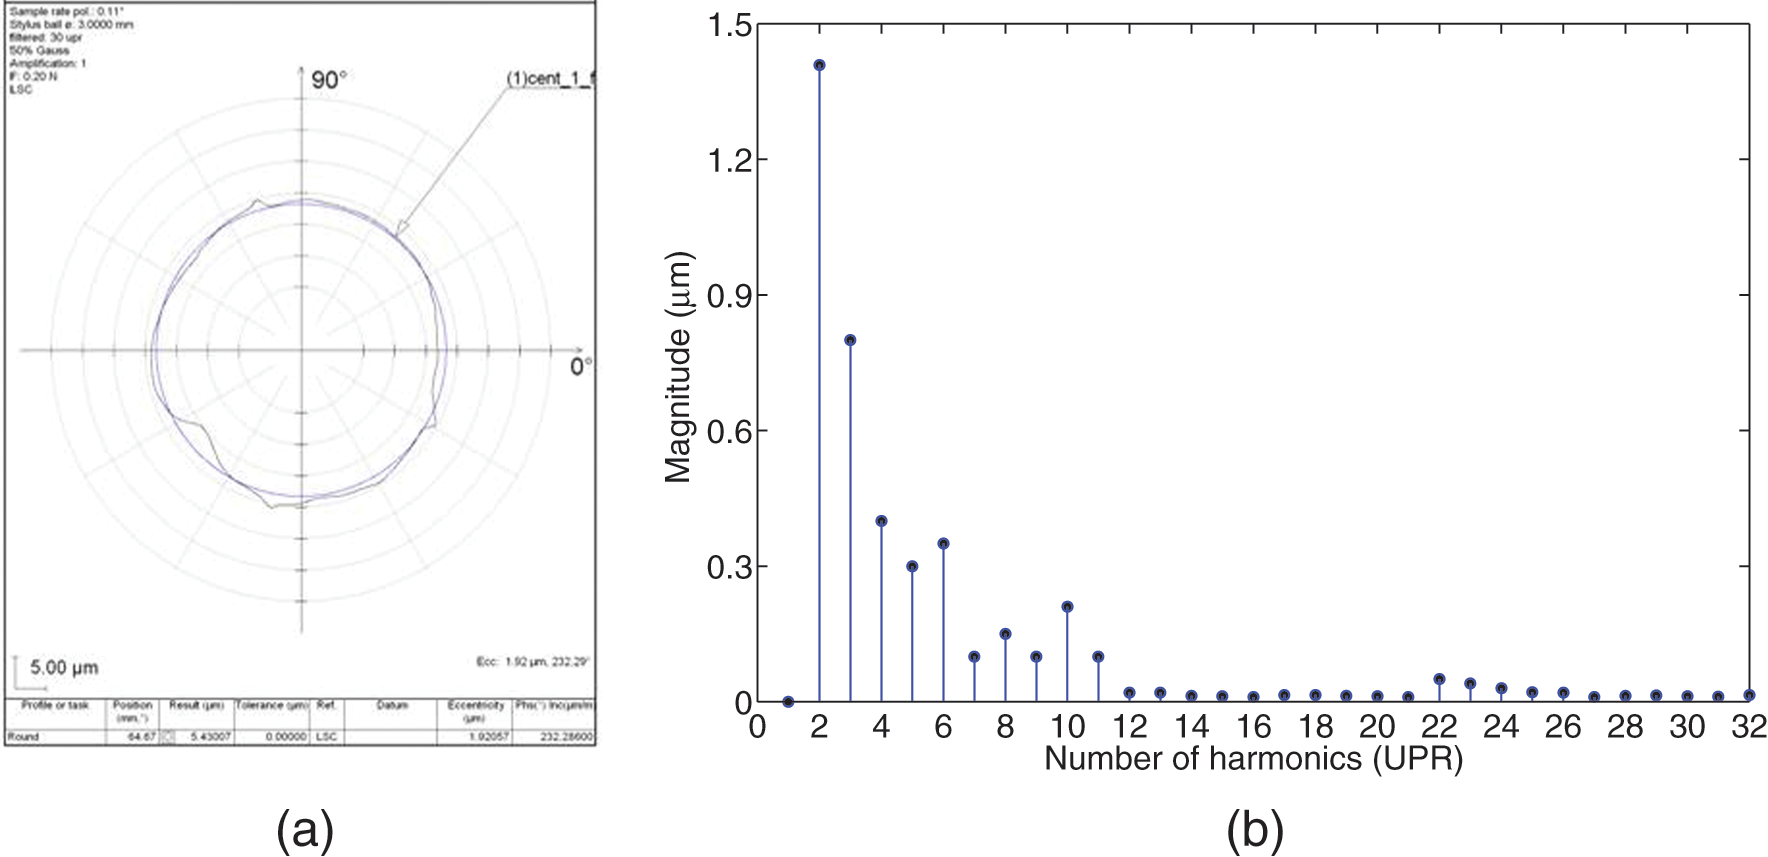
Form profile of the cylinder and its harmonic components measured by the stylus probe (a) form profile of cylinder’s surface and (b) the harmonic components in the form profile.
Experiments were carried out to measure the form deviations of the cylinder’s surface using a capacitive sensor at different sampling frequencies. Figure 10(a) shows the data measured using the capacitive sensor at a sampling frequency of 10,000 Hz. The periodic components of the form profile were determined for a harmonic cutoff value of 30 UPR. It can be observed that the periodic components closely follow the trend in the measured data. The magnitudes of the harmonic components in the profile of the cylinder are shown in Figure 10(b). The magnitude of the first harmonic component represents the contribution of the centering error of the cylindrical artifact and it was not considered for further analysis. It was found that the magnitudes of the harmonic components at 2, 3 and 4 UPR were higher than the other harmonic components.
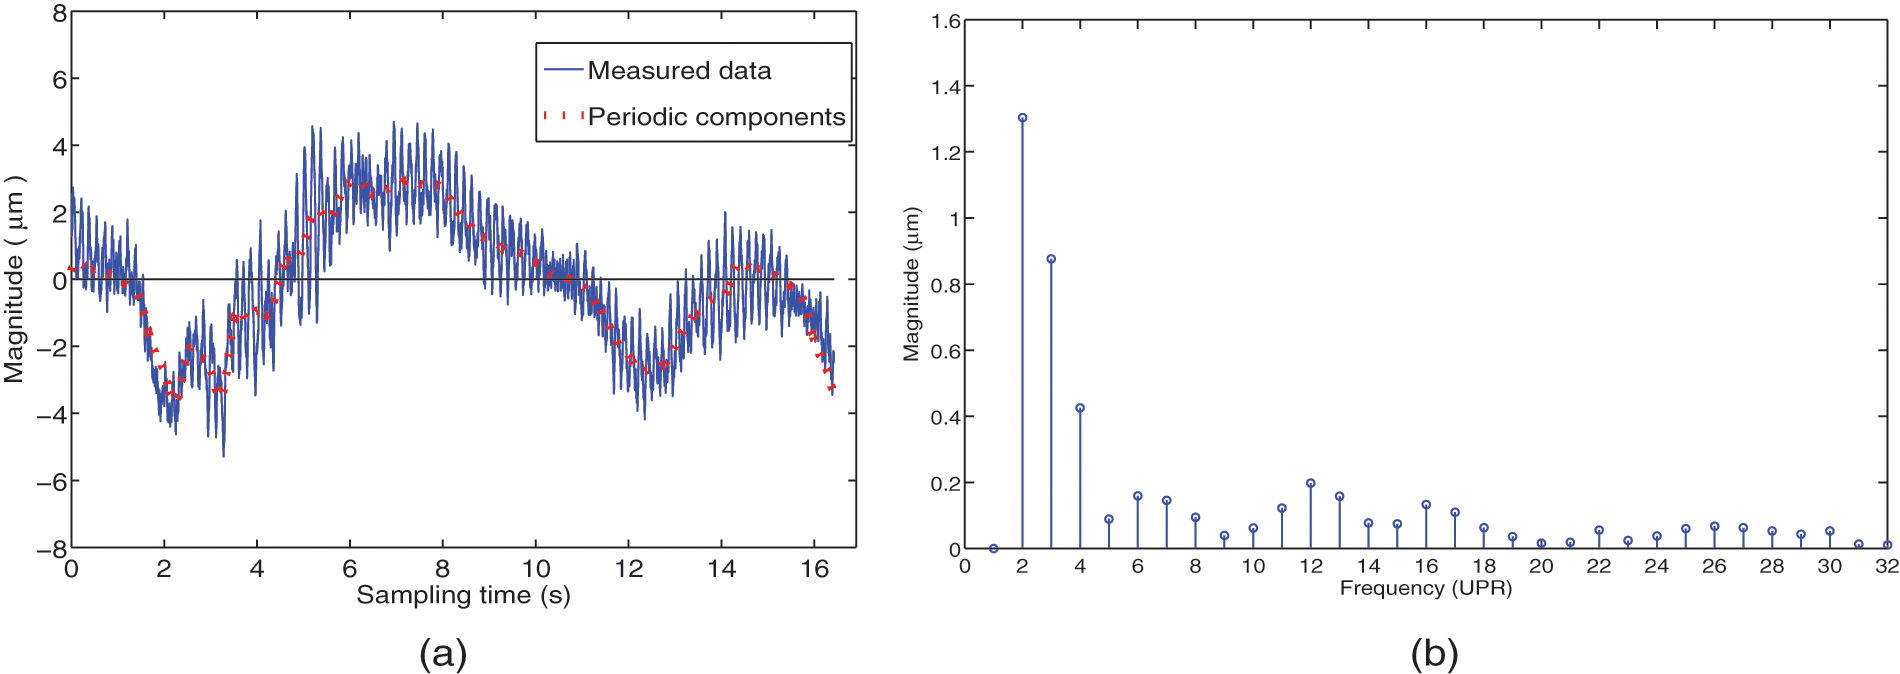
Form profile of the cylinder and its harmonic components measured by the capacitive sensor (a) data measured in the time domain and (b) the harmonic spectrum of the cylinder’s surface.
A polar plot of the form profile of the cylinder is shown in Figure 11(a). Here the radius of the plotting circle was selected to be 10 µm. The least-squares center for the polar profile of the cylindrical artifact was determined to evaluate the form error of the artifact. 18 The radial width between the circumscribing and inscribing circles was determined as shown in Figure 11(b) and was found to be 5.476 µm. Table 4 shows the estimated values of the form errors of the cylinder for the profiles obtained at the sampling frequency values.
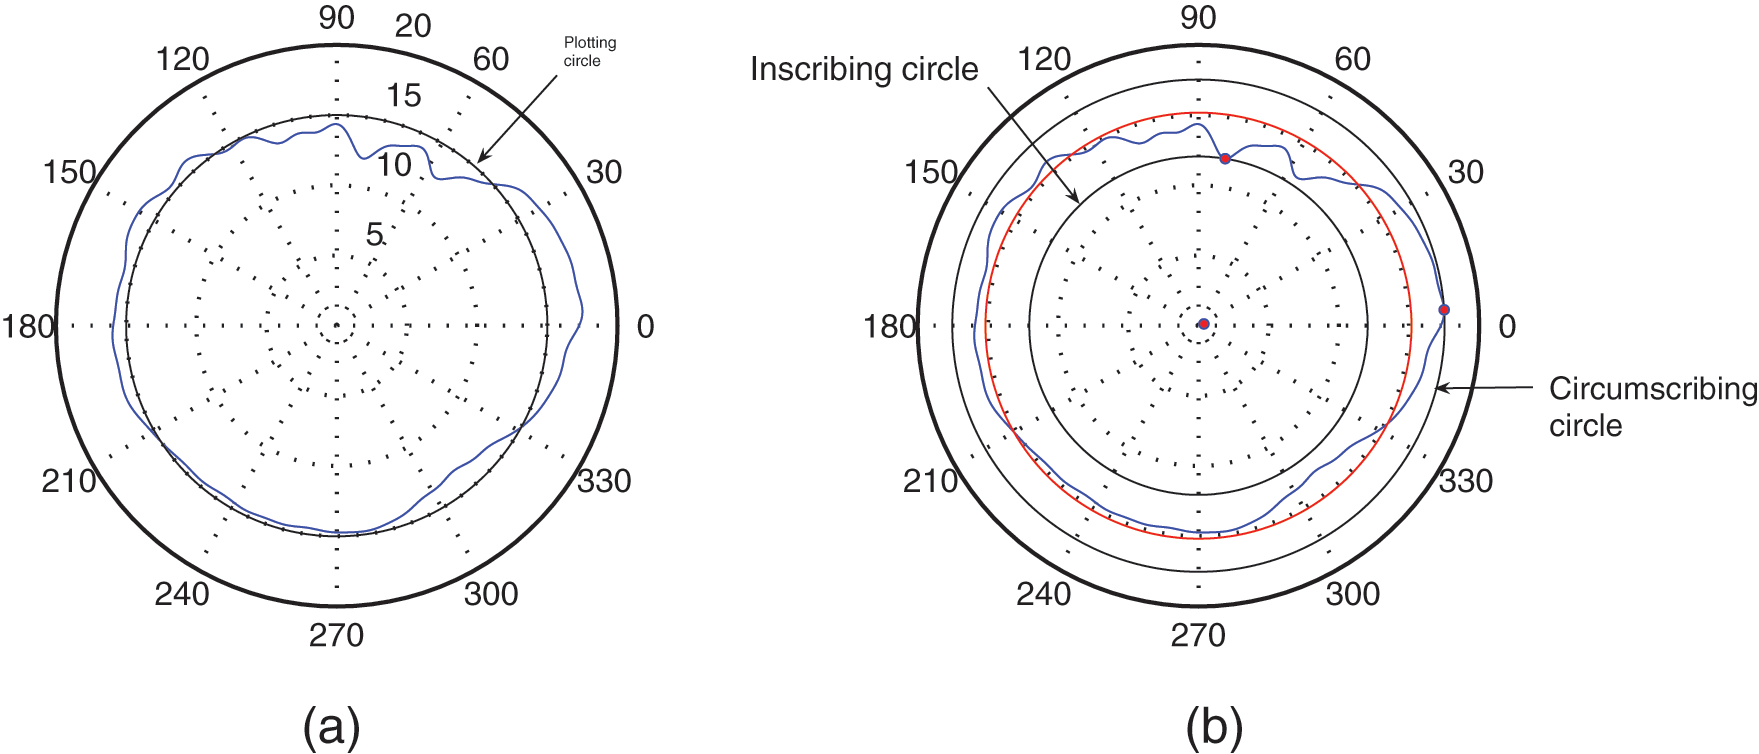
Evaluation of the form error of the cylinder (a) polar plot for the form profile of the cylinder and (b) the inscribing and circumscribing circles.
Estimated values of the form error of the artifact’s surface at different sampling frequencies.
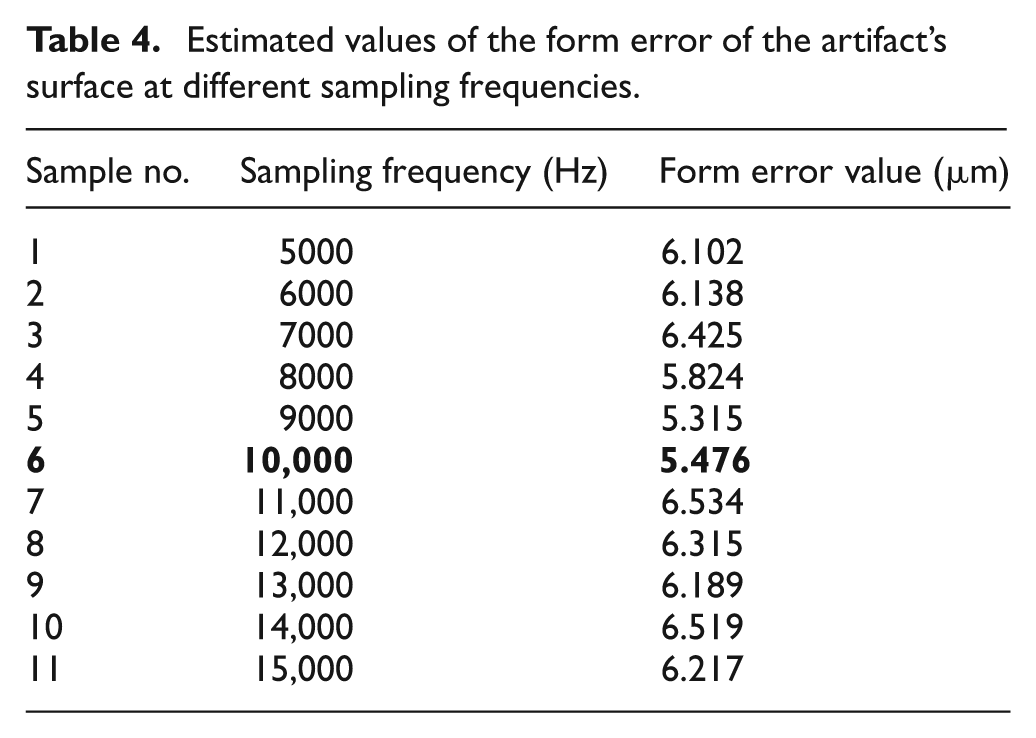
From these results, it is clear that the selection of an appropriate sampling frequency is essential for the evaluation of the form error of an artifact. In the present work, the sampling frequency for the form error measurement was selected based on the form error value obtained by the stylus probe. It can be observed that the form error value at a sampling frequency 10,000 Hz is 5.476 μm which is close to the evaluated value obtained by the stylus probe, as highlighted in Table 4. Hence the measured data obtained at 10,000 Hz was considered in subsequent analyses.
Harmonic analysis of the surface profile of the artifact
A harmonic analysis method was followed to identify the dominant harmonic components in the roundness profile of the artifact. 19 In the present work, the number of harmonic components considered in an analysis was fixed as 30. The roundness profile of the artifact was reconstructed for the given number of harmonic components in terms of UPR and it is shown in Figure 12. A plotting circle of radius 10 µm was chosen to display the roundness profile of the artifact.
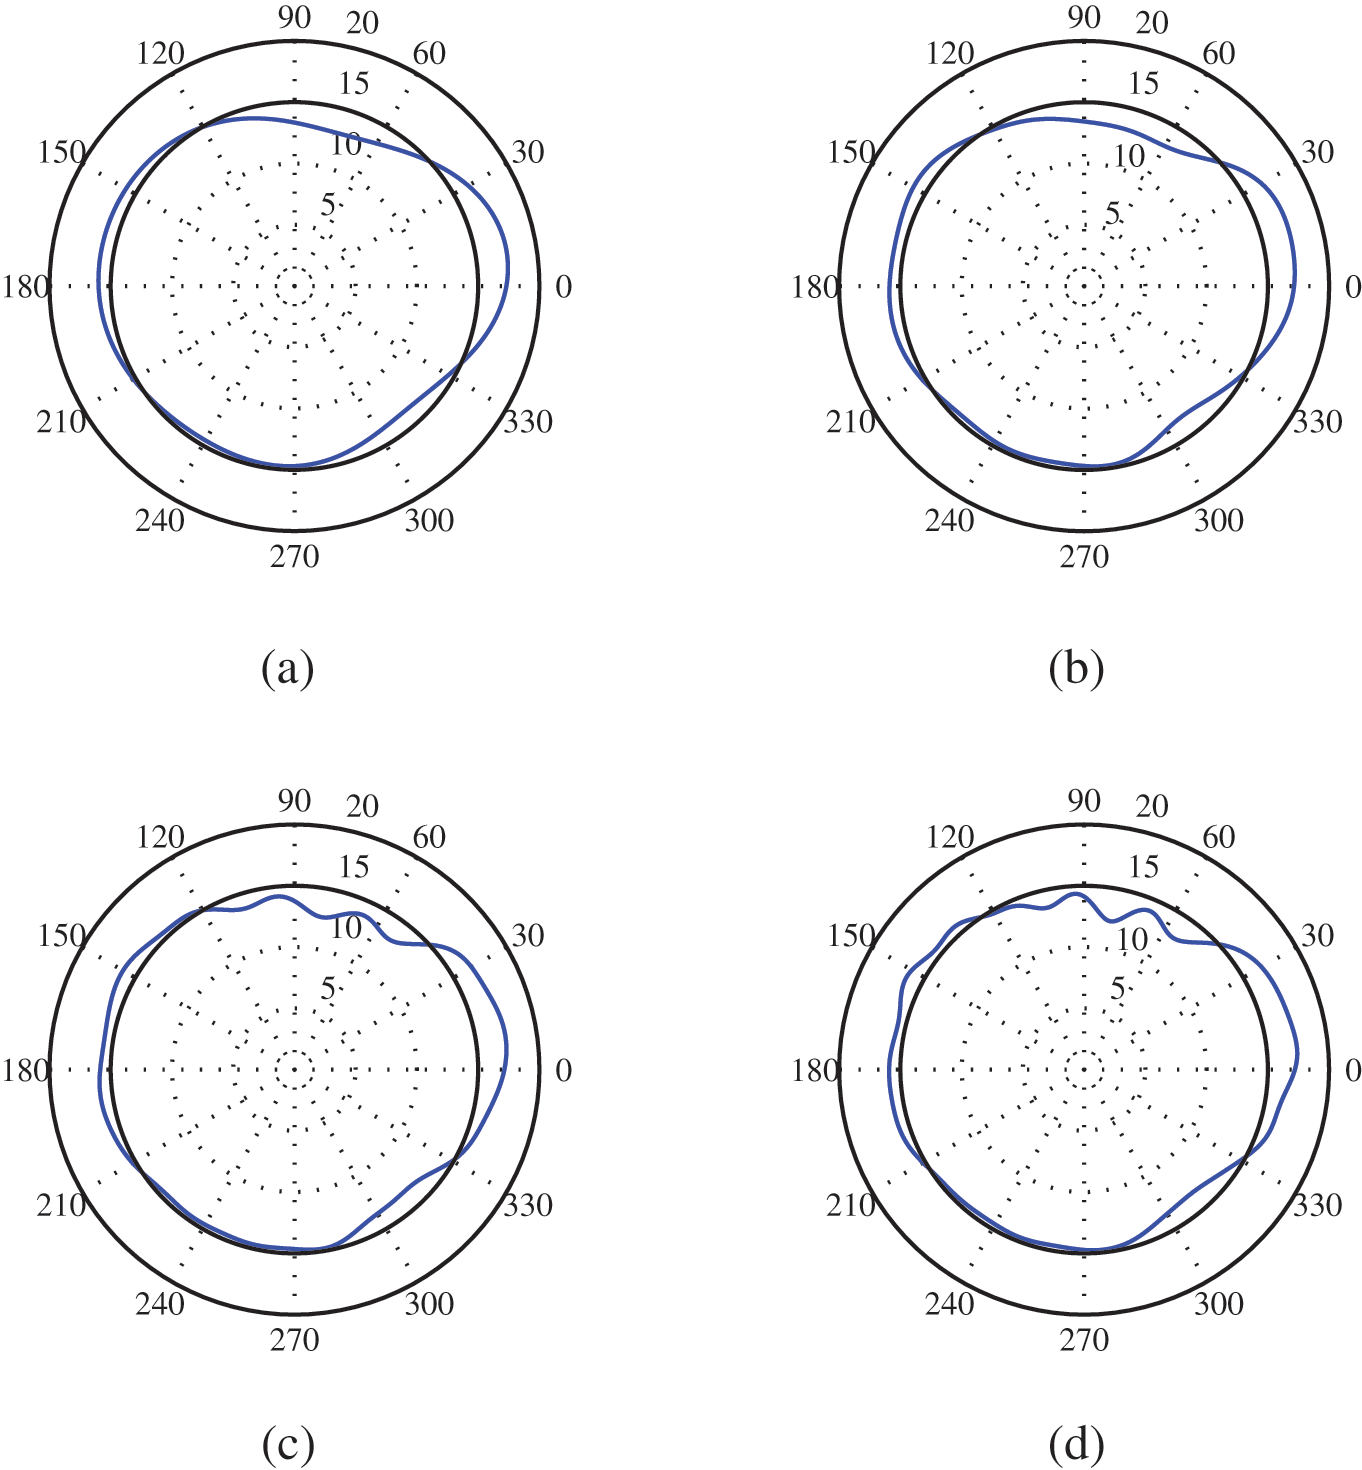
Effect of the number of harmonics on the roundness profile of the artifact (a) 5 UPR, (b) 10 UPR, (c) 15 UPR and (d) 20 UPR.
Comparing the polar plots in Figures 12(a) and (b), it can be seen that the effect of an increase in the number of harmonics from 5 UPR to 10 UPR does not alter the shape of the harmonic components significantly. This is due to the dominance of the first five harmonic components in the form profile of the cylinder and its magnitude can be noticed in Figure 10(b). When the numbers of harmonics was increased to 20 UPR, the variation in the shape of the form profile could be clearly identified in a polar plot as shown in Figure 12(d).
Identification of the dominant harmonic components in the form profile
In order to identify the dominant harmonic components in the form profile of the cylindrical artifact, the form error value (eh) was determined for the given harmonic component (h). Harmonic components were increased further and the deviation in the form error value (eh+1) was also calculated to determine the relative importance of including the harmonic components in the form error value. The percentage contribution of individual harmonic components on the overall form error of artifact can be determined using equation (6)

where eh represents the form error value for the hth harmonic component and eH refers to the form error value for the combined contribution of H harmonic components in the form profile of the cylindrical artifact.
The number of harmonics considered for analysis (H) was fixed at 30 UPR and the form error value for the form profile was found to be 5.476 µm. Table 5 provides the percentage contribution (E) of first 15 harmonic components on the form error of the cylindrical artifact.
Percentage contribution of individual harmonics to the form error of the cylinder.
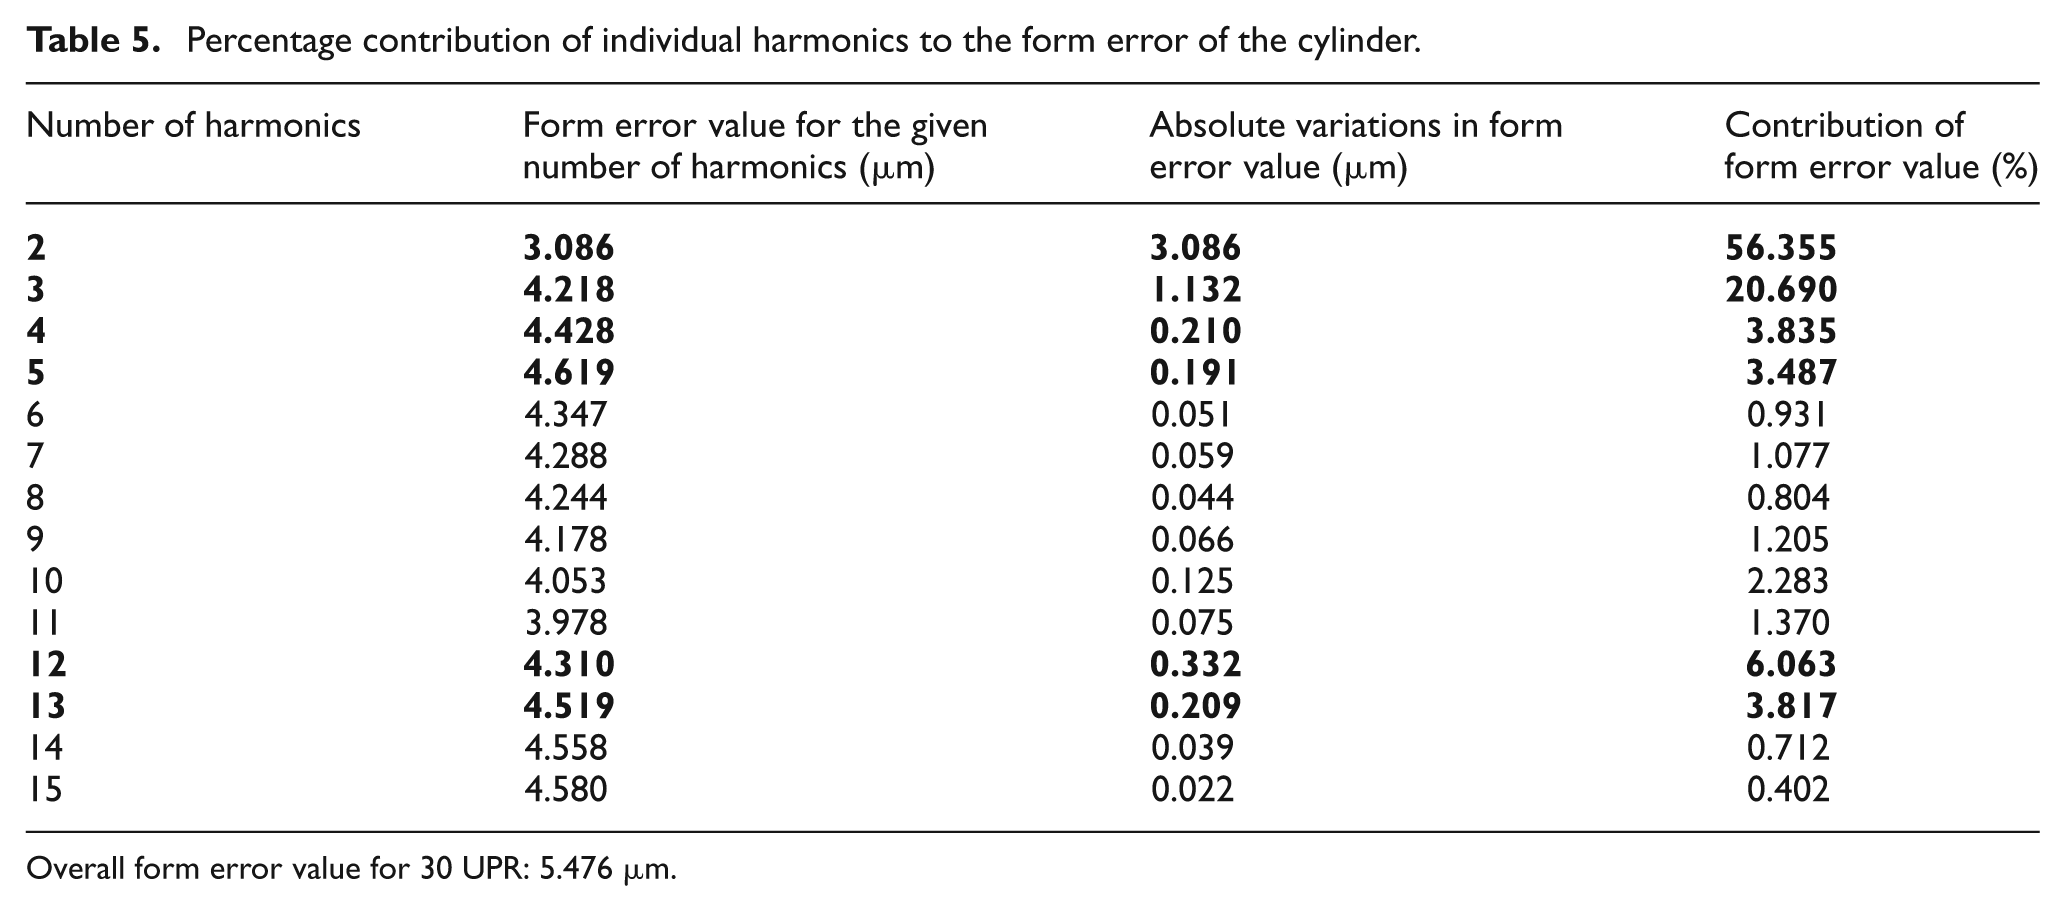
Overall form error value for 30 UPR: 5.476 µm
Figure 13 illustrates the contribution of individual harmonic components and their percentage contribution to the overall form error value obtained for 15 harmonic components. The percentage contribution value indicates the relative importance of individual harmonic components on the form error value of the cylindrical artifact. Hence, it was used to select the dominant harmonics in the surface profile of the cylindrical artifact. It can be seen that the percentage contributions of the second and third harmonic components are higher than all the other harmonic components. In the present work, a threshold value of 3% was chosen as a limiting criterion for the selection of the dominant harmonic components in the form profile of the cylindrical artifact. The highlighted, bold values given in Table 5, the second, third, fourth, fifth, twelfth and thirteenth harmonics were found to be above the threshold value of 3% and they were selected as the dominant harmonic components in the form profile of the cylindrical artifact.
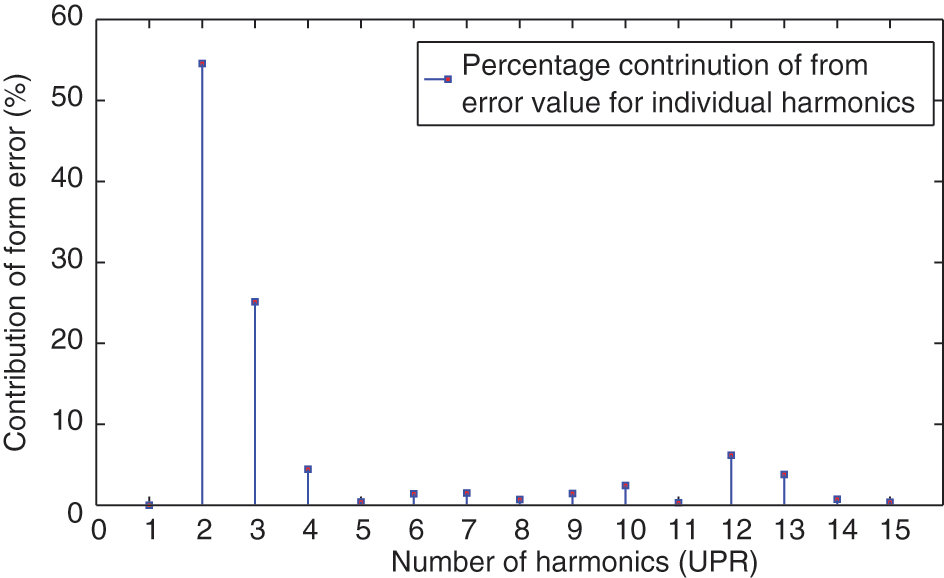
The effect of individual harmonics on the value of the form error.
Separation of dominant harmonic components
It is assumed that the dominant harmonic components of the form profile contribute to the synchronous components of the measured data on spindle error. Dominant harmonic components were identified in the synchronous components as shown in Figure 14(a). Figure 14(b) shows the harmonic spectrum of the synchronous components after removal of the dominant harmonics in the form profile of the cylindrical artifact. The remaining harmonic components are assumed to contain the contribution of the synchronous radial error of the spindle.
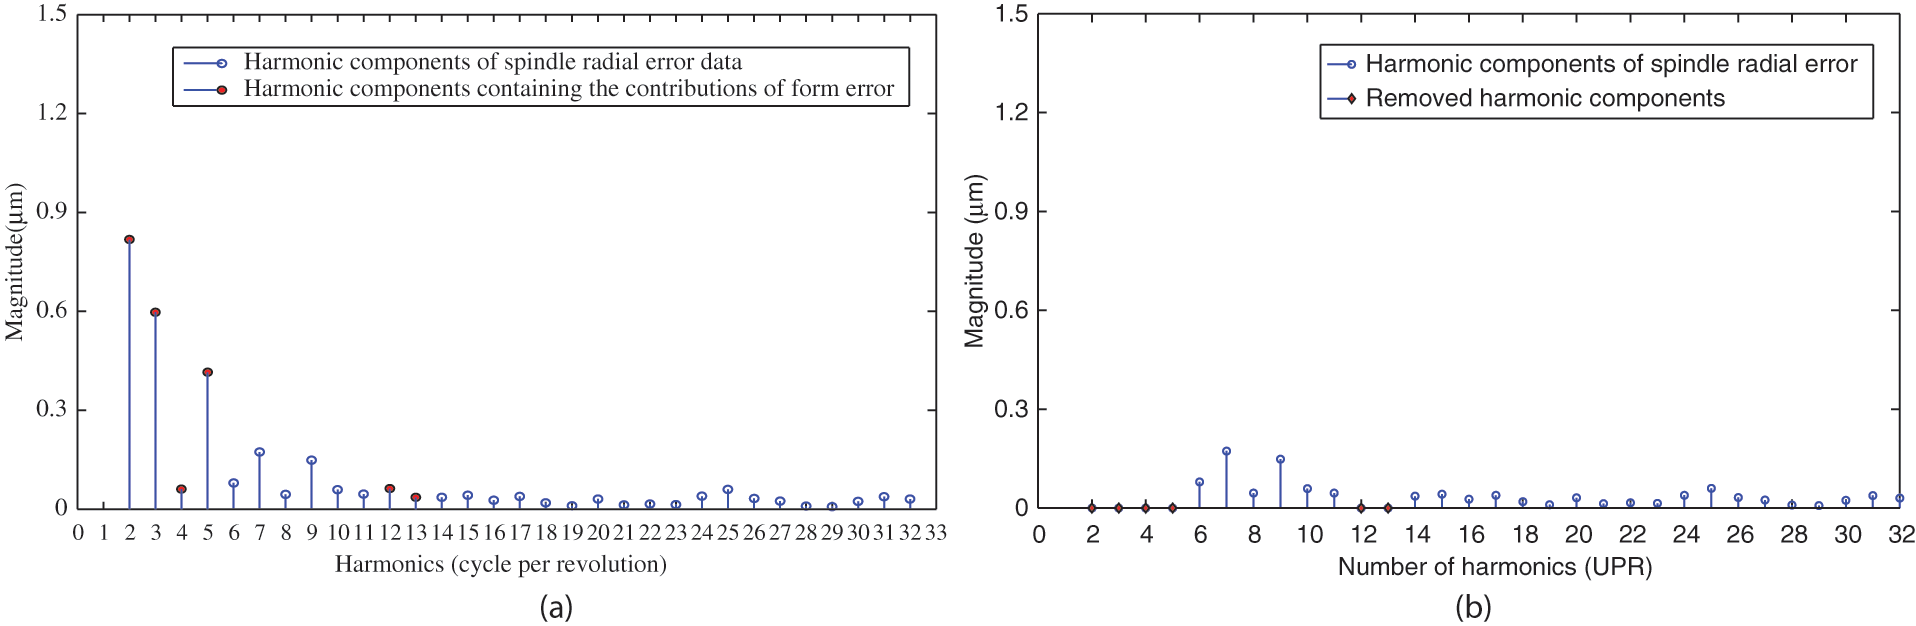
Identification and removal of dominant harmonic components (a) magnitude of the harmonics in synchronous components and (b) harmonic components after removal of the dominant harmonics.
A mathematical description of the process involved in separating the contributions of the dominant harmonic components from the synchronous components of the measured data on the spindle’s radial error is provided in Appendix 4. Sample values for the synchronous components and the contribution of the dominant harmonic components in the form profile of the cylindrical artifact are given in Table 6.
Contributions of the dominant harmonic components and synchronous radial error of the spindle.
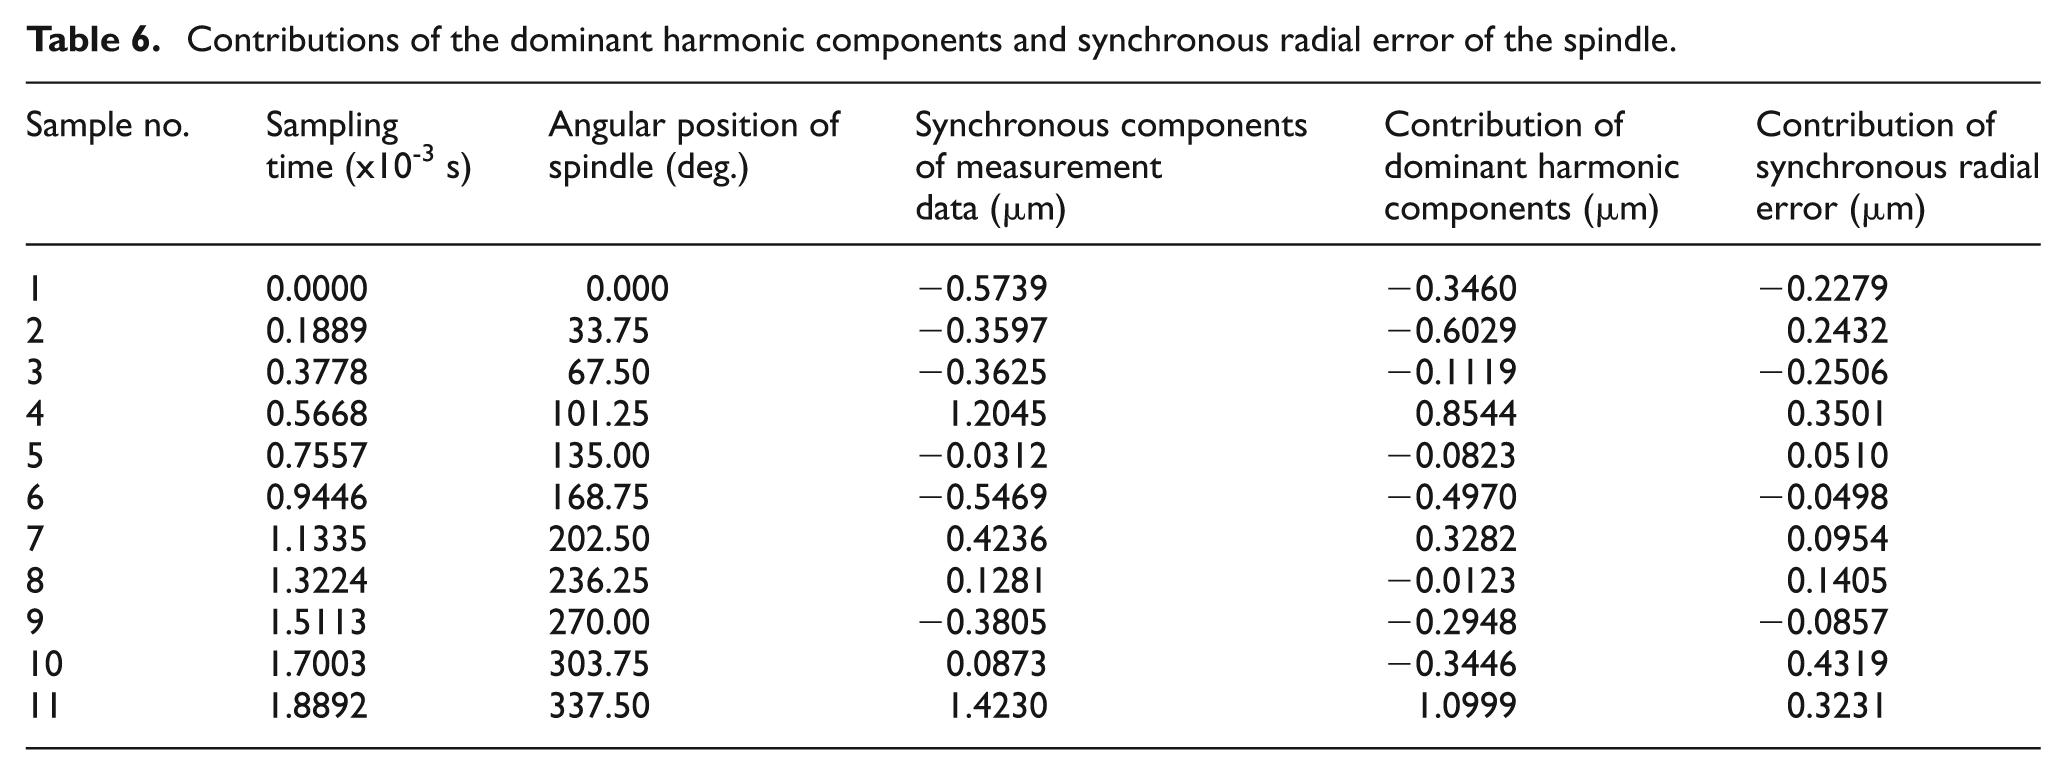
The contribution of the dominant harmonic components was estimated using equation (21) in Appendix 4 and it is shown in Figure 15(a) for the synchronous components of the data measured on the spindle’s radial error obtained at speed of 30,000 r/min. The contribution of the synchronous radial error of the spindle after the removal of the dominant harmonic components is given in Figure 15(b).
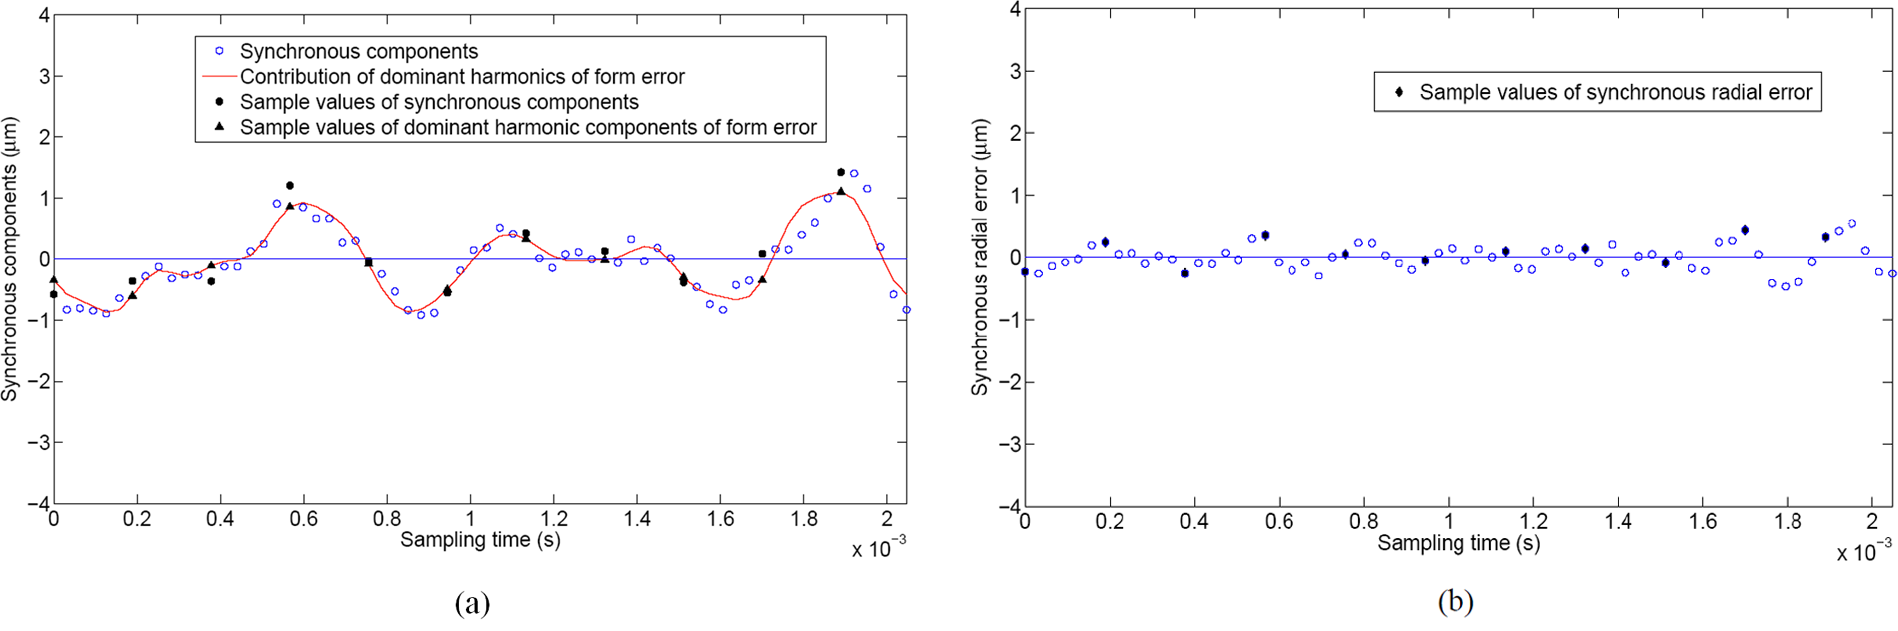
Separation of the dominant harmonic components of the surface of the cylindrical artifact (a) estimated values of the dominant harmonic components and (b) the separated contribution of the synchronous radial error.
Experimental results
Reconstructed profile of the synchronous components
The synchronous components are shown in Figure 16(a) and a polar plot of the estimated values for the dominant harmonics is shown in Figure 16(b). It is clear that the shapes in the two plots are very similar. This is due to the dominant contribution of the form error of the artifact in the measured data on the spindle’s radial error. After removal of the estimated values for the dominant harmonic components, the contribution of the synchronous radial error was obtained and it is shown in Figure 16(c). Here the radius of the base circle for plotting the polar profile was taken to be 5 µm.
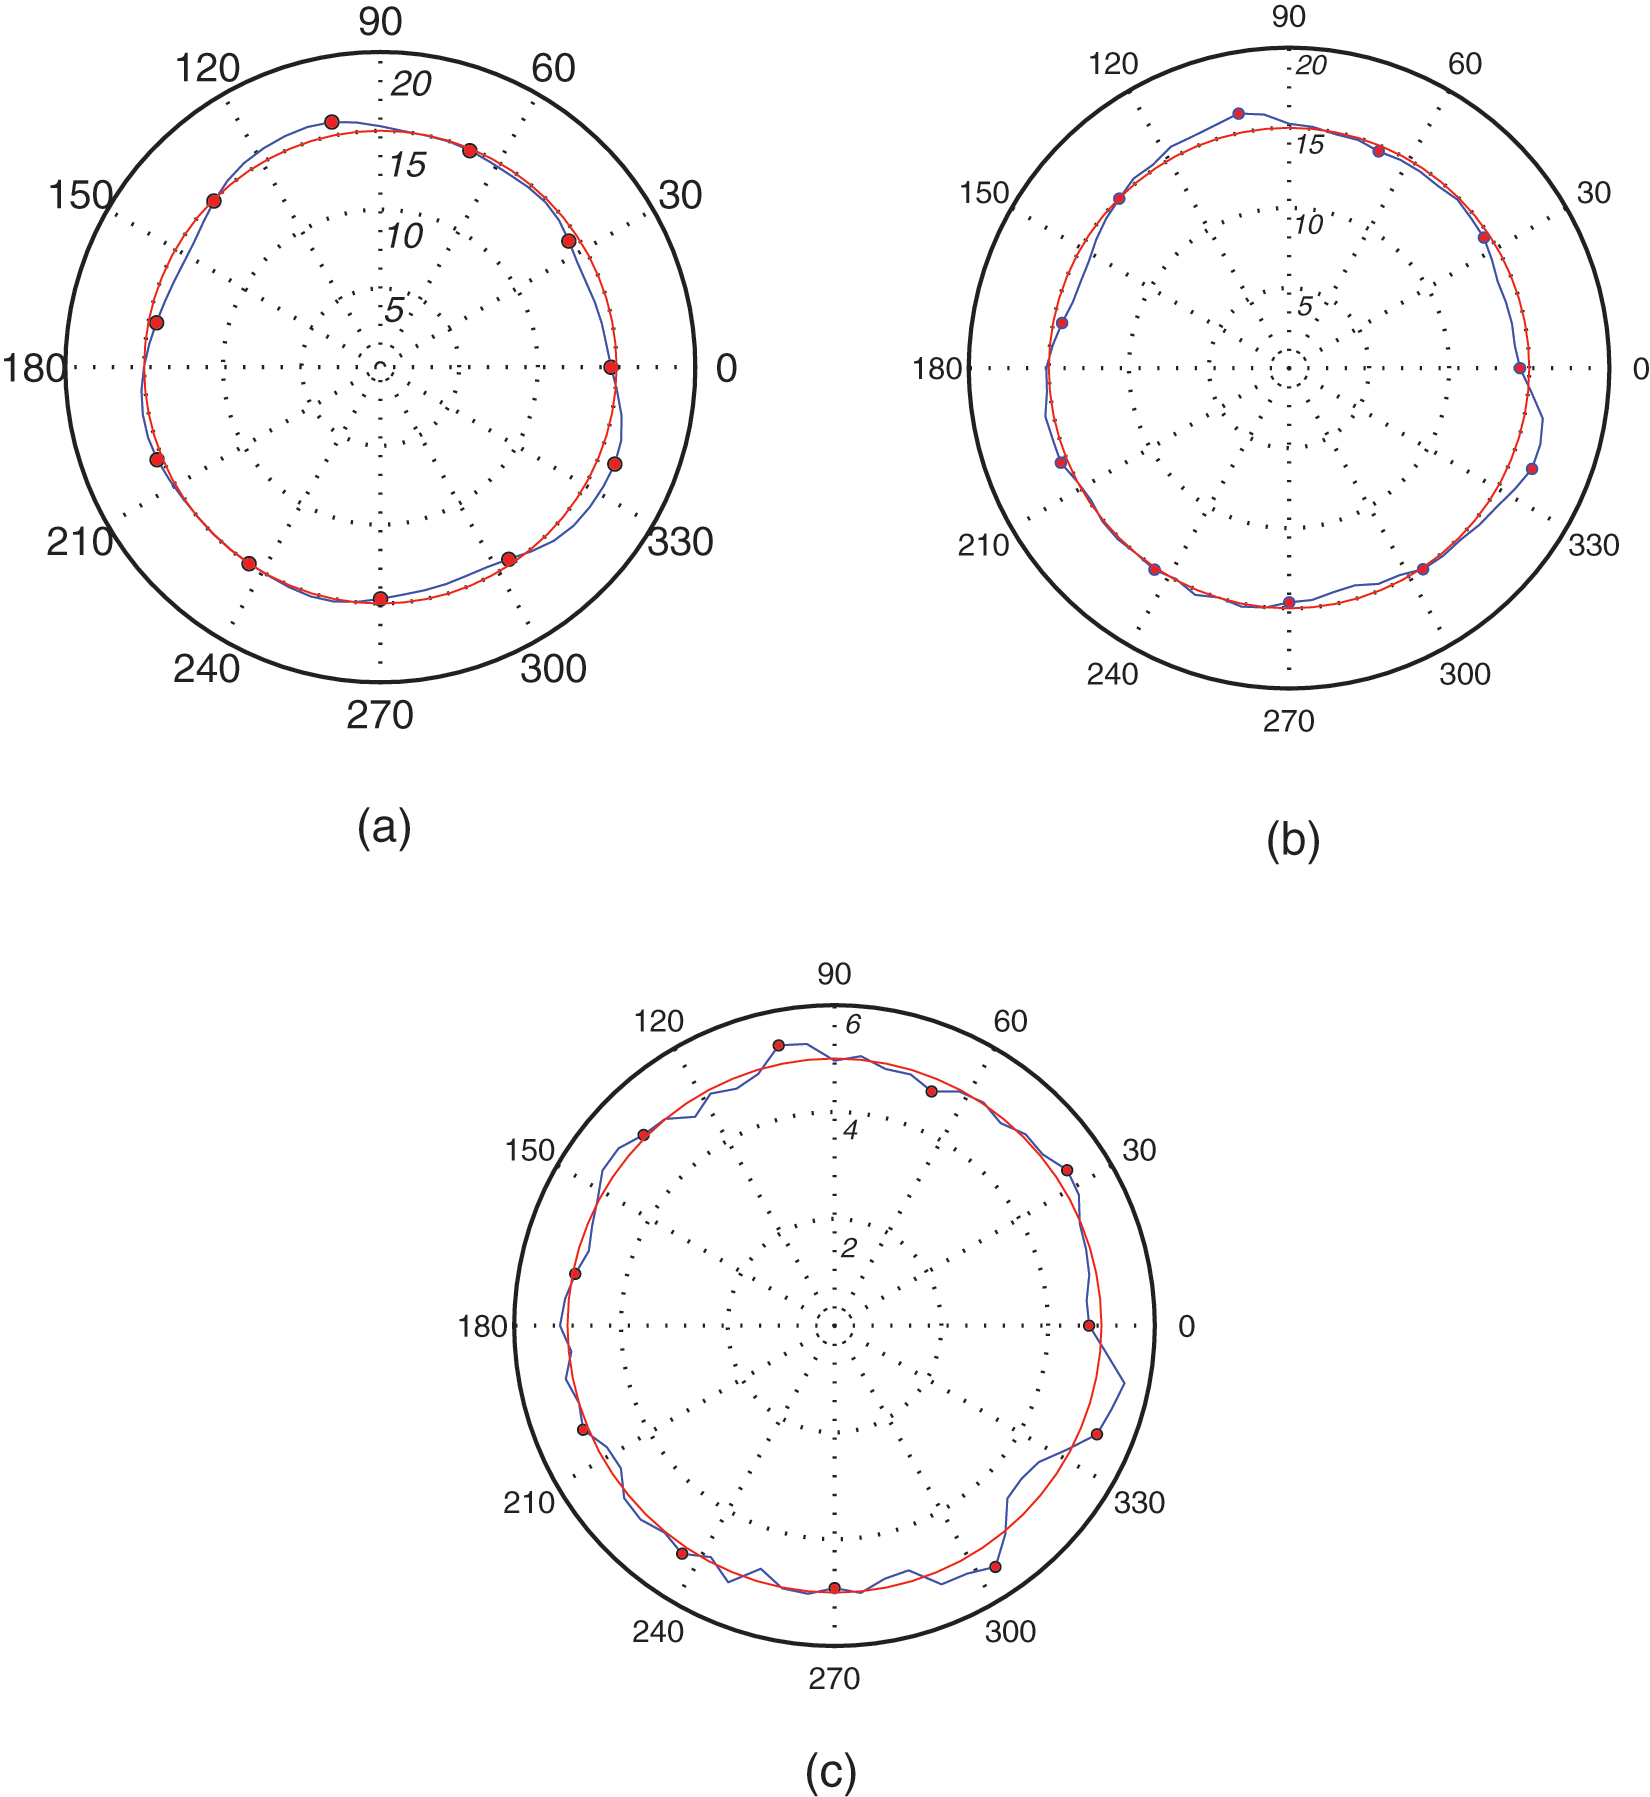
Separation of dominant harmonic components of artifact’s surface in a polar plot (a) synchronous components, (b) contribution of dominant harmonics and (c) contribution of synchronous radial error.
Effect of spindle speed
The proposed method for the form error separation was applied to the synchronous components of the measured data obtained at different spindle speeds and the results are presented in Figure 17. The polar profiles for the synchronous radial error do not show much variation between different spindle speeds and this highlights the repeatable nature of the measurements. In accordance with ANSI/ASME B89.3.4M, the polar profiles shown in Figure 17 can be assessed for evaluating synchronous radial error of the spindle.
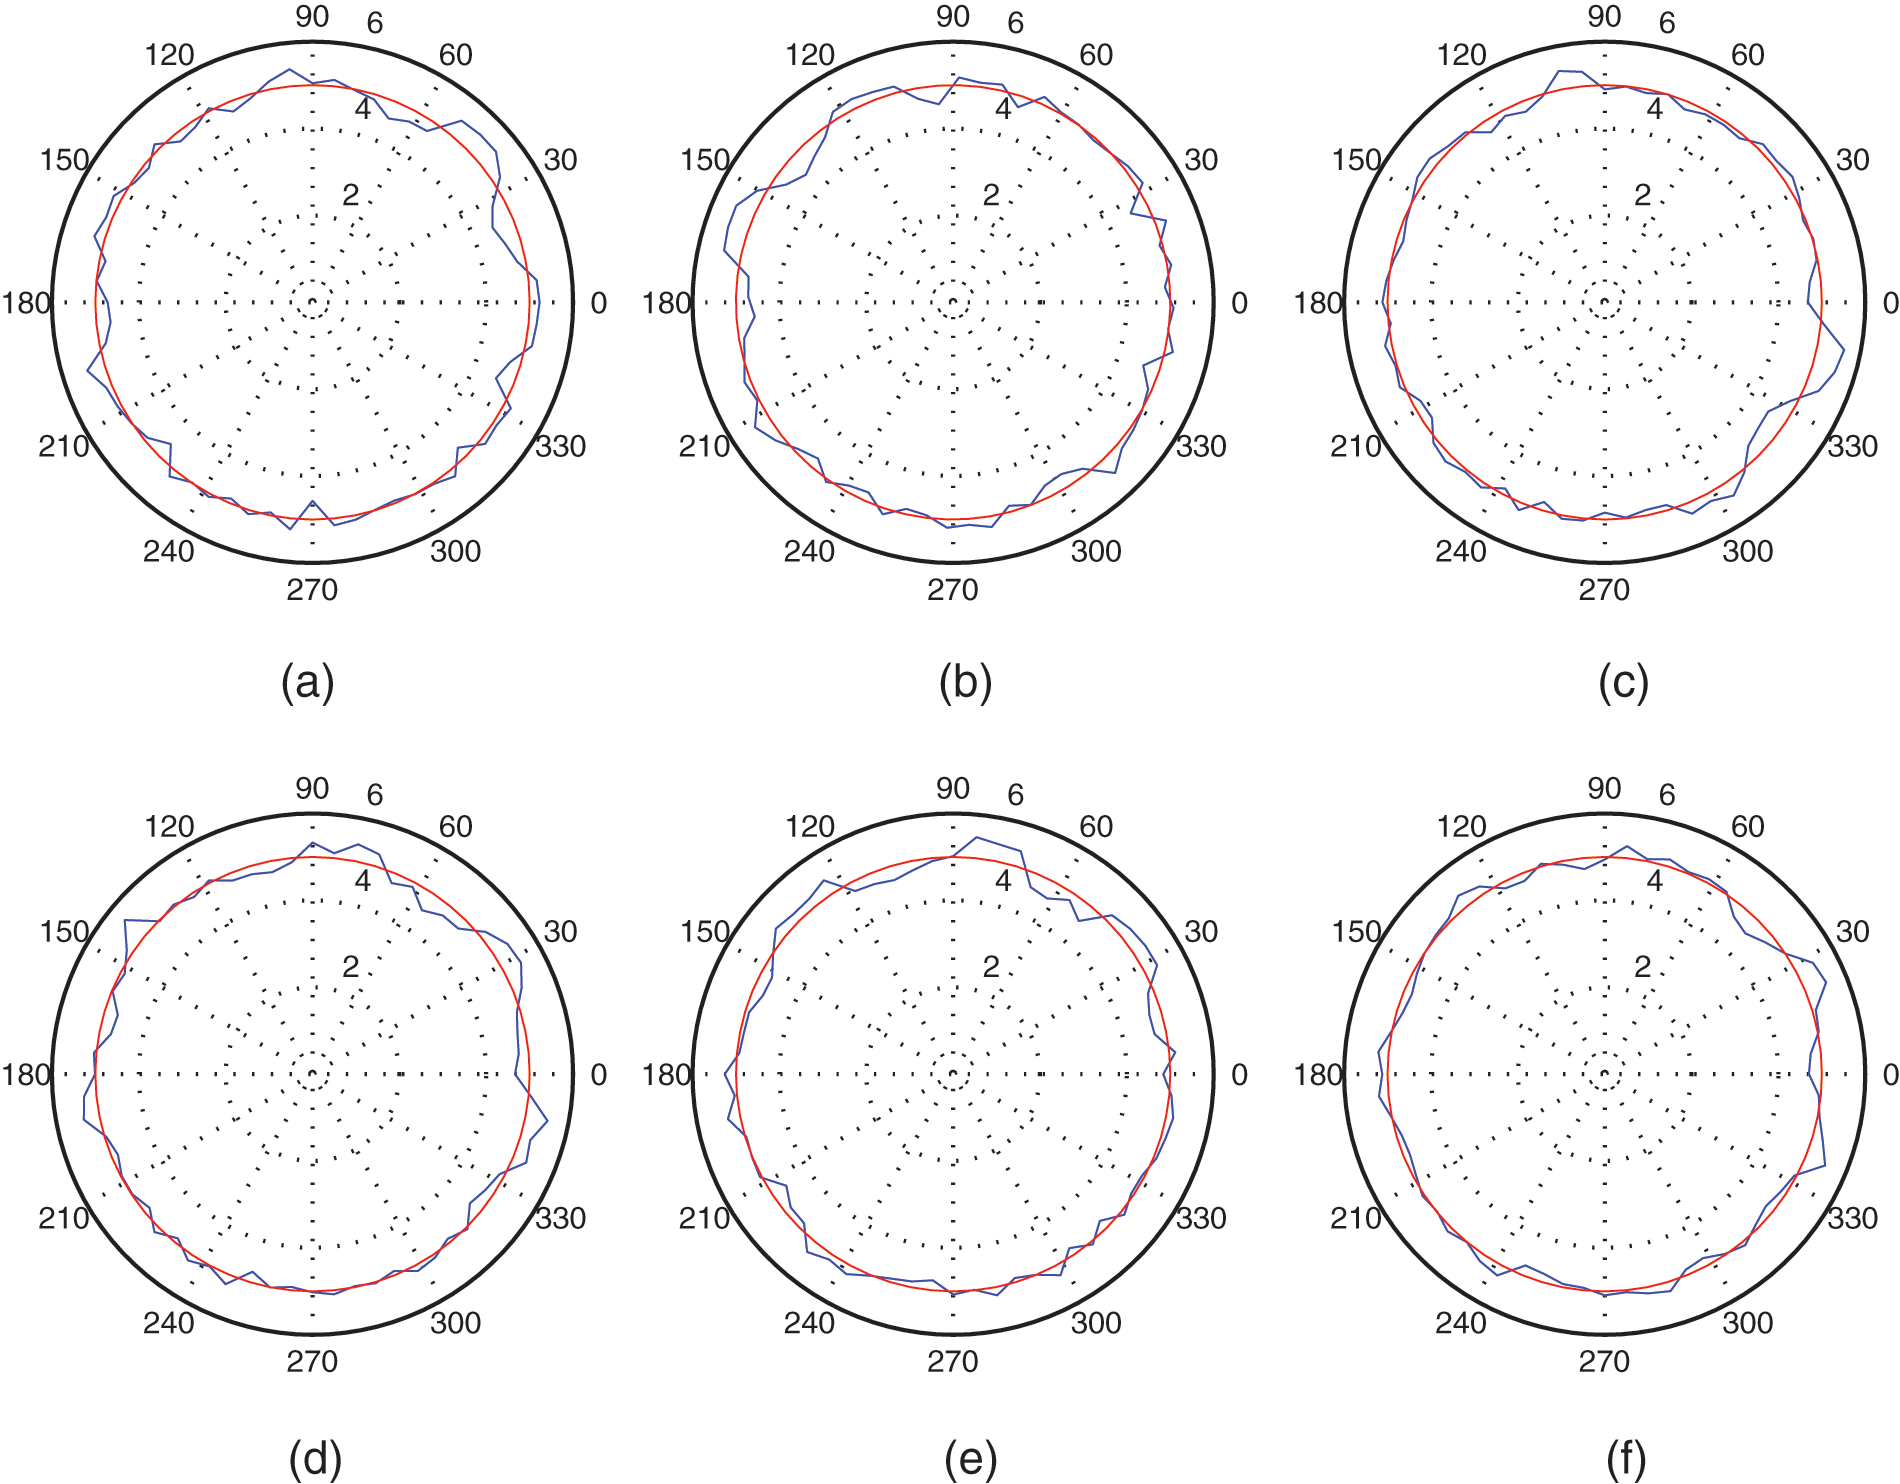
Polar plots for the estimated values of the synchronous radial error at different spindle speeds (a) 500 r/min, (b) 15,000 r/min (c) 25,000 r/min, (d) 35,000 r/min (e)45,000 r/min and (f) 55,000 r/min.
Evaluation of the synchronous radial error
Evaluation of the radial errors of the spindle is an important step in quantifying the performance of the axis of rotation in terms of synchronous error and asynchronous error. According to the ANSI/ASME B.89.3.4M, 2004 standard, the synchronous error value is equal to the difference in the radii of the two concentric circles that enclose the synchronous components of the measured spindle errors in a polar plot. The least-squares circle center is used as the reference for the evaluation of the synchronous radial error of the spindle. Inscribing and circumscribing circles were drawn from the estimated least-squares circle center and the synchronous radial error motion value was estimated as the difference in the radii of the two concentric circles that just enclosed the profiles of the synchronous radial error. Figure 18 shows the evaluation results for the synchronous radial error obtained for a spindle speed of 30,000 r/min. The least-squares center was at (−0.0145, −0.0008). In the present case, the value was found to be 0.899 µm. This method can be applied to the data measured at different spindle speeds.
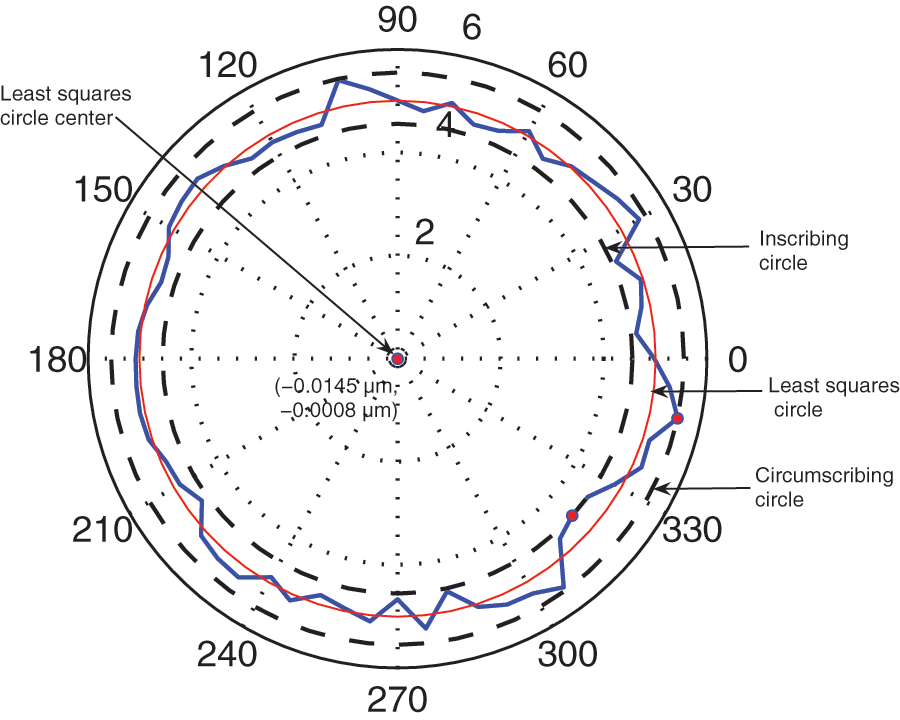
Evaluation of the synchronous radial error for a spindle speed of 30,000 r/min.
Conclusions
This paper presented a method for form error separation that can be applied to the data measured on high-speedspindles. A mathematical model consisting of a second-order polynomial and Fourier series function was used to decompose the measured data. The best-fitting harmonic curve was estimated using the proposed model and it was found to have a correlation coefficient of 0.987 with the measured data. This highlighted the suitability of the proposed model for the analysis of data measured in the time domain. In the proposed form error separation method, the harmonic components in the surface profile of the cylindrical artifact were analyzed and identified separately using a roundness tester. This strategy is required for the high-speed spindles in the micro machine tools due to their distinctive features such as high-speed conditions, space limitations and speed variations. A harmonic analysis method was proposed for the identification and separation of the dominant harmonic components in the form profile of the artifact. The proposed method for form error separation can be implemented at high-speed conditions to allow the evaluation of the synchronous radial error of spindles in miniaturized machine toos.