
Abstract
The preferred tool for conceptualizing, determining, and claiming relations of kinship, ancestry, and descent among humans are diagrams. For this reason, and at the same time to avoid a reduction to biology as transported by terms such as kinship, ancestry, and descent, we introduce the expression diagrammatics of relatedness. We seek to understand the enormous influence that especially tree diagrams have had as a way to express and engage with human relatedness, but hold that this success can only be adequately understood by attending to what in fact are broader diagrammatic practices. These practices bring to light that diagrams of relatedness do not simply make visible natural connections, but create or deny relations in particular ways and for particular reasons. In this special section, contributors investigate diagrams of relatedness in genealogy, heredity, as well as biological and social anthropology. Conceiving of diagrams as techniques that transcend such binaries as ‘thought and action’ and ‘image and text’, we aim at an understanding of how they were constructed and how they functioned in particular epistemic, cultural, and political contexts.
Kinship, ancestry, and descent are hotly debated concepts. However, these debates rarely focus on the diagrams that are fundamental to the conceptualization of relationships across several generations. This special section engages with diagrammatic practices at the core of making human relatedness. According to a common definition, diagrams are indeed meant to primarily represent the relational structure of objects. In doing so, they are tools to think with that often hybridize image, text and number (Bigg, 2016; Priest, De Toffoli, and Findlen, 2018). Diagrams may have a variety of epistemic, aesthetic, and political functions. They can generalize on the basis of insufficient information; they can reduce the complexity of a realm; and they can also bring new relations into being (Schmidt-Burkhardt, 2005: 169). Our interest thus reinforces what is sometimes referred to as a ‘diagrammatic turn’ in the humanities (Bogen and Thürlemann, 2003: 3). Diagrammatics has been proclaimed an interdisciplinary approach in cultural and social studies, with its own introductions, overviews, anthologies, and handbook entries (e.g. Bauer and Ernst, 2010; Bender and Marrinan, 2010; Ernst, 2014; Schneider, Ernst, and Wöpking, 2016; Tufte, 1990).
In view of the observed and criticized reduction of relatedness to relations of descent (Carsten, 2000), we introduce the term diagrammatics of relatedness. With regard to diagrammatics, relatedness is predominantly represented in the shape of the tree. Accordingly, tree thinking and iconography have been foregrounded by scientists, scholars, and graphic designers, particularly with respect to organismic relatedness in natural history and biology (e.g. Bouquet, 1996; Pietsch, 2012; Ragan, 2009; Tassy, 2011). There exists a long-standing tradition that engages with the ‘tree of life’ as one of the oldest symbols, almost as a panhuman archetype; indeed, downright dendrolatry in mythology and folklore has been made out in relation to the tree's association with fertility, immortality, and rebirth (Cook, 1988; Demandt, 2005, 2014; Höhler, 1985; James, 1966; Philpot, 1897). A close connection is drawn between the tree of life and the equally powerful metaphor of the tree of knowledge (Macho, 2002: 16). Consequently, recent surveys of the role of tree diagrams in Western intellectual history often treat both genealogical and epistemic kinds of trees as almost self-evident means to conceptualize and understand life: ‘Throughout human history the tree structure has been used to explain almost every facet of life: from consanguinity ties to cardinal virtues, systems of law to domains of science, biological associations to database systems’ (Lima, 2014: 26; for a critical review of this literature, see Hellström, 2019: 16–24).
However, throughout history, relatedness has also been visualized in entirely different forms, and competing visualizations are often indicative of underlying social, political, and epistemological conflicts (Hounshell and Amstutz, 2024). As brought to the fore by the contributions to this special section, the historicity of a diagrammatics of relatedness seems to reside in the creative reuse of available diagrammatic forms to express new ideas, or, conversely, in the persistence of old concepts in novel diagrammatic shapes. Of particular interest to us is how this highly dynamic regime entangles scientific, scholarly, and cultural practices with issues of sovereignty, identity, and family. The contributions selectively shed light on the use of diagrams and the emerging diagrammatic epistemologies and politics in modern anthropology and human genetics. In what follows, we provide some historiographical context for these realms.
Genealogical diagrams
If we search for early attempts at a diagrammatic representation of genealogical relations, we are led to the medieval period. Christiane Klapisch-Zuber's book L’ombre des ancêtres (2000) provides a broad examination of the ways in which tree diagrams of kinship emerged and spread between the Middle Ages and the early modern period. In part, she draws on the rich archive of Hermann Schadt (1982), who analysed and systematized kinship diagrams from a great number of theological and legal manuscripts from the end of antiquity to the end of the Middle Ages. While the clues we have for the existence of kinship diagrams as early as the Roman period mainly point to their use in the context of inheritance law, clerics of the early Middle Ages remodelled them into arbores consanguinitatis (showing kinship by descent) and arbores affinitatis (kinship by marriage, or in-law relations) in order to delineate the degree to which incest prohibitions prevailed (Teuscher, 2013; Ubl, 2008; see Figure 1). These diagrams introduced a new, systematic way of imagining the totality of one's relations by descent and marriage, and supplemented older visualizations of kinship that had been more selective, emphasizing lineages along which landed property, coats of arms, or titles were transferred from one generation to the next (Sabean and Teuscher, 2007).
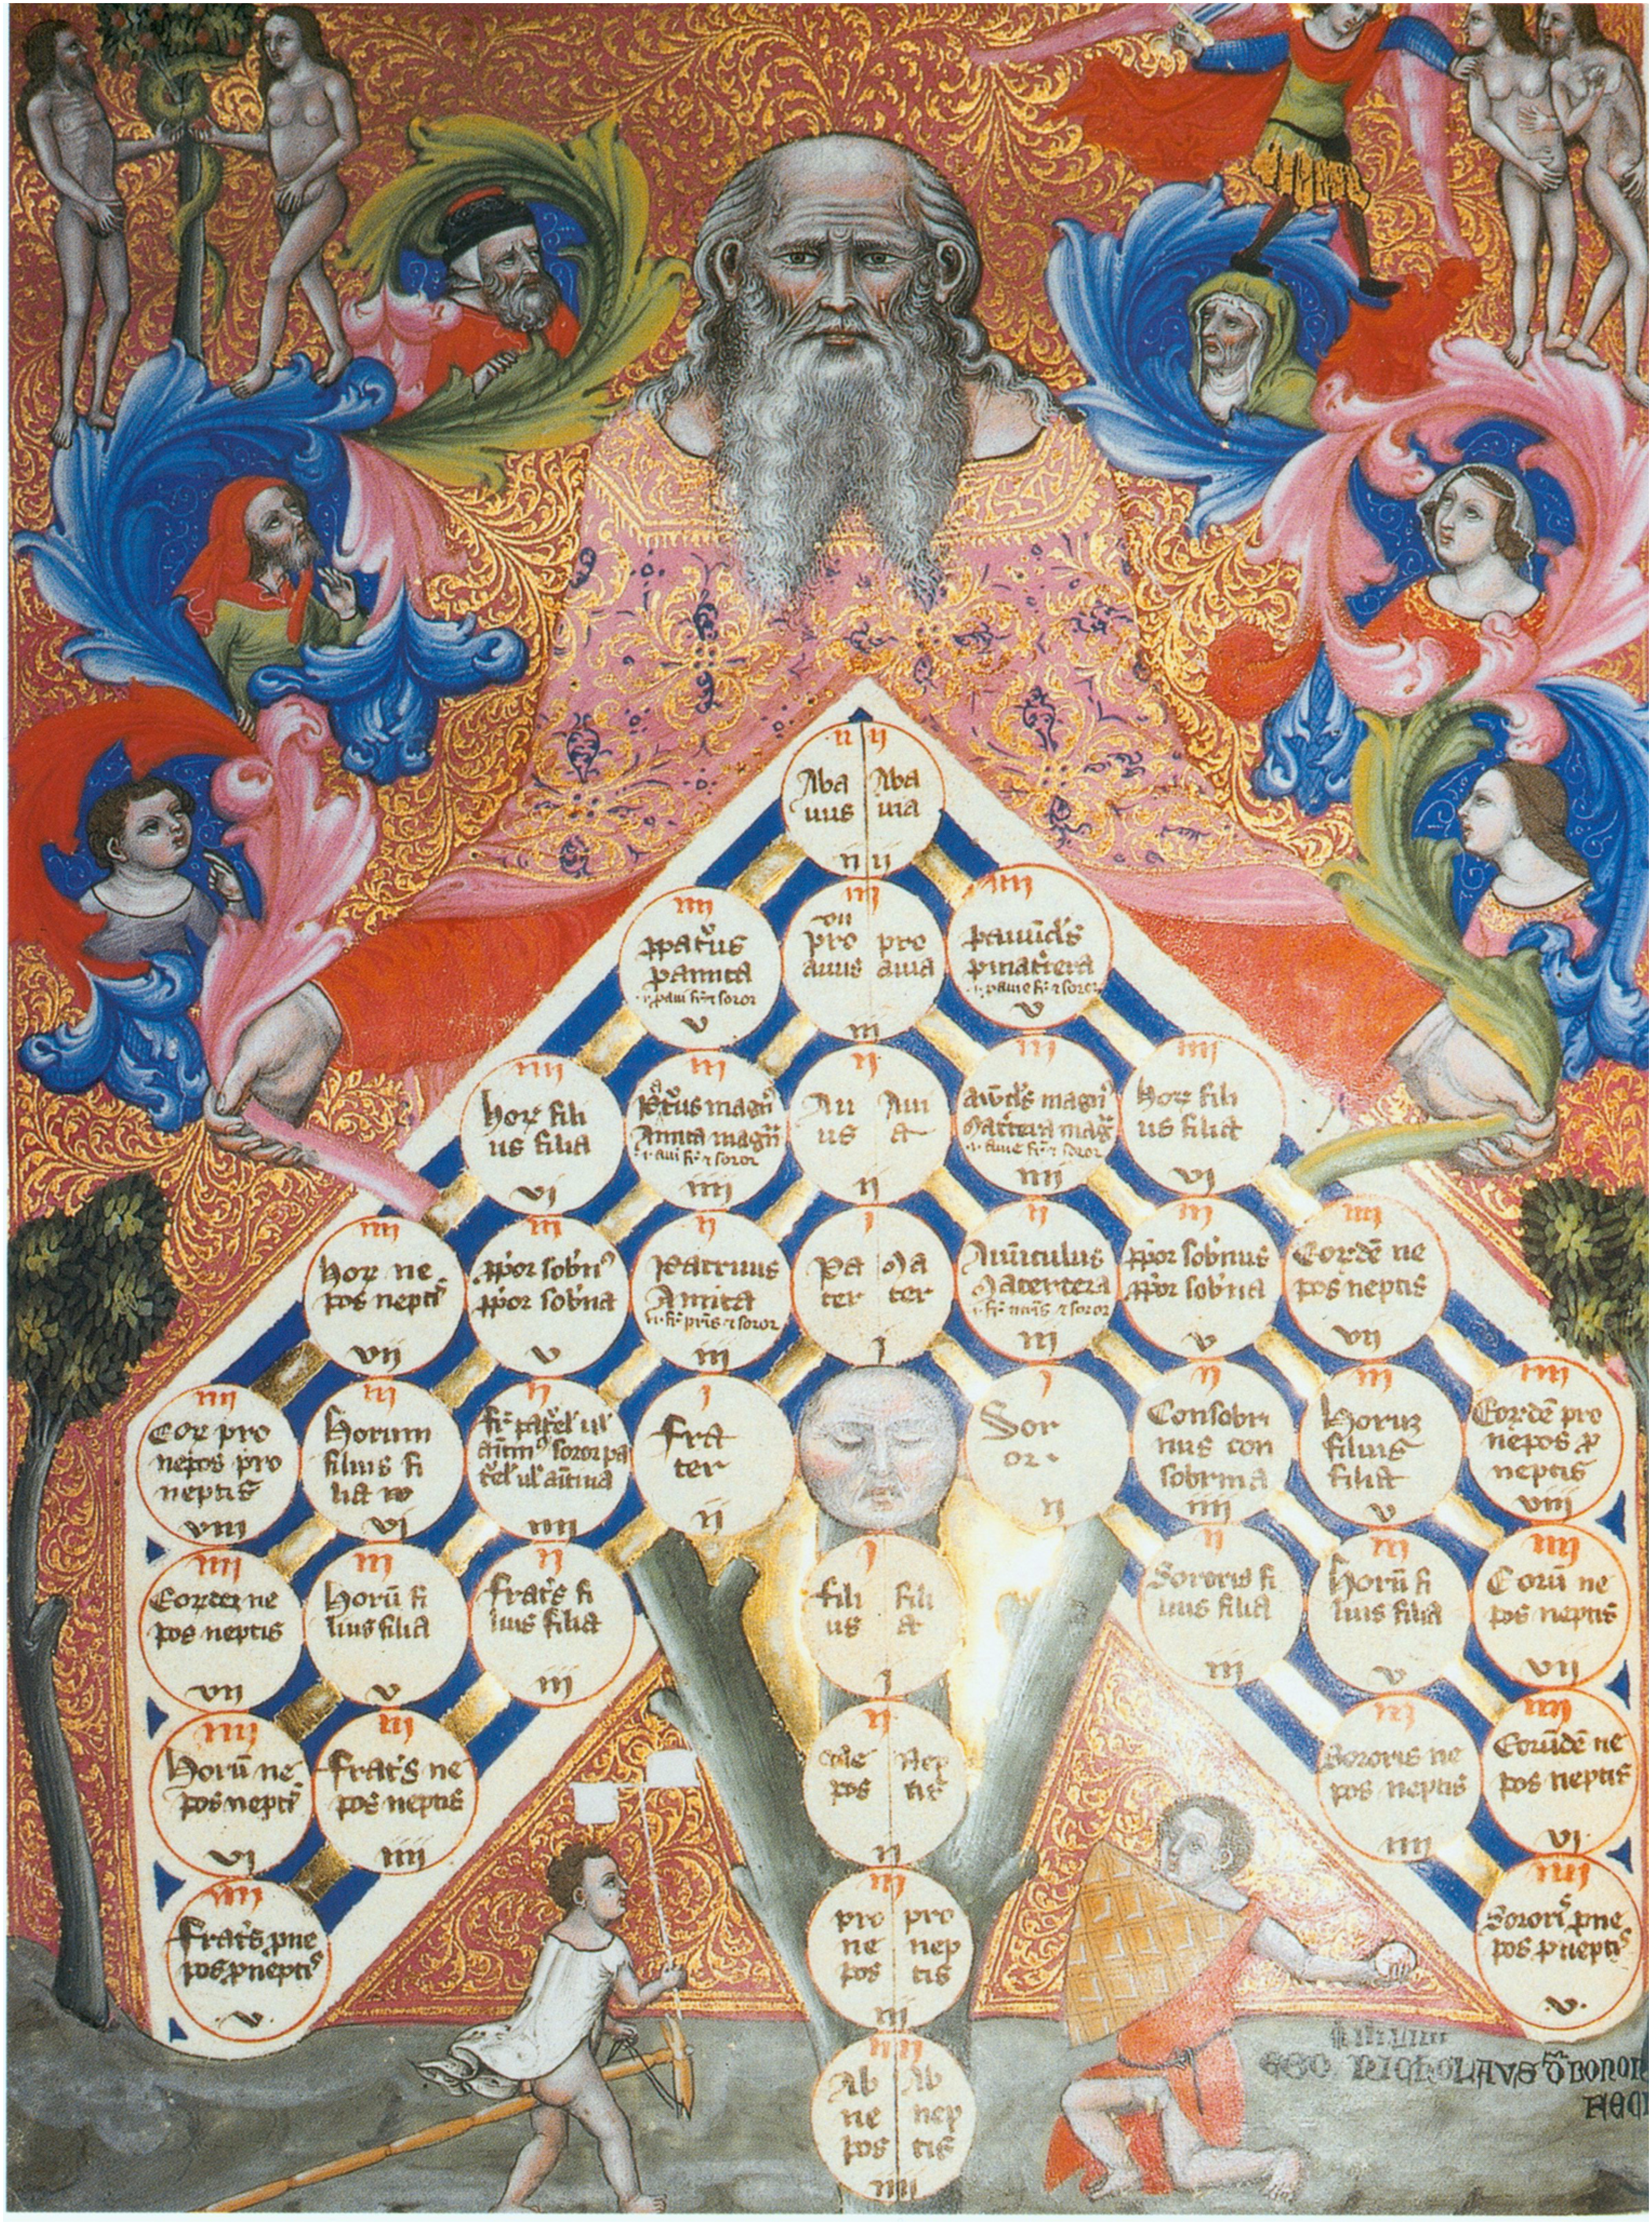
Arbor consanguinitatis, from a 14th-century manuscript by Johannes de Andreae on Liber sextus decretalium (Salzburg, Bibliothek des Stifts St. Peter, cod. A XII 10, fol. 118v).
Also in the Middle Ages, there existed a religious tradition that visualized relations by yet another logic: the tree of Jesse, which depicted the genealogy of Jesus Christ. Despite its name, it followed a strictly lineal logic and related fathers to sons according to the genealogical lists contained in the Bible. Trees of Jesse could be found in many medieval psalters and on church walls and windows (e.g. Siegel, 2009: 62–4; Watson, 1934). Other trees that were inspired by the tree of Jesse did not represent kinship at all, at least not in the sense of relatedness by descent, but rather the unity, fertility, and diversity of religious orders. They placed the founders (e.g. St. Benedict, St. Dominic) at the root and prominent members of the respective religious order on the branches of a tree (Cárdenas, 2016; Donadieu-Rigaut, 2005). However, although clerics and monks took over the botanical vocabulary of root, trunk, and branch from antiquity, prior to the 14th century, only very few kinship diagrams came in the form of trees, and even though called trees, such as the trees of Jesse or of consanguinity and affinity, they usually lacked the structure of bifurcation we associate with a tree. If diagrams of kinship by descent (arbores consanguinitatis) were given a figurative shape at all, it was often that of a building or of a human body, or, in fact, a complex and stunning combination of diverse visual and symbolic elements, including but not restricted to botanical ones, as in Figure 1. To subsume these kinship diagrams under a history of tree iconography thus tends to veil a much richer visual culture (Klapisch-Zuber, 2000: 231; 2004).
Subsuming this tradition under the tree would also be problematic because the link between the medieval arbores affinitatis and consanguinitatis and the family trees of the early modern period is uncertain; it is far from clear how family trees became one of the central semiotic instruments in the era's great project of securing continuity in the wake of social unrest and religious division (also in the colonies, and not least through printing). What has been documented is how, in the early modern period, royal and princely families, nobility, and urban elites legitimated their authority and guaranteed the transfer of possession and status through the demonstration of great antiquity and noble bloodlines (especially in Germany, but also in Great Britain, France, and Italy). In this context, kinship was indeed put on record in the form of family trees (Heck, 2000, 2002). At the same time, and as part of the same movement, there emerged genealogical tables (all ancestors of a person are shown over a few generations) of a rather different diagrammatic form. These showed not one oldest ancestor at the bottom and his offspring in ascending branches, but the most recent family member at the bottom and her or his ancestors up to a certain degree on the higher levels. This figure could be represented as a tree, but it was a tree with an inverse temporality, ‘growing and converging downwards’ from the uppermost branches to the root at the bottom. Such tables were used for proof of nobility, which was required to get access to certain collegiate chapters and knightly orders (Harding and Hecht, 2011).
On the Iberian Peninsula, examinations built around the logic of such diagrams were also employed to ascertain the ‘purity of blood’ (limpieza de sangre), that is, the absence of Jewish or Muslim ancestors in Christian bloodlines. In a broader context, the demand for proof of limpieza de sangre among a person's 8 or 16 closest male and female ancestors discriminated not only against Jews and Muslims, but also against Christians with Jewish and/or Muslim ancestry (Hernández Franco, 1996). Later the same test was employed in the colonies to ascribe people to ‘racial’ categories (castas) like mulatto, distinguished by degrees of mestizaje (Hering Torres, 2006; Martínez, 2008; Rodrigues, 2012; Vinson, 2017). In short, kinship diagrams were utilized to conceptualize dynasties (Klapisch-Zuber, 2000), orders of nobility (Harding and Hecht, 2011), and ‘racial’ ancestry (Martínez, 2008).
In general, while we have begun to understand diverse aspects of the morphological development of genealogical diagrams, the actual operations of their use and the ways in which these changed remain largely unexplored. Although the kinship diagrams that Klapisch-Zuber and Schadt collected and discussed to a great extent originate from manuscripts that contain lengthy explanations on how to use them, researchers have long concentrated on developments in visual features and have only recently begun to more closely investigate the explanatory texts (Teuscher, 2013). The contributions to this special section put the focus on diagrammatic practices, be it trees or other diagrams, and they make clear that while the history of racist ideologies is well known, we need a fuller understanding of the actual social-epistemic work that resulted in the construction of more or less stable classifications and the ascription of individuals to particular groups.
Between the 16th and 17th centuries – and with the advent of a historiography that was increasingly occupied with the study of documents – genealogy began to be ‘scientized’ and increasingly built on evidence from family and state archives (Gierl, 2012: 102–12; Kellner, 2004). At the same time, Bizzocchi (2010) has shown that while there existed scholarly standards, up to about 1800, family trees could still be généalogies fabuleuses and reach back to tribal chieftains of the Migration Period and even to the Trojan War. Indeed, the Valois and Bourbons were derived directly from Adam. This combination of scholarship and fiction was fundamental for the power of the family tree as a tool to historically legitimate noble and mostly male sovereignty in the early modern period. In this sense, pedigree building, while related to technologies of antiquity, can be seen as a sign of scholarly modernity, particularly in its striving for straightforwardness, clarity, and reduction of complexity in view of the declared and bemoaned flood of knowledge around 1600 (Blair, 2010).
It has been argued that as a state-founding principle, the visualization of princely succession lost its power in the second half of the 17th century (Heck, 2000, 2002); but at the same time, dynastic information began to be advertised to broader publics by being printed in smaller and cheaper periodical formats (Landwehr, 2014). As Stéphane Jettot shows in his contribution to this special section, arborescent and lineal representations vanished from these commercial publications as the preferred genealogical medium in the long 18th century and were replaced by tables and charts that emphasized the concentration of merit within contemporaneous kindred at the expense of ancestry. However, Jettot also shows how the tree shape re-emerged in the age of revolutions, when it was reinvented to defend and naturalize social hierarchy and national unity. Interestingly, this mirrors contemporaneous developments in diagrammatic representations of ‘natural’ systems of plant and animal species (Rieppel, 2010), suggesting a link between diagrammatic conceptualizations of natural and social orders that is still in need of further exploration.
The family tree in anthropology and human genetics
With regard to the history of biological anthropology, there can be no doubt that the tree image is the dominant means to (re)present the evolution and relation of taxa. Despite this undisputed epistemic importance and political power of the anthropological tree, diagrams of relatedness have to be considered more broadly (Lipphardt and Sommer, 2015; Sommer, e.g. 2007: Part II, 2015, 2016). Thus, in her contribution, Marianne Sommer focuses on the very beginnings of physical anthropology to show how a decidedly diagrammatic tradition established itself vis-à-vis the older, historical-comparative approach. Discussing a wide range of diagrammatic imagery that was introduced to produce ‘human races’ and their relations in the first place, that is, prior to proposing the final product in the shape of a tree, she also brings to light the violent practices behind it. Indeed, she demonstrates that rather than aiming at the creation of kinship, these diagrams were developed to deny close affinities between human groups as they had long been acknowledged in the image of the human family (tree).
Another disciplinary locus in which genealogical diagrams were arguably as important as in biological anthropology is social anthropology, or, more precisely, kinship studies as a central research field of that discipline. Helen Gardner shows in her contribution that the work of ‘the father of kinship studies’, the American anthropologist Lewis Henry Morgan, indicates that the different traditions of diagrammatics of human relatedness are in fact interlinked, because, in his founding Systems of Consanguinity and Affinity of the Human Family (1871), he incorporated the arbores techniques. Morgan came up with a ‘schedule’ to analyse systems of kinship that profoundly influenced social anthropology up to Claude Lévi-Strauss’ Les structures élémentaires de la parenté (1949). However, the introduction of kinship diagrams, especially of the family tree, as a method to present and communicate data happened surprisingly late in this field. In the earliest systematic collection of data on global kinship systems, Morgan mostly built on tables in the tradition of the word lists compiled by explorers and missionaries in the decades before. Furthermore, when new diagrammatic forms to capture kinship were experimented with, diverse fields, even chemistry, were drawn on. Although such methods for analysing and circulating data were established in the Australian colonies in the 1870s, these were not reproduced in any publications until the 1890s.
Around the same time, with the advent of human genetics, tree imagery gained another kind of importance. The inventor of the term eugenics, Darwin's cousin Francis Galton, introduced in his Hereditary Genius (1892[1869]) a system for designating kin relations that was analogous to Morgan's, and supposedly laid bare the invisible mechanism by which ‘talent’ and ‘genius’ were passed down through the germ line from generation to generation. He placed equal emphasis on maternal and paternal lines, even if the traits that he was interested in were considered to be exclusively male (Müller-Wille, 2022: 88–90). Towards the end of the 19th century, with a similar delay as in the case of Morgan, such pedigrees became standard elements of publications in psychiatry as well as in human genetics and eugenics (Gausemeier, 2016; Porter, 2018). With the ambition to capture whole networks of kin relations for several generations, the resulting diagrams resembled electrical circuits more than trees (Gausemeier, 2014; Germann, 2016: 183–307; Müller-Wille and Rheinberger, 2012: 120–3). This can be illustrated with the Darwin-Wedgewood-Galton ‘family tree’ that charted ‘genius’ and ‘scientific ability’ and that became iconic for the eugenics movement: the inclusion of the female line produced a ‘loop’ caused by cousin marriage (see Figure 2).
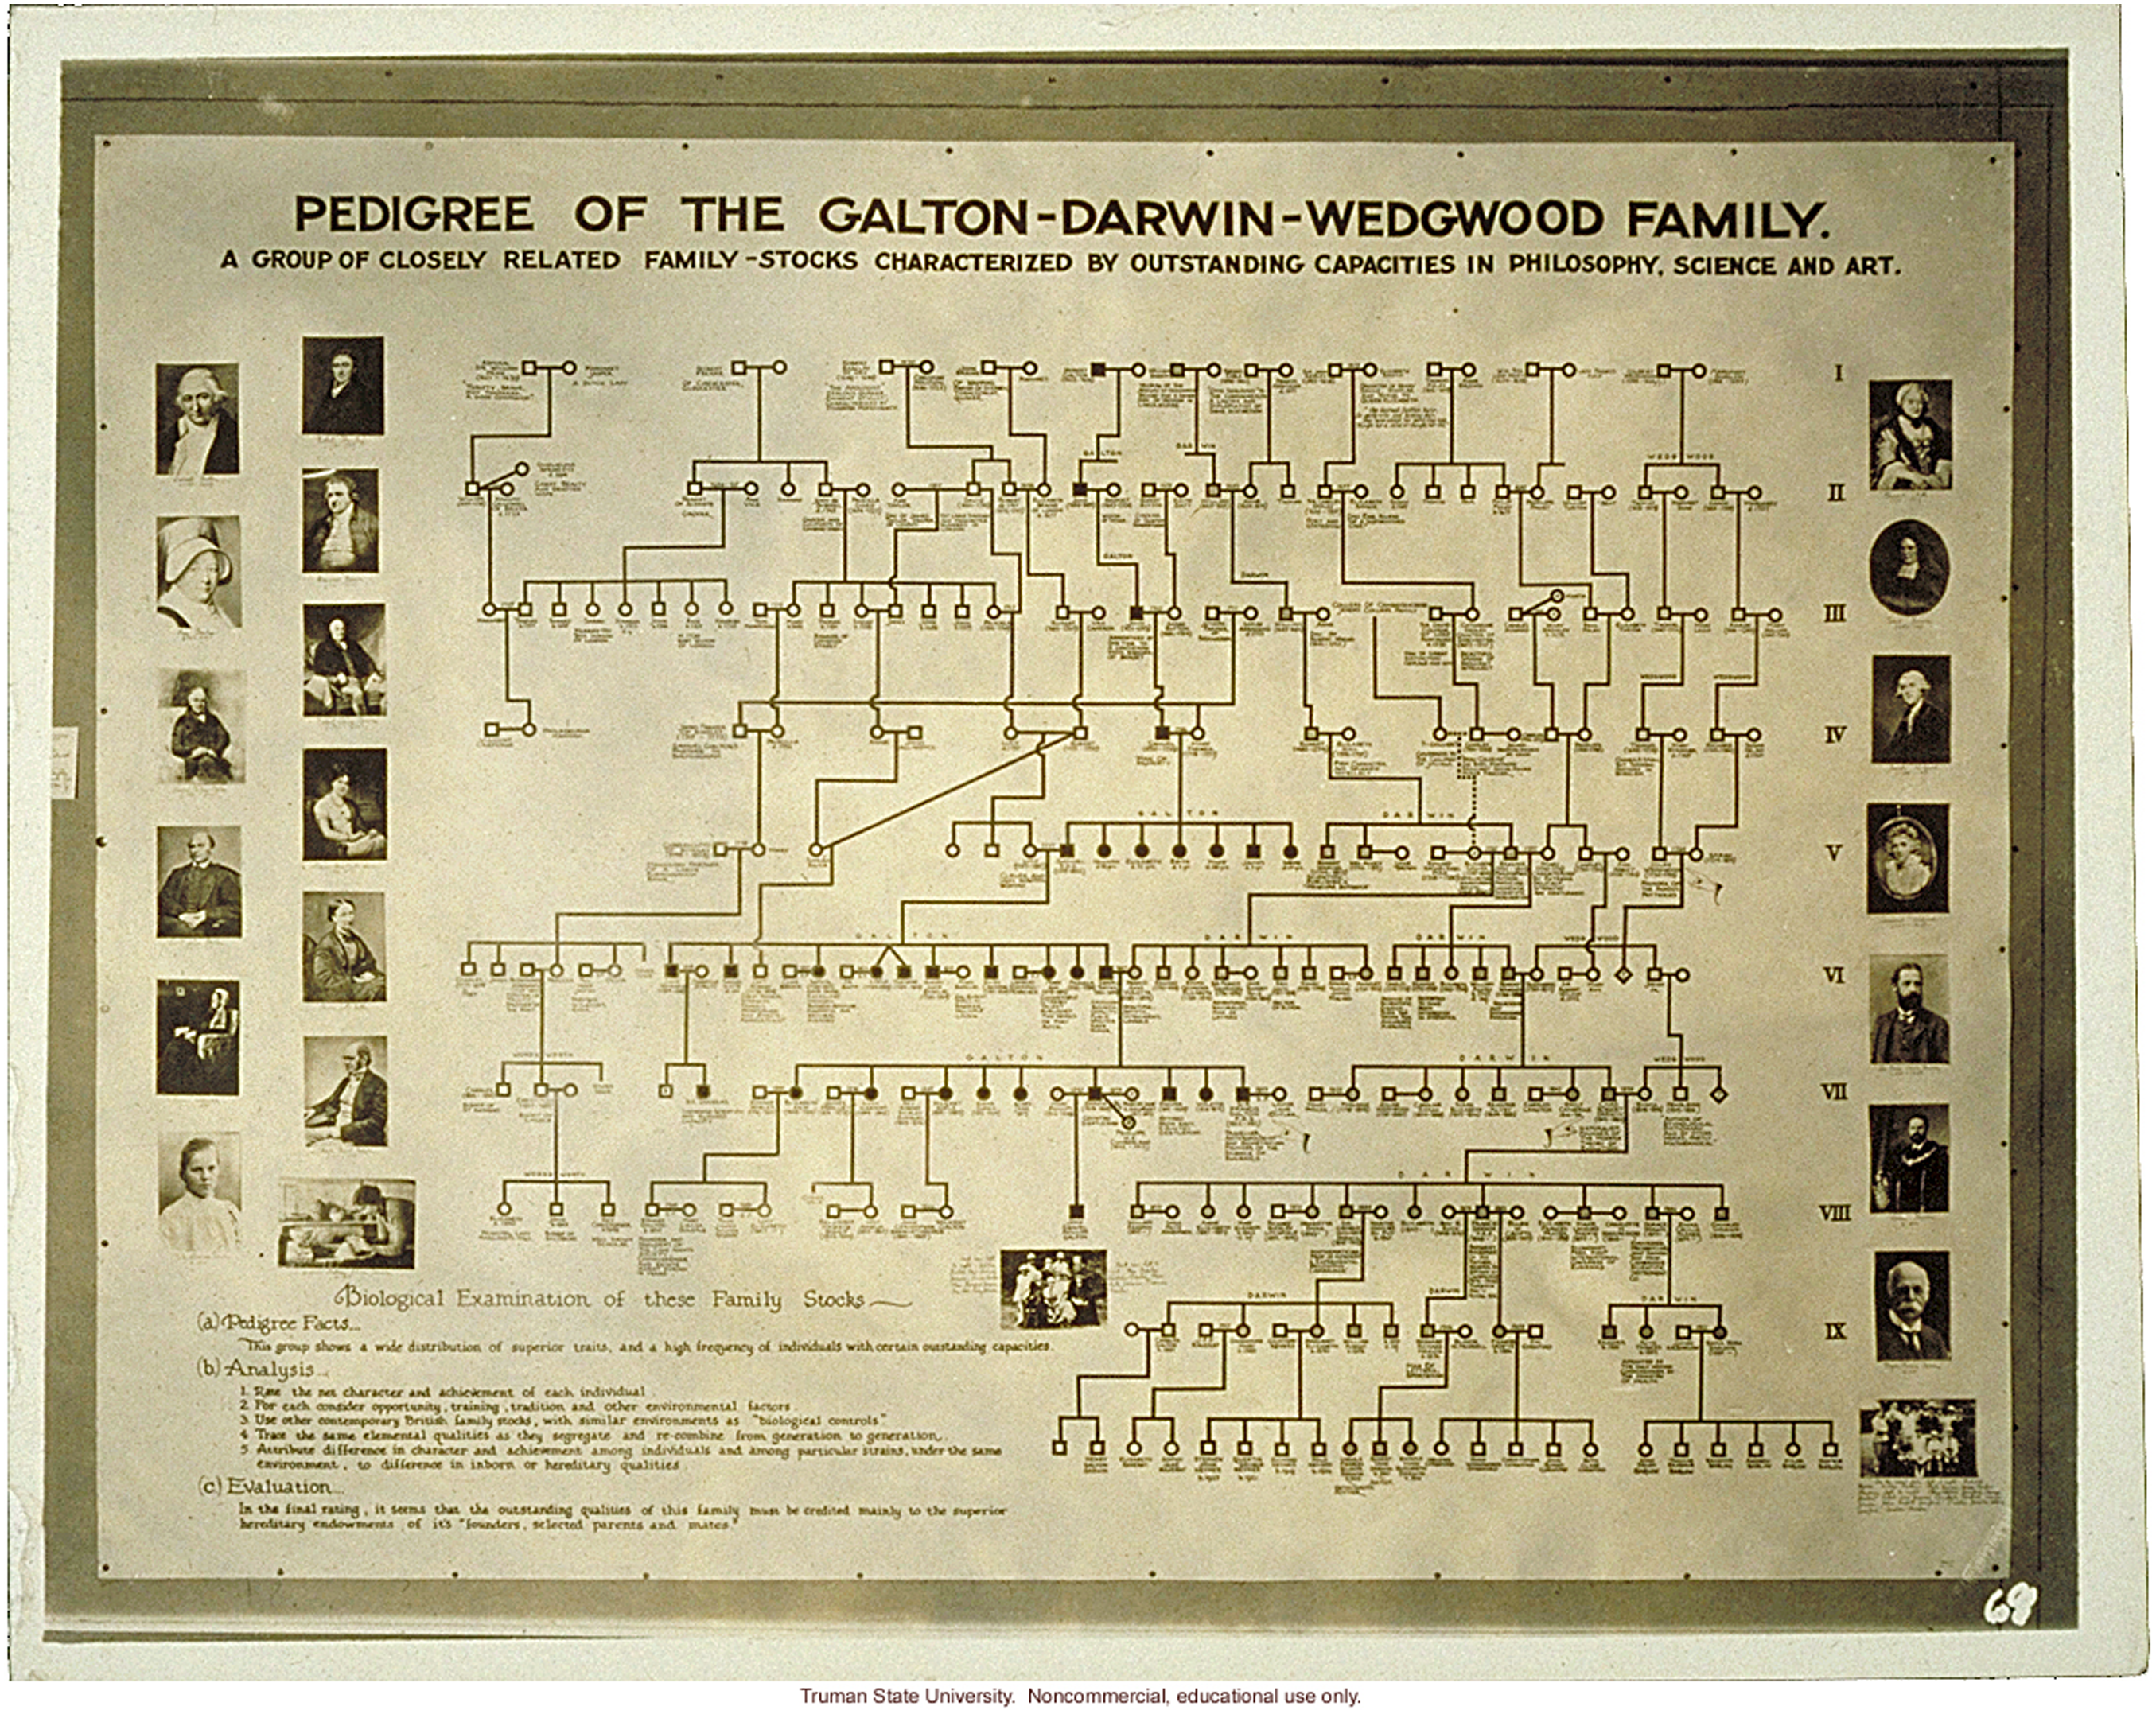
‘Pedigree of Galton-Darwin-Wedgwood Family’, 3rd International Eugenics Conference 1932 (Truman State University, Pickler Memorial Library Special Collections and Museum Department, Harry H. Laughlin Papers, HQ 750 A3 I6 1932D pt. 1).
Indeed, ancestral charts and family trees were structurally unfit for the statistical examination of Mendelian ratios, which were based on a combinatorial logic and thus sought to trace relations between gametes and zygotes, that is, the descent of genetic dispositions rather than of individuals or taxa. In addition, Amir Teicher, in his contribution to this special section, makes a strong case for the constructedness of diagrams of relatedness, as on their way into textbooks and more popular realms, pedigrees could be made to exemplify the Mendelian rules of inheritance rather than purely represent a full set of data.
Diagrams of the ‘races’ in anthropology, of individuals and traits in psychiatry and eugenics, but also of genetic dispositions in Mendelian genetics came to inform the biopolitics of totalitarian regimes, including in Nazi Germany (Teicher, 2020). In the early 20th century, lay people were actually encouraged to construct their genealogical charts – in brochures, for instance – in association with eugenic projects to improve the populace (Gausemeier, 2008). Nowadays, family trees continue to be used in genetic counselling in the context of ‘genetic risks’ (e.g. Castañeda, 2002; Nukaga and Cambrosio, 1997). In the end, our introductory exploration of the role of diagrams in experimenting with human relatedness, as well as the contributions to this special section, suggest that diagrams, as well as tools for thinking, are tools for making. Diagrams of human relatedness carry political meaning and power beyond their epistemic worth. They entangle history and the human sciences.
Footnotes
Declaration of conflicting interests
The authors declared no potential conflicts of interest with respect to the research, authorship, and/or publication of this article.
Funding
The authors disclosed receipt of the following financial support for the research, authorship, and/or publication of this article: This article is part of the Swiss National Science Foundation Sinergia-Project ‘In the Shadow of the Tree: The Diagrammatics of Relatedness as Scientific, Scholarly, and Popular Practice’, available at: ![]() .
.