
Abstract
Nonprofit organizations are under pressure to contain their overhead costs. This pressure can affect spending behavior and create an impulse to manipulate financial reporting data. Drawing on stakeholder theory, this study develops a comprehensive framework of ratio management pressure and examines the extent to which external and internal pressures affect financial decisions. We conduct a scenario experiment wherein financial managers perform accounting and spending tasks after subjection to various types of pressure: donor pressure, board pressure, or media pressure. We find that donor pressure significantly affects both accounting and spending behavior, whereas board and media pressure affect only accounting choices. Our research generates insights into the extent to which the observed practice of continuous cost containment is driven by external pressure or rather by organizations themselves. These findings are insightful for nonprofit leaders who wrestle with complex financial challenges and the expectations of multiple stakeholder groups.
Keywords
Introduction
Many nonprofit organizations face pressure to demonstrate financial efficiency. Despite regular criticism on various grounds as a poor efficiency measure, the overhead ratio (i.e., the proportion of total expenses dedicated to administration and fundraising) continues to receive considerable attention among stakeholders and nonprofit organizations themselves (Coupet & Berrett, 2019). Accordingly, many organizations keep their overhead ratio low by engaging in ratio management—the deliberate manipulation of cost ratios as well as the cutting back of overhead-related expenditures (Parsons et al., 2017). In recent years, concerns have risen that these practices lead to systemic underfunding of vital administrative infrastructure, such as maintaining well-trained staff, up-to-date information technology, or sustainable fundraising. This underfunding can ultimately impair organizations’ ability to effectively deliver on their social mission (Gregory & Howard, 2009; Lecy & Searing, 2015; Schubert & Boenigk, 2019).
To date, nonprofit literature holds that ratio management is fundamentally driven by pressure from donors (Garven et al., 2016). Numerous archival (Weisbrod & Dominguez, 1986) and experimental studies (Gneezy et al., 2014; Newman et al., 2019) have assessed this argument from a donor perspective, suggesting that willingness to give is at least in part dependent on reported cost ratios. From an organizational perspective, Parsons et al. (2017) conducted a survey among 200 nonprofit managers that explicitly measured their perceptions of donor pressure and their willingness to manage ratios. The authors found that perceived donor pressure is a strong predictor for the willingness to manage ratios and that 52% of the survey participants were openly willing to make spending changes to keep the program ratio at a desirable level.
In this study, we argue that the primary focus on donor pressure as a key driver of ratio management has come at the expense of a more holistic assessment of the pressure environment faced by financial managers. Garven et al. (2016), for example, argue that the media is another potential external pressure source. However, this effect of media pressure on ratio management has not yet be investigated empirically. More broadly, cost efficiency expectations are widespread among a range of different external and internal stakeholders who can all potentially pressure managers to engage in ratio management. Most notably, prior nonprofit literature has not examined the extent to which internal pressure drives ratio management. Behavioral accounting research in for-profit contexts illustrates that managerial decisions are strongly affected by internal social influence pressure from superiors (Bishop et al., 2016). From conversations with financial managers we see evidence of a similar phenomenon in the nonprofit sector, such that some board members have internalized the norm of keeping overhead low and pressure financial managers to report favorable ratios. Thus, a first research gap exits regarding the effects that external and internal pressure sources have on the behavior of nonprofit financial managers.
We furthermore note that most previous studies on ratio management so far have relied on archival financial data (Keating et al., 2008; Kitching et al., 2012; Krishnan et al., 2006; Krishnan & Yetman, 2011). These studies employ financial proxies to infer the effect of pressure on reporting behavior and collectively provide compelling evidence that ratio management is a widespread phenomenon. However, experimental research allows for a more direct assessment of managers’ behavioral changes when confronted with stakeholder expectations. Adopting a micro-perspective also allows for a more nuanced take on the dominating mechanism of ratio management, that is, whether individual financial managers are more inclined to management ratios through accounting or through spending decisions. A second research gap is hence the limited application and use of experimental methodology in the study of nonprofit financial decision making.
In light of these research gaps, this article aims to answer the following research question: to what extent do external and/or internal pressures to report low overhead change the behavior of nonprofit financial managers? To answer this question, we conduct a scenario experiment with 223 experienced nonprofit financial managers from German nonprofit organizations, in which we confront them with a set of cost accounting and spending tasks that affect an organization’s overhead ratio. In our experiment, we manipulate cost efficiency expectations raised by different stakeholders (namely donors, the board of directors, and the media) to assess whether such stimuli trigger differential pressure perceptions and cost decisions.
Complementing prior research on ratio management, our study makes several important contributions. First, we draw on stakeholder theory to conceptually develop a comprehensive framework of ratio management pressure that distinguishes several external as well as internal pressure sources. Second, we contribute methodologically with an experimental research approach that shifts the level of analysis from the organization to the individual financial manager. Opening the black box of the organization is insightful to better understand whether the practice of continuous cost containment is a result of external pressure only or also of internal pressure dynamics within an organization. Finally, our study contributes to the literature by studying the phenomenon of ratio management in a new context. Our sample is composed of financial managers from German nonprofit organizations. In a nonprofit sector with very limited mandatory financial disclosure requirements (Schubert & Boenigk, 2019), most organizations in our sample disclose financial data only as part of their compliance with self-regulation initiatives. This provides an interesting new study context for ratio management, as prior research is almost exclusively based on the U.S. nonprofit sector that is shaped by a much higher degree of financial transparency.
Toward a Comprehensive Framework of Ratio Management Pressure
The theoretical foundation of our conceptual framework is stakeholder theory (Freeman, 1984; Mitchell et al., 1997). Stakeholder theory situates organizations in an environment of multiple claims from groups “who can affect or [are] affected by the achievement of the organization’s objectives” (Freeman, 1984, p. 46). A key premise is that the configuration of stakeholder claims predicts managerial decisions. As these claims at times compete with one another (Donaldson & Preston, 1995), managers must weigh various stakeholder interests and carefully decide upon which ones to prioritize (Mitchell et al., 1997). To understand the process of stakeholder prioritization, the theory further holds that stakeholders vary in the level of pressure they exercise, referring to the “ability and capacity of stakeholders to affect an organization by influencing its organizational decisions” (Helmig et al., 2016, p. 154). Following Mitchell et al. (1997), the level of pressure can be viewed as socially constructed, hinging on various attributes individual managers cognitively ascribe to the respective stakeholder. As described in their theory of stakeholder salience, these attributes include a stakeholder’s power, legitimacy, and urgency (Mitchell et al., 1997). While power refers to the extent to which a stakeholder “has or can gain access to coercive, utilitarian, or normative means, to impose its will in the relationship” (Mitchell et al., 1997, p. 865), legitimacy is “a generalized perception or assumption that the actions of an entity are desirable, proper, or appropriate within some socially constructed system of norms, values, beliefs, and definitions” (Suchman, 1995, p. 574).
Management scholars have used stakeholder theory extensively to investigate how managers prioritize stakeholder interests and to what extent stakeholder pressure drives organizational decisions (Helmig et al., 2016; Kassinis & Vafeas, 2006). Nonprofit researchers have long highlighted that stakeholder theory is a particularly suitable lens to investigate decisions, given that nonprofit organizations lack a clear ownership structure and are therefore exposed to many different stakeholder demands (Knox & Gruar, 2007; LeRoux, 2009; Van Puyvelde et al., 2012).
Whereas prior ratio management literature has strongly focused on donor pressure and accordingly drew on resource dependency theory (Kitching et al., 2012; Parsons et al., 2017), we argue in this study that a stakeholder theory lens contributes to a more holistic understanding of the financial pressure environment. Our conceptual framework, shown in Figure 1, acknowledges that a wide range of different external and internal stakeholders can contribute to ratio management pressure. To identify a comprehensive list of relevant stakeholders, we reviewed general stakeholder classifications in the nonprofit literature (Schubert & Willems, 2020; Van Puyvelde et al., 2012) and closely examined what stakeholders are explicitly discussed in prior ratio management literature (Eckhart-Queenan et al., 2019; Garven et al., 2016; Gregory & Howard, 2009; Parsons et al., 2017; Wing & Hager, 2004). In particular, we relied on prior frameworks of the ratio management pressure environment by Garven et al. (2016) and Eckhart-Queenan et al. (2019). As external stakeholders, we conceptualize five segments: (a) All kinds of donors, (b) intermediaries (such as the media, watchdogs or accreditation agencies), (c) institutional funders (such as governmental agencies, foundations, or other grant-making nonprofit organizations), (d) beneficiaries, and (e) the general public. Internal stakeholders notably include (a) members of the board of directors, (b) employees (including managers and paid staff), and (c) volunteers. The framework conceptually acknowledges that the different sources of pressure are interrelated (see arrows in Figure 1) and that all these pressures may be present at the same time. This limitation should be kept in mind when we later empirically test and interpret the results of the isolated effects of a single pressure source on decision-making.
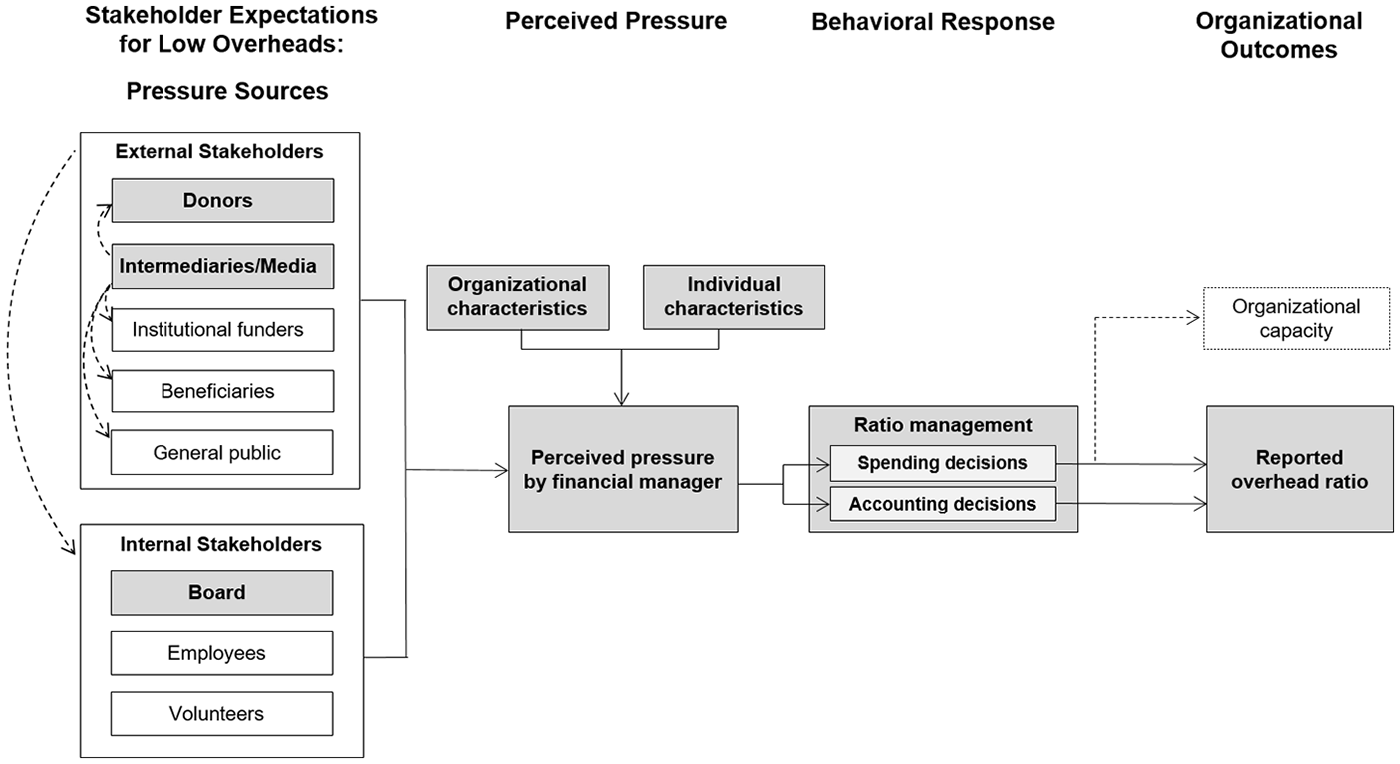
A comprehensive framework of ratio management pressure.
Our framework’s logic is furthermore rooted in the fundamental mechanisms of the nonprofit starvation cycle, which holds that stakeholder expectations for low overheads lead to perceived pressure by financial managers. We follow Parsons et al. (2017) that perceived pressure is likely influenced by the individual characteristics of the financial manager, for example, his or her work experience or educational background, and by organizational characteristics, like an organization’s size, funding structure, governance, or accreditations. While aiming for a comprehensive and generalizable framework, we hence acknowledge that the presence or absence of certain stakeholder pressures can vary greatly between and even within organizations (DeZoort & Lord, 1997). Perceived pressure by the financial manager may then in turn lead to ratio management, which is based on both spending and accounting decisions (Parsons et al., 2017). As shown in Figure 1, ratio management affects the reported overhead ratio as our final outcome. Although not part of our subsequent empirical study, our framework also illustrates the link between ratio management and organizational capacity. When managers base their spending decisions on the desire to keep overhead low, this can lead to systemic underspending on organizational infrastructure (Gregory & Howard, 2009).
Finally, we want to acknowledge that the behavioral accounting literature distinguishes between two pressure variants: chronic versus acute pressure, which we did not explicitly conceptualize in our framework but that are implicitly existent (DeZoort & Lord, 1997). Pressure has a chronic dimension in that the norm for cost efficiency is nowadays so prevalent in the organizational environment that it affects the cognition of financial managers even without explicit articulation by a stakeholder. That said, pressure becomes acute, and hence particularly salient, when managers are directly exposed to a stakeholder’s expectations, knowing that individual and organizational performance may depend on their ability to meet stakeholder demands. Against this backdrop, our study can be understood as an investigation of how exposure to acute pressure, that is, the direct confrontation with stakeholder expectations, affects ratio management.
Hypothesis Development
Figure 1 offers a broad view on stakeholder relationships. The advantage of such a broad perspective is that this may inspire other researchers to analyze not only different pressure sources but also how they are related to each other. However, testing our full framework in one study would be overly ambitious so that we decided to focus on three specific stakeholder segments: donors, the board of directors, and the media.
Donor Pressure
Following the stakeholder theory lens, financial managers will likely perceive donors as a particularly salient stakeholder group. First, managers are aware that in times of increased competition on the market for charitable donations, organizational performance will depend on their ability to retain donors and build long-term relationships (Arya & Mittendorf, 2015). Second, donors hold direct sanctioning ability, as they can, upon discontent, easily choose giving to another organization. Nonprofit literature provides considerable evidence of donor pressure resulting from an aversion toward overhead costs. High overhead increases the “price of giving,” that is, the cost for one unit of charitable output (Weisbrod & Dominguez, 1986), or, alternatively, it decreases the perceived impact of giving (Charles et al., 2020; Gneezy et al., 2014). Chen (2016) argues that this holds true for major donors in particular who are more likely than small donors to pay attention to organizational performance metrics. Accordingly, managers have been found to perceive donor pressure to contain overhead costs which impacts their willingness to engage in ratio management (Berlin et al., 2017; Parsons et al., 2017). Following these prior studies, we hypothesize:
Board Pressure
Internal stakeholders, and notably the board of directors as the body with ultimate decision-making authority, are a much less explored pressure source. Board pressure can arise for at least two reasons. First, board members may, in light of limited monitoring ability, interpret a high share of program-related spending as an indicator of good managerial performance (Arya & Mittendorf, 2015). Pressure to meet expectations for low overhead spending can hence arise when financial managers seek to maintain positive job performance evaluations. Indeed, several studies in the nonprofit literature have found a positive relationship between managerial compensation and reported program ratios (Baber et al., 2002; Frumkin & Keating, 2010). While professional managers may be particularly sensitive to performance evaluations, we believe that a similar sensitivity exists when financial decisions are made by volunteers, given that volunteering is strongly guided by a desire for personal enhancement and social belonging (Clary et al., 1998). Second, board members are frequently themselves community members who interact with external stakeholders and may therefore act as spokespersons of external expectations within an organization. We received a similar feedback in a number of conversations with senior financial managers. For instance, one chief financial officer indicated that boards tend to exert pressure when board members are themselves actively involved in external communications. Accordingly, we expect:
Media Pressure
A third pressure source are information intermediaries, including the media and/or charity watchdogs. Evidently, media pressure becomes particularly salient within organizations that are directly confronted with critical media coverage. For instance, Tinkelman (2009) illustrates in a case study of the Avon Products Foundation how media focus on fundraising ratios pressured the organization to relabel fundraising costs as program costs. However, we hold that media pressure goes beyond individual organizations affected by critical media coverage. A more relevant mechanism for the sector as a whole is that critical media coverage makes the norm for cost efficiency salient and can affect public trust in the sector (Becker et al., 2020). As producers of trust goods, nonprofit organizations heavily rely on the public’s trust as an important intangible asset and determinant of giving (Bekkers, 2003). McDougle and Handy (2014) find that the media represents the most frequently used source of donors’ information gathering on organizational performance. We therefore believe that confrontation with critical media coverage also affects judgments of financial managers even when their organization is not directly targeted. Thus, our third hypothesis is:
Pressure Strength
Stakeholder theory allows us to further hypothesize about differential pressure strength. As elaborated above, Mitchell et al. (1997) suggest that the degree to which stakeholder expectations find representation in organizational decisions depends on a stakeholder’s salience, captured by the attributes of power, legitimacy, and urgency. In many organizations, board members and donors are likely among the most salient stakeholders, given that they maintain a direct power relationship and are often in closer social proximity to financial managers. As we argued above, media pressure does not necessarily target the specific organization but the sector as a whole, arguably implying a lower degree of salience. In a comprehensive examination of stakeholder influences, Miragaia et al. (2016) corroborate this assertion, finding that the media is a less important stakeholder when compared with board members and sponsors. If similar mechanisms apply in a ratio management context, we would expect:
Method
Research Design, Data Collection, and Study Participants
We conducted a between-subjects online scenario experiment with nonprofit financial managers of German nonprofit organizations, in which participants assumed the role of a financial manager for a fictitious organization. Participants were randomly assigned to different pressure stimuli and then made several cost accounting and spending decisions that would affect the organization’s overhead ratio. The subjects placed in the control group were not subjected to a pressure stimulus.
Data collection took place in August and September 2019. In a first step of the data collection process, we identified a relevant population of organizations, which included all organizations that have either signed the self-regulation Initiative for a Transparent Civil Society (ITZ) or hold the donation seal of approval from the German Central Institute for Social Issues (DZI). In a nonprofit sector that is subjected to limited legal requirements of financial disclosure (Schubert & Boenigk, 2019), these two information intermediaries cover an important segment of organizations active on the German charitable donations market. In a second step, all 1,241 organizations (1,105 ITZ signatories, 231 DZI accredited organizations, of which 95 hold both certifications) were invited individually by email to participate in our study. To ensure a high-quality sample of financial managers, we screened the website of each organization to identify and directly contact the preferred study participant. Whenever possible, we contacted the person listed to be in charge of managing organizational finances. Depending on an organization’s size and degree of professionalism, specific role profiles of these individuals varied, including financial managers, executive directors, and treasurers. If no person was listed as being in charge of managing finances, we contacted an accountant. Finally, when no information on personal responsibilities were provided, we contacted the organization through a general email address requesting the survey link to be forwarded to the person in charge of finances within the organization.
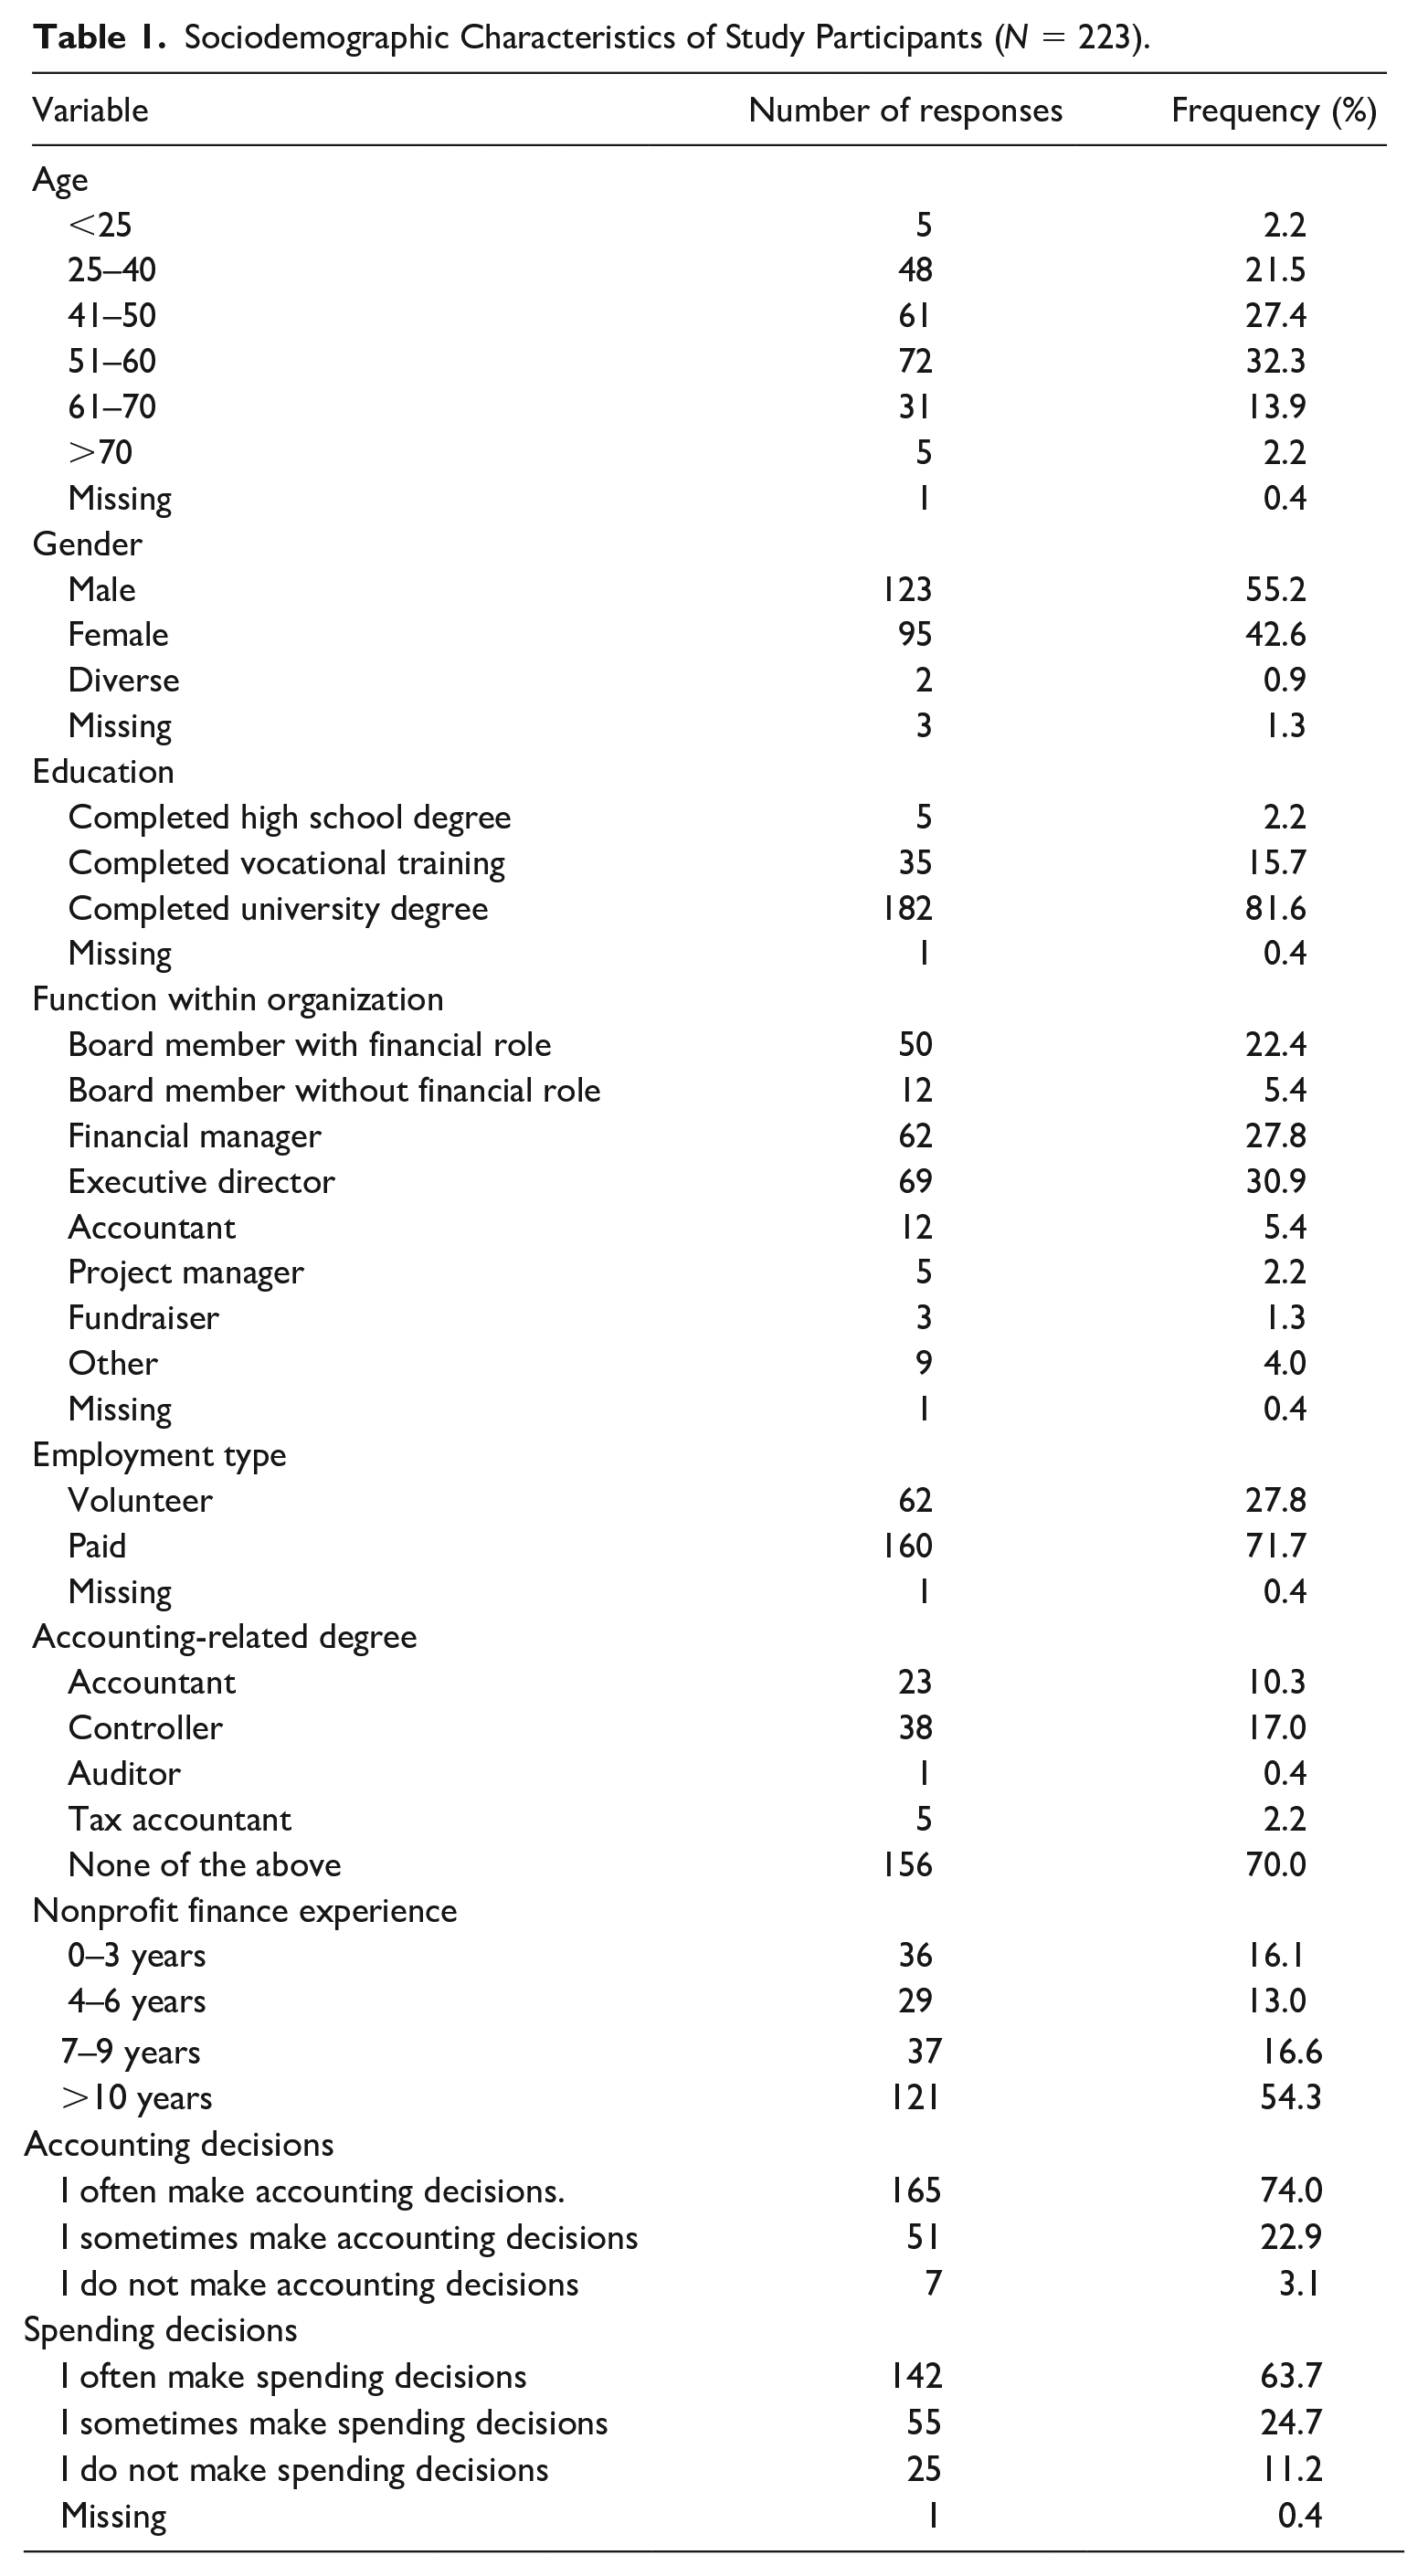
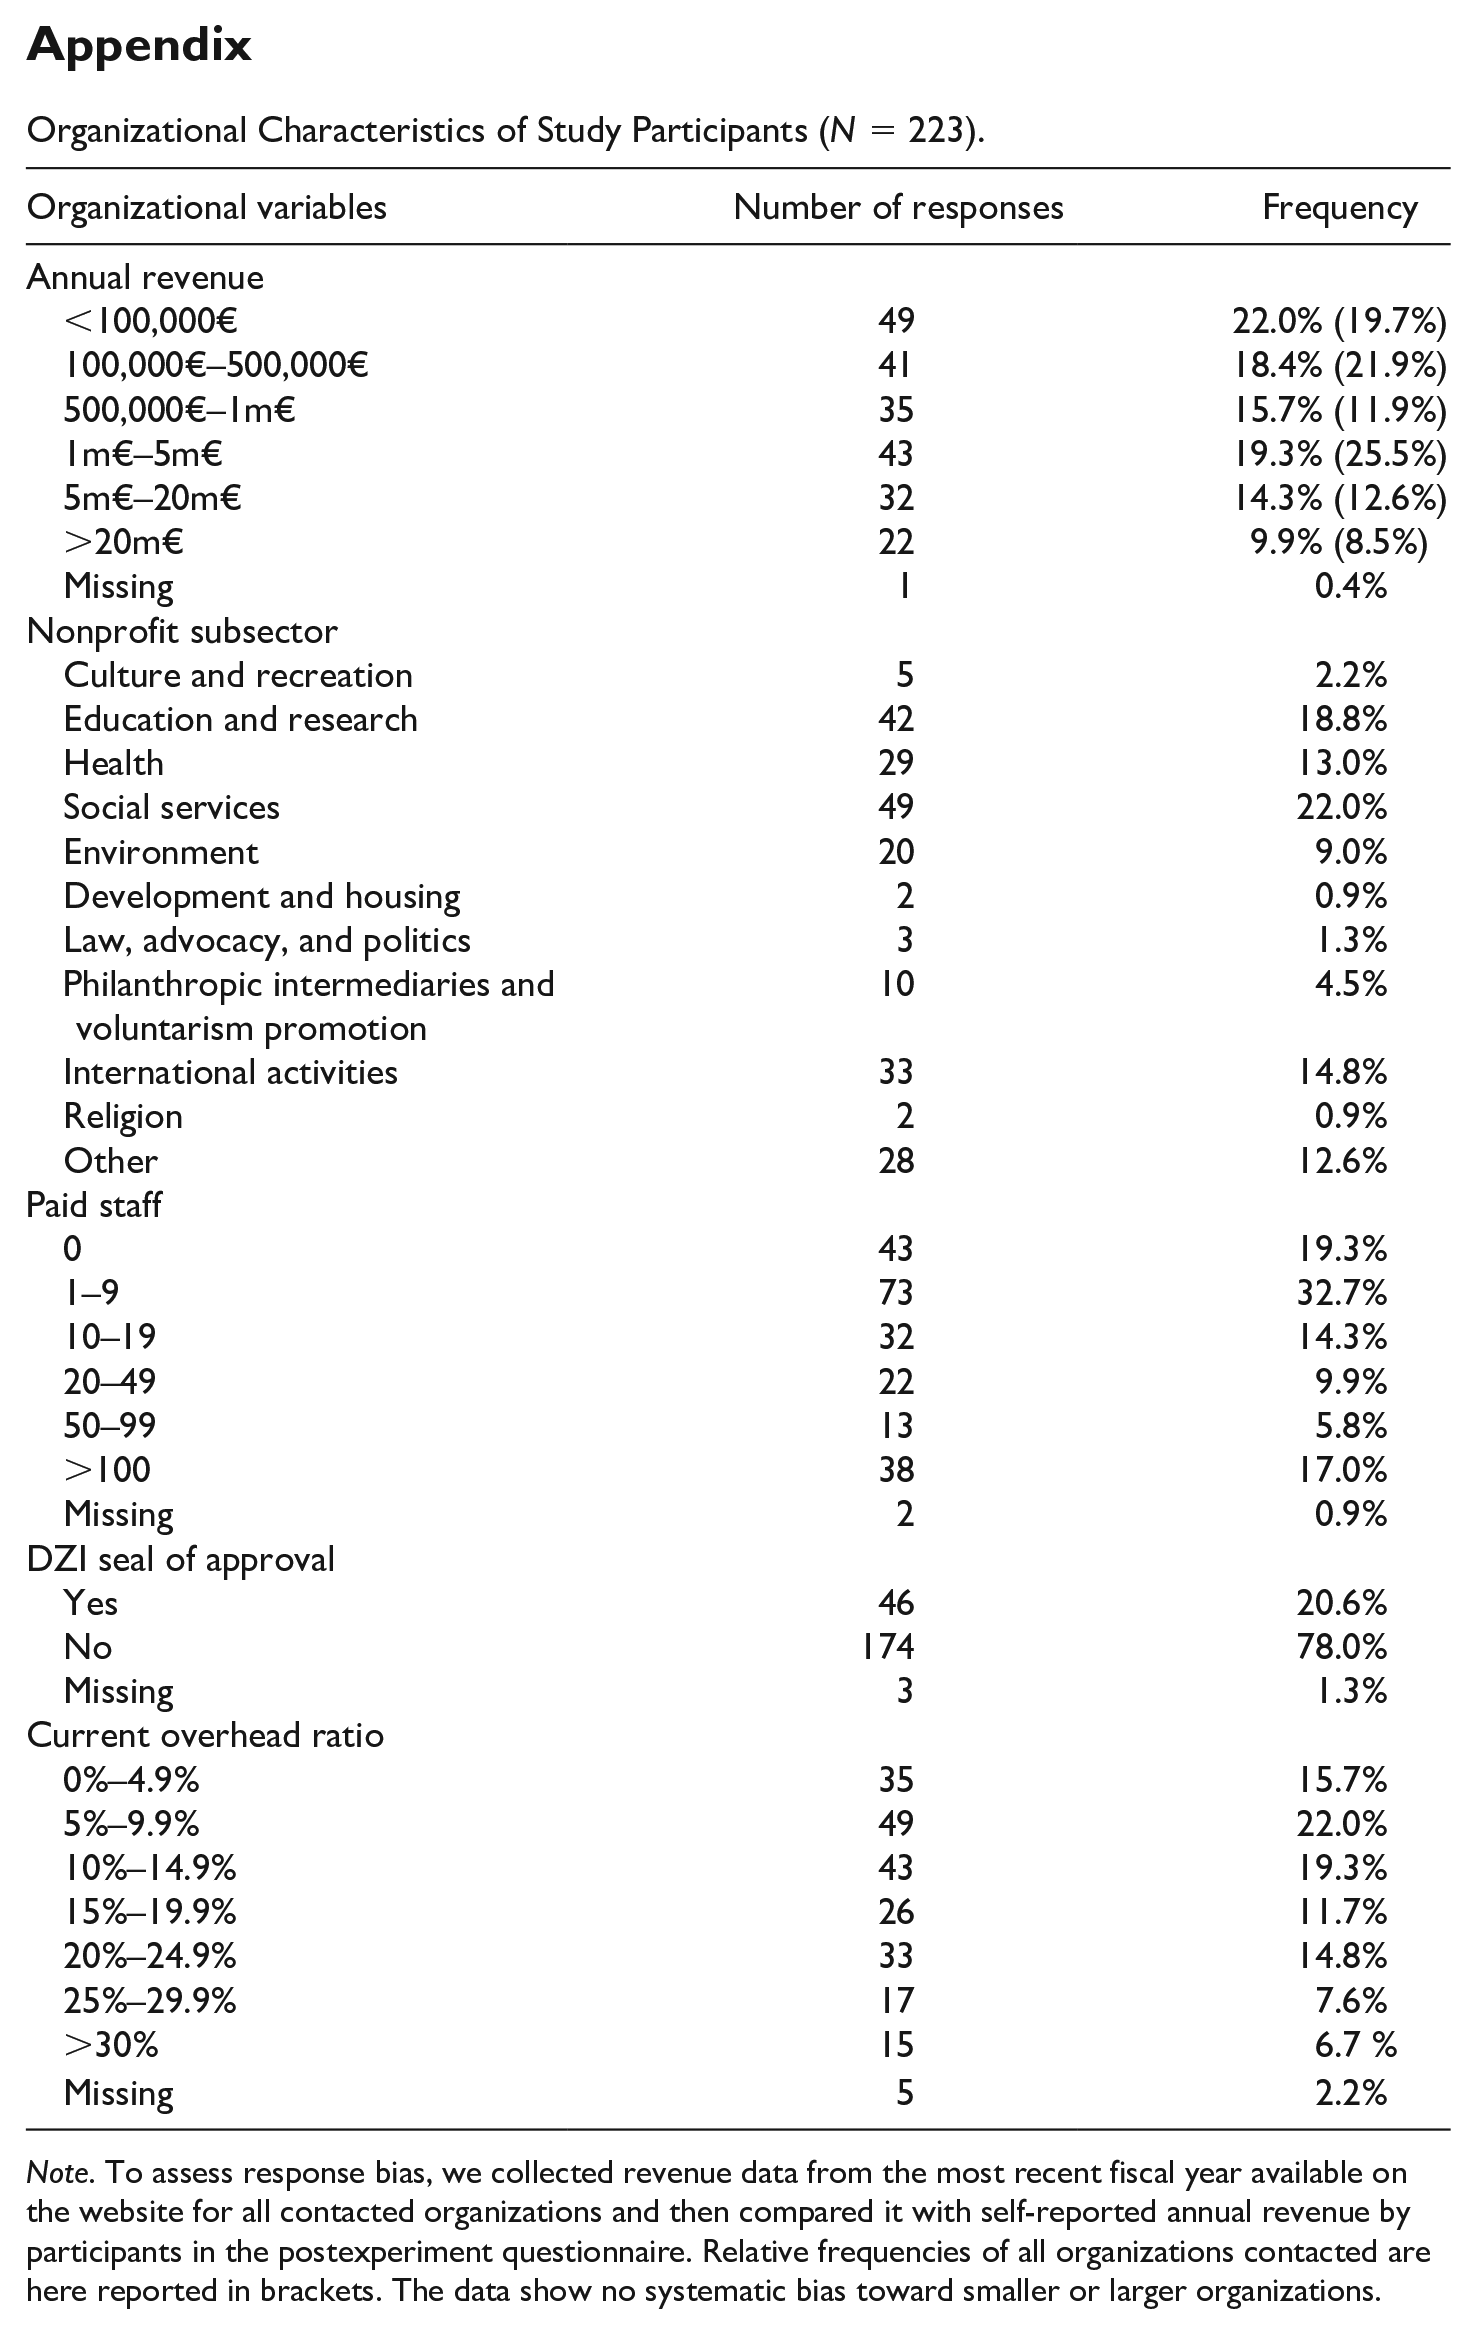
We received 223 responses from financial managers, corresponding to a response rate of 18.0%. Table 1 presents an overview of the sociodemographic characteristics of the participants in our study. The data show that our sample is predominantly composed of highly experienced decision makers and that they vary in the type of employment, in their role within the organization, and in their professional background. The Appendix shows other additional organizational characteristics. For none of the sociodemographic and organizational variables, we found significant differences across experimental conditions (all p values > .05).
Sociodemographic Characteristics of Study Participants (N = 223).
Pressure Source: Independent Variable Manipulation
We manipulated the source of pressure (donor pressure, board pressure, and media pressure) as an independent variable, and each of the experimental groups were given various information about stakeholder expectations. We took several precautionary steps to ensure that our conditions were realistically operationalized. First, we conducted five expert interviews with highly experienced financial managers on perceived pressure and ratio management. Second, we ran two separate pretests: one with a small sample of 45 nonprofit treasurers, and another one with 152 professional accountants recruited through an online panel. Last, we discussed the wordings of the manipulations with academic scholars.
Those participants who were subjected to the donor pressure condition were informed that at a major donor meeting key donors of the organization expressed the opinion that the overhead ratio should be lower and that they would consider donating to other organizations in the future. Another group of participants was subjected to board pressure. The participants were informed that at a board meeting, board members expressed the opinion that the overhead ratio should be lower and that they would monitor the financial manager’s work more closely. In the media pressure condition, participants read that the media reported on donation scandals and that key journalists had recently expressed the opinion that many nonprofit organizations should have a lower overhead ratio. The participants in the control group did not receive such information in addition to the case study material. The exact wording of the manipulations can be found in the full survey instrument available in the online Supplementary Materials.
Experimental Tasks and Procedure
Figure 2 shows a graphical representation of the experimental procedure.
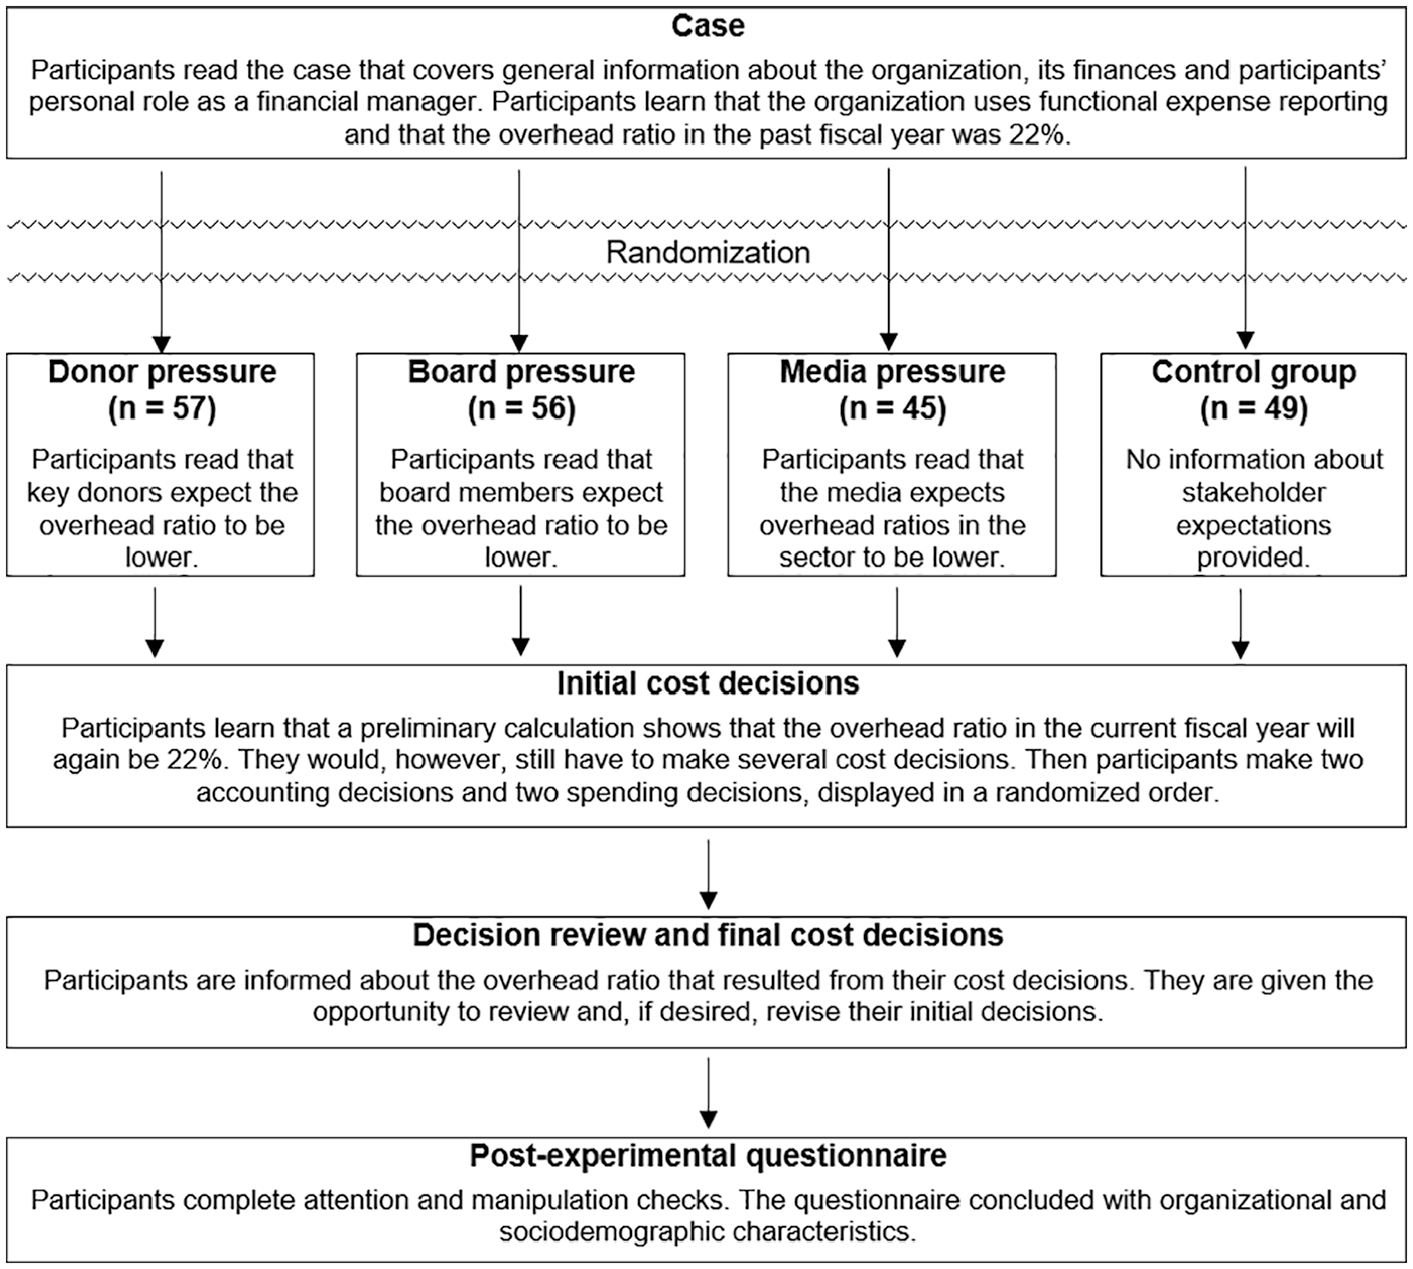
Overview of the experimental procedure.
After giving consent to the use of their data for academic purposes on the condition that their anonymity would be ensured, all participants first read the case materials. We chose a scenario where the overhead ratio was at 22%, because it exceeds the 20% threshold, which is an established overhead benchmark in the nonprofit sector (Kitching et al., 2012; Schubert & Boenigk, 2019). If assigned to one of the three pressure conditions, the participant’s material contained a paragraph about expectations expressed by the concerned stakeholder. In the next step, all participants were informed that a preliminary calculation had indicated that the overhead ratio for the current fiscal year will again be at 22%, though there were still several cost decisions to be made. These were two accounting tasks and two spending tasks displayed in random order. For each of the tasks, the participants were presented with six different cost allocation options and the effects of each allocation option on the overhead ratio were indicated (see Table A1 and Table A2 in the Supplementary Materials).
The two accounting tasks addressed a particularly contentious case in nonprofit accounting, entailing ambiguity whether costs fall within fundraising expenses (i.e., overhead) or within the expenses incurred to carry out the mandate of raising awareness for the social cause (i.e., programs) (Jones & Roberts, 2006). The first accounting task was worded more clearly as a case of fundraising expenses than the second task (see Table A1). The spending tasks confronted participants with the option of spending on fundraising and on information technology at the expense of an increasing overhead ratio (see Table A2). We opted for fundraising and information technology expenses as these are regularly discussed as areas that suffer from underinvestment in nonprofit organizations (Gregory & Howard, 2009).
Participants were then shown the overhead ratio that resulted from their initial decisions and were given the opportunity to revise their decision if desired. We included this review option to get more nuanced insights into the mechanism of ratio management. The postexperimental questionnaire then included attention and manipulation checks and questions regarding participants’ organizational and sociodemographic characteristics.
Dependent Variables
The degree of ratio management was measured with several dependent variables. First, we consider both versions of the reported overhead ratio, namely, a prereview overhead ratio that resulted from participants’ initial cost decisions and a postreview overhead ratio that resulted from the review. By their cost decisions, participants were able to decrease the overhead ratio to as low as 17% or have it rise to as high as 28%.
To further understand what drives potential changes observed in reported overhead ratios, we followed Parsons et al. (2017) and captured two additional dependent variables: Accounting as the sum of both final decisions on the accounting tasks and spending as the sum of the spending tasks. With each task having an assigned value between 1 and 6, the summative variables accounting and spending ranged between 2 and 12, where 2 indicates no allocation to overhead and 12 indicates full allocation to overhead (see Tables A1 and A2).
Individual and Organizational Characteristics
Following Parsons et al. (2017), we included several measures of managerial sophistication into the postexperimental questionnaire, including participants’ years of working experience in nonprofit finance, whether they hold an accounting-related degree, and whether they work as volunteers or paid staff (see Table 1). Following Chen (2016), we also assess perceived ethicality and asked the participants to indicate on a 9-point scale (1 = strongly disagree to 9 = strongly agree) whether they considered it ethical to report an overhead ratio of less than 22% for the current financial year in the described case. Last, we consider the size of the organization measured on the basis of its annual revenue and having the DZI seal of approval as organizational characteristics in our analysis (see Appendix).
Results
Manipulation Checks
With the first check, we assessed whether participants attended to the manipulation by asking them to recall information from their respective pressure conditions. Exclusion of 16 participants who did not pass this attention check resulted in a final sample of n = 207 participants for our subsequent analyses. A second check assessed whether the manipulation affected the underlying theoretical construct, namely, perceived pressure of financial managers. We asked participants to respond to the statement “I perceive high pressure to limit the overhead ratio” on a 9-point scale from 1 = strongly disagree to 9 = strongly agree. Participants in the control group (M = 5.08) felt significantly less pressure than in the donor pressure group (M = 6.82; Z = −3.88, p < .001) and in the board pressure group (M = 6.07; Z = −2.20, p = .028). However, we found a nonsignificant difference between the media pressure group (M = 5.93; Z = −1.71,p = .084) and the control group. Please note that all p values we report here and below are based on two-tailed tests.
Test of Hypotheses
Reported overhead ratios
We first evaluate our hypotheses with respect to the reported overhead ratio by means of a one-way between-subject ANOVA with subsequent planned contrasts. Table 2, Panel A presents the means, standard deviations, and number of observations separately for the prereview overhead ratio and postreview overhead ratio by experimental group. Table 2, Panel B shows that ANOVA results are statistically significant for both the prereview overhead ratio (F = 3.103, p = .028) and the postreview ratio (F = 4.701, p = .003).
One-Way Between-Subjects ANOVA Results for the Prereview Overhead Ratio and Postreview Overhead Ratio.
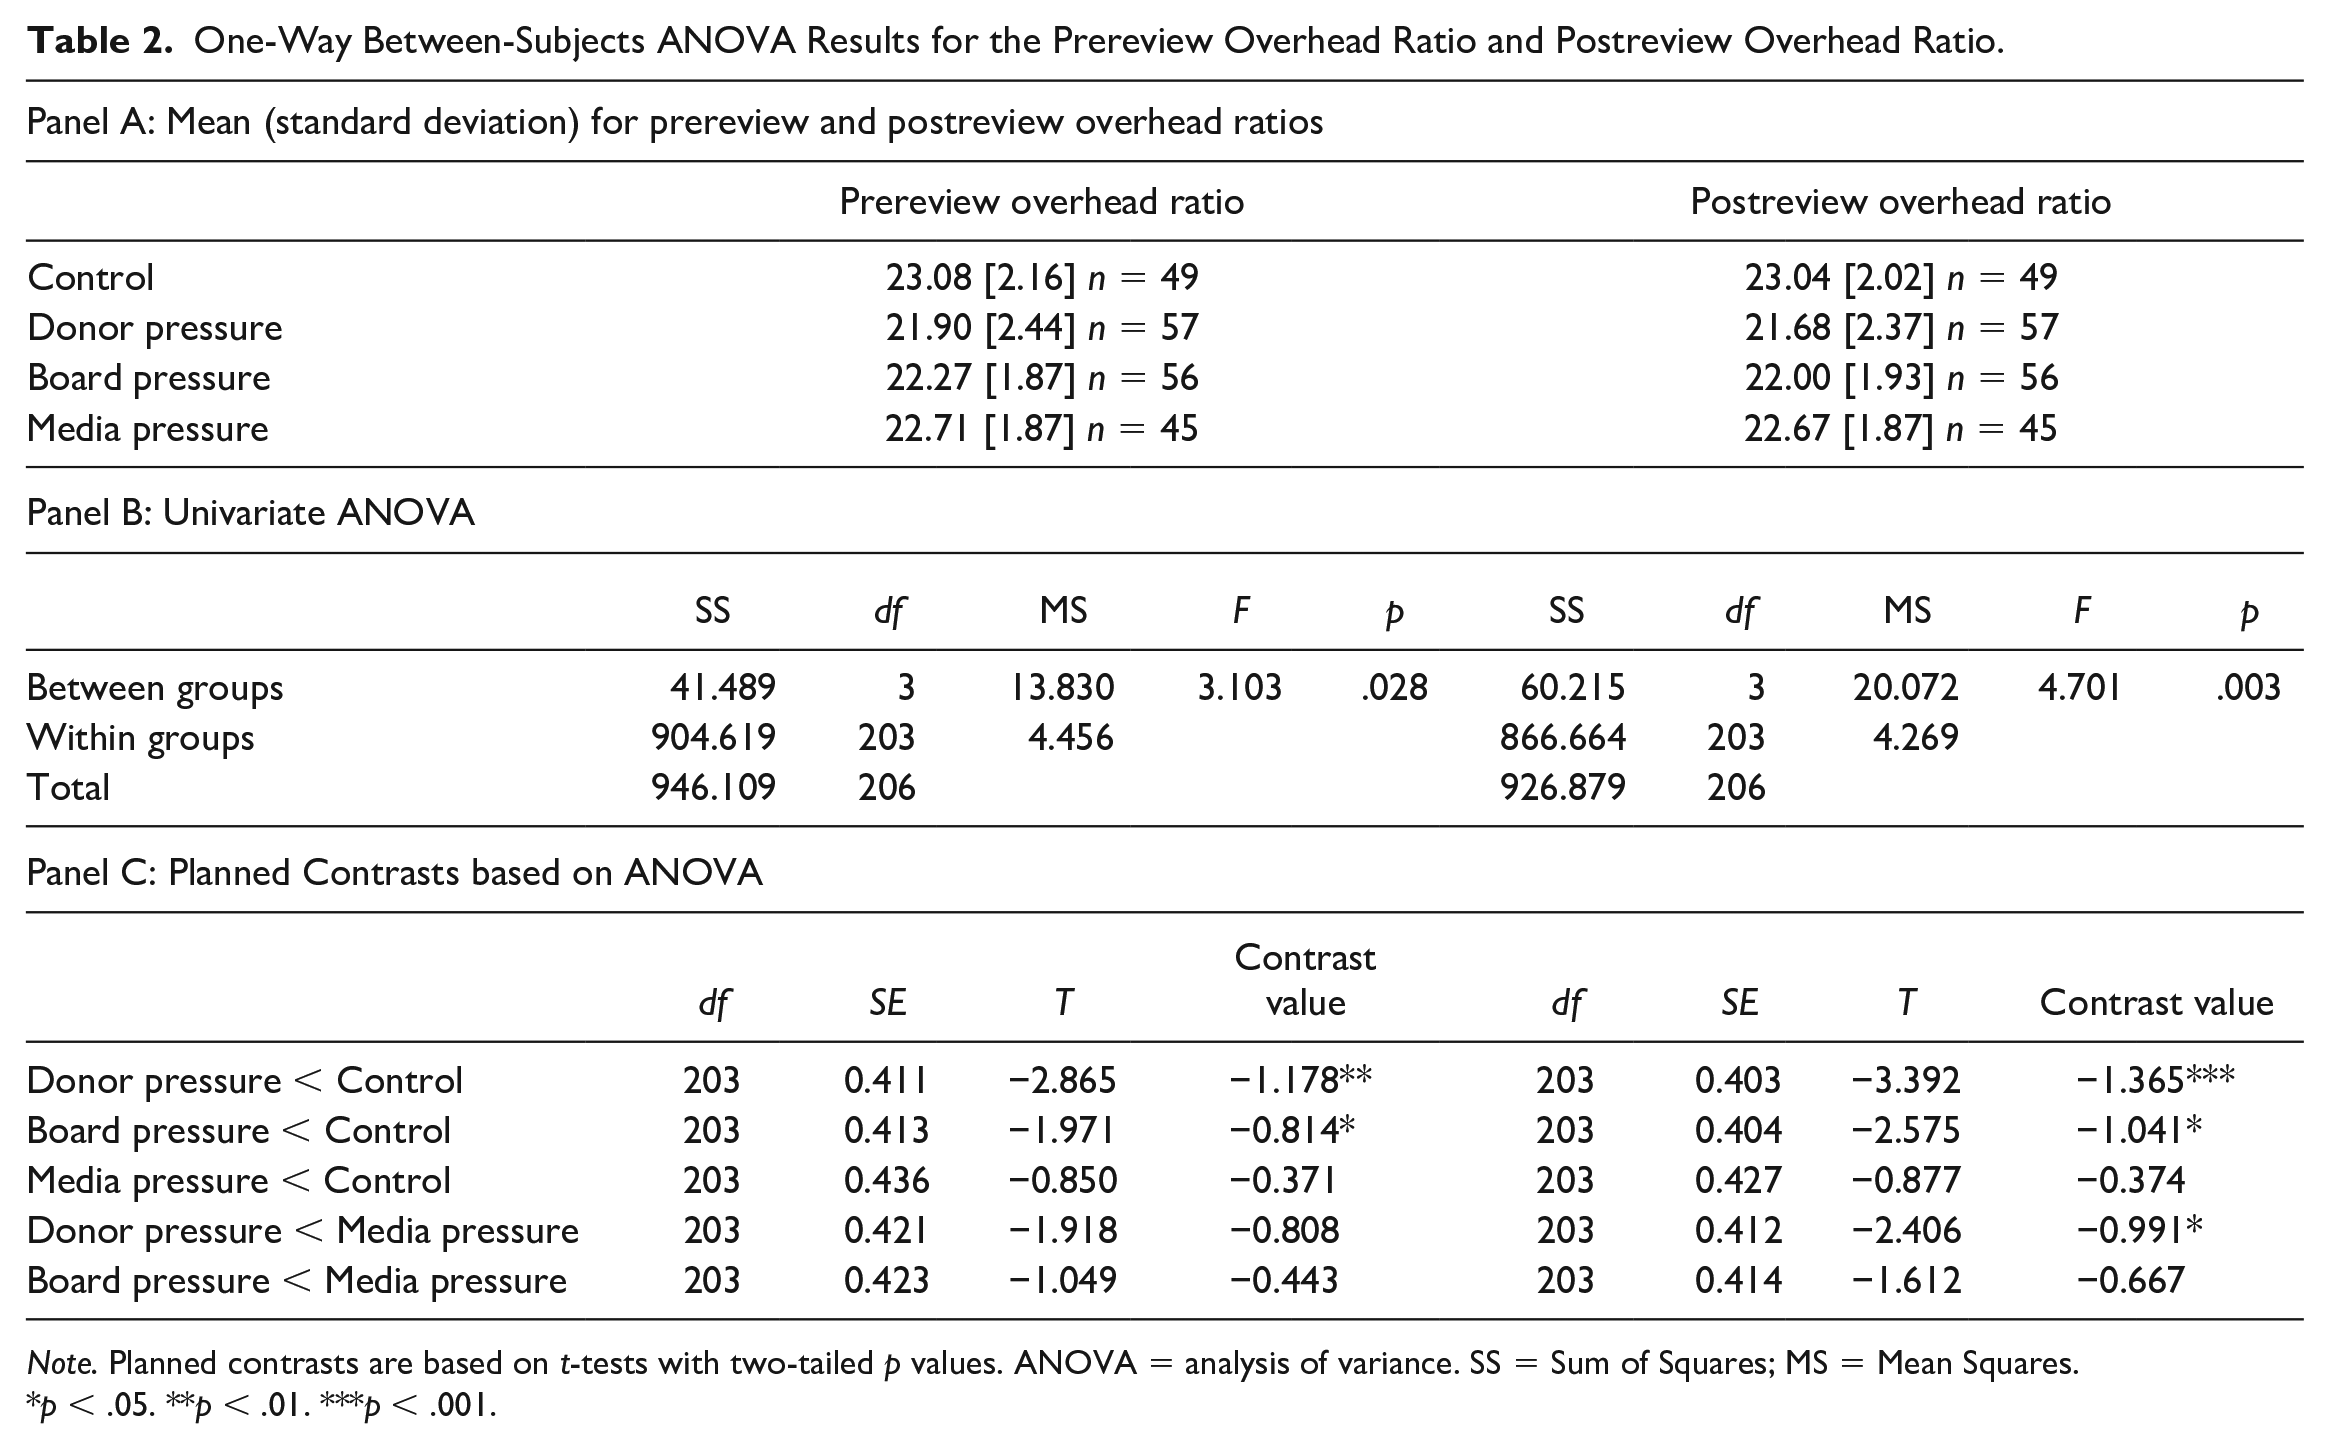
Note. Planned contrasts are based on t-tests with two-tailed p values. ANOVA = analysis of variance. SS = Sum of Squares; MS = Mean Squares.
p < .05. **p < .01. ***p < .001.
Planned contrasts in Table 2, Panel C, show that compared to the control group, donor pressure (H1) and board pressure (H2) both led to significantly lower prereview and postreview overhead ratio. However, there were no statistically significant differences in the overhead ratios between the control group and the group under media pressure (H3). When comparing the donor pressure with the media pressure condition (H4a), results are nonsignificant for the prereview overhead ratio and significant for postreview overhead ratio. Last, a comparison of board pressure and media pressure (H4b) shows nonsignificant differences for both the prereview overhead ratio and the postreview overhead ratio.
Accounting and spending decisions
Note that the reported overhead ratios in our experiment are aggregate measures based on both accounting and spending decisions. We here further evaluate our hypotheses separately for accounting and spending. Recall that higher values for these dependent variables imply that participants allocated more costs toward overhead. Regression results in Table 3 show that donor pressure has a significant effect across all models for both accounting (models 1–3) and spending (models 4–6). However, board pressure only negatively affects accounting, not spending. A similar pattern emerges regarding the media pressure group, for which we find significant effects for accounting (models 2 and 3) and nonsignificant effects for spending. Additional group comparisons revealed that the differences between donor pressure and media pressure are statistically significant for spending (Z = −2.23, p = .026) but not for accounting (Z = −0.96, p = .340), and between board pressure and media pressure, they are not significant for either accounting (Z = −0.67, p = .505) or spending (Z = −1.51, p = .132).
Regression Analysis.
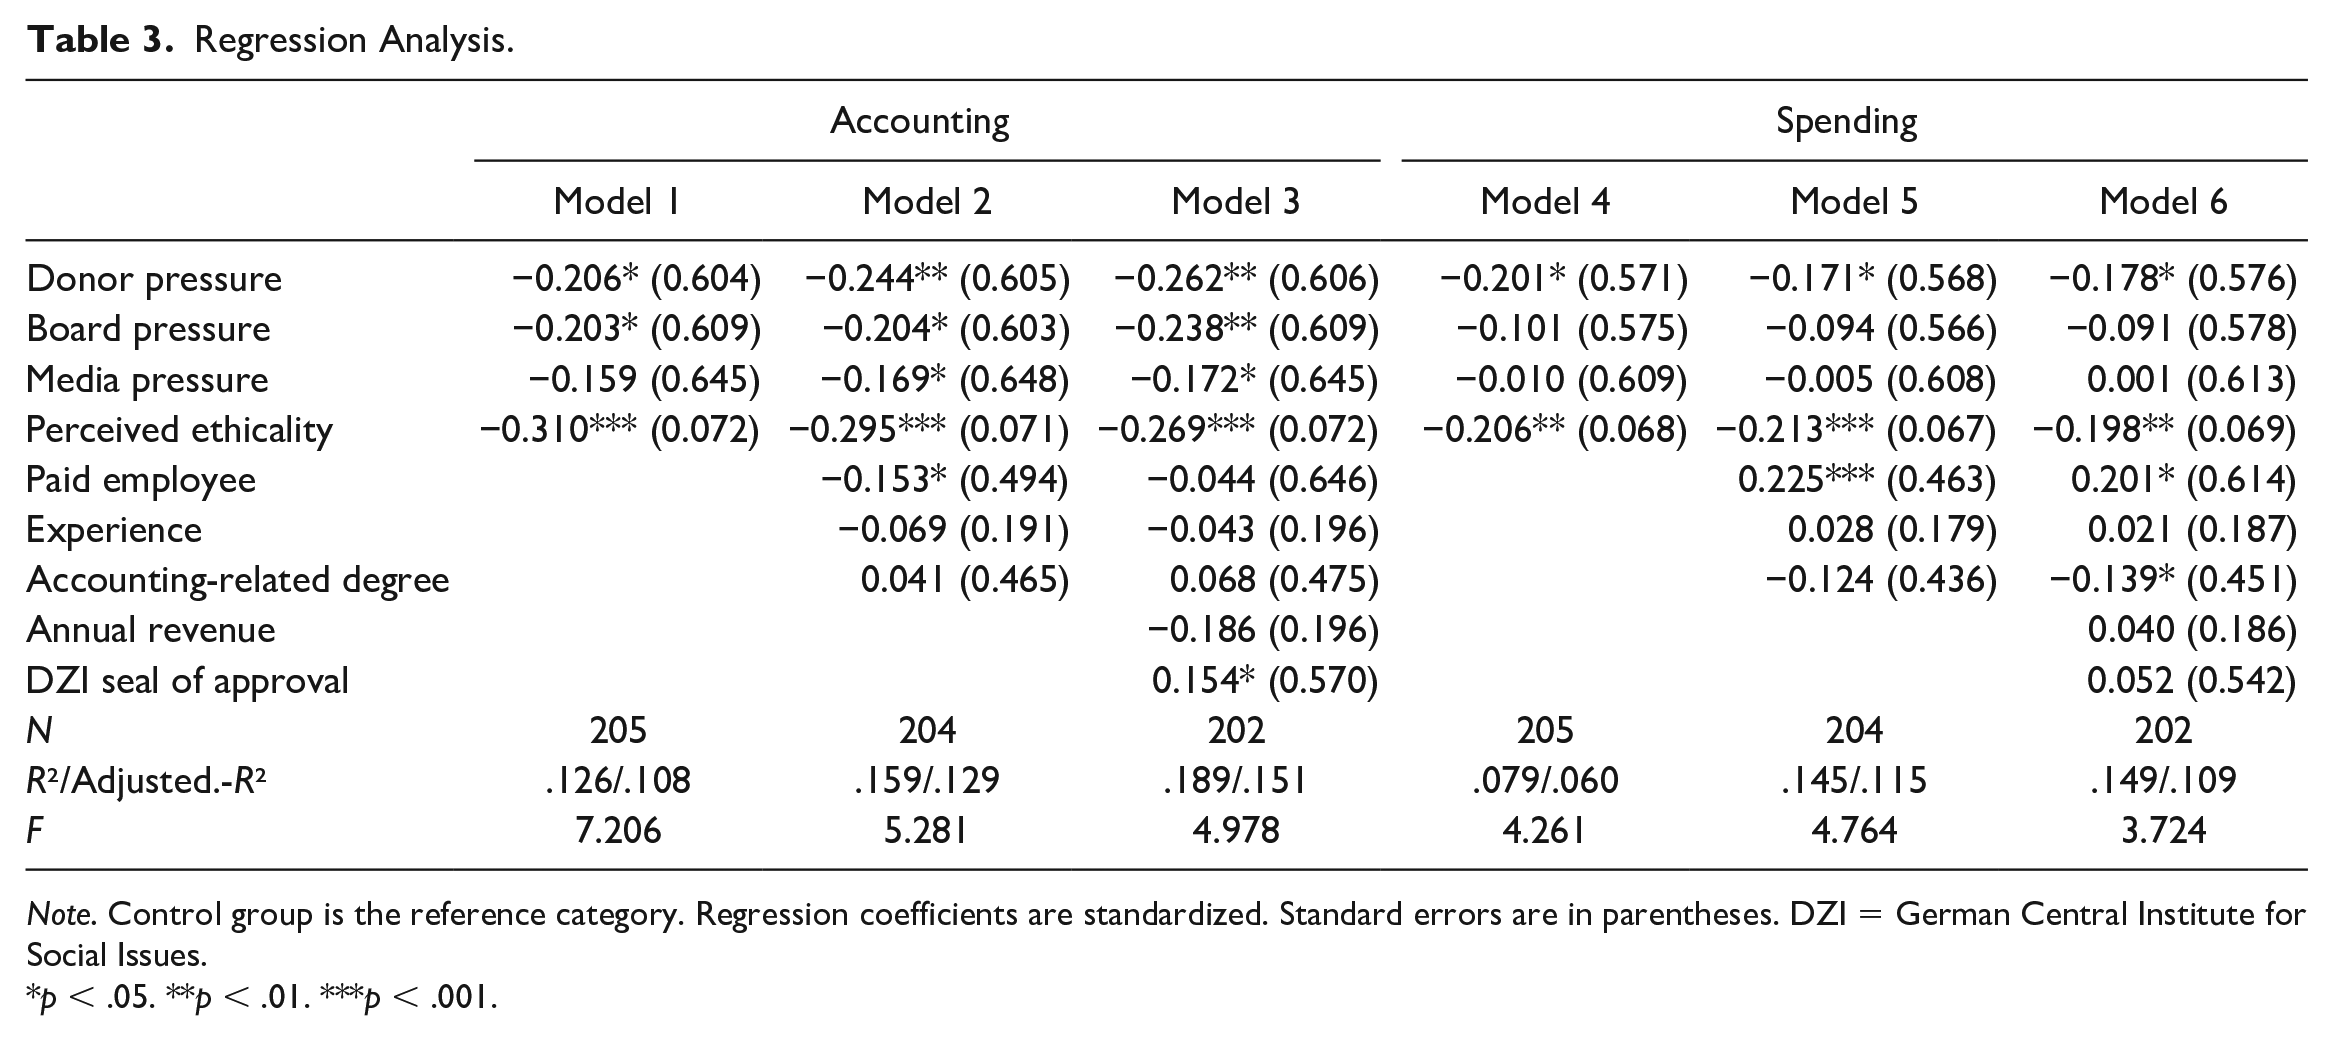
Note. Control group is the reference category. Regression coefficients are standardized. Standard errors are in parentheses. DZI = German Central Institute for Social Issues.
p < .05. **p < .01. ***p < .001.
The regression models in Table 3 also included different measures for managerial sophistication. A noteworthy finding here relates to employment: results show that paid employees spend significantly more on overhead than volunteers (see models 5 and 6). To the contrary, however, model 2 suggests that employees were also more inclined to reduce overhead through accounting decisions, although this effect does not hold up in model 3.
As a final step of our analysis, we investigated whether group differences in accounting and spending were associated with a particular experimental task. Figures 3 and 4 show the mean overhead ratio change by experimental group following responses to a specific task. These graphs yield additional insights into the mechanism available for ratio management. First, they reconfirm that participants primarily used the accounting tasks to keep overhead ratios low, more so than the spending tasks. Second, Figure 3 shows that participants responded very consistently on the two accounting tasks, as indicated by high within-group correlation coefficients. Third, regarding the spending decisions, Figure 4 shows that participants across all groups were more willing to spend on new IT infrastructure than on fundraising.
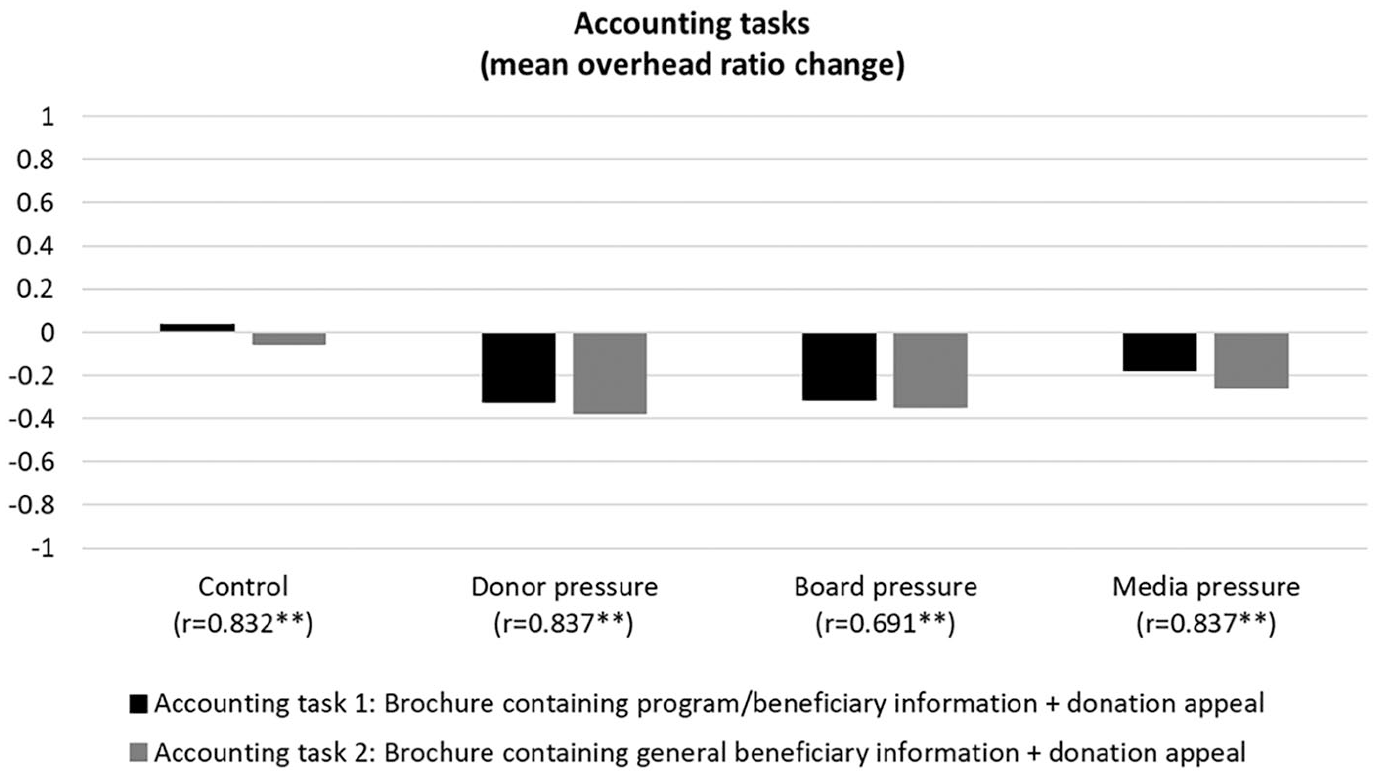
Overhead ratio change by accounting task.
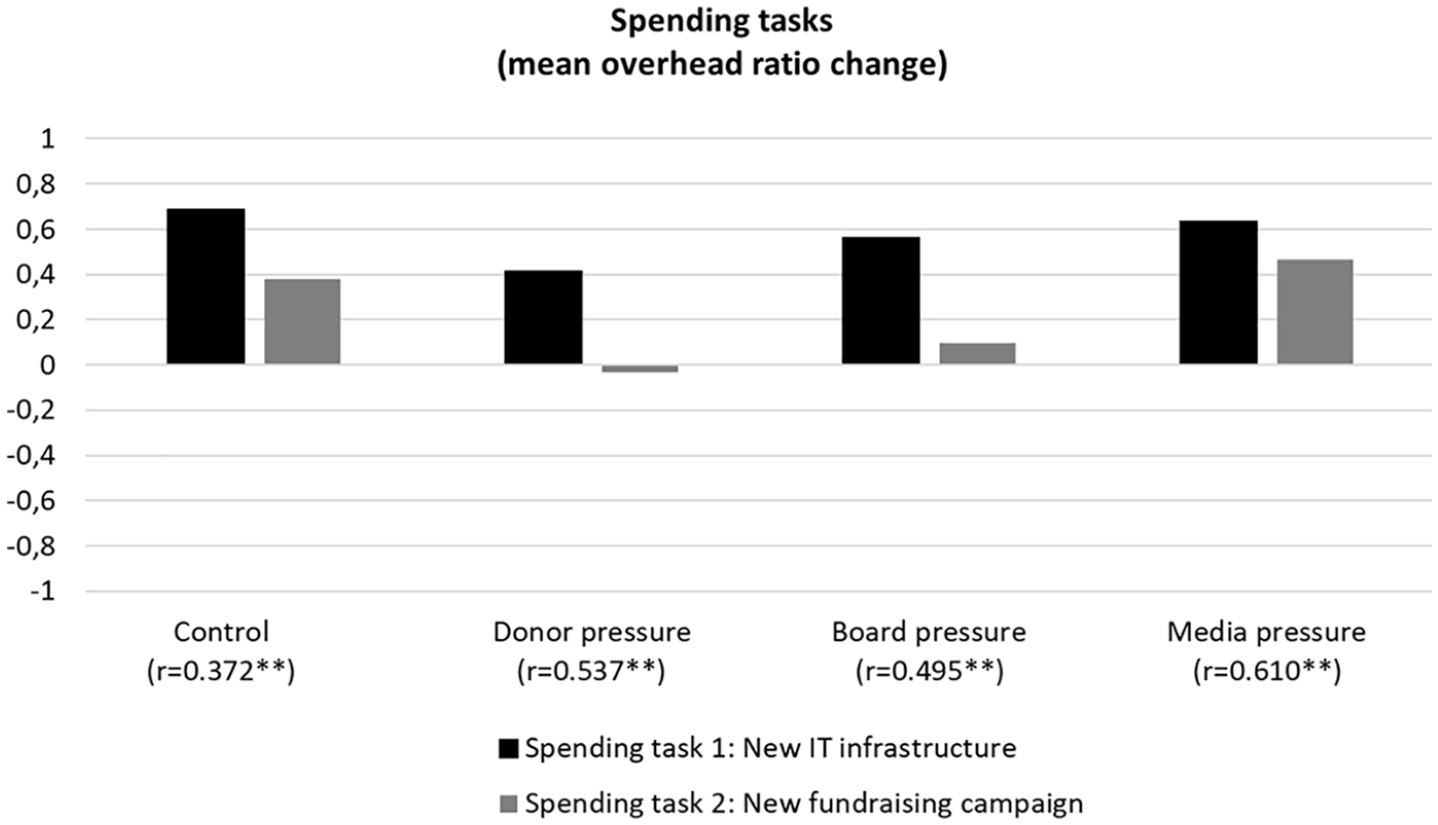
Overhead ratio change by spending task.
Taken together, we find strong support for H1 regarding the effect of donor pressure on ratio management. We also find partial support for board pressure (H2) and media pressure (H3), which both affect accounting decisions and but not spending decisions. We can also confirm that donor pressure had a stronger impact on participants than media pressure (H4a), at least when it comes to spending decisions, although a similar effect cannot be confirmed for board pressure (H4b).
Discussion
The objective of this study was to examine the extent to which different sources of external and internal pressure affect ratio management behavior by nonprofit financial managers. Our results show that exposure to donor expectations led to ratio management through both accounting and spending decisions. Decision makers under board pressure managed ratios through accounting decisions, although they did not refrain from spending on infrastructure to the same extent as participants subjected to donor pressure. We also find some evidence that media pressure affects accounting decisions, although other measures of ratio management do not indicate significant differences vis-à-vis the control group.
Our finding on board pressure in particular warrants further discussion, as this phenomenon has not yet received much attention in the literature. Based on what Krause et al. (2019) termed a “coercive isomorphism ripple effect” whereby board members’ expectations deter investments in organizational infrastructure, we could have expected board pressure to also affect spending decisions. Social influence literature would also have suggested a strong impact of superior directives on decision makers (Bishop et al., 2016; Lord & DeZoort, 2001). Our finding could be interpreted as an indication that direct power relationships might be less pronounced in a sector where organizational hierarchies are flatter and, therefore, obedience or compliance pressure is less pronounced than found in other industries. As opposed to discontent donors, who can easily redirect their funds to another organization, boards may in reality be more limited in their sanctioning ability (as they are usually highly invested in the organization). Finally, it should be noted that our board pressure manipulation included a less-severe consequence than the donor pressure manipulation. While we carefully operationalized our manipulations based on conversations with financial managers, it is in theory possible that some boards express more severe consequences than monitoring a manager’s job performance more closely.
Another important consideration is that we conceptualized donor pressure and board pressure as distinct concepts from one another, given our aim of separately assessing their influence. However, these two constructs can in reality be interrelated. Board members are often in touch with donors and may themselves channel donor expectations to financial managers. Through their frequent involvement in fundraising efforts of the organization (Keating & Frumkin, 2003) boards are oftentimes aware of the need to comply with donors’ expectations and, therefore, board expectations may be viewed as a mediator or moderator of donor pressure.
Although we find statistically significance group differences in reported overhead ratios (see Table 2), we acknowledge that effect sizes are modest, with mean ratios across groups rather close to one another. Based on the postreview overhead ratio, we find an empirical effect size of η2 = 0.06 (ω2 = 0.05), corresponding to what is commonly described as a medium effect (Cohen, 1988). Nevertheless, we believe these effects warrant a number of practical implications. Nonprofit managers should carefully strike an appropriate balance between meeting donor expectations and adequately investing in fundraising infrastructure. In our study, donor pressure had a particularly strong (negative) effect on fundraising investment. This prompts the question whether organizations invest sufficiently in the fostering of long-term relationships and trust-building with donors (Waters, 2011), which is certainly needed to alter skewed expectations toward cost efficiency. Organizations run by volunteers in particular need to reflect upon the existence of an “investment trap” as a key impediment toward their professionalization. This is underlined by our finding that volunteers were less inclined to spend on fundraising than paid staff. Finally, increased awareness among board members is needed about potentially harmful effects resulting from assessing organizational and managerial performance based on cost efficiency measures.
Our study is subject to a number of limitations. First, while a scenario experiment enjoys high internal validity through careful manipulation of independent variables and randomization of study participants, this design choice comes at a cost of external validity. We tried to ensure scenario realism through careful pretesting and discussions with experts. Nevertheless, participants may behave differently in their actual organizational context, being exposed to several pressures at the same time instead of individual pressure sources. A second and related limitation is that the specific country context of the study may affect the findings’ generalizability, leaving ample room for the future study of ratio management in a comparative perspective. Last, with an overhead ratio that exceeds 20%, our experimental case described what may be considered a high-pressure situation. An established benchmark by charity watchdogs, research shows that many organizations manage ratios below 20% (Kitching et al., 2012; Schubert & Boenigk, 2019). Investigating ratio management in a setting with a lower overhead ratio might give insights into whether ratio management only occurs around established benchmarks in the sector or whether it is an issue regardless of current financial performance.
Finally, our study provides several avenues for future research. First, we believe that more studies in nonprofit finance and accounting should embrace behavioral approaches to assess the drivers of financial decisions to complement prior research based on archival financial data. Since professional norms and career trajectories are less established than in for-profit accounting, a deeper analysis of how individual managers’ characteristics affect financial decisions can be particularly insightful. Second, future experimental studies could investigate how decision makers behave in a setting where stakeholder demands are conflicting. Our sole focus has been on cost efficiency expectations, which may be seen as a simplification of the true complexity of stakeholders’ demands. For instance, board members may wish not only for cost efficiency but also for accurate decision-making (Krishnan & Yetman, 2011; Yetman & Yetman, 2012), leading to difficult decision trade-offs when making reporting decisions. Finally, future studies could pay closer attention to specific areas within organizational infrastructure that suffer from investment gaps.
This study has taken a first step toward a broader stakeholder perspective in the ratio management discourse, highlighting that not only external but also internal expectations can affect accounting decisions. Our framework in Figure 1 invites future research to build on our study to generate a deeper understanding of how financial managers behave in a context of multiple stakeholder demands and how to alleviate potentially harmful outcomes of stakeholder pressure. Such research would promise the development of new practical implications that can help nonprofit practice eventually “Ending the Nonprofit Starvation Cycle” (Eckhart-Queenan et al., 2019).
Supplemental Material
sj-pdf-1-nvs-10.1177_08997640211003218 – Supplemental material for Pressure, Cost Accounting, and Resource Allocations: Experimental Evidence on Nonprofit Financial Decision-Making
Supplemental material, sj-pdf-1-nvs-10.1177_08997640211003218 for Pressure, Cost Accounting, and Resource Allocations: Experimental Evidence on Nonprofit Financial Decision-Making by Peter Schubert and Silke Boenigk in Nonprofit and Voluntary Sector Quarterly
Footnotes
Appendix
Organizational Characteristics of Study Participants (N = 223).
| Organizational variables | Number of responses | Frequency |
|---|---|---|
| Annual revenue | ||
| <100,000€ | 49 | 22.0% (19.7%) |
| 100,000€–500,000€ | 41 | 18.4% (21.9%) |
| 500,000€–1m€ | 35 | 15.7% (11.9%) |
| 1m€–5m€ | 43 | 19.3% (25.5%) |
| 5m€–20m€ | 32 | 14.3% (12.6%) |
| >20m€ | 22 | 9.9% (8.5%) |
| Missing | 1 | 0.4% |
| Nonprofit subsector | ||
| Culture and recreation | 5 | 2.2% |
| Education and research | 42 | 18.8% |
| Health | 29 | 13.0% |
| Social services | 49 | 22.0% |
| Environment | 20 | 9.0% |
| Development and housing | 2 | 0.9% |
| Law, advocacy, and politics | 3 | 1.3% |
| Philanthropic intermediaries and voluntarism promotion | 10 | 4.5% |
| International activities | 33 | 14.8% |
| Religion | 2 | 0.9% |
| Other | 28 | 12.6% |
| Paid staff | ||
| 0 | 43 | 19.3% |
| 1–9 | 73 | 32.7% |
| 10–19 | 32 | 14.3% |
| 20–49 | 22 | 9.9% |
| 50–99 | 13 | 5.8% |
| >100 | 38 | 17.0% |
| Missing | 2 | 0.9% |
| DZI seal of approval | ||
| Yes | 46 | 20.6% |
| No | 174 | 78.0% |
| Missing | 3 | 1.3% |
| Current overhead ratio | ||
| 0%–4.9% | 35 | 15.7% |
| 5%–9.9% | 49 | 22.0% |
| 10%–14.9% | 43 | 19.3% |
| 15%–19.9% | 26 | 11.7% |
| 20%–24.9% | 33 | 14.8% |
| 25%–29.9% | 17 | 7.6% |
| >30% | 15 | 6.7 % |
| Missing | 5 | 2.2% |
Note. To assess response bias, we collected revenue data from the most recent fiscal year available on the website for all contacted organizations and then compared it with self-reported annual revenue by participants in the postexperiment questionnaire. Relative frequencies of all organizations contacted are here reported in brackets. The data show no systematic bias toward smaller or larger organizations.
Acknowledgements
The authors would like to thank the participants of the 2019 Doctoral Fellows Program of the Penn Center for Social Impact Strategy under direction of Dr. Peter Frumkin. They are also thankful for feedback received by participants of the 2019 ARNOVA conference. Finally, they are grateful for the valuable suggestions for improvement to the manuscript received by three anonymous reviewers.
Declaration of Conflicting Interests
The author(s) declared no potential conflicts of interest with respect to the research, authorship, and/or publication of this article.
Funding
The author(s) received no financial support for the research, authorship, and/or publication of this article.
Supplemental Material
Supplemental material for this article is available online.
Author Biographies
References
Supplementary Material
Please find the following supplemental material available below.
For Open Access articles published under a Creative Commons License, all supplemental material carries the same license as the article it is associated with.
For non-Open Access articles published, all supplemental material carries a non-exclusive license, and permission requests for re-use of supplemental material or any part of supplemental material shall be sent directly to the copyright owner as specified in the copyright notice associated with the article.