
Abstract
Background:
For patients on peritoneal dialysis (PD), the deleterious effects of high concentrations of dialysate glucose on the peritoneal membrane are well-documented. Systemic effects of peritoneally absorbed glucose are more poorly defined. Using continuous glucose monitoring (CGM), we aimed to describe 24-h glycaemic profiles of PD patients without diabetes and compare with non-dialysis controls with stage 5 chronic kidney disease (CKD-5).
Methods:
In this cross-sectional, case-control study, 15 patients on PD (9 automated PD (APD) and 6 continuous ambulatory PD (CAPD)) and 16 CKD-5 controls underwent 72 h of CGM and metabolic profiling. CGM was used to derive average glucose concentrations and within-participant standard deviation (SD) of glucose. Data were analysed for the whole 72-h monitoring period and as daytime (09.00 to 21.00) and night-time (21.00 to 09.00).
Results:
Average glucose concentrations and within-participant SD of glucose for the whole monitoring period were not different between the three groups (p ≥ 0.5). Daytime average glucose concentrations were also similar across the three groups (p = 0.729). APD was associated with a significantly higher nocturnal glucose than CAPD (5.25 mmol/L ± 0.65 vs. 4.28 ± 0.5, p = 0.026). A significant drop in nocturnal glucose compared with daytime average seen in both CAPD patients and controls was absent in APD patients.
Conclusions:
Systematically different glycaemic patterns were observed in non-diabetic APD and CAPD patients, including an absence of physiological nocturnal glucose dipping in patients on APD. Comprehensive CGM data sets highlight subtleties not appreciated by traditional metabolic biomarkers; this has implications when choosing the most appropriate outcome measures in future research addressing the metabolic impact of PD.
Introduction
High levels of cardiovascular morbidity and mortality in patients on peritoneal dialysis (PD) are mostly attributable to the high prevalence of traditional cardiovascular risk factors and consequences of chronic uraemia. 1,2 However, there is concern that traditional dialysate solutions utilising supraphysiological concentrations of glucose as their osmotic agent may contribute to this increased cardiovascular risk. It is estimated that 60–80% of the daily dialysate glucose load is absorbed, 3 varying between patients dependant on their membrane characteristics and dwell time. The systemic consequences of this glucose absorption are not well understood.
Large epidemiological studies comparing risk of new onset diabetes in PD patients with their haemodialysis (HD) counterparts have produced conflicting results including increased risk for PD patients, 4 increased risk for HD patients 5 and no difference between the two modalities. 6 Within the multi-ethnic GLOBAL fluid cohort, 7 random plasma glucose concentrations correlated positively with dialysate glucose exposure in prevalent non-diabetic patients. This contrasts with other studies reporting no correlation between dialysate glucose absorption and development of new onset diabetes 8 or insulin resistance. 9 Some conflicts in the literature may be partially explained by differences in choice of outcome measures and their applicability in this population, exemplified by concerns regarding the validity of glycated haemoglobin (HbA1c) in dialysis cohorts. 10 –12 Interpretation of single plasma glucose concentrations is also problematic. Although PD is a continuous therapy, patients are exposed to variable concentrations of glucose during their prescription and are never truly ‘fasted’ unless PD is withheld. The best choice of biomarker for measuring the additional metabolic burden in these patients remains uncertain.
Continuous glucose monitoring (CGM) has proven useful in a number of settings. 13 Glucose concentrations are measured in interstitial fluid via a subcutaneous sensor with measurement intervals between 5 min and 20 min. Data collected allow calculation of average interstitial glucose concentrations and glycaemic variability over 24 h. CGM has been used in diabetic PD patients to demonstrate typical patterns of glycaemia 14,15 and improvements in average glucose and glycaemic variability associated with glucose sparing regimes. 16 There are no comparable data sets in PD patients without diabetes.
We conducted a case-control study using CGM to describe the 24-h glycaemic profiles of non-diabetic PD patients and non-dialysis stage 5 chronic kidney disease (CKD-5) controls. Participants underwent metabolic profiling to assess whether differences in glycaemic profiles were reflected in differences in traditional biomarkers of glucose metabolism and insulin resistance.
Materials and methods
Subjects
We conducted a case-control, observational study in an outpatient setting. We recruited participants from outpatient clinics at the Royal Devon and Exeter Hospital NHS Foundation Trust between August 2017 and November 2019. Inclusion criteria for PD patients were age 18 years or older, able to give informed consent, able and willing to wear a CGM, free of PD-related complications for at least 2 months (PD-related infections, catheter replacement). Exclusion criteria were an established diagnosis of diabetes mellitus, infection requiring antibiotic treatment in the preceding 30 days, medication known to influence glucose metabolism, acute or chronic pancreatitis. Participants were eligible for the control group if their estimated glomerular filtration rate (Chronic Kidney Disease Epideimiology Collaboration equation) was ≤15 mL/min and were not yet on any form of kidney replacement therapy. Other inclusion and exclusion criteria were as per the PD group.
Metabolic profiling
For the single study visit, participants were asked to attend fasted overnight for at least 8 h. PD patients were asked to attend without dialysate in situ (“dry”); their overnight dialysis treatment the night before was conducted as per their normal prescription. We recorded participant demographic details, past medical history, current medications and in the case of the PD patients results of the most recent peritoneal equilibration test and current dialysis prescription. Daily dialysate glucose exposure was calculated as total grammes of unhydrated glucose within the 24-h dialysis prescription (e.g. 2 L of 1.36% glucose-based dialysate = 2 × 13.6 grammes = 27.2 grammes) as previously described. 7
All participants underwent a standard 75 g oral glucose tolerance test (OGTT), PD patients remained “dry” during the OGTT. Participants were asked to drink 75 g of anhydrous glucose (113 mL of polycal liquid, Nutricia) diluted in water to a volume of 250 mL, within a 5-min period. Blood samples were taken at 15-min intervals for 1 h and 30 min intervals for the following hour. Glucose concentrations were analysed at the bedside using a Yellow Springs Instrument, YSI 2300 STAT Plus (YSI UK Ltd, Hampshire) calibrated immediately prior to the patient visit. Additional samples from each time point were frozen at −80°C for future analysis.
Fasting bloods were used to measure HbA1c and insulin concentrations (Elecsys Insulin assay, Cobas). Fasting insulin levels were used to calculate the homeostatic model assessment of insulin resistance. 17
Continuous glucose monitoring
All participants wore a continuous glucose monitor (FreeStyle Libre, Abbott Diabetes Care, Whitney, UK) for 72 h. FreeStyle Libre is a factory calibrated, single-use, subcutaneous sensor using wired enzyme technology (osmium mediator and glucose oxidase enzyme) to monitor interstitial glucose concentrations at 15-min intervals. 18 Data are transferred by radio frequency identification from the sensor to a handheld reader. FreeStyle Libre has previously been validated in haemodialysis patients. 19 There is strong evidence that the icodextrin metabolite maltose interferes with glucose dehydrogenase pyrroloquinoline-quinone-based glucose meters, resulting in falsely elevated glucose readings. 20,21 For patients on PD, using a variety of solutions including Icodextrin, the accuracy of CGMs using other enzymatic reactions (such as the glucose oxidase reaction used in FreeStyle Libre) remains uncertain.
Application of the FreeStyle Libre was conducted in accordance with manufacturer’s guidelines. Participants were fully briefed on use and care of the sensor. This included a requirement for the sensor to be scanned using the handheld reader at least 8 h for complete data collection. Output from the glucose monitor was not ‘masked’ from participants, who could see real-time readings when the reader was scanned and access historical readings during the monitoring period. During the 72-h monitoring period, participants kept a food diary. No additional restrictions were placed on their oral intake or level of activity. Participants on PD continued their usual PD prescription, which remained constant during the monitoring period.
CGM derived outcomes
After 72 h, the sensor was removed and data uploaded using FreeStyle Libre Glucose Data Management Software Version 1.0. This software was used to produce a graphical representation of the traces for each participant.
Raw data were analysed using EasyGV 2011© (Nathan Hill, University of Oxford, UK), a macro-enabled Excel workbook which calculates 10 different measures of glycaemic variability from raw CGM data. 22
All outcome measures were decided a priori. The CGM data were used to derive average interstitial glucose concentrations and within participant standard deviation (SD) of interstitial glucose, a measure of glycaemic variability. Data were analysed for the whole 72-h monitoring period and as daytime (09.00 to 21.00) and night-time (21.00 to 09.00). Automated PD (APD) and continuous ambulatory PD (CAPD) have been associated with different patterns of glycaemia in PD patients with diabetes; 15 therefore, the PD group were analysed as a whole and by PD modality.
The Freestyle Libre is susceptible to missing data if participants do not ‘scan’ the sensor every 8 h. The Advanced Technologies and Treatments for Diabetes consensus guidelines 23 recommend at least 70% data are captured for the monitoring period for a CGM recording to be considered valid; all data sets collected as part of this study met these criteria and were included in the final analysis. The Freestyle Libre is factory calibrated and does not require additional capillary glucose calibration; therefore, all recorded data points were considered valid.
Ethics
The study was approved by South Central-Hampshire A Research Ethics Committee (REC ref 17/SC/0266) and conducted as per the Declaration of Helsinki. All participants gave written informed consent.
Statistics
Statistical analysis was performed using StataSE-16 (Stata Corporation, Texas, USA). All variables were tested for normality by Shapiro–Wilks test. For normally distributed data, between group differences were assessed using analysis of variance and correlations assessed using Pearson’s correlation coefficient. For non-normally distributed data, between group differences were assessed using the Kruskal–Wallis test and correlations were assessed using Spearman’s rank correlation coefficient. A result was considered statistically significant if p ≤ 0.05. Data are presented as mean ± SD or median [Inter-quartile range].
Results
Participant characteristics
Fifteen PD patients consented to the study (recruitment flow diagram in Supplementary Figure 1). Primary kidney diagnoses for PD patients included hypertensive nephropathy 46.7%, glomerular nephritis 26.7%, polycystic kidney disease 13.3%, small kidneys/unknown cause 6.7% and small vessel vasculitis 6.7%. Thirty-five control patients were identified as meeting the eligibility criteria and invited to participate. Nineteen patients declined to take part or did not follow-up with the research team. Sixteen control patients consented to the study. Primary kidney diagnoses in controls were hypertensive nephropathy 31.25%, polycystic kidney disease 18.75%, glomerular nephritis 18.75%, obstructive/reflux nephropathy 18.75% and other 12.5%. Demographic data are detailed in Table 1. Controls and PD patients were well matched for gender, ethnicity and body mass index (BMI). Both PD groups had a mean total Kt/V > 1.7 and similar duration of PD treatment. Total Kt/V trended towards being higher in the CAPD group as a consequence of their greater kidney Kt/V. No participants experienced any PD-related infections during the study. There were three previous episodes of peritonitis in the CAPD group and two previous peritonitis episodes in the APD group. All PD patients continued their usual PD prescription (details of individual prescriptions are outlined in Supplemental Table 1). All APD patients were receiving glucose containing fluid at night and either Icodextrin or dry during the day. All CAPD patients were receiving glucose containing fluid during the day and either Icodextrin or dry during the night.
Characteristics of study participants in control and PD groups and by PD modality.a
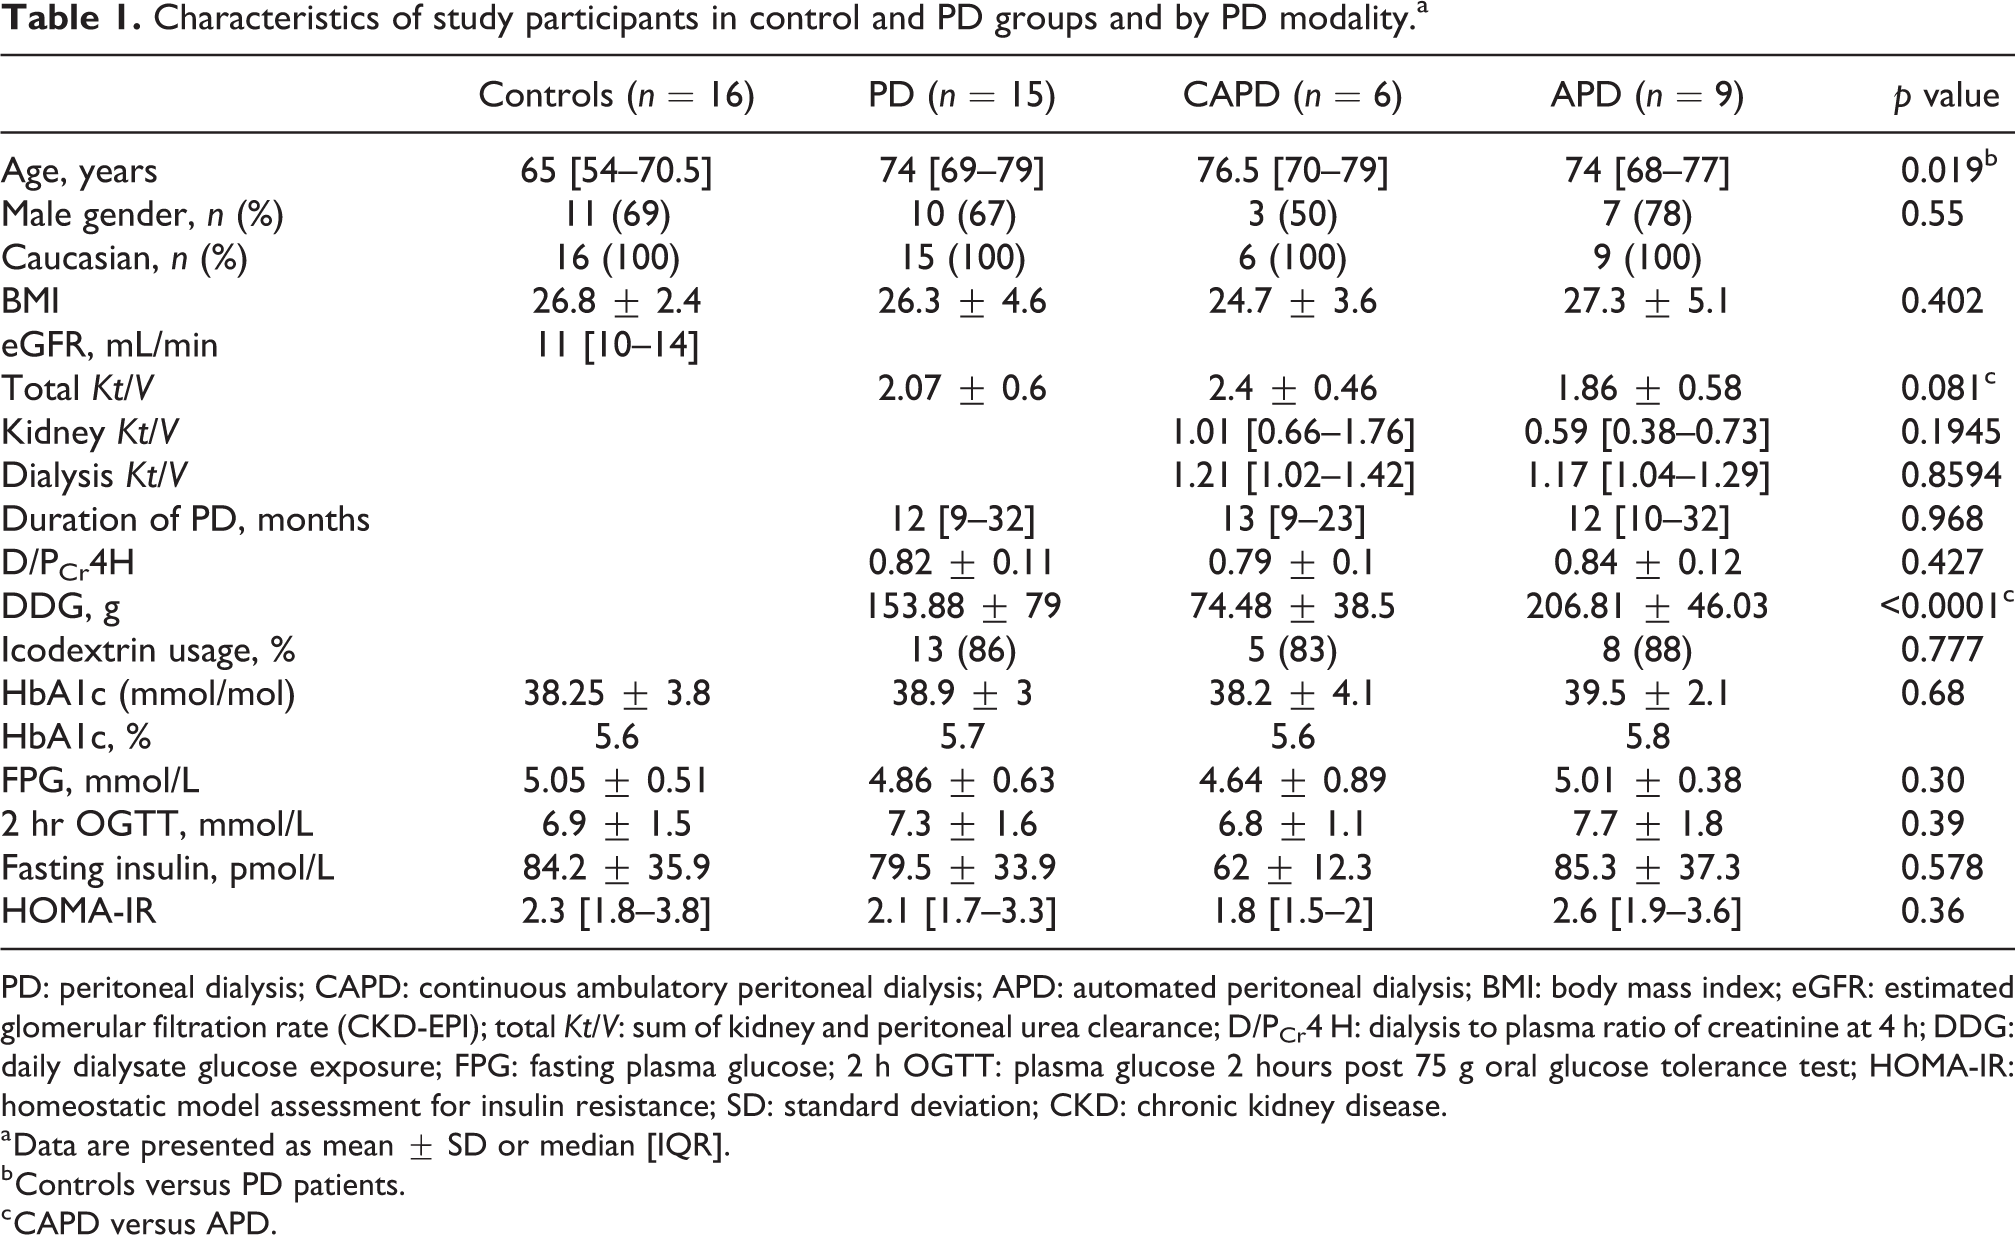
PD: peritoneal dialysis; CAPD: continuous ambulatory peritoneal dialysis; APD: automated peritoneal dialysis; BMI: body mass index; eGFR: estimated glomerular filtration rate (CKD-EPI); total Kt/V: sum of kidney and peritoneal urea clearance; D/PCr4 H: dialysis to plasma ratio of creatinine at 4 h; DDG: daily dialysate glucose exposure; FPG: fasting plasma glucose; 2 h OGTT: plasma glucose 2 hours post 75 g oral glucose tolerance test; HOMA-IR: homeostatic model assessment for insulin resistance; SD: standard deviation; CKD: chronic kidney disease.
a Data are presented as mean ± SD or median [IQR].
b Controls versus PD patients.
c CAPD versus APD.
CGM outcomes
All participants completed the 72-h CGM monitoring period. Sixteen participants had no missing data points. The total number of missing data points were 144/8928 representing 1.6% of the total data. These missing data points were proportionately distributed between the three groups. No participants reported any difficulties in using the CGM.
There was no significant difference in average interstitial glucose concentrations (mmol/L) between PD patients and controls; over the whole monitoring period (PD 5.1 ± 0.63 vs. controls 5.08 ± 0.69, p = 0.935), for the daytime periods (PD 5.31 ± 0.72 vs. controls 5.44 ± 0.75, p = 0.618) or the night-time periods (PD 4.86 ± 0.76 vs. controls 4.69 ± 0.7, p = 0.512) (Figure 1).
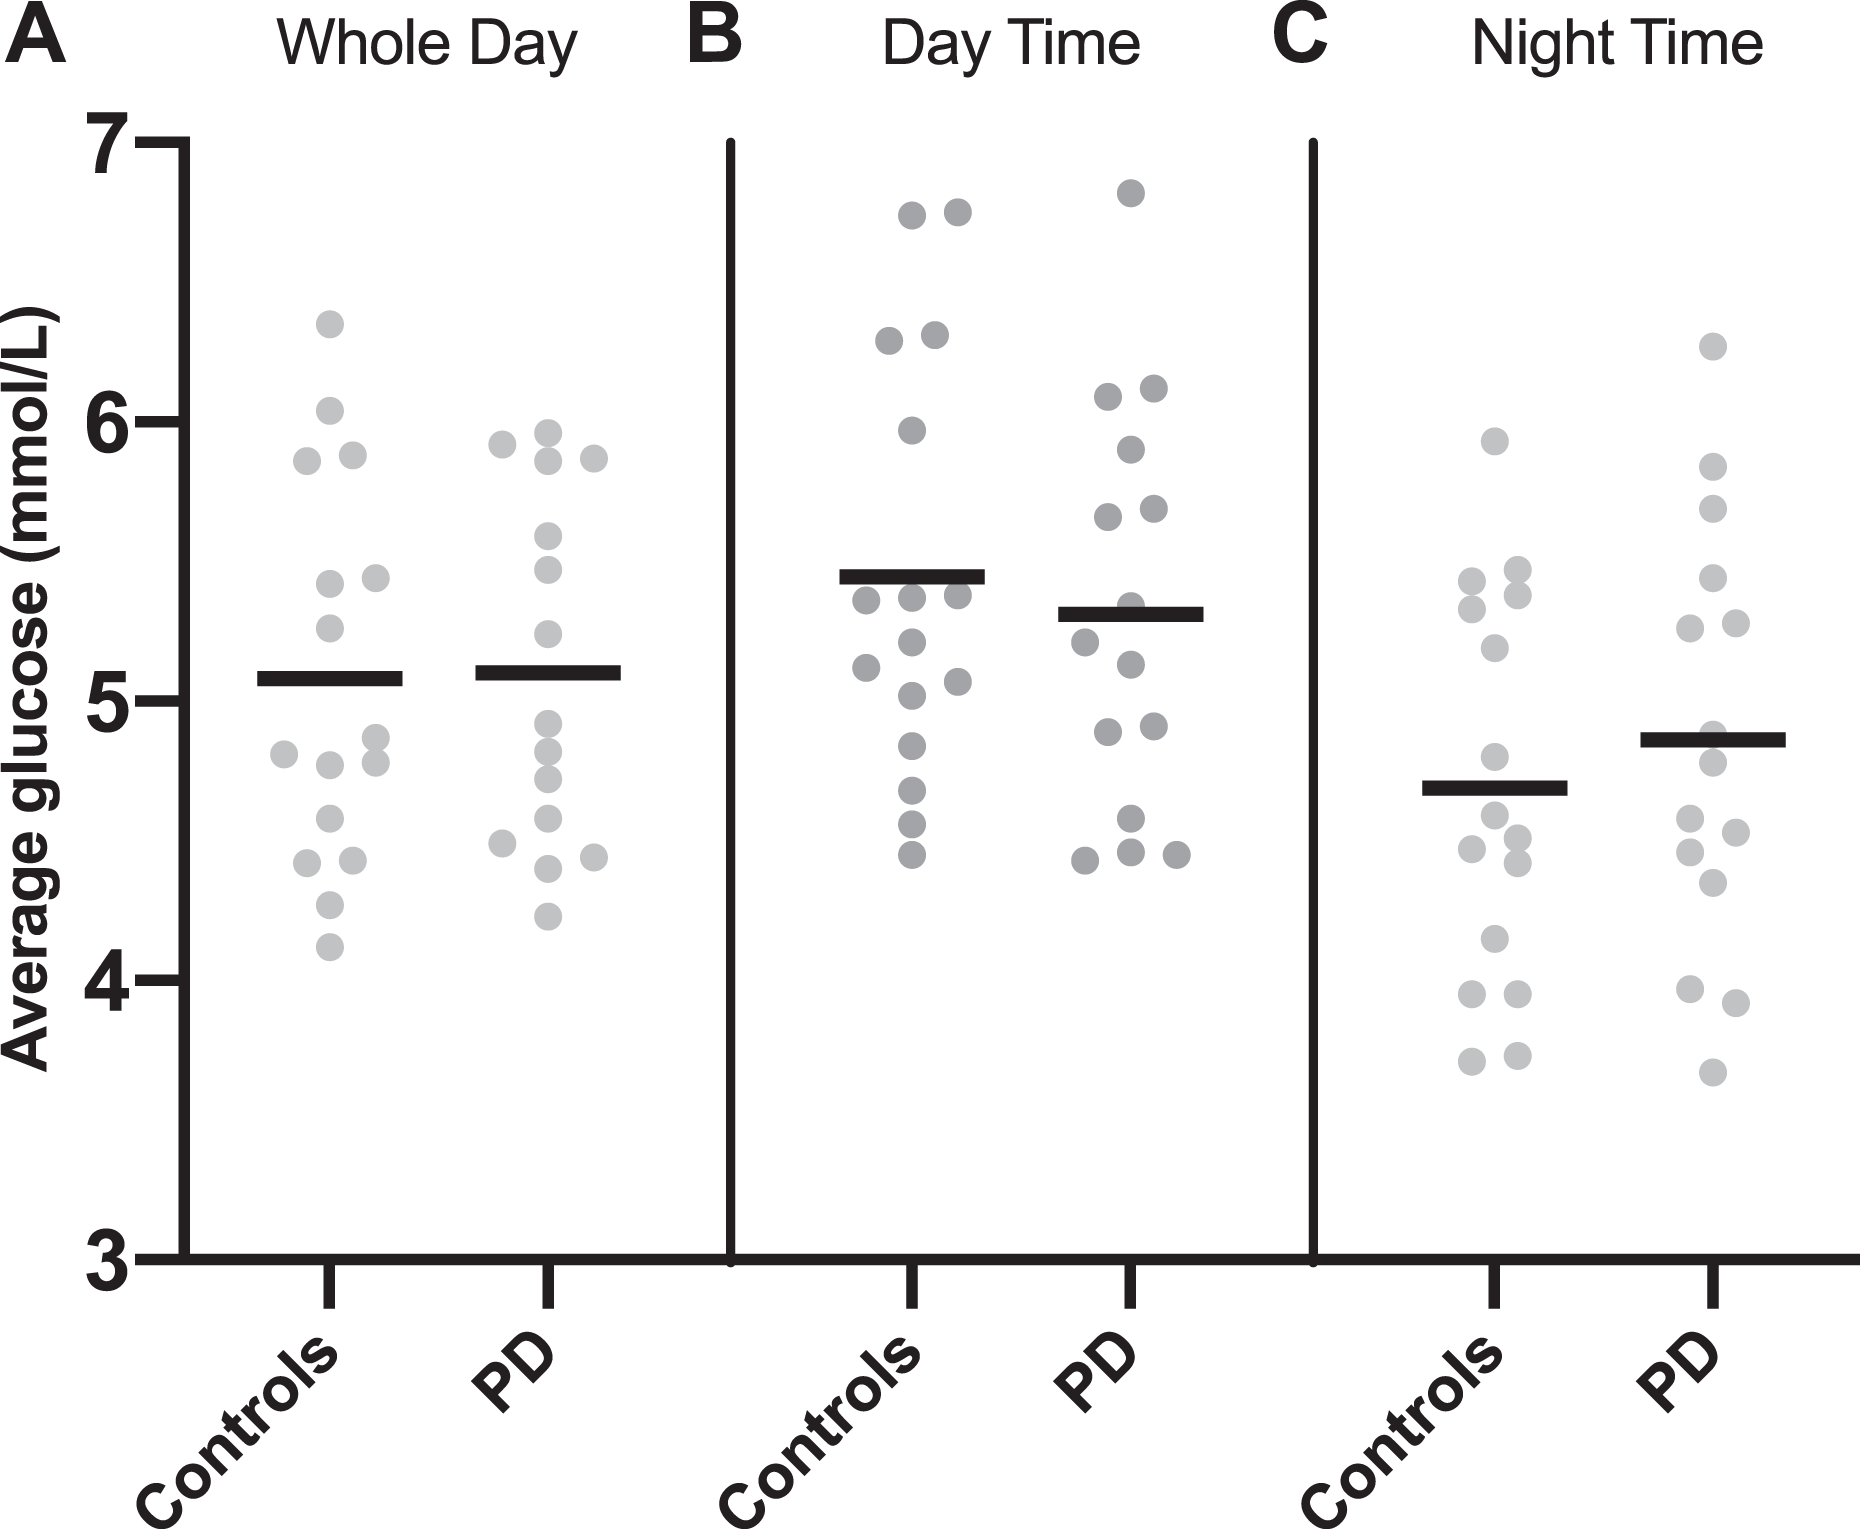
1. Average interstitial glucose levels (mmol/L) in controls versus PD patients. Data are presented for (A) whole study period, (B) daytime recordings and (C) night-time recordings. Line drawn at mean value. p ≥ 0.05 for all three periods. PD: peritoneal dialysis.
There was no significant difference in the within-person SD of interstitial glucose (mmol/L) between PD patients and controls: over the whole monitoring period (PD 1.19 ± 0.24 vs. controls 1.26 ± 0.25, p = 0.47), for the daytime periods (PD 1.19 ± 0.26 vs. controls 1.32 ± 0.37, p = 0.286) or the night-time periods (PD 1.03 ± 0.25 vs. controls 0.99 ± 0.27, p = 0.754).
CGM outcomes by modality
Different patterns of glycaemia were evident in APD patients compared with CAPD patients and controls (Figure 2).
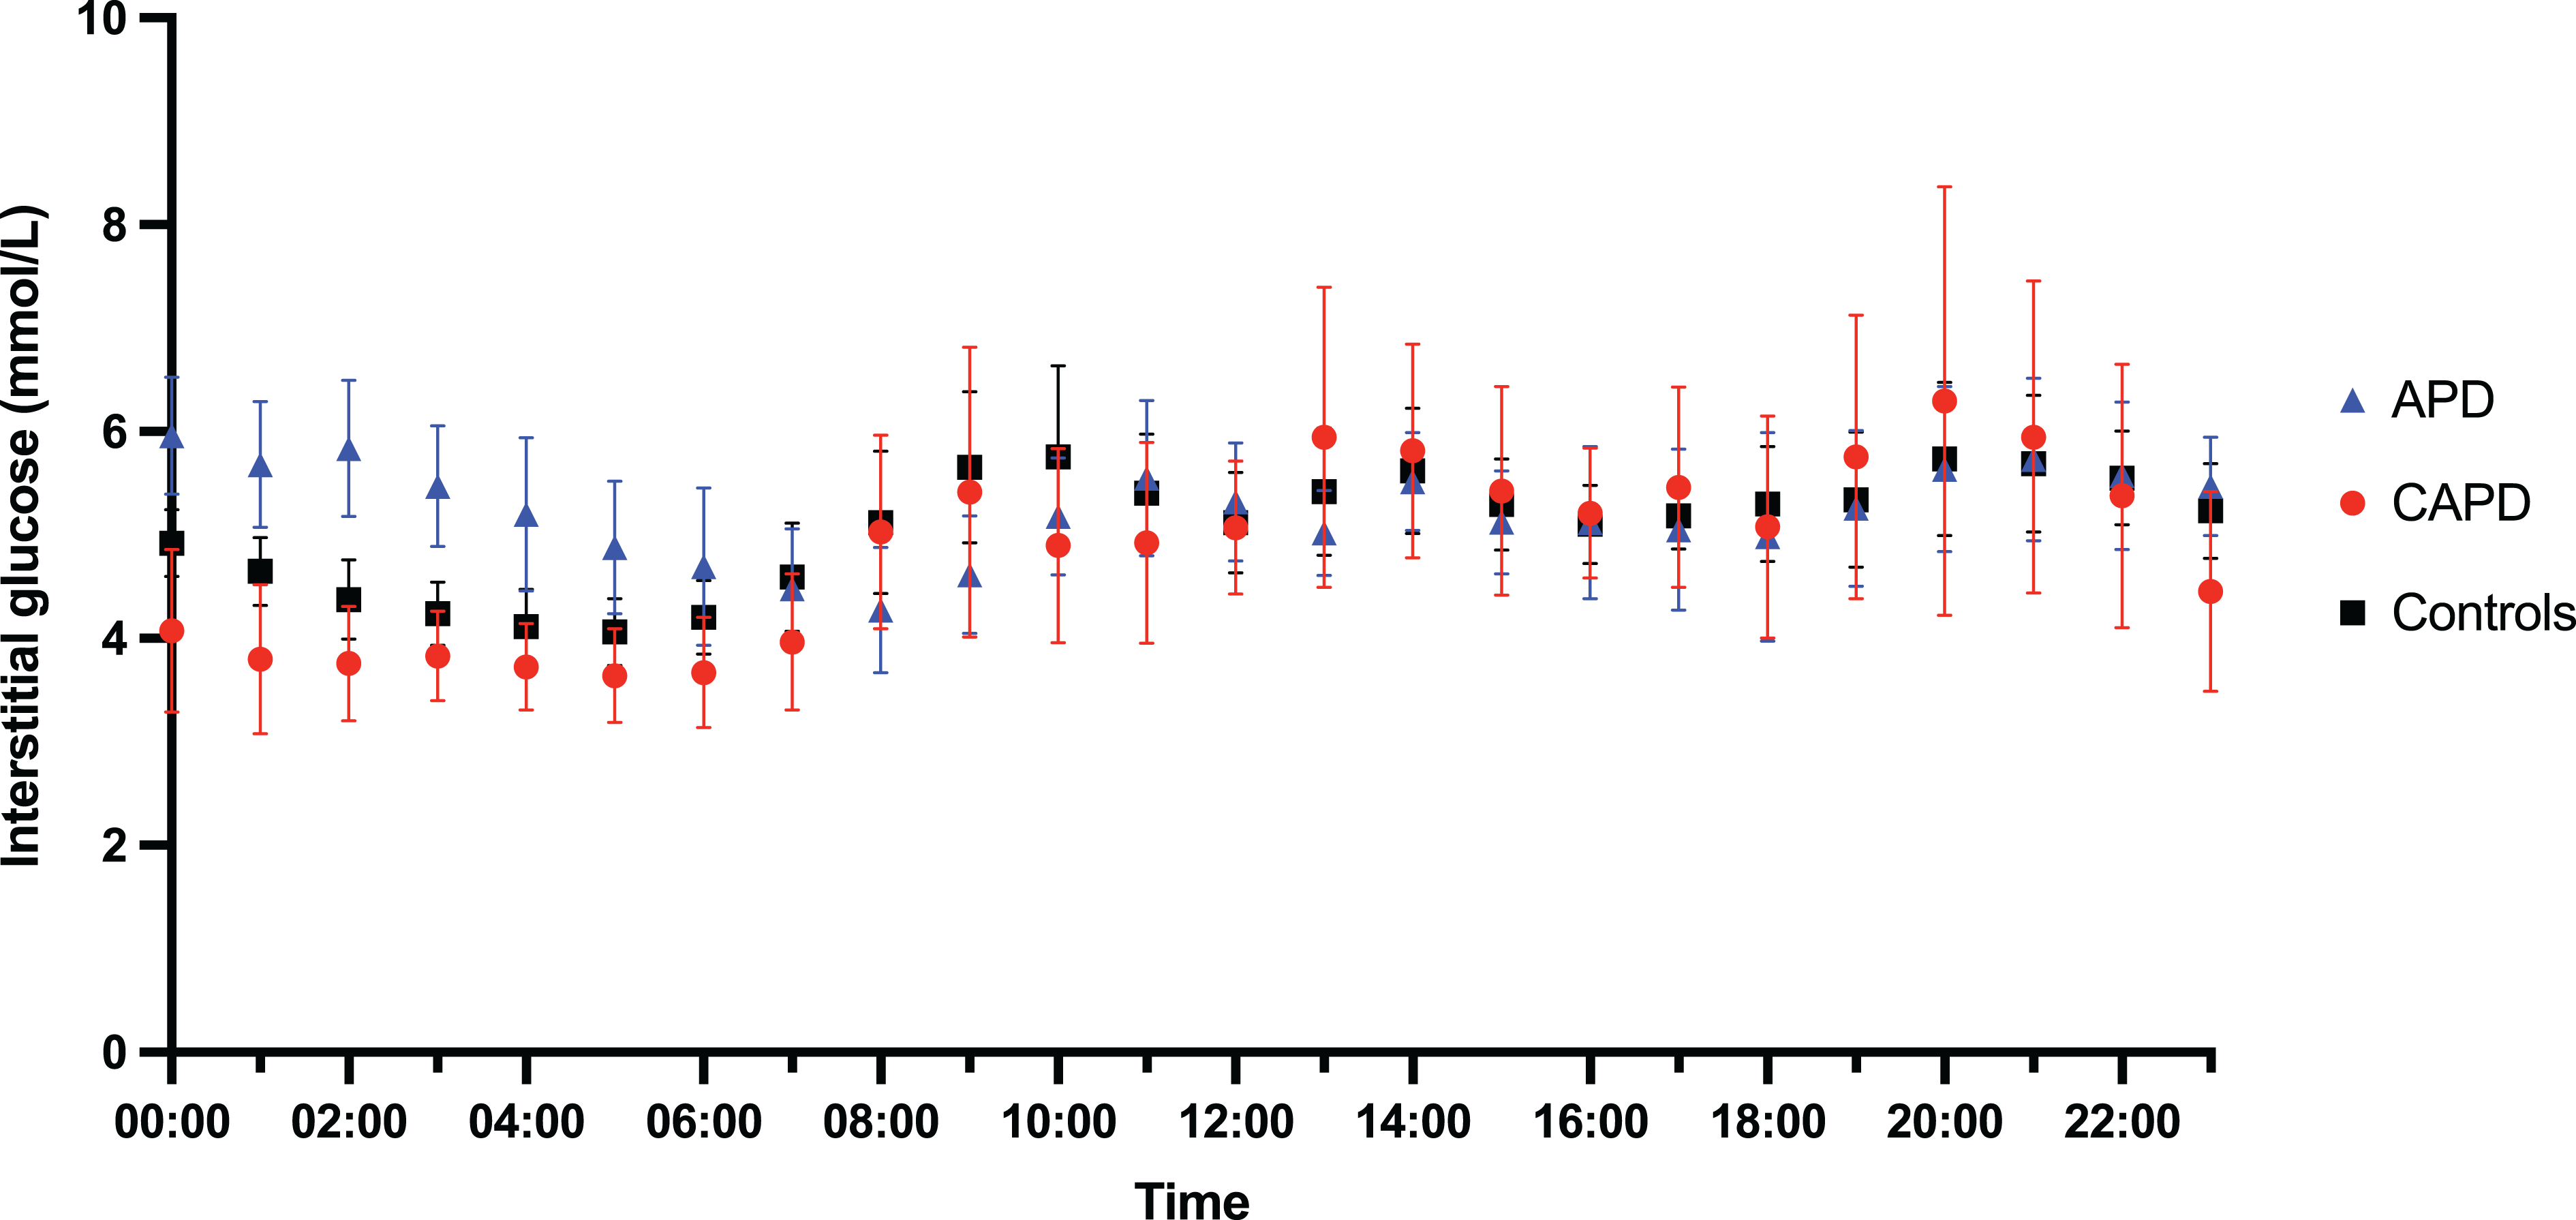
Summary graph of glycaemic profiles comparing controls, APD patients and CAPD patients. Data represent the hourly mean (95% CI) for each group over the 72-h monitoring period. APD: automated peritoneal dialysis; CAPD: continuous ambulatory peritoneal dialysis.
CAPD patients followed a similar overall pattern to control patients, with variations in interstitial glucose during the day associated with meals and a lower, less variable interstitial glucose concentration at night. APD patients demonstrated a daytime pattern similar to controls and CAPD patients but night-time interstitial glucose levels were higher than fasting levels for the duration of the APD program and dropped to fasting levels once therapy with glucose containing fluid stopped.
There was no difference in the average glucose concentration (mmol/L) between the three groups over the whole monitoring period (controls 5.08 ± 0.69, CAPD 4.9 ± 0.64, APD 5.23 ± 0.62, p = 0.637) or during the daytime (controls 5.45 ± 0.75, CAPD 5.46 ± 0.86, APD 5.21 ± 0.65, p = 0.729). The average night-time glucose (mmol/L) in APD patients was significantly higher than CAPD patients (APD 5.25 ± 0.65 vs. CAPD 4.28 ± 0.5, p = 0.026). There was no statistically significant difference in average night-time glucose between controls (4.69 ± 0.7) and either APD (p = 0.145) or CAPD (p = 0.605).
There was no difference in within-person SD of glucose (mmol/L) across the three groups over the whole monitoring period (controls 1.26 ± 0.25, CAPD 1.27 ± 0.33, APD 1.15 ± 0.17, p = 0.5), daytime periods (controls 1.31 ± 0.37, CAPD 1.16 ± 0.29, APD 1.21 ± 0.26, p = 0.541) or night-time periods (controls 0.99 ± 0.27, CAPD 1.05 ± 0.34, APD 1.01 ± 0.19, p = 0.923).
Loss of night-time dipping
The control and CAPD groups demonstrated a statistically significant drop in average night-time glucose compared with daytime values. This was not seen in the APD group. In controls average, night-time glucose was 0.76 ± 0.43 mmol/L lower than average daytime glucose (p ≤ 0.0001). In CAPD patients, this value was larger at 1.18 ± 0.5 mmol/L (p = 0.0023). In APD patients, average night-time glucose did not differ significantly from daytime, 0.03 ± 0.42 mmol/L (p = 0.814) (Figure 3). This difference in daytime to night-time interstitial glucose concentrations was significantly different in APD patients compared with both controls and CAPD patients (p = 0.001 vs. controls, p ≤ 0.0001 vs. CAPD) (Figure 4). There was no statistically significant difference between the pattern seen in controls and CAPD patients (p = 0.168).
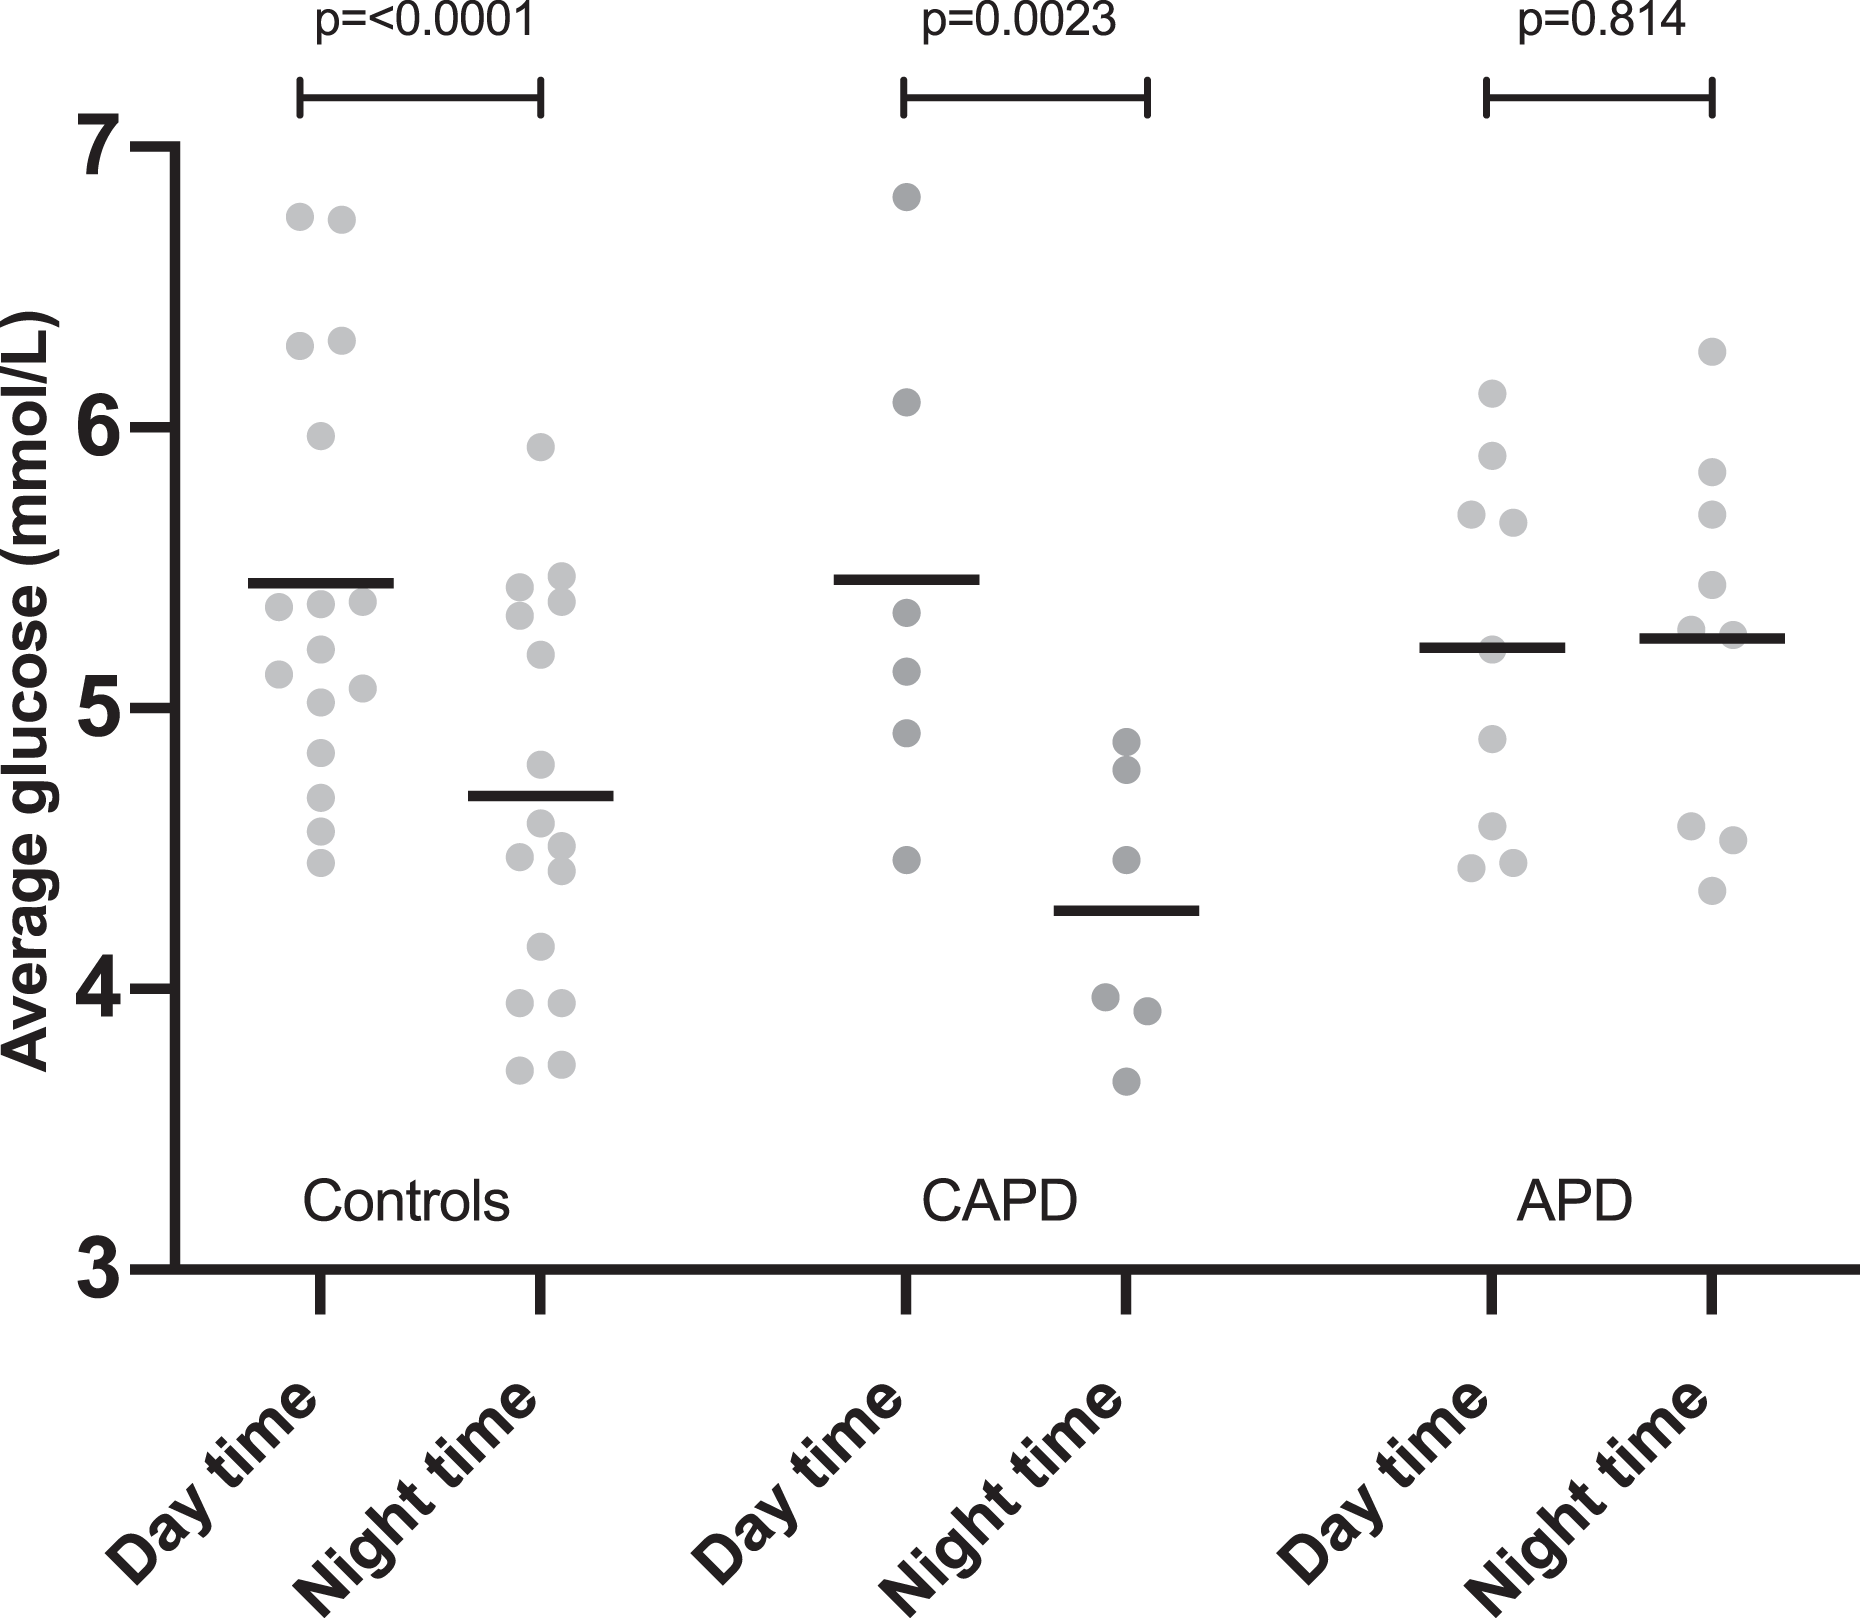
Differences between average daytime and average night-time interstitial glucose levels by group. Line drawn at mean. p values are shown. CAPD: continuous ambulatory peritoneal dialysis; APD: automated peritoneal dialysis.
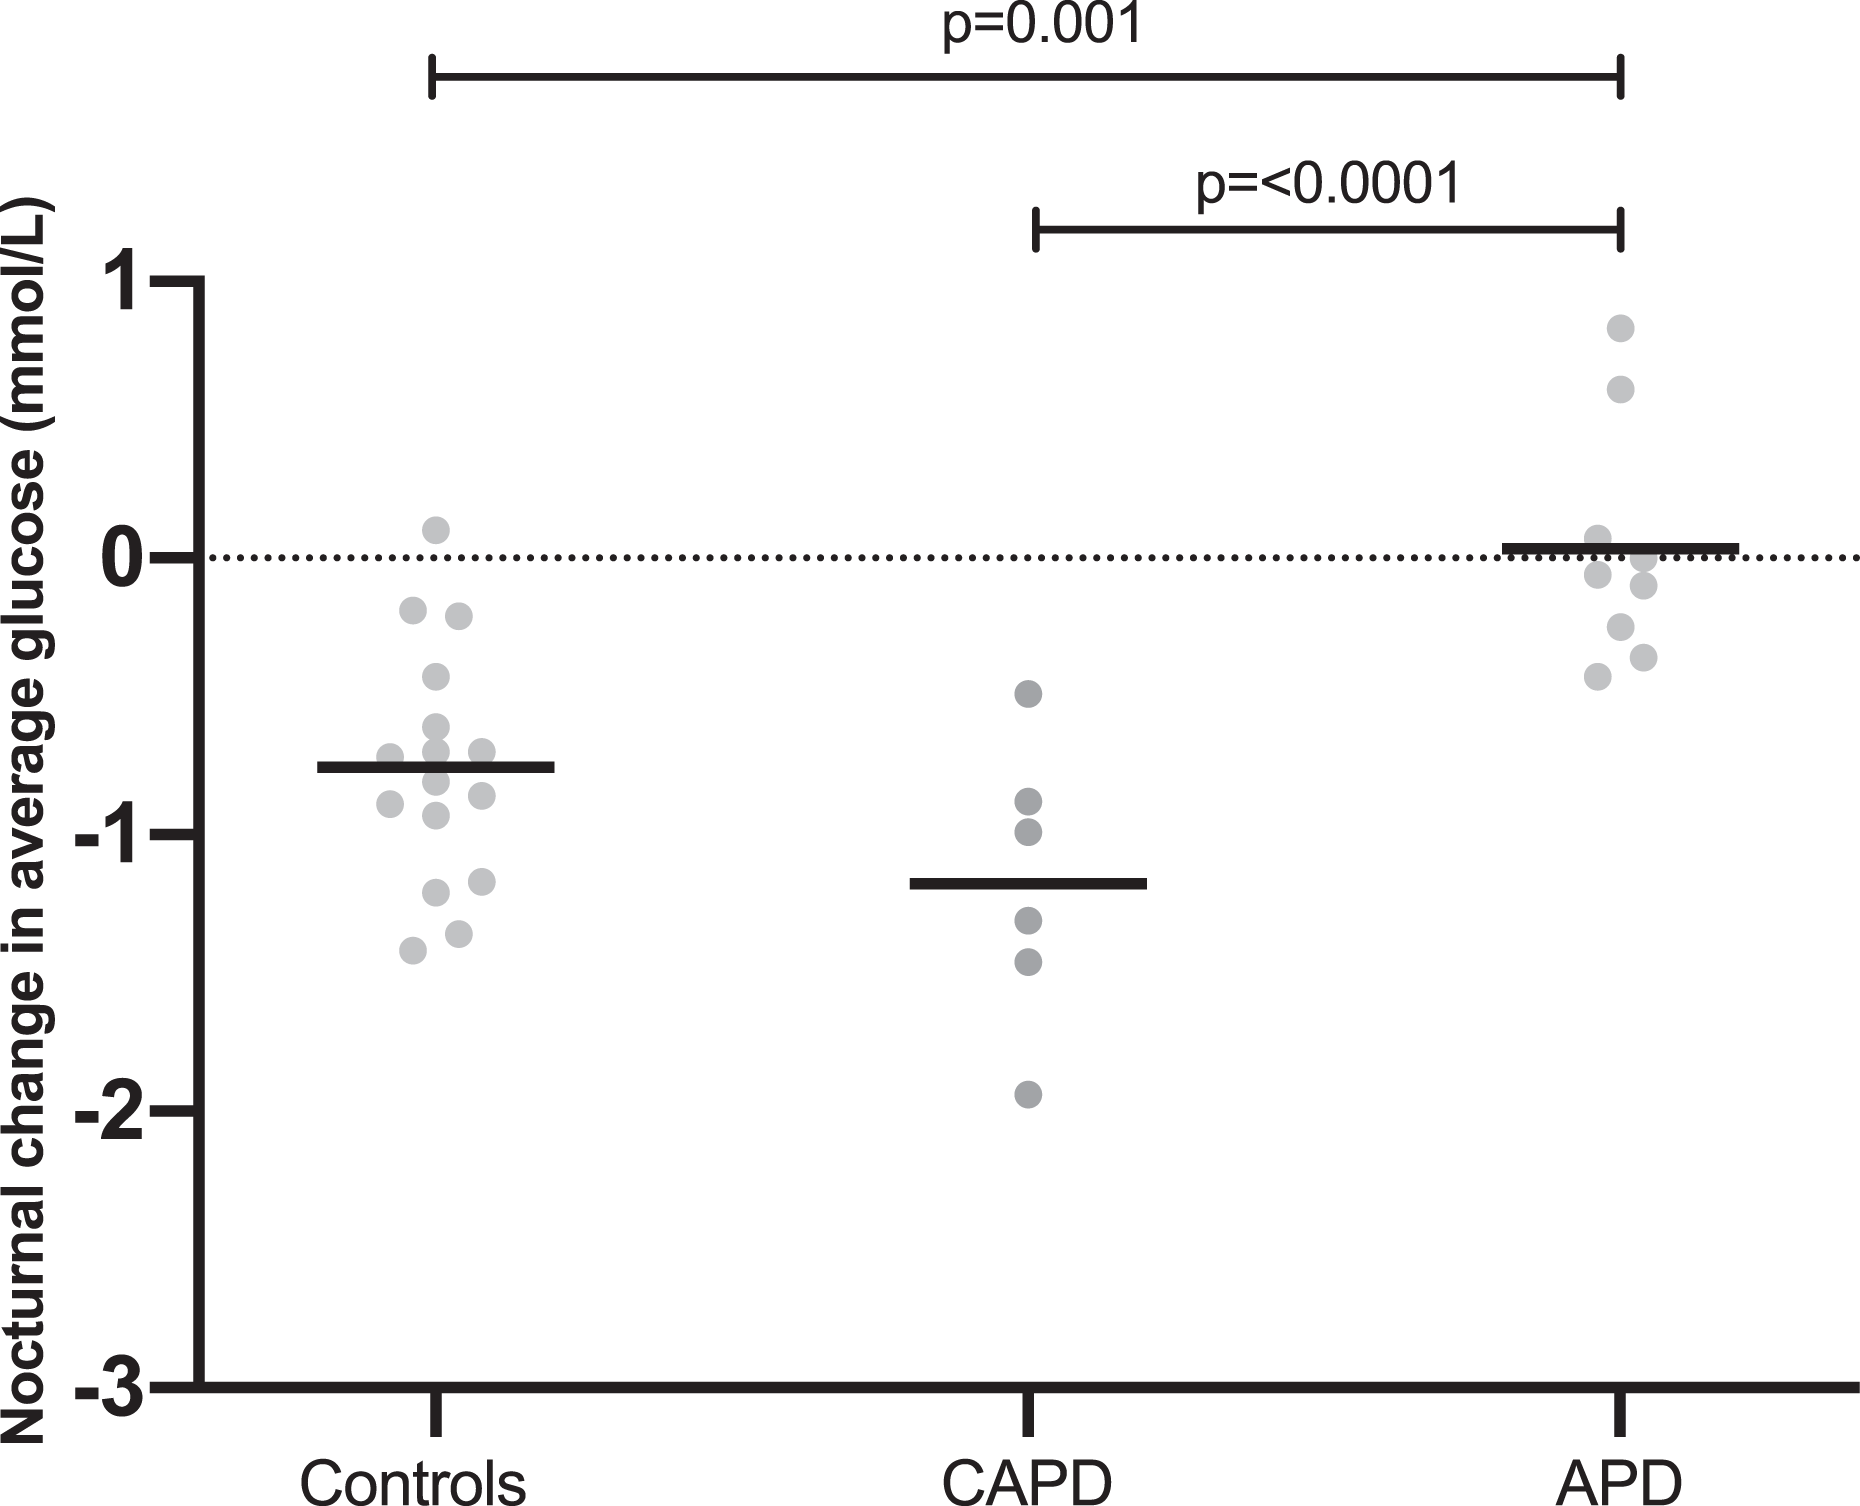
Change in night-time average glucose compared with daytime average glucose by group (value plotted = night-time average – daytime average; therefore, negative values represent lower value at night than during the day). Line drawn at the mean. Significant p values (<0.05) are shown. CAPD: continuous ambulatory peritoneal dialysis; APD: automated peritoneal dialysis.
Traditional metabolic markers
There were no significant differences between control and PD groups for HbA1c, fasting plasma glucose, plasma glucose 2 h post OGTT or markers of insulin resistance (Table 1). In the cohort as a whole, there were no significant correlations between any traditional markers of glycaemia and outcomes generated from the CGM data (average interstitial glucose and SD of glucose).
In the PD group as a whole, there was no correlation between daily dialysate glucose exposure and average interstitial glucose or SD of glucose (r = 0.13, p = 0.65, r = −0.14, p = 0.61, respectively). There was no correlation between rate of peritoneal transport (D/PCr at 4 h) and average interstitial glucose or SD of glucose (r = −0.13, p = 0.66, r = −0.22, p = 0.46, respectively). There was no correlation between length of time on PD and average interstitial glucose or SD of glucose (r s = 0.02, p = 0.94, r s = 0.29, p = 0.294, respectively).
Discussion
In this study of continuous interstitial glucose profiles in PD patients without diabetes, we found significantly different patterns of glycaemia in those patients on automated PD compared with continuous ambulatory PD and non-dialysis controls with CKD-5. In patients on APD, exposure to glucose containing solutions at night resulted in loss of the pattern of nocturnal glucose dipping seen in both CAPD patients (who were not exposed to glucose containing solutions at night) and controls. This did not result in a statistically significant difference in 24-h average interstitial glucose concentrations or glycaemic variability between PD patients and controls. Sixteen controls and 15 PD patients in the final analysis enabled detection of a 1.05 SD difference between groups. This equates to a difference in average interstitial glucose of 0.65 mmol/L and a difference in glycaemic variability (SD of glucose) of 0.25 mmol/L. It is possible that there were differences between the PD patients and controls smaller than these that this study was unable to detect. The clinical significance of differences smaller than this is uncertain.
Systematically different patterns of interstitial glucose for APD and CAPD have previously been reported in PD patients with diabetes. 15,24 Okada et al. 15 retrospectively studied 23 CGM traces from PD patients with diabetes (12 APD, 11 CAPD). They reported reduced SD of glucose and reduction in the difference between minimum and maximum glucose levels in the APD traces compared with CAPD, concluding that CAPD causes increased glucose fluctuations. It is possible reduced fluctuations in their APD group were the result of reduced differences between daytime and night-time values as we report here. Our study benefits from a non-PD control group for comparison and indicates that the pattern seen in CAPD patients may be closer to physiological norms.
CAPD patients differed from controls and APD patients by being subject to an additional peritoneal glucose load during the day; however, in this study, there was no significant difference in the daytime average interstitial glucose levels between CAPD patients and either APD patients or controls. In contrast, the glucose load that the APD patients were exposed to at night resulted in significantly increased interstitial glucose concentrations. The reason for a measurable effect at night that is not seen in the day is unclear and the relatively small numbers in this study allow for speculation only. It may simply be the result of the greater overall dialysate glucose load APD patients are exposed to. Alternatively, insulin released in response to meals, which often coincided with CAPD exchanges, may result in more efficient handling of this peritoneally absorbed glucose. The greater relative impact of glucose absorbed during the night may also be a result of diurnal variations in glucose tolerance. In a study of young healthy individuals, a constant infusion of intravenous glucose over 30 h resulted in a 15% increase in plasma glucose levels during the night compared with the day. 25 This physiological reduction in night-time glucose tolerance aims to avoid hypoglycaemia during the overnight fasting period. 26
The physiological implications of this iatrogenic lack of nocturnal dipping in APD patients are also unclear. Food intake during the wrong circadian phase has been shown to cause obesity in mice 27 and there is increasing evidence from human studies that ‘time-restricted feeding’ including a prolonged fasting period overnight is beneficial for weight loss 28 and reducing insulin resistance. 29 It is possible the additional glucose load, asynchronous with natural circadian rhythms coupled with the absence of any significant period of fasting during a 24-h period may negatively impact glucose metabolism and further exacerbate insulin resistance.
The intermittent nature of HD as a therapy has always posed a challenge in studies with regards timing of investigations and comparing outcomes between studies. We have demonstrated that despite the perception of PD as a ‘continuous’ treatment, the timing of investigations is at least as important. The more in-depth analysis afforded by CGM highlights subtleties that would not be appreciated by time averaged markers such as HbA1c. Consideration should also be given to the differential impact of APD and CAPD on single plasma glucose measurements. In APD-dominated cohorts, random daytime plasma glucose may underestimate true glucose exposure.
The strengths of this study include a well characterised cohort, prospectively recruited to study patterns of glycaemia. This is the first study to use CGM in this patient group. Although CGM was designed for use in people with diabetes, a newer model where the need for external calibration has been removed proved easy to use and acceptable to a cohort of patients without diabetes, resulting in comprehensive data sets with few missing data.
This study has some limitations. Conclusions regarding absolute differences between the three groups are limited by relatively small numbers and a heterogeneous cohort. For example, although the difference in night-time glucose between APD patients and controls (0.56 mmol/L) was not statistically significant, this is likely to be a Type 2 error, and larger participant numbers may have rendered it statistically significant. The CGM data were not masked from the participants potentially influencing their behaviour during the study. However, these non-diabetic participants had no frame of reference for ‘normal’ glucose levels and options for behaviour modification were limited to food intake as they were not on any glucose lowering therapies. The groups were well matched for gender, ethnicity and BMI; however, there was a significant difference in age, control patients being on average 9 years younger than the PD patients. It is likely this would increase glucose levels in the PD patients, 7 enhancing any differences between groups. Although the study group was representative of our local PD population, it remains an entirely Caucasian cohort and it is therefore unclear how translatable these findings are to other ethnicities, especially those at high risk for metabolic derangements. 30
This study provides an important and previously unrecognised insight into patterns of glycaemic control in patients without diabetes on PD and those patients with advanced kidney disease not yet on dialysis. We report systematically different patterns of glycaemia in APD and CAPD patients, including an absence of nocturnal glucose dipping in patients on APD, the clinical implications of which are not yet clear. These patterns do however have implications when choosing the most appropriate outcome measures in future research addressing the metabolic impact of PD. They also suggest that in studies addressing the systemic impact of peritoneally absorbed glucose, APD and CAPD patients should be considered as separate groups with systematically different patterns of glycaemic exposure.
Supplemental material
Supplemental Material, sj-docx-1-ptd-10.1177_08968608211047787 - 24-h Glycaemic profiles in peritoneal dialysis patients and non-dialysis controls with advanced kidney disease
Supplemental Material, sj-docx-1-ptd-10.1177_08968608211047787 for 24-h Glycaemic profiles in peritoneal dialysis patients and non-dialysis controls with advanced kidney disease by Jennifer Williams, Mark Gilchrist, William David Strain, Donald Fraser and Angela Shore in Peritoneal Dialysis International
Footnotes
Acknowledgements
We are grateful to the home care team at the Royal Devon and Exeter Hospital for their help in conducting the study.
Author contributions
JW, MG, DS, DF and AS were involved in conceptualisation, study design and analysis plan, JW conducted all data collection and statistical analysis, JW wrote the first draft and all co-authors were involved in writing, review and editing.
Authors’ note
The authors declare no relevant financial interests. WDS reports grants, personal fees and non-financial support from NovoNordisk, non-financial support from Bayer Pharmaceuticals, grants and personal fees from Takeda, personal fees from Astra Zeneca, outside the submitted work. MG reports personal fees from Napp outside the submitted work. The results presented in this article have not been published previously in whole or part, except in abstract form.
Data availability statement
The data supporting this publication are currently available by contacting Dr J Williams (
Declaration of conflicting interests
The author(s) declared no potential conflicts of interest with respect to the research, authorship, and/or publication of this article.
Ethical approval
Ethical approval for this study was obtained from South Central-Hampshire A Research Ethics Committee (REC ref 17/SC/0266).
Funding
The author(s) disclosed receipt of the following financial support for the research, authorship, and/or publication of this article: This work was funded by a Kidney Research UK Training Fellowship awarded to JW [TF_013_20151127].
Informed consent to participate
Written informed consent was obtained from all subjects before the study.
Informed consent to publish
Written informed consent was obtained from all participants for anonymised data collected as part of this study to be published.
Supplemental material
Supplemental material for this article is available online.
References
Supplementary Material
Please find the following supplemental material available below.
For Open Access articles published under a Creative Commons License, all supplemental material carries the same license as the article it is associated with.
For non-Open Access articles published, all supplemental material carries a non-exclusive license, and permission requests for re-use of supplemental material or any part of supplemental material shall be sent directly to the copyright owner as specified in the copyright notice associated with the article.