
Abstract
Background:
The continuous global rise of end-stage kidney disease creates a growing demand of economically beneficial home-based kidney replacement therapies such as peritoneal dialysis (PD). However, undesirable absorption and exposure of peritoneal tissues to glucose remain major limitations of PD.
Methods:
We compared a reference (standard) automated PD regimen 6 × 2 L 1.36% glucose (76 mmol/L) over 9 h with a novel, theoretically glucose sparing (optimised) prescription consisting of ‘ultrafiltration cycles’ with high glucose strength (126 mmol/L) and ‘clearance cycles’ with ultra-low, physiological glucose (5 mmol/L) for approximately 40% of the treatment time. Twenty-one prevalent PD patients underwent the optimised regimen (7 × 2 L 2.27% glucose + 5 × 2 L 0.1% glucose over 8 h) and the standard regimen in a crossover fashion. Six patients were excluded from data analysis.
Results:
Median glucose absorption was 43 g (IQR 41–54) and 44 g (40–55) for the standard and optimised intervention, respectively (p = 1). Ultrafiltration volume, weekly Kt/V creatinine and urea were significantly improved during optimised interventions, while no difference in sodium removal was detected. Post hoc analysis showed significantly improved ultrafiltration efficiency (ml ultrafiltration per gram absorbed glucose) during optimised regimens. No adverse events were observed except one incidence of drain pain.
Conclusion:
Optimised treatments were feasible and well tolerated in this small pilot study. Despite no difference in absorbed glucose, results indicate possible improvements of ultrafiltration efficiency and small solute clearances by optimised regimens. Use of optimised prescriptions as glucose sparing strategy should be evaluated in larger study populations.
Keywords
Introduction
End-stage kidney disease incidence continues to rise worldwide 1 –3 and the future need of kidney replacement therapy is expected to increase. 4,5 Automated peritoneal dialysis (APD) is an increasingly popular choice of economically beneficial home-based dialysis modalities. 5,6 Automatic cycling enables a wide variation of treatments, tailored to meet dialysis needs and wishes of the individual patient. 7 However, despite increasing use of non-glucose osmotic agents, dialysis fluids with glucose concentrations 15 to 40 times higher than physiological levels remain the most commonly used. 8 –11 Peritoneal membrane exposure of glucose, its degradation products and hyperosmolar stress alter structural and functional membrane properties with consequential effects on technique failure and patient survival. 12 –16 Beyond local membrane effects, systemic glucose absorption is suggested to account for 20% of recommended daily energy intake. 8 As 50% of PD patients develop a new-onset glucose metabolic disorder, it has become clear that use of glucose as an osmotic agent should be refined, reduced or replaced. 17,18
Theoretical three-pore model (TPM) simulations by Öberg and Rippe suggest marked glucose absorption reduction by use of bi-modal, ‘optimised’ APD regimes, combining high glucose ‘ultrafiltration (UF) dwells’ with consecutive very low glucose small-solute ‘clearance dwells’. 19 In comparison to a ‘standard’ simulated APD prescription, optimised regimes reduce absorbed glucose by 20–30%, based on the condition that standard and optimised regimens are equally effective regarding UF and small solute clearances. In this experimental pilot study, the clinical feasibility of such regimens is tested regarding glucose absorption, UF and small solute clearances.
Methods
This randomised single-centre trial was a prospective, investigator-initiated and open-label study conducted at the Hospital Privado Universitario de Còrdoba, Argentina. Before trial initiation, the study was registered at US National Library of Medicine clinical trial registry (ID NCT04017572) and approved by the regional ethics committee. A published protocol was developed in accordance with the Declaration of Helsinki and is available online. 20
Participants
Twenty-one prevalent PD patients were enrolled after written informed consent between June and December 2019. Enrolment was conditioned on fulfilling all criteria of inclusion and none of the exclusion criterions. Patients were randomised to either start with the optimised treatment or the reference treatment using a random number generator. In a crossover manner, the initial intervention was followed by the other intervention within 30 days. Enrolment criteria and allocation flow chart are shown in Figure 1. Patient enrolment and randomisation was managed by the investigator on site (JdA). All interventions were performed in-centre by trained healthcare personnel.
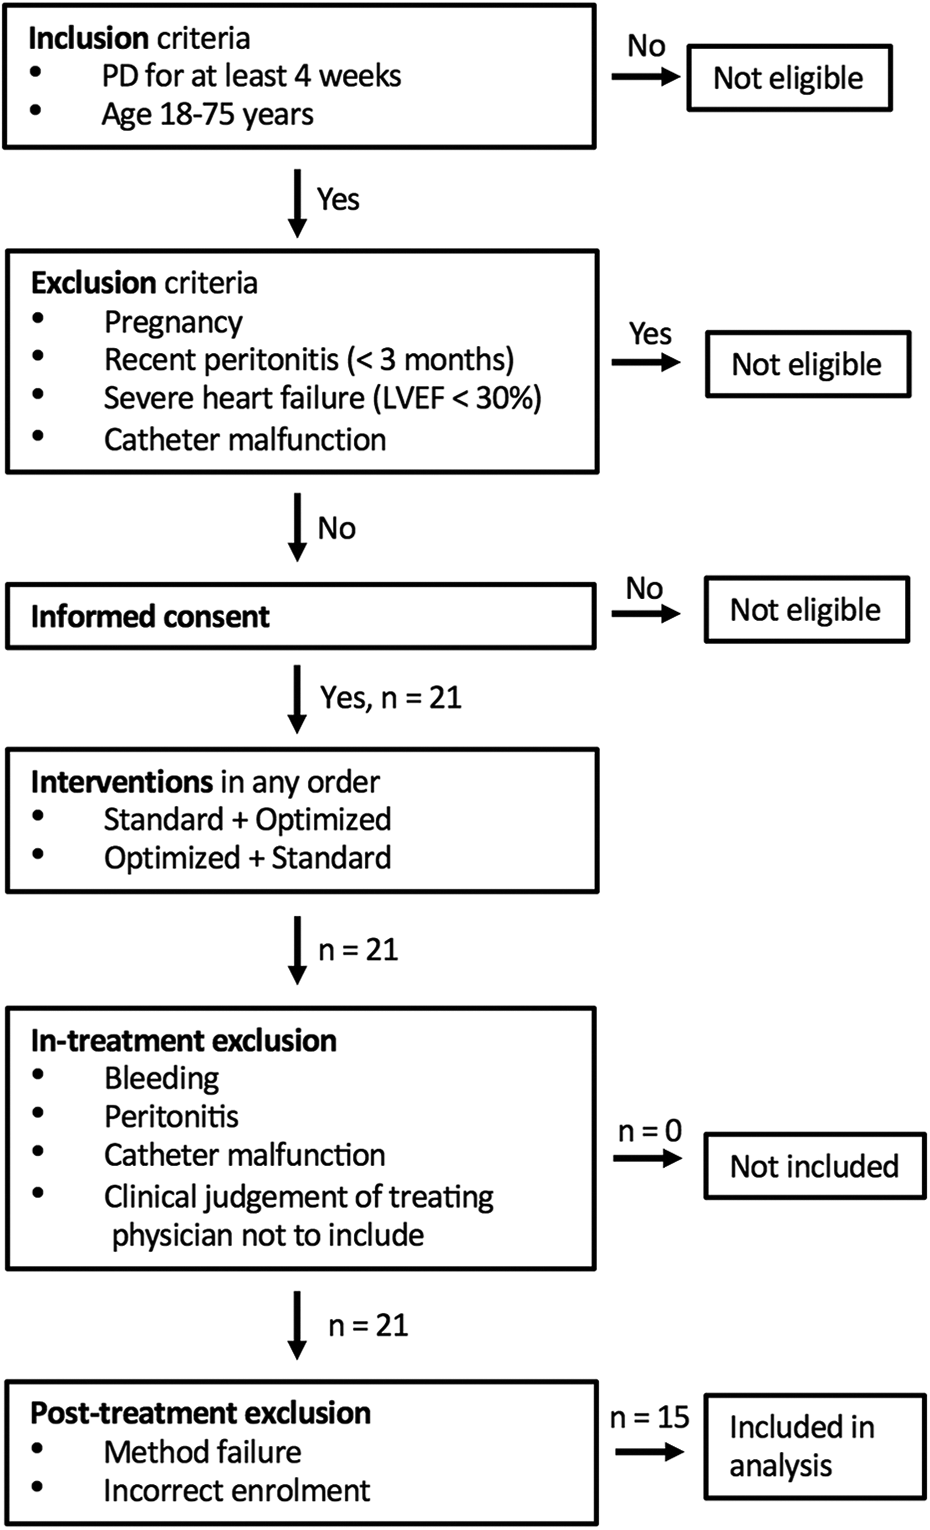
Enrolment criteria and participant allocation sequence. A total of 21 participants underwent the study protocol and 15 included in the final outcome analysis.
Primary outcome
The primary outcome was observed difference in absorbed glucose during standard and optimised APD treatment. Secondary outcomes were difference in UF, sodium removal, weekly Kt/V of creatinine and urea. Adverse events during interventions and 2 weeks after were carefully observed.
Intervention
All interventions began at morning after PD according to the participant’s ordinary PD prescription. After draining the night bag, a 2 L 1.36% (Dianeal, Baxter Healthcare Corporation, Deerfield, Illinois, USA) rinse was performed. All interventions were performed using an APD-cycler HomeChoice Pro (Baxter Healthcare Corporation) in the supine position. The standard intervention consisted of 6 × 2 L 1.36% Dianeal during 9 h as schematically described in Figure 2. The optimised regimen was initiated by 7 × 2 L 2.27% dwells (Baxter Healthcare Corporation) during a total of 280 min. There is no commercially available very low glucose concentration PD fluid, therefore 0.1% continuous kidney replacement therapy fluid was used during the subsequent clearance dwells, 5 × 2 L 0.1% (Certesol 0/3.5, Rivero, Ciudad Autónoma de Buenos Aires, Buenos Aires, Argentina. See Supplemental Table 1 for solution contents) during 200 min. The optimised regimen is also schematically demonstrated in Figure 2. The 0.1% glucose dwells were performed after a manual change into a second pre-primed HomeChoice Pro cycler to avoid delay during priming. Each intervention was finished by a 1.36% rinse.
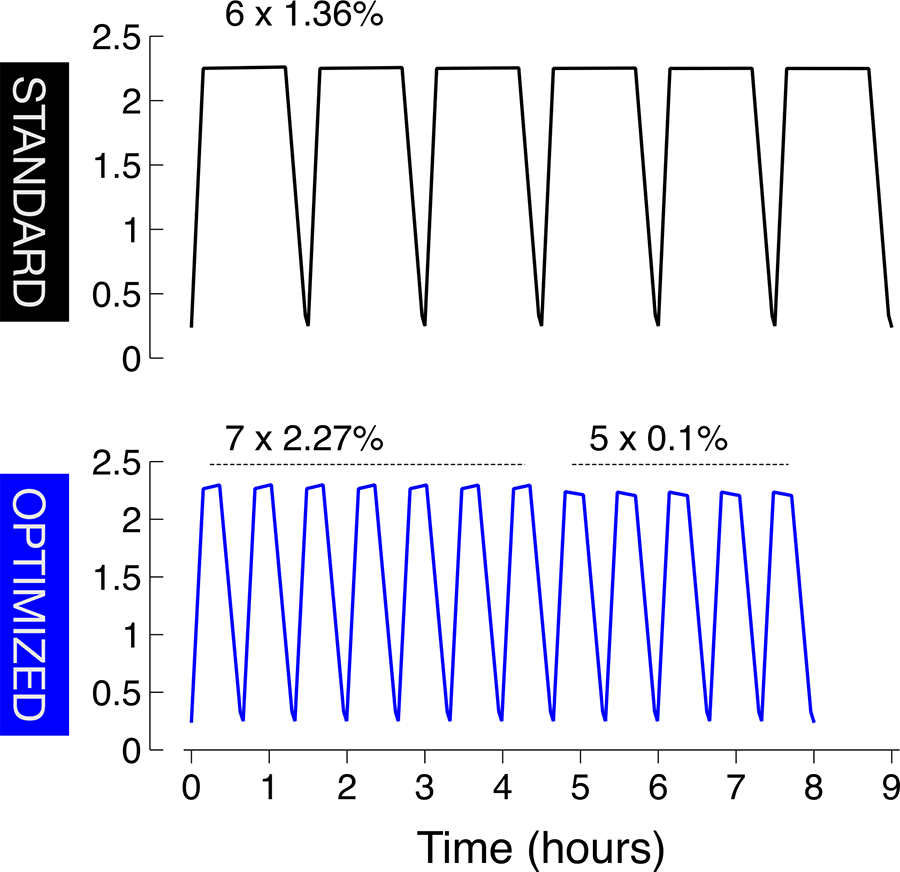
Standard and optimised APD intervention procedures. Standard treatment consisting of 6 × 2 L 1.36% glucose dwells, total duration 9 h. Optimised treatment initiated by 7 × 2 L 2.27% glucose during 280 min followed by 5 × 2 L 0.1% glucose over 200 min (8 h). APD: automated peritoneal dialysis.
Data collection and calculations
Fill and drain bags were initially weighed to assess fill and drain volumes. Due to excellent agreement between the gravimetric and cycler specified volumes, the cycler specified volumes were used. Residual volumes before and after interventions and between 2.27% and 0.1% glucose dwells were calculated using albumin (for details see Martus et al. 21 ) and integrated in the UF estimations.
Laboratory analysis
Samples of blood and dialysis fluids were analysed in the hospital laboratory. Blood samples pre- and post-intervention were collected. Samples were collected from the fresh dialysis fluid, immediately after peritoneal instillation and from all drain bags. Samples were also taken immediately after instillation of the pre- and post-intervention rinse dialysate. Concentrations of glucose, urea, creatinine, albumin, total protein, chloride and sodium were analysed in the effluent using an autoanalyser Cobas 501 (Roche Diagnostics AG, Rotkreuz, Switzerland). Creatinine was assessed using a variant of the Jaffé method. According to the manufacturers sheet for the Cobas 501, no interference with glucose is expected for concentrations below 25 mmol/L. Median glucose concentrations of fresh dialysis fluids were used in calculations. One missing post-intervention blood sample was replaced by the patient’s pre-intervention blood data. Information regarding participant age, sex, length and prior peritoneal equilibration test results (4 h 2.27% glucose dialysis to plasma ratio of creatinine) were collected from hospital records. Body weight was measured before and after each intervention.
Statistical analysis
Pre-experimental Monte Carlo power analysis indicated a statistical power to detect a 10 g difference in absorbed glucose (Cohen’s d = 1.45) of 80% with 10 study participants and 98% with 20 included patients. The trial was stopped after 20 patients or more had completed both interventions. An interim analysis was performed after 10 participants had undergone both interventions, and the results did not suggest preterm termination. Four participants were excluded from the analysis due to method failure (incorrect fill volume given by the cycler, fresh fluid composition discrepancy and missing data) and two due to incorrect enrolment discovered after interventions were performed. Primary and secondary outcomes were analysed by two-sided Wilcoxon signed rank test using RStudio version 1.2.1335. p Values below 0.05 were considered statistically significant. Results are presented as median and interquartile range (IQR) or as frequency.
Results
Participants
During the study period, 21 patients underwent the full protocol. A total of 15 patients were included in the study. Baseline characteristics for included patients are presented in Table 1. Median age was 57 years, and 66% of patients were male.
Baseline characteristics.
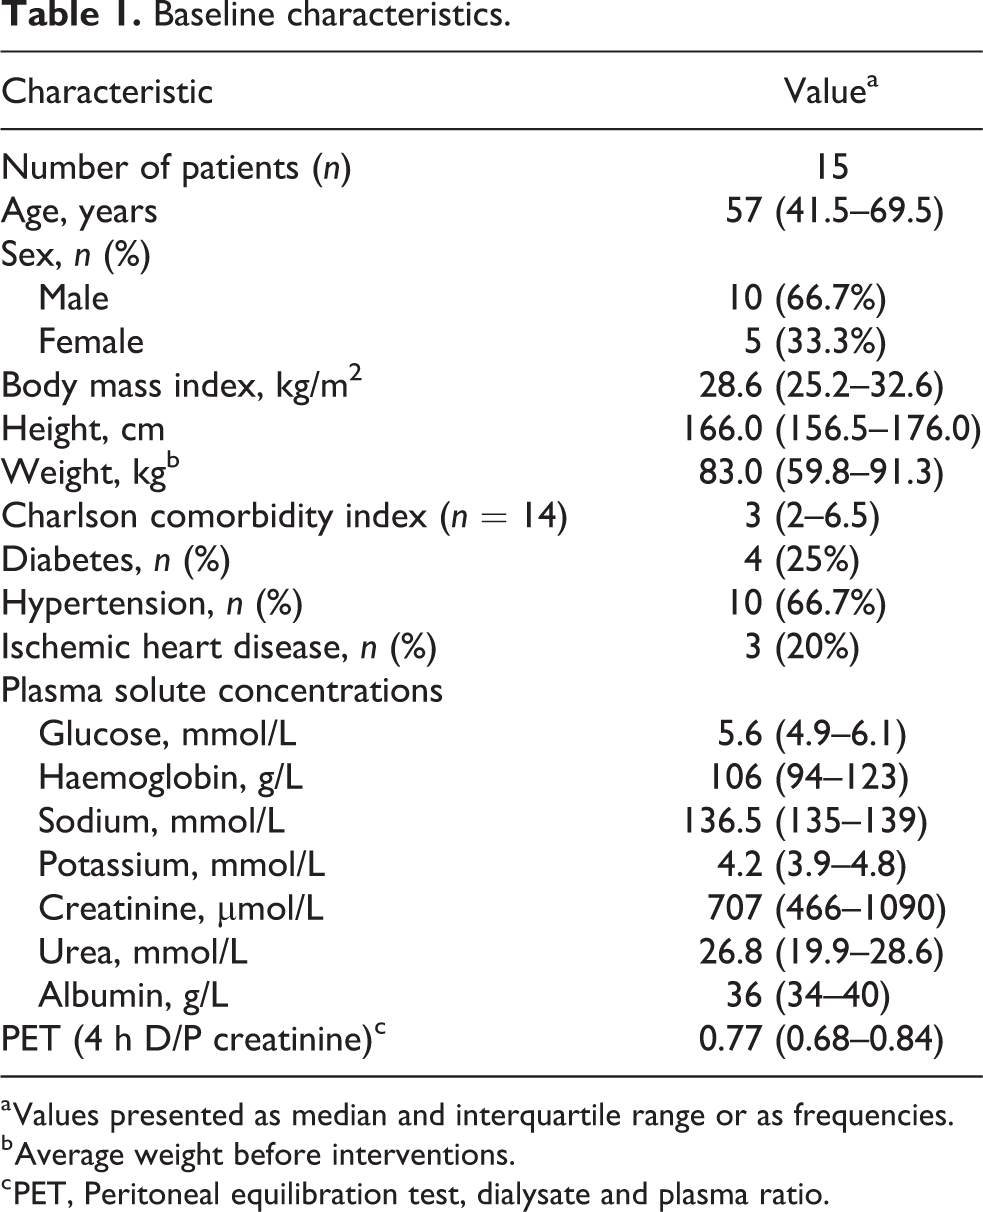
a Values presented as median and interquartile range or as frequencies.
b Average weight before interventions.
c PET, Peritoneal equilibration test, dialysate and plasma ratio.
Glucose absorption
As shown in Figure 3(a), no statistically significant difference in glucose absorption was observed, standard treatment glucose absorption median was 43 g with an interquartile range between 41 g to 54 g and optimised 44 g (IQR 40–55).
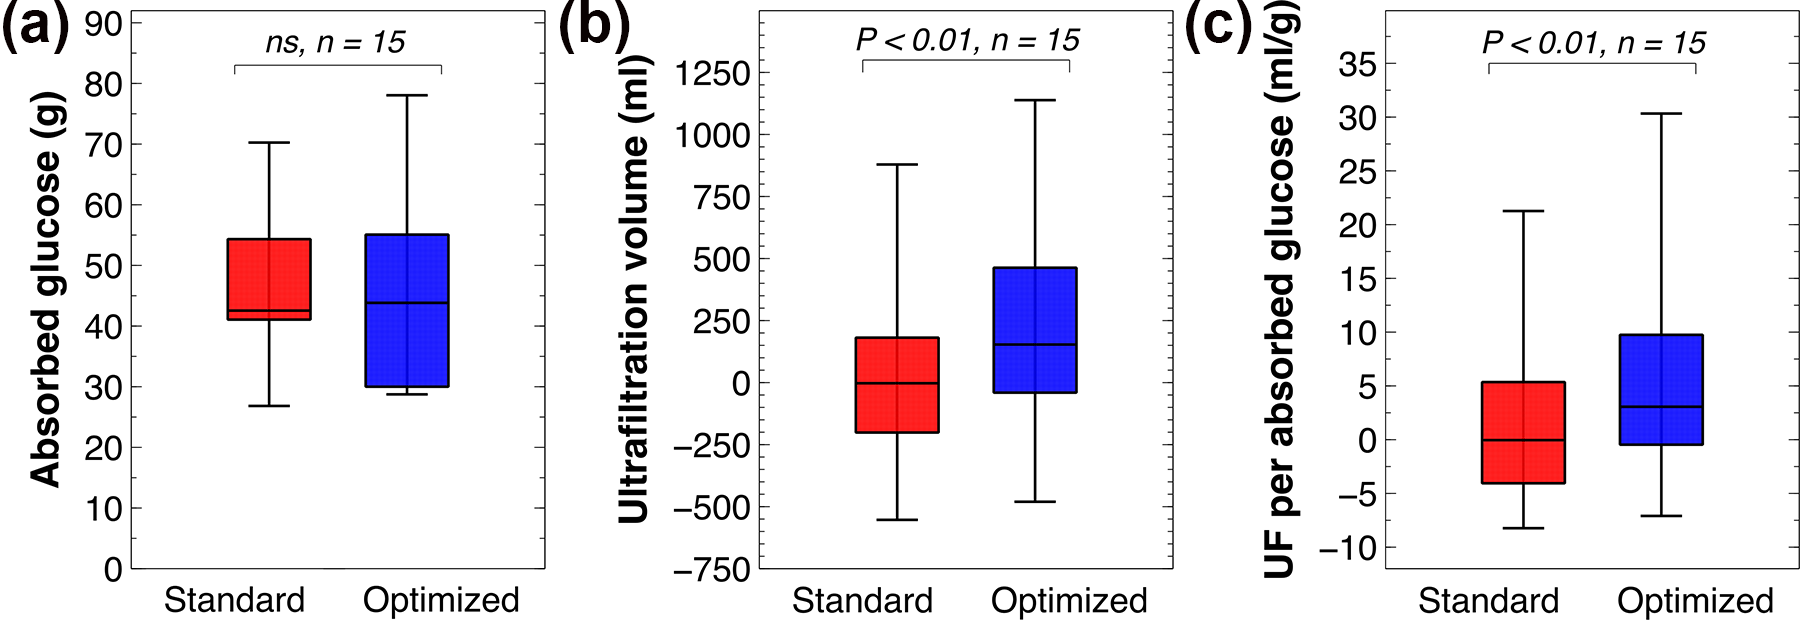
Absorbed glucose, ultrafiltration volume and ultrafiltration efficiency. (a) Median glucose absorption of 43 g (IQR 41–54) during standard interventions and 44 g (IQR 40–55) during optimised regimens. No significant intervention difference observed, p > 0.05. (b) During optimised regimens, significant increase in ultrafiltration compared to standard interventions was observed, p < 0.01. Standard median −3 mL (IQR −201 to 181) and optimised 153 mL (IQR −40 to 463). (c) The ratio of ultrafiltration and absorbed glucose during optimised regimens was significantly superior standard observations, optimised median 3.1 mL/g (IQR −0.5 to 9.8) in comparison to standard 0 mL/g (IQR −4.1 to 5.4), p < 0.01.
UF and UF efficiency
Out of 15 participants, 13 achieved a larger UF volume (mL) with the optimised regimen compared to the reference regimen (see Figure 3(b)). Optimised interventions were significantly superior to standard, supported p < 0.01 and optimised UF of 153 mL (IQR −40 to 463) in comparison to standard −3 mL (IQR −201 to 181). In a post hoc analysis, we calculated the UF efficiency, that is, achieved UF per absorbed glucose (mL/g). The results are shown in Figure 3(c). Nearly all participants achieved an increased UF efficiency during the optimised dwells with an ultrafiltration efficiency of 3.1 mL/g glucose absorbed (IQR −0.5 to 9.8) compared to 0 mL/g (IQR −4.1 to 5.4) during reference treatment (p < 0.01).
Small solute clearances – Weekly Kt/V creatinine and urea
As shown in Figure 4(a), weekly Kt/V of creatinine and urea (APD-sessions only) were increased during the optimised regimen in comparison to the standard regimen, a difference supported by p < 0.01 (creatinine) and p < 0.001 (urea). Weekly Kt/V creatinine median was 0.75 (IQR 0.63–0.91) and urea 1.28 (IQR 1.0–1.43) for the standard regimen, to be compared to optimised 0.79 (IQR 0.67–1.13) and 1.33 (IQR 1.1–1.74).
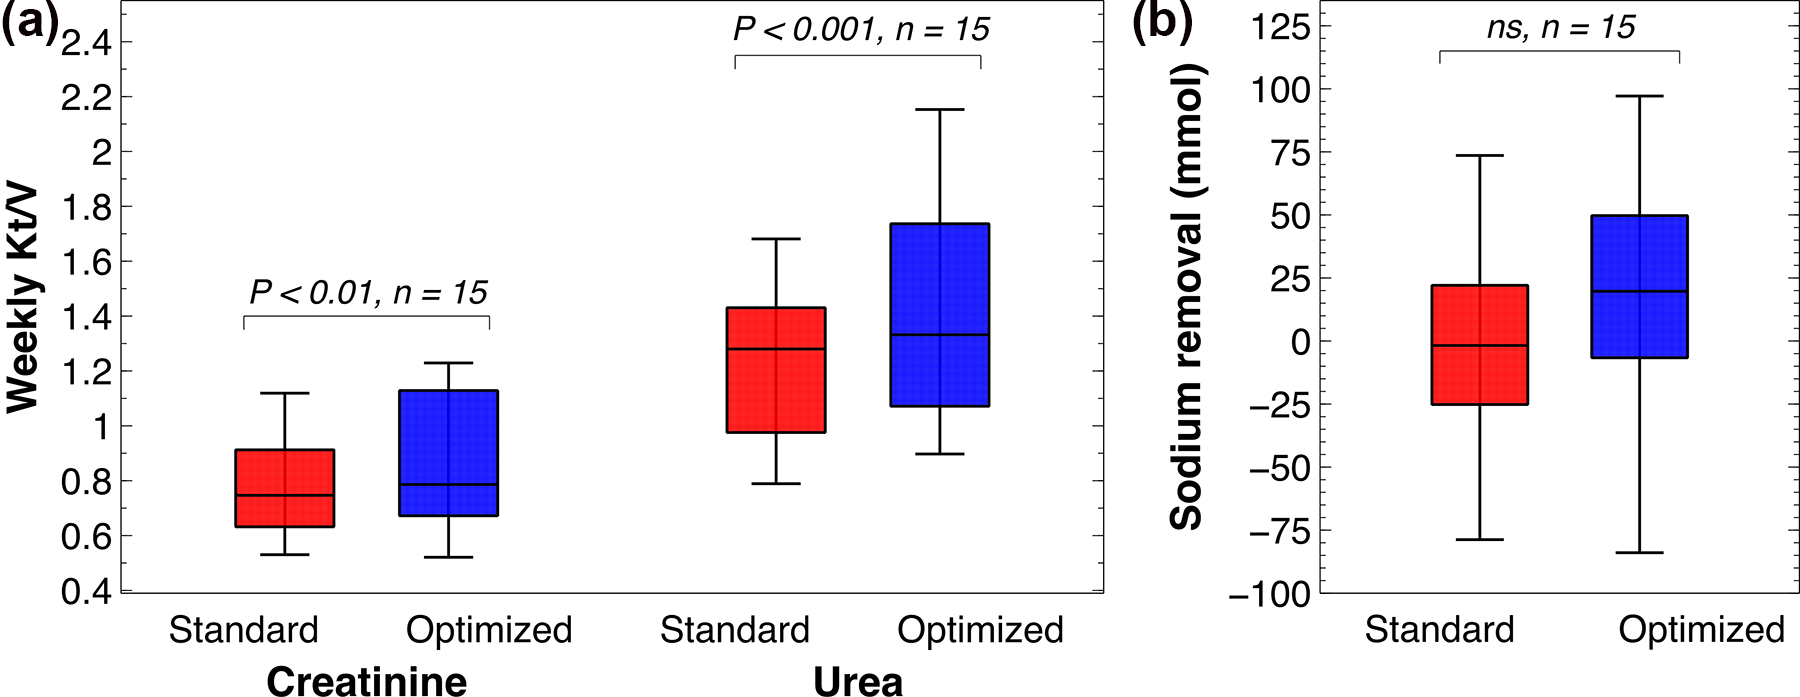
Weekly Kt/V creatinine and urea and sodium removal. (a) Significantly improved weekly Kt/V during optimised regimens, p < 0.01 (creatinine) and p < 0.001 (urea). Optimised regimens weekly Kt/V of creatinine median 0.79 (IQR 0.67–1.13) and urea 1.33 (IQR 1.07–1.74) while standard regimes creatinine weekly Kt/V were 0.75 (IQR 0.63–0.91) and urea 1.28 (IQR 0.98–1.43). (b) No statistical difference in sodium removal between interventions was observed, p > 0.05. Standard regimens induced removal of −2 mmol (IQR −25 to 22) and optimised interventions 20 mmol (IQR −7 to 50).
Sodium removal
Standard intervention sodium removal median was −2 mmol (IQR −25 to 22) and 20 mmol (IQR −7 to 50) for optimised interventions (see Figure 4(b)). No significant difference in removal of sodium was observed.
Adverse events
One patient suffered from an episode of drain pain during an optimised regime. After a short drain pause, the patient was able to finish the treatment with no further discomfort or complications and was included in the study analysis. There were no serious adverse events during the trial.
TPM simulations
The design and dwell times of the optimised regimen were determined by pre-study TPM simulations 19 (see Supplemental Table 1 and 2 for parameters). Separate outcomes from the clearance and ultrafiltration cycles are presented in Supplemental Table 3. After the trial was finished, simulations were modified by increasing the plasma oncotic pressure from 22 mmHg to 28 mmHg, and the lymphatic flow rate from 0.3 mL/min to 0.4 mL/min, and the plasma urea concentration from 20 mmol/L to 27 mmol/L, and lowering the UF coefficient from 0.074 mL/min/mmHg to 0.040 mL/min/mmHg and slightly lowering the A 0/▵x parameter (Supplemental Table 2). After these modifications, the simulations matched the results for the reference (standard) treatment, but not the optimised regimen in which similar outcomes were achieved, with the glucose absorption being lower than the reference treatment. To achieve the observed benefits in UF and small solute clearances (and the higher glucose absorption) for the optimised treatment, it was necessary to increase small solute diffusion capacities and the hydraulic conductance by 27%, in addition to lowering the lymphatic flow rate back to 0.3 mL/min. With these alterations, the simulation outcomes closely matched those in the present study (Supplemental Table 4).
Discussion
This is the first clinical pilot trial of optimised APD regimens proposed by Öberg and Rippe. Optimised regimens refer to the concept of targeting ultrafiltration and small solute removal separately by prescribing APD treatments with altering dwells components and durations. 22 In this study, we evaluated a prescription combining ultra-low and high glucose cycles (clearance and UF cycles) according to a pre-study computer-aided prescription on the basis of the extended TPM. 19 Simulations predicted a reduction in absorbed glucose of 10 g during conditions in which the amount of UF and small solute clearance is the same in both regimes. 19 These predicted results were not replicated in clinic under present conditions, as no significant difference in glucose absorption was observed among the intervention types. However, despite shorter treatments (8 h vs. 9 h) and the fact that very low glucose fluids (5 mmol/L) were used for nearly half of the treatment time, we found significantly improved UF volume and small solute clearance during optimised interventions. There were no differences in sodium removal which may indicate lower sodium removal per L UF in optimised regimes, see also Demetriou et al. 23 While dwell times were not directly measured, dwell times estimated from drain- and fill rates were markedly reduced in the optimised treatment (155 min vs. 376 min during standard regimes). Thus, optimised treatments resulted in more UF and small solute transport while utilising only half of the dwell time compared to standard regimes, which probably reflects that clearances are higher at higher dialysate flow rates (DFRs) 19,23 and that significant transport also occurs during filling and draining. The deviation between predicted 20 and observed outcomes could either be due to intrinsic limitations in the extended TPM or simply be due to the fact that sample sizes are very small in the present trial, which, in combination with a smaller than expected effect size, may impair the ability to find significant differences. However, unexpectedly, there were significant improvements in UF and small solute clearances (including glucose) for the optimised treatments that were not consistent with pre-study simulations. Post-study simulations with the TPM revealed that these observed improvements could only be achieved if the small solute diffusion capacities and hydraulic conductance were both increased by nearly 30% (see Supplementary Material). Such an increase would be consistent with a ‘stirring effect’ 19 or possibly a vasodilation effect, 24 arising due to the higher dialysate flow rate used in the optimised regimen (which also leads to shorter dwell times). Also, the fact that the lymphatic flow rate needed to be set lower in the optimised regimen may possibly reflect a lower intra-peritoneal pressure in this treatment, 25 something that may be expected during the low-glucose dwells.
UF volume and Kt/V of creatinine and urea were significantly improved. As over-hydration and insufficient small solute removal impair life quality and increase morbidity among PD users, these features of optimised regimens could be of great clinical interest. 26,27 Moreover, the UF efficiency, that is, UF volume per absorbed glucose (mL/g) was significantly improved, as 14 out of 15 study participants increased their UF efficiency during optimised regimens. Thus, it may be of interest to use this parameter in future prospective studies instead of glucose absorption. The present increase in UF efficacy may be due to the use of higher glucose concentrations in the optimised regimens, which have been shown to increase UF efficacy. 28 Despite use of 2.27% glucose fluids for more than half the treatment time during optimised interventions, systematic glucose load did not increase compared to the 1.36% standard regimen. Hence, improved UF and clearance were not achieved on expense of increased systematic glucose load.
The UF dwells in the optimised regime induce extensive glucose membrane exposure, but, they only constitute about half of the 8 h treatment time, while the clearance dwells have similar composition of electrolytes and glucose to that in the extracellular fluid. Impact of low glucose fluid on the peritoneal membrane is unknown, but presumably such fluids are well-tolerated by peritoneal tissues as there is no exposure of glucose or it’s degradation products and no hyperosmolar stress. Whether the summative membrane effects induced by optimised regimens exceed stress induced by 9 h of lower yet still non-physiological glucose concentrations remain unknown and should be further investigated. In any case, the present treatments did give acceptable UF and small-solute transport in the majority of included patients despite being 1 h shorter than the comparator (standard) treatment.
Limitations
The present study has several limitations. Due to the quite complex study protocol, including multiple blood and dialysis fluid sampling, several patients had to be excluded from the outcome analysis. The limited sample size will inflate type 2 error rates, meaning that non-significant results should be interpreted carefully. The concept of optimised APD 19,22 refers to mathematically optimised multi-cycle regimens tailored to the individual patient’s needs (e.g. in terms of UF target or small solute transport). However, in this study, only a single regime for all patients was tested against a simpler reference regime. In future larger studies, the full concept should be tested. The fact that this is a single-centre study also means that the external validity of the results could be questioned and no general conclusions can be drawn. Nevertheless, the study findings are interesting and provide a basis for a larger clinical study.
Conclusion
To our knowledge, this is the first prospective clinical study using ultra-low 0.1% glucose fluid in an APD prescription. Apart from one reported episode of drain pain, no adverse events occurred, and, despite using ultra-low glucose fluid for about 40% of the treatment time, all patients except two achieved a higher UF on the novel regimen compared to the reference regime. Optimised treatments were feasible and should be further evaluated in larger study populations.
Supplemental material
Supplemental Material, sj-docx-1-ptd-10.1177_08968608211069232 - Optimised versus standard automated peritoneal dialysis regimens pilot study (OptiStAR): A randomised controlled crossover trial
Supplemental Material, sj-docx-1-ptd-10.1177_08968608211069232 for Optimised versus standard automated peritoneal dialysis regimens pilot study (OptiStAR): A randomised controlled crossover trial by Karin Bergling, Javier de Arteaga, Fabián Ledesma and Carl M Öberg in Peritoneal Dialysis International
Footnotes
Acknowledgements
The research team would like to thank colleagues Graciela Gonzales at the Department of Nephrology and Gabriela Garay at the Department of Laboratory Medicine at the Hospital Privado Universitario de Còrdoba for valuable assistance and study conduct. We would also like to thank our colleagues Magdalena Alvarez and Daniela Stoppa for study coordination.
Author contributions
KB, JdA and CAÖ researched literature and conceived the study. KB, FL, JdA and CAÖ was involved in protocol development and data analysis. FL performed patient treatments. KB wrote the first draft of the manuscript. All authors reviewed and edited the manuscript and approved the final version of the manuscript
Declaration of conflicting interests
The author(s) declared the following potential conflicts of interest with respect to the research, authorship, and/or publication of this article: CMÖ has worked as a consultant and received speakers’ honoraria from Baxter Healthcare Corporation. KB has pursued a master thesis project in collaboration with Gambro Lundia AB (part of Baxter Healthcare Corporation).
Ethical approval
The study is approved by the regional ethical vetting board in Córdoba, Argentina (Health ministry document registry number 3788).
Funding
The author(s) disclosed receipt of the following financial support for the research, authorship, and/or publication of this article: This study was supported by a grant by Baxter Healthcare, Thure Carlsson Foundation and Region Skåne (Medical Training and Research Agreement (Avtal om Läkarutbildning och Forskning)).
Informed consent to participate
Written informed consent was obtained from all subjects before the study.
Informed consent to publish
Written informed consent was obtained from the patient(s) for their anonymised information to be published in this article.
Trial registration
The study was registered at US National Library of Medicine clinical trial registry (ID NCT04017572).
Supplemental material
Supplemental material for this article is available online.
References
Supplementary Material
Please find the following supplemental material available below.
For Open Access articles published under a Creative Commons License, all supplemental material carries the same license as the article it is associated with.
For non-Open Access articles published, all supplemental material carries a non-exclusive license, and permission requests for re-use of supplemental material or any part of supplemental material shall be sent directly to the copyright owner as specified in the copyright notice associated with the article.