
Abstract
Introduction:
Unwanted glucose absorption during peritoneal dialysis (PD) remains a clinical challenge, especially in diabetic patients. Recent experimental data indicated that inhibitors of the sodium and glucose co-transporter (SGLT)-2 could act to reduce glucose uptake during PD, which raises the question of whether glucose absorption may also occur via intracellular or trans-cellular pathways.
Methods:
We performed PD in anesthetized Sprague-Dawley rats using a fill volume of 20 mL with either 1.5% glucose fluid or 4.25% glucose fluid for 120 min dwell time to evaluate the effects of SGLT2 inhibition by empagliflozin on peritoneal water and solute transport. To assess the diffusion capacity of glucose, we developed a modified equation to measure small solute diffusion capacity, taking convective- and free water transport into account.
Results:
SGLT2 inhibition markedly increased the urinary excretion of glucose and lowered plasma glucose after PD compared to sham groups. Glucose absorption for 1.5% glucose was 165 mg 95% CI (145–178) in sham animals and 157 mg 95% CI (137–172) for empagliflozin-treated animals. For 4.25% glucose, absorption of glucose was 474 mg 95% CI (425–494) and 472 mg 95% CI (420–506) for sham and empagliflozin groups, respectively. No significant changes in the transport of sodium or water across the peritoneal barrier could be detected.
Conclusion:
We could not confirm recent findings that SGLT2 inhibition reduced glucose absorption and increased osmotic water transport during experimental PD.
Introduction
Glucose remains the prototypic osmotic agent in peritoneal dialysis (PD), but its use leads to considerable glucose absorption during the treatment, accounting for 20% of total daily energy intake 1 in PD patients. Recent results by Xue et al. indicate that about half of the PD patients develop a glucose disorder, which may significantly increase mortality. 2 Several techniques have been proposed to reduce unwanted systemic glucose absorption during PD, such as icodextrin 3 or by altering the prescription. 4 –6
Glucose is impermeable across cell membranes, and the entry of glucose into cells occurs via a family of hexose transporters: sodium and glucose co-transporters (SGLT)-1 and 2, allowing secondary active glucose transport (independent of glucose gradient), and facultative glucose transporters (GLUTs), allowing facilitated diffusion (dependent on glucose gradient). SGLT2 is present in the early proximal tubule where co-transport of glucose and sodium (2 Na+ : 1 glucose) occurs against the glucose gradient to allow effective glucose reabsorption. SGLT1 transporters account for almost all sodium-dependent glucose uptake in the small intestine (1 Na+ : 1 glucose) but play only a minor role in renal glucose handling.
It is widely accepted that glucose is chiefly transported via paracellular pathways during PD. However, previous studies have demonstrated some SGLT and GLUT subtypes expressed in human peritoneal mesothelial cells 7 and rat peritoneal mesothelial cells. 8 The presence of these transporters in peritoneal tissues implies that at least some glucose is transported into cells or possibly across cells. Indeed, recent data have indicated that significant glucose transport via SGLT2 may actually occur during experimental PD and that SGLT2 inhibitors reduce the glucose uptake and increase ultrafiltration through the peritoneum in rats receiving PD. 9 Here, we performed experimental studies in a rat model of PD with or without administration of empagliflozin, a potent and selective inhibitor of SGLT2, to test the hypothesis that SGLT2 inhibition significantly reduces glucose absorption and/or glucose diffusion capacity during experimental PD.
Methods
Experimental PD was performed in 9 weeks old Sprague-Dawley rats weighing 295 g (281–309) (n = 32) divided into four groups: sham 4.25% group (n = 8), empagliflozin 4.25% group (n = 8), sham 1.5% group (n = 8) and empagliflozin 1.5% group (n = 8) using a fill volume of 20 mL and a dwell time of 120 min (Figure 1). The Ethics Committee for Animal Research at Lund University approved the current study, and the animals were treated in accordance with the guidelines of the National Institutes of Health for Care and Use of Laboratory animals. For induction, the animals were placed in a covered glass container to which a continuous supply of 5% isoflurane in air (Isoban, Abbot Stockholm, Sweden) was administered. After induction, the animal was removed from the container, and anaesthesia was maintained with 1.6–1.8% isoflurane in air delivered via a mask. After tracheostomy, the animals were connected to a ventilator (Ugo Basile; Biological Research Apparatus, Comerio, Italy) and ventilated in a volume-controlled mode using a positive end-expiratory pressure of 4-cm H2O. Body temperature was kept between 37.1°C and 37.3°C via a feedback-controlled heating pad. End-tidal pCO2 was monitored continuously and kept between 4.8 kPa and 5.5 kPa (Capstar-100, CWE, Ardmore, PA, USA). The left femoral artery was cannulated for measurement of mean arterial pressure (MAP) and heart rate and to obtain blood samples (95 µL) for measurement of glucose, creatinine, urea, electrolytes, haemoglobin and haematocrit (I-STAT, Abbott, Abbott Park, IL, USA). The right femoral vein was cannulated and used for continuous saline infusion of 50 µL min−1. The right internal jugular vein was cannulated for drug infusion. Access to the peritoneal cavity was established percutaneously via a multiholed silastic catheter (Venflon, BOC Ohmeda AB, Helsingborg, Sweden) (outer diameter 1.7 mm) secured to the skin using cyanoacrylate (Histoacryl, B. Braun Surgical, Rubi, Spain). Urine was collected in a vial from the start of PD until the end of the PD dwell, and urinary glucose concentration was measured (I-STAT; Abbott). After 120 min, the dialysate was recovered from the peritoneal cavity, first by using a syringe, and thereafter carefully retrieving the rest of the fluid using pre-weighed gauze tissues. All PD solutions were pre-warmed to 37°C before use. After the experiment, animals were euthanized with an intravenous bolus injection of potassium chloride. Prior to dialysate sampling, 1 mL of the dialysate was flushed back and forth several times.
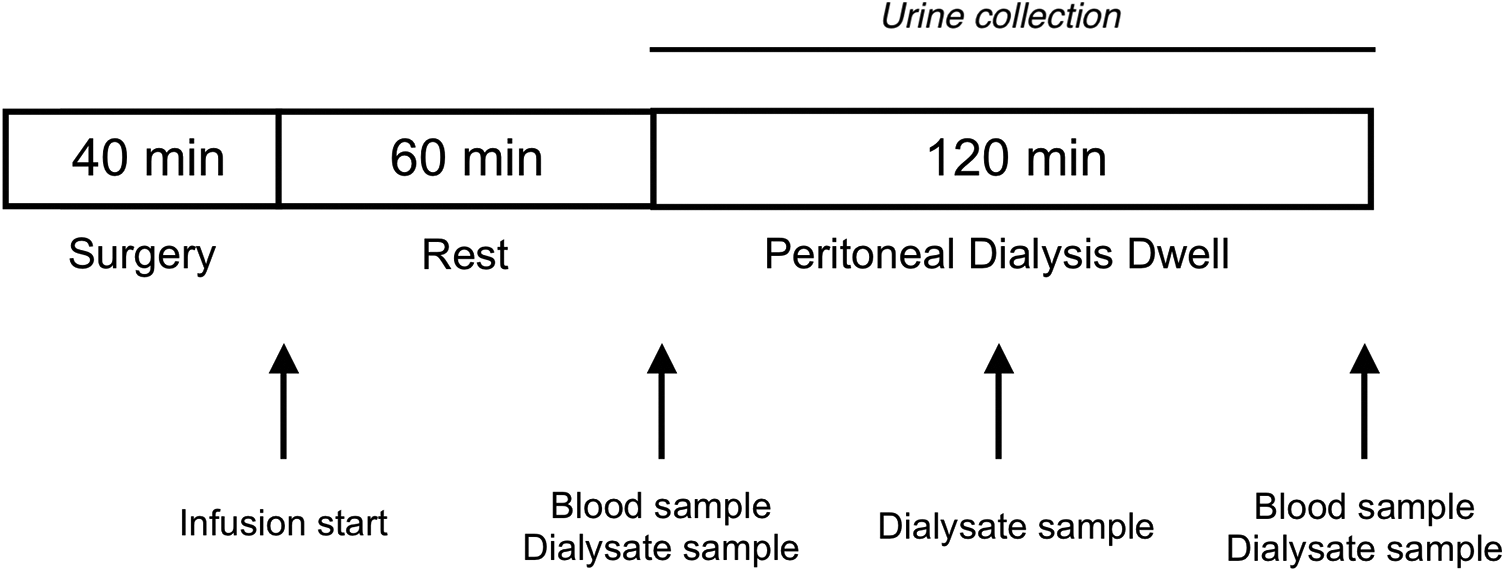
Outline of the experimental setup. Experimental peritoneal dialysis was performed in anesthetized Sprague-Dawley rats using a fill volume of 20 mL with either 1.5% glucose fluid or 4.25% glucose fluid for 120 min. Blood samples were obtained before and after dialysis. Sampling of the dialysate occurred at 0, 60 and 120 min.
Experimental protocol
The study consisted of four groups of animals: a sham 4.25% group (n = 8), an empagliflozin 4.25% group (n = 8), a sham 1.5% group (n = 8) and an empagliflozin 1.5% group (n = 8). In both empagliflozin groups, empagliflozin 0.8 µg min−1 kg−1 (Merck, Darmstadt, Germany) 0.01 mg mL−1 in 1% DMSO/99% saline was given as an intravenous infusion (8 µL min−1 kg−1). Sham groups received 1% DMSO/99% NaCl without empagliflozin (8 µL min−1 kg−1). In all animals, a blood sample was collected after 60 min of infusion time followed by administration of 20 mL of 4.25% or 1.5% PD fluid (BicaVera, Fresenius Medical Care, Frankfurt, Germany). All animals received maintenance fluid (50 µL min−1) saline containing a small amount of 1 mg mL−1 of creatinine (allowing plasma and dialysate creatinine levels to be within the range of measurement for the iSTAT1 instrument). Sampling of dialysis fluid was performed before and immediately after instillation of PD fluid and after 60 and 120 min. After 120-min dwell time, the dialysate was drained after which a final blood sample was obtained. During dialysis, urine was collected and glucose concentration was measured (I-STAT; Abbott). Dialysate-to-plasma clearance was calculated as the average solute absorption rate (mmol min−1) divided by the average dialysate concentration (mmol L−1). Plasma-to-dialysate clearance was calculated as the average solute removal rate (mmol min−1) divided by the average plasma concentration (mmol L−1). In four separate animals, empagliflozin was given intra-peritoneally directly in the dialysate (1.5% glucose) to obtain an estimated concentration of 2 µmol L−1 (approximately 10-fold higher concentration than plasma concentrations in the above experiments).
Isovolumetric glucose diffusion capacity
The conservation of the intra-peritoneal mass of glucose transported to/from the peritoneal cavity can be expressed by the continuity equation
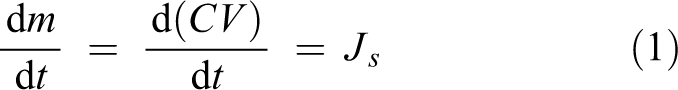
Thus, a net glucose and/or solvent flux to/from the peritoneal cavity may result in changes in the mass (m) of glucose in the intraperitoneal cavity. Here, Js is the net glucose flow (mmol min−1) into the peritoneal cavity having a volume V (L) and a solute concentration C (mmol L−1). Hence, a solute flow is positive if it leads to an increase in intra-peritoneal solute concentration. Assuming diffusion as the only transport mechanism (Fick’s law
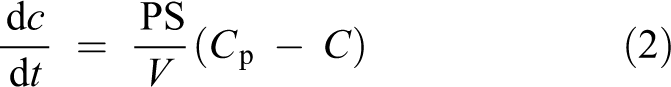
Solving the initial value problem C(0) = C0 where C0 is the initial solute concentration in the peritoneal cavity gives the unique solution
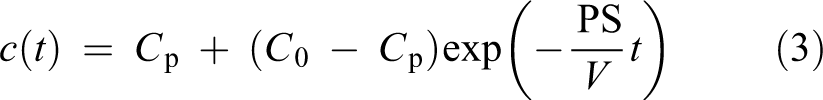
Rearranging the solution, the isovolumetric diffusion capacity (PS) can be calculated as follows
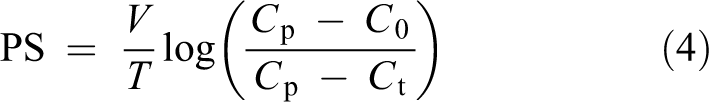
Here, Ct denotes the solute (glucose) concentration at time T. This equation for PS was derived by Henderson and Nolph 10 and has been widely applied to approximate small solute diffusion capacity in experimental PD. The constant volume V was herein approximated as the average intra-peritoneal volume (see also the work of Morelle et al. 11 ). For situations where convective- and free water transport is negligible (isovolumetric state), this equation should perform well.
Isocratic glucose diffusion capacity
A limitation with isovolumetric diffusion capacities is that convective solute transport and free water transport are not taken into account. To expand the Henderson–Nolph model, the simplest scenario is that of a constant (isocratic) ultrafiltration (UF) rate Jv (mL min−1), that is,
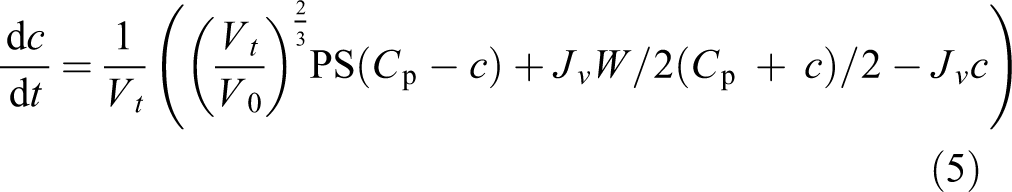
Here, the convective hindrance factor W was set to unity, which is approximately true for small solutes like glucose. The initial value problem c(0) = C0 was solved with a fourth-order Runge–Kutta algorithm. The isocratic diffusion capacity was estimated using a root-finding algorithm (uniroot).
Three-pore model analysis
Simulations of transmembrane transport during 120 min were performed using the well-established three-pore model (TPM), solved using a Runge–Kutta fourth-order algorithm. All TPM parameters and initial values are given in Online Supplemental Table S1. In accordance with the cube–square law, 12 the ultrafiltration capacity (LpS, mL min−1 mmHg−1) and diffusion capacity values of glucose, urea, sodium and albumin were scaled continuously during simulations. Observed kinetics of intraperitoneal volume and glucose concentration of the study animals were used as input in non-linear least square regression analysis (GSL version 2.6).
Statistical methods
Values are given as median interquartile range (IQR) unless otherwise stated. Non-parametric two-way analysis of variance (ARTool version 0.10.7) was conducted to compare the main effects of empagliflozin treatment (empagliflozin vs. control) and glucose strength (1.5% glucose vs. 4.25% glucose) and the interaction effect empagliflozin × glucose strength on the study outcomes. The values of p below 0.05 were considered significant. A pre-experimental power analysis based on previous experiments in our group showed that a group size of eight animals has 80% power to detect a difference in glucose absorption between the EMPA group and the SHAM group of 78 mg (Cohen’s d = 1.5) for 4.25% glucose. Statistical calculations were performed using R for mac version 3.6.3.
Results
Intravenous administration of empagliflozin evoked marked glucosuria and increased urine volume (Table 1). Also, plasma glucose was lower and plasma creatinine higher after PD in groups receiving empagliflozin (Table 1). There was no difference in plasma glucose before PD (see Online Supplemental Table S2). Glucose absorption for 1.5% glucose was 165 mg 95% CI (145–178) in controls and 157 mg 95% CI (137–172) for empagliflozin-treated animals. For 4.25% glucose, absorption of glucose was 474 mg 95% CI (425–494) and 472 mg 95% CI (420–506) for control and empagliflozin groups, respectively. Two-way analysis of variance showed that empagliflozin did not have a significant treatment effect on glucose diffusion capacity (p = 0.72, η2 = 5 ×·10−3) (Figure 2(a)), glucose clearance (p = 0.67, η2 = 7 ×·10−3) (Figure 2(b)), glucose absorption (p = 0.35, η2 = 0.03) or D/D0 glucose (Table 2). For 1.5% glucose groups, diffusion capacity for glucose was 167 µL min−1 95% CI (144–180) for the EMPA group and 178 µL min−1 95% CI (146–198) for controls. For 4.25% groups, diffusion capacities were 181 µL min−1 95% CI (164–191) and 181 µL min−1 95% CI (166–195) for the EMPA group and controls, respectively. For Henderson–Nolph type diffusion capacities, the effect of glucose strength (4.25% vs. 1.5%) was expectedly highly significant (p < 0.001, η2 = 0.73) due to the higher ultrafiltration rate and free water transport in these groups but non-significant for empagliflozin treatment (p = 0.80, η2 = 0.05) and interaction between glucose strength and empagliflozin treatment (p = 0.66, η2 = 0.03) (Table 2). In four separate animals, empagliflozin was given intra-peritoneally directly in the dialysate (1.5% glucose). In these animals, the measured glucose absorption was 168 mg (157–170) and D120/D0 glucose was 0.41 (0.40–0.43).
Effects of empagliflozin on urinary output and glucose excretion, plasma creatinine and plasma glucose.a
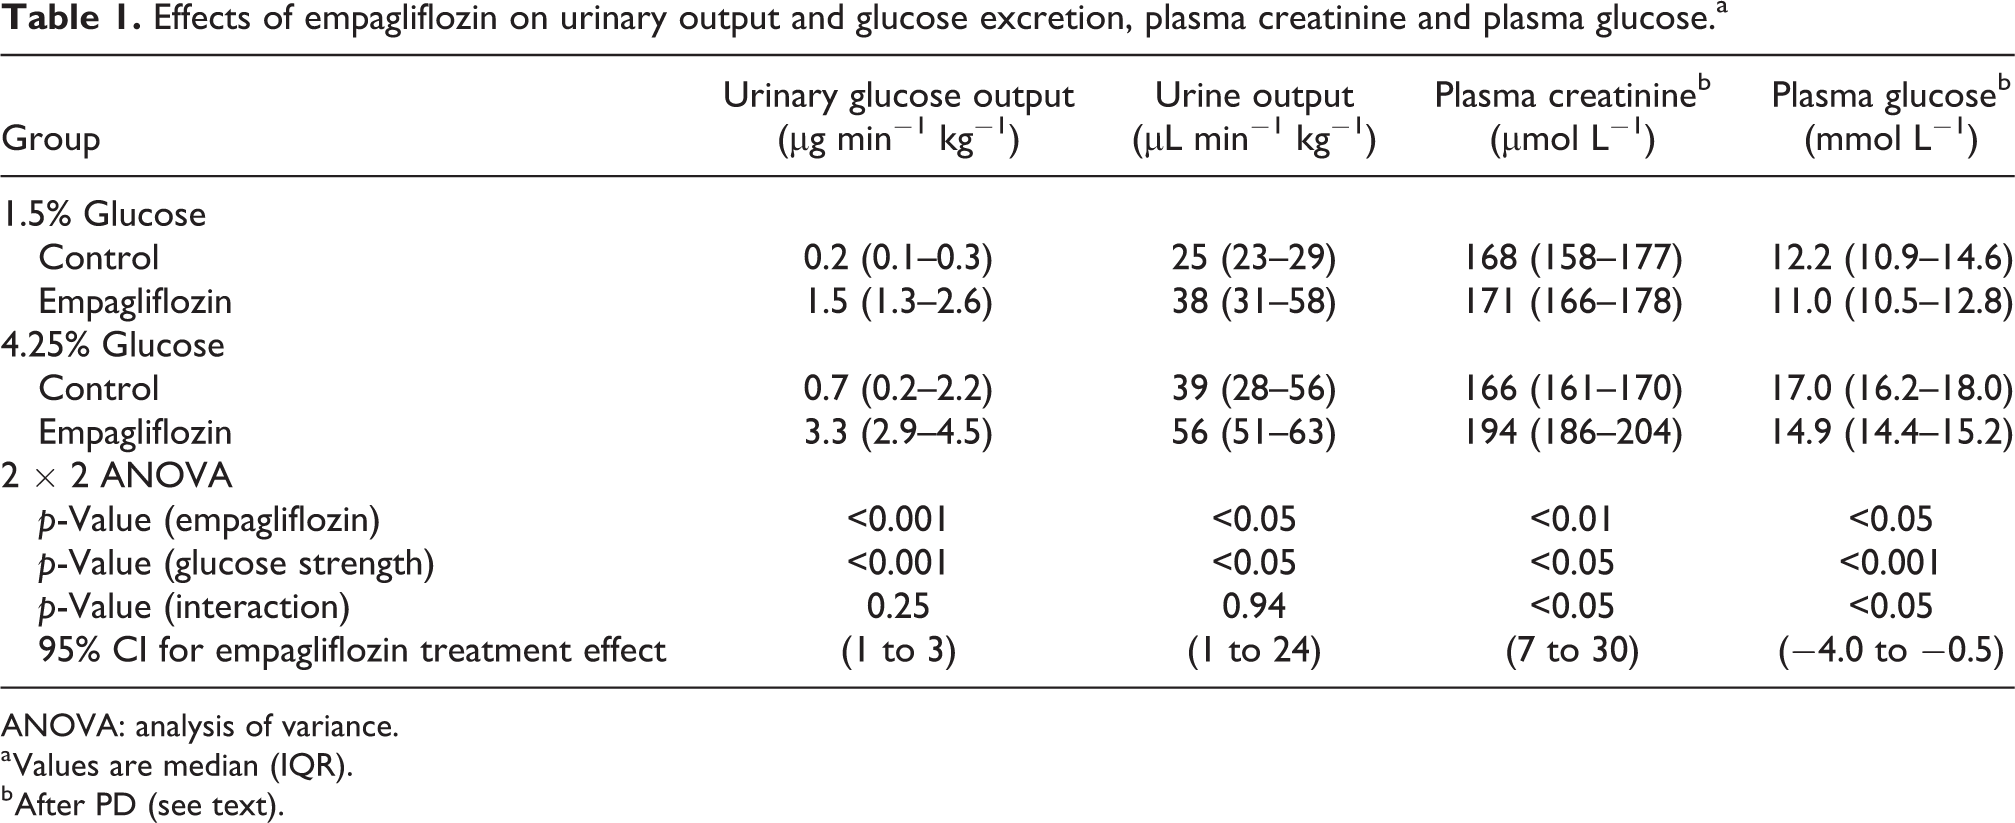
ANOVA: analysis of variance.
a Values are median (IQR).
b After PD (see text).
Glucose transport parameters.a
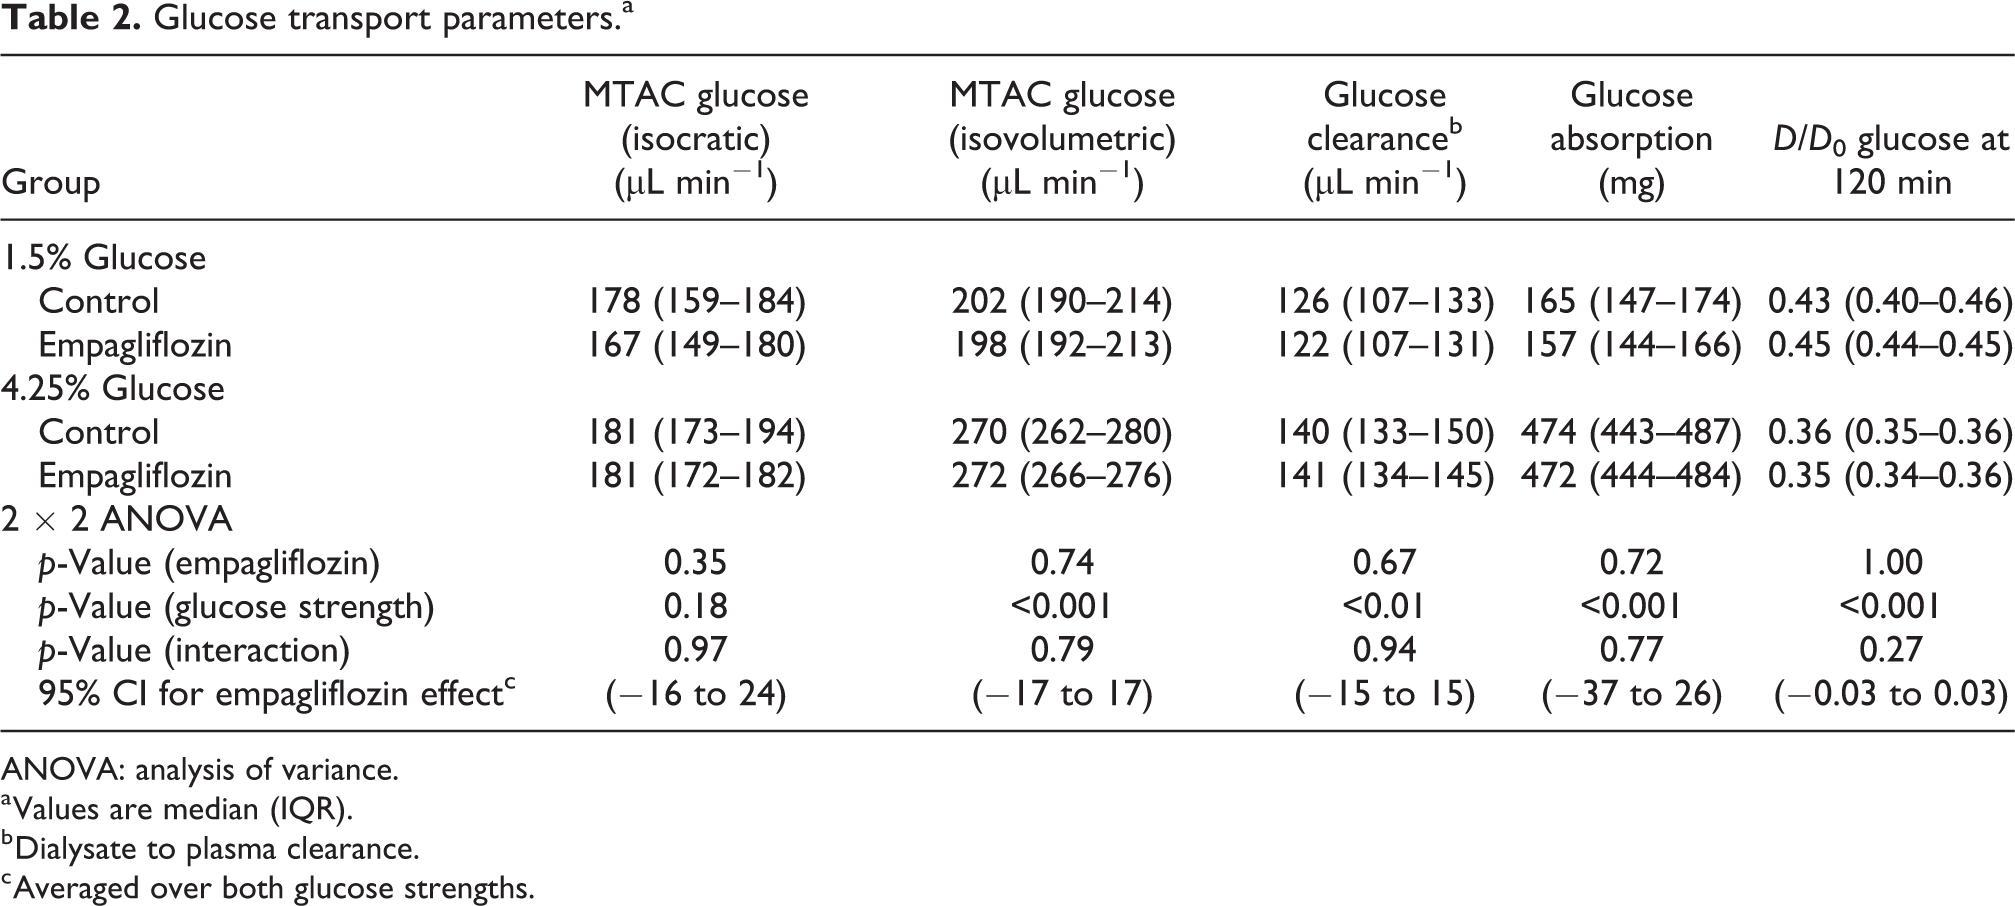
ANOVA: analysis of variance.
a Values are median (IQR).
b Dialysate to plasma clearance.
c Averaged over both glucose strengths.
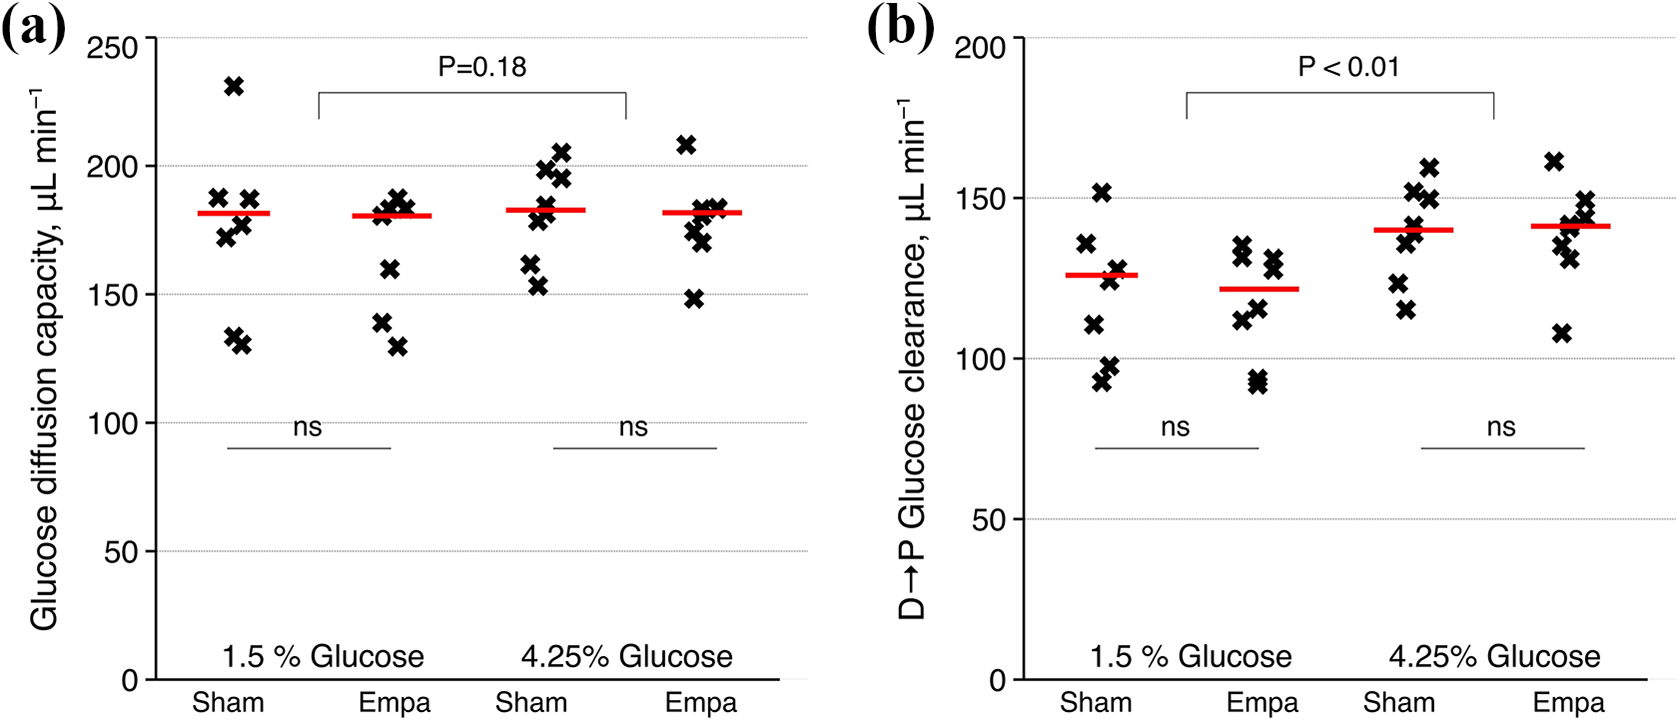
Glucose diffusion capacity (a) and dialysate to plasma glucose clearance (b) (µL min−1) for treated and untreated animals with 1.5% glucose and 4.25% glucose.
UF and sodium transport
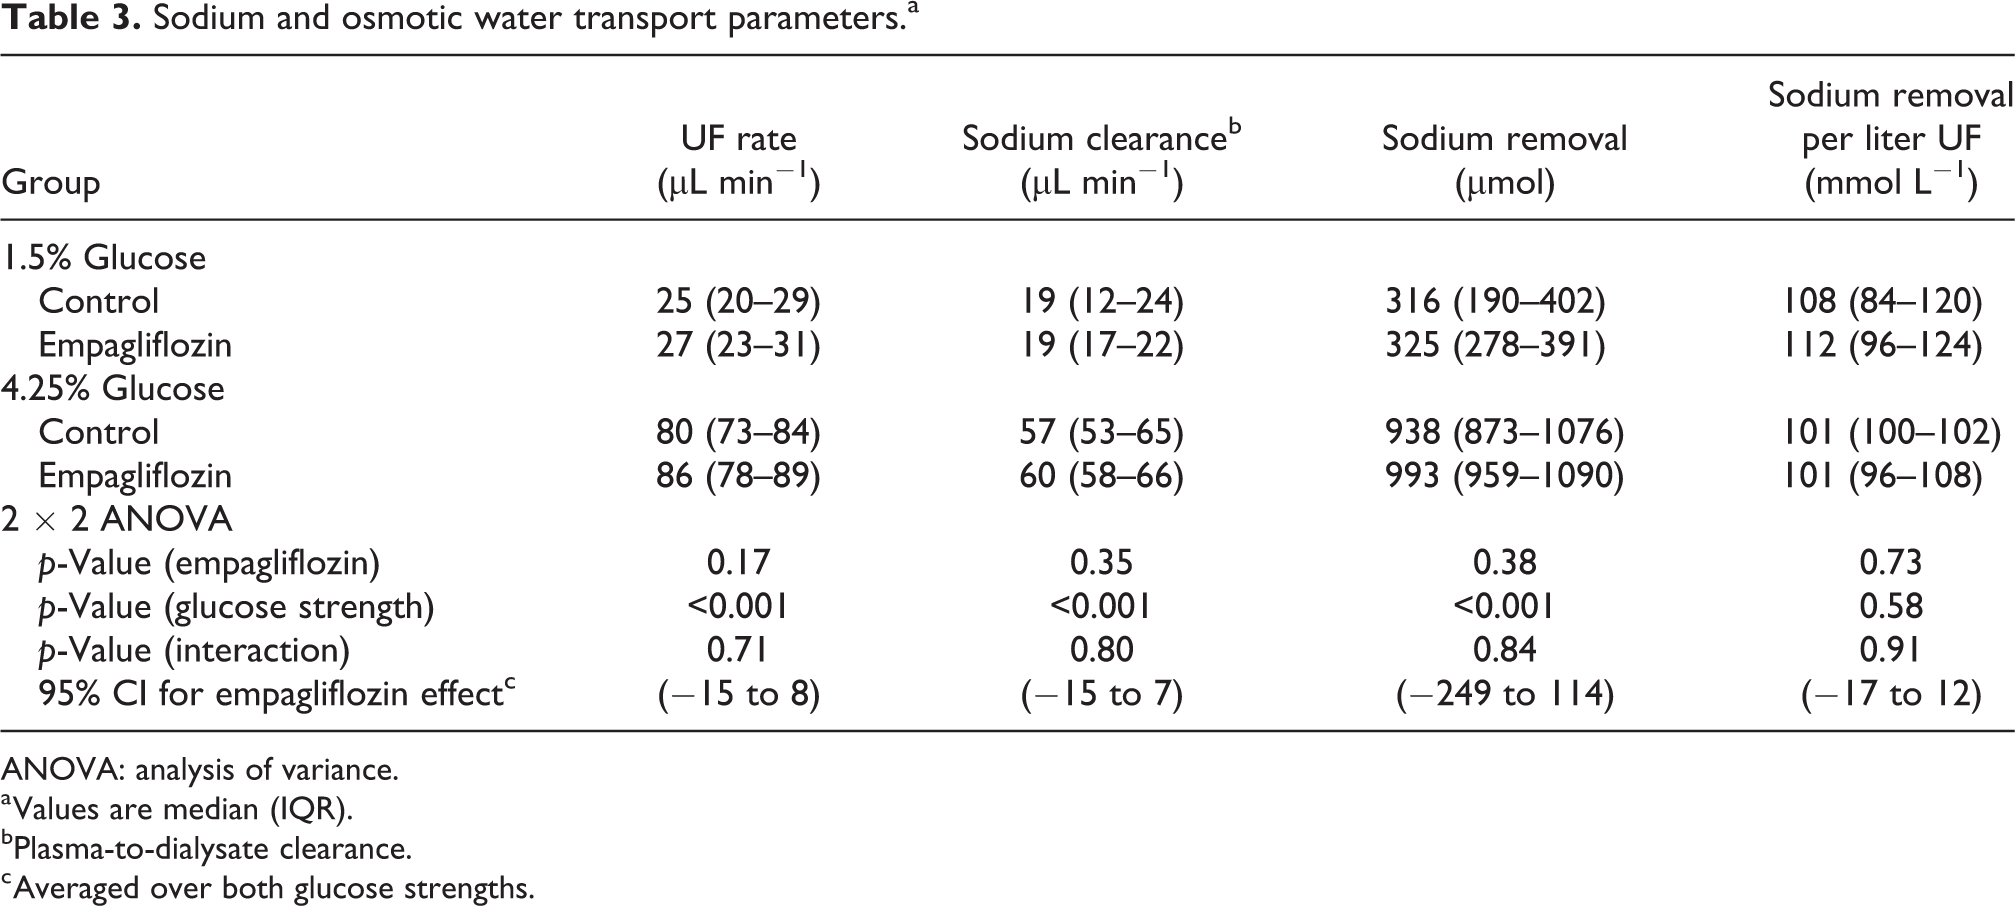
We found no significant treatment effect of empagliflozin on osmotic water transport (p = 0.17, η2 = 0.02) or sodium clearance (p = 0.35, η2 = 0.04) (Table 3). In the 1.5% glucose groups, net sodium removal was 325 µmol (112 mmol per L UF) for EMPA versus 316 µmol (108 mmol per L UF) for control animals (p = 0.73). For 4.25% groups, sodium removal was 993 µmol (941–1072) (101 mmol per L UF) for EMPA versus 938 µmol (873–1076) (101 mmol per L UF) for control animals (p = 0.82). The amount of UF per gram glucose absorbed did not differ between groups, being 19 mL g−1 95% CI (14–29) for 1.5% glucose and 21 mL g−1 95% CI (19–25) for 4.25% glucose.
Sodium and osmotic water transport parameters.a
ANOVA: analysis of variance.
a Values are median (IQR).
bPlasma-to-dialysate clearance.
c Averaged over both glucose strengths.
TPM analysis
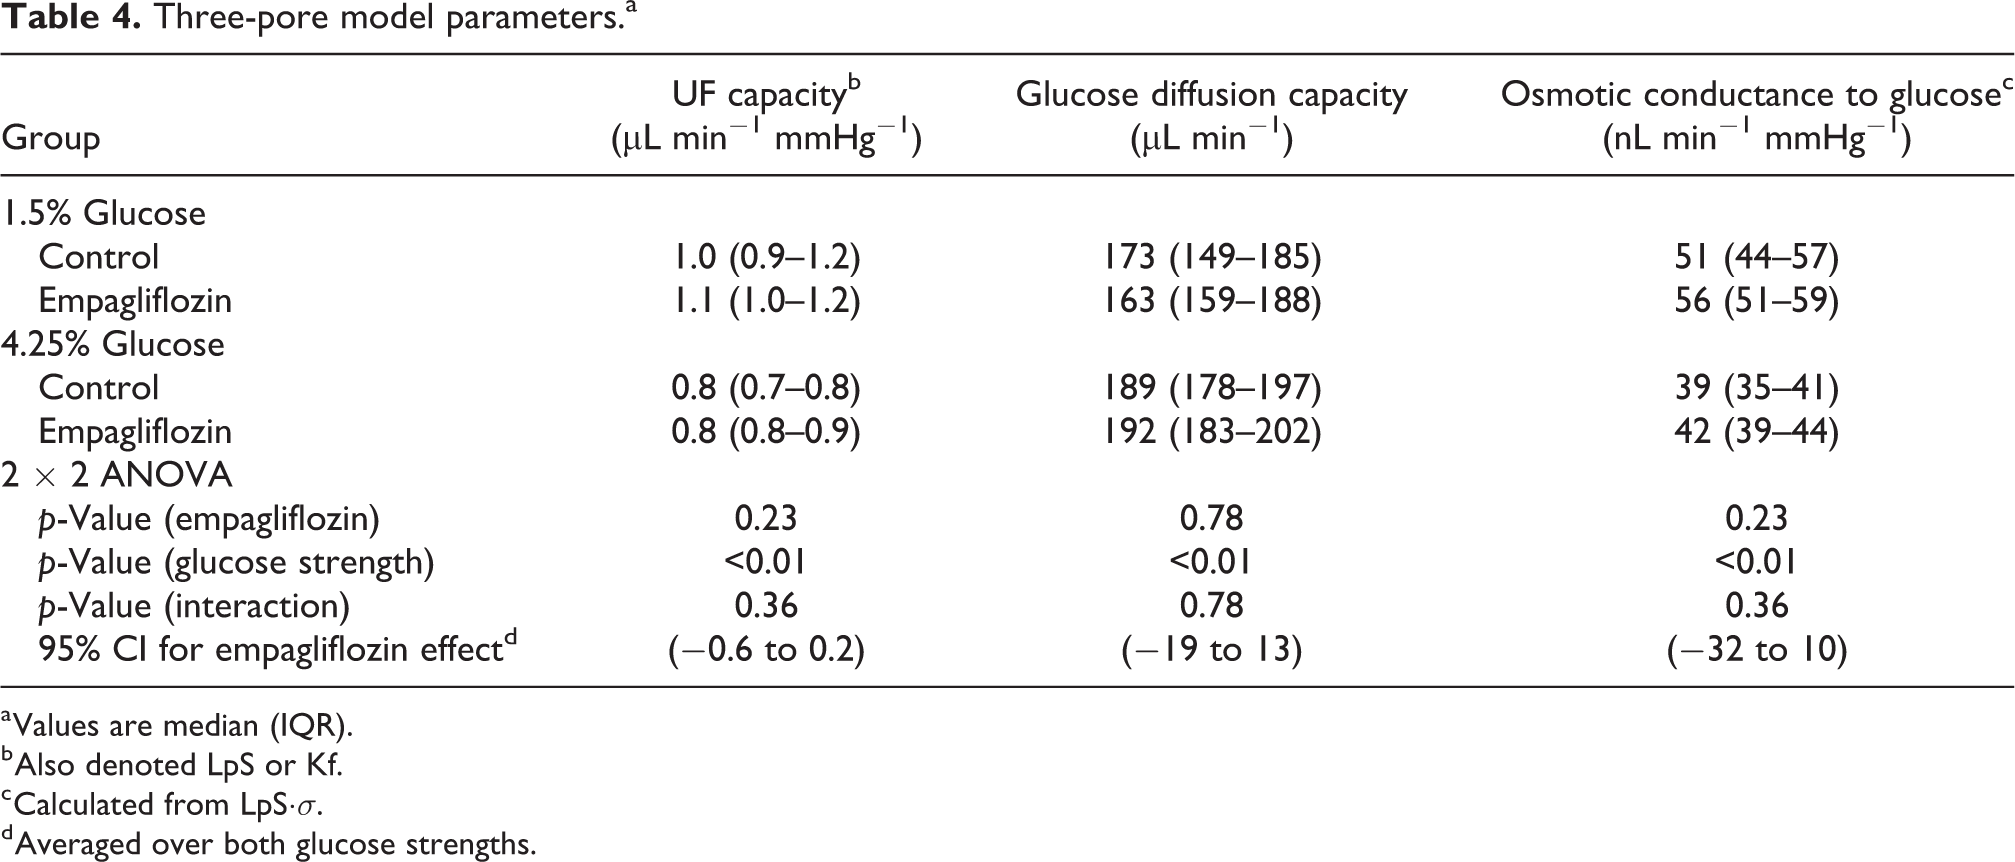
The classic TPM was applied (see Online Supplemental Table S1), and a two-step non-linear regression was performed to assess UF capacity (LpS) and glucose diffusion capacity. The results of the analysis are given in Table 4. In contrast to the isocratic glucose diffusion capacity, TPM glucose diffusion capacity was significantly lower (p < 0.01) for the 1.5% glucose than the high glucose concentration with a 95% CI (−39 to −7 µL min−1) (averaged over both control- and empagliflozin-treated animals). Also, the UF capacity was higher for the 1.5% glucose groups. Bland–Altman analysis of TPM versus isocratic glucose diffusion capacity revealed an excellent linear agreement between the methods (R2 = 0.70) (Figure 3(a)) with a tendency of slightly smaller isocratic PS values (Figure 3(b)).
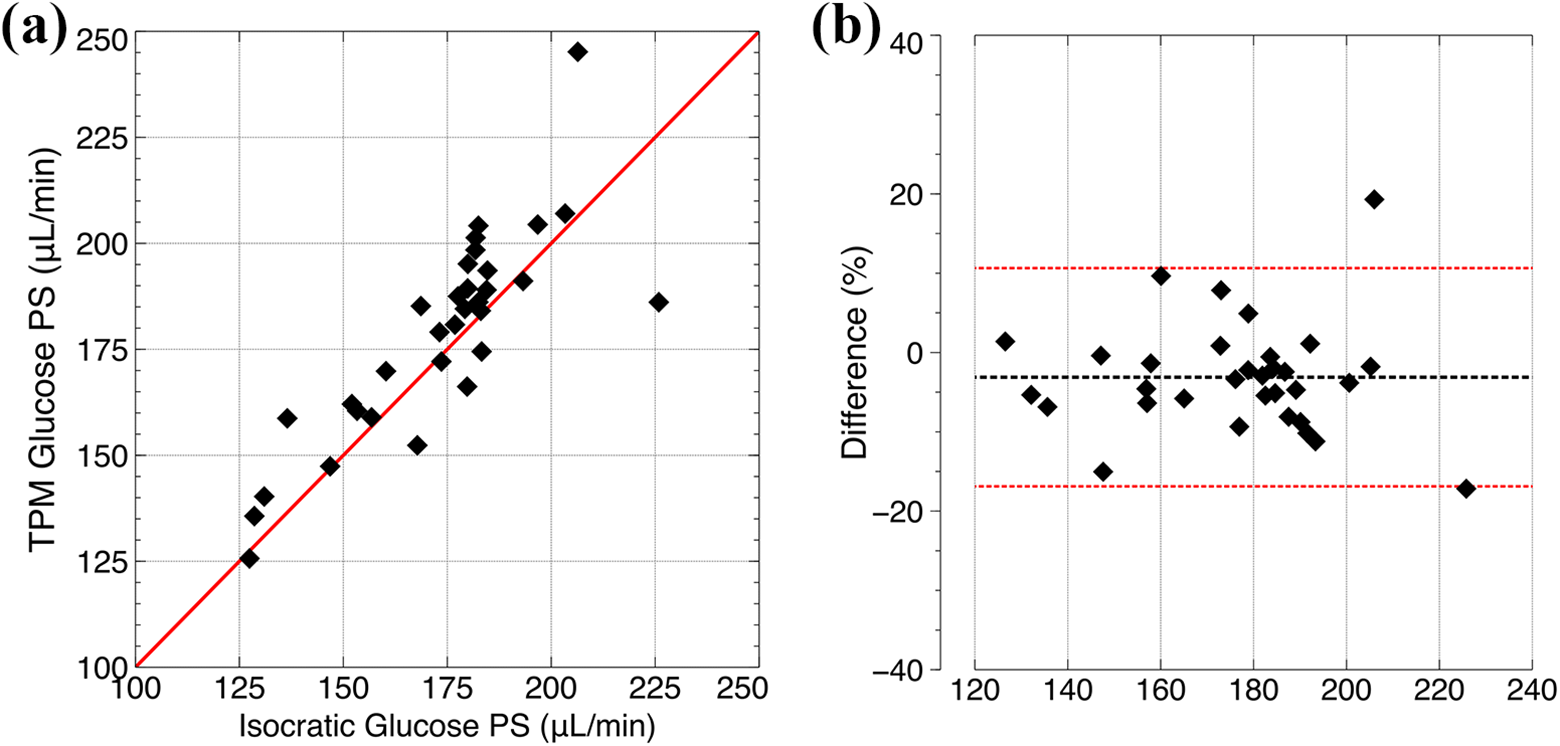
Linear regression between glucose diffusion capacities estimated using the TPM (non-linear regression) versus isocratic diffusion capacity calculated using equation (5) for all animals (a). Bland–Altman analysis showing the difference between glucose diffusion capacity estimated using the TPM (non-linear regression) versus isocratic diffusion capacity calculated using equation (5) for all animals (y-axis) as a function of the average diffusion capacity of the two methods (b).
Three-pore model parameters.a
a Values are median (IQR).
b Also denoted LpS or Kf.
c Calculated from LpS·σ.
d Averaged over both glucose strengths.
Discussion
In the present study, we could not provide evidence that empagliflozin influenced glucose absorption during a 120-min experimental PD treatment in Sprague-Dawley rats. However, the decrease in plasma glucose during inhibition of SGLT2 could possibly have increased the glucose absorption from the dialysate, masking an effect on glucose absorption in our experiments. Therefore, from a theoretical standpoint, glucose diffusion capacity is a more appropriate outcome than glucose clearance or absorption. However, despite using three different methods to assess glucose diffusion capacity (Henderson–Nolph method, isocratic PS and the TPM), we could not find any significant differences in glucose diffusion capacity between groups, with 95% confidence intervals being very similar between treated and untreated animals. Interestingly, we found a significant difference in TPM estimated parameters (LpS and PS for glucose) between 1.5% and 4.25% glucose, similar to recent findings that dialysis fluid tonicity may affect parameter estimation when using the TPM. 13 However, while the isocratic glucose PS values were in agreement with those estimated by the TPM, no difference was found between glucose strengths for isocratic diffusion capacities. Also, since SGLT2 transports 2 sodium ions for each glucose molecule, one should expect larger changes in sodium transport than glucose transport. In line with the negative results on glucose diffusion capacity, we could not detect any difference between treated and untreated animals in the different transport parameters for sodium (see also Online Supplemental Table S4).
Empagliflozin is a potent (IC50 of 1.3 nM), reversible and selective inhibitor of SGLT2. Assuming a first-order renal elimination of EMPA, steady-state plasma concentrations should reach approximately 200 nM in our experimental setting, which should be sufficient to ensure effective inhibition of SGLT2. Indeed, empagliflozin had potent effects on both urinary glucose excretion (and blood glucose levels in 4.25% glucose groups), which confirms effective SGLT2 inhibition in the kidney. Our present results are in contrast to those by Zhou and colleagues who obtained significant differences in dialysate glucose concentration ratio (D4/D0) after a long 240-min PD dwell in Sprague-Dawley rats with 4.25% dialysis fluid. 9 However, group sizes were small in Zhou et al. as well as in the current study and our study may have failed to detect a smaller effect size (Cohen’s d < 1.5). In line with this, our pre-experimental power analysis indicated that a reduction in glucose absorption of about 15–20% is needed to have sufficient statistical power to detect a significant difference between groups of eight animals. Another limitation in the current study is that hyperglycaemia was induced by the anesthesia. 14 This could potentially affect results but the effect should be the same in all groups. Also, in contrast to PD patients, the animals used here did not have diabetes and had normal kidney function. A previous study has shown that experimental diabetes in Wistar rats increased the expression of SGLT1, SGLT2 and GLUT2 in mesothelial cells 8 and thus the effect of SGLT2 inhibition on glucose absorption during PD may be larger in diabetic subjects.
According to the TPM, glucose is chiefly transported via the small pore system by passive diffusive transport along with other small solutes such as uric acid and creatinine. In a recent study, 15 we found that the diffusion capacity of glucose was 80% of that of creatinine in PD patients. This is very similar to the relationship predicted by their diffusion coefficients (Dglucose/Dcrea ≈ 8.8 × 10⁻⁶/1.1 ×·10−5 = 0.80), indicating that both these solutes are transported via the same pathway, and mainly by passive diffusion. In light of these clinical results, the effect of SGLT2 inhibition on peritoneal glucose absorption in PD patients is unlikely to be significant. However, from the results in the current study, a smaller effect on glucose absorption <15–20% cannot be excluded.
We found a higher concentration of creatinine after PD in animals treated with empagliflozin compared to controls. These findings are consistent with clinical studies 16 and may be explained by an increase in sodium delivery to the macula densa during SGLT2 inhibition, which will enhance glomerular afferent arteriolar tone, leading to a decrease in glomerular filtration rate (GFR). However, recent data showed a reduction in GFR and filtration fraction without a decreased renovascular resistance, suggesting that the reduction in GFR may also be due to efferent arteriolar vasodilation. 17 The observed decrement in GFR is assumed to attenuate glomerular hypertension and hyperfiltration in diabetics, which may contribute to the nephroprotective effects of SGLT2 inhibitors. Also, in addition to halting the decline in GFR over time, clinical studies have shown improvements in HbA1c, weight, blood pressure, arterial stiffness and plasma uric acid levels, 18 all of which may also confer protective effects on kidney function. Also in line with clinical results, we observed increased sodium and chloride concentrations in empagliflozin-treated animals (see Online Supplemental Table S3) subsequent to the osmotic diuresis caused by SGLT2 inhibition leading to increased free water clearance. 19
Inhibitors of the SGLT2 reduce blood glucose levels by enhancing urinary glucose excretion and are effective anti-diabetic drugs. Due to the presence of SGLT2 in peritoneal tissues, and recent experimental data, we hypothesized that SGLT2 inhibition would reduce systemic glucose uptake during PD. However, our experimental data showed that the effect of SGLT2 inhibition on glucose absorption during experimental PD in Sprague-Dawley rats is likely small and of little clinical significance. Lastly, it is well known that there is a decrease in GFR associated with empagliflozin. Thus, SGLT2 inhibition in PD patients could potentially compromise residual kidney function, which may limit their usefulness in a clinical setting.
Supplemental material
Supplemental Material, sj-pdf-1-ptd-10.1177_08968608211008095 - SGLT2 inhibition does not reduce glucose absorption during experimental peritoneal dialysis
Supplemental Material, sj-pdf-1-ptd-10.1177_08968608211008095 for SGLT2 inhibition does not reduce glucose absorption during experimental peritoneal dialysis by Giedre Martus, Karin Bergling, Javier de Arteaga and Carl M Öberg in Peritoneal Dialysis International
Footnotes
Acknowledgements
None.
Author contributions
GM, JdA and CAÖ researched literature and conceived the study. GM and CAÖ was involved in protocol development and data analysis. CAÖ wrote the first draft of the manuscript. All authors reviewed and edited the manuscript and approved the final version of the manuscript.
Declaration of conflicting interests
The author(s) declared no potential conflicts of interest with respect to the research, authorship, and/or publication of this article.
Ethical approval
The Ethics Committee for Animal Research at Lund University approved the current study.
Funding
The author(s) disclosed receipt of the following financial support for the research, authorship, and/or publication of this article: This study was supported by a grant by the Thure Carlsson Foundation and Region Skåne (Medical Training and Research Agreement [Avtal om Läkarutbildning och Forskning; ALF]).
Informed consent to participate
Not applicable since it is an animal study.
Informed consent to publish
Not applicable since it is an animal study.
Supplemental material
Supplemental material for this article is available online.
Trial registration
This is not a clinical trial.
References
Supplementary Material
Please find the following supplemental material available below.
For Open Access articles published under a Creative Commons License, all supplemental material carries the same license as the article it is associated with.
For non-Open Access articles published, all supplemental material carries a non-exclusive license, and permission requests for re-use of supplemental material or any part of supplemental material shall be sent directly to the copyright owner as specified in the copyright notice associated with the article.