
Abstract
The majority of peritoneal dialysates contain glucose, which can potentially be absorbed from the peritoneal cavity. Previous studies have reported an observation between dialysate glucose exposure and increases in total cholesterol (TC), low-density lipoproteins (LDLs) and triglycerides (TGs). As most of these studies reported glucose exposure in peritoneal dialysis (PD) patients treated by continuous ambulatory peritoneal dialysis (CAPD), we wished to determine whether measured peritoneal glucose absorption resulted in an increase in lipid profile with CAPD and automated PD (APD) cycler treatments. Glucose absorption was measured in 143 patients; 89 (62.2%) males, 53 (37.1%) diabetics, mean age 61.3 ± 14.9 years, with 90 (62.1%) using a daytime icodextrin exchange; 37 (25.9%) CAPD, attending for their first assessment of peritoneal membrane function, when PD prescriptions were then individualised for peritoneal transporter status and repeated after 12 months. Median glucose absorption was 172.5 (75.5–265.5) mmol/day. Although glycated haemoglobin increased (42 ± 16 to 45.4 ± 17.7 mmol/mol, p = 0.006), there was no change in TC (4.8 ± 1.3 to 4.7 ± 1.3 mmol/L), high-density lipoproteins (1.39 ± 0.45 to 1.33 ± 0.51 mmol/L), LDL (2.48 ± 1.12 to 2.21 ± 0.87 mmol/L) or TGs (2.0 (1.3–2.6) to 2.0 (1.3–2.8) mmol/L, adjusted p > 0.05). We found no association between glucose absorption and either lipid profiles or changes in serum lipids. In the current era of APD cyclers and icodextrin, PD prescriptions can be individualised to accommodate patients with a different peritoneal transport status, so that despite daily glucose absorption from dialysates, and a minor increase in glycated haemoglobin, we were unable to demonstrate any significant increase in standard lipid profiles.
Main body
Cardiovascular disease is the commonest cause of death in peritoneal dialysis (PD) patients. Previous studies have reported that starting treatment with PD leads to an increase in both total cholesterol (TC) and triglycerides (TGs) after 12 months of treatment with PD, and that increases in lipid profiles were associated with an increased risk of cardiovascular disease. 1 Some studies have reported an increase in cholesterol, but not TGs, 2 and yet others an increase in TGs, but not cholesterol. 3 It has been suggested that the increase in lipid profiles is due to the glucose load from peritoneal dialysates, as “low” glucose PD prescriptions have been reported to reduce plasma TGs and cholesterol fractions. 4 None of these studies actually measured glucose absorption, and many of the studies were undertaken before the introduction of 3-methylglutaryl coenzyme A reductase inhibitors (statins), so we wished to determine whether there was an association between measured glucose absorption and changes in lipid profiles.
We audited the results obtained when adult PD patients who had electively started PD attended for their first routine outpatient assessment of peritoneal membrane function and determination of dialysis adequacy 5 2–3 months after catheter insertion and then when they returned 11–13 months later for a subsequent assessment of peritoneal membrane function. Patients who had a delayed first or second peritoneal membrane assessment due to PD peritonitis or an acute illness requiring hospitalisation and those prescribed steroids and chemotherapy were excluded.
Body composition was measured after drainage of peritoneal dialysate, using multi-frequency bioelectrical impedance. 6 Corresponding samples of spent dialysate effluent and fasting serum lipid profiles were analysed with a standard multichannel biochemical analyser, creatinine using an enzymatic method, and albumin using the bromocresol green method (Roche Integra; Roche Diagnostics, Lewes, UK). Weekly dialysis dose calculated as weekly Kt/Vurea, and normalised protein nitrogen appearance was calculated by standard methods. 5 The volume of PD dialysate used was determined by the in-flow volume recorded by automated peritoneal dialysis (APD) cyclers, and for continuous ambulatory peritoneal dialysis (CAPD), patients were instructed to allow 15 s for the flush before fill, and we measured this volume in the sitting position, with a median volume of 90 mL, which was used to adjust for the volume of dialysate, and glucose instilled for CAPD patients. Glucose absorption was calculated by deducting the glucose measured in drained out in the 24-h peritoneal dialysate effluent from the total instilled.
Our retrospective audit was checked by and complied with the United Kingdom National Health Service Health Research Authority, guidelines for clinical audit and service development with all patient data anonymised prior to analysis (https://www.hra.nhs.uk), and complied with United Kingdom best practices, www.nice.org.uk/media/796/23/bestpracticeclinicalaudit.pdf.
D’Agostino Pearson testing was used to determine data normality, followed by paired t testing or Wilcoxon rank sum pair testing with post hoc adjustment for multiple testing. Univariate analysis was by Spearman’s correlation (SPSS version 22.0 IBM, Armonk, New York, USA and GraphPad Prism version 8.1, San Diego, California, USA). Data are presented as mean ± standard deviation, median (inter quartile range), and p < 0.05 considered statistically significant.
We analysed the data from 143 PD patients; 89 (62.2%) males, 53 (37.1%) diabetics, mean age of 61.1± years who had their first assessment of peritoneal membrane function 2 (2–3) months after starting PD training and then repeated at 14 (13–15) months. The majority of patients were treated by APD with an additional daytime exchange (CCPD) and were prescribed statins, atorvastatin, median daily dose 40 (20–40 mg), which did not change over the study period (Table 1). PD prescriptions were adjusted for transporter status after the first assessment of peritoneal membrane function, 5 and thereafter not changed. At the follow-up assessment of peritoneal membrane function, the measured amount of glucose absorbed was 172.5 (75.5–265.5) mmol/day. There was no change in TC or TGs (Figure 1). Both high- and low-density lipoprotein (HDL, LDL) concentrations decreased over time, but after adjusting for multiple testing, then these differences were not statistically significant. Glycated haemoglobin increased from 36.6 (33.3–47.5) to 39.9 (33.3–49.7) mmol/mol, p < 0.01. Overall fat mass increased by 1.8 (−0.5 to 4.4) kg and fat-free mass fell by 1.3 (−2.9 to 1.0) kg. There was no correlation between glucose absorption and TC, TGs, LDL, HDL, glycated haemoglobin, or changes in or percentage changes in TC, TGs, LDL, HDL, glycated haemoglobin, and prescription of statins. There were no differences in serum lipid profiles after 12 months comparing non-diabetic and diabetic patients (TC 4.6 ± 1.2 vs. 4.7 ± 1.4, HDL 1.4 ± 0.5 vs. 1.3 ± 0.5, LDL 2.3 ± 0.9 vs. 2.1 ± 0.7, and TGs 2.2 ± 1.3 vs. 2.6 ± 2.2 mmol/L, all p > 0.05). Similarly, there were no differences in those prescribed icodextrin and those only using glucose dialysates (TC 4.7 ± 1.4 vs. 4.6 ± 0.8, HDL 1.3 ± 0.5 vs. 1.3 ± 0.3, LDL 2.2 ± 0.9 vs. 2.3 ± 0.7, and TGs 2.3 ± 1.7 vs. 2.4 ± 1.5 mmol/L, all p > 0.05.
Patient demographics.a
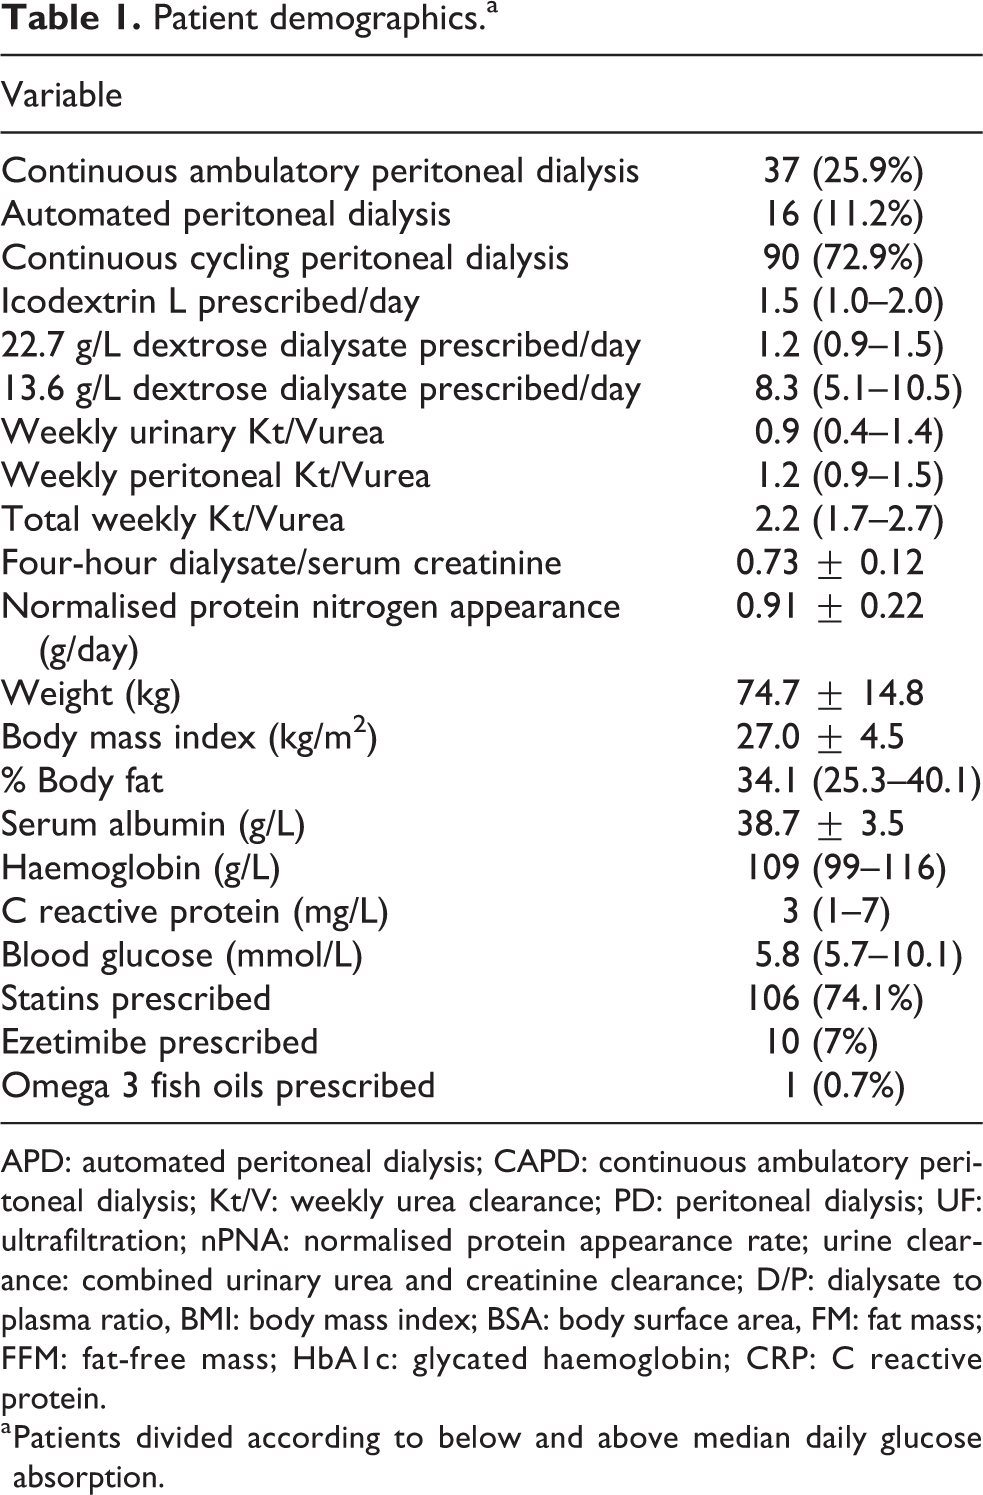
APD: automated peritoneal dialysis; CAPD: continuous ambulatory peritoneal dialysis; Kt/V: weekly urea clearance; PD: peritoneal dialysis; UF: ultrafiltration; nPNA: normalised protein appearance rate; urine clearance: combined urinary urea and creatinine clearance; D/P: dialysate to plasma ratio, BMI: body mass index; BSA: body surface area, FM: fat mass; FFM: fat-free mass; HbA1c: glycated haemoglobin; CRP: C reactive protein.
a Patients divided according to below and above median daily glucose absorption.
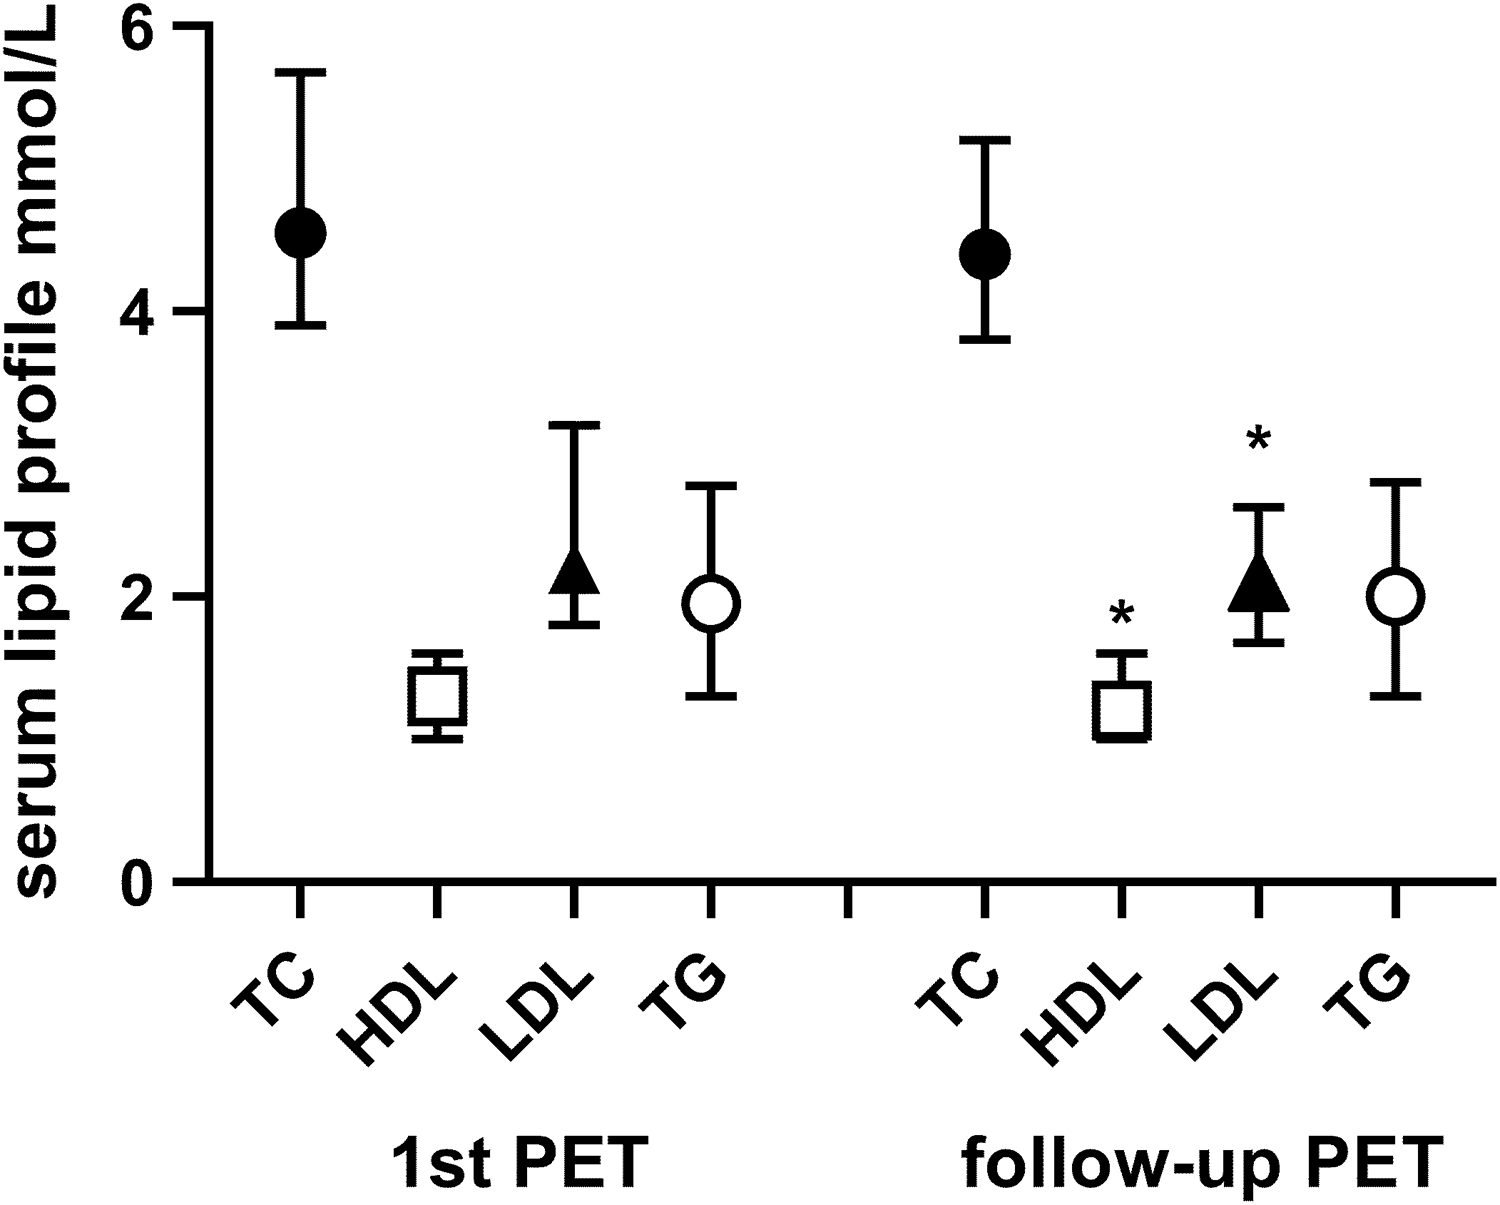
Serum lipid profiles in patients who electively started peritoneal dialysis at the time of first and the repeated peritoneal membrane assessment. Statistical differences LDL p = 0.039, HDL p = 0.015.
Discussion
PD patients are exposed to glucose containing dialysates, and previous reports have suggested that glucose absorption from the dialysates can lead to an increase in cholesterol and TGs. 1 –3 However, many of these predate the introduction of APD cyclers and icodextrin. However, the effect of glucose exposure on increasing lipid concentrations was subsequently supported by short-term trials designed to reduce glucose exposure by combining icodextrin and amino acid containing dialysates. These reported a reduction in glycated haemoglobin levels in a selected group of diabetic patients predominantly treated by CAPD, along with a modest reduction in total cholesterol, TGs 7 and very LDL cholesterol, and apolipoprotein B (apoB). 4
As not all glucose in dialysates is absorbed, we measured glucose absorption, rather than using glucose exposure, to determine whether there was an effect of glucose absorption on changes in lipid profiles from the first assessment of peritoneal membrane function, when PD prescriptions were revised according to the transporter status 2 and patient PD modality choice. In our cohort of patients electively starting PD, glycated haemoglobin levels increased over time. There was no significant change in total cholesterol or TGs, and if anything, there was a statistical decrease in HDL and LDL cholesterol on paired sample testing, which became insignificant after adjusting for multiple testing. We found no statistical association between peritoneal glucose absorption and lipid profiles, or changes in lipid profiles, and lipid profiles were not different in diabetic patients or those prescribed icodextrin. Previous studies may have been confounded by the risk of glucose absorption in faster peritoneal transporters using longer dwell times. In the modern era of icodextrin and APD cyclers, by adjusting PD prescriptions for peritoneal transporter status and the prescription of statins, we observed that peritoneal glucose absorption in patients electively starting PD did not adversely affect lipid profiles in the short term.
Footnotes
Acknowledgements
None.
Author contributions
Both Steven Law and Andrew Davenport collected the data, analysed the data and wrote the report.
Declaration of conflicting interests
The author(s) declared no conflict of interest with regards to the research, authorship, and/or publication of this article.
Ethical approval
Ethical approval for this study was checked by and complied with the United Kingdom National Health Service Health Research Authority guidelines for clinical audit and service development and United Kingdom best practices.
Funding
The author(s) received no financial support for the research, authorship, and/or publication of this article.
Informed consent to publish
Informed consent to publish was not sought because all patient data was anonymised prior to analysis.