
Abstract
Measuring the appropriate level of teacher compensation for different working conditions requires overcoming a number of empirical challenges, including defining and measuring differences in qualifications, effects of non-wage compensation, financial constraints, and lack of market clearing. We address those challenges in a study of teacher compensation in Alaska’s 462 public schools in 53 districts. Each of our three linked empirical specifications produces a set of different compensation adjustments needed to offset differences in working conditions across schools and communities. However, an overall pattern is clear: if districts wish to attract and retain teachers of similar qualifications across all schools, schools serving mainly racially minoritized and low-income populations will need to pay substantially more than they currently do. Estimated required compensation adjustments are quite large in some cases, illustrating the need to address working conditions and other factors that affect teachers’ choices to accept and stay in jobs at high-need schools.
Compensation—including salary and benefits—are important strategies for recruiting and retaining teachers. However, teachers differ in qualifications, and the literature consistently documents that more qualified teachers move from high-need schools to affluent schools with better working conditions (Barnes et al., 2007; Bonhomme et al., 2016; Clotfelter et al., 2004; Guin, 2004; Knight, 2019; Loeb et al., 2005). Prior research has documented that retaining qualified teachers in high-need schools requires more compensation (Godby, 2010; Johnston, 2020; Tuck et al., 2005), but how should those rates be determined?
Political debates and court challenges related to adequacy and equity in public school finance have typically focused on financial resources available for local districts to spend on all education inputs. Offering adequate compensation requires not only the resources, but a commitment to spending those resources on teacher compensation. Determining what level of compensation is “adequate” for all schools involves determining a minimum threshold for qualifications deemed adequate and the minimum salary required to attract and retain teachers meeting that threshold. The minimum salary will differ among schools and communities if they differ in their attractiveness to teachers.
Empirical studies that measure the effects of working conditions on salary differentials that would equalize teacher qualifications across schools have generally applied a variant of the hedonic wage model (HWM) (see Godby, 2010; Goldhaber et al., 2010; Tuck et al., 2009). The HWM estimates a tradeoff between nominal salary and other job and worker characteristics. Applying the HWM to teacher salaries has a number of empirical limitations. First, employee benefits represent an important aspect of the compensation package, yet are difficult to quantify and are thus often left out. Second, hedonic models assume that teacher labor markets are competitive and that the observed salaries represent an equilibrium of supply and demand; however, institutional barriers and financial constraints often prevent districts from changing salaries enough to attract and retain teachers with desired qualifications. We use lack of market clearing as a shorthand for this phenomenon, which is visible as unfilled job vacancies (excess demand), and job queues (excess supply). Finally, and most challenging to resolve, one must be able to distinguish differences in teacher preferences from unobserved qualifications (e.g., difficult to measure qualitative factors) that might sort teachers into schools with different levels of skill.
In this paper, we seek to define and measure the amount schools with varying characteristics need to pay in order to attract and retain highly qualified teachers with an approach that addresses these empirical challenges with the HWM. We start by reviewing the literature on the evolution of the HWM and its criticisms, particularly when applied in the unique context of teacher labor markets, as well as proposed alternative approaches. Next, we outline our approach, based on a system of three linked empirical models. Then, we apply that approach to estimate a base salary and salary differentials that would achieve a minimum threshold of qualifications for public schools in every community in Alaska, a state with historically large disparities in working conditions across its urban and rural communities. Our approach to measuring adequate compensation better accommodates the potential lack of market clearing from institutional barriers such as district financial constraints, while addressing the empirical challenges of non-wage compensation, and distinguishing differences in preferences from unobserved variations in teachers’ qualifications. The results suggest that salaries were about adequate in a number of communities in the state’s 53 urban and suburban school districts; however, ensuring equitable teacher qualifications would require raising salaries substantially in many rural communities with large racial minority populations.
Compensation That Promotes Equity in Teacher Distribution
Evidence of inequitable teacher distribution is abundant: schools characterized by better working conditions attract and retain more qualified teachers (DeFeo et al., 2018; Goldhaber et al., 2010; Hanushek et al., 2004; Horng, 2009; Lankford et al., 2002; Scafidi et al., 2007) and better qualified teachers are more likely to move from poor working conditions in high-racial minority, low-income schools to Whiter, more affluent ones (Barnes et al., 2007; Bonhomme et al., 2016; Clotfelter et al., 2004; Guin, 2004; Knight, 2019; Loeb et al., 2005). These patterns perpetuate and expand social inequities (Amrein-Beardsley, 2012), and there is a growing policy interest in interrupting these patterns through fiscal incentives (Goldhaber et al., 2010).
Addressing inequity starts with the understanding that teachers decide where they want to work based on conditions that are optimal to them. When districts are unable to change attributes that make a placement less desirable, they can make the teaching position more attractive by offering a higher salary. Studies have typically used hedonic wage modeling (HWM) to estimate how much more (or less) salary is required. The HWM assumes that individual employment choices reflect the relative value the teacher places on the composite characteristics of the job, based on the wages they accept for positions of varying characteristics, including salary. To measure salary-working conditions tradeoffs accurately, HWM applications require that working conditions and wages are appropriately measured and that wages are determined in competitive markets. However, this is generally not the case when applied to teacher labor markets.
Employee Benefits
Non-wage employee benefits matter in job choices (Bawalla & Omolawal, 2022; Smith & Ehrenberg, 1983), but are usually not accommodated in HWM (AUTHORS, 2005; Graves et al., 2002). Benefits are omitted on the assumption that benefits vary little between districts or because there is a lack of data (Godby, 2010; Goldhaber et al., 2010; Hanushek et al., 2004). However, districts use a wide variety of benefits to make jobs more attractive to teachers (Hanushek et al., 2004, 2005). These benefits include health insurance (e.g., medical, dental, vision); retirement (e.g., pensions, tax sheltered annuities); leave (e.g., sick, personal, maternity/paternity, military duty, jury duty); insurance (e.g., life, disability, professional liability); housing placements or stipends; tuition support or reimbursement; professional development stipends; and opportunities to earn bonus pay (Hirshberg et al., 2015). Benefit packages do in fact vary among districts and may in some cases have more value to workers than their pecuniary value (Dale-Olsen, 2006); thus omitting them from HWM calculations is a significant limitation.
Competitive Markets
A second challenge with HWM is the assumption that the observed compensation reflects an equilibrium price that balances the demand for and supply of workers in competitive markets. On its face, this seems unlikely in the short run, given the prevalence of multi-year collective bargaining contracts in education that would ordinarily be presumed to delay market clearing. There is also good evidence that this does not average out over time either: a fair number of teachers with strong qualifications are not hired immediately out of college, when less qualified ones are (Ballou, 1996). Applications to different positions also vary; more desirable districts often have a surplus of qualified applicants (Tuck et al., 2005, 2009), while low-income and high-racial minority schools have unfilled vacancies (Evans, 2011). Lack of market clearing is clearly indicated by the frequent use of signing bonuses for some positions, such as STEM and special education (Blair, 2000), while others, such as elementary education positions, have job queues (see e.g., Will, 2016).
Financial Constraints
The United States’ reliance on local taxes to finance schools means that districts with a large local tax base may be able to offer better pay. Because HWM estimates wages using real salaries, the observed salary may reflect the district’s ability to pay rather than the need to compensate for specific job characteristics. This could explain counterintuitive findings produced by some HWM studies, such as calculating lower wages for teachers in schools serving a higher proportion of low-income students (Boyd et al., 2013). Observed lower qualifications of teachers working in those schools (Evans, 2011; Lankford et al., 2002; Loeb et al., 2005) provides further support for the hypothesis that low salaries reflect the districts’ diminished purchasing power.
Unobserved Teacher Qualifications
More subtle differences in teacher characteristics, such as information from professional references and other qualitative information included in job applications and performance reviews, may be observable to school administrators, but not to researchers. Principals’ performance evaluations of teachers are a useful quality indicator (Jacob & Lefgren, 2005), but in addition to being confidential, they are not standardized (Tuck et al., 2009), which renders them unusable for large-scale quantitative modeling. If school administrators use this information in hiring decisions, HWM calculations that fail to accommodate it will inaccurately estimate differences between schools (Tuck et al., 2009).
Lacking more appropriate measures, in practice the most commonly used qualifications measures are teacher education and years of experience. However, these indirect measures are often only weakly correlated with teaching quality (Chingos & Peterson, 2011; Clotfelter et al., 2006; Hanushek, 2003; H. C. Hill et al., 2019; Pennucci, 2012; Rivkin et al., 2005). Student incremental achievement metrics (i.e., value added measures) also frequently present validity and reliability concerns (Bacharach et al., 1984; Hanushek et al., 2005; Lasagna, 2010; Podgursky & Springer, 2007; Polikoff & Porter, 2014) fail to represent the full array of teacher duties (Goldhaber et al., 2008), and do not accommodate all teachers as these are limited to specific subjects and grade levels.
Because of these challenges, most previous analyses have either ignored potentially unobserved teacher characteristics (Chambers et al., 2003) or used various combinations of available proxies, mostly experience and education (Godby, 2010; Hanushek et al., 2004). These researchers have noted that this is a significant limitation, yet they had no alternative solution for quantitative analysis. Some work has sought to address these limitations. Tuck et al. (2009) control for unobserved quality characteristics by modeling how individual teacher moves between schools in different districts are associated with salary and working condition differences. Boyd et al. (2013) use a game-theoretic two-sided matching model to represent heterogeneous district demand and teacher supply. However, neither study addresses benefits or potential lack of market clearing.
Incentives for Retention
Research in the broader field of teacher supply and demand has also identified another shortcoming HWM studies: typically, they only try to identify the salary needed to place a teacher initially but not the wage required to retain the educator who gains experience working in that job. Though some studies have distinguished between base salary and total salary (see Taylor, 2011), their objective is to measure overall teacher compensation more accurately, not model retention. R. M. Ingersoll and Perda (2010) identify teacher turnover as a larger contributor to teacher shortages than teacher production, and note significant practical implications of using wages to mitigate turnover. Yet HWM applications typically fail to account for teacher retention, although many of the same working condition variables used in HWM can also predict turnover (Boe et al., 2008; DeFeo et al., 2018; Guin, 2004).
Approach
Our analysis makes use of hedonic wage modeling within a structural model of teacher supply and demand. First we describe the supply of teachers, based on their characteristics. Then we describe teacher demand and its interaction with teacher supply in the regional labor market.
Teacher Characteristics
Procuring qualified teachers is costly. A tradeoff exists between society’s willingness to pay and the achievable level of teacher qualifications. The concept of “adequacy” implies that a higher-level authority—the state, province, or nation—has defined a measurable standard of qualifications that every school in its jurisdiction should meet. Setting aside for the moment the difficulty of defining such a measurable standard, we focus now on the more tractable question, challenging enough in its own right, of determining the compensation schools would need to provide to meet that given minimum standard across all school contexts. 1 We consider how a school would endeavor to address this challenge through compensation offers in the relevant labor market: that is, the supply and demand for qualified teachers. Our aim, therefore, is to measure hedonic equivalent compensation—a package of salary and non-wage benefits adjusted for differences in working and living conditions across schools—that achieves a minimum acceptable qualification threshold for all teachers. Schools that are well-resourced and/or have favorable characteristics that align with teacher preferences may be able to attract and retain teachers who exceed the minimum threshold, while high-need schools may have difficulty meeting it.
We start by assuming that each individual public school and each teacher is a price-taker in a regional labor market for teachers. The regional market may comprise a state, large metropolitan area, or economic region within which teachers are free to move, ensuring competition in both supply and demand. We also assume that teachers have preferences for a variety of working conditions as well as for salary. Ultimately, accepting a teaching job involves accepting a package of salary and employee benefits, working conditions, and living conditions in the community or a feasible commuting area.
Teachers differ in their qualifications, so school employers face a differentiated supply. Higher pay and better working conditions attract teachers of all skill levels (Hanushek et al., 2004). Better-qualified teachers will have better alternative opportunities and consequently higher opportunity costs than less-qualified teachers, either in teaching or other jobs. The competitive supply of qualified teachers to an individual school in a given labor market region, QS, therefore varies with “hedonic compensation” from teaching in a public school, hT, and hedonic compensation from other teaching and non-teaching opportunities, including leisure, hO. Hedonic compensation includes salary, s; non-wage employee benefits, r; working conditions, such as teaching assignments and supervision, class sizes, student characteristics, and facilities, x; and community characteristics, that is, living conditions within the commuting area of the job, such as cost of living, remoteness, housing availability, and other place amenities, z:
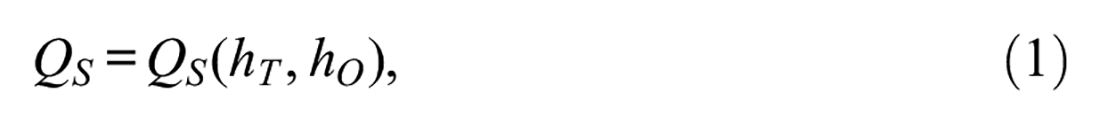
where hj = h(s j ,r j ,x j ,z j ), j = public school teaching, other activities. Teachers may have different preferences for certain working conditions, but we assume that those differences are not correlated with qualifications. Schools prefer more qualified teachers, and differ in their ability to pay for them, due to differences in fiscal capacity and non-teaching costs. Although the school policies may influence salary, benefits, and some working conditions, other working conditions such as student body characteristics, as well as community living conditions, z, are generally outside the school administration control and considered exogenous. 2
Demand for Teacher Qualifications
The market demand for teacher qualifications represents a portfolio of teacher characteristics that employers prefer and are willing and able to pay for when hiring staff to teach in public schools. Many aspects of compensation such as the salary scale and health insurance are determined at the district level, often through collective bargaining agreements with teachers’ unions. However, school administrators may have some discretion as to how they apply the salary scale and certain benefits to attract and retain better qualified teachers (see Castro, 2022; DeFeo & Tran, 2019). We assume that school principals who make hiring decisions desire to hire the best teachers they can within budgetary, collective bargaining, and other constraints such as the number of positions they are permitted to fill handed down to them from district administration, school boards, and higher-level authorities. 3
The competitive demand for qualified teachers, QD, depends on the cost of teachers who possess those characteristics, measured by the hedonic compensation that a public school offers from teaching there, hT; other instruction-related and non-instructional costs of running a public school such as operations and maintenance costs, c; and school fiscal capacity, y:

where again hT = h(sT,rT,xT,zT). Many of the elements of the vector cost variable, c, are likely to affect the hedonic compensation. However, their marginal cost to schools locally may differ from their marginal benefit to teachers, so they must be considered as separate factors that influence the level of teacher qualifications for which schools are willing and able to pay (see also Johnston, 2020).
Observed Equilibrium of Teacher Qualifications
Because schools differ in working conditions and other features, the equilibrium level of teacher qualifications will differ among schools, even if they pay the same salary and offer the same employee benefits. Funding for public schools in the United States and Canada comes primarily from local property taxes, supplemented by grants from the state or provinces, and federal governments. We assume that this revenue base is exogenous to schools and district administration. On the supply side, public schools serve all children, so likewise do not control the characteristics of students or community characteristics affecting working and living conditions. These exogenous variables identify the supply and demand equation system.
Figure 1 illustrates the supply and demand for qualified teachers. The vertical axis represents (hedonic compensation, H) and shows increasing levels of compensation that schools can offer, such as a mix of better pay, benefits, and working conditions. Schools able and willing to offer compensation above the level needed to achieve the threshold level of adequate teacher qualifications (demand D1) experience low turnover rates and job queues enabling them to select better qualified teachers from their applicant pools. Schools with more difficult working conditions and fewer financial resources (demand D2) face challenges when recruiting and retaining qualified teachers. Since a teacher who gains some teaching experience becomes more qualified, at least over the first several years of classroom instruction (i.e., moving from an initial Q2 to a new Q1), if compensation does not keep pace with the change in a teacher’s qualifications, then the teacher may move to a different school that offers a better mix of pay and working conditions than that individual was able to obtain as a novice.
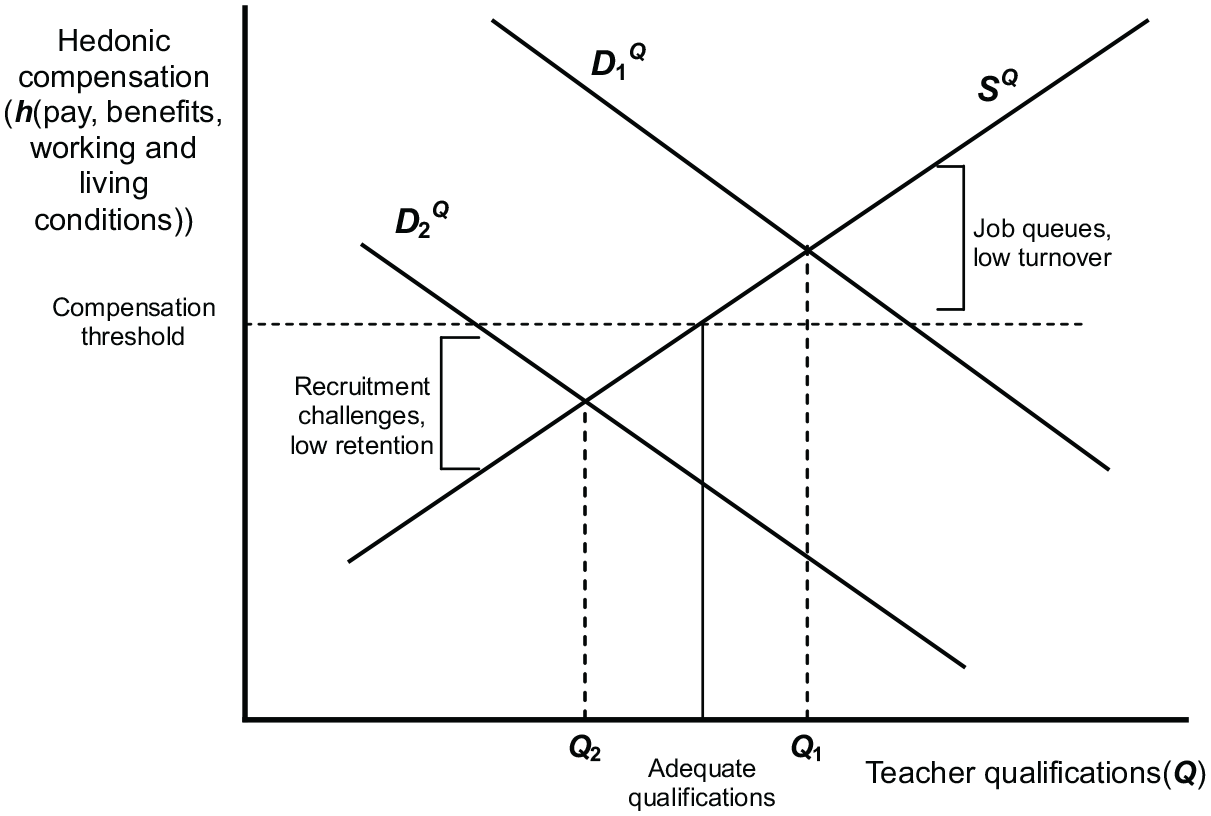
Hedonic compensation and teacher supply.
Empirical Model
The empirical analysis builds from the basic model of the labor market for teacher qualifications outlined in Figure 1. We measure equivalent, adequate compensation through a combination of three empirical specifications, each of which approaches the issue in different ways. The first specification estimates the supply curve for teacher qualifications facing the school directly. Then we consider two different ways to measure the compensation-working conditions tradeoff with greater sensitivity, controlling for potentially unobserved teacher skills and characteristics by examining the job choices of individual teachers. First, we describe each of the three specifications of the demand for qualified teachers and associated statistical estimation procedures. Then we discuss the application of the model to public schools throughout the state of Alaska.
Supply of Qualified Teachers
Since the actual level of qualified teachers in each school is determined from the demand relationship, we do not actually need to measure this directly in the supply relationship. What we do need to measure is the relevant preference tradeoff of monetary compensation for the set of employee benefits, working conditions, and community characteristics. Two conditions allow us to identify the preference tradeoff. First, we assume that although teachers differ in preferences for salary and working conditions, we assume that these preferences are not related to their qualifications. However, for our analysis, as more qualified teachers are more likely to have their choice of preferred positions, we must control for these variations in teacher qualifications to ensure that variation across schools in pay and working conditions are measuring teacher preferences rather than differences in teacher qualifications (Simon & Johnson, 2015; Sims, 2017). To achieve the second condition, we control for teacher qualifications as well as the associated opportunity cost of alternative employment indirectly by analyzing employment decisions of individual teachers. We estimate two specifications based on very general assumptions about preferences.
Analysis of Job Duration
Teachers are likely to stay longer in jobs that they prefer, given the opportunity costs. Analysis of observations on a large number of individual job duration intervals has the potential to indicate contract provisions, job assignments, and characteristics of schools and communities that are associated with measurable effects on job turnover. Hedonic compensation in the teaching job is also assumed to be a linear function of salary, non-wage benefits, and working conditions consisting of school characteristics, and community characteristics. We model the natural log of the relative hazard rate, Hij for teacher i leaving a public school teaching job in community j as a linear function of the natural logarithm of hedonic compensation. The natural logarithm of hedonic compensation is a linear function of the log of the teacher salary, sij, non-wage benefits rj, school and district characteristics xj, characteristics of the teacher, wi, and community characteristics zj:

where the γ k represent parameters to be estimated. Observations in Equation (3) represent individual teachers. We measure salary net of the employee’s required contribution to the health insurance premium. Since it is possible that observed salary could be influenced by the individual teacher’s decision to stay or leave that year, we use the predicted value of an equation estimated for salary net of the employee’s portion of the health premium as a function of individual teacher, characteristics, (w), and school, district, and community characteristics (x and z) as an instrumental variable in Equation (3).
Analysis of Teacher Moves Between Schools
When a teacher moves from one school job to another, one can assume that the new job is preferable to the old job, on some dimension that is valuable to the teacher. For example, a teacher may move from a less desirable job in a preferred community to a more desired job in a less preferred community, and vice versa. 4 We apply a rank-ordered discrete-choice model (Beggs et al., 1981) to estimate trade-offs between compensation and working conditions at the new and old jobs from observed job changes of individual teachers. The rank-ordered choice model estimates an equation in which the log of the odds ratio that teacher i prefers teaching job in community A to a teaching job in a different school in community B, L(A,B), is a function of the teacher salary s, non-wage benefits r, school characteristics x, and community characteristics z in jobs A and B. That is,

where the δ k represent parameters to be estimated. As with the analysis of job duration, we use the predicted value of an equation estimated for salary net of the employee’s portion of the health premium as a function of teacher, school, district, and community characteristics as an instrumental variable in Equation (4).
While non-salary benefits and market clearing indicators represented in Equations (2), (3), and (4) are theoretically distinguishable, it is important to keep in mind that the inducements that districts and schools might offer to mitigate the effects of institutional obstacles to raising salaries may come in the form of enhancements to otherwise standard non-salary employee benefits. One would expect coefficients on non-wage benefits, β 2 , γ 2 , and δ 2 to be positive, like the coefficients on salary. A negative sign on an employee benefit means that the availability of the benefit is associated with teacher turnover, rather than retention. An example is the provision of teacher housing, which has an obvious and calculable monetary value. If the availability of this benefit is nonetheless associated with teacher turnover, the negative sign in the model suggests that the enhanced benefit does not fully compensate for the less desirable working conditions the employer is trying to ameliorate with the benefit.
Demand for Teachers
Observations in Equation (2) represent schools. The pay scale and benefits are typically set at the district level, but the school characteristics do vary among individual schools within districts, and community characteristics also vary if the districts incorporate multiple communities. One must be careful with the non-salary employee benefits, as the cost to the school may diverge from the value of the employee benefit. The employer’s contribution to the employee’s health plan also differs from the portion contributed by the employee. To attract and retain a teacher meeting a given set of qualifications, the school has to pay them enough to match the relative difference between the hedonic wage at their school and the hedonic wage at other potential schools. Consequently, we estimate the demand for teacher qualifications i as a linear function of relative hedonic compensation hj, non-compensation costs that might vary among schools and communities, cj, and district fiscal capacity, yj:

where uj represents a random error term, and the βκ represent parameters to be estimated. Hedonic compensation is an instrumental variable derived from the predicted values of the supply equations used in Equations (3) and (4). For Equation (3), teacher i’s associated hedonic wage in dollar units for job duration would be

For Equation (4), the associated hedonic wage is

The hij projected from Equations (6) and (7) are likely to differ in practice. We decided to use the average of the two estimates for teachers in each school j
Since the hedonic wage includes the perceived value to teachers of the benefits they receive, the β2 coefficients include the costs of non-wage benefits to the school net of their value to the teacher. If benefits are optimally provided, these components of β2 will be zero. However, there may be institutional constraints preventing this from occurring, especially in the short run. Because of the potential for market scarcity to influence the cost of these benefits, we use instrumental variables based on fitted values of linear regressions on school, district, and community characteristics, including local fiscal capacity.
Application to Alaska Public Schools
Alaska has 53 school districts containing about 500 schools, with 58% classified as high-need by Alaska’s Department of Education and Early Development (DEED). 5 Each of the districts’ school boards negotiates separate teacher contracts with local unions or teacher groups. Including the two state-run schools, Alaska has 55 unique salary and benefit schedules with significant variation in compensation, before considering variations in interpretation for individual teachers. In 2015, minimum starting salaries ranged from $29,915 to $55,729, with an average starting teacher salary of $44,840. District and teacher payments for health insurance also varied widely, with district costs ranging from less than $4,000 to almost $27,000 per year per teacher, with the teacher’s contribution ranging from zero to $4,800 (Hirshberg et al., 2015). State and federal funding account for 64% and 14% of Alaska’s public school funding, respectively. The proportions of state and federal funding are the fifth and sixth highest in the nation, respectively, largely attributable to Alaska’s unique municipal tax structure (see Berman & DeFeo, 2022; DeFeo et al., 2019).
Alaska allocates state school funding to school districts using a per-pupil spending amount set by the legislature which is adjusted to accommodate school size, geographic cost differentials, and special programs, such as special education, career and technical education, and district-operated distance-learning programs (Alaska Statutes 14.17). The state foundation program subtracts an amount equal to a fixed percentage property tax—4 mills during the study period—from each district’s foundation formula allocation. School districts can increase the local contribution above that up to 8 mills, within disparity limits. Approximately two-thirds of Alaska’s districts are able to do this, and most do contribute more to some extent. 6 School size and district geographies vary dramatically; differences include climate, availability of amenities, opportunities for recreational activities, and school-community relationships (Hirshberg et al., 2015, 2019). 7
Direct Estimate of Adequate Qualifications
We use the 2002 No Child Left Behind Act (NCLB) highly qualified (HQ) definition as our indicator of teacher qualifications. To meet the NCLB definition of HQ, an educator needed to have “1) a bachelor’s degree, 2) full state certification or licensure, and 3) prove that they know each subject they teach” (emphasis added). One of the more controversial mandates of the NCLB legislation was that 100% of students be taught by HQ teachers by 2005.
HQ status represented a teacher’s qualifications to teach specific content in a specific educational setting but was not an indicator of overall teacher effectiveness or performance. It is therefore easy to dismiss the standard as a useful measure of teacher skills. However, the HQ standard was socially determined (through an Act of Congress) and was the first time that the nation had a uniform minimum standard, but also one that was easily observable for researchers due to required reporting. Criticisms of NCLB and the HQ designation notwithstanding, the measure itself was useful as an example to demonstrate a method of estimating the compensation needed to achieve adequate and equitable teacher qualifications across public schools for any standard that is in widespread use and measurable for all schools that aim to achieve it.
Of course, the standard, whatever it is, can only be used empirically to estimate the compensation needed to achieve an adequate and equitable teacher workforce if some schools actually had difficulty achieving the target. By 2010, when schools could face penalties for non-compliance, 98% of elementary and 96% of secondary teachers nationally had HQ status. However, there were noted disparities in HQ attainment rates between high- and low-income areas (U.S. Department of Education, 2015), and five states (including Alaska) were still reporting less than 90% of core courses taught by HQ teachers in 2014 (U.S. Department of Education, 2015). Alaska’s percentage of HQ teachers was lower at the secondary level (86%), and in high-poverty areas (75%). The state’s gap between high and low-poverty areas was the third highest in the nation, following only Missouri and New York. In 2015, the Every Student Succeeds Act (ESSA) replaced NCLB, ending the requirements for highly qualified teachers.
The HQ standard is a rather crude indicator; most teachers will be HQ to teach some classes. However, a school’s ability to recruit and retain appropriately trained teachers for every core class is likely to be correlated with the school’s ability to meet any internal or external qualifications standard. For a window of time between about 2010 and 2015, therefore, NCLB provided an opportunity to test how combinations of pay and working conditions affected schools’ ability to attract and keep teachers meeting the defined minimum threshold of teacher qualifications.
Data Sources
We compiled data from Collective Bargaining Agreements (CBAs), public school data, certified personnel data, and community data to flesh out the variables used in our equations. Table 1 summarizes the school and district, community, and personnel data used in the empirical analysis, including variable definitions, sources, units, and means and standard deviations. Data were available from 2005 through 2014 for all 462 public schools and their respective communities, excluding charter schools.
Data Definitions and Sources.
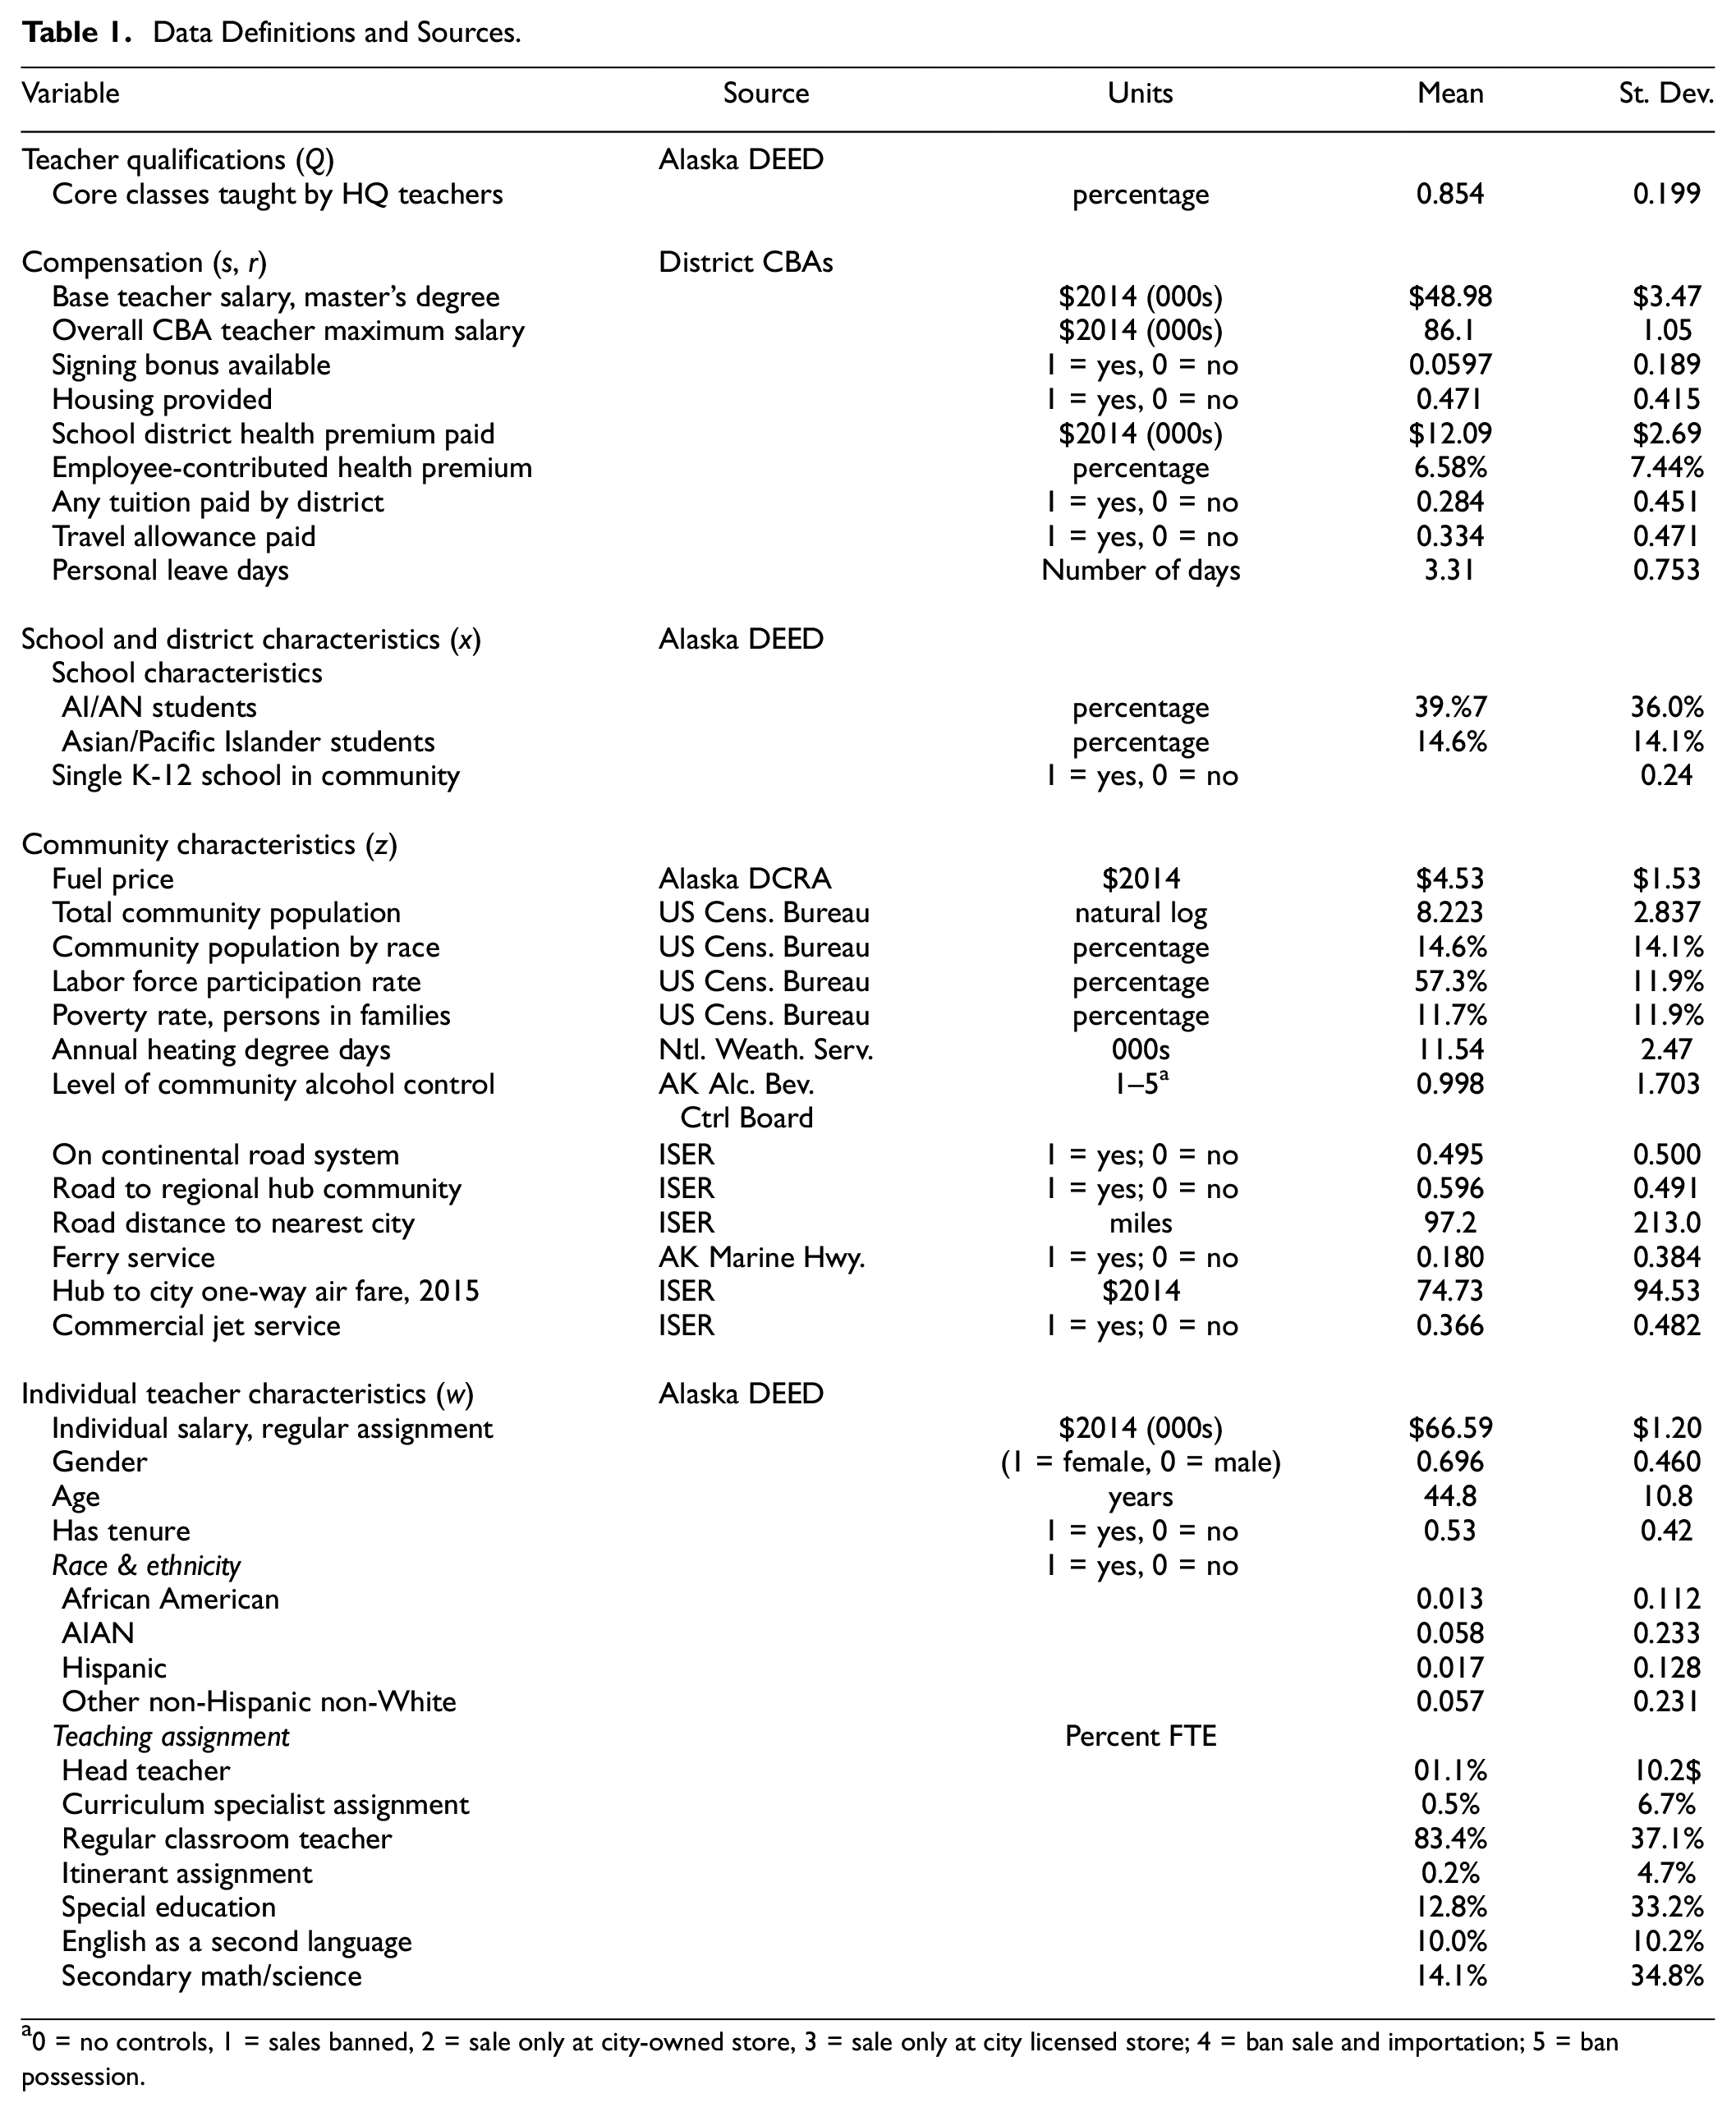
0 = no controls, 1 = sales banned, 2 = sale only at city-owned store, 3 = sale only at city licensed store; 4 = ban sale and importation; 5 = ban possession.
Salary and Non-Wage Employee Benefits: CBAs
We obtained at least one recent teacher CBA for each district (except for one district that does not have collective bargaining). For most districts, we were able to obtain CBAs covering the period from the 2009–10 school year to the 2014–15 school year. CBAs contain the complete salary schedule, employee benefits, whether the school was able to offer a discretionary one-time signing bonus, total and school district annual payments for health insurance, whether the district paid tuition for required periodic recertification classes or provided a travel allowance, minimum and maximum personal leave days during the school year, and whether the school provided housing for teachers and their families (primarily in smaller rural communities where housing options are often extremely limited). Salary and health insurance payments were adjusted to constant 2014 dollars using the Anchorage Consumer Price Index.
Working Conditions: Public School Data
Data for individual Alaska schools and school districts came from School Report Cards and other reports submitted by schools and districts to the Alaska Department of Education and Early Development (DEED), including the percentage of core academic classes taught by HQ teachers as defined by NCLB.
Certificated Personnel Data
DEED provided individual information on all certificated personnel working in Alaska public schools assignments between 2005 and 2015. Personnel data included highest academic degree, years of experience in the job class, base salary, and percentage of full-time equivalents in each job assignment. Data for individuals were linked across years using a unique Alaska teacher identification number.
Community Characteristics
The US Census and other public sources generated additional information on characteristics of the communities Alaska public schools serve. Census community data included the total and school-aged community population and its racial composition, percentage of population in the labor force, and percentage of families living in poverty. Data from school districts included total students and racial composition of students. The Alaska State Assessor’s office provided annual district tax base data. We also compiled community data including current airfare from the community and from the nearest hub community to Anchorage, whether the community was connected by road to a hub community and to Anchorage, climate data from National Weather Service climatologies, and alcohol legal status from the Alaska Alcoholic Beverage Control Board.
Estimation Methods
Supply Equations
We estimated Equation (3) using a Cox proportional hazard model (Cox, 1972), adjusting standard errors to account for the potential multiple jobs and associated years observed for an individual teacher. It is possible that some job separations are involuntary, mainly affecting teachers who lack tenure. The potential effect of tenure can be investigated by testing whether the hazard rate changed significantly after the third year, when teachers would have earned tenure. For Equation (4), each move was considered to be a different case in the rank-ordered logit model.
Instrumental variables were used for salary and benefits, estimated from all exogenous variables in the supply and demand equations. Health care coverage was relatively similar across districts, but the total cost and the district-employee contribution split varied widely. Consequently, we defined salary as the amount the teacher received, which was net of the employee contribution to the health care premium. Other benefits included in the equation were provision of teacher housing (binary), number of personal leave days, payment of tuition for continuing education (binary), and a travel allowance (binary). Both supply equations control for the classroom teaching assignment by limiting the sample to teachers with a job assignment of at least 80% of full-time-equivalent status.
Demand Equation
We assumed that the uj in Equation (5) are identically distributed with a Gaussian distribution within a given school but have variance components that randomly vary by school and by year. The equation is therefore a cross-section time series panel, which we estimated using a random-effects panel regression (Skrondal & Rabe-Hesketh, 2004), censored at zero and 100%. Since the instrumental variable for the teacher compensation used in the supply equations is net of the employee contribution to health care, we add that back in and then add the district contribution before generating the cost of qualified teacher labor as the average of Equations (6) and (7). We then normalize the hedonic price by dividing by the value for the Anchorage School District, the state’s largest district and the benchmark for the school cost index in the foundation formula. The resulting hedonic price index represents the predicted hedonic salary (expressed as a ratio to Anchorage) for the same teacher that is needed to make a teacher indifferent between working in a teaching position in that school and holding a similar position in Anchorage.
Because we are analyzing variation in choices of individuals in the supply equations, the opportunity cost of alternative employment is given. It could change over time due to general regional market conditions, however, so we include yearly fixed effects in the demand equation. We add the option of an initial signing bonus as a benefit cost, in addition to the benefits considered in the supply equations.
Results
Table 2 summarizes the results of estimating Equations (3), (4), and (5) for the Alaska panels of schools and teachers. Explanatory variables for individual teacher salaries and employee benefits are measured using instrumental variables. Results show that salary had a positive and highly significant (p < .001) effect on the teacher supply in each equation, but the magnitude of the effect varied depending on the specification of the supply relationship. Employee benefit measures present a mixed picture. We discuss results for each measure separately below.
Results of Panel Regression Equations Estimated for Supply of Qualified Alaska Public School Teachers. (Maximum Likelihood Estimates, t statistics or z scores enclosed in parentheses).
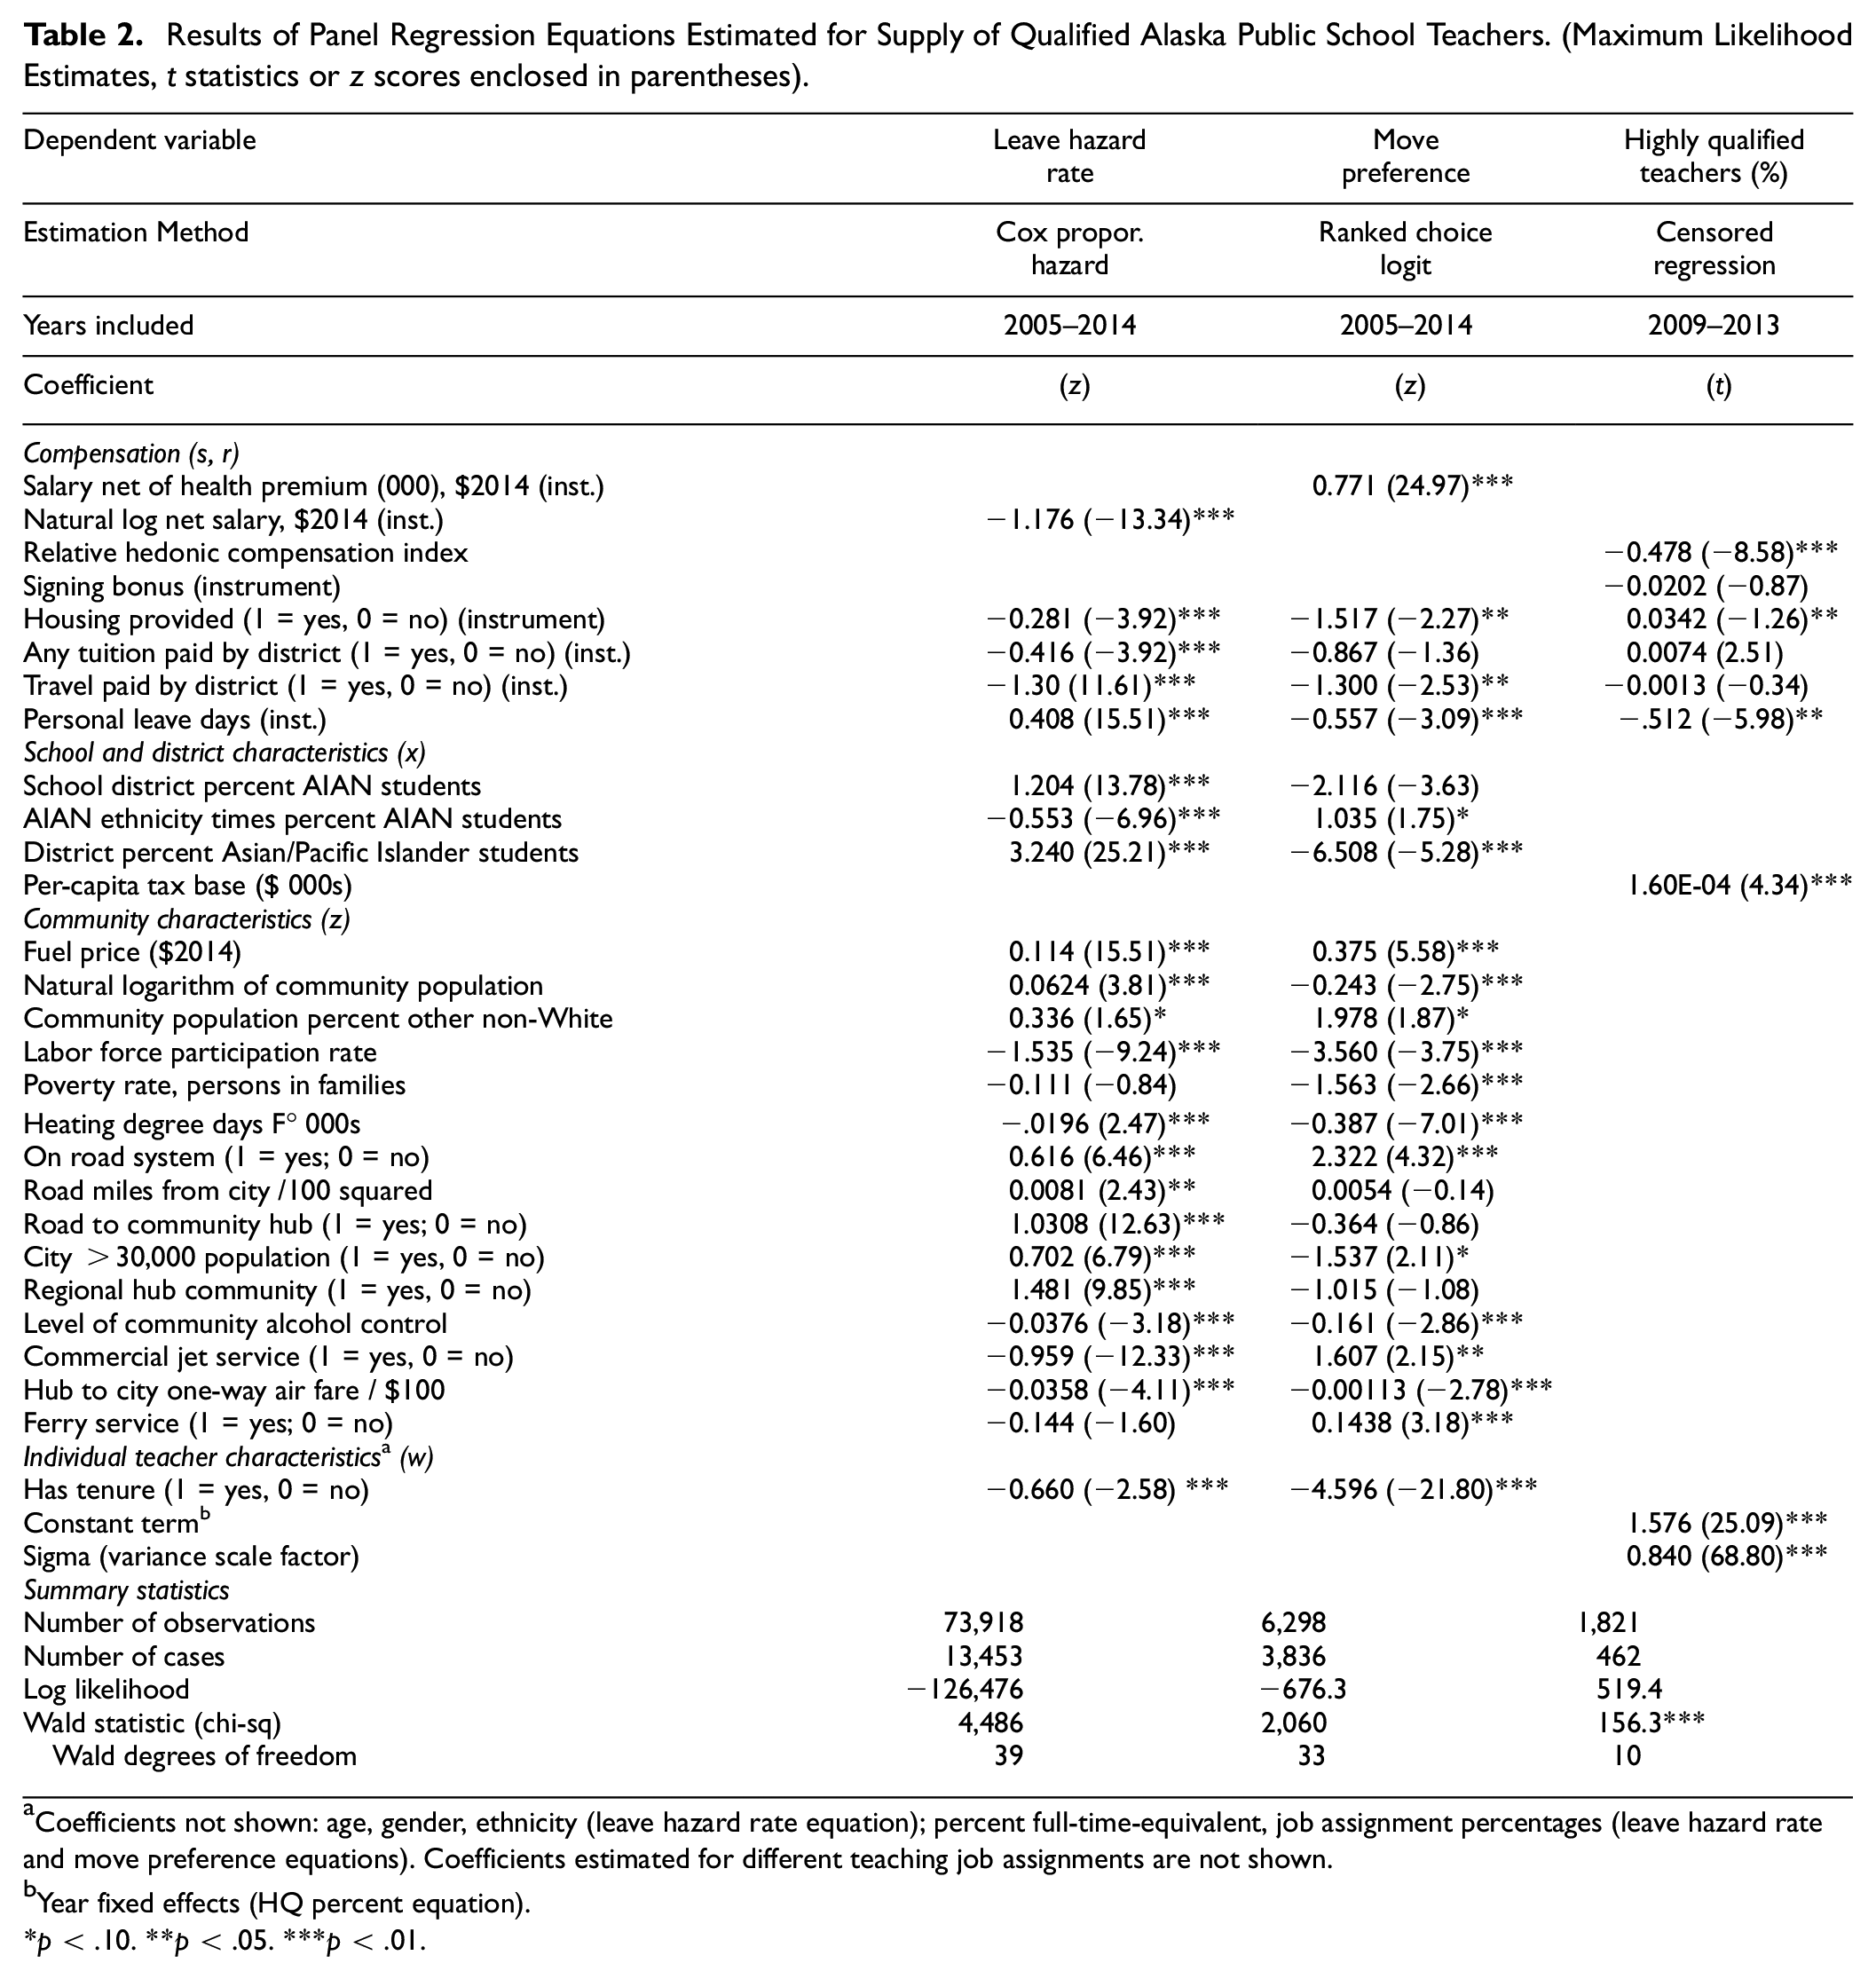
Coefficients not shown: age, gender, ethnicity (leave hazard rate equation); percent full-time-equivalent, job assignment percentages (leave hazard rate and move preference equations). Coefficients estimated for different teaching job assignments are not shown.
Year fixed effects (HQ percent equation).
p < .10. **p < .05. ***p < .01.
Job Duration
The first column of coefficients in Table 2 shows the results of estimating Equation (3) for job duration of individual teachers, with hazard coefficients reported rather than hazard ratios to facilitate comparison with the other two equations. Coefficients for job assignment percentages, age, gender, and ethnicity are omitted for brevity. A preferred job would be associated with a lower hazard rate, so the expected signs of the coefficients on compensation variables would be negative. The salary net of employee contribution to the health insurance premium in this equation had an estimated elasticity of −1.1. As hypothesized, tenured teachers are significantly less likely to leave than untenured teachers. However, in a survival equation a portion of the effect could just represent a threshold effect (i.e., a teacher who has stayed into the fourth year has found the job to be a good fit).
The large sample—over 13,000 teachers observed over an average of nearly 6 years each—provides ample power to test hypotheses about the role of various employee benefits. Provision of housing and reimbursement for continuing education had large significant negative associations with the leaving hazard. District payments for travel were also weakly associated with leaving the job. Noting the lower turnover in larger urban and regional hub communities and measures of accessibility by road or ferry to urban areas, the travel reimbursement implies that living in a remote rural community presents less desirable community characteristics. The strong positive association of personal leave days with the leaving hazard also suggests an acknowledgment by the school district of more difficult working and living conditions—and an ultimately inadequate attempt to compensate for them. The results also indicate that teachers prefer warmer locations and are more likely to leave schools serving high proportions of racially minoritized students—except for American Indian/Alaska Native (AIAN) teachers teaching AIAN students. Stricter regulation of alcohol was also associated with longer job tenure, likely indicating improved social conditions associated with community decisions to regulate alcohol in rural communities (Berman et al., 2000).
Moves Among Alaska Schools
The results for teacher moves between Alaska schools, displayed in the middle column in Table 2, show a significant positive correlation between moving to a new job and higher predicted compensation in the new job relative to the old job. Provision of housing has a negative sign, suggesting that availability of adequate private housing in larger communities draws more experienced teachers (though earlier in their careers, they may have been willing to take jobs smaller communities with limited housing). Having more personal leave days and a paid travel allowance were negative and significant, again suggesting inadequate district attempts to compensate for more difficult working and living conditions. Interestingly, teachers were more likely to move away from cities, which have lower living costs as evidenced by the fuel price variable. Although, the significant negative preference for jobs in communities with higher poverty rates and higher percentages of non-Asian students of color—other than for AIAN teachers teaching AIAN students—suggests a preference for smaller towns with access to amenities rather than remote rural communities. As expected, potential loss of tenure is a large and significant deterrent to moving to a new district.
Demand for Qualified Teachers
The right-most column of Table 2 displays results of estimating Equation (5) for the demand for qualified teachers. Observations represent schools, and the dependent variable is the percentage of core classes taught by HQ teachers in the school in a particular school year. Estimates of Equation (5) were limited to the 4-year period when schools could face penalties for failing to meet the NCLB legislated standard. As expected, the price was negative and the ability to pay, as measured by the per-capita tax base, was positive. Both were highly significant (p < .001). The results estimate that a 10% increase in the price of qualifications, as measured by the school’s hedonic salary relative to Anchorage, would reduce the percentage HQ by 3.9% (95% CI −0.28 to −0.49).
The non-wage benefit costs to the school all have negative signs as well. However, only provision of teacher housing and personal leave days are significant, not counting the cost to the school district of health insurance, which is included in the salary. The school incurs the cost of hiring substitute teachers for the additional personal leave days, and although teachers pay rent for housing, it is presumably subsidized. The significant negative coefficients on housing and personal leave days imply that the cost of these benefits exceed their value. However, the housing provision likely signals that housing in the community is limited or unavailable, and expanded personal leave allowance—over 10 days per year in several cases—attempts to mitigate teacher burnout from acknowledged difficult working and living conditions.
Inferred Adequate and Equivalent Compensation
One may derive a measure of adequate compensation by applying Equation (2) using the coefficients estimated for the percentage of core classes taught by HQ teachers shown in the demand equation in Table 2. Although teacher salaries are typically negotiated through collective bargaining at the district rather than school level, the inferred adequate compensation varies by community and school as well as by district. To generate estimates of changes in compensation to reach the adequate level, we calculated the change in relative hedonic salary of teachers with a master’s degree, holding all other variables constant, which would cause the linear prediction of the censored regression to evaluate to 1.0.
Figure 2 displays the scatter plot of the linear prediction for the average level of teacher qualifications and the the predicted salary that each of the 462 Alaska public non-charter schools would have to pay to attract and retain all highly qualified teachers. Predicted qualifications, defined here as the percentage of core courses taught by HQ teachers, ranged from about 60% of the 100% target to about 5% above the target. The associated salaries ranged from about 60 to 320% of the Anchorage compensation. Since the salary and the predicted qualifications are both measured as ratios, the slope of the figure represents an elasticity of demand. The estimated magnitude of about −0.5 indicates that for every 2% increase in the hedonic price of a teacher relative to Anchorage, the school buys 1% lower qualifications.
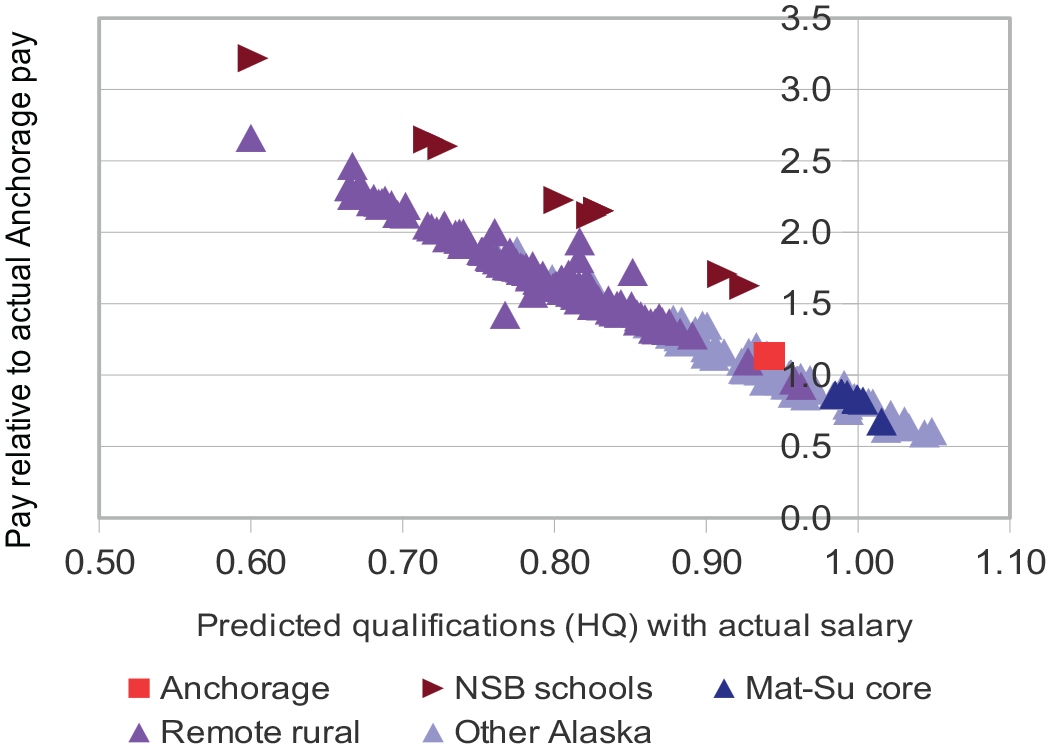
Salary Required for all Alaska Schools to Attract and Retain Highly Qualified Teachers.
The tight clustering of predicted supply around the downward-sloping line in Figure 2 illustrates that differences in hedonic compensation represent the main cause of differences in teacher qualifications. Schools may also purchase more or lesser qualifications depending on their fiscal capacity, which shifts the demand curve. Mat-Su “core” schools—schools in the communities of the Matanuska-Susitna Borough that are Anchorage suburbs—are able to achieve highly qualified teachers by paying less than Anchorage, which would have to raise its salaries by about 13% to reach the 100% threshold. The Anchorage result is primarily driven by elementary schools serving lower income ethnically diverse areas of this large urban school district. In general, location disadvantages impose substantial hedonic price penalties on remote rural schools, which few have the resources to overcome. North Slope Borough schools represent somewhat of an exception. The borough includes the North Slope oil fields, and is able to tax the infrastructure, giving it a high fiscal capacity. Its schools appear above the line in Figure 2 (demand curve shifted upward and to the right), but except for schools in Utqiagvik, a larger community with more amenities, the harsh climate and remoteness leave them still struggling to fill all positions with highly qualified teachers.
Only about 6% of schools, mostly located in small cities in Southcentral and Southeast Alaska, paid more than necessary. Meanwhile, 91 of 462 schools (or 22%) would need to raise salaries by more than 50%—25% more than the Anchorage baseline—to achieve the modeled adequate compensation level. These schools are mostly located in small rural communities in Western and Northern Alaska.
Discussion
The diversity of employee benefit packages found in collective bargaining agreements within one state—Alaska—adds another dimension and area of opportunity around previous teacher pay studies such as Godby (2010), Goldhaber et al. (2010), Graves et al. (2002), Hanushek et al. (2004), and Tuck et al. (2005), that assume that benefits vary little between districts. Our review of collective bargaining agreements revealed significant differences, and our results indicate that these benefits do affect teacher recruitment and retention. However, the results illustrated that adding employee benefits to a HWM is not straightforward, and requires care in interpreting the results, due to failure of labor markets to clear.
In particular, we found expected (positive) signs for various non-wage benefits in some cases yet counter intuitive (negative) signs in others. The negative signs suggest that districts may attempt to substitute enhanced benefits for wages when there are institutional barriers to raising salaries enough to clear the market. The negative sign for a benefit with a clearly positive value, combined with strong positive effects for salary, indicates that total compensation remains too low to attract and retain HQ teachers. This aligns to other research that has considered the effect of such incentives in practice (see A+ Colorado, 2016; Feng & Sass, 2017). In other cases, our results found that benefits appear to correlate with geographic variation in prices of specific, high-cost services like health care, housing, and travel in remote rural areas, rather than measuring real differences in the quantity or quality of these services.
We found large differences in equivalent salaries. Rather than ascribe too much to the variation in average numerical differences among schools in the three different specifications, we focus instead on the broader finding that the differences among the implied projections of equivalent pay suggest that different compensation mechanisms are needed to attract a teacher to a job than are needed to retain the same teacher. Teacher turnover is not only the main driver of the nation’s teacher shortage (R. Ingersoll, 2003), but it also increases costs and impairs teaching and learning in a variety of ways (Allensworth et al., 2009; Carroll, 2007; DeFeo et al., 2017; Guin, 2004; Hakanen et al., 2006; Loeb et al., 2005; Milanowski & Odden, 2007). Our results suggest that teachers might be initially willing to take a job in a new place, but they make different choices once they arrive and obtain more information and gain experience. This suggests that using compensation as a tool to address equity in education outcomes would require attention to retention as well as to recruitment.
Even if salary differentials were successful in attracting teachers of exactly equal qualifications to both highly desirable and less desirable assignments (see also Feng, 2020), the literature suggests that teachers need to be more skilled (or take more time to train up) when they work with students from diverse backgrounds (Guin, 2004). In other words, the translation of teacher qualifications to teacher effectiveness is variable and context-dependent, and the presumption that teacher quality has “a single underlying dimension … [that is] constant for all students” (Hanushek et al., 2005, p. 18) and in all teaching contexts is problematic. Ideally, examinations of teacher quality would use a better measure of teacher effectiveness than teacher qualifications. However, this is both logistically and politically challenging, particularly when school characteristics are highly correlated with student characteristics and teacher qualifications. Moreover, teacher effectiveness changes over time. Kraft and Papay (2014) noted that differences in teacher improvement over time were linked to school placements; that is, teachers in better-resourced schools received better professional development opportunities that increased their effectiveness over time. This underscores the importance of our study’s broader objective to achieve equity in hiring, as individual-level differences culminate in greater school-level disparities. It also stresses the limitations of applying our analysis to achieve teacher equity through compensation alone, as it does not make up for differences in professional development opportunities.
Our study was designed to measure school, community, and school district differences in equivalent compensation. However while the Alaska schools studied have large geographic, social, and economic disparities among rural areas, only two of Alaska’s urban school districts—Anchorage and Fairbanks—have multiple schools with disparities in student characteristics within the same metropolitan area, a common feature of urban school districts in other states. This made it difficult to measure how differential student characteristics affected teacher move patterns within schools in the same community. How differences in student characteristics and working conditions affect equivalent teacher compensation within a community remains an area of research opportunity (see also Loeb et al., 2005).
Though 52% of the nation’s student body is comprised of racial minorities (National Center for Education Statistics [NCES], 2020), the U.S. teaching workforce is predominantly White (R. Ingersoll & May, 2011; NCES, 2019). Considering the objective of attracting more teachers of color to jobs in racially minoritized communities, our analysis found that Alaska Native teachers were significantly more likely to stay in schools with high Alaska Native student populations, suggesting that hiring teachers from underrepresented racial minority groups would be highly effective for reducing turnover in schools with high enrollments of students of color. The effectiveness (see also Espinoza et al., 2018; Hwang et al., 2022; Motamedi & Stevens, 2018; Sleeter, 2008) and challenges (see also Carter Andrews et al., 2019; Carver-Thomas, 2018; Simon et al., 2015) of hiring teachers of color have been well documented. Our analysis adds the dimension of teacher retention to the growing body of literature underscoring the need to further diversify the teaching profession.
Our study modeled how compensation systems may be used to recruit and retain teachers of equal qualifications to different communities. Evidence from the field—that is, what districts are already doing—suggests that higher salaries do attract more qualified teachers, including high-performing teachers to high-need areas (Jones & Hartney, 2017). Subject-based incentives may attract teachers, too, and, if substantial enough, retain them in high-need schools (Bueno & Sass, 2019; Feng & Sass, 2017). However, most implementations of these policies are imprecise and inelegant, without a systematic mechanism for calculating what differentials should be. In current practice, as we demonstrated in Alaska, a few schools are paying more than they need to, while the majority—particularly those serving traditionally underrepresented students or difficult-to-staff geographies—are not paying enough.
Moving from the empirical exercise of identifying significant relationships between variables to a policy recommendation is more challenging. The most comprehensive way to apply our findings to achieve salary equity would be through a state-wide salary schedule for teachers inclusive of community-level differentials, instead of separate agreements in each district. In practice, several states have legislated salary schedules. 8 However, philosophically, such an approach also challenges local control, and some legislatures (e.g., Ohio and Texas) change laws related to teachers’ salaries so frequently that descriptions of their salary schedules are quickly obsolete. Achieving pay equity through top-down salary legislation may also challenge other equity-based initiatives. 9 Thus while we find this empirical exercise valuable, we do not advocate for applications that would disempower community-based approaches.
The evidence for institutional obstacles to raising salaries enough to equalize teacher qualifications in underserved areas found in our study indicate that these obstacles may be difficult to overcome. Achieving equity of teacher qualifications would likely require that policymakers and district leaders also implement non-compensation strategies for improving working conditions in high-need schools. As various actions to change working conditions in individual schools work at varying speeds, salary differentials derived from models like ours would need to be updated and reassessed regularly. 10
Directions for Future Research
Our analysis of teacher hiring and movement patterns across Alaska’s 462 schools in 53 school districts builds on previous studies of equivalent compensation by explicitly considering the effects of employee benefit packages and the failure of observed salary and benefit packages to clear teacher labor markets. We explored how salaries and benefits affected the desired goal of meeting the demand for qualified teachers in all schools by not just recruiting but also retaining highly qualified teachers.
Limitations of our study raise several opportunities to build on our findings with additional research. One area would be to extend our analysis to address intra-community variation in required equivalent compensation—such as in large urban school districts—to separate effects of student characteristics from characteristics of neighborhoods where teachers can live while commuting to their jobs. Another significant area of opportunity for future research remains in defining and measuring teacher effectiveness outside of the easily quantified qualifications of education and experience. Although the analysis of individual teacher retention and mobility patterns is robust, we used HQ teachers as defined by NCLB, which is a crude and now obsolete measure.
The empirical challenges we enumerated in our literature review and encountered in our own analysis underscore the need for more inquiry in this area to address noted methodological gaps and data limitations. Our statistical analysis only measured effects of what we could observe, and teachers have many characteristics that influence their decisions about employment that we are not able to measure, such as personal beliefs and values. To the extent that there is a systematic effect on the ability of schools to attract and retain enough highly qualified teachers, these unobservable characteristics will affect our results.
Inquiry should also consider how to improve working conditions, as equity cannot truly be achieved through salary alone. Successful implementation of such findings through policy must be feasible politically, financially, and with respect to local control.
To achieve equity in teacher qualifications across Alaska’s schools, our results suggest the need to raise teacher salaries or improve working conditions in many schools, although salaries could be reduced in some places. These recommendations must be met with sufficient funding for implementation. As working and community conditions and national teacher labor markets change over time, the predicted salaries will change as well, and models like ours need periodic updating.
Conclusion
Our work makes a methodological and empirical contribution, but the disparities we see around equal salary, to the extent that they represent working conditions and not community characteristics, document the broader challenges of systemic education inequities. School districts may have limited ability to improve many of these conditions (e.g., availability of amenities, or how cold or dark a community is). In such instances, about the only tool available to districts is to try to increase compensation. Our contribution is to quantify the amount that would be needed. Equitable compensation to attract better qualified teachers to classrooms would help to level some of the existing discrepancies, but not all of these discrepancies are static. Large salary variations as recommended by our model could be an important step, but as we move toward equity in our schools, we would hope that over time, we would see salary differentials connected less to variations in school working conditions, and more to community characteristics.
Footnotes
Declaration of Conflicting Interests
The authors declared no potential conflicts of interest with respect to the research, authorship, and/or publication of this article.
Funding
The authors disclosed receipt of the following financial support for the research, authorship, and/or publication of this article: This research was funded in part by National Science Foundation Robert Noyce Teacher Scholarship Program grant (2050440 and 2050559). Any opinions, findings, conclusions, or recommendations expressed in this material are those of the authors and do not necessarily reflect the views of the National Science Foundation.