
Abstract
We use a novel linkage of school district administrative data to Internal Revenue Service records to study educators’ post-exit career outcomes. The majority of leavers remain in education and mean earnings are slightly below pre-exit earnings even 8 years later. However, these average changes conceal wide variation in outcomes. Roughly 20% of leavers are unemployed, and the bottom quartile of employed leavers earn less than $20,000 annually. At the same time, earnings among the top quartile of employed leavers are higher than those of nearly all stayers, sometimes exceeding $100,000. Post-exit employment and earnings declines are associated with the presence of children or a high-earning spouse for voluntary female leavers, suggesting a role for family-conscious policies for teacher retention.
Introduction
Teacher turnover, its causes, consequences, and potential solutions are long-standing concerns among school leaders and researchers alike (Hanushek et al., 1999, 2004; Harris & Adams, 2007; Kershaw & McKean, 1962; Murnane et al., 1989; Murnane & Olsen, 1989). Turnover can harm student achievement and learning, and degrade school climate, staff cohesion and collaboration, and student–teacher relationships (Guin, 2004; Hanselman et al., 2016; Henry & Redding, 2020; Redding & Henry, 2018; Ronfeldt et al., 2013). 1 Estimates suggest that recruiting, hiring, and training new teachers costs public school districts more than $2.2 billion annually and occupies resources and administrative capacity that could be devoted to supporting instruction (Barnes et al., 2007; Darling-Hammond & Sykes, 2003; Garcia & Weiss, 2019a; Haynes, 2014; Horng et al., 2010; Ronfeldt et al., 2013). Despite relative stability in overall levels of teacher turnover (Goldhaber & Theobald, 2022), many individual districts consistently struggle to fill vacant positions and all but six states recorded teacher shortages in key areas in recent years (Carver-Thomas & Darling-Hammond, 2017; DiNapoli Jr, 2021; Grissom & Reininger, 2012; Sutcher et al., 2016). Such challenges are particularly acute in urban districts with large concentrations of racially and economically marginalized students (Carver-Thomas & Darling-Hammond, 2017; Darling-Hammond & Sykes, 2003; Hanushek & Rivkin, 2008; Papay et al., 2017).
Teacher wage penalties and greater earnings opportunities outside of teaching are often touted as prime contributors to teacher turnover (Allegretto & Mishel, 2019; Garcia & Weiss, 2019b; Liu & Aubry, 2021; Stinebrickner, 2002). A substantial literature documents how compensation contributes to teacher mobility within the K–12 sector (Hendricks, 2015; Imazeki, 2005; Knight, 2020; Murnane et al., 1989; Murnane & Olsen, 1989, 1990). However, due to data limitations, prior studies that examine the post-exit outcomes of teachers are unable to follow individuals who move between survey waves or across-state boundaries (Chingos & West, 2012; Grissom & Reininger, 2012; Han, 2021; Podgursky et al., 2004; Scafidi et al., 2006; Stinebrickner, 2001, 2002). They are also unable to characterize a teacher’s household financial situation to understand the degree to which family structure and spousal earnings affect labor market decisions.
We extend and advance this literature examining the post-exit labor market outcomes of educators using a novel combination of human resources data from a diverse, urban public school district in the western United States linked to Internal Revenue Service (IRS) tax returns reported on individual and household W-2s, 1040s, and data from the U.S. Census Bureau. This linkage creates detailed data on annual earnings and employment for all educators leaving this school district over a period of 12 years, from 2003–2004 to 2014–2015, providing a unique opportunity to investigate how multiple aspects of teachers’ professional, financial, and personal lives might impact turnover and subsequent career success. We examine outcomes for leavers at all experience levels who relocate anywhere within the United States for up to 8 years after they exit. We also examine the subsequent fields of employment for teachers and consider how family factors and geographic mobility relate to their subsequent labor market outcomes. Examining outcomes with information about career stage, leave reason, family factors, and cross-state mobility provides a comprehensive, nuanced understanding of the variability in the opportunity costs facing teachers and the possibility of targeted policy solutions to stem the increasingly widespread, persistent school staffing challenges.
Our results show that more than half of leavers obtain another position within education, while a fifth exit the labor force entirely, and less than a quarter find a position outside of education. 2 Moreover, despite persistent concerns that educators are leaving the field to obtain higher incomes elsewhere, we find that the median employed leaver makes less than before they left teaching and their earnings do not recover nearly a decade after exit. Staying in education is also associated with larger earnings increases, on average, than leaving the field of education altogether. These broad trends, which are largely consistent with the prior literature, suggest that factors other than earnings may have contributed to exit decisions for the average leaver.
This picture of modest post-exit outcomes on average conceals substantial heterogeneity. While many leavers experience earnings losses they never recover, a subset of teachers experience significant earnings gains after leaving. Heterogeneous post-exit outcomes also suggest that different competitive forces from inside and outside of education may contribute to turnover in ways that vary along professional, personal, and family factors. Leavers who had an established foothold in education were more likely to move into other positions in education and experience earnings gains. This suggests that state-level efforts to reduce salary differentials between districts within the same region may help mitigate some degree of turnover, particularly among more veteran educators. At the same time, many novice teachers experienced comparably large earnings increases if they left education, where the top decile roughly doubled their final Coastline Unified School District (CUSD) earnings within 4 years of exit. This highlights the varied opportunity costs of remaining in education by experience and the challenges retaining novice teachers in competitive labor markets (consistent with Han [2021]). Despite prior evidence of variability in post-exit earnings by teacher quality (Chingos & West, 2012), we find no clear pattern of post-exit outcomes by value-added; however, we have relatively few educators from tested subjects and estimates are imprecise. We also find minor earnings differences by subject area, but the top decile of leavers with science, technology, engineering, and mathematics (STEM) expertise that work outside of education also have earnings that exceed $100,000 relatively soon after exit. Thus, a small subset experience substantial income increases after exit and their teaching positions would require large salary changes to remain competitive. However, the majority of employed leavers experience modest earnings changes or even earnings losses, suggesting that salary may not be the primary factor motivating their exit and that salary increases alone may insufficient for increasing retention.
Our results also highlight how family factors contributed to employment and earnings outcomes. We find notable differences across gender and leave reason, with male leavers having a higher likelihood of employment and being more likely experience earnings increases compared with female leavers. Having children at home was associated with negative outcomes especially for voluntary female leavers, while spousal income had countervailing relationships with employment and earnings for different groups. Our results suggest that temporary benefits, such as childcare and housing assistance, as well as more permanent benefits related to subject area expertise may be useful approaches for districts that are attempting to improve teacher retention.
The rest of the article is structured as follows. Section “Background” presents background on the existing literature on teacher mobility and post-attrition labor market outcomes. Section “Data and Method” then describes the unique data and methods that we use to lend evidence to these debates, and Section “Results” describes our results. Section “Conclusion” compares our findings with others in the literature and discusses policy implications of our results.
Background
Prior literature has documented that the vast majority of teacher turnover is voluntary (Carver-Thomas & Darling-Hammond, 2017) and identified a variety of factors explaining this turnover (see Borman & Dowling, 2008; Grissom et al., 2015; Guarino et al., 2006 for summaries). A wide array of structural conditions of their teaching assignments, educator qualities, preparation, and experience, and preferences have been identified as contributing to exit from the teaching profession. Teaching also facilitates a temporary exit around childrearing and other caretaking in ways that other professions may not (Dolton & van der Klaauw, 1999; Grissom & Reininger, 2012; Murnane et al., 1989; Stinebrickner, 2001, 2002).
Among the myriad reasons identified as contributors to teacher turnover, one of the most frequently cited drivers of and solutions to turnover is teacher compensation. The focus on teacher compensation is justified by numerous examples of how differences in financial opportunities within the K–12 education sector influence teacher turnover, sorting, and quality. This includes research on how pay directly impacts turnover (Clotfelter et al., 2008; Hendricks, 2015), affects sorting between and within school districts (Hough & Loeb, 2013; Imazeki, 2005; Steele et al., 2010), how flexibility of pay options affects turnover (Biasi, 2021; Biasi et al., 2021), and how pay tied to performance metrics can affect retention (Dee & Wyckoff, 2015). 3
A resulting and enduring argument from this research is that teachers’ fairly uniform salary schedules prioritize experience over skill development and schools are insensitive to differences in teachers’ opportunity costs outside of education (Dolton, 2020; Hanushek et al., 1999; Harris & Adams, 2007; Kershaw & McKean, 1962; Murnane et al., 1989; Murnane & Olsen, 1989). Others note teachers’ financial disadvantage by comparing teachers’ earnings with those of other college- and master’s educated workers. 4 These arguments often culminate in a conclusion that turnover is high because teachers are “lured” away to higher-paying nonteaching jobs, particularly if teachers possess stronger skills, subject area expertise, or other special qualifications, particularly from high-poverty schools (Bland, 2015; Ingersoll & May, 2012; Ingersoll & Perda, 2010; Kershaw & McKean, 1962; Nguyen & Redding, 2018; Stinebrickner, 2002). At the same time, survey evidence indicates that teaching is often a “career of personal choice” that educators pursue despite perceptions of low salary (Watt et al., 2021).
An arguably more direct test of the salary pressures facing school districts is whether teachers who exit K–12 teaching realize financial improvements. A small number of studies have used either nationally representative survey data (i.e., the National Longitudinal Study of Youth or the Current Population Survey) or linked school human resource and state unemployment insurance (UI) records to examine labor market outcomes for educators who leave the profession (Chingos & West, 2012; Grissom & Reininger, 2012; Han, 2021; Podgursky et al., 2004; Scafidi et al., 2006; Stinebrickner, 2001, 2002). Across most of these studies, a great degree of turnover stems from mobility within education to K–12 districts with higher salaries. Those who do leave K–12 schools are largely not moving to higher-paying fields outside of education. Instead, many transition to part-time positions or exit the labor force temporarily or permanently in conjunction with family formation. Goldhaber and Theobald’s (2022) similar comparison of the earnings of newly credentialed individuals who do and do not enter teaching using UI records in Washington affirms conclusions that options outside of education do not yield greater earnings for novice teachers. However, Han (2021) contradicts these results somewhat, finding large increases for individuals who leave teaching in their 20s and 30s and slight decreases for older leavers, underscoring the potential importance of career stage for earnings improvements relative to teaching.
There is also mixed evidence that indicators of teacher quality relate to better post-exit outcomes. For example, higher-ability teachers (as measured by ACT scores) were more likely to leave Missouri public schools but did not obtain higher-paying positions (Scafidi et al., 2006). In contrast, in Florida, teachers with higher value-added and additional degrees beyond a bachelor’s had earnings that were roughly 20% higher after leaving teaching (Chingos & West, 2012). This suggests that the opportunity wages facing teachers may not be equal, and that different dimensions of teacher quality are associated with greater financial opportunities outside of the classroom in some instances.
These studies provide insights into the career trajectories of former teachers. However, their limitations yield an incomplete picture of the labor market outcomes of exiting teachers. The prior studies using UI records cannot distinguish those who obtained employment outside of the state from those who exited the labor market, they primarily focus on novice teachers, and they exclude professions that are not included in the UI system, such as contractors. This excludes approximately one quarter to one third of former teachers, making it difficult to understand transitions out of the labor market among each study’s respective sample. Han (2021) examines a broader set of experience levels and time periods, but only observes individuals immediately after exit who do not relocate between survey waves. In addition, these prior studies that use administrative data cannot measure qualities of teachers’ households. It is quite possible that factors such as spousal earnings and the presence of children in the household have a pronounced impact on teacher labor supply. Likewise, these studies lack information about involuntary exit. Evidence from other fields indicates that displaced workers experience persistent earnings losses (Moore & Scott-Clayton, 2019). While the emotional burden of being released from a district through such a policy is evident among those who return (Kraft, 2015; Strunk et al., 2018), it is unclear whether negative signaling impacts subsequent career outcomes.
The financial environment facing teachers has evolved substantially since much of the prior work was conducted. Teachers’ salaries have remained relatively stable for many years while housing costs have surged, particularly in metropolitan areas with competitive labor markets (Allegretto & Mishel, 2019; Fay, 2017; Gould et al., 2019; Nittler, 2017; Richards & Wynn, 2019). Moreover, educators lost ground financially during the Great Recession and their earnings did not recover in the same way that those of many college-educated workers’ earnings did (Hansen, 2018). Differences are particularly pronounced in metropolitan areas with escalating housing costs (Fay, 2017). These combined factors contributed to widescale protests for more favorable compensation and other financial supports for teachers, and suggest that the financial calculus for educators may have changed since many of the earlier studies were conducted (Strauss, 2019; Yan, 2018).
Despite districts’ need to understand teachers’ economic opportunity costs, the ability to fully observe the earnings and career alternatives of individuals who leave teaching has been hindered by data limitations. Our study of post-exit educator labor market outcomes updates and extends prior work and is guided by the following research questions:
The findings from this study can inform district and state-level policy on the types of supports and incentives that might reduce teacher attrition, particularly in urban districts located in competitive labor markets.
Data and Method
Setting
Our study examines educators’ career and earnings outcomes after exiting a large, urban district in the western United States, which we pseudonymously refer to as Coastline Unified School District (CUSD) during the 2003–2004 to 2014–2015 school years. 5 CUSD provides an important case detailing the labor market dynamics of educators in districts in large metropolitan areas with higher costs of living that frequently struggle with staffing challenges. CUSD is one of the 20 largest districts in its state and has a diverse student population of more than 50,000 students, 6 with 82% identifying as students of color and 28% identified as English language learners (ELLs). Roughly half of CUSD students are enrolled in the free/reduced price meals (FRPM) program. These student demographics are comparable to those of many urban districts in the state. CUSD’s students have somewhat higher academic performance, 7 but the district had substantial achievement gaps before and after the adoption of the Common Core State Standards, particularly between lower-income African American and Latino students and more affluent White students. These gaps, while present in many other large school districts, tend to be larger in CUSD than in other districts in the state with similar proportions of students from these groups.
CUSD is located in a state with a decentralized educator wage structure, strong collective bargaining, and teacher salaries that are above the national average, which distinguishes it from the settings of prior studies (Han, 2021). 8 Because each district negotiates a salary schedule with its respective union, salaries can diverge by more than $10,000 for similar levels of experience even within the same geographic regions of the state. Average teacher salaries in CUSD exceed the state average by roughly $6,000 to $9,000 throughout our panel, but neighboring districts offer a range of salaries that are both higher and lower than CUSD’s. While the educator turnover rate in CUSD of 17% in 2016–2017 is roughly 5 percentage points higher than the state’s turnover rate, and slightly above the national turnover rate of nearly 15.8% in 2012–2013 (Goldring et al., 2014), CUSD’s turnover rate is similar to that of other districts in its immediate region serving similar student populations.
Several features of the broader economic context could also influence teacher turnover in ways that differ from the prior literature but are common among many urban districts in the contemporary period. CUSD is located within a relatively dynamic labor market creating many potential external opportunities for educators. While the region was negatively impacted by the Great Recession, it rebounded more quickly than some other areas. This strong labor market might mitigate the need to relocate for a partner’s employment. However, educators in CUSD, much like those in many metropolitan areas around the country, have expressed strong feelings of financial stress from slow salary increases and rapidly escalating housing costs (Clark, 2015; Dizon-Ross et al., 2019; Fay, 2017). CUSD is among the growing number of districts where the ratio of teacher wages to housing costs makes it challenging for teachers to afford rent or a down payment (U.S. Bureau of Labor Statistics, 2018; Maciag, 2016; Nittler, 2017; Zillow Research, 2022). Despite the high cost of living, the school districts located in these areas still require qualified teachers to educate their children (Allegretto & Mishel, 2016; Dolton, 2020). Thus, while CUSD faces academic, labor market, and cost of living challenges that distinguish it from the contexts examined in prior research, CUSD’s challenges are not unique within its state context or compared with urban districts in major metropolitan areas across the country. Thus, this setting provides an important opportunity to understand the possibilities and limitations facing teachers in many other urban contexts.
Primary Data
The base of our data comes from administrative records kept by CUSD human resources. CUSD employs more than 3,500 educators annually, and our sample of educators contains all types of certificated employees employed by the school district, including teachers, administrators, counselors, and speech and language pathologists in any of the 2003–2004 to 2014–2015 school years. These administrative records include a rich set of educator characteristics, including demographic characteristics, such as gender, race/ethnicity, and age; professional preparation and experience, including subject area expertise (STEM non-STEM); academic preparation including BA selectivity, if they have obtained an MA or higher, if they have National Board Certification (NBCT), if they ever received a bonus for teaching a hard-to-staff subject or in a hard-to-staff school; and final school assignment characteristics including the school level (elementary, middle, or high school), whether the student population in the school was above the district median percent Black, Hispanic/Latinx, and enrolled in FRPM.
For the purposes of our analyses, we focus on turnover from “leavers” who stopped working for CUSD before the 2015–2016 school year and classify “stayers” as those who remain employed in CUSD into the 2015–2016 school year. This includes anyone who worked for CUSD in the first year of our data or joined the district at any point during the panel but remained employed in the final year of our data. 9 Stayers also include those who changed schools but remained within the district.
We link these data to records at the U.S. Census Bureau using the Person Identification Validation System (Wagner & Layne, 2014) to connect each record with a Protected Identification Key (PIK). We successfully linked 99.7% of our exiting teachers to the Census Bureau’s administrative records infrastructure. 10 We then use the records with PIKs appended to link district administrative records to tax records from the IRS to identify our primary outcomes of interest: employment and earnings.
We draw our employment, employment sector, and wage earnings outcome measures from W-2 filings made by individuals and their employers. We verify that leavers are no longer employed in CUSD by confirming that they have no W-2 filings from the district in years after they are no longer observed in district records. We identify individuals as “employed” if they reported any taxable earnings through a W-2 filing. Because of the exceptional coverage of reported earnings in W-2s, it is reasonable to assume that if an individual does not report earnings via a W-2 in a given year, they are not working in the formal sector in the United States.
We identify educators’ subsequent job sector using the employer listed on their W-2 filing. For individuals with W-2 filings from multiple employers, we select the employer from which the individual earns the largest amount in the calendar year. We identify employer industry and location using the Census Bureau Business Register (BR), a comprehensive list of businesses in the United States constructed using IRS tax data in conjunction with data from the Census Bureau and other federal agencies. 11 We categorize businesses in the BR into “fields” using the North American Industry Classification System (NAICS) industry codes in conjunction with the name of the business. Within education we classify subsequent employers into fields that represent K–12 school districts (public and private) as well as higher education and research. Because we want to examine competitive pressures from other public school districts, we also report details about destination school districts within the same state. Using public information from the State Department of Education, we added an indicator for whether their post-exit employer was among the 20 largest school districts in the state. We also use information about the average salary offered by all remaining school districts in the state to identify school districts with higher average salaries than CUSD’s. Outside of education, we group employers into several general categories including health, government, and business. The remaining noneducation fields are combined into a fourth category called “other fields.” We create our annual earnings variable by aggregating all taxable sources reported in all W-2s for each educator in our sample, top coding at $500,000. 12
While W-2s provide clear information on formal employment and earnings, they have some limitations. First, they exclude any unreported income from informal positions and under-the-table work such as occasional tutoring, inherited wealth, or income earned from non-U.S. employers. In addition, W-2s are filed based on the calendar year running January through December while employment in CUSD is on an academic year cycle which typically runs approximately August through May in CUSD for most classroom teachers and through July for most administrators. The offset nature of the school calendar and tax year can contribute to dips in earnings in the final tax year of employment in CUSD and/or the first tax year of employment elsewhere during employment transitions. Because of the potential issues due to the discrepancies between tax and academic years, we consider the academic year prior to the last year the educator worked in the district as the base year for the analyses below.
Supplementary Data
To contextualize the results from CUSD, we examine similar post-exit outcomes from educators leaving public school districts in the 2012–2013 release of the Teacher Follow-Up Survey (TFS) of the Schools and Staffing Survey (SASS) data (National Center for Education Statistics, 2021). The TFS is a nationally representative sample survey of public and private K–12 teachers who participated in the prior year’s SASS data collection, designed to help understand factors associated with teacher mobility and turnover (see Goldring et al., 2014 for more details on the 2012–2013 TFS). We restrict our sample to respondents from school districts in which five or more teachers were initially sampled in the 2011–2012 SASS.
Method
We examine labor market outcomes for a sample of teachers who exit their school district (leavers) relative to their peers who remained (stayers) over a 12-year period. We begin by describing differences in demographic, professional, and residential characteristics between leavers and stayers. Pre-exit characteristics for leavers are reported using the year before they exited the district to avoid the split earnings from a partial tax year of employment in CUSD in the year they exit. Most outcome information for leavers is reported 1 year and 4 years after they leave CUSD, resulting in 2-year and 5-year changes in outcomes. Most information for stayers is reported from the final year of our data (the 2014–2015 school year and the 2015 tax year). While this may bias some aspects of the pool of stayers toward the end of our panel, it also avoids integrating individuals who eventually become leavers into the pool of stayers in an earlier year. Where possible, we also compare similar characteristics among leavers in the TFS sample.
We present employment outcomes for all leavers and several subgroups, including their subsequent fields of employment 1 and 4 years after exit, with additional detail for those that remained in K–12 education settings. We also investigate a series of often suggested mechanisms that might relate to unemployment after exit, specifically children, relocation, and changes to spouses’ employment. We compare these employment outcomes to comparable outcomes in the TFS.
Because we are especially interested in understanding the opportunity costs of remaining in CUSD positions, we examine post-exit income in several ways. First, we show income trajectories for leavers for up to 8 years after leaving CUSD. We center these trajectories on leavers’ final year in CUSD and include up to 4 years of income while employed by CUSD prior to exit. We also plot income for individuals who do not leave the district during our panel (stayers), including individuals who joined at any point and remained employed in the 2015–2016 year. 13
Second, to examine the variability in income after exit, we present percentiles of income changes for individuals employed inside and outside of education fields after exit. We show the 10th, 25th, 50th, 75th, and 90th percentile earnings in each year relative to their final year in CUSD. We contrast these with earnings percentiles for stayers. We show these results for our full sample as well as several subgroups (novice, female and male, and STEM and non-STEM leavers and stayers).
Finally, to understand factors that might relate to leavers’ subsequent labor market outcomes, we test for differences in the likelihood of employment 1 and 4 years after exit. We estimate a series of linear probability models separately to examine relationships between employment and a host of personal and professional characteristics, including demographics, professional preparation, experience, pre-exit earnings, spousal career and earnings, presence of children, and school characteristics. These models control for years of experience in the district and year fixed effects. In a set of similar models, we predict the change in annual earnings between the year prior to CUSD exit and 1 year after exit. We likewise estimate a series of models examining the likelihood of CUSD exit. These models are not intended to identify the causal effect of these factors on post-exit employment, earnings, or likelihood of exit, but instead offer insight on the relative importance of various demographic, familial, and professional characteristics in predicting labor force outcomes among former CUSD teachers.
Privacy Protection Procedures
Because our data reflect substate estimates and involve individual-level tax return data, the U.S. Census Bureau Disclosure Review Board requires the use of a noise injection algorithm that follows the principles of differential privacy. 14 In practice, the error does not qualitatively affect the results and the level of noise added is typically smaller than sampling error. See Appendix B for more details.
Results
Sample Characteristics
Table 1 provides detailed information about individuals who left CUSD during the 2003–2004 to 2014–2015 school years and compares them with individuals who remained in CUSD (“stayers”). 15 Roughly 3,400 educators left CUSD, while approximately 4,000 educators remained employed in the district through the 2015–2016 school year. 16 The third column of Table 1 then compares these groups with leavers from the SASS TFS.
Descriptive Statistics Comparing Teachers Who Leave and Teachers Who Stay in Coastline Unified School District (CUSD)
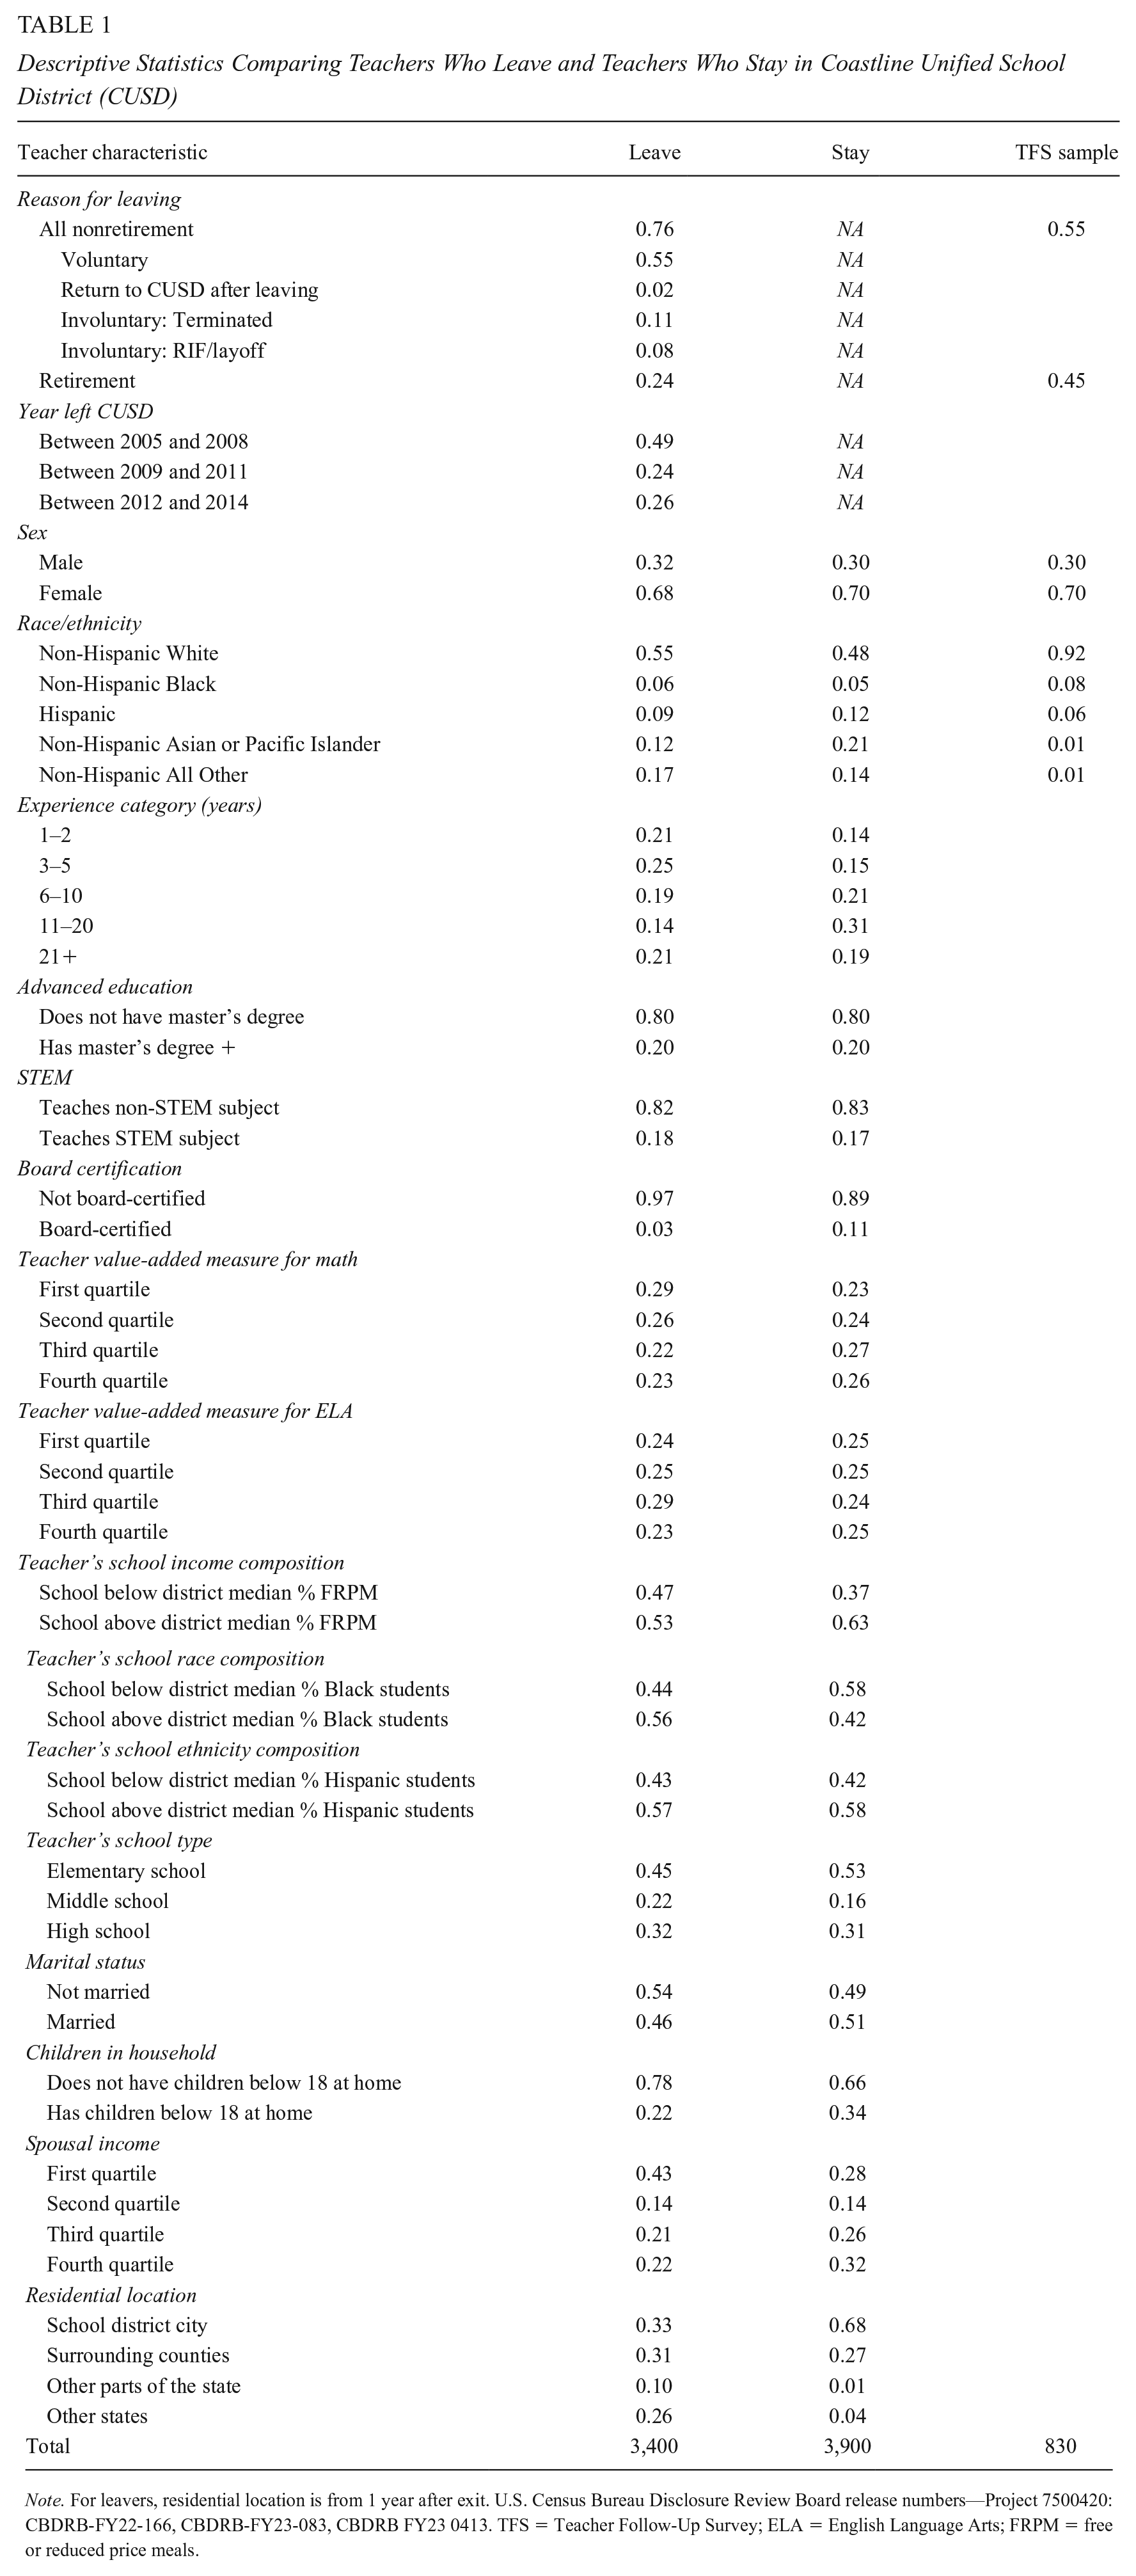
Note. For leavers, residential location is from 1 year after exit. U.S. Census Bureau Disclosure Review Board release numbers—Project 7500420: CBDRB-FY22-166, CBDRB-FY23-083, CBDRB FY23 0413. TFS = Teacher Follow-Up Survey; ELA = English Language Arts; FRPM = free or reduced price meals.
As Table 1 indicates, the majority of CUSD leavers left voluntarily (55%). Nearly a quarter retired, compared with 45% of leavers in the nationally representative TFS sample. During this period, CUSD also dismissed roughly 20% of exiting teachers through three different involuntary mechanisms: termination at the end of a short-term assignment (denoted Term Leaver), end of contract prior to receiving tenure in a particular role (often called Reduction in Force 17 [RIF]), resulting from the need to reduce staff due to budget uncertainties and typically following reverse seniority within job category), and layoffs for poor performance. 18 Nearly half of the leavers departed before the Great Recession (2005–2008) and a quarter each left in the other two periods, during (2009–2011) and after (2012–2014) the Great Recession. 19
Leavers are generally less experienced, have lower value-added, are more diverse, and tend to come from schools with higher percentages of students of color than others in the district or national averages, though they have similar levels of education. However, this profile of leavers more closely resembles leavers from many urban school districts, particularly those in the same state, and the types of urban districts that struggle with high turnover rates (Ingersoll et al., 2019; Papay et al., 2017).
Family and residential factors also distinguish stayers and leavers. Leavers in our sample are less likely to be married or have children than stayers, and, if married, are more likely to have lower-earning (or nonearning) spouses than stayers. While roughly two thirds of stayers reside in Coastline City, only one third of leavers reside there 1 year after exit. There is substantial post-exit out migration; roughly 10% of leavers subsequently reside elsewhere in the state and more than one quarter live outside the state, which is substantially greater than what is observed in other studies of teacher mobility (e.g., Papay et al., 2017). 20
Employment After Exit
Table 2 presents employment outcomes for former nonretiring educators overall and by gender and leave type 1 year after CUSD exit. The final column presents available comparisons to TFS leavers.
Employment Outcomes for Teachers 1 Year After Leaving Coastline Unified School District
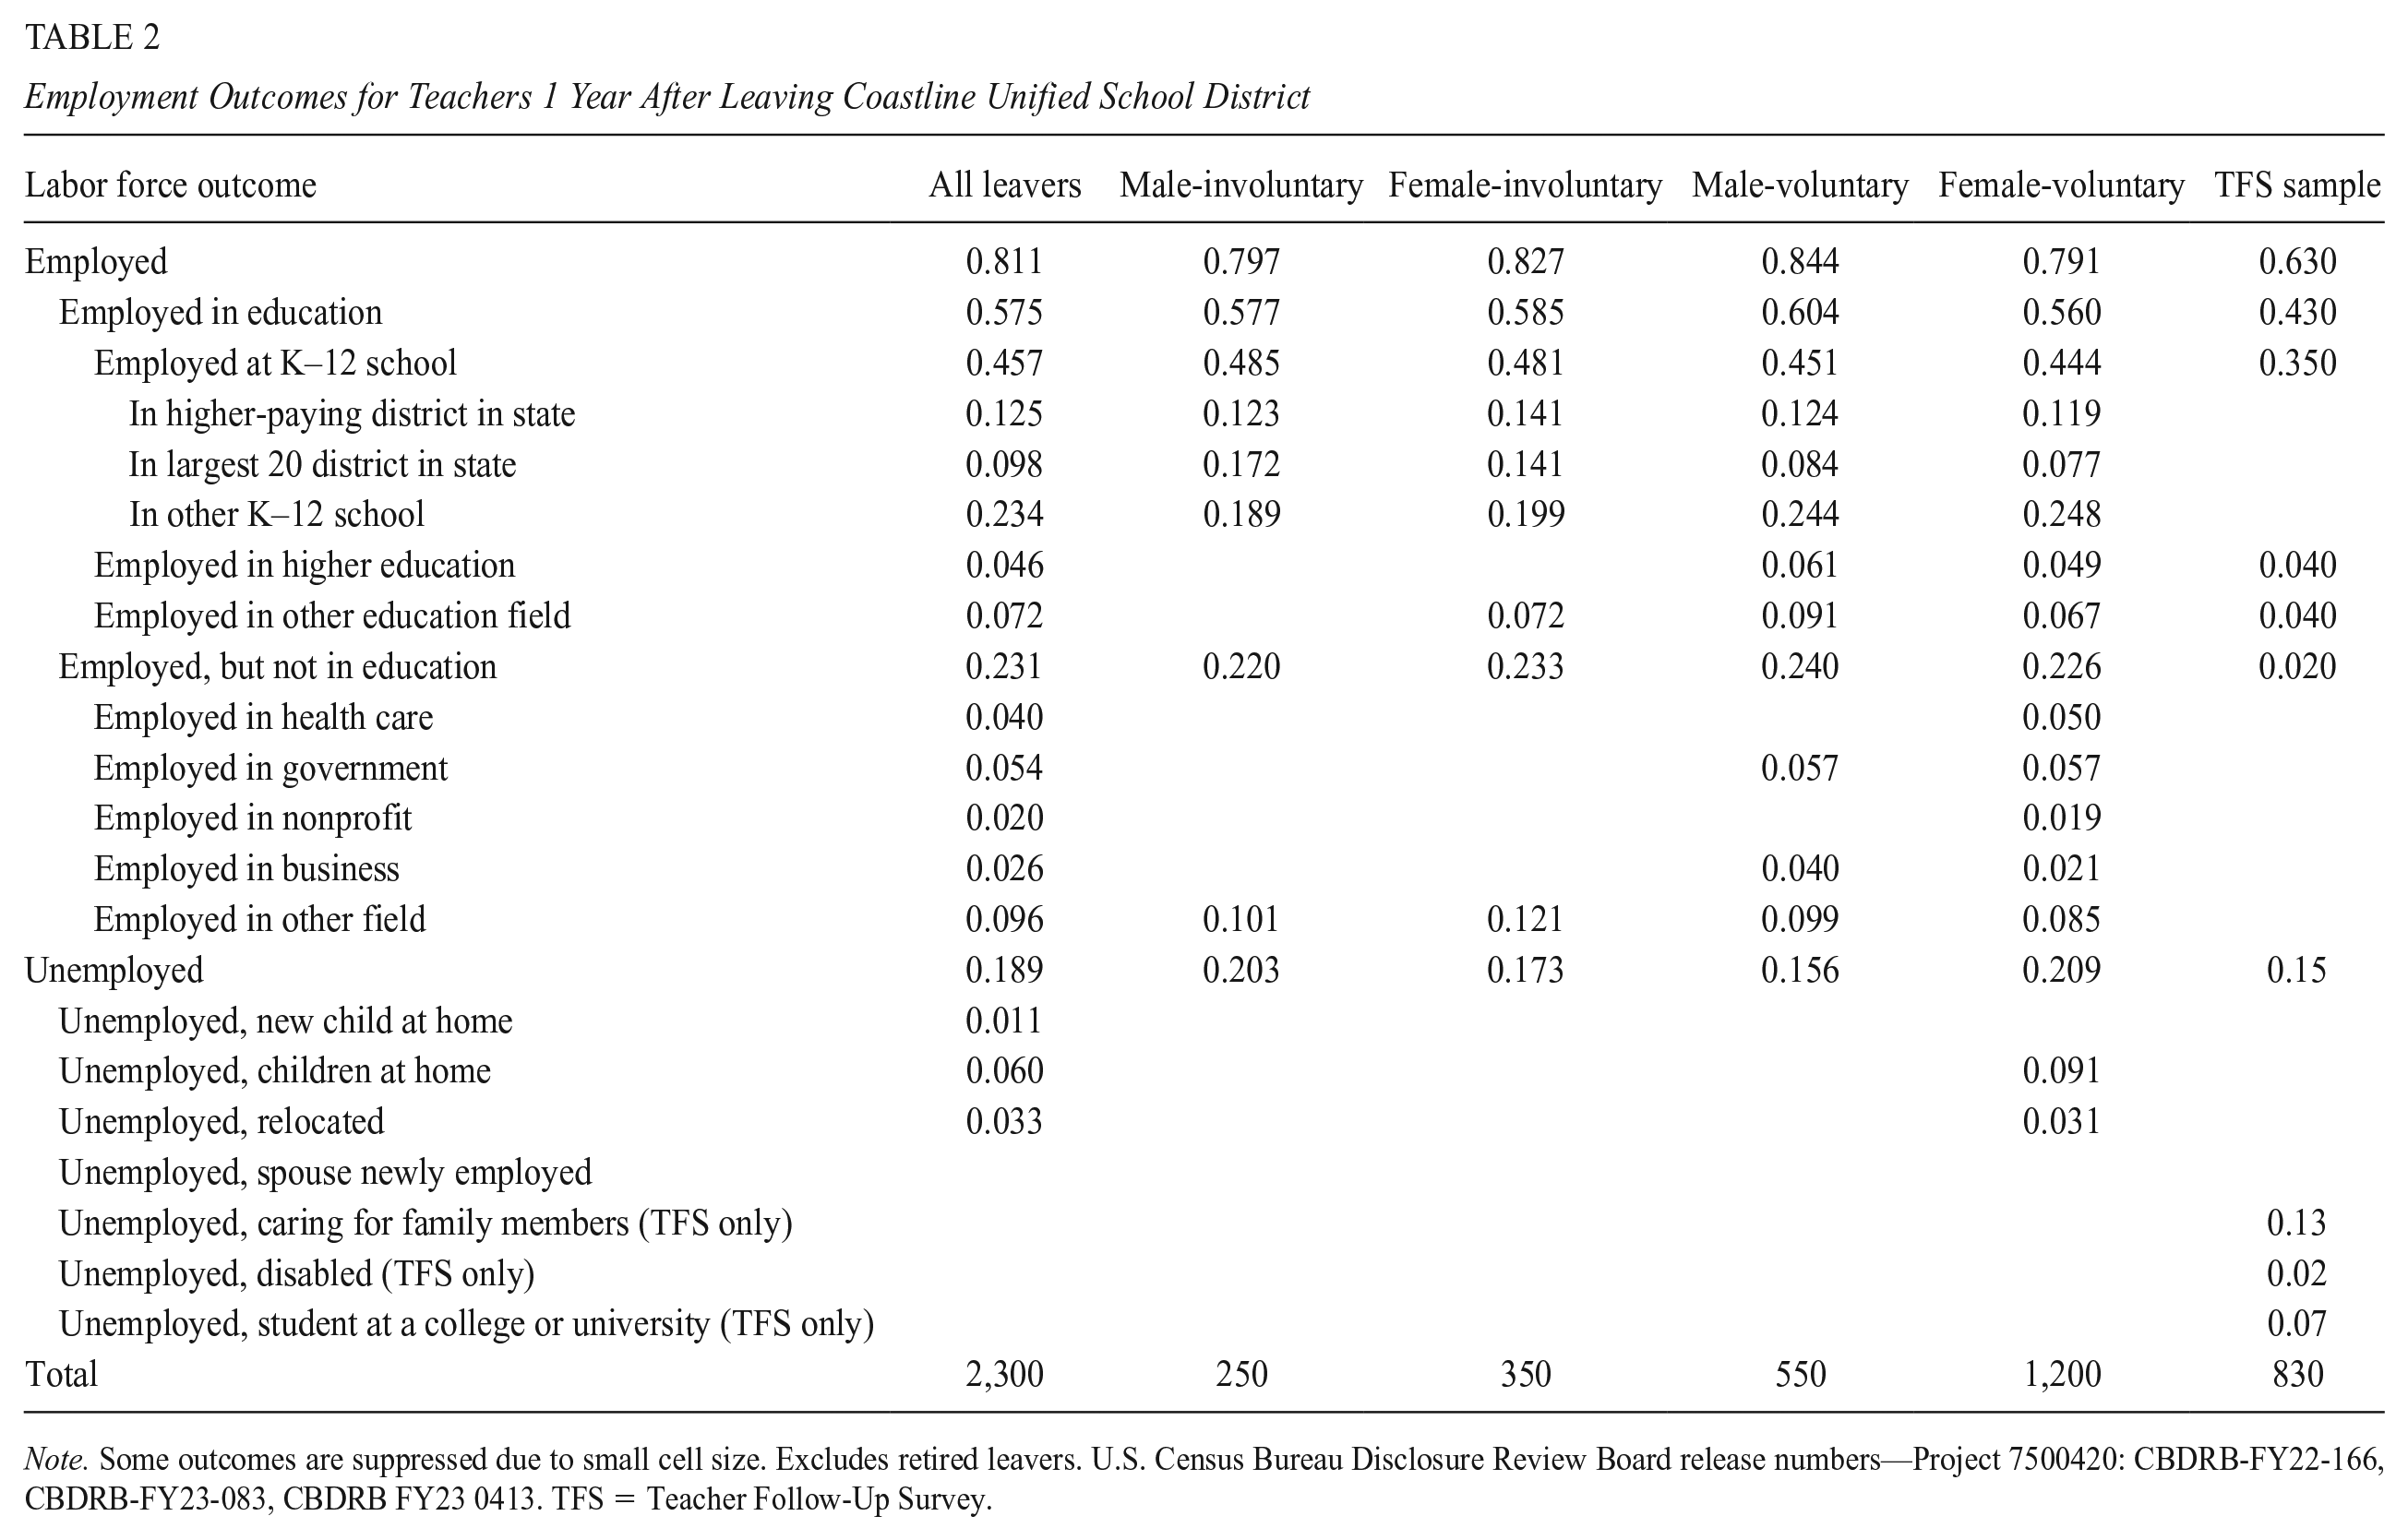
Note. Some outcomes are suppressed due to small cell size. Excludes retired leavers. U.S. Census Bureau Disclosure Review Board release numbers—Project 7500420: CBDRB-FY22-166, CBDRB-FY23-083, CBDRB FY23 0413. TFS = Teacher Follow-Up Survey.
One year after exiting CUSD, roughly 81% of nonretiring leavers are employed, varying somewhat by leave reason and gender. Male voluntary leavers have the highest employment rates and female voluntary leavers have the lowest. Employment rates are slightly lower across all groups 4 years after exit, but this is not unexpected if older leavers subsequently retire (see Supplementary Table A.1 in the online version of the journal). Supplemental results in Supplementary Table A.2 (in the online version of the journal) indicate that leavers with the least experience are the most likely to be employed after exit.
The majority of CUSD leavers work in education after exit (roughly 58%). Results in Supplementary Table A.2 (in the online version of the journal) indicate that the most- and least-experienced leavers are the most likely to remain employed in education (over 60% of both groups). Roughly 46% of leavers work in another K–12 school district, including 12.5% in higher-paying districts and 10% in the state’s largest 20 districts. This is compared with just 35% of TFS leavers who remain in K–12 schools, suggesting that CUSD faces a comparably high degree of competition within the local K–12 labor market. An additional 5% move to higher education and 7% move to another education field (e.g., after school provider or tutor), which is somewhat comparable to the 4% of the TFS sample in each area. Less than one quarter of CUSD leavers transition to a position outside of education, compared with 20% of TFS leavers. Of the four broad fields into which we grouped leavers, government and health care are the most common (at 5% and 4%, respectively), while only 3% entered the business sector and 10% in some other field. 21
Nearly a fifth of leavers transition to unemployment 1 year after exit, and we use data about leavers’ households to identify whether several commonly suggested mechanisms might be present. Among all unemployed leavers, 6% have “children at home,” and 3% “relocate” after exit. Nearly half of unemployed voluntary female leavers have children at home, suggesting this is an important factor for this group in transitioning out of the workforce. The suppressed, small cell sizes for other subgroups suggest that none of the family factors are major life features of most male unemployed leavers or involuntary female leavers. On the whole, these results align with the results from the TFS, though the TFS indicates higher rates of employment, potentially reflecting differences in the measurement of employment between the survey and administrative records sources. 22
We formally test for factors predicting employment 1 year after exit in a series of regressions shown in Table 3. Each coefficient or group of coefficients (e.g., all three included quartiles for teacher value-added models [VAMs] or spousal income) are estimated in a separate regression, meaning that the results are conditional only on experience, academic year, age, and race/ethnicity. Analogous results from models predicting being employed in education 1 year after exit are shown in Supplementary Table A.4 (in the online version of the journal) and models predicting employment 4 years after exit are shown in Supplementary Table A.5 (in the online version of the journal). 23
Regression Results for Employment 1 Year After Leaving CUSD by Gender and Voluntary/Involuntary Exit
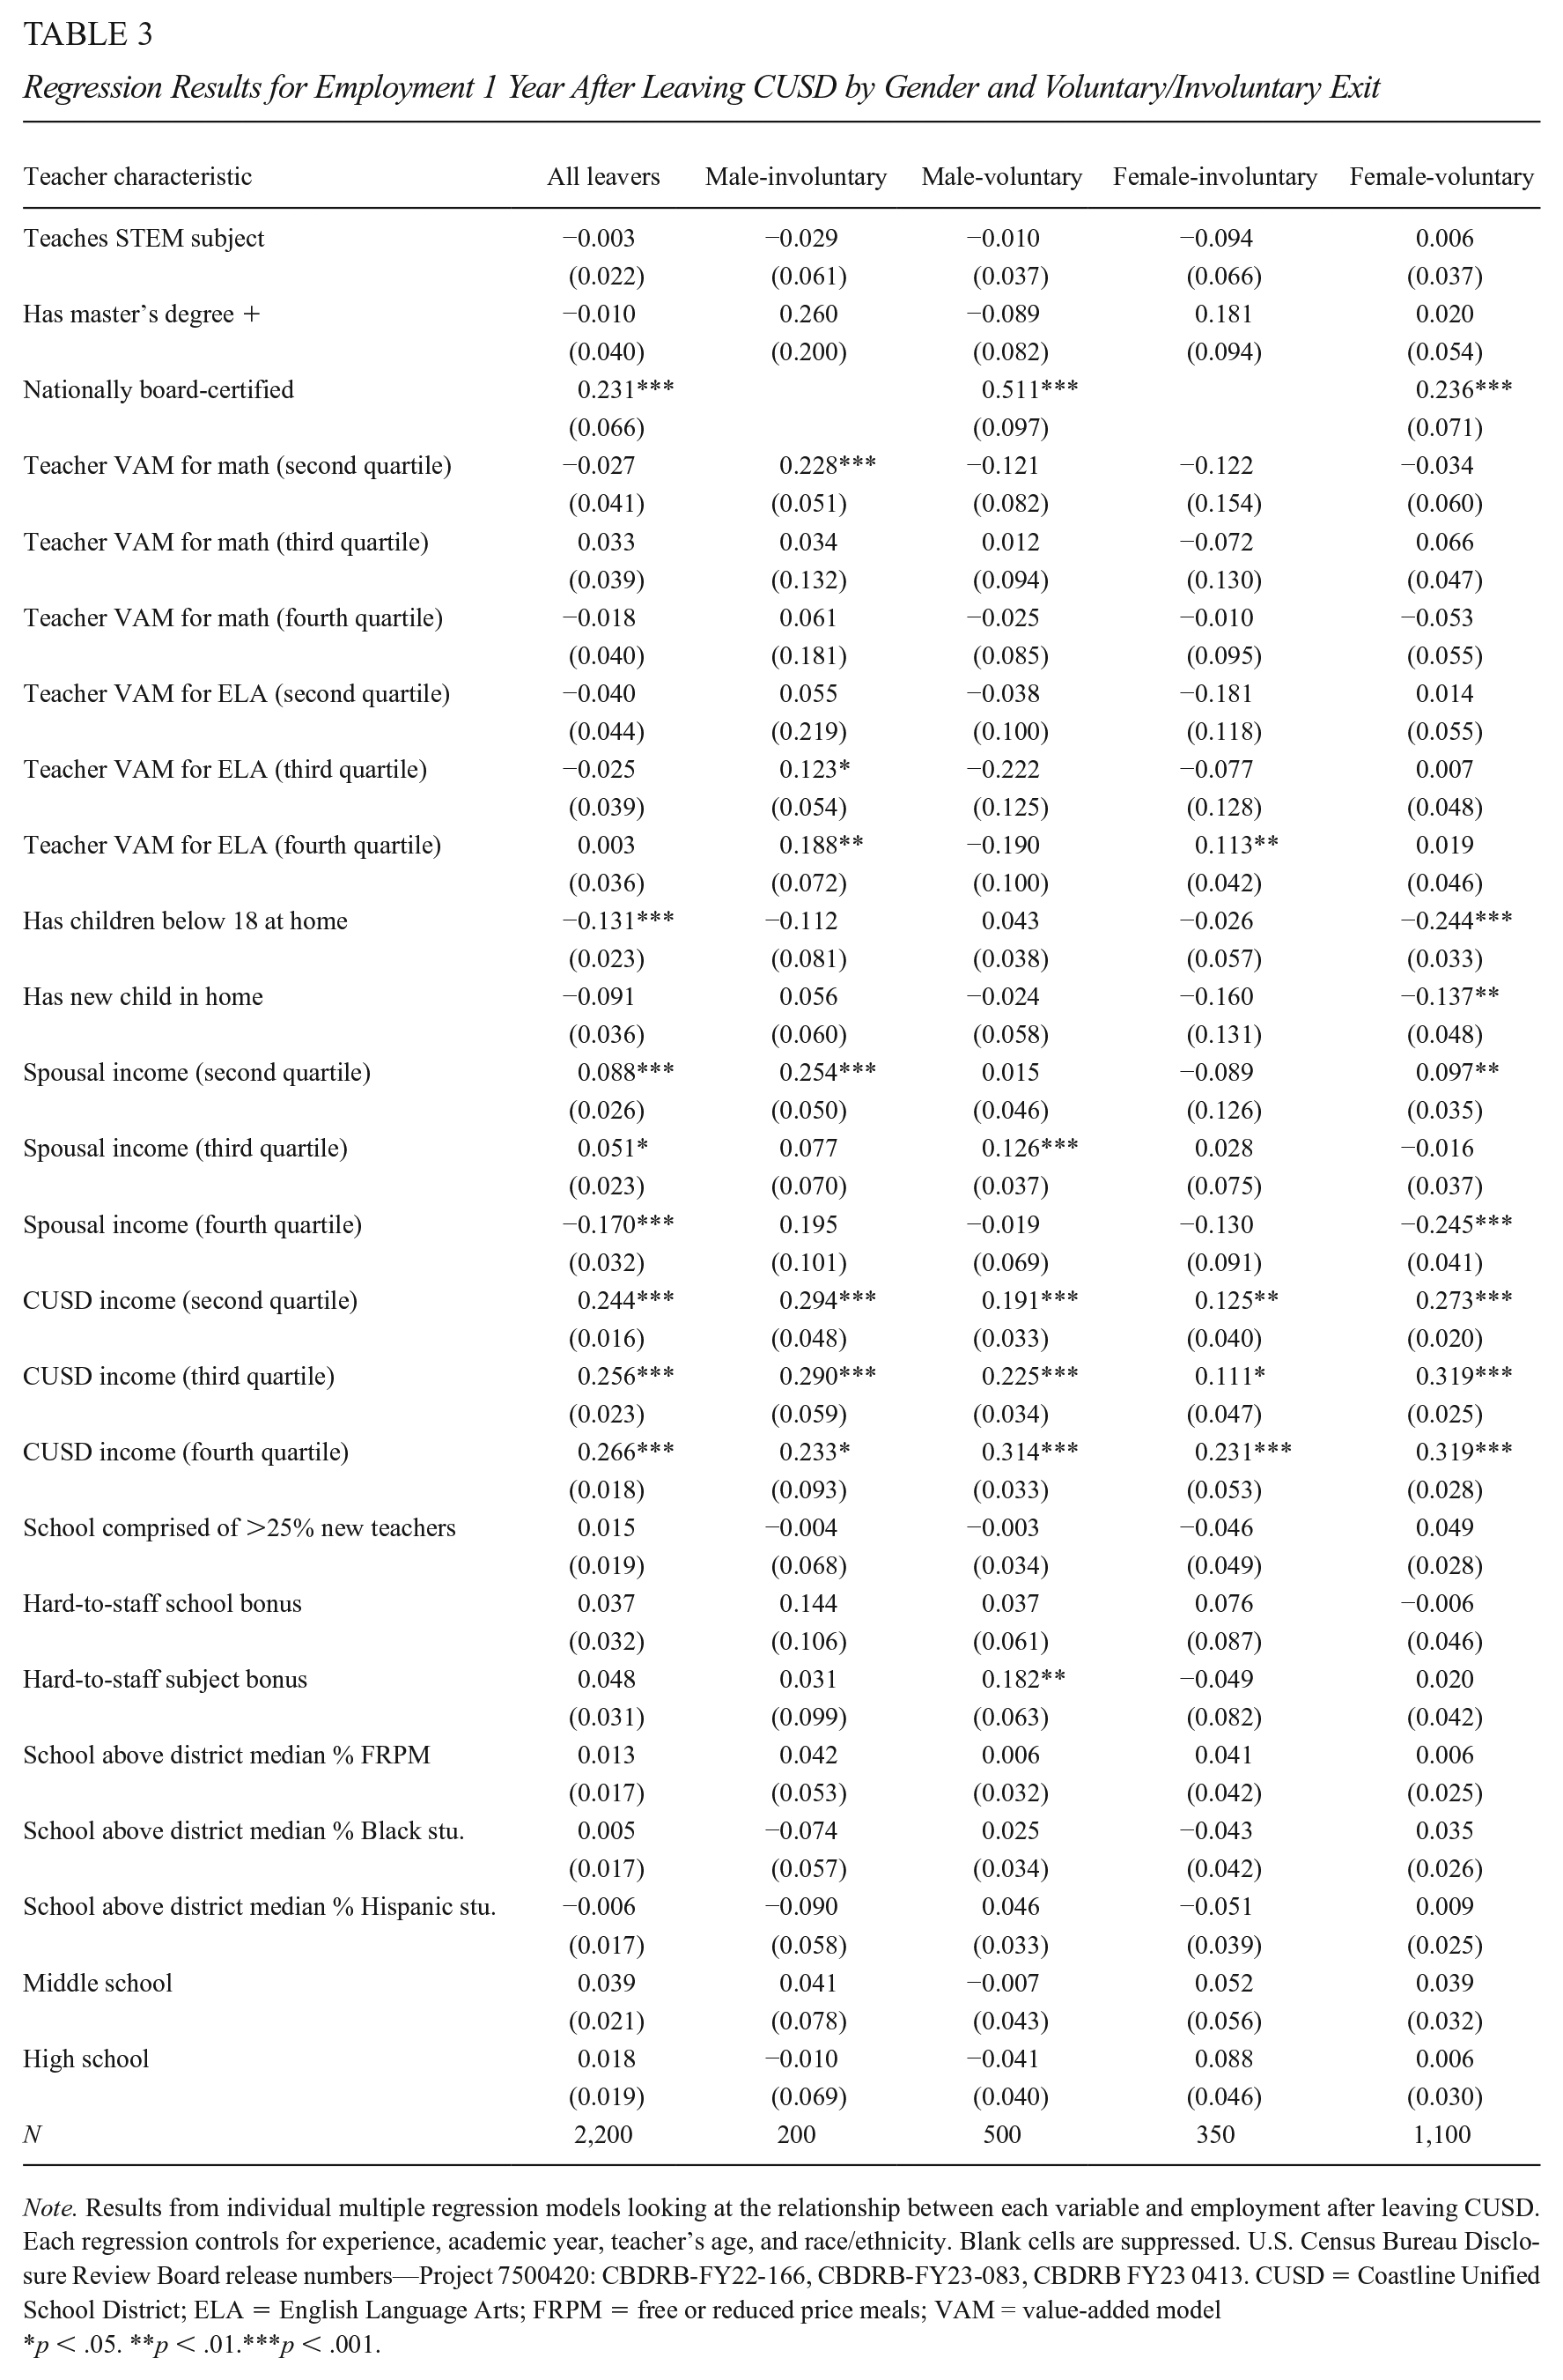
Note. Results from individual multiple regression models looking at the relationship between each variable and employment after leaving CUSD. Each regression controls for experience, academic year, teacher’s age, and race/ethnicity. Blank cells are suppressed. U.S. Census Bureau Disclosure Review Board release numbers—Project 7500420: CBDRB-FY22-166, CBDRB-FY23-083, CBDRB FY23 0413. CUSD = Coastline Unified School District; ELA = English Language Arts; FRPM = free or reduced price meals; VAM = value-added model
p < .05. **p < .01.***p < .001.
Several professional and family characteristics predict post-exit employment while few factors related to educators’ final pre-exit school do. For example, having National Board Certification has a large positive association with post-exit employment for leavers (note that the cell sizes are too small to estimate models for involuntary subgroups). Being among the highest CUSD income quartiles in their final year also increases the likelihood of post-exit employment by 11 to 32 percentage points relative to those in the lowest CUSD income quartile.
Female voluntary leavers also have some unique patterns that highlight the influence of their family situation on their careers. 24 These leavers are substantially less likely to be employed 1 year after exit if they have a new child or children below 18 in the home (differences of 14 and 24 percentage points, respectively) and if they have spouses in the highest earnings quartile (a 25-percentage point difference). All of these estimates remain statistically significant and negative for voluntary female leavers 4 years after exit. The consistent results indicating reduced likelihood of employment for female voluntary leavers suggest that as they have children, they are exiting the labor force as well as the field of education at higher rates and not returning for at least several years. Finally, models examining the same relationships for novice teachers show a similar negative relationship between new children and children below 18 in the home as well as having a spouse with income in the top quartile (although this sample is not exclusive to voluntary female leavers), suggesting that family factors influence attachment to CUSD teaching jobs early in educators’ careers.
Earnings After Exit
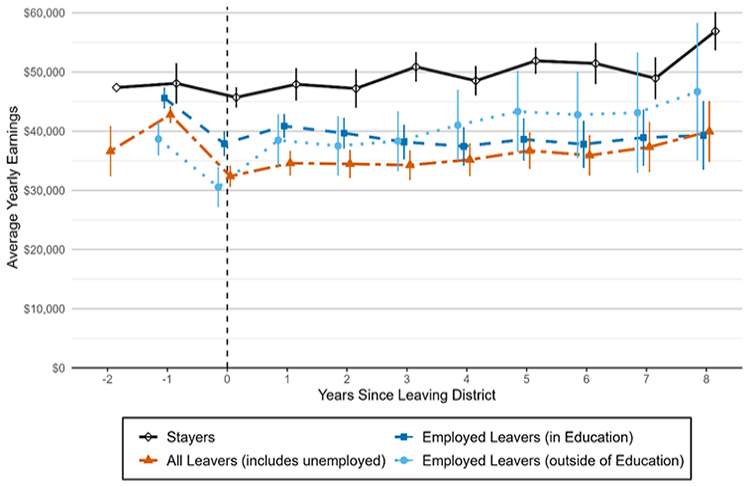
Given the varied employment conditions of leavers, we next examine their earnings trajectories in a series of figures. Figure 1 contrasts income trajectories for all leavers (including the 20% that are unemployed) and employed leavers that work in and outside of education. Each point represents the average earnings among the relevant group of leavers at a particular year relative to exit with 95% confidence intervals. Earnings trajectories use all available pre- and post-exit data available for each leaver. While the more distal years should be interpreted with some caution because they include fewer observations, years close to the exit year on either side include virtually all of the relevant samples.
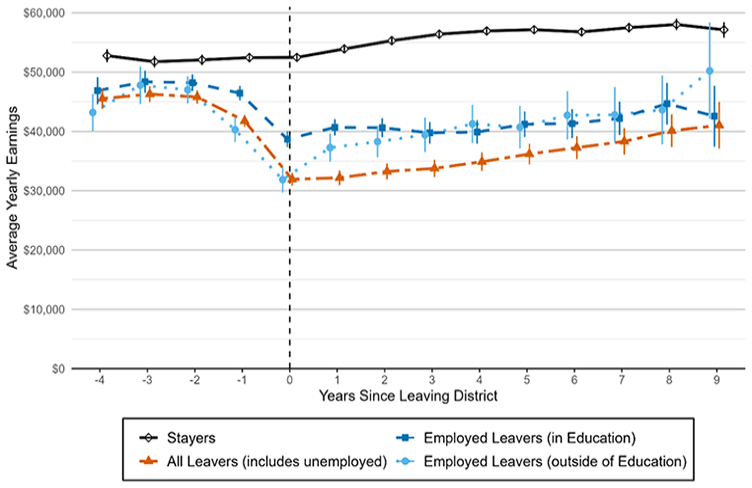
Earnings trajectories for leavers compared with stayers from Coastline Unified School District (CUSD).
We contrast leavers’ earnings relative to the average earnings of stayers remaining in the district through the 2015–2016 school year. By definition, stayers are in the district at the end of our study period, and it is impossible to calculate “years until or years after leaving” measures. Therefore, to include stayers in Figure 1, we assign stayers a placebo leave year drawn from the empirical distribution of leave years observed in our main sample of leaving teachers. Their earnings in the years before and after this pseudo leave year are then compared with leavers’ available years of pre- and post-exit earnings. 25
Stayers have incomes that are roughly $20,000 higher than those of all leavers at the time that leavers exit CUSD. Leavers are lower paid and less experienced than stayers on average, so this is not unexpected. 26 Stayers’ incomes increase by small increments over time, on average, as the composition of employees and their pay scales shift slightly, amounting to a roughly $6,000 increase over 8 years. Leavers, on average, experience an income decline after exit, with earnings just approaching pre-exit levels 8 years later. Leavers who are subsequently employed in education after exit initially have higher incomes at exit than leavers who exit education, but these differences converge quickly and there are no significant differences between the groups on average.
Figure 2 provides similar trajectories for novice leavers and stayers. Novice stayers start with higher incomes than novice leavers, suggesting they are starting higher up the pay scale either because they teach in hard-to-staff subject areas or schools or have an additional source of income, such as teaching summer school or other nonschool employment. Novice stayers’ earnings grow steadily, increasing by roughly $11,000 over 8 years, roughly following increases in the CUSD pay scale for new teachers. Because novice leavers are the most likely group to seek employment after exit, the differences between all novice leavers and the employed novice leavers are relatively small. Earnings appear to diverge somewhat between those who exit to another position within education versus those who move to another field. Those remaining in education see very small income changes on average—only $2,000 over 8 years—while those who leave education see earnings growth of roughly $13,000 and exceed their final CUSD incomes. However, these differences are not significantly different from one another and the estimates for those leaving education are particularly imprecise.
Earnings trajectories for novice leavers compared with novice stayers from Coastline Unified School District (CUSD).
Figure 3 contrasts trajectories between female and male leavers and stayers in Panel A and STEM and non-STEM leavers and stayers in Panel B. Although female and male leavers have relatively overlapping earnings while employed in the district, they diverge after exit. Male leavers’ earnings are roughly $2,000 to $9,000 higher than female leavers’ earnings every year after exit, and these differences are significant even among those who are employed in each group. In contrast, there are relatively minor differences in average earnings between those with and without STEM qualifications and few of these differences are statistically significant.
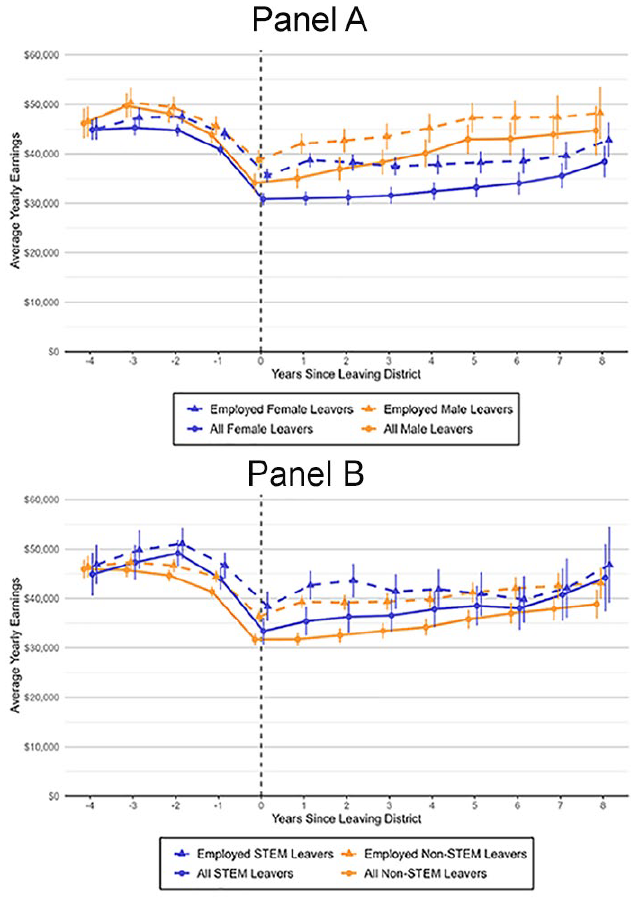
Panel A. Earnings trajectories for female leavers compared with male leavers from Coastline Unified School District (CUSD). Panel B. Earnings trajectories for STEM leavers compared with non-STEM leavers from CUSD.
The income trajectories shown in Figures 1 to 3 demonstrate that the transition out of CUSD did not result in large financial gains for the average leaver. In general, leavers’ earnings were lower than those of stayers and lower than their own earnings while employed in the district. These general trajectories do highlight differences between some leaver subgroups and not others. However, average differences may conceal some divergence across the earnings distribution.
To examine this potential variation, we present earnings trajectories for five percentiles of the earnings distributions (10th, 25th, 50th, 75th, and 90th percentiles) for those employed in and outside of education and stayers. 27 Figure 4 presents these distributional trajectories for the full sample.
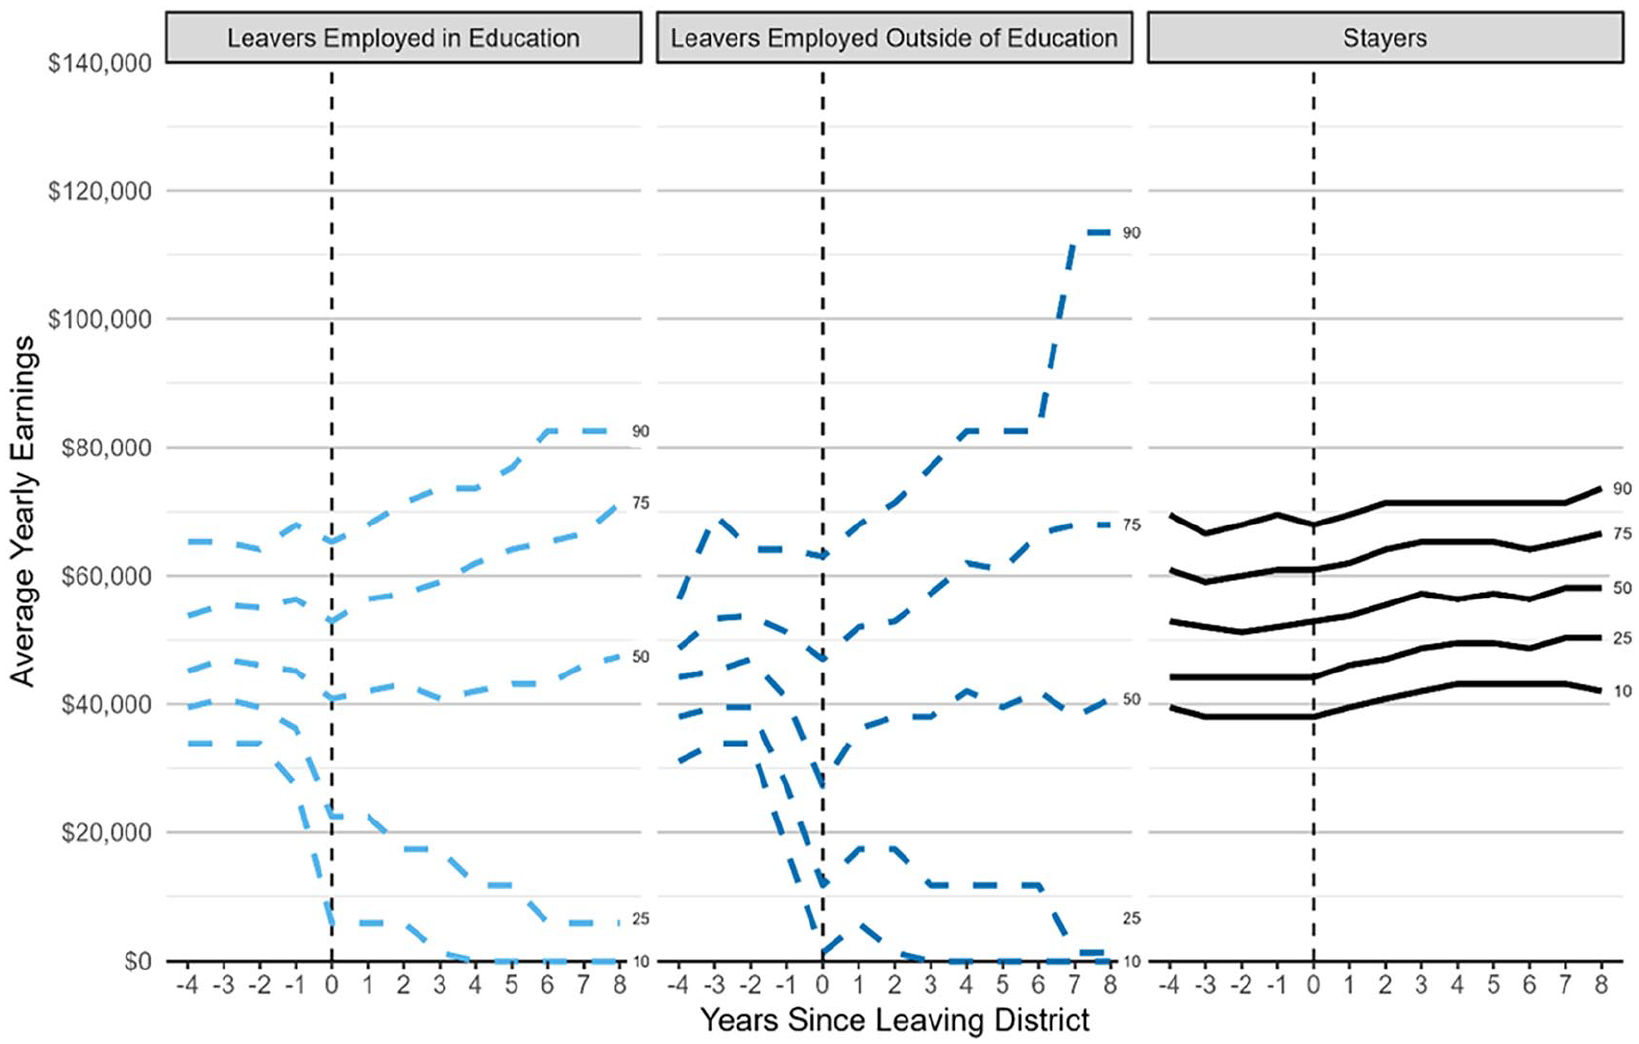
Percentiles of earnings trajectories for leavers employed in and outside of education compared with stayers.
Stayers’ earnings are relatively flat at all percentiles. They increase steadily over time at similar rates across the percentiles. Employed leavers’ earnings diverge much more than those of stayers. At least half of employed leavers experience earnings that are lower than the bottom quartile of stayers’ earnings and lower than their own pre-exit earnings most years after they leave CUSD. Moreover, the bottom quartile earnings are very low, roughly $20,000 or less. The bottom decile of leavers’ earnings drops to $0 after being employed just after exit. However, the top quarter of leavers in both sectors experience relatively high earnings after exit that exceed the top decile of stayers’ earnings (above $75,000). The top decile of earnings for those employed outside of education nears and exceeds $100,000 several years after exit. This suggests that many leavers can earn more outside of CUSD, particularly if they exit education altogether, but a much larger share fares substantially worse.
We present similar figures for leavers and stayers from each of our subgroups of interest: novice (Figure 5), female and male (Figure 6), and STEM and non-STEM (Figure 7). Novice stayers’ earnings percentiles are lower than those of the overall sample, and the bottom decile is below $40,000, suggesting some emergency credentialed and nonstandard classroom teacher roles among this group. The top decile also remains around $60,000, suggesting few changes to the salary schedule for novice teachers, but differentiation for things such as subject area expertise or teaching in a hard-to-staff school. The median earnings for novice leavers in education remain steadily just above $40,000 and just below $40,000 for those who leave education, which is roughly in line with the 25th percentile earnings for novice stayers. The substantially lower earnings for the bottom quartile and decile, which drop below $20,000 and $5,000, respectively, suggest that at least a quarter of novice leavers’ experience substantial earnings decreases soon after exit. The top quartile of earnings in and outside of education nears $60,000, which is similar to the top quartile of earnings for stayers. Moreover, the top decile of earnings in each group of leavers is substantially higher (near or above $80,000) than for those who remained in CUSD and eventually exceeds $100,000 among those who left education.
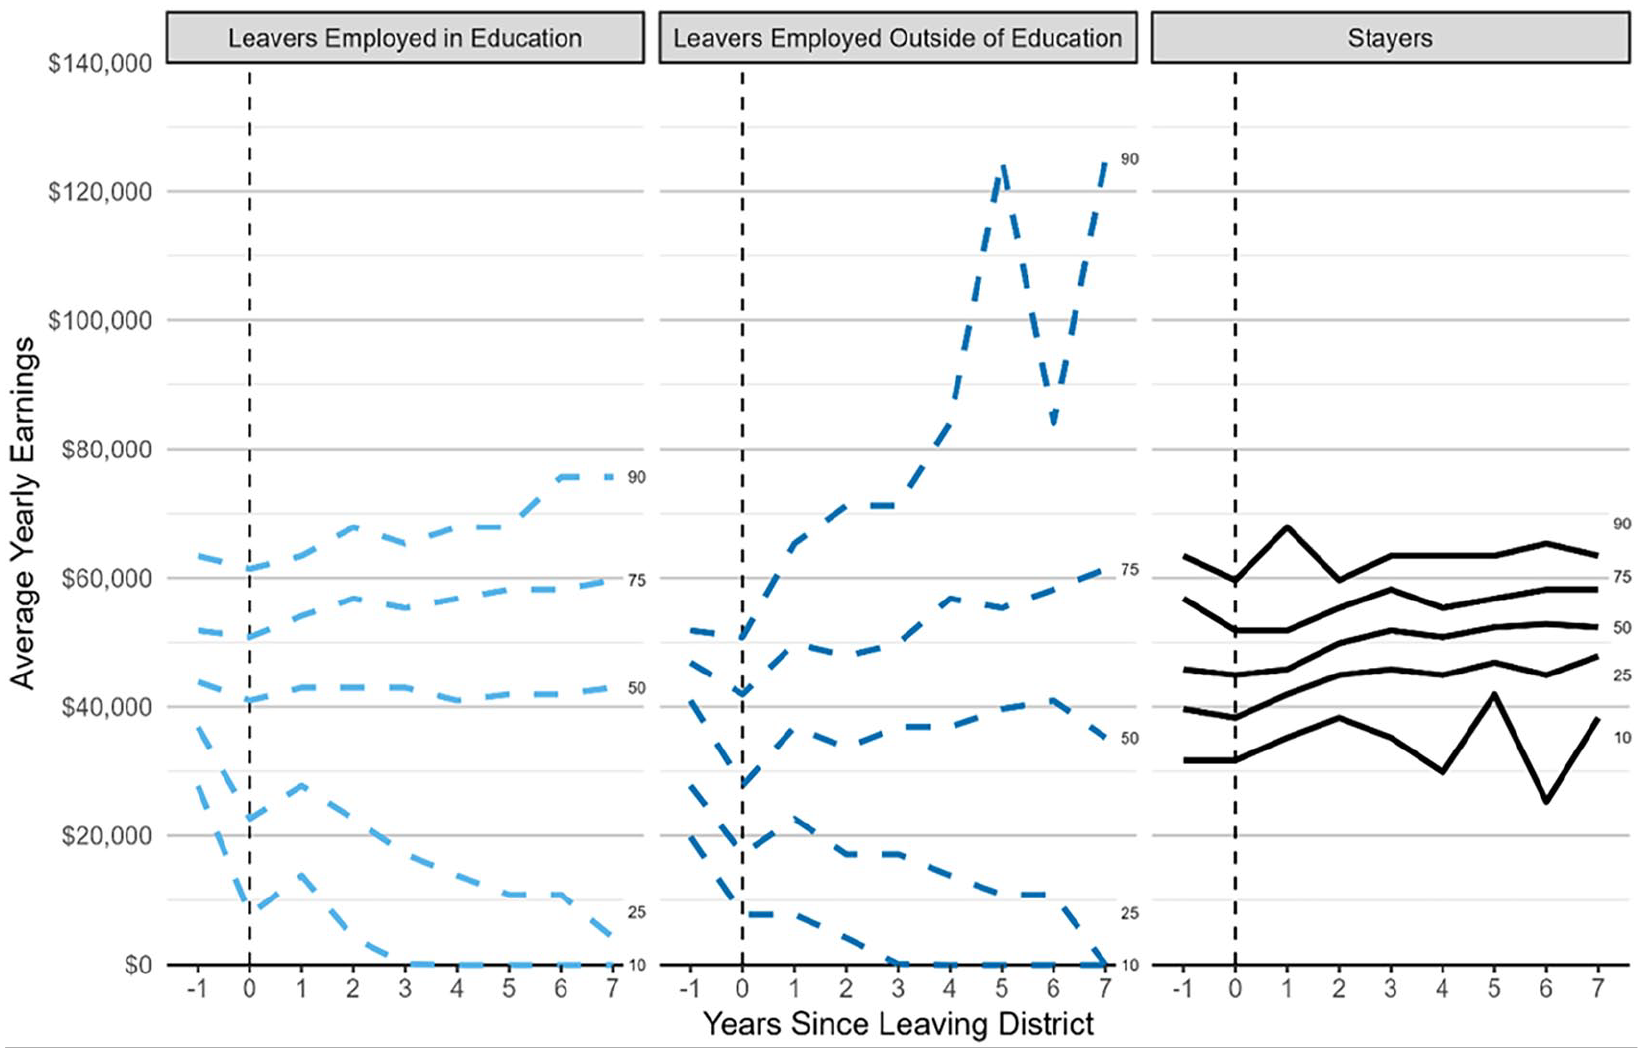
Percentiles of earnings trajectories for novice leavers employed in and outside of education compared with novice stayers.
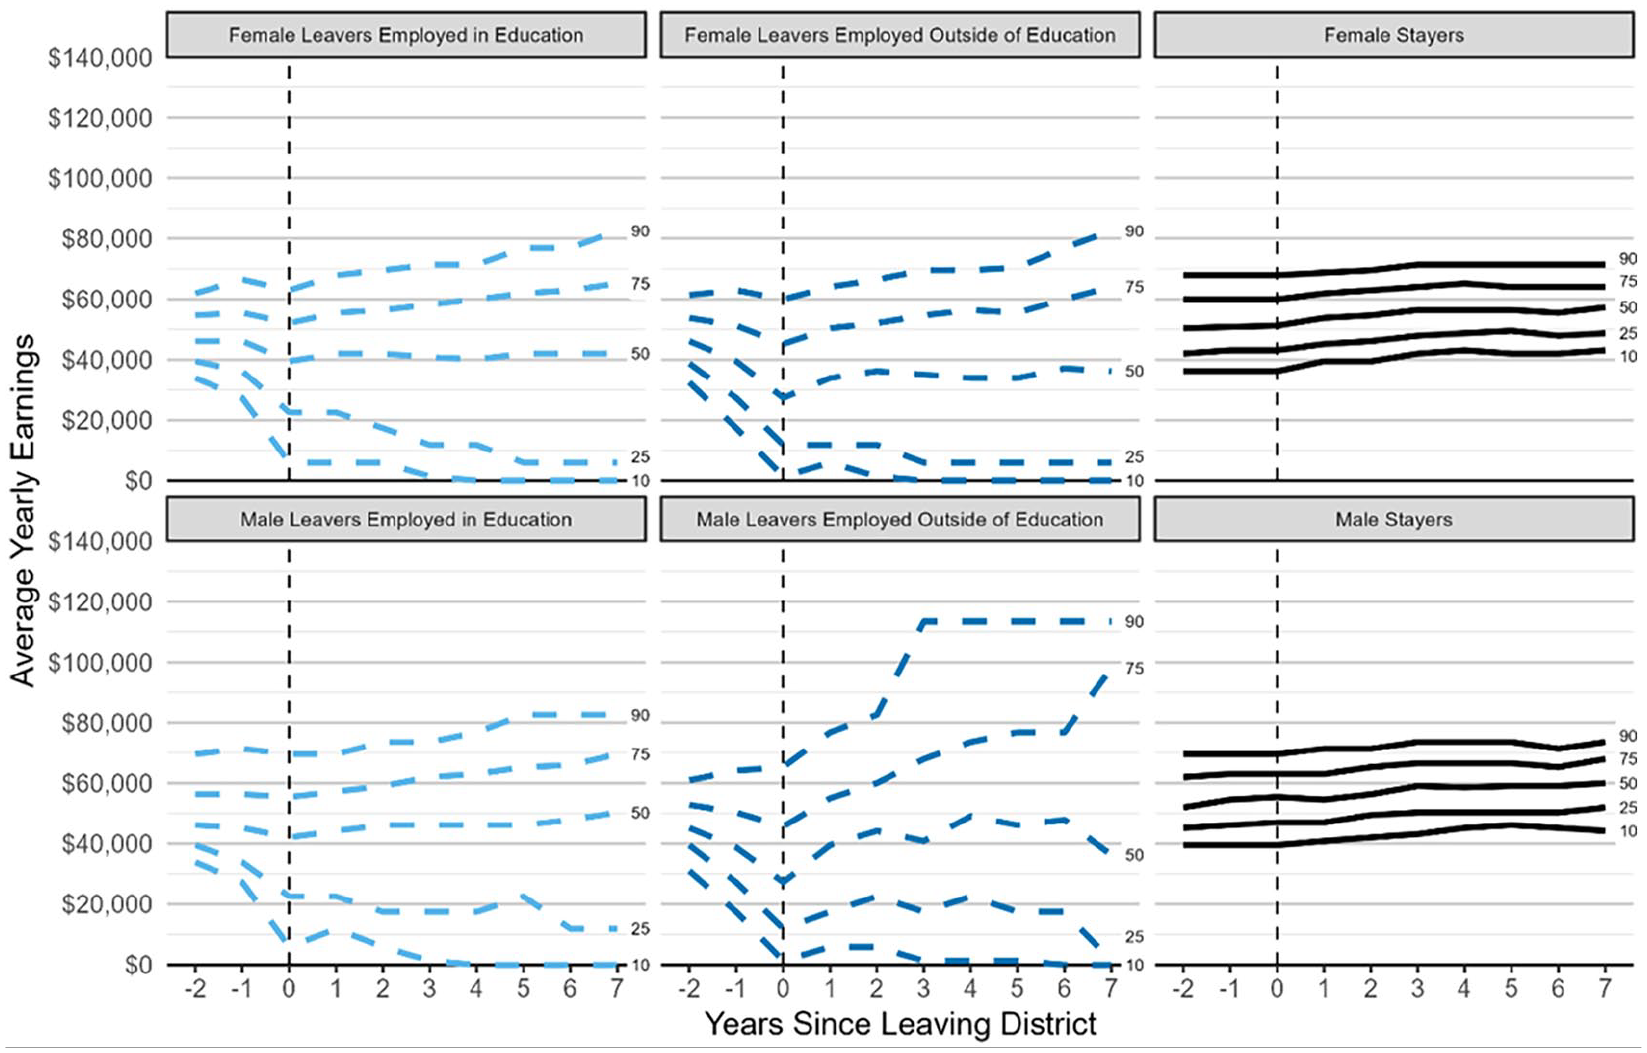
Percentiles of earnings trajectories for female and male leavers employed in and outside of education compared with stayers.
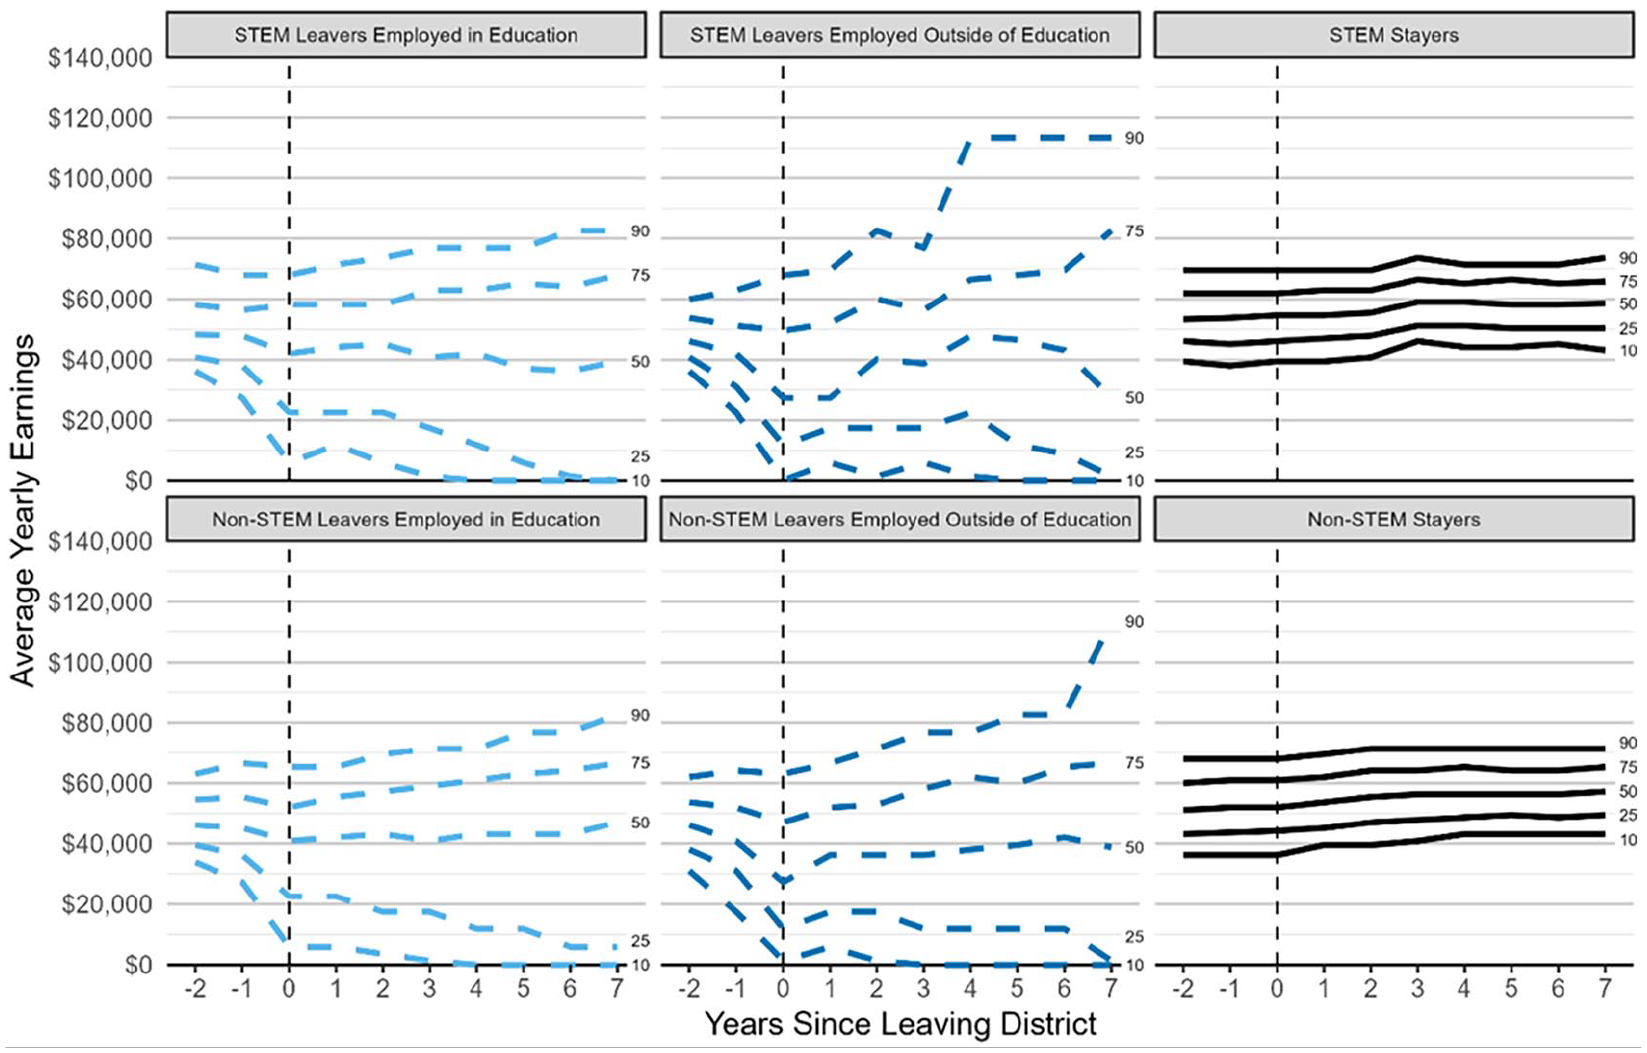
Percentiles of earnings trajectories for STEM and non-STEM leavers employed in and outside of education compared with stayers.
The distribution of earnings over time by employment sector and gender underscores the earnings advantages and more rapid post-exit earnings growth that we observed in the averages shown in Figure 3 for male leavers. Again, stayers’ earnings increase steadily, but modestly over time and at similar rates for female and male stayers. Earnings diverge much more over time for leavers and the earnings distribution for males is higher than that of females. In other words, fewer male leavers experience very low earnings, and a greater share of male leavers experience relatively high earnings. This difference is noticeable at the median where earnings for female leavers are consistently around $40,000 and closer to $50,000 for male leavers (corresponding to roughly the 10th and 25th percentile earnings for stayers, respectively). Median earnings are slightly higher for those remaining in education compared with those who leave education among both groups. Among leavers in education, the top quartile earnings for male leavers surpass $60,000 and the top decile earnings surpass $80,000 several years earlier than they do for female leavers in education. Moreover, fewer male leavers in education are transitioning to very low-paying positions in the sector as the 25th percentile earnings is roughly $20,000, while the 25th percentile earnings for female leavers in education is closer to $10,000. There is an even more substantial divergence by gender for leavers outside of education. While the top decile of earnings for female leavers outside of education only exceeds $80,000 seven years after exit, the top decile for male leavers outside of education exceeds $80,000 in just 2 years. There is a similar gender difference in the pace at which the top quartile earnings outside of education exceed $60,000. Likewise, the bottom quartile of female leavers employed outside of education earn less than $10,000, while the bottom quartile for male leavers outside of education is closer to $20,000 in most years. In other words, even among those who are employed, a greater proportion of male leavers have substantially higher earnings than female leavers. More male leavers also have higher earnings than both male and female stayers, particularly if they exit education.
STEM and non-STEM leavers’ earnings distributions also underscore the varied opportunities across employment sector. Stayers in the two groups have similar, modest earnings increases over time. Leavers’ median earnings level is roughly $40,000 in nearly all years (below the 10th percentile for stayers). However, for both STEM and non-STEM leavers that remain in education, the very top percentiles of earnings exceed those of stayers (by approximately $10,000–$20,000 depending on the year and comparison). The highest earnings outside of education are even greater, particularly for STEM leavers where the top decile of leavers’ earnings exceed $100,000 within 4 years of CUSD exit. The top decile of non-STEM leavers outside of education is near this level as well, but only 7 years after exit.
Given the divergent earnings trajectories by experience, gender, and credential area, we consider how a host of professional and background characteristics predict post-exit earnings changes, shown in Table 4.
Regression Results for Change in Income 1 Year After Leaving CUSD by Gender and Voluntary/Involuntary Exit
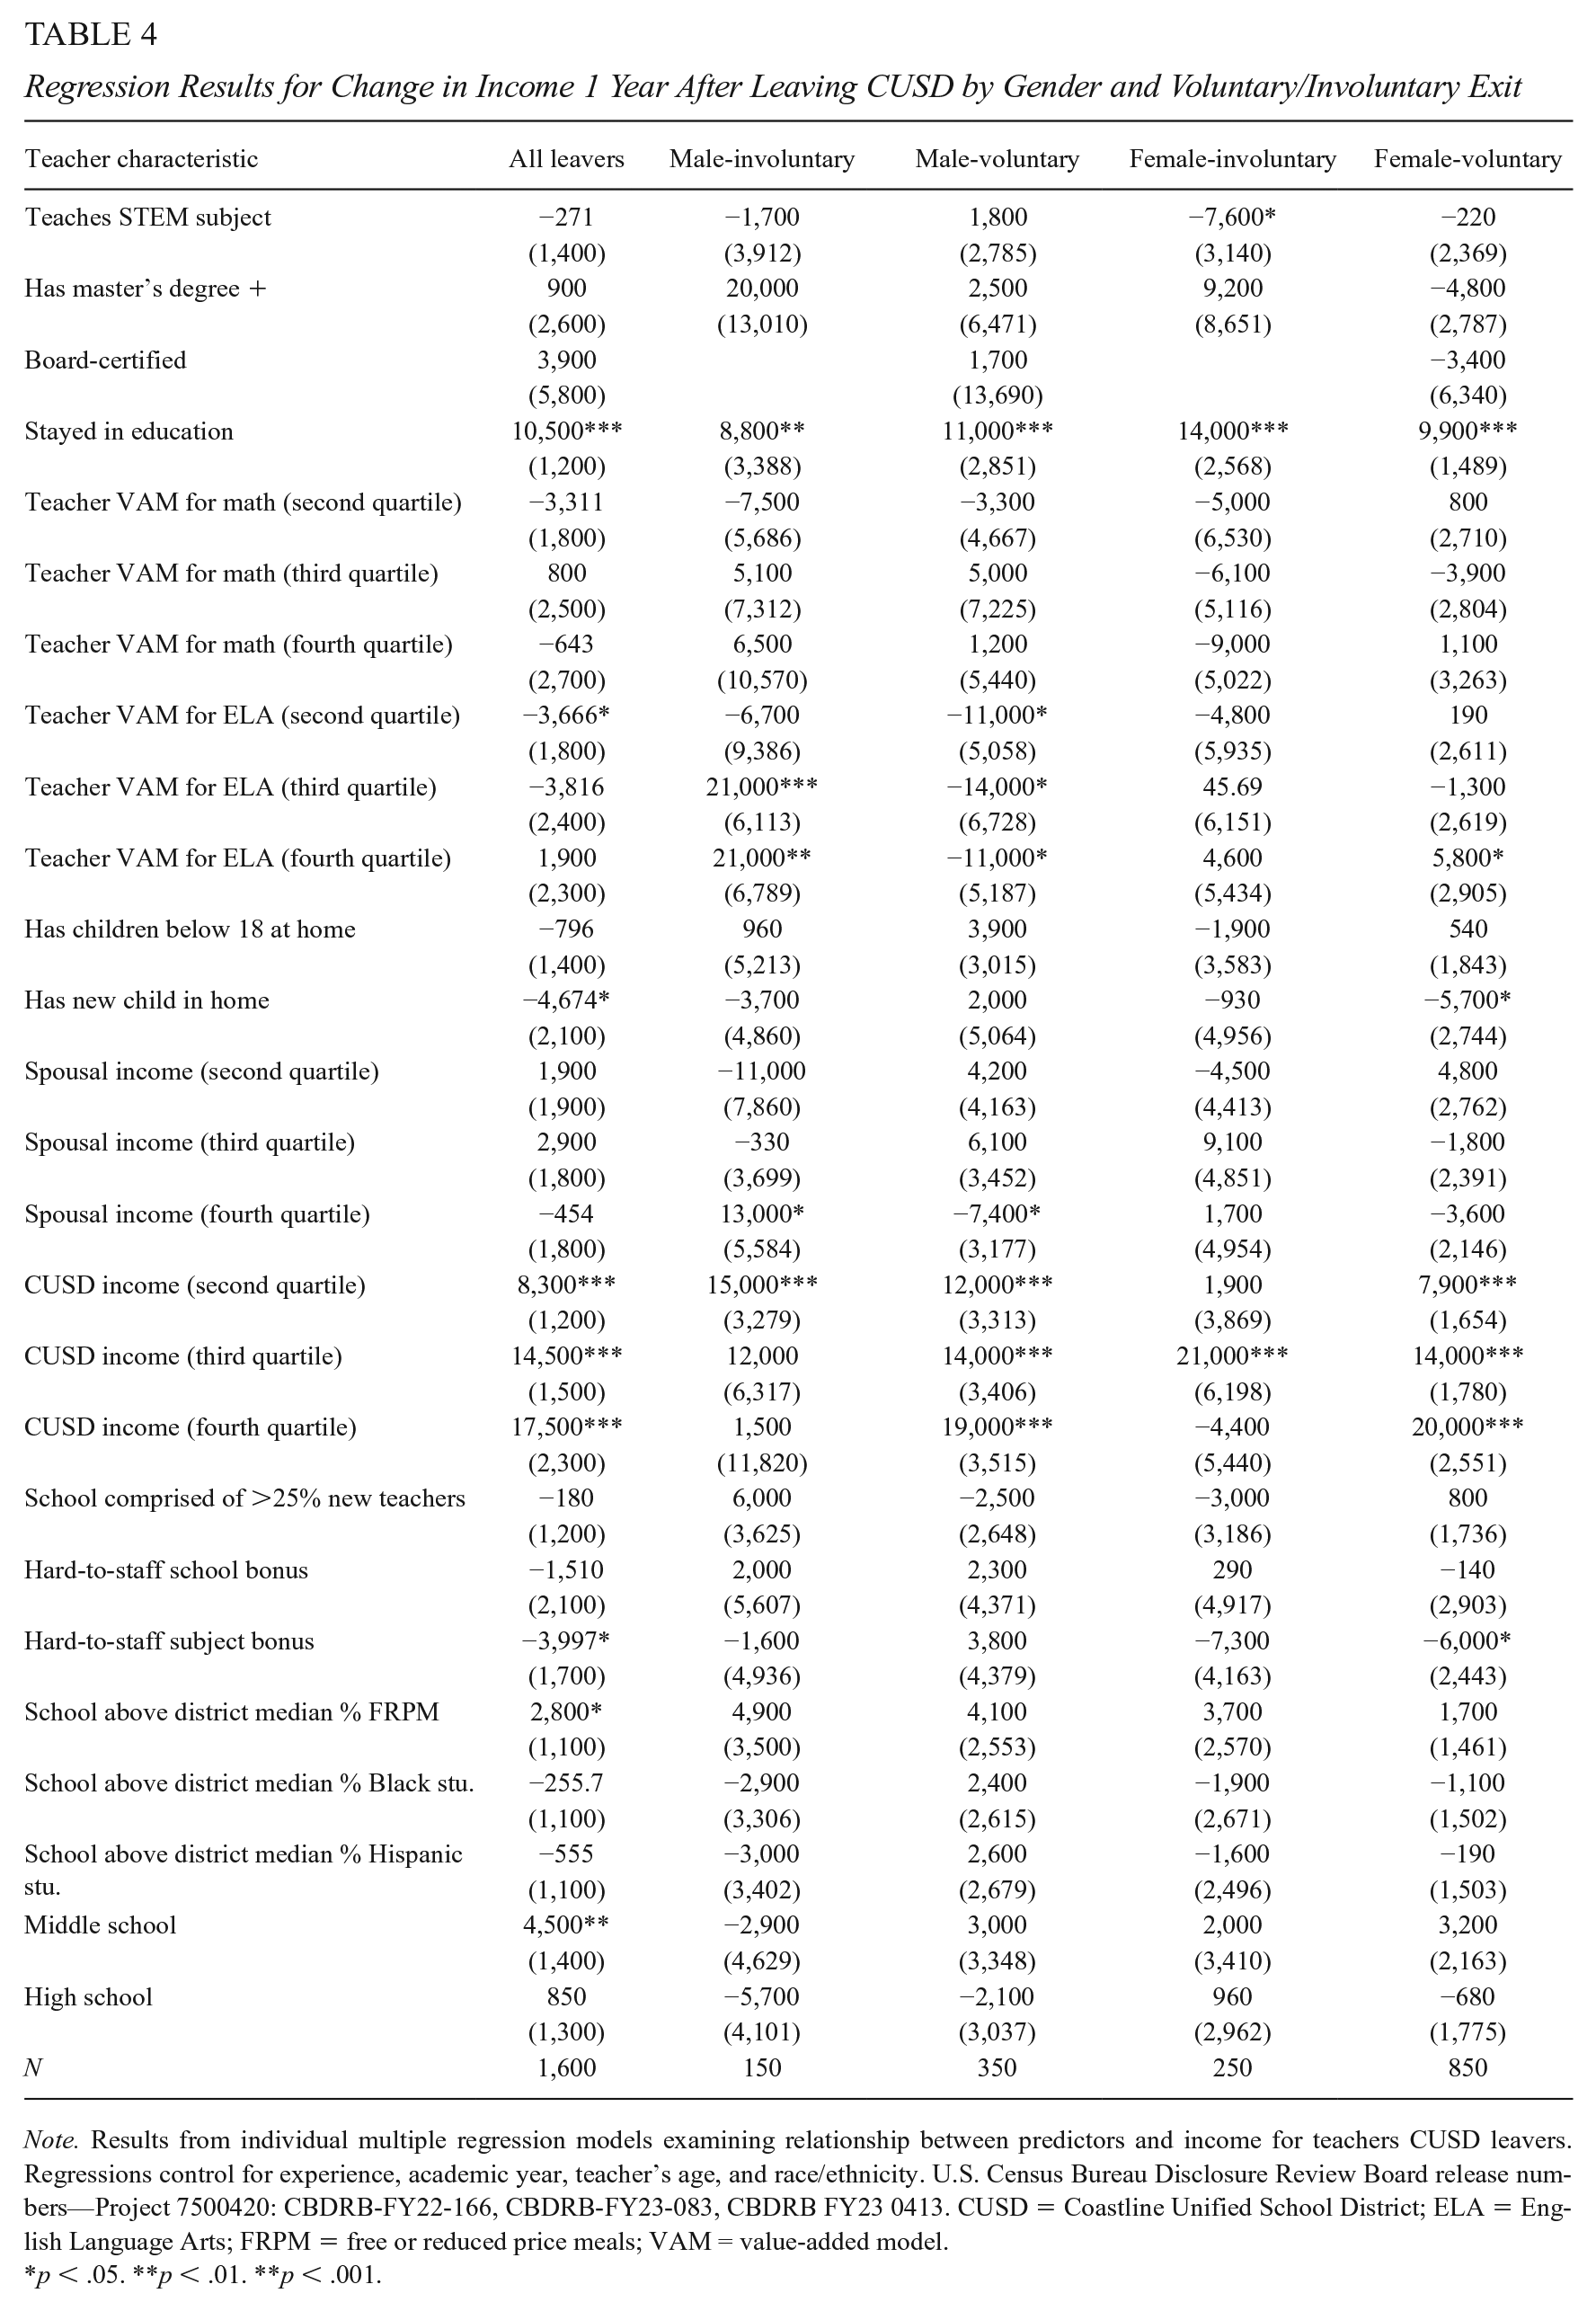
Note. Results from individual multiple regression models examining relationship between predictors and income for teachers CUSD leavers. Regressions control for experience, academic year, teacher’s age, and race/ethnicity. U.S. Census Bureau Disclosure Review Board release numbers—Project 7500420: CBDRB-FY22-166, CBDRB-FY23-083, CBDRB FY23 0413. CUSD = Coastline Unified School District; ELA = English Language Arts; FRPM = free or reduced price meals; VAM = value-added model.
p < .05. **p < .01. **p < .001.
The most consistent predictor of earnings increases is staying in education, which is associated with average income changes of $10,500 overall, with some variation by gender and leave reason. Being among the higher income quartiles while in CUSD was also associated with earnings increases 1 year after exit overall and for most subgroups. This is further evidence that those who were more experienced within CUSD were more likely to make transitions within the field of education to another district for higher pay and underlines the potential relevance of salary pressures from other school districts for teacher retention.
Few other professional or school characteristics consistently predicted post-exit earnings. Teacher value-added in English Language Arts (ELA), but not math, was inconsistently associated with earnings changes across groups, with varying signs and magnitudes. These patterns are much less clear than the strong and consistent relationship between teachers’ value-added measures and their post-exit economic success identified in the prior literature (Chingos & West, 2012). However, our value-added results should be interpreted with caution, because they are drawn from a smaller subsample of leavers who taught in tested subjects than the Chingos and West sample.
Finally, for female voluntary leavers, the largest of the four subgroups, having a new child in the home was associated with a decline in earnings of $5,700 on average. This association was not observed for other subgroups.
Together, these results provide a mixed picture of economic success for leavers. While some professional qualifications, experiences, and personal characteristics relate to consistent patterns for some subgroups of CUSD leavers (e.g., female voluntary leaver parents), many others are inconsistent sources of variability.
Conclusion
Understanding the opportunity costs facing teachers is important for informing teacher retention efforts, but they are difficult to understand using conventional school district data sources alone. This study uses a novel data linkage between school district human resource records and IRS tax returns to examine employment, earnings, and residential mobility outcomes for all leavers from an urban district in the western United States. It provides the most comprehensive accounting of labor market transitions of leavers to date by following individuals at all experience levels and leave reasons for more than a decade across state boundaries. It examines all types of formal employment across many sectors and their income from any formally reported source. This district represents an important case study for teacher retention policy because it describes the potential outcomes facing educators in precisely the type of district where teacher retention poses a consistent human resources challenge: one with higher-than-average turnover in a competitive labor market that serves substantial populations of low-income students and students of color.
While the literature has often framed teacher exits as being driven by a “lure” from outside of education, our results suggest a more complex picture that demonstrates a much stronger attachment to the education field than in prior work. The majority of the professional transitions CUSD educators make are within the education sector, with nearly 46% of all leavers moving to another K–12 district and many to higher-paying and larger districts within the same state. This conflicts with findings from Papay et al. (2017) who found little evidence of between-district within-state mobility but is consistent with Knight (2020) who found that salary differentials between districts contribute to teacher sorting within local teacher labor markets in Texas. Moreover, fewer leavers move to unemployment than in prior studies and national data (33% of leavers in Chingos and West (2012) are nonworkers 28 and 37% of nonretiring leavers are unemployed in the TFS compared with roughly 19% in our data).
We find a great degree of variability in post-exit incomes among those who remain employed. While many leavers working outside of education experience earnings losses in low-paying jobs, the top decile of earnings for leavers exceeds stayers’ earnings and is substantially higher outside of education. Novice teachers in particular experience relatively fast income growth on average if they leave education while most novices’ earnings change only negligibly if they remain in the field. In particular, the top decile income for novice leavers outside of education is more than double their final CUSD income. In contrast, more veteran leavers face relatively similar opportunities for income changes from positions in education and noneducation positions. This is also consistent with Han’s (2021) findings that there are differential returns to leaving education by age with younger and more inexperienced leavers benefiting more from exiting education than older veterans. This finding poses challenges for CUSD and other districts that recruit many novice teachers to meet their staffing needs because these individuals face real opportunity costs that they stand the best chance of recovering if they exit after just a few years. Likewise, there is a small set of leavers with STEM experience who exit education and experience relatively high incomes post-exit. However, while results are somewhat imprecise, there is a less clear benefit to exiting for either STEM educators or those with higher value-added than in prior literature. Our findings also lack the clear relationship between teacher quality (as measured by value-added) and post-exit earnings found in the prior literature (Chingos & West, 2012).
We identify notable variation by gender and leave reason. Male leavers, and in particular male involuntary leavers, often experience relatively large earnings increases compared with their final CUSD earnings. In addition, the top decile of male leavers who transition to employment outside of education have the highest incomes of any groups. In contrast, more female leavers, and particularly voluntary female leavers, experience reduced employment and earnings losses that continue 4 years after exit, particularly if they are parents or have high-earning spouses. This points to the potential for temporary supports, such as childcare in addressing some types of teacher attrition.
While these data have advantages over previous data sources used to address questions of leavers’ labor market success, they also have some limitations. For example, although we expect many similar dynamics in other large urban districts and in places with high costs of living, our results may not generalize as well to other settings, such as lower-cost rural districts, or to other time periods with economic conditions that differed from those surrounding the years of the Great Recession.
In addition, because the current analysis only studies individuals who made the decision to leave teaching, we cannot conclusively say that financial incentives would not reverse some of the turnover we observed or increase the selection into working in CUSD, particularly if large wage increases occurred within CUSD relative to other opportunities. What we can say is that many leavers exit despite the lack of financial improvement. An additional limitation of our data is that we do not observe job titles for leaver’s subsequent jobs. Thus, for example, we cannot determine whether individuals moved to a different school district to become school leaders or whether those who moved into private industry became baristas or CEOs. Likewise, we cannot definitively address the reasons why individuals do not report any taxable income in a given year. For example, we lack information on school enrollment that might be observed using 1098-T tax return forms and thus cannot determine whether some of the unemployed individuals are pursuing additional education. We are also limited by some of the smaller sample sizes for various subgroups that prevent us from examining more detailed outcomes or looking at these outcomes over a longer period.
Comparisons of annual earnings are our primary way to define whether leavers had better financial outcomes after exit. However, as the literature has noted, there are other important components to educators’ total compensation. According to public-sector salary databases, for most classroom teachers and other certificated positions in CUSD, such benefits amount to roughly 21% of their base salaries. We lack analogous benefits information for the subsequent position leavers obtain, thus comparisons of changes in total compensation are not feasible. Nonetheless, given that our results below point to modest average increases in salaries for most educators after leaving teaching, we expect that fully accounting for any potential increased benefits for CUSD teachers would underscore this result.
Indeed, our study reinforces the idea that many teachers leave their jobs for reasons besides increased earnings that are more difficult to measure, such as lack of administrative support, poor working conditions, or to pursue additional education. Our results suggest that even in a context with robust employment opportunities outside of teaching, relatively few teachers secure more lucrative opportunities after leaving. They also indicate that some subgroups of teachers face greater barriers to this type of success than others. Future research should replicate these analyses across a broader range of districts, set of school staff, employment environments, and economic conditions to determine whether similar labor market outcomes and variability are present among educators who leave the profession.
Our results also suggest several possible interventions for school districts and state governments that may help reduce turnover in similar urban districts. Echoing suggestions from Knight (2020), states could consider minimizing salary gaps within regions to reduce churn in higher-turnover districts. Temporary supports, such as childcare and housing assistance, as well as larger amounts of targeted funding for hard-to-staff schools or subjects might also help to keep positions more attractive for newer teachers and reduce turnover among teacher parents. Our results also suggest that financial challenges are not the only concern in retaining the teacher labor force in this district. Thus, while financial levers may be useful in reducing turnover to a degree, such efforts may be best complemented with other district reforms that target other aspects of teachers’ jobs as well.
Supplemental Material
sj-pdf-1-epa-10.3102_01623737241227906 – Supplemental material for After School: An Examination of the Career Paths and Earnings of Former Teachers
Supplemental material, sj-pdf-1-epa-10.3102_01623737241227906 for After School: An Examination of the Career Paths and Earnings of Former Teachers by Quentin Brummet, Emily K. Penner, Nikolas Pharris-Ciurej and Sonya R. Porter in Educational Evaluation and Policy Analysis
Footnotes
Appendix A
Appendix B
Acknowledgements
The authors would like to thank the human resources and research, planning, and evaluation staff in our partner district, UC Irvine’s Center for Administrative Data Analysis, the Center for Advanced Study in the Behavioral Sciences and the Center for Education Policy Analysis at Stanford University, Leah Clark and Lindsay Liebert for their support with disclosure review preparations, Caitlin Kearney and Megan Rauch for excellent research assistance with the Teacher Follow-Up Survey Data, and Susanna Loeb, Leah Clark, Andrew Penner, Thurston Domina, and members of the Education and Transitions to Adulthood work group for their invaluable feedback on this research. Any opinions and conclusions expressed herein are those of the author(s) and do not necessarily represent the views of the U.S. Census Bureau. All results have been reviewed to ensure that no confidential information is disclosed. U.S. Census Bureau Disclosure Review Board release numbers—Project 7500420: CBDRB-FY22-166, CBDRB-FY23-083, CBDRB FY23 0413.
Declaration of Conflicting Interests
The author(s) declared no potential conflicts of interest with respect to the research, authorship, and/or publication of this article.
Funding
The author(s) disclosed receipt of the following financial support for the research, authorship, and/or publication of this article: This work is supported by the Institute for Education Sciences (R305B130017), the National Science Foundation (IBSS-L1620419), and the National Institute of Child Health and Human Development (R01HD094007).
Notes
Authors
QUENTIN BRUMMET, PhD, is principal research methodologist at NORC at the University of Chicago. His research focuses on teacher labor markets, K–12 education policy, and the pathways from education to the labor force.
EMILY K. PENNER, PhD, is associate professor of education at the University of California, Irvine. Her research focuses on K–12 education policy and considers the ways that districts, schools, teachers, and families contribute to and ameliorate educational inequality.
NIKOLAS PHARRIS-CIUREJ, PhD, is assistant center chief for demographic research in the Center for Economic Studies at the U.S. Census Bureau. His research focuses on educational attainment, racial/ethnic inequality, and survey methodology.
SONYA R. PORTER, PhD, is the assistant center chief for interdisciplinary research in the Center for Economic Studies at the U.S. Census Bureau. She conducts research on racial/ethnic measurement and inequality, incarceration, eviction, and opportunity.
References
Supplementary Material
Please find the following supplemental material available below.
For Open Access articles published under a Creative Commons License, all supplemental material carries the same license as the article it is associated with.
For non-Open Access articles published, all supplemental material carries a non-exclusive license, and permission requests for re-use of supplemental material or any part of supplemental material shall be sent directly to the copyright owner as specified in the copyright notice associated with the article.