
Abstract
Online credit recovery (OCR) refers to online courses that high school students take after previously failing the course. Many have suggested that OCR courses are helping students to graduate from high school without corresponding increases in academic skills. This study analyzes administrative data from the state of North Carolina to evaluate the efficacy of OCR using full data from public and private OCR providers. Findings indicate that students who fail courses and enroll in OCR are 20 percentage points more likely to earn course credit, have lower test scores of up to two tenths of a standard deviation, and are about eight percentage points more likely to graduate high school within 4 years than students who repeat courses traditionally. Test score differences are particularly large for Biology compared to Math I and English II. Hispanic and economically disadvantaged OCR students are more likely to graduate high school than their peers.
Keywords
For generations, students who failed classes in high school would need to repeat the class in full to graduate. Current high school students typically have the option of retaking the course virtually through online credit recovery. During the 2015-2016 school year, 72% of high schools reported offering credit recovery and 1 in 10 high schools enrolled 20% of more of the student body in credit recovery (Tyner & Munyan-Penney, 2018). Along with these high enrollment numbers comes a great deal of concern about the quality of the courses. When the online periodical Slate did a series on online credit recovery (OCR), they wrote that OCR has “a disturbing lack of quality control” with “a whole generation of students . . . being let down by a system that prioritizes graduation over knowledge” (Kirsch, 2017; Smiley, 2017). OCR has several attractive features that can theoretically help struggling students graduate from high school including the ability to complete courses during non-traditional school hours and skip topics they have previously mastered. As an article in Education Next noted, “online credit-recovery classes can be lifeline to struggling students” (Loewenberg, 2020). Despite criticisms, schools often turn to OCR to help students earn course credits they lost through course failure.
At the same time, course failure is not equally distributed across students. Students from racially minoritized backgrounds as well as economically disadvantaged students are more likely to fail courses, making them off-track for high school graduation (Allensworth & Easton, 2005; Kemple et al., 2013; Viano, 2021). Since OCR is an intervention for students who fail courses, racially minoritized students and economically disadvantaged students are likely overrepresented in these courses compared to their enrollment in the school. At the same time, online courses might especially benefit these students. Research has consistently documented teachers’ bias against Black and Hispanic students (see Tenenbaum & Ruck, 2007), making transitioning students to an online environment to retake courses potentially particularly effective for students previously negatively affected by these biases. However, if these courses are low quality, they could contribute to the educational opportunity gap (Welner & Carter, 2013).
In this study, we examine the effectiveness of OCR as a tool that schools are using in order to help students graduate from high school, particularly for traditionally underserved student populations. As OCR is an intervention for students who fail courses, we are interested in whether enrolling in OCR has different outcomes than the traditional credit recovery option of repeating courses face-to-face (F2F, note this acronym is only used to refer to face-to-face credit recovery courses throughout, not traditional instruction). With the sample of students who have failed courses, we use student-by-school fixed effects to understand the relative change in probability of earning credit for previously failed courses for OCR compared to F2F and test score changes from when students took an end of course exam at the end of the course they failed to their score after their OCR or F2F course. For high school graduation, we implement a marginal mean weighting through stratification matching procedure to approximate probability of selection into OCR versus F2F if assignment were random, fitting models with these weights and school-by-cohort fixed effects. We address two research questions:
RQ1: Do students who take OCR courses differ from students who retake courses traditionally F2F in terms of passing previously failed courses, end of course exam scores, or graduating from high school within 4 years?
RQ2: Do Black, Hispanic, or economically disadvantaged students who take OCR courses differ from other students in those groups who retake courses F2F in passing previously failed courses, end of course exam scores, or high school graduation within 4 years?
Policy Context of Current Study
Students face many institutional and personal barriers to graduating from high school. In particular, studies have consistently found that, even when controlling for demographics, test scores, and other key characteristics, failing courses or low credit accumulation are associated with lower rates of high school graduation (Bowers, 2010; Mac Iver & Messel, 2013; Neild et al., 2008; Silver et al., 2008). The most proximal solutions to address course failure or low credit accumulation are for the students to earn the credits they lost when they failed the course. High schools have historically done this through remedial courses in the summer/after school or repeating the course in full (Cooper et al., 2000; Lauer et al., 2006). Although no available studies assess the effectiveness of these traditional options on likelihood of high school graduation, one evaluation estimated the effects of repeating a course F2F after course failure on earning course credit, finding three quarters of students who repeated Algebra I in a California school district passed the course the second time (Fong et al., 2014).
Many have hypothesized students finish OCR courses faster and with less effort than traditional F2F courses (see Smiley, 2017). If OCR is more efficient than F2F, then students who fail courses and enroll in OCR would, theoretically, be more likely to graduate from high school than those repeating the course F2F. OCR can also increase access to credit recovery by allowing more students to enroll in OCR without commiserate staffing or facilities costs as traditional courses (Heinrich & Darling-Aduana, 2021). Prior research has found evidence OCR partially crowds out F2F, such that schools could be both expanding opportunities for credit recovery and placing students in OCR who would have otherwise repeated courses F2F (Viano, 2018b). At the same time, if OCR courses are low quality, then students might learn less, lowering their test scores compared to those enrolled in F2F courses (Viano, 2018a). A prior study of online courses in high school (including OCR and first-time courses) found taking an online course was associated with large decreases in math and reading scores (Heinrich et al., 2019).
Hypotheses about the effectiveness of OCR have only begun to be empirically tested. In a study of OCR courses offered through the state-run North Carolina Virtual Public School (NCVPS), OCR students were less likely to graduate from high school overall but more likely to graduate within 4 years than students who retook courses F2F (Stallings et al., 2016). This study did not include OCR course-taking from privately-run OCR providers (a popular option in North Carolina, as discussed below) and estimated associations using covariate-adjusted regressions. The second study used a randomized control trial (RCT) design to randomly assign students in 17 Chicago high schools who had failed Algebra I in ninth grade to enroll in traditional summer school F2F or an OCR Algebra I course the following summer. Despite higher passing rates and posttest scores for F2F as compared to the OCR course, there was no statistically significant difference in the high school graduation rate of the OCR versus F2F assigned students (Rickles et al., 2018). While this study is causal, the generalizability is limited. OCR is often offered during the school year, and there are a multitude of different providers. A study from Florida of OCR courses found OCR students were more likely to persist to 12th grade than F2F students (Hart et al., 2019). Another study in a large, urban school district found students in courses that were likely to be OCR were more likely to graduate from high school and enroll in postsecondary education (Heinrich & Darling-Aduana, 2021). None of these studies explicitly examined whether OCR enrollment, including multiple providers using a statewide sample, is associated with high school graduation and test scores.
How Credit Recovery Is Implemented in Schools Nationwide and in North Carolina
Data from the National Survey on High School Strategies Designed to Help At-Risk Students Graduate (HSS), a nationally-representative survey sponsored by the U.S. Department of Education, indicated that 71% of schools offered at least one OCR course in the 2014-2015 school year, 42% of schools allowed students to repeat courses F2F, and a quarter of schools offered both options (U.S. Department of Education Office of Planning, Evaluation and Policy Development Policy and Program Studies Service, 2018). In the 2016-2017 school year, 82% of schools in North Carolina (NC) had at least one student enrolled in OCR. Among schools that offered OCR, the median school had a fifth of eligible students enrolled in OCR (range of 0.7%–100%). We discuss how OCR is used in schools nationwide and in NC, specifically, because, while OCR is popular nationwide, much of the research available on OCR selection is based on information from NC. This study analyzes data from NC Public Schools, so we situate the NC setting within the broader OCR context throughout.
How Online Credit Recovery Courses Are Offered
NC schools have a configuration of OCR offerings that is similar to other states. NC has a publicly-run online course provider, NCVPS, and allows districts and schools to contract with privately-run providers of OCR. As of 2016, 24 states had publicly-run providers of online courses, enrolling over half a million students, and privately-run OCR providers are very popular nationwide (Gemin & Pape, 2017). NCVPS creates course content and serves as a state-run vendor of courses (students do not enroll full time in NCVPS) including asynchronous instructional support for the courses. The majority of schools in NC offer OCR through third-party vendors. These for-profit companies, including NovaNET, OdysseyWare, Edmentum/E2020, Plato, Grad Point, Edgenuity, and Apex, offer OCR courses to schools nationwide (North Carolina Virtual Public School, n.d.; Stallings et al., 2016; authors’ analysis). The providers have online course options for all traditional high school courses offered in NC, marketing their ability to provide an online version for hundreds of different courses, with options for synchronous and asynchronous instruction (Edmentum Courseware, 2020; Stallings et al., 2016; authors’ analysis and interviews with school districts). While private providers are a substantial source for OCR courses, prior studies tended to be limited to public providers or a single private provider (Heinrich & Darling-Aduana, 2021; Rickles et al., 2018; Stallings et al., 2016).
Which Students Enroll in Online Credit Recovery
More information is available on student enrollment/selection into OCR. For instance, the 2014 to 2015 HSS indicated schools targeted students for OCR most often based on their academic performance (87%), attendance problems (73%), staff referral (60%), and discipline or behavioral issues (48%; U.S. Department of Education Office of Planning, Evaluation and Policy Development Policy and Program Studies Service, 2018). A study on 24 Massachusetts high schools that were part of the MassGrad initiative found that students’ grade level was a common OCR selection criterion. Some schools used OCR for 12th grade students who only needed one or two credits to graduate while other schools gave preference to 10th graders over 9th graders. Across all schools, a slightly higher percentage of students enrolled in OCR in 12th grade (36%) with the other high school grades enrolling similar percentages of students in OCR. Some schools reported being less likely to enroll students with low English proficiency, high need for teacher support, or external commitments (jobs, child care) after seeing these types of students struggle in OCR. While schools over time reported beginning to more purposefully identify students most likely to succeed in OCR, most schools said they were willing to enroll any student in OCR (Levine et al., 2017). A study of students who failed courses in the 2008-2009 through 2011-2012 school years compared students enrolled in NCVPS OCR to those who repeated courses F2F or enrolled in non-NCVPS OCR. They found that Hispanic students were slightly less likely to enroll in NCVPS OCR. White students and economically disadvantaged students were slightly more likely to enroll in NCVPS OCR. There were no differences in enrollment by gender or by special education status (Stallings et al., 2016).
In order to gain a more nuanced understanding of OCR assignment in NC, we conducted interviews with school district officials with OCR assignment responsibilities from three school districts in NC in fall 2017. Each district had different policies for enrolling students in OCR although with some commonalities between them. For instance, all districts allowed students to request assignment to OCR courses and updated their OCR policies on a regular basis, indicating that OCR policy was evolving over time. Students might request OCR because they perceive it to be easier or to avoid specific teachers, but they also might request F2F because taking a F2F course results in their failing grade being expunged from their transcript (but would not be expunged for OCR).
In the district with the most formalized OCR assignment policies, they had a student contract with stated criteria for enrolling in OCR. Students were not to enroll in OCR in 9th grade and were discouraged from doing so in 10th grade. Students had to have a final grade in the course they failed of 50% to 59% (a policy that another school district also had) or have failed due to absences (i.e., they had a passing grade in the course). If the course they failed was associated with an end of course exam, they had to have earned a proficient score on the exam. While this was not stated as the reason behind this rule, it is noteworthy that students who pass an end of course exam do not have to retake it even if they retake the class, so this school district might have implemented this requirement to avoid concerns that OCR enrollment would lower their overall proficiency rates. The district only enrolled students in OCR as part of their normal course schedule, so they preferred to enroll students in OCR if they had failed at least two classes since they believed students should be able to make up two course credits in the space of one regular class period. Another district with more informal assignment policies instructed counselors to enroll students in OCR if, “for the most part, they’re a decent student.” The third district had no system for enrolling students in OCR. They reported that sometimes teachers requested OCR assignment (occasionally mid-semester), and students commonly requested OCR.
For this study, we investigated the efficacy of OCR, from both public and private providers, as a tool to help students recover course credit lost to failure thereby increasing their likelihood of graduating from high school for all students and for groups of students who were less likely to graduate from high school, such as racially minoritized students and economically disadvantaged students. In addition, we explore whether OCR has negative, unintended consequences on academic achievement. Throughout these analyses, we compare outcomes for students in OCR compared to F2F. If OCR courses are indeed a “questionable quick fix” (Turner, 2015) that allow students to earn course credit without commiserate increases in student learning, then we would see OCR students have lower scores on standardized tests than F2F students. Because schools might use a variety of data points to assign students to OCR or F2F, information on selection into OCR is especially important in order to separate the effects of selection into OCR from the effectiveness of OCR. Information from nationwide surveys, reports, and interviews, presented above, paint a complicated picture of OCR enrollment. Schools could have used several signal indicators for OCR enrollment including academic performance, behavior, attendance, the number of courses they failed, and grade level. Some students were assigned to take OCR while others chose to enroll in OCR. We addressed each of these assignment mechanisms in this study as described below with the goal of exploring whether OCR is related to students’ course credits, test scores, and high school graduation.
Methods
The data for this project include longitudinal student-level records from an administrative database including all students enrolled in public schools in NC. Student course roster files and student grade records are particularly important data files to identify students enrolled in OCR. The sample in this study is restricted to students who failed a core, required academic course anytime in high school (see North Carolina Department of Public Instruction, n.d.). 1 Students who failed courses are identified between the 2012-2013 and 2016-2017 school years. This sample restriction is due to OCR being an intervention limited to students who previously failed a course. Including only students who failed at least one course in the sample will allow students eligible for the treatment in this study (i.e., OCR) but did not receive the treatment (or received an alternate treatment, F2F) to be compared with those students who did receive this treatment.
Within this sample, some students have been identified as taking an OCR course (i.e., the treatment group), while other students repeated the course in full in a traditional fashion during a class period, after school, or in summer school, which are jointly termed “repeating a course for credit” (i.e., F2F). 2 Students who failed a course could have neither taken the course through OCR nor F2F, or they could do both OCR and F2F at different points in time. In this sample, it was very common for students within the same school to have had the option of taking OCR or F2F. About 90% of the sample attended a school where students enrolled in both options, less than 1% of the sample enrolled in a school that only had OCR, 7% of the sample enrolled in schools where students only enrolled in F2F, and 3% of the sample were in schools where students didn’t enroll in either option.
Measures
Enrollment in OCR and/or F2F is determined using course transcript files. Students are observed to be F2F when they failed a course and repeated that same course within the same year or in subsequent school years. Courses are classified as OCR when the student repeats the failed course online, as expressed by a course code indicator and through course titles. All students who enroll in OCR, regardless of the provider (i.e., NCVPS or a private provider), are included in this study although data limitations do not allow us to distinguish between OCR providers. Students in the sample failed an average of five courses. Across all students, about 13% only enrolled in OCR and failed an average of three courses, 35% only enrolled in F2F and failed an average of three courses, 48% enrolled in OCR and F2F at some point in time and failed an average of seven courses, and 4% never took OCR or F2F and failed an average of two courses.
Outcome Variables
The three dependent variables for this study are passing the previously failed course, end of course exam (EOC) scores, and graduating from high school within 4 years (i.e., on-time). High school graduation is determined through the graduation file, which indicates whether a student graduated from high school in a particular year. 3 We observe when students passed a course based on their grade in the course including passing scores based on the numeric score, letter grade, or earning a score of “P” (OCR courses are pass/fail). This variable indicates whether the student passed each course they enrolled in with the analytical sample including observations for the courses that were originally failed.
EOCs are offered in three subjects: Math I, English II, and Biology. Students took the EOC when they completed the associated course. Students failing the course are required to take the EOC and local districts are not allowed to exempt students from taking the EOC (Public Schools of North Carolina, State Board of Education, Department of Public Instruction, 2014). Students retook the EOC every time they enrolled in an EOC-associated course (including an OCR course) unless they previously earned a proficient score on that EOC. Students who earned a proficient score are allowed to retake the EOC after enrolling in OCR or F2F. 4 We define the original score as a pre-treatment variable and subsequent EOC scores as post-treatment observations. We match EOC scores to student-course records by the date the EOC was taken. If a student took both OCR and F2F with in the same year, we are unable to differentiate if the EOC was taken at the end of the OCR or F2F course. If a student is only in OCR or F2F, we are certain the EOC was taken at the end of the OCR/F2F course that year. We standardize the EOC scores by subject and year.
Covariates
The school-level covariates are measured by year. They include student body enrollment percentages for the following student groups: percent classified as Limited English Proficient, gifted, qualify for special education services, economically disadvantaged, Black, and Hispanic. We also included enrollment as a school-level covariate.
All student-level behavioral and academic covariates are measured pre-OCR enrollment, mostly during middle school, to avoid covariates that potentially mediated the effects of OCR on the outcomes (Wooldridge, 2005). Students’ prior academic performance is measured through end-of-grade test scores (standardized by test and year then averaged), enrollment in accelerated or remedial courses, grade point average (GPA), and whether they failed a course in eighth grade. Students are enrolled in accelerated courses if they enrolled in a course that was designed to be offered to students at a higher grade level when in eighth grade. Whether students enrolled in remedial courses is determined in the same fashion as accelerated courses, but for enrollment in courses designed for lower grade students. Student attendance information is included from middle school and operationalized as the percentage of school days that a student was absent in eighth grade and an indicator if the student was chronically absent that year (i.e., was absent 15 or more days). Other covariates include gender, whether the student was designated as Limited English Proficient (LEP), whether the student was gifted, whether the student was enrolled in special education (SPED), whether the student was overage in eighth grade, and their approximate age in eighth grade. We included measures of student race/ethnicity—in particular, whether or not a student is Hispanic or Black, and whether the student is in a family that is economically disadvantaged (ED) for the moderation analysis and as covariates.
We include several covariates measured in high school in select analyses that were unlikely to be affected by OCR enrollment (i.e., unlikely to mediate the relationship between OCR assignment and the outcomes) and potentially proxy for engagement or effort. We include an indicator of the year in high school they failed their first course (e.g., their second year in high school). We use four indicator variables, one for each of the four core subjects they failed, which equal 1 if they failed a course within the specific core subject. As a measure of student behavior, we include an indicator of whether the student received a behavioral infraction in the year they first failed a course. To proxy for engagement and achievement, we calculated the numeric distance their final grade was from earning a passing grade the first time the student failed each course (specific grading scales are mandated in NC schools) and average this distance across these courses. For courses associated with an EOC, we observed the numeric grade students earned in the course and their EOC score. We included the distance from passing for EOC courses and their EOC scores for all initial EOC enrollments (i.e., including EOC courses they passed and failed initially) as individual covariates and as an interaction. The interaction is, in essence, the EOC score by how close the student was to passing.
Missing Data
These measures contain significant amounts of missing data due to the nature of this dataset and traditional limitations of administrative data. We are missing the middle school measures for students who were not attending a public school in NC in the year prior to ninth grade or did not take the end of grade assessment that year (11%–46% missing). Discipline data are not available until 2015. Because we measure discipline in the year of first failure, we did not have discipline data on students who failed courses prior to 2015 (55%–62% missing). Another pattern of missing data is for the measures of distance from passing and EOC classes/scores. About half of the data in the grades files was numeric, but the other half indicated a student’s letter grade. We did not calculate distance from passing for the latter group of students. Students might also have been missing EOC scores, although this is less common (7%–20% missing). We accounted for this missing data using indicators for missing and transforming the associated variables to equal 0 when the missing indicator equals 1 for the graduation analysis only (note that we did not transform the EOC scores when this was the outcome, this missing indicator is only included as a covariate in the graduation analysis). We also ran robustness checks with case-wise deletion for missing data (Graham, 2009).
Empirical Framework
The goal of this study is to explore the relationship between enrolling in OCR and passing previously failed courses, test scores, and graduating from high school compared to F2F enrollment for students who failed core, required courses. The ideal empirical framework for this study would have been to randomly assign students to OCR and F2F to assess the effectiveness of OCR on these outcomes. Since this study uses secondary data, the empirical framework is designed to remove or reduce the influence of potential confounders to the extent possible.
The empirical framework sought to address several levels of endogeneity: endogenous differences across time and between schools as well as within school and year selection bias. Students might have had differential access to OCR courses due to the school they attend and the years they enrolled in that school. The school itself might have varied OCR enrollment in response to endogenous trends in the school like an escalating dropout rate. Different schools took different approaches to OCR enrollment due to preferences of the leadership, school budgets, and other school-level trends that might be correlated with the outcomes. Finally, the validity of any causal estimate is also challenged by likely student-level selection bias—in other words, the systematic selection of students who failed core, required classes into OCR courses rather than F2F based on variables correlated with the outcomes. We took several approaches to address these different types of endogeneity that differed due to the two types of outcome variables: course-level outcomes and student-level outcomes.
Passing Previously Failed Courses and End of Course Exam Outcome Analysis
For the years 2012-2013 through 2016-2017, we observe every student course enrollment and whether the student earned a passing grade from that enrollment. Every observation is student-by-course for any failed high school core course. In other words, the sample includes all student-by-course observations in which the student is observed enrolling in the same course that previously resulted in a failure including that original failed course.
For the EOC analysis, the sample includes all student-by-course observations for students who failed an EOC subject in 2012-2013 through 2017-2018. In NC, EOC scores are included as part of the student’s final grade, but their EOC score did not determine whether the student failed the course (i.e., a student can pass an EOC exam and still fail the course). Therefore, observations are included in the analysis regardless of their score on the original or subsequent EOC exams. The unit of analysis is the student-by-course-by-test date, such that each record represented one of the times the student took an EOC exam. We included all EOC exam scores for students as long as they had originally failed the course associated with that EOC exam (e.g., if a student failed Biology, we include all of their Biology EOC scores, if this same student passed English II the first time they enrolled then we do not include their English II EOC scores).
The analysis assessing the relationship between OCR and passing previously failed courses or EOC scores is estimated using the following equation:
where
The coefficient
In the passing courses models, the student-by-school fixed effect allow us to assess the likelihood of passing the course in subsequent enrollments (OCR = 1 OR F2F = 1, all enrollments are associated with only one of these equaling one), given that the first enrollment (OCR = 0 AND F2F = 0) did not result in passing the course. In the EOC models, because of the student-by-school fixed effect, the coefficients compare the standardized EOC score the first time the student took the exam when they originally failed the course to the score post OCR or F2F, removing all stable student and school characteristics from the estimates. Due to this specification, the model estimates within student learning differences between the original EOC score (OCR = 0 AND F2F = 0) and subsequent EOC scores for the same course (OCR = 1 OR F2F = 1 OR OCR&F2F = 1).
We are specifically interested in comparing coefficients
We cannot include indicators for race/ethnicity or economic disadvantage since these do not vary meaningfully within student over this time period. 5 To examine our second research question, we estimated model (1) separately for samples of students and compared coefficients (e.g., testing whether OCRA − OCRB = 0 comparing models fit for samples A and B) and difference-in-differences (e.g., (OCRA − F2FA) − (OCRB − F2FB) = 0) using Chow tests.
High School Graduation Outcome Analysis
We are unable to analyze the high school graduation outcomes using the same empirical strategy as the course passing/EOC scores since high school graduation occurs only once, and student fixed effects requires at least two observations of the outcome of interest. The analytical sample for examining high school graduation was organized as a panel data set with two cohorts of students: first-time ninth graders in the 2012-2013 and 2013-2014 school years (note this restriction made the number of students smaller than in the previous two analyses). These were the only two cohorts with enough information to include full course-taking information in high school up to an on-time graduation date 4 years after entering high school. The unit of analysis is at the student-school level such that each student has one unique observation for every school they attended.
In order to address endogenous differences between cohorts and schools, the models include cohort-by-school fixed effects such that only students who failed courses within the same cohort within the same school are compared to each other. Cohort-by-school fixed effects account for factors such as the availability of OCR courses, the likelihood of assignment-to-OCR based on the school in which a student is enrolled, and the availability of OCR courses.
In this sample, we defined the treatment as enrolling in at least one OCR course and no F2F courses at any time in high school. We focus our comparison on students who only enroll in F2F, excluding students who did both or neither (although they are included in a robustness check). We address within-cohort and school selection bias by implementing weighted propensity scores estimated using marginal mean weighting through stratification (MMWS) adjustment to estimate propensity scores. Rosenbaum and Rubin (1983) demonstrated that these probabilities of assignment can produce a study sample in which assignment to treatment is independent of the outcome in that sample, based on an assumption known as strong ignorability. According to Stuart (2010), the likelihood that the assumption held true using a matching procedure is more reasonable when the covariates that predict both assignment and the outcomes of interest were identified and included in the estimation of propensity scores.
The goal is to weight the sample such that, conditional on the covariates, the students in the treatment and comparison conditions are as similar as they would be if treatment assignment were random. Following the advice of Stuart, the included covariates are highly correlated with assignment to OCR and the outcomes of interest. The matching procedure reduces bias in assignment to treatment to the extent that the correlation between OCR assignment and the outcomes of interest are controlled by the included covariates. We compile a robust set of covariates associated with taking an OCR course and with graduation for the matching procedure. Basic student variables that prior data have shown to be related to high school graduation, such as student race/ethnicity, gender, and an indicator of economic disadvantage, are included. Also included are key indicators highly predictive of high school graduation and are likely taken into account when assigning students to OCR courses: whether the student had a disability, whether the student was gifted, whether the student was LEP, their approximate age, and whether they were overage in eighth grade.
We include a wide set of variables from eighth grade to attempt to account for the various pieces of information that schools likely used when assigning students to OCR. We use several measures of academic achievement including eighth grade test scores, GPA, failing a course, enrollment in advanced courses, and enrollment in remedial courses. Students with lower academic achievement might be discouraged from taking OCR courses because these students need more guidance and scaffolding than an online platform could provide. Students who enrolled in accelerated courses are more likely to be college-bound. The eighth grade GPA is expected to predict both of the outcomes, since this is an indicator of both motivation and achievement. Failing a course in eighth grade may also measure students’ motivation and achievement. Student attendance and chronic absenteeism in eighth grade are also included. Attendance might be a key assignment mechanism, since students who have poor attendance might be seen as being a better fit for a flexible, online platform.
We include several covariates measured in high school as long it is unlikely these covariates are endogenous to assignment to OCR. As indicated in the interviews with school districts, when a student failed a course (i.e., earlier or later in high school) had salience for OCR assignment, so we include year of first failure. Since discipline could be an assignment mechanism for OCR, we measure discipline in the year of first failure in high school with an indicator of whether the student received a behavioral infraction. Note that we did not include school-level covariates in matching.
As a robustness check, we include the other covariates measured in high school (see the Measures section) in the matching procedure. While we cannot guarantee they are not mediated by OCR assignment, we construct these variables to lessen this concern. We included distance from passing for first time failure, distance from passing for first time enrollments in EOC courses, first-time EOC scores, and an interaction between the latter two variables.
To empirically examine the extent to which our strong identification assumption was likely to hold, we assess whether these covariates are correlated with treatment assignment and the outcomes in two ways. First, we examine within cohort-school correlations between the covariates, treatment assignment, and graduation (see Steiner et al., 2010). For OCR, 23/40 covariates had significant correlation coefficients with OCR assignment within school-cohort. The comparison groups had a similarly high proportion of the variables with significant correlations (29/40 for F2F). All of the covariates have significant correlations with graduating high school. In addition, we compared a naïve linear probability model predicting OCR assignment with no covariates to a linear probability model predicting OCR assignment with the covariates (both with school-cohort fixed effects). The R2 in the naïve model with graduation as the outcome is .058, and the R2 in the model with covariates is .141, a noticeable improvement in the R2, even allowing for the attenuation of the R2 due to the binary dependent variable.
Our matching approach uses MMWS adjustment. MMWS combines propensity score and stratification methods of matching (Hong, 2010, 2012; Linden, 2017). The MMWS procedure begins by estimating propensity scores through a logistic regression model followed by stratifying the sample based on the propensity score. We then calculate a marginal mean weight based on the propensity score and stratification procedure that is designed to reweight the sample to represent the proportion of the sample we would expect to be assigned to each condition if treatment was assigned randomly using the mmws command in Stata (Linden, 2014). While the MMWS procedure is done across the sample, not within school-cohort, we then fit an OLS model with school-by-cohort fixed effects and full covariates with this marginal mean weight.
We assess balance on the sample reweighted by the MMWS procedure using two metrics based on the advice of Stuart (2010): standardized difference in means and the ratio of standard deviations (SD) between the treated and comparison groups. According to Stuart (2010), the difference in standardized means should all be less than 0.25, and the ratio of SD should be between 0.5 and 2. The OCR and F2F samples are already very similar prior to matching with only a couple of differences between them. As shown on Table 1, these differences were even smaller post-weighting with an average standardized difference pre-matching of 0.067 and an average standardized difference post-weighting of 0.004. The SD ratios post-weighting were also very close to 1 with a range of 0.973 to 1.168.
Balance Check Pre-Weighting and Post-Weighting.
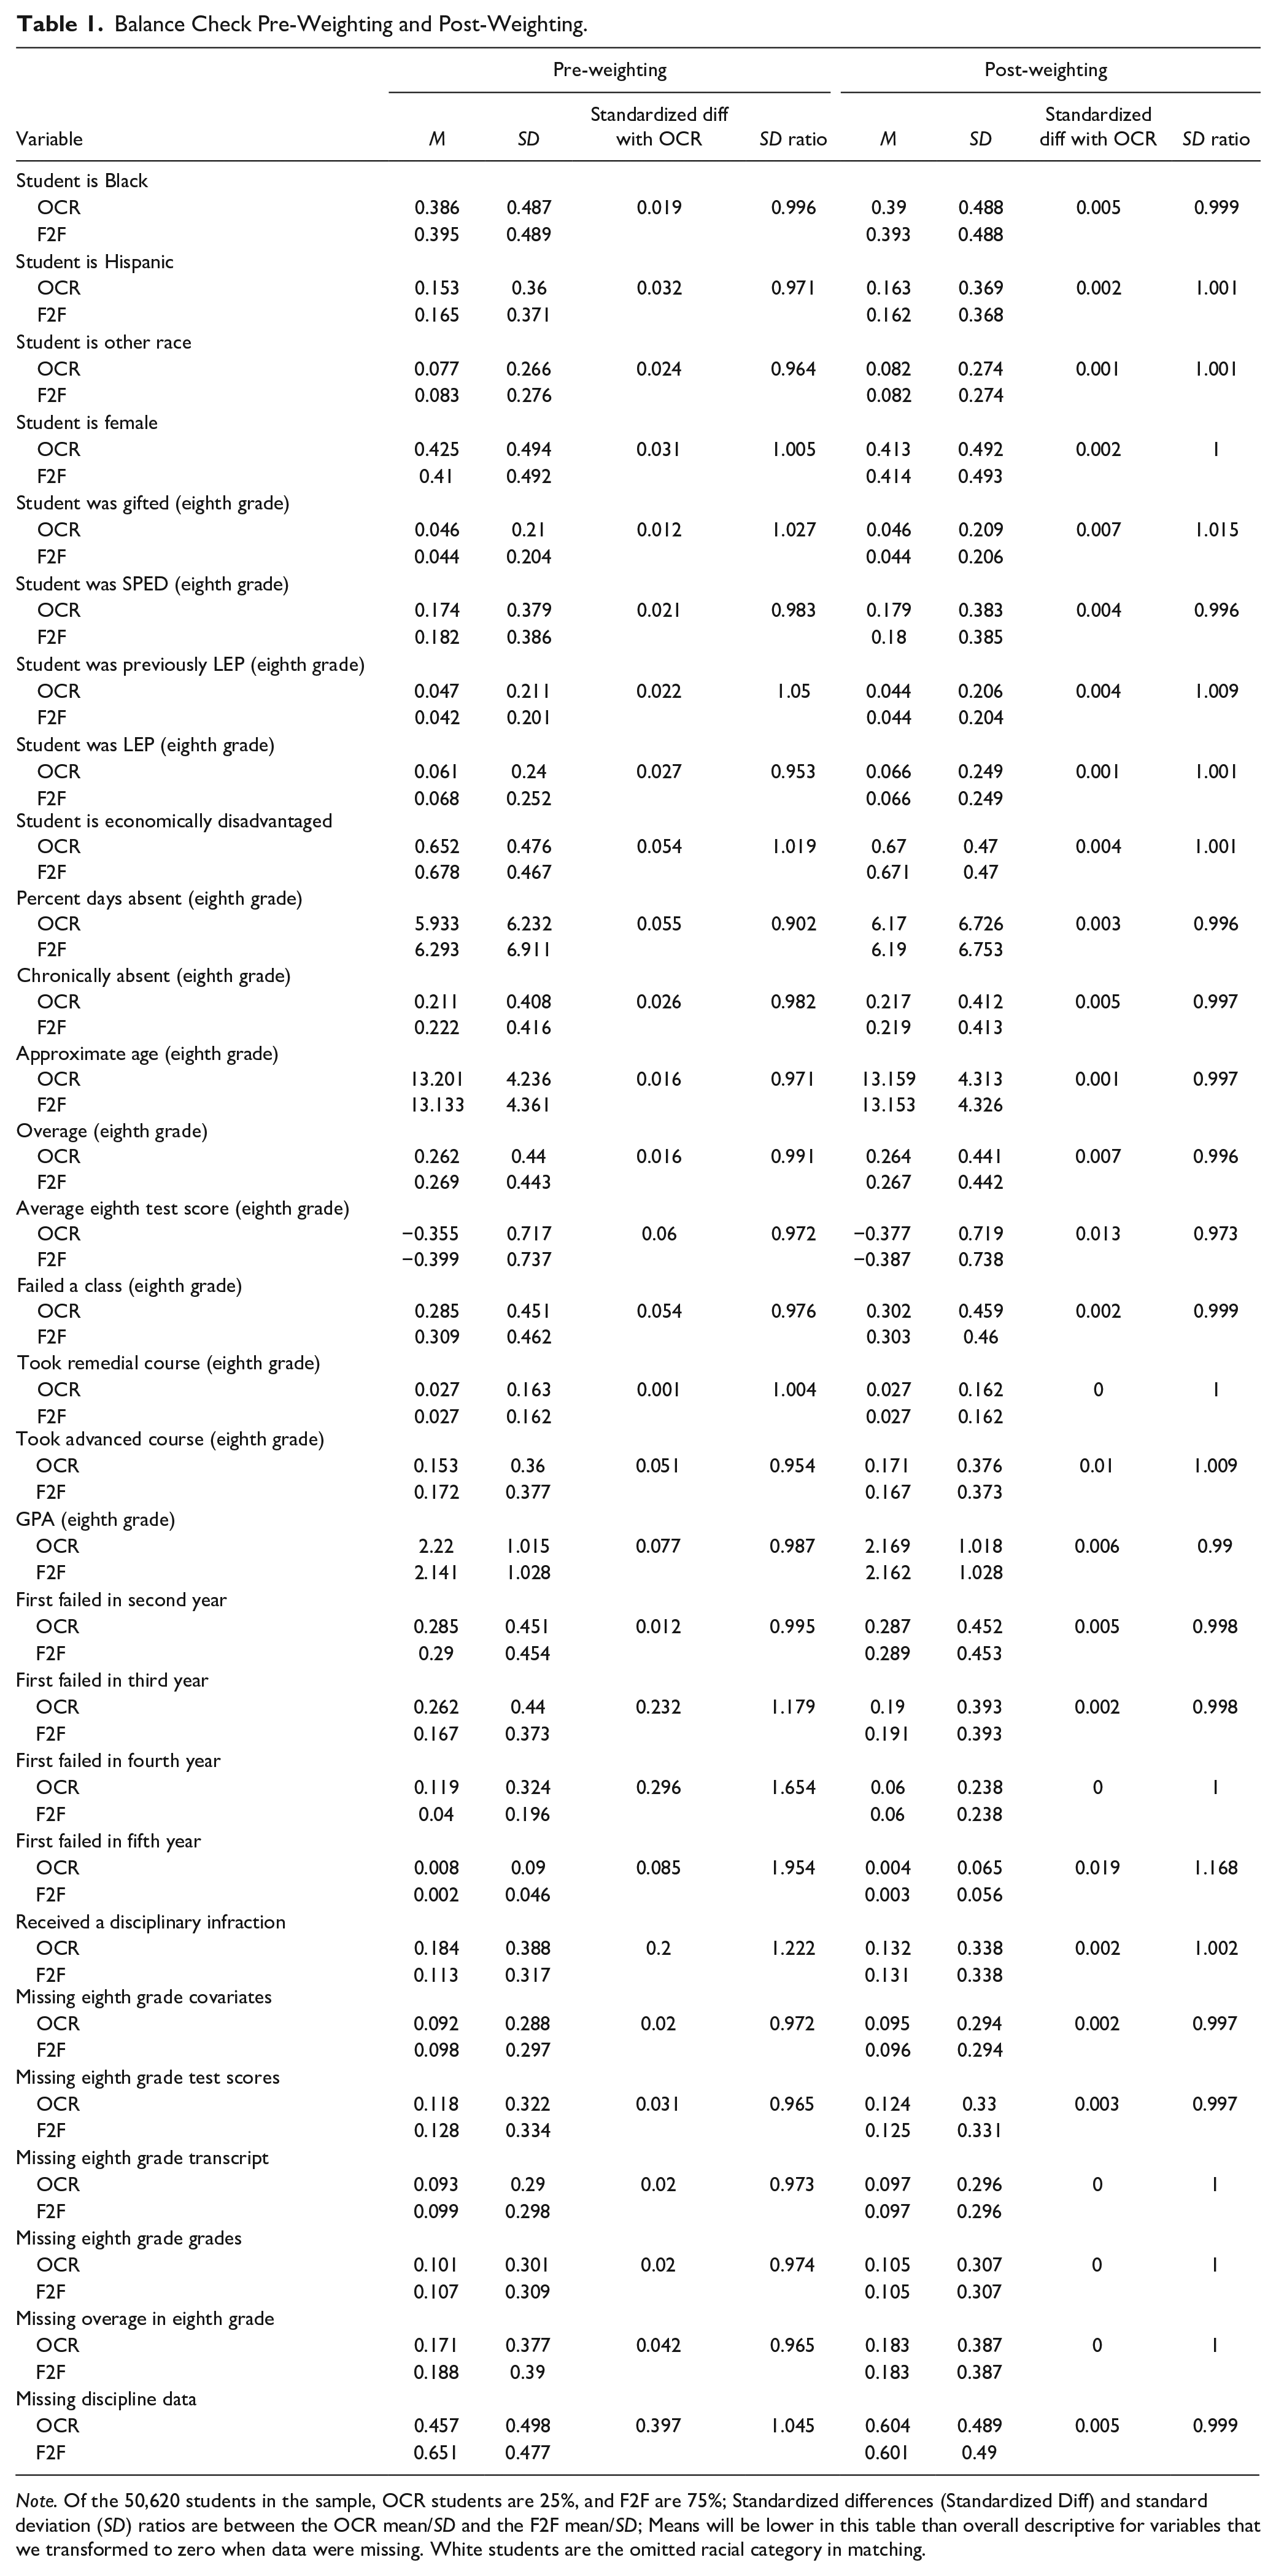
Note. Of the 50,620 students in the sample, OCR students are 25%, and F2F are 75%; Standardized differences (Standardized Diff) and standard deviation (SD) ratios are between the OCR mean/SD and the F2F mean/SD; Means will be lower in this table than overall descriptive for variables that we transformed to zero when data were missing. White students are the omitted racial category in matching.
We also assess balance using a variety of covariates that we did not include in the matching procedure. Covariates included in MMWS were correlated with treatment assignment and the outcomes, but our rich administrative dataset included many covariates that we could use to assess balance post-matching. We created a variety of variables using data on students’ middle schools, their middle school classmates, and middle school teachers. We found in this exercise that the samples are already very similar pre-matching (average standardized difference of 0.058) and even more similar when weighted (average standardized difference of 0.045). These weights produced balanced samples based on the metrics suggested by Stuart (2010).
The final models are linear probability models with cohort-by-school fixed effects, probability weights from the MMWS procedure, and all of the covariates used in matching,

The outcome,
Limitations
While our goal is to reduce endogeneity to estimate a plausibly unbiased treatment effect of OCR on the outcomes, several sources of endogeneity may not be fully addressed. In the course passing and EOC score student-by-school fixed effect analysis, we account for non-time-varying student/school characteristics but only account for time-varying student/school characteristics by adjusting for covariates. If something about the student or school changed substantially over time (in ways not accounted for by the year and grade fixed effects) but related to both assignment to OCR and the course-level outcomes, then these changes could lead to bias.
Similarly, our approach makes it difficult to assess whether the OCR course itself is driving outcomes or the way in which the OCR course is offered. For instance, schools could be systematically using OCR over the summer instead of offering a traditional F2F option. In that example, offering courses over the summer could drive the estimated effect of OCR and not the online nature of the course. This would only be an issue to the extent that schools systematically are offering F2F and OCR in fundamentally different ways that are not captured by our fixed effects or covariates. Our interviews and other research in this state context give us confidence that this is a minimal threat to estimates of OCR effectiveness.
For the graduation analysis, we are aware of additional concerns for potential endogeneity. For instance, if students were assigned to OCR in schools in a highly-personalized manner, such that two students who look identical according to their data (e.g., same middle school attendance, test scores, and grades) are assigned to OCR based on specific information about those students that is uncorrelated with the available covariates and also predicts their high school graduation propensity, then the treatment effect estimates would be biased. The extent to which this was true is unknown and may vary across and within schools. Above, we review many of the reasons students are assigned to OCR. We account for most of these explanations using available covariates. Likely, students are assigned to OCR in some mixture of random and highly purposeful ways, with some schools perhaps using one approach or the other, while others mix the two. However, purposeful assignment only biases the estimates to the extent that it is not correlated with covariates like gender, test scores, or attendance. In addition, a continuing debate among causal inference researchers asks whether matching represents a substantial improvement in bias reduction over regression, particularly when matching without a pre-treatment measure of the outcome (Angrist & Pischke, 2009; Cook et al., 2008). Considering pre-treatment measures of one-time events like graduation do not exist, it is possible that the matching process did not lessen bias beyond what we would observe using covariate-adjustment alone.
Results
The results for the student-by-school fixed effects model with course passing as the outcome are listed in Table 2 for 1,195,448 course enrollments of 281,233 students. The first panel has the findings for all courses with the first column including the full sample. We can observe, as expected, students are much more likely to pass the course when they retake the course. OCR courses are associated with a 58 percentage point (pp) increase in probability of passing and F2F courses are associated with a 39 pp increase. Consequently, students in OCR are about 19 pp more likely to pass the course than students in F2F courses (Wald test p < .001). We found similar differences between OCR and F2F in the models estimated using the five groups in columns 2 through 6. The likelihood of passing the course for OCR compared to F2F is 2.2 pp higher for non-ED than ED students (Chow test p = .002).
Results From Student-by-School Fixed Effect Models With Passing Failed Courses as the Outcome.
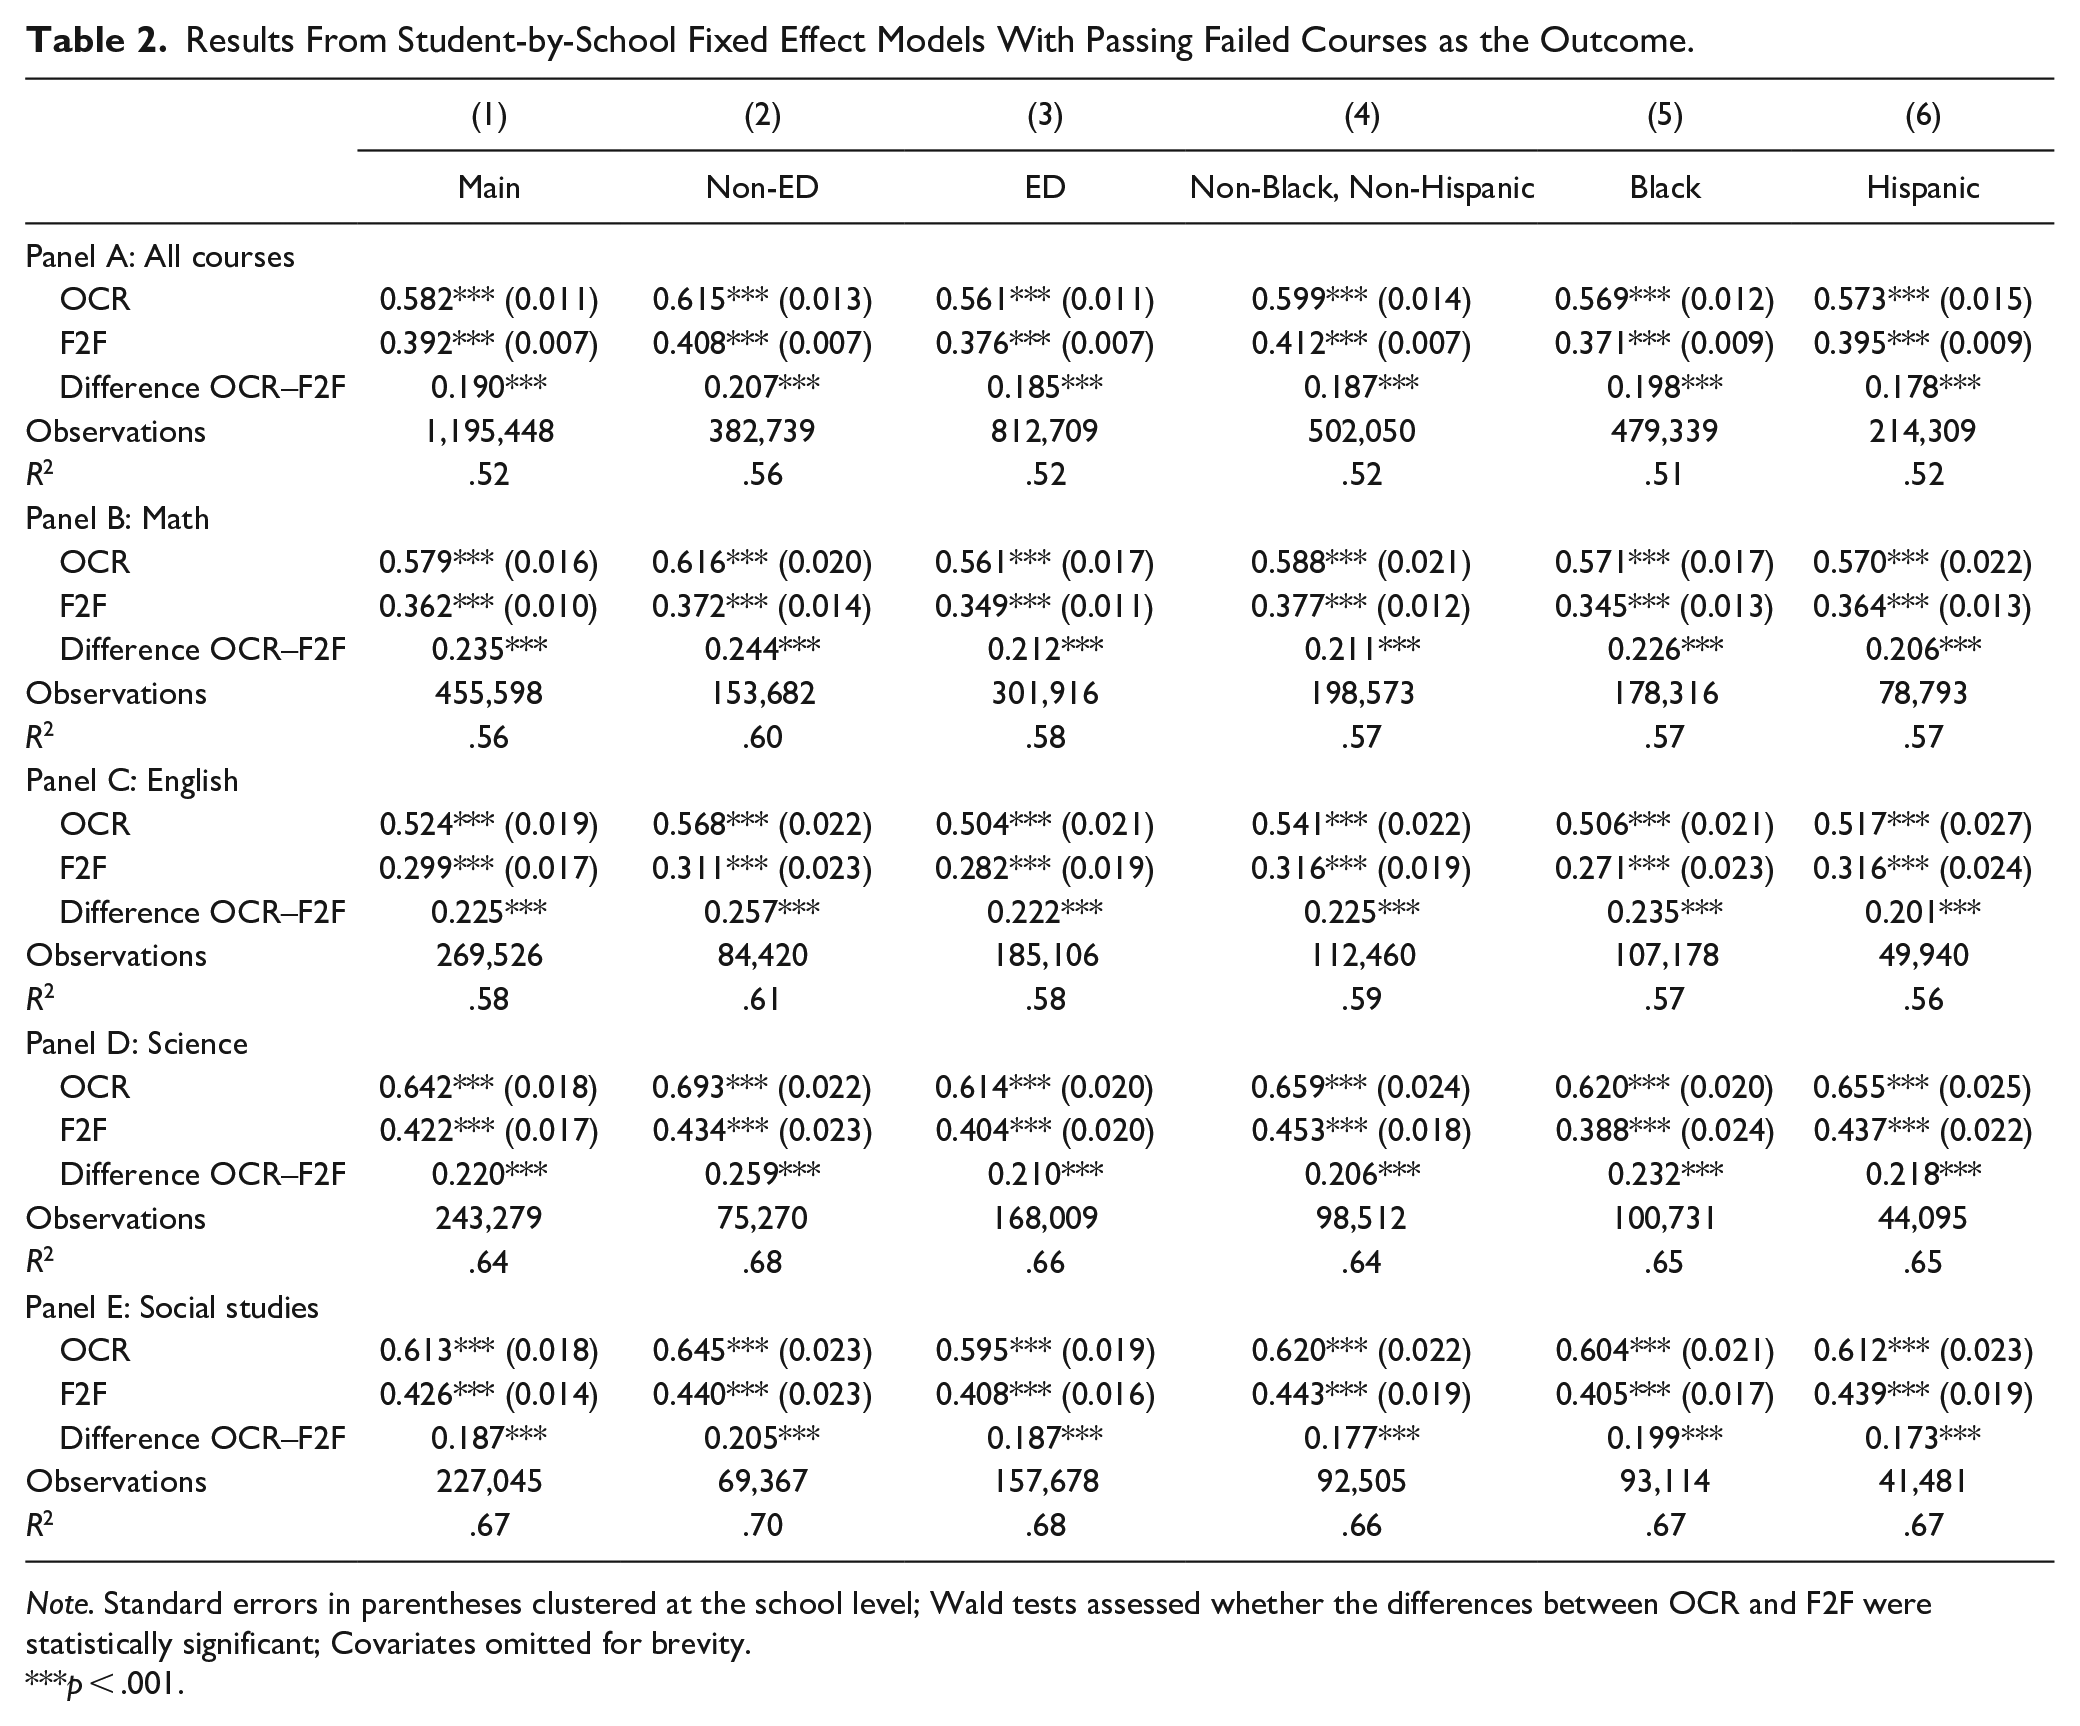
Note. Standard errors in parentheses clustered at the school level; Wald tests assessed whether the differences between OCR and F2F were statistically significant; Covariates omitted for brevity.
p < .001.
We then examine results by course subject. Panel B includes all math courses, Panel C incudes all English courses, Panel D includes all science courses, and Panel E has all social studies courses. We can see across all subjects and groups that OCR courses have a higher probability of passing than F2F courses. We can observe some variation in this difference across subjects. While the probability of passing OCR is consistently about 20 to 24 pp higher than F2F for math, English, and science courses, the difference in probabilities is slightly lower for social studies courses, with social studies OCR courses being about 18 to 20 pp more likely to result in passing than F2F courses. While we observe the difference-in-differences is significant overall between ED and non-ED students, this difference-in-difference is correspondingly significant for English courses (0.035, p = .012) and science courses (0.049, p < .001). We also find the difference-in-difference is significant comparing Black with non-Black, non-Hispanic students such that Black students have significantly larger difference in probabilities of completing an OCR science versus a F2F course (0.026, p = .046) and social studies (0.022, p = .045) than non-Black, non-Hispanic students. While OCR courses consistently have a higher probability of resulting in course credit, this is even more the case for non-ED students in English/science and for Black students in science/social studies.
Results from student-by-school fixed effects models with EOC scores as the outcomes are listed in Table 3 for 196,286 EOC scores from 112,943 students. The first panel shows the results for all EOCs, and the first column has the coefficient for the full sample. The difference between the OCR and F2F coefficients is over a 10th of a standard deviation and is statistically significant (−0.117, Wald test p < .001). We show the results for the student-by-school fixed effects models restricted to groups of students by ED status and race/ethnicity in columns 2 to 6. Each of the five groups had significantly lower test scores for OCR compared to F2F of a similar magnitude. We found no significant differences between OCR coefficients across models or difference-in-differences in the comparison of OCR and F2F.
Results From Student-by-School Fixed Effect Models With Standardized End of Course Exam Scores as the Outcomes.
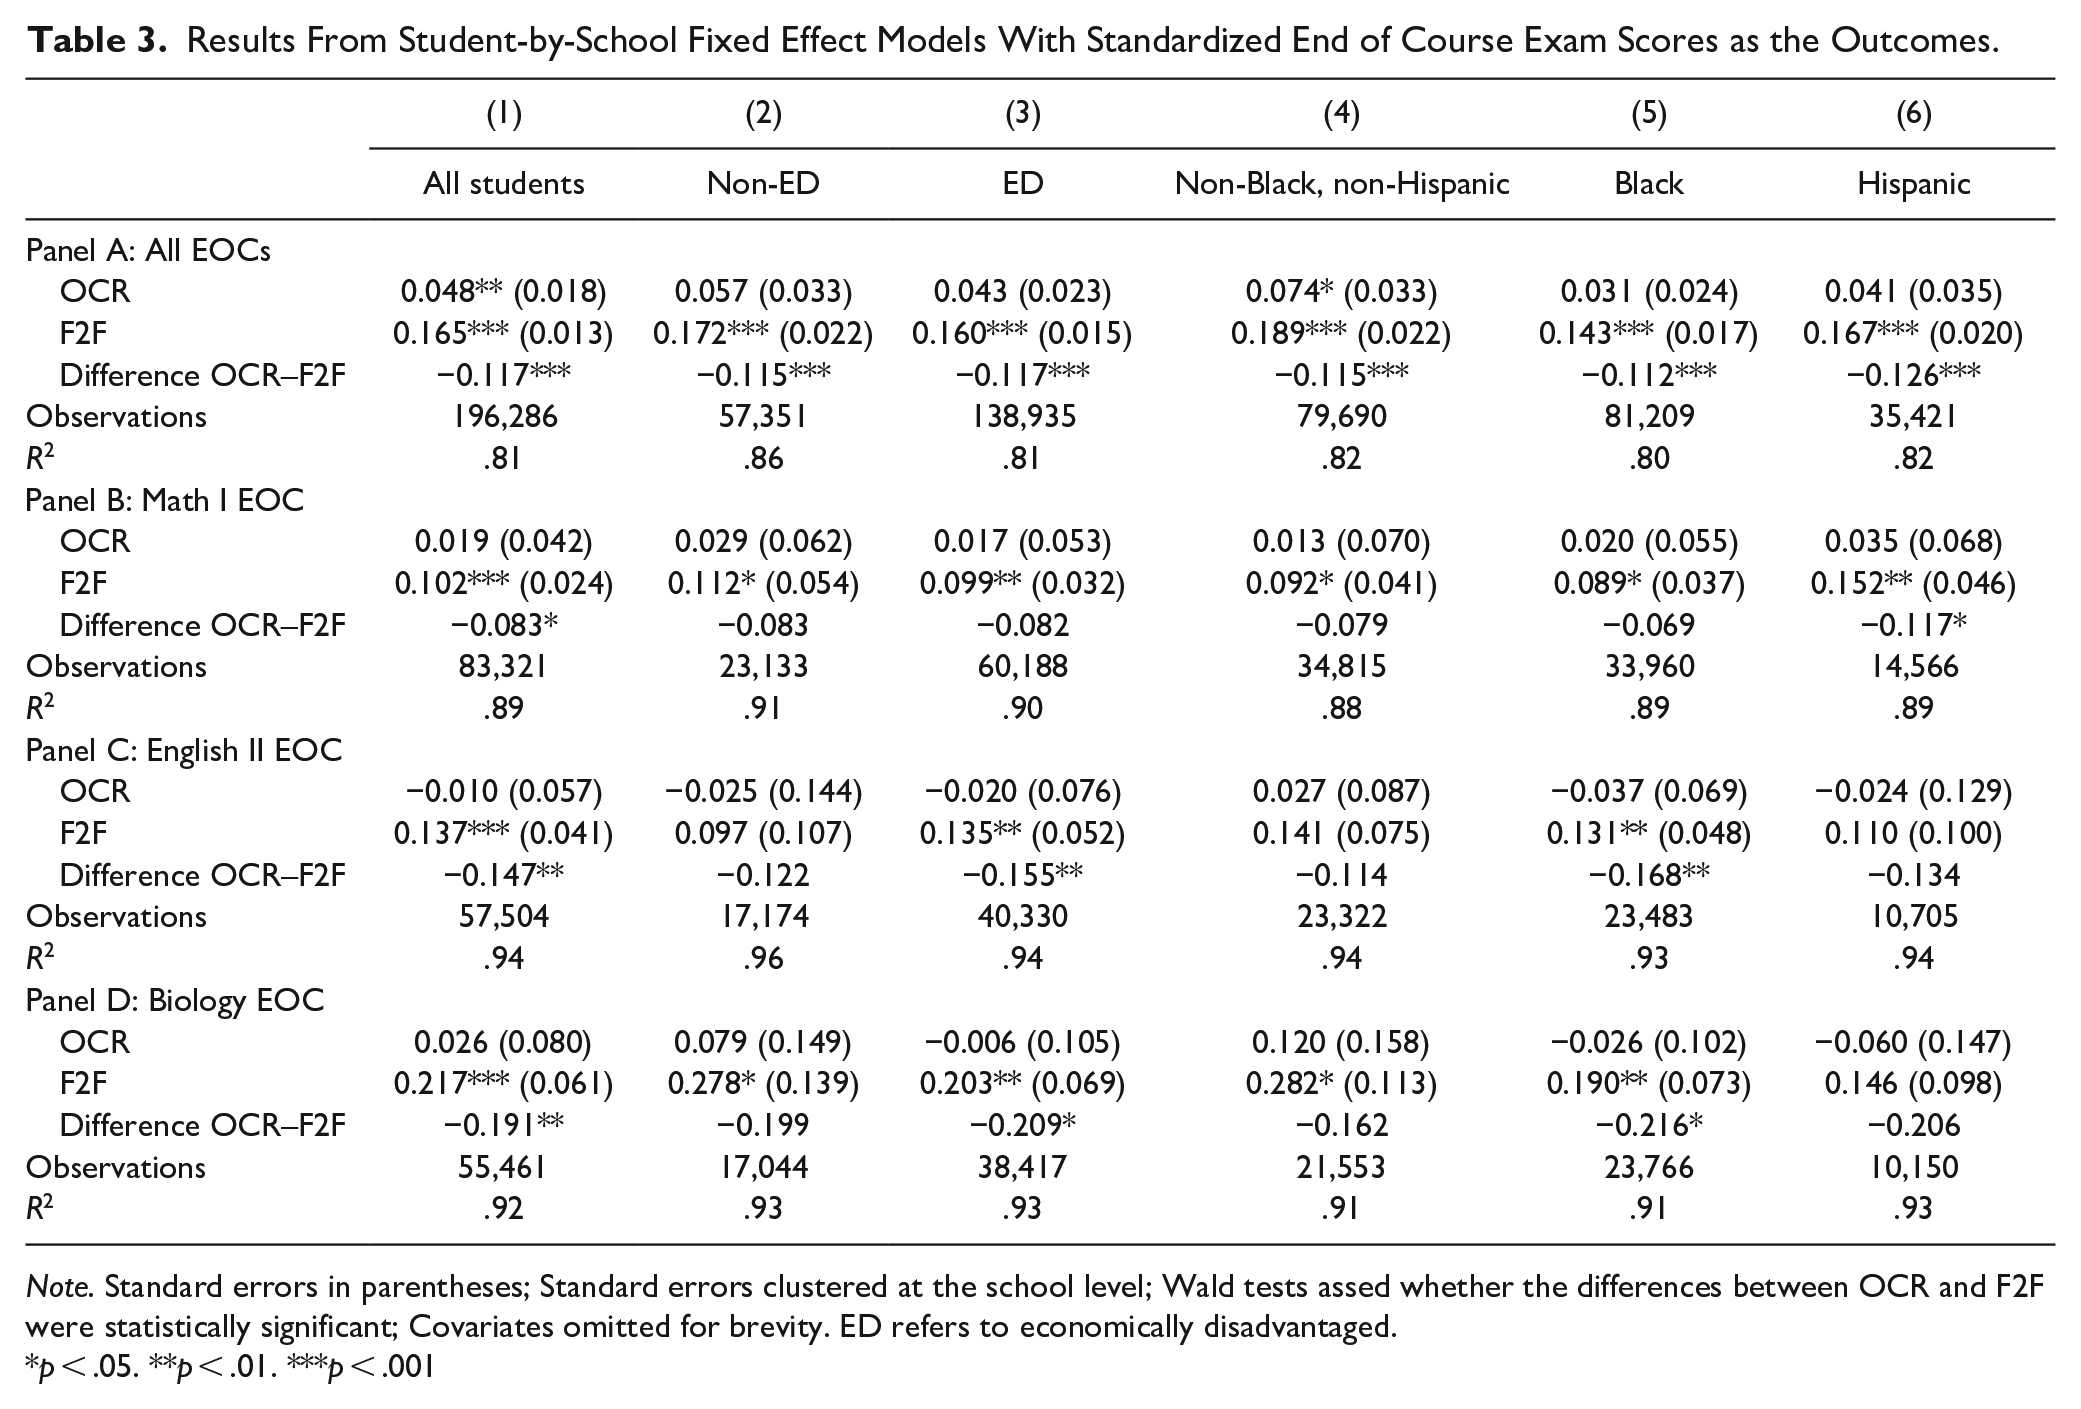
Note. Standard errors in parentheses; Standard errors clustered at the school level; Wald tests assed whether the differences between OCR and F2F were statistically significant; Covariates omitted for brevity. ED refers to economically disadvantaged.
p < .05. **p < .01. ***p < .001
We next examined the results by EOC subject. In panel B for the Math I EOC, the difference between the OCR and F2F coefficients is just below a 10th of a standard deviation (−0.083, Wald test p = .021). The only group with significant differences between OCR and F2F is Hispanic students with over a 10th of a standard deviation difference in scores. As is shown in panel C, we find a −0.147 difference in learning gains for English II EOC between OCR and F2F (Wald test p = .001). The difference between OCR and F2F is significant for the sample of ED students (−0.155, Wald test p = .010) and Black students (−0.168, Wald test p = .005), but not statistically significant for the other student groups. While the coefficient on OCR is similar in Panel D for the Biology EOC compared to the OCR coefficient for the Math I EOC, the coefficient on F2F is larger for the Biology EOC. The difference between the OCR and F2F coefficients for the Biology EOC is now almost two tenths of a standard deviation (−0.191, Wald test p = .004). The difference between OCR and F2F is only statistically significant for ED students (−0.209, Wald test p = .024) and Black students (−0.216, Wald test p = .040). We do not find evidence that these negative effects are more or less pronounced for certain groups of students in each subject (i.e., the difference-in-differences are not statistically significant).
We examine the results on graduation visually in Figure 1 to ease interpretation of the interactions. This figure has the predicted probabilities of graduating from high school from the interaction terms by treatment/comparison status and race/ethnicity or ED status. As is shown in Figure 1, OCR students, regardless of the group, are predicted to be more likely to graduate from high school. This corresponds to the coefficient on OCR in the models (0.076, p < .001), where OCR students are predicted to be 8 pp more likely to graduate high school than F2F students. These differences are particularly pronounced for Hispanic students and ED students. Hispanic F2F students have a predicted probability of graduating of 0.61 and Hispanic OCR students have a predicted probability to graduating of 0.71 (Wald test p < .001). ED F2F students have a predicted probability of graduating of 0.71 compared to 0.80 for ED OCR students (Wald test p < .001). Black OCR students also are shown to be more likely to graduate high school (0.79) than Black F2F students (0.72; Wald test p < .001). Note that ED OCR students have a slightly higher predicted graduation probability as non-ED F2F students (0.80 compared to 0.78; Wald test p = .04). F2F Hispanic students have the lowest predicted probability of graduating (0.61), but Hispanic OCR students have a slightly higher, but not significantly, predicted probability of graduating (0.71) compared to White OCR students (0.69; Wald test p = .14).
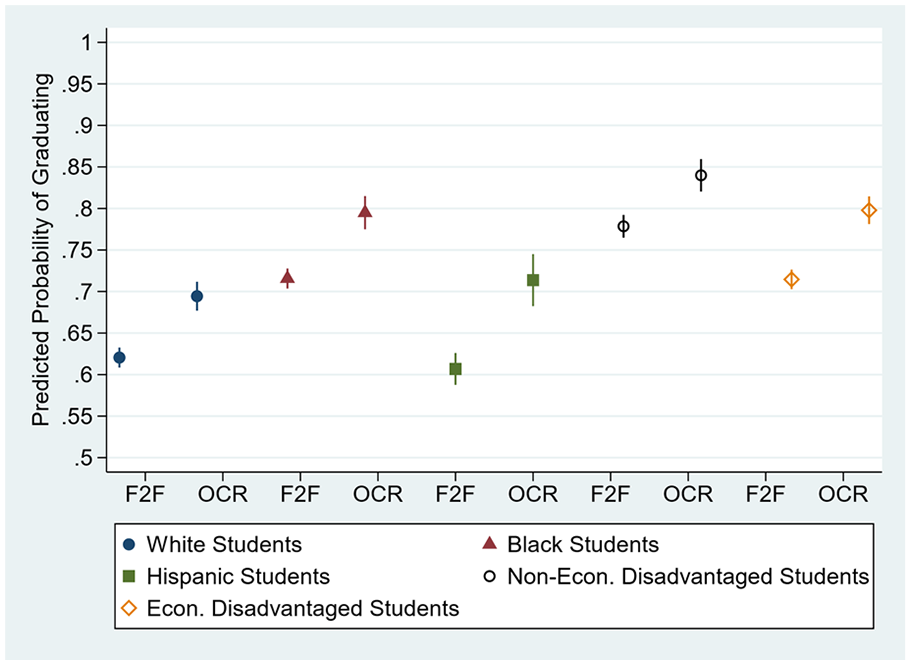
Predicted probability of graduating from high school based on student race, economic disadvantage status, and OCR versus F2F enrollment with 95% confidence intervals.
Robustness Checks
We perform several robustness checks to see if the results are sensitive to specification of the model and the matching strategy. 6 We estimate models with binary outcomes using logistic regression, with results maintaining the same significance levels and direction. We then compare estimates of the results for the high school graduation models that allow for case-wise deletion which were smaller in magnitude but in the same direction and statistical significance level as the main results. We assess if the results could be an artifact of the different samples of students across the three analyses or the different method and covariates used to estimate each model. When we estimated a school-by-cohort fixed effect model with the same covariates for all outcomes, we find very similar results. We then conduct an identical matching process with the passing courses sample and the EOC sample, as we did for the high school graduation analysis. We fit the original models of those outcomes but weighted with propensity scores with student-by-school fixed effects and then with school-by-cohort fixed effects with very similar results.
For the passing courses and EOC analysis, we include an additional robustness check that excludes students who did not retake the course (i.e., they did not take OCR or F2F for that course), restricting the sample to students with at least two course enrollments or EOC scores, respectively. We find identical results. We include a couple more robustness checks on the EOC analysis. First, we restrict the sample to only include students who did not score proficient on their initial EOC exam, producing very similar results. Second, we exclude students for whom we cannot determine if the EOC was taken at the end of the OCR or F2F course because they took both types of courses in the same year. The results are identical in interpretation. Third, since the 2012-2013 school year, all students enrolled in 11th grade in NC are required to take the ACT. Since this study’s sample is comprised of students who fail courses, only 63% of the sample took the ACT with OCR students more likely to persist to 11th grade and therefore take the ACT. For this reason, we did not include ACT scores in our main set of results, but we use ACT scores as a robustness check. We use the graduation analysis sample and methodology to conduct this robustness check, finding OCR students are predicted to have ACT scores that are 0.22 standard deviation units lower than F2F students, very similar results compared to the EOC analysis.
We now discuss several additional robustness checks for the high school graduation analysis. We restrict the sample to only students who failed one class and redo the full analysis. The coefficients are slightly smaller but retain statistical significance. We had access to additional variables measured in high school that we did not include in the main specifications because they could be potential mediators between OCR assignment and the outcomes. We rerun the matching procedure including these variables with the original set of covariates. Matching is successful, and the results are almost identical. It’s possible that the positive association between OCR and high school graduation is a result of some students having more access to OCR courses and not enrolling in OCR courses themselves. After restricting the sample to only students who had access to OCR courses since their first ninth grade year of high school, the results are almost identical to the main estimates. Also, the original model’s unit of observation is at the student-school level, leading to students who attended multiple schools to have more than one observation. We re-run the matching process and models (1) excluding students who attended more than one school and (2) retaining these students, but only keeping the ID for the first school they attended. Both changes in sample led to equivalent results. We also re-run the matching procedure and re-fit the models including the OCR&F2F/Neither OCR nor F2F groups with identical results.
To test the robustness of our results to an alternative matching approach, we combine exact matching, coarsened exact matching, and matching based on a distance measure (Iacus et al., 2019; King & Nielsen, 2019). We exact match students who failed courses and subsequently only enrolled in OCR to those that only enrolled in F2F credit recovery (removing those who did OCR and F2F and neither from the sample) on receipt of a disciplinary infraction, cohort, and school. We then take a coarsened exact matching approach by matching students on the quintile of their average eighth grade test scores. The students are then matched on the full set of covariates using a Mahalanobis distance measure (King & Nielsen, 2019). When we fit models using this matched sample, the results are similar to our preferred approach.
Conclusion
Students who fail courses in high school are commonly faced with two options to make up for that failed credit: F2F (over the summer, after school, or during the school year) or OCR. This study shows empirically that OCR is associated with higher probability of high school graduation for students who fail core courses. Using carefully selected methods that account for most likely sources of bias, this study finds that OCR led to a higher likelihood of graduating compared to students who only retook courses F2F. These results are especially pronounced for Hispanic and ED students.
We found passing previously failed courses is a potential mechanism that could lead to OCR students being more likely to graduate, although we did not find the same patterns by group. OCR students are predicted to be more likely to pass previously failed courses than F2F students across all subjects and especially for non-ED and Black students. However, OCR appears to result in less student learning compared to F2F as measured by EOCs, especially the EOCs in English and Biology, and, in robustness checks, the ACT. The negative effect sizes for these assessments could be described as medium to large effects (range is −0.22 to −0.08), showing that these negative associations are practically significant (Kraft, 2020). These positive associations for passing courses and negative associations for test scores appeared to be equally shared by students by race and socioeconomic statuses. In some ways, OCR might be allowing traditionally marginalized students to have a higher probability of graduating while not exacerbating inequality in other ways, at least compared to traditionally advantaged OCR peers.
These results confirm much of what others found when evaluating the effects of OCR on students’ outcomes. A prior study in NC found NCVPS OCR students had higher on-time graduation rates almost identical to our findings (Stallings et al., 2016). Our results also mirror findings from Florida where students who repeated courses online were 5 pp more likely to pass OCR courses than F2F courses and 7 pp more likely to remain in high school through the spring of 12th grade (their proxy for graduating; Hart et al., 2019). We have similar results as a study of a large, urban school district which found students likely enrolled in OCR were 8 to 11 pp more likely to graduate high school than F2F students (Heinrich & Darling-Aduana, 2021). While the RCT in Chicago initially found OCR students had lower posttest scores in Algebra I than F2F students, OCR students were less likely to pass the course with no effect on graduation (Heppen et al., 2017; Rickles et al., 2018). Our study differs from the RCT in that students typically did not only take one OCR or F2F course (69% of the sample took more than one of either OCR or F2F) and took OCR in courses other than Algebra I (equivalent to Math I in NC). This leaves open the possibility that OCR can have differing effects based on the context and course.
From these results, we can hypothesize that OCR courses might tend to lack rigor and/or the same content as traditional courses. Since OCR courses are more likely to be passed but are associated with lower test scores, this could mean OCR encourages high school graduation by making it easier to accumulate course credits without the knowledge that would have been accrued in a traditional classroom setting. This study lends empirical support to much of what has been said by critics of OCR courses but should be considered exploratory. Future research should continue to test these hypotheses in other settings and with more years of data. We now have evidence on the effectiveness of OCR in a few different settings (Hart et al., 2019; Heinrich & Darling-Aduana, 2021; Rickles et al., 2018) which should help to justify continued randomized experiments to give schools and policymakers a clearer understanding of the effectiveness of OCR in helping students graduate with possible tradeoffs in student learning.
However, the relative merits of OCR have not been explored in this study. Graduating from high school might have greater benefits, both individually and societally, than small to medium changes in test scores. This pattern of increasing graduation rates potentially at the expense of student learning might erode the economic signal provided by high school graduation (Heinrich & Cheng, 2022). These kinds of questions about what the high school credential does and should signify are currently playing out in schools, as they decide whether to enact policies that might increase their graduation rates to the detriment of scores on high-stakes assessments. This study gives school leaders more empirical information with which to make these decisions.
Footnotes
Appendix
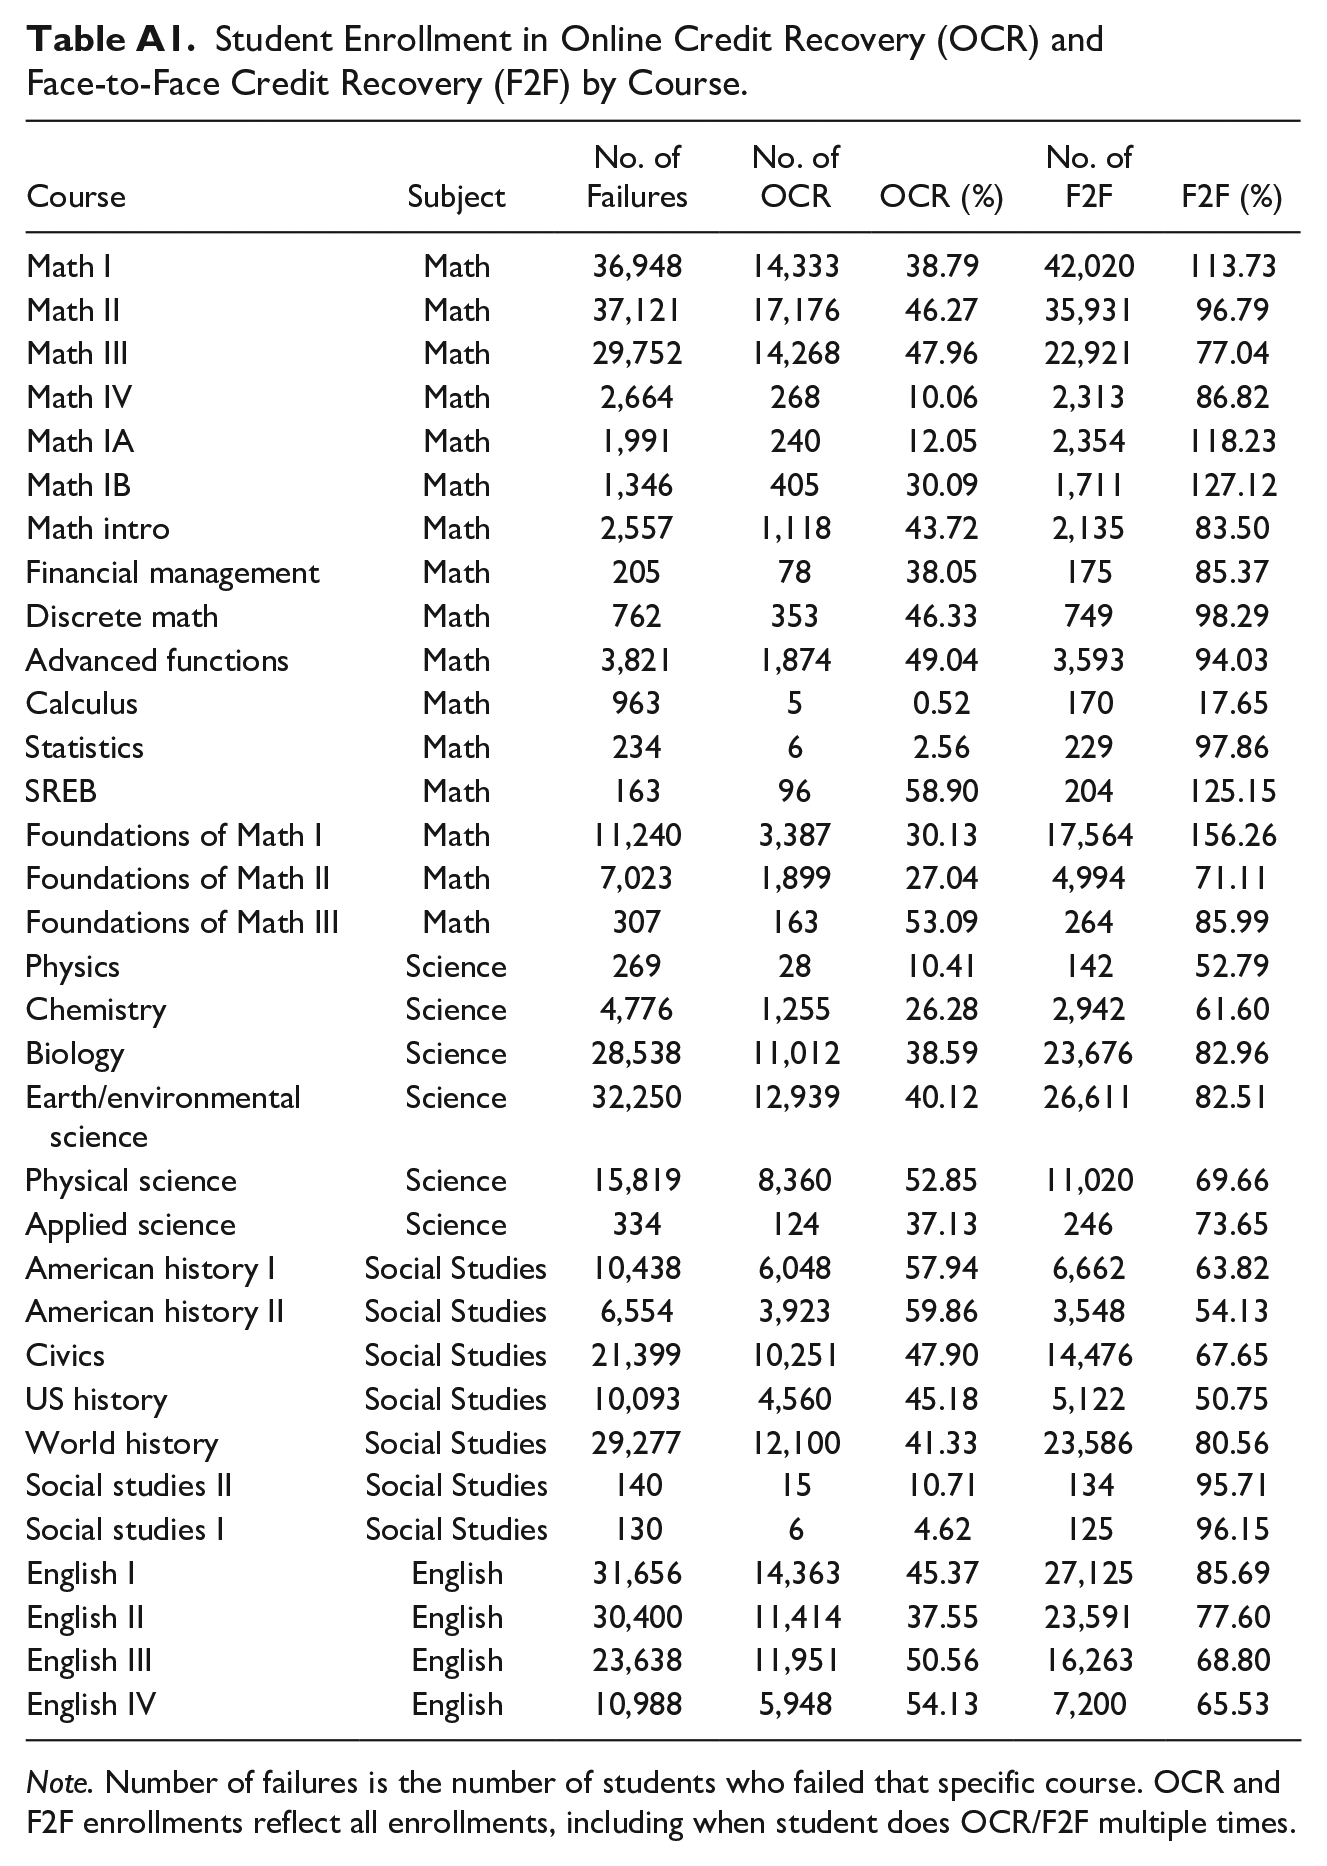
Student Enrollment in Online Credit Recovery (OCR) and Face-to-Face Credit Recovery (F2F) by Course.
| Course | Subject | No. of Failures | No. of OCR | OCR (%) | No. of F2F | F2F (%) |
|---|---|---|---|---|---|---|
| Math I | Math | 36,948 | 14,333 | 38.79 | 42,020 | 113.73 |
| Math II | Math | 37,121 | 17,176 | 46.27 | 35,931 | 96.79 |
| Math III | Math | 29,752 | 14,268 | 47.96 | 22,921 | 77.04 |
| Math IV | Math | 2,664 | 268 | 10.06 | 2,313 | 86.82 |
| Math IA | Math | 1,991 | 240 | 12.05 | 2,354 | 118.23 |
| Math IB | Math | 1,346 | 405 | 30.09 | 1,711 | 127.12 |
| Math intro | Math | 2,557 | 1,118 | 43.72 | 2,135 | 83.50 |
| Financial management | Math | 205 | 78 | 38.05 | 175 | 85.37 |
| Discrete math | Math | 762 | 353 | 46.33 | 749 | 98.29 |
| Advanced functions | Math | 3,821 | 1,874 | 49.04 | 3,593 | 94.03 |
| Calculus | Math | 963 | 5 | 0.52 | 170 | 17.65 |
| Statistics | Math | 234 | 6 | 2.56 | 229 | 97.86 |
| SREB | Math | 163 | 96 | 58.90 | 204 | 125.15 |
| Foundations of Math I | Math | 11,240 | 3,387 | 30.13 | 17,564 | 156.26 |
| Foundations of Math II | Math | 7,023 | 1,899 | 27.04 | 4,994 | 71.11 |
| Foundations of Math III | Math | 307 | 163 | 53.09 | 264 | 85.99 |
| Physics | Science | 269 | 28 | 10.41 | 142 | 52.79 |
| Chemistry | Science | 4,776 | 1,255 | 26.28 | 2,942 | 61.60 |
| Biology | Science | 28,538 | 11,012 | 38.59 | 23,676 | 82.96 |
| Earth/environmental science | Science | 32,250 | 12,939 | 40.12 | 26,611 | 82.51 |
| Physical science | Science | 15,819 | 8,360 | 52.85 | 11,020 | 69.66 |
| Applied science | Science | 334 | 124 | 37.13 | 246 | 73.65 |
| American history I | Social Studies | 10,438 | 6,048 | 57.94 | 6,662 | 63.82 |
| American history II | Social Studies | 6,554 | 3,923 | 59.86 | 3,548 | 54.13 |
| Civics | Social Studies | 21,399 | 10,251 | 47.90 | 14,476 | 67.65 |
| US history | Social Studies | 10,093 | 4,560 | 45.18 | 5,122 | 50.75 |
| World history | Social Studies | 29,277 | 12,100 | 41.33 | 23,586 | 80.56 |
| Social studies II | Social Studies | 140 | 15 | 10.71 | 134 | 95.71 |
| Social studies I | Social Studies | 130 | 6 | 4.62 | 125 | 96.15 |
| English I | English | 31,656 | 14,363 | 45.37 | 27,125 | 85.69 |
| English II | English | 30,400 | 11,414 | 37.55 | 23,591 | 77.60 |
| English III | English | 23,638 | 11,951 | 50.56 | 16,263 | 68.80 |
| English IV | English | 10,988 | 5,948 | 54.13 | 7,200 | 65.53 |
Note. Number of failures is the number of students who failed that specific course. OCR and F2F enrollments reflect all enrollments, including when student does OCR/F2F multiple times.
Declaration of Conflicting Interests
The author(s) declared no potential conflicts of interest with respect to the research, authorship, and/or publication of this article.
Funding
This research was supported by the National Academy of Education and the National Academy of Education/Spencer Dissertation Fellowship Program.