
Abstract
Charter schools are considered an important education reform effort in the United States. High school graduation stands as an important milestone that impacts students’ future opportunities. Hence, it is important to examine whether attending charter schools affects students’ likelihood of graduation and influences equity among students from various backgrounds. Our study addresses these questions by using student-level longitudinal data for seven cohorts of Utah public high school students who started ninth grade between 2011–12 and 2017–18. Our analysis reveals that students who attended charter high schools experienced lower probability of graduation than their counterparts in traditional public schools. However, this gap has been narrowing over time. Moreover, the evidence from our analysis is inconclusive as to whether charter school attendance promotes equity among students with diverse backgrounds. Regardless of school type, it is crucial to create an effective and equitable educational system that supports the success of all students.
Keywords
Introduction
Since their establishment in the early 1990s, charter schools have been regarded as an important aspect of the education reform landscape in the United States. Charter schools have garnered attention nationwide and received both acclaim (e.g., touted as a quality and equitable alternative to traditional schools) and opposition (e.g., strain on already diminishing resources and mechanism of inequity) (Blatt & Votruba-Drzal, 2021; Whitehurst et al., 2016). Charter school advocates argue that charter schools may have an academic edge over traditional public schools (TPS) in their governance and funding structure (Betts & Tang, 2011; Bifulco & Ladd, 2006). Unlike TPS, charter schools are often exempted from state and local regulations that govern staffing, financing, and curricula (Betts & Tang, 2011; Clark et al., 2015; Malkus & Hatfield, 2017). As a result, many people argue that charter schools are better positioned to hire more qualified teachers, allocate funding in a manner that prioritizes student achievement, and adopt a nimble and innovative outlook as concerns their curricula and pedagogic methods (David et al., 2020; Hoxby & Rockoff, 2005).
In this article, we focus on the goal of charter schools to create educational opportunities for high school students. Compared with charter elementary and middle schools, charter high schools face challenges to improve student achievement and foster awareness of and access to postsecondary options for their students. High school graduation is one important measure of student achievement and a strong predictor of long-term outcomes. Furthermore, high school completion and graduation serve as a prerequisite for pursuing higher education (Heckman & LaFontaine, 2008). In the 2019–20 academic year, the graduation rate in the United States reached 87%. However, the graduation rates for public high school students who are American Indian/Alaska Native (75%), African American (81%), and Hispanic (83%) were below the national average (National Center for Education Statistics, 2023b). Like their TPS counterparts, charter schools create pathways toward high school graduation, including those that prepare students for college and the world of work.
The existing body of research on the relationship between charter school participation and high school graduation has been limited and has yielded mixed findings. Some studies have found that students who attended charter high schools were more likely to graduate than those who attended TPS (Booker et al., 2011; Dobbie & Fryer, 2011; Sass et al., 2016), whereas other studies have found no significant or negative charter effect on high school graduation (Angrist et al., 2013, 2016; Orfield & Luce, 2016). It is important to note that these studies have focused predominantly on specific locations such as Chicago, Boston, Florida, and a single school in California, making it premature to generalize the results.
Furthermore, advocates contend that charter schools foster equity by providing parents and students, particularly those from underrepresented communities, with an alternative to attending underperforming neighborhood TPS. Due to their nature, charter schools may benefit from increased autonomy and flexibility, which may allow them to develop unique educational models and adopt innovative teaching methods that effectively address the diverse needs of students. In contrast, critics argue that charter schools may perpetuate inequities, including by selective admissions or diverting resources away from TPS. Given the ongoing debates about which schooling option is better, it is essential to conduct empirical research that considers variables such as student demographics and selectivity when assessing the actual disparities in high school graduation rates for students attending charter schools and TPS. It is also important to examine whether attending charter schools indeed promotes equity and helps narrow the graduation gap among students from various backgrounds.
By using longitudinal student-level data for seven cohorts of high school students in Utah, we asked the following research questions (RQs):
RQ1: Is there a difference in high school graduation between students attending traditional and charter high schools?
RQ2: How does the relationship between high school graduation and charter school attendance vary across different student groups?
Despite the significance of high school graduation and college admissions, research investigating the effects of charter schools on high school graduation has been relatively limited until recently. This study addresses this gap by focusing on Utah, where charter school enrollment continues to grow alongside increasing diversity in the student population. Despite these important trends, this study is the first to examine Utah charter school graduation outcomes. Our analyses consider a wide variety of factors that previous research has found to be related to graduation outcomes and take measures to address selection bias. In what follows, we (a) summarize what is known about charter schools’ contribution to graduation rates and indicators of high school completion, (b) identify a theoretical lens that is hypothesized as the major differences in graduation rates at TPS and charter schools, (c) describe our data and analytic methods, (d) present our findings, and (e) discuss the strengths, limitations, and implications of these findings.
Literature Review
Since the No Child Left Behind Act became federal law in January 2002, high school graduation rates have served as a prominent metric of school performance in educational policy circles. No Child Left Behind required that high schools and state-district accountability systems incorporate a multipronged approach to school accountability based on metrics such as graduation rates and performance on academic assessments. In the beginning, states were only required to report graduation rates. Although states could set their own performance goals, schools that did not meet them were subject to sanctions, including various reform, oversight, and reporting requirements. In 2016, under the Every Student Succeeds Act, the U.S. Department of Education initiated efforts to raise higher graduation rate goals. Charter schools and TPS must use the 4-year graduation rate to measure their goals, must set goals for all students and for individual groups of students, and must provide baseline data, measures of interim progress, and a timeline for attaining their goals. In addition, states must designate high schools with 4-year graduation rates below 67% as comprehensive support and improvement schools as part of the states’ monitoring and oversight responsibilities. These accountability measures have renewed the debate about whether charter schools achieve greater educational outcomes.
Theoretical Lens
The charter school debates often draw on free-market principles rooted in economic theories of competition as articulated by influential economists such as Milton Friedman (1962). Friedman argued that introducing market mechanisms into education—such as vouchers or charter schools—could improve efficiency and quality by fostering competition. Allowing parents to choose between TPS and charter schools and tying funding to enrollment create incentives for educators in both types of schools to compete for students. This competition encourages improvements in academic performance by, for example, enhancing teacher quality, encouraging innovative instructional methods, and allocating resources more effectively. Poorly performing schools that fail to improve over time will lose students and revenue to higher-performing schools, potentially being driven out of the market. As a result, the market-based reform of charter schools was expected to lead to overall improvements in education. Charter school effects are thus understood to include both a direct impact—benefiting students who actively choose charter schools—and a systemic competitive effect—benefiting students who remain in TPS through improved performance in the broader education system (Hoxby, 2003).
However, although a market-driven approach suggests that school choice will improve overall education quality, critics argue that it may exacerbate inequities, a concern often referred to as an equity–efficiency tradeoff (Giesinger, 2011; Ladd & Fiske, 2021; Levin, 2009). By enabling students to select from a broader range of differentiated public schooling options, charter school policies inevitably create a sorting process that redistributes students based on family backgrounds, influencing the racial and socioeconomic diversity of schools. In other words, although competition from charter schools may lead to overall gains in student outcomes, it also could worsen disparities both within charter schools and for students remaining in TPS, thus raising significant equity concerns (Cohodes, 2018; Heckman & Masterov, 2007; Zimmer & Guarino, 2013).
To date, the direct and competitive effects of charter schools have been examined extensively. Many studies have focused on the direct effects of charter schools, investigating whether they achieve better educational outcomes with similar or fewer resources than TPS (Angrist et al., 2016; Orfield & Luce, 2016; Sass et al., 2016) and whether inequality among student subgroups is greater in charter schools than in TPS (Buerger & Bifulco, 2019; Giesinger, 2011; Walters, 2018). Other studies focus on the competitive effects of charter schools, exploring how their presence influences neighboring TPS and whether competition improves TPS performance (e.g., Arsen & Ni, 2012; Chen & Harris, 2023; Figlio et al., 2024; Ni, 2009; Ridley & Terrier, 2024) as well as whether inequalities within TPS are exacerbated by charter schools (Ni, 2012). Although both effects are important, our study addresses the direct effects of charter schools by examining whether students attending charter schools are more or less likely to graduate from high school compared with their peers in TPS.
The charter school literature has examined various educational outcomes, including test scores, high school graduation, college attendance, dropout rates, and long-term career success. Although these outcomes are all important, our study focused specifically on high school graduation. High school graduation is a stronger predictor of long-term life outcomes than test scores because it is essential for access to higher education and serves as a key milestone for future employment opportunities (Heckman et al., 2008). Furthermore, graduation rates offer a more comprehensive measure of a school’s long-term support for students because they capture factors such as engagement, retention, and academic success, which test scores alone may not reflect. Given that high school completion is a prerequisite for college and plays a crucial role in socioeconomic mobility, understanding how charter schools impact graduation rates is vital for evaluating their broader societal effects.
Additionally, given prior evidence of the mixed effects of charter schools and other school choice programs on short-term student achievement across diverse student populations (Walters, 2018), an important open question is whether participation in charter high schools translates into comparable gains in medium-term outcomes, such as high school graduation, across student groups with varying characteristics. These characteristics, including family demographics (race/ethnicity and socioeconomic status), student attributes (English language learners and students with disabilities), and other educational indicators (Orfield & Luce, 2016), have strong associations with high school graduation. Educators, policymakers, and practitioners have expressed concerns about ensuring fairness and equity in human capital outcomes, including high school graduation. Thus, our study sought to address these concerns by empirically examining the complexities of how charter school participation impacts the likelihood of high school graduation across different student subgroups. In the following sections we review the limited body of empirical studies on charter school graduation, which will help contextualize and guide our analysis of charter school attendance and high school graduation, particularly among diverse student subgroups.
Literature on Charter School Graduation Rates
The existing literature regarding the impact of charter schools on students’ medium-term outcomes, such as graduation rates, remains relatively limited. These studies have concentrated on specific geographic locations and produced mixed results. Booker et al. (2011) were among the earliest researchers to explore high school graduation rates linked to charter schools. Their findings revealed that students attending charter high schools in Chicago and Florida had a 7–15% higher likelihood of graduating than students who attended charter middle schools but later transitioned to traditional public high schools (Booker et al., 2011). Sass et al. (2016) replicated the study by Booker et al. (2011) with longitudinal data in Florida and confirmed that students attending charter high schools were more likely to graduate from high school than their counterparts in traditional public high schools.
Dobbie and Fryer (2011) used lottery-based designs and found positive effects on high school graduation and college attendance for children participating in Harlem Children’s Zone charter schools. In a subsequent study, Dobbie and Fryer (2020) examined open-enrollment charter high schools in Texas and found considerable heterogeneity by charter-type “No Excuses” charter schools (schools with higher behavioral expectations), regular charter schools, and all charter schools. They found that the No Excuses charter schools enhanced the education levels of students of color, especially African American and Hispanic students. These students had higher chances of graduating from high school or enrolling in a 2- or 4-year college than those who did not attend charter schools. However, regular charter schools increased high school graduation by only 1.2%, suggesting little positive impact on the average charter school in Texas.
Angrist et al. (2016) estimated the effects of attendance at six charter high schools in Boston using student-level data. They examined AP test and SAT scores, graduation rates, and college enrollment rates. The authors found that charter schools had no impact on the probability of high school graduation or college enrollment but a positive effect of shifting from 2-year colleges into 4-year colleges. However, Boston charter students took longer to graduate high school, likely due to the academic requirements of charter schools. In another study, Orfield and Luce (2016) analyzed data from the Illinois State Board of Education for the 2012–14 school years and found that Chicago’s charter schools had lower graduation rates and scored worse in several American College of Testing categories compared with TPS, even after adjusting for student characteristics. The two academic years significantly differed in the 4-year graduation rate coefficients between charter schools and TPS. Although there was some improvement in the 5-year graduation rate comparison for charter schools, the results remained negative and statistically significant. Furthermore, a growing body of evidence using individual-level data on all public school students in specific states, such as Georgia, Ohio, and Pennsylvania, suggests that virtual charter school students have substantially worse high school graduation rates (Ahn & McEachin 2017; Bueno, 2020; Cordes, 2024).
As such, we do not yet have holistic or consistent evidence regarding the effectiveness of charter schools. Although some studies have found that charter schools outperform TPS in terms of graduation rates, others have found no effect or negative results. There may be many reasons contributing to the heterogeneity of high school graduation rates in charter schools across studies, and some of these differences may be attributed to the different methodologies employed or different periods covered by various data sources. In addition, the wide variation in charter school laws among states, including regulations, requirements, and funding mechanisms, complicates the generalization of findings across different geographic areas. This study sought to contribute to the understanding of charter school effectiveness in increasing opportunities for students in the state of Utah.
Other Predictors of High School Graduation
Previous research illustrates that the variation in graduation rates by school type could be explained in part by systematic differences between charter schools and TPS in terms of school location, student demographics, and mobility of the student population. Since the 1970s, a constellation of factors has been linked to high school graduation rates (Rumberger, 1987, 2004), including student race/ethnicity, socioeconomic status, prior school achievement, and school location. Graduation rates were found to be lower for students from Hispanic and African American subgroups (Miller-Cribbs et al., 2002), large urban school districts, and low-income households. Moreover, students with disabilities tended to have lower graduation rates (Schifter, 2016).
Longitudinal studies indicated that students’ preparation for high school remains a crucial factor in determining graduation patterns (Perna & Kurban, 2013). A number of studies, for example, have found that high school performance is influenced by a student’s academic trajectory beginning as early as elementary school (Smerillo et al., 2018). Several studies have found that students who enter high school with higher elementary school test scores are more likely to succeed in high school than low-scoring students (Altonji et al., 2005). In addition to prior test scores, other educational experiences also predict high school graduation. Using longitudinal Chicago Public Schools attendance patterns, Smerillo et al. (2018) found that chronically absent students, defined as students missing ~14 days of school or more in a year, experienced reduced probabilities of completing high school. Adjusting demographic characteristics, studies have found that student mobility significantly reduces the likelihood of completing high school (Barrat et al., 2014; Rumberger & Larson, 1998; Rumberger & Lim, 2008).
Together these prior studies clarify that longitudinal analysis can illuminate how students’ graduation patterns differ based on specific demographic factors and school experiences. Understanding these predictive variables can lead to identifying factors that lead to high school graduation and those that detract from this outcome. Such results better represent students’ academic trajectories through high school and shed light on opportunities for effective intervention.
Despite all the existing work in this area, we still do not fully understand how much the variation across demographic characteristics and school factors might explain graduation differences by school type. For example, although student transfers, mobility, and chronic absenteeism are issues for any school, they may be particularly acute for charter schools. Prior studies have found that a key reason for the relatively mixed academic performance of the charter sector was the much higher student mobility rate (Bifulco & Ladd, 2006; Knight et al., 2022). A case in point, Zimmer and Guarino (2013) conducted a study using data from an anonymous major urban school district to investigate whether low-achieving students are more likely to exit charter schools compared with TPS, a phenomenon often referred to as the push-out critique (the opposite of graduation). Their descriptive results found no empirical evidence supporting the claim that charter schools push out or have higher dropout rates for low-achieving students than TPS. Overall, there is still a lack of comprehensive studies examining student transfers between TPS and charter schools and other factors influencing graduation rate disparities between these sectors.
This study attempted to address this gap in the literature by using statewide administrative data to compare the likelihood of completing high school among students who attended charter schools and those who attended TPS. Longitudinal data from multiple cohorts that cover a long-term time horizon (i.e., >10 years, including a year of COVID-19) enabled us to conduct a comprehensive analysis of charter school participation and high school graduation while considering relevant student- and school-related factors.
Data and Methods
Utah Charter Context
Utah charter schools were established in 1998 with the goal of offering parents and students additional school choices and allowing educators the freedom to experiment with innovative ways of educating and inspiring students (Ni & Rorrer, 2012; Ni et al., 2015). Utah charter schools must comply with all federal and state legislation and regulations and state board of education rules with a few exceptions. According to the Utah Administrative Code (53F-2-702), charter schools receive state and federal funds, as applicable, on the same basis as a school district receives funds, although they are not eligible for state-supported transportation funding. In addition, Utah is one of the few states that provides charter schools with access to state facilities funding (National School Boards Association, 2021). Although the state allows multiple authorizing entities including local school boards and boards of trustees for higher education institutions, 126 of the 137 charter schools in 2022 were authorized by the Utah State Charter School Board (2023). This board has made significant efforts to ensure that all charter school students have a guaranteed pathway to continue their education within the charter sector throughout their K–12 years. Geographically, charter schools are widely distributed across the state, with a presence in nearly every school district, except for one small rural district. Importantly, charter school students have the flexibility to choose between virtual charter schools and charter schools in neighboring districts because charter schools are not limited by designated catchment areas. These measures collectively provide students with the opportunity to remain within the charter sector for as long as they choose.
Charter school enrollment in Utah has increased consistently over the years. Of all the ninth graders in academic year 2011–12, 7.2% attended charter schools. In 2017–18, this number had increased to 10.2%. By 2022, 137 charter schools had been established in the state (Utah State Charter School Board, 2023), enrolling >77,000 students, or 11.5% of all Utah public school students, making Utah one of the states with the highest percentages of students enrolled in charter schools (National Center for Education Statistics, 2023a). In addition to the growth in charter school enrollment, Utah’s charter schools are becoming increasingly diverse, reflecting demographic shifts in the state and across many others. This raises critical equity concerns, particularly regarding educational outcomes, such as graduation rates, among students from diverse backgrounds.
Data
As stipulated in legislation, the Utah State Board of Education (USBE, 2022a) has maintained complete records of all K–12 students as they progress through Utah public schools. The information includes but is not limited to student annual enrollment; attendance; demographics; annual state standardized test scores in mathematics, English language arts (ELA), and science; and graduation status. Student data can be tracked across years through a unique identifier, which retains student anonymity, as long as students remain in the Utah public school system. Moreover, the student data can be linked to the information on the schools that students attend annually, including school type (TPS or charter school, online or not), urbanicity, and grade span.
Data for this study are available through a Master Data Sharing Agreement. 1 We use longitudinal student-level data from seven cohorts of high school students. We define high school years as between ninth and twelfth grades. Utah public schools (both TPS and charter schools) that include ninth to twelfth grades can have various structures, such as offering K–12 grades, 6–12 grades, 8–12 grades, 9–12 grades, or 10–12 grades. For the purposes of this study, the first cohort started ninth grade in the 2011–12 school year with an expected graduation in 2014–15. The last and most recent cohort started ninth grade in 2017–18 and had an expected graduation in 2020–21. Baseline information from students’ eighth grade year also was available. Therefore, the study period contains the school years from 2010–11 to 2020–21.
Variables
The main outcome variable is student graduation status, which uses USBE’s definitions. 2 For the purpose of this study, we divided students into three categories: (a) graduate, (b) nongraduate, and (c) excluded. The graduate group included those who had earned a basic high school diploma or an alternate diploma or an adult education high school diploma. Students who were in the nongraduate category included dropouts (i.e., dropped out, expelled/suspended, etc.), continuing students (i.e., graduation pending, transfer to higher education or University Clinical Aptitude Test, or retained senior), and other completers. Consistent with USBE’s definition and federal guidance on reporting graduation rates, individuals categorized as “other completers,” including those who aged out or obtained completion certification or GED, were considered nongraduates. Students who were identified as “excluded” include students who transferred out of or withdrew from the Utah public school systems during ninth to twelfth grades for various reasons, such as transferring to a private school or homeschool (therefore, their graduation status was unavailable in the dataset), withdrawing for medical reasons or death, or leaving as foreign exchange students. It is worth noting that when the 4-year graduation rate for a school is calculated, the denominator does not include students in the “excluded” category. Because these students were no longer in the USBE system, we were unable to track their academic progress and determine whether they eventually graduated from high school. Thus, including them in the denominator would distort the results.
The predictor variable of central interest was charter school participation, or whether a student attended a charter school for each year between the ninth and twelfth grades. To capture a nuanced charter school participation rate throughout the high school years, a vector of dichotomous variables was used: (a) whether a student consistently attended a charter school (charter stayers), (b) whether a student switched between charter school and TPS (switchers), and (c) whether a student consistently attended TPS (TPS stayers). This approach was more informative than using a single dichotomous variable that indicated whether a student attended a charter school at any point during high school because students often switched schools throughout their high school years. Some students started their ninth grade in a TPS but later transferred to a charter school or vice versa. It is also possible for students to make multiple transfers between charter school and TPS during their high school years. As shown in Table 1, among all students of the seven cohorts, ~4.6% of students attended only charter school(s), 8% attended both charter schools and TPS, and the remaining 87.4% attended only TPS. It should be noted that although switchers could make multiple transfers between charter schools and TPS, the impact of the directionality of a switch and the number of the switches were not further considered in this study due to the small samples in some of the categories.
Student and school characteristics of ninth graders in Utah by charter school attendance

TPS, traditional public schools; ELA, English language arts
Analysis of variance, Kruskal–Wallis, and post hoc multiple comparison tests were conducted, as appropriate, to assess the statistical significance of group differences.
This includes all students who were in the ninth grade during the academic years between 2011–12 and 2017–18.
Other variables included student demographic information (e.g., gender, race, and low-income status), English language learner (ELL) status, special education status, student mobility, chronic absenteeism, school transfer, and standardized test scores of ELA, math, and science. Student mobility referred to a situation where a student withdrew from one or more schools and then enrolled in a different school within the same academic year. A student was considered chronically absent when their school absences exceeded 10% of the total instructional time within an academic year regardless of cause (Utah Education Policy Center, 2012). Finally, student transfer measured whether and how many times students transferred school during ninth through twelfth grades irrespective of whether the transfers occurred between charter schools and TPS.
Description of Student and School Characteristics
Utah’s charter schools have seen growing diversity alongside the increase in enrollment. Although in the early years Utah charter schools served a more predominantly White and non-low-income student population than TPS (Ni & Rorrer, 2012), the student demographics have become more comparable among charter stayers, switchers, and TPS stayers, as shown in Table 1.
For all seven cohorts, the racial composition among the three groups of students was similar. Although some differences were statistically significant, they were not substantial in magnitude, with each difference being less than 2 percentage points. Charter stayers and switchers were slightly less likely to be identified as ELLs but more likely to be students with disabilities compared with TPS stayers. However, charter stayers and switchers were almost twice as likely to experience mobility (i.e., changing schools within a single school year) compared with TPS stayers. They also were more likely to encounter chronic absenteeism than TPS stayers. In addition, TPS stayers had significantly higher test scores than switchers across all three subjects and outperformed charter stayers in math and science; switchers had the lowest scores across all subjects. When considering school characteristics, it was observed that compared with TPS stayers, a higher proportion of charter stayers and switchers attended suburban schools, whereas a lower proportion attended in-town schools. Another notable observation was that ~12.7% and 6.3% of charter stayers and switchers attended online schools, whereas only 0.3% of TPS stayers enrolled in online schools.
Analytic Strategy
We used logistic models to evaluate the association between charter school participation and the likelihood of high school graduation. Specifically, we estimate the following model:

where Yij is the binary dependent variable for student i in school j, taking a value of 1 if a student graduated within 4 years and 0 if not.
To address our second research question regarding whether the relationship between charter school attendance and graduation likelihood varies across students with different characteristics, interaction terms between the charter school attendance variable and various demographic factors were incorporated into the models.
One challenge in estimating the effects of charter school attendance on graduation was selection bias. If there were systematic differences between students attending charter schools and TPS or unobserved factors influenced the decision to participate in a charter school, β1 might reflect the inherent differences between charter school and TPS students rather than the actual effects of attending charter schools on graduation. To address potential selection bias, we conducted three additional robustness checks. First, we restricted the sample to students who attended charter schools in eighth grade. Focusing on students from charter middle schools helped to control unmeasured student and family characteristics that led to the selection of charter high schools. Students who attended charter middle schools (even if some later transitioned to a TPS high school) were likely to have more comparable unobserved backgrounds than those attending TPS middle schools (Booker et al., 2011).
Second, to identify stronger comparison groups, we used propensity score matching (PSM) to create a matched sample of three groups of eighth grade charter school students with similar baseline characteristics, including student characteristics (i.e., gender, race, socioeconomic status, ELL status, special education status, test scores, mobility, and chronic absenteeism) and school characteristics (i.e., demographics and urbanicity) (Ho et al., 2007, 2011). We first matched charter stayers and TPS stayers using one-to-one nearest-neighbor matching without replacement, estimating propensity scores with logistic regression based on these characteristics. We then matched TPS stayers with switchers using the same method. Finally, we retained charter stayers and switchers who had a common match with TPS stayers, resulting in three groups with similar baseline characteristics. It is important to note that the number of matched groups was smaller in the three-way match because not all TPS stayers could be matched with both a charter stayer and a switcher. The baseline student and school characteristics for the three-way matched groups are shown in Appendix A.
Third, a potential source of selection bias arises from structural moves. Students attending charter schools that extended beyond eighth grade were less likely to switch schools because they could continue at the same school. In contrast, students in charter schools where the eighth grade was the highest grade offered had to transition to a new school, either a TPS or another charter school. To address this, we further restricted the sample to students in charter schools where eighth grade was the highest grade, ensuring that all students faced the same school transition. We then applied the same PSM procedure to generate matched samples for charter stayers, TPS stayers, and switchers with the baseline student and school characteristics shown in Appendix A.
It should be noted that although the analysis of eighth grade charter school attendees and matched samples using PSM strengthened the internal validity of our findings, caution is warranted in generalizing the results because eighth grade charter school attendees do not fully represent all public high school students in Utah (Booker et al., 2011; Sass et al., 2016).
Results
Charter School Attendance and Graduation: Variations and Trends
Table 2 shows the 4-year graduation rates, grouped by cohort and students’ charter school attendance status. As mentioned earlier, when calculating the graduation rate, students in the “excluded” category were not included in the denominator to align our calculations with federal guidelines for calculating graduation rates. Column (4) shows that the 4-year graduation rate has been increasing steadily for all cohorts, with the cohort that started ninth grade 2017–18 having the highest average graduation rate of all cohorts. This is consistent with the results reported by USBE (2022b).
Four-year graduation rates by charter attendance and by cohort

TPS, traditional public schools
Note. Students in the “excluded” category are not included in the calculation of graduation rate. Charter stayers are those who consistently attended charter schools between ninth and twelfth grades; TPS stayers are students who consistently attended TPS; and switchers at least made one transfer between TPS and charter schools between ninth and twelfth grades.
Graduation rates were compared among three groups of students: TPS stayers (those who consistently attended TPS throughout their high school years), charter stayers (those who consistently attended charter schools throughout their high school years), and switchers (those who made at least one transfer between TPS and charter schools throughout their high school years). TPS stayers had the highest graduation rate (87.7%) versus charter stayers (82.1%) and switchers (81.3%). However, it is worth noting that the gaps in graduation rates among the three groups have been shrinking over the years. For example, the difference between TPS stayers and charter stayers had decreased from 11.4% in the 2011–12 cohort to 5.0% in the 2016–17 cohort and further declined to just 1.6% in the 2017–18 cohort. The rate graduation of the 2017–18 cohort is noteworthy because they experienced part of their junior year (2019–20) and their entire senior year (2020–21) during the COVID-19 pandemic. Interestingly, although charter schools increased in average graduation rate between the 2016–17 cohort and the 2017–18 cohort, TPS experienced a decline for the first time in 7 years. However, we caution the interpretation and use of this particular result because there are still many unknown factors surrounding student completion during the pandemic period.
Charter School Attendance and the Likelihood of Graduation
We ran a sequence of logistic regressions to explore how charter school attendance and student characteristics account for the likelihood of high school graduation. As shown in Table 3, Model 1 only considered the variables indicating charter school attendance during high school years and eighth grade school fixed effects. Model 2 added a set of cohort dummies to account for the trends in graduation rates over time. Model 3 incorporated student racial background, and Model 4 took into consideration the full set of student characteristics, including eighth grade student demographic information, test scores, mobility, and chronic absenteeism, and the number of transfers between ninth and twelfth grades.
Charter school attendance and the likelihood of graduation: logistic regression results
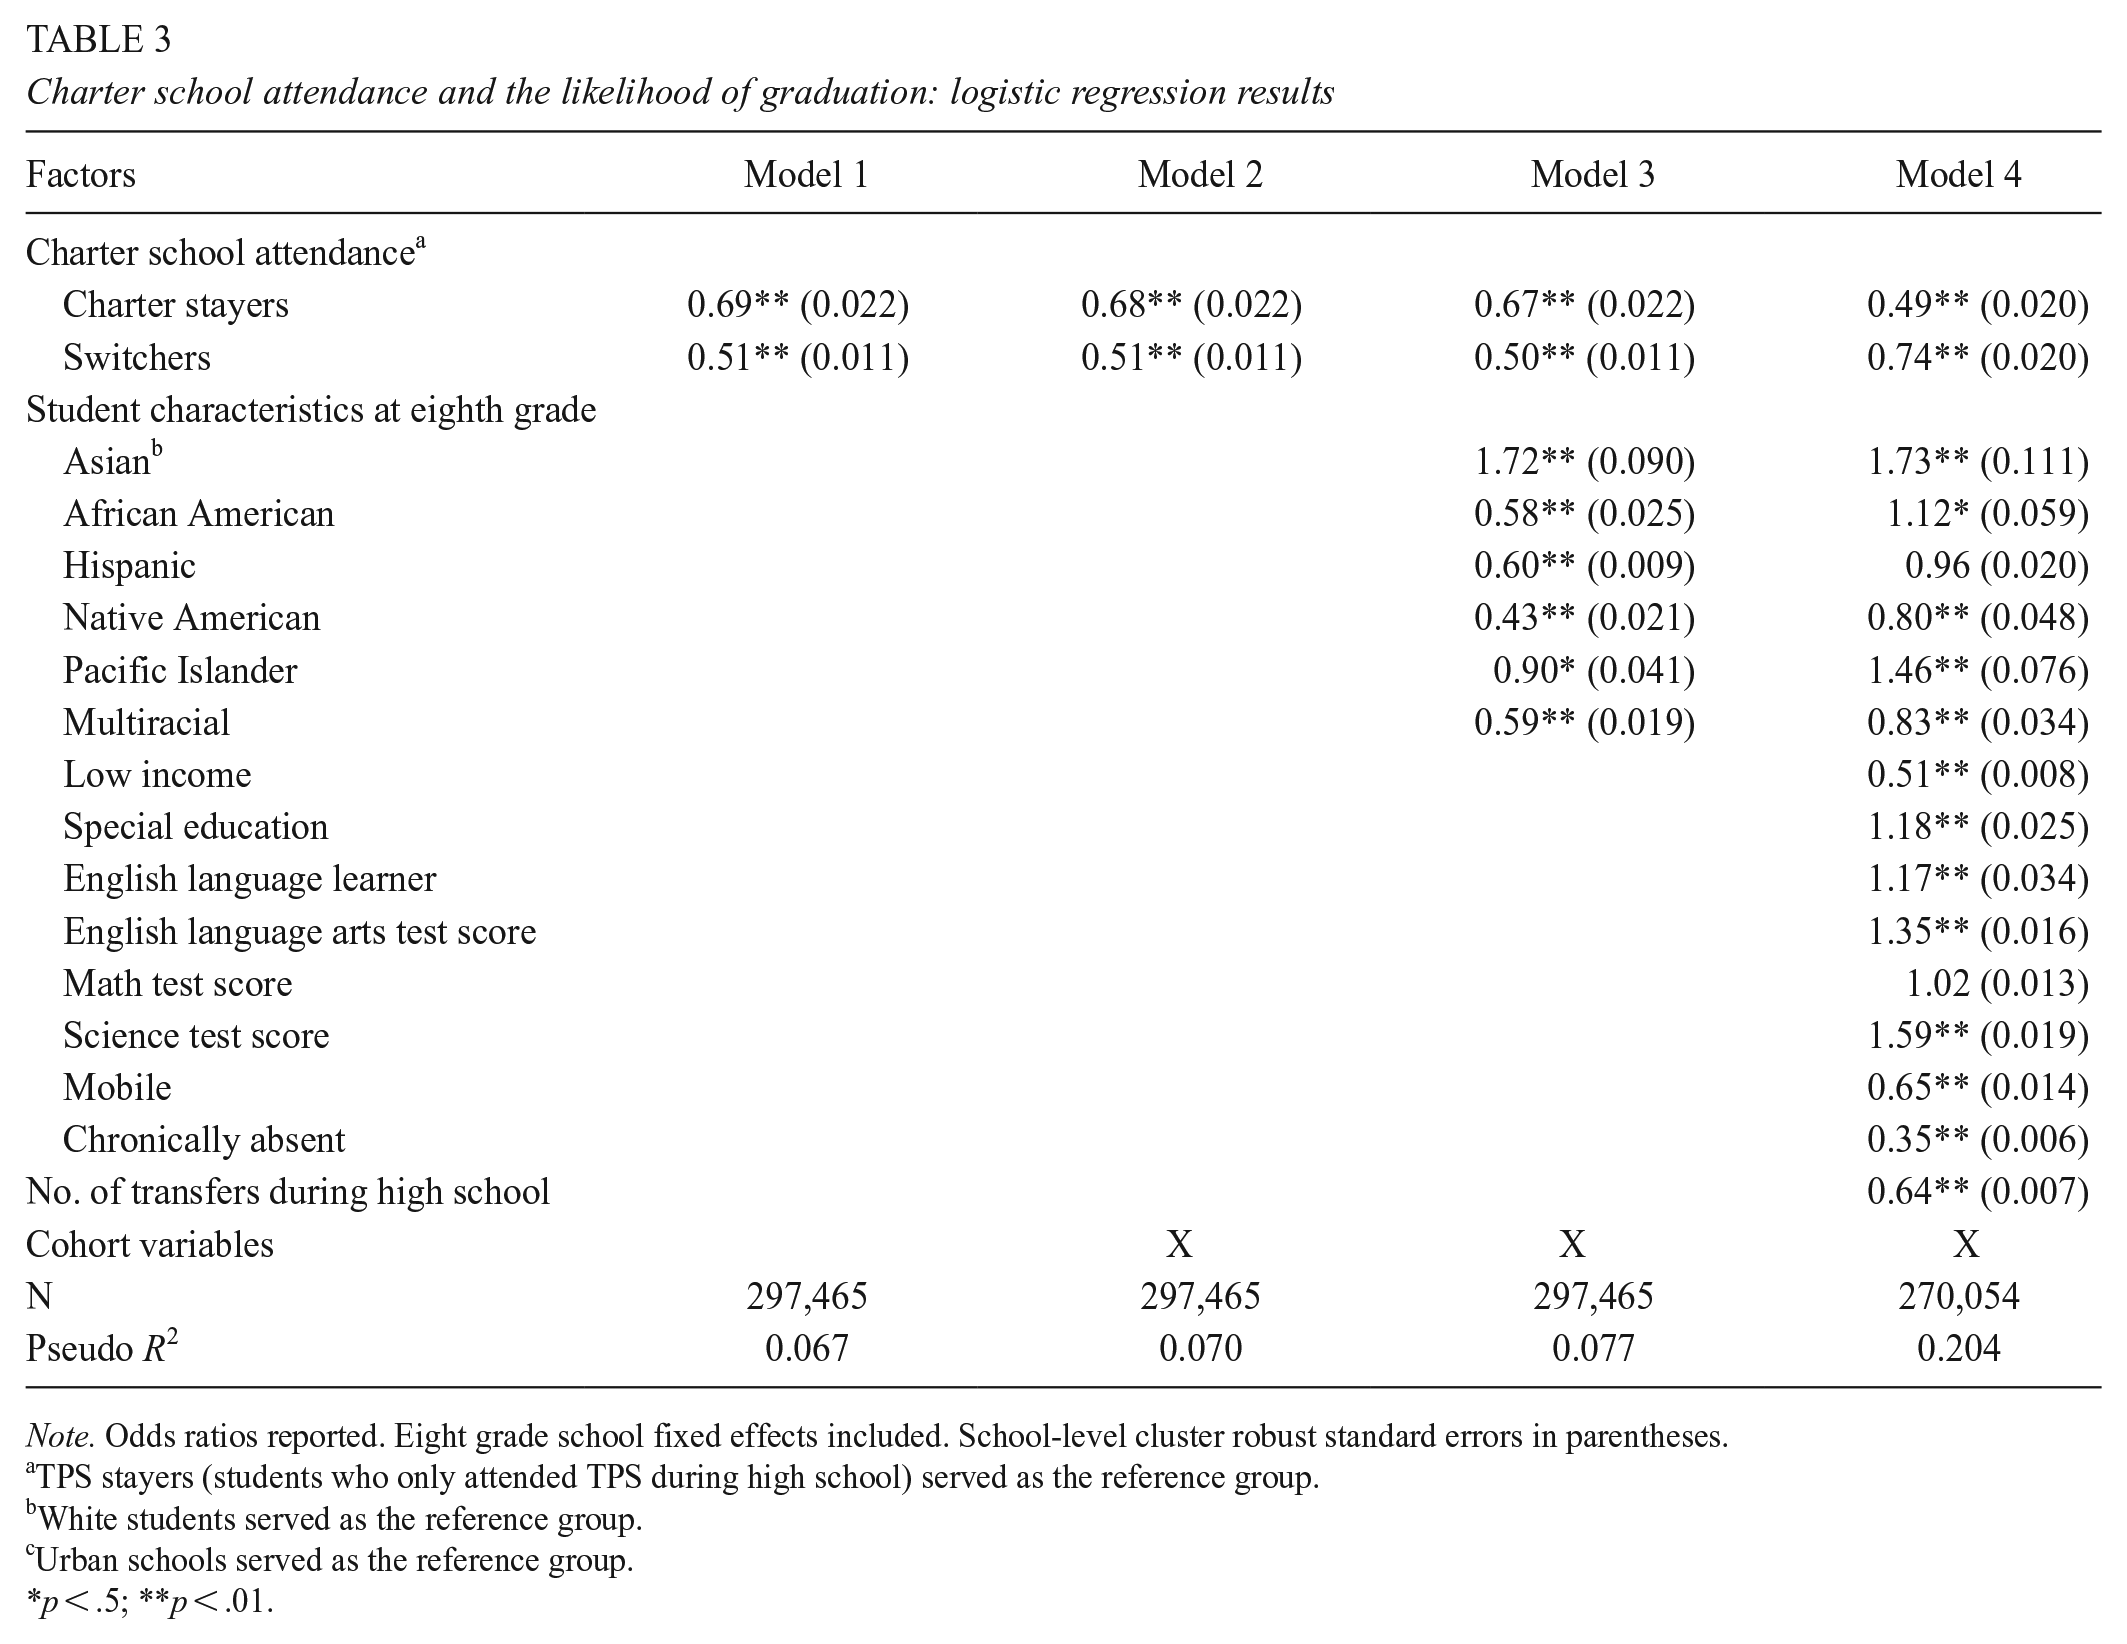
Note. Odds ratios reported. Eight grade school fixed effects included. School-level cluster robust standard errors in parentheses.
TPS stayers (students who only attended TPS during high school) served as the reference group.
White students served as the reference group.
Urban schools served as the reference group.
p < .5; **p < .01.
Charter School Attendance and the Likelihood of Graduation
As Model 1 shows, both charter stayers and switchers had significantly lower odds of graduation (odds ratios [OR] = 0.69 and 0.51; p < .01) compared with TPS stayers, which served as the reference group. Controlling for the cohort variables in Model 2 essentially produced no changes in the likelihood of graduation of different charter school attendance groups. Although not reported in the table, the OR for the cohort variables indicated a consistent upward trend in graduation for all students in recent years.
After considering student characteristics in Models 3 and 4, the OR of graduation remained low for charter stayers (OR = 0.49; p < 0.01, Model 4) in comparison with TPS stayers. However, the OR for switchers increased (OR = 0.74; p < .01; Model 4), suggesting that the gap had narrowed between switchers and TPS stayers. This is because switchers tended to experience more school transfers than students who consistently attended TPS or charter schools. Because the number of transfers was negatively related to the odds of graduation (OR = 0.64; p < .01; Model 4), after controlling for this variable, the odds of graduation for switchers increased.
Student Characteristics and the Likelihood of Graduation
In Model 3, accounting for racial background variables revealed significant disparities in graduation likelihood among student groups. Students who were Hispanic, African American, Pacific Islander, Native American, and multiracial all exhibited significantly lower odds of graduation than White students (the reference group). Asian students were the only racial group that displayed higher odds of graduation in comparison with White students (OR = 1.72; p < .01). In Model 4, when other student characteristics and prior test scores were considered, the adverse associations between racial background variables and graduation were either mitigated (for Hispanic, Native American, and multiracial students) or reversed (for African American and Pacific Islander students). This may indicate that students of color were more likely to encounter systemic barriers and academic challenges. Supporting this, descriptive analyses indicated that they were disproportionately classified as ELL, requiring special education, and more frequently experienced chronic absenteeism, school mobility, and lower test scores (results not shown). As demonstrated in Model 4, these factors were associated with lower graduation odds, and controlling for them resulted in higher graduation likelihoods for several student groups of color compared with Model 3.
Charter School Attendance and the Probability of Graduation Across Student Subgroups
Next, we conducted additional analyses to examine whether charter school attendance reduced graduation gaps between student subgroups. As shown in Model 4 of Table 3, after controlling for other student characteristics, Native American students, multiracial students, students from low-income backgrounds, and those who experienced mobility or chronic absenteeism in eighth grade had significantly lower odds of graduation than their peers outside these categories. To investigate this further, we included interaction terms between these variables and charter attendance in our full models, with results displayed in Appendix B and Figure 1 comparing predicted graduation probabilities for these student groups by charter school attendance. Figure 1 also presents corresponding 95% confidence intervals, a measure of the precision of the predicted probabilities, indicating the plausible variability around the estimated graduation rates for each student group. Even though Figure 1 includes patterns pertaining to switchers, in the interest of clarity and to avoid information overload, our interpretation of the figure centers exclusively on comparing the differences between charter stayers and TPS stayers.

Predicted probability of graduation with 95% confidence interval, by charter attendance and student subgroups.
In general, for students who shared the same demographic characteristics, TPS stayers consistently had either higher or at least comparable predicted probabilities of graduation compared with charter stayers. For example, as Figure 1A shows, for all students who were from low-income family backgrounds, TPS stayers, on average, had higher predicted probabilities of graduation than charter stayers. This pattern held true for all students who were from non-low-income backgrounds as well, although the difference between TPS stayers and charter stayers was more pronounced.
Next, we examine our analysis results presented in Figure 1 from a different perspective, shifting the focus from examining students sharing similar characteristics (e.g., all students who were identified as low income) to a comparison between the two student subgroups along the same variable (e.g., comparing students who were identified as low income versus students who were not identified as low income). Within the charter-stayers student group, although there is a difference in estimated probabilities of graduation between students who were from low-income families (82.1%) and non-low-income families (84.0%), it was statistically insignificant. The statistical insignificance is also indicated by the overlapping 95% confidence intervals, as shown in Figure 1A. However, among TPS stayers, a statistically significant gap of 5.7% exists between the two groups, with graduation probabilities at 86.9% for students from low-income families and 92.7% for those from non-low-income families, respectively.
Similar patterns were observed when comparing multiracial and non-multiracial students (Figure 1B) and Native American and non–Native American students (Figure 1C). Among TPS stayers, multiracial students had significantly lower predicted probabilities of graduation than non-multiracial students, whereas no significant differences were found between the two groups among charter stayers. Similarly, among TPS stayers, Native American students faced lower graduation probabilities than their non–Native American peers. Interestingly, this pattern reversed among charter stayers, where Native American students had significantly higher predicted probabilities of graduation.
Finally, Figures 1D and 1E show significant and substantial differences in predicted graduation probabilities between students who were chronically absent and those who were not chronically absent as well as between students who were mobile and those who were not mobile. These differences align with established research emphasizing the crucial role of school engagement, participation, and attendance in shaping graduation outcomes (Rumberger, 2015; Rumberger & Larson, 1998). Notably, the predicted graduation gap between mobile and nonmobile students was smaller among charter stayers than among TPS stayers. However, the gap between chronically absent and non–chronically absent students was similar in both groups.
Analysis of Eighth Grade Charter School Attendees
In addition to the main analysis involving the full sample of students, we conducted the same analysis on a subset of students who attended charter schools in eighth grade, the year before high school. This analysis included only 27,700 students, which accounted for ~8.7% of the entire sample. During the high school years of eighth grade charter school attendees, 34% were charter stayers, 27% were TPS stayers, and the remaining 40% were switchers. Please note that the proportion of switchers was significantly higher among eighth grade charter school attenders compared with the full sample, where only 8% constituted switchers. This suggests that a larger percentage of eighth grade charter school attendees switched back and forth between charter schools and TPS during their high school years. Although this study did not delve into the underlying reasons for this, it may suggest that families choosing charter schools for middle school education remain proactive and are more likely to continue seeking alternatives in high school. Regardless, it is important to exercise caution when comparing the outcomes of switchers in the subsample with the outcomes of those in the full sample.
Table 4 describes how graduation rates differed by charter school attendance among eighth grade charter school attendees. The graduation patterns observed among charter stayers and TPS stayers very closely resembled those reported in Table 2, calculated based on the entire sample. Charter stayers had lower graduation rates than their TPS counterparts in the early years, but the difference narrowed over time. In analyzing graduation gaps for the most recent cohort of 2017–18, charter stayers actually had slightly higher graduation rates than their TPS counterparts. Additionally, the most notable differences between Tables 2 and 4 were related to improved graduation rates for switchers. Although switchers experienced the lowest graduation rates in the main analysis with the full sample, the results within this subset of eighth grade charter school attendees showed higher student graduation rates among switchers than among TPS stayers. As mentioned earlier, it is important to note that the switchers in this subset constituted a distinct group from those in the full sample given that they initially enrolled in charter schools in eighth grade. Future research is needed to explore whether the directionality of switches and the frequency of switches can explain the graduation differences between the subsample and the full sample.
Graduation rates by high school charter school attendance, subsample of eighth grade charter school attendees

TPS, traditional public schools
Note. Students in the “excluded” category are not included in the calculation of graduation rate. Charter stayers are those who consistently attended charter schools between ninth and twelfth grades; TPS stayers are students who consistently attended TPS; and switchers at least made one transfer between TPS and charter schools between ninth and twelfth grades.
Table 5 presents the logistic regression results on the restricted sample of eighth grade charter school attendees. Models 1 and 2 demonstrated that attending either charter high schools or TPS had no significant association on graduation probabilities without the control variables in place. Even after accounting for racial/ethnic characteristics in Model 3, the results remained largely unchanged. Nevertheless, in Model 4, when all student control variables were considered, charter stayers exhibited a significantly lower estimated graduation probability than TPS stayers (OR = 0.58; p < .01). However, no significant difference in graduation probabilities was observed between TPS stayers and switchers.
Charter school attendance and the likelihood of graduation, eighth grade charter school attendees

Note. Sample only includes students who attended charter schools in their eighth grade.
TPS stayers (students who only attended traditional public schools [TPS] during high school) served as the reference group.
p < .05.
Table 6 presents the results of additional analyses using PSM-matched samples. Models 1 to 3 focused on matched samples of all eighth grade charter school attendees: TPS stayers versus charter stayers (Model 1), TPS stayers versus switchers (Model 2), and all three groups (Model 3). The sample sizes varied across models, with the three-group match having the smallest number of matched groups, representing only half of all eighth grade charter school attendees. Each model included the full set of student covariates. The results indicate that charter stayers consistently had a lower estimated odds of graduation than TPS stayers (e.g., OR = 0.60; p < .01; Model 3), whereas no significant differences were observed between TPS stayers and switchers. Models 4–6 were estimated using matched samples of eighth grade students who attended charter schools where eighth grade was the highest grade offered. This restriction further reduced the sample sizes, with the three-group match including only roughly one third of all eighth grade charter school attendees. Both Model 4 and Model 6 indicated that charter stayers had lower estimated odds of graduation than TPS stayers. Models 5 and 6 showed that switchers had lower estimated odds of graduation than TPS stayers, although the differences between the two groups were less pronounced than those between charter stayers and TPS stayers and not statistically significant in Model 6.
Charter school attendance and the likelihood of graduation using propensity score matching, eighth grade charter school attendees.

TPS, traditional public schools
Note. All models include the full set of control variables.
TPS stayers (students who only attended TPS during high school) served as the reference group.
p < .5; **p < .01.
Discussion and Implications
High school graduation is a significant milestone that impacts students’ future opportunities. High school graduation rates are often used as a key indicator of school success and accountability in most states. Charter schools are often established with the goal of providing alternative educational options, particularly for underserved communities and students. Our study focused on Utah and addressed a critical gap in the literature: the limited research on the long-term outcomes of charter schools. With one of the nation’s highest charter school enrollments, Utah has experienced substantial demographic shifts over the past several decades, leading to a more diverse student population and highlighting critical equity concerns in educational outcomes. By using student-level longitudinal data for seven cohorts of Utah public high school students who started ninth grade between 2011–12 and 2017–18, this study is the first to examine graduation outcomes in Utah’s charter schools. We believe that our findings have significance not only for Utah but also for shaping policy and practice in other states with similar charter school systems, particularly those undergoing demographic changes or experiencing high levels of charter school enrollment.
We conducted analyses on the full sample of students and a subset of students who attended charter schools in eighth grade and further restricted samples through PSM. Our analysis revealed several important patterns. First, the descriptive analysis suggested that the 4-year graduation rates steadily increased every year during the study period. Notably, charter schools demonstrated a more rapid pace of improvement in graduation rates compared with TPS. In other words, although students who attended charter schools, on average, had lower graduation rates than their TPS counterparts, the gap narrowed over the years. Although these findings inform the viability of charter high schools in the state to support student educational progression, conducting a similar analysis with cohorts beyond 2021 will be important. In particular, the influence of the COVID-19 pandemic on high school completion and graduation is yet unknown. Future studies replicating this design and consideration of more recent cohorts would enable us to examine whether the gap between charter schools and TPS continues to narrow as well as to assess the potential impact of the COVID-19 pandemic on secondary and postsecondary opportunities for students.
Second, our statistical analysis revealed an advantage in the likelihood of graduation for TPS stayers over charter stayers and switchers. These findings remained consistent across all statistical analyses using data for seven cohorts (from 2011–12 to 2017–18) with and without the control variables. When we narrowed our sample to eighth grade charter school attendees and further refined it with matched samples through PSM, our models consistently demonstrated that TPS stayers exhibited a higher likelihood of graduation than charter stayers after accounting for other variables. Although most of our models showed no significant difference in graduation probabilities between TPS stayers and switchers among eighth grade charter school attendees, it is important to note that switchers in this subsample differed from those in the full sample. In the eighth grade sample, all switchers initially enrolled in charter schools, so their subsequent transitions likely reflect moves from charter schools to TPS. This contrasts with the full sample, where switchers included students moving in either direction—making the nature of their transitions more heterogeneous. Future research could explore potential differences in transfer patterns and reasons among switchers, including those who previously attended charter middle schools. Additionally, future research could delve into whether transferring within TPS, within charter schools, and between TPS and charter schools have differing effects on the likelihood of graduation.
Third, some nuanced patterns in graduation rate gaps emerged when we further examined the relationship between charter school participation and graduation by the identified student groups. In the analysis involving interaction terms between the attendance variable and various demographic factors, TPS stayers consistently displayed higher or similar predicted probabilities of graduation compared with charter stayers among students with similar demographic backgrounds. However, when examining the differences in graduation probabilities between student groups along the same variable, the disparities among charter stayers were smaller (e.g., low income and mobile), negligible (e.g., multiracial), or even reversed (e.g., Native American) compared with the disparities observed among TPS stayers. Thus, it is worth noting that although there are smaller gaps in graduation rates among student subgroups in charter schools, which might suggest more equality in the probability of graduation, the overall probability of graduation is lower for students within charter schools.
In summary, our findings indicate that students who attended charter high schools experienced lower probabilities of graduating than their TPS counterparts, although this gap has been narrowing over time. On the whole, our results align with those of some previous studies (Orfield & Luce, 2016) but contradict others (Booker et al., 2011; Sass et al., 2016). These findings suggest that charter schools do not consistently improve graduation rates, indicating that a market-driven approach to education through school choice systems is unlikely to serve as a universal solution for educational improvement. Moreover, the evidence is inconclusive regarding whether charter school participation promotes equity among students with diverse backgrounds. Although the disparities in graduation rates between student subgroups along the same variables tended to be smaller for charter stayers, they still exhibited lower graduation rates than TPS stayers for each student group. Again, further research will be instrumental in drawing more definitive conclusions regarding equity.
Based on our findings, we recommend that future research explore charter school practices to understand the graduation disparity between students attending TPS and those attending charter schools, focusing on the specific practices or resources within charter schools that may influence students’ likelihood of completing high school. For example, more work is needed to expand on Zimmer and Guarino’s (2013) study that investigated the push-out critique of charter schools (the opposite of graduation). Although they found no empirical evidence that charter schools have higher dropout rates for low-achieving students than TPS, they noted that students transferring out of charter schools generally had slightly lower achievement levels than their TPS counterparts. A more extensive empirical analysis that builds on their findings could provide a clearer understanding of the lower graduation rates observed in charter schools.
Additionally, although our findings on whether charter schools promote equity may not be conclusive, future research could continue to examine how the experiences of students vary in charter schools and TPS as well as across student groups, with the goal of identifying best practices that may address different needs of student groups. This suggestion would include in-depth qualitative research to identify policies, programs, and practices that have contributed to narrowing graduation gaps for student groups and between TPS and charter schools (Angrist et al., 2013; Fryer, 2014).
Lastly, it is difficult to find a high school—whether charter or TPS—that does not prioritize increasing high school completion rates, enhancing graduation outcomes, and addressing disparities across student subgroups. Although this study focused on comparing graduation outcomes between students attending charter schools and TPS, future research is needed to examine whether competition from charter schools motivates TPS to improve graduation rates and address disparities among student subgroups. Together these two lines of research would provide a more comprehensive understanding of the impact of charter schools. Such insights would be invaluable for policymakers and educators, helping to develop strategies that leverage competition as a mechanism for system-wide improvement, ensuring that all schools—not just charter schools—prioritize equitable and effective pathways to graduation for all students.
Footnotes
Appendix
Charter Attendance and the Likelihood of Graduation, Logistic Models with Interaction Terms

| Factor | Model 1 | Model 2 | Model 3 | Model 4 | Model 5 |
|---|---|---|---|---|---|
| Charter attendance a | |||||
| Charter stayers | 0.36**
(0.018) |
0.48**
(0.019) |
0.48**
(0.020) |
0.45**
(0.019) |
0.42**
(0.018) |
| Switchers | 0.58**
(0.021) |
0.73**
(0.019) |
0.73**
(0.020) |
0.69**
(0.020) |
0.64**
(0.018) |
| Low income | 0.47**
(0.008) |
||||
| Charter stayer × low income | 1.80**
|
||||
| Switcher × low income | 1.53**
|
||||
| Native American | 0.74**
|
||||
| Charter stayer × Native American | 2.43**
|
||||
| Switcher × Native American | 2.07**
|
||||
| Multiracial | 0.79**
|
||||
| Charter stayer × multiracial | 1.12 |
||||
| Switcher × multiracial | 1.36*
|
||||
| Chronically absent | 0.33**
|
||||
| Charter stayer × chronically absent | 1.44**
|
||||
| Switcher × chronically absent | 1.34**
|
||||
| Mobile | 0.49**
|
||||
| Charter stayer × mobile | 1.53**
|
||||
| Switcher × mobile | 1.62**
|
||||
| Student covariates | X | X | X | X | X |
| N | 270,054 | 270,054 | 270,054 | 270,054 | 270,326 |
| Pseudo R2 | 0.203 | 0.204 | 0.205 | 0.204 | 0.187 |
TPS stayers (students who only attended traditional public schools [TPS] during high school) served as the reference group.
p < .05; **p < .01.
Funding
This research project was funded in part by the Utah Leading through Effective, Actionable, and Dynamic (ULEAD) Education Project.
Note: This manuscript was accepted under the editorship of Dr. Kara Finnigan.
Notes
Authors
YONGMEI NI is a professor of educational leadership and policy at the University of Utah and an assistant director at the Utah Education Policy Center. Her scholarship focuses on (a) the importance of school leadership and how leadership preparation programs prepare transformative leaders to make a difference in schools and (b) evaluation of different education policies, including charter school policies.
CHARISSE GULOSINO received a doctorate in education from Columbia University and is currently a professor in the Leadership and Policy Studies Program at the University of Memphis. Her research focuses on the evaluation of educational policies and programs with a specific interest in school choice that enhances education access, equity, efficiency, and results-based accountability.
T. WILLIAM ALTERMATT is a data scientist at the Utah Education Policy Center at the University of Utah. He is interested in the use of multilevel modeling and especially growth curve analysis to better understand longitudinal educational data.
ANDREA K. RORRER is a professor in the Department of Educational Leadership and Policy and director of the Utah Education Policy Center at the University of Utah. Her research focuses on leadership preparation and practice, system change, school improvement, and educational policy, emphasizing systems approaches to build capacity and conditions for equity and excellence.