
Abstract
Online political campaigning takes place on several platforms, suggesting the need for those seeking voter support—such as political parties—to adapt to the characteristics of each platform. Getting voters to take action—be it online (such as asking them to engage with posts) or offline (such as asking them to attend rallies or to vote)—is a key element of campaigning efforts. Here, we focus on the use of what is referred to as calls to action as employed by Norwegian political parties on three different social media platforms (Facebook, Instagram, and Twitter) between 2013 and 2024. Using a combination of automated and manual content analysis, the results indicate that while Facebook is the preferred platform for providing calls to action during roughly the first half of our time period, Instagram takes the lead in this regard for the latter half. Overall, though, we see a clear decrease of calls to action across all three platforms, indicating the changing priorities of parties. Using likes as a common measurement of engagement across all three studied platforms, posts containing calls to action emerged as less popular towards the end of the time period for Facebook and Twitter, while users of Instagram appear to be more interested in engaging with such posts also during these latter stages. The study ends with a discussion of the main findings, also suggesting some ways forward for future research efforts.
Introduction
Gibson and co-authors (2008) point out that “technology is often viewed as a key driver of change in the electoral arena” (2008, p. 15). Such a driver, then, makes it necessary for parties and individual politicians to master the minutiae of different communication channels, ranging from “top-down media such as television” (Freelon, 2017, p. 2) to comparably novel modes of rallying electoral support by means of a seemingly never-ending array of online services such as social media platforms. Already in 2007, Druckman and co-authors suggested that “it has become virtually mandatory for candidates to have a campaign web site” (2007, p. 426), and while web sites might not be the campaigning tool du jour, the same necessity can be coupled with social media such as Facebook, Instagram, and Twitter. Specifically, in what is often described as the current and fourth age (Bennett & Pfetsch, 2018; Blumler, 2016; Sorensen, 2023), era (Klinger et al., 2022; Roemmele & Gibson, 2020), or indeed phase (Gibson, 2023; Magin et al., 2017) of political communication, it has become more important to target the social communication undertaken by potential supporters (Bene, 2021a). In processes reminiscent of the two-step flow model of communication (Lazarsfeld et al., 2021), parties on the campaign trail must not only succeed in winning over individual voters—they should do so in a way that encourages each such voter to take further action, making their “support visible to their family, friends, and acquaintances” (Eberl et al., 2020, p. 48) online as well as offline.
While digital politicking must be seen as a key feature within our current paradigm of political communication research, we must take into account the variations that occur within this current situation. Indeed, social media platforms are largely bound to come and go (Gagrčin & Butkowski, 2023), exposing “dead or dying platforms” (Matassi & Boczkowski, 2023, p. 106) among relative newcomers and older, established platforms. Relatedly, platforms are likely to change and amend their functionalities as competition between them increases (e.g., Helmond et al., 2019; Kreiss et al., 2017). Thus, as platforms change or even fade away, studying the degree to which parties urge voters to take action on different platforms and over time becomes important in order to understand how campaigning priorities change. A similar necessity can be identified from the voter side—to what degrees are voters engaging with the social media offerings of parties—and how does this engagement behavior change over time? With studies from over ten years ago (e.g., Bekafigo & McBride, 2013; Hargittai, 2015) as well as more recent offerings (e.g., Bolin et al., 2024; Geise et al., 2024; Haßler et al., 2024; Russmann et al., 2024) pointing to the need for platform comparison in scholarly efforts, the study presented here details the use of what is referred to as calls to action by political parties. In combination with studying party use, we also investigate the degree to which potential voters engage with posts containing—and not containing—such calls across Facebook, Instagram, and Twitter.
Besides answering the call for comparative efforts, the work presented here also takes into account that “[t]he role of history in the nascent scholarship on social media has been decidedly relegated in favor of a present-day focus” (Matassi & Boczkowski, 2023, p. 90) and features a longitudinal design (as suggested by, e.g., Klinger et al., 2022; Koc-Michalska et al., 2023), allowing for the assessment of over-time changes and developments in the aforementioned fourth digital age of political communication. Specifically, the study at hand features novel approaches to content analysis using large language models (LLMs) and studies the use of calls to action across the three mentioned platforms as used by Norwegian parties and their potential voters between 2013 and 2024. The following two research questions serve as our starting point. RQ1: To what extent did parties use calls to action across platforms and years? RQ2: To what extent were posts containing or not containing calls to action engaged with across platforms and years?
Beyond the necessity to detail developments like these in non-US contexts (e.g., Bolin et al., 2024; Jungherr, 2016), Norway was chosen as a suitable case given high levels of Internet and social media use among the populace (Schiro, 2022) and high voting attendance (Aardal & Bergh, 2018).
Approaching digital political communication efforts with both the provision of calls to action—as well as the engagement levels reached by such calls—in mind (e.g., Baltz, 2023; Porten-Cheé et al., 2018), the next section reviews previous, similar research efforts and presents a series of hypotheses focused on the Norwegian context.
Literature Review
The Importance of Calls to Action
While the precise nature of the process through which certain content provided to social media platforms becomes popular, spreads, and reaches virality remains shrouded in more or less opaque algorithmic prioritizations (Bode & Epstein, 2015), we can nevertheless be certain that beyond the weighting prioritizations utilized by platform operators (Schwartz et al., 2022; Tønnesen et al., 2023; Zubrow, 2021), user input plays an important role in boosting content visibility (Klinger & Svensson, 2015; Van Dijck & Poell, 2013). Indeed, Zhang and co-authors (2017) refer to the results of audience engagement by means of liking, sharing, commenting, and so on as amplification, defined as “how the activities of social media–based publics may enlarge the attention paid to a given person or message” (2017, p. 3161). Beyond reaching users already following a specific social media account, acts of amplification can also make the content interacted with reach the friends or followers of each such individual user who acted accordingly. Thus, we can think of online content exposure as taking place “proactively or incidentally” (Heidenreich et al., 2022, p. 6) as users are reached directly (by following a politician) or indirectly (by being friends with someone following and engaging with a politician on social media) by content such as posts made by political actors (Bene, 2021b). The previously mentioned similarity to the two-step flow model of communication has indeed been noted by other scholars (Bene, 2021a; Bene et al., 2022), further supporting the role of individual voters and their respective communication activities on platforms such as those studied here in the political communication process (Blumler, 2016).
Given this importance of audience engagement, political actors frequently ask their followers to take action. Focusing especially on Facebook, Larsson (2021b) queried the degree to which Norwegian political actors asked their followers to take action online by liking, sharing, or commenting on their posts by means of searching post content for various imperative forms of verbs related to varieties of calls to action—“like this post,” “share if you agree,” and so on. The longitudinal design allowed for insights into over-time development towards online quizzes and games rather than efforts to get supporters to take part in deliberation and discussion—developments akin to a gamification of politics. For our current efforts, we take a broader approach that seeks to accommodate both our platform comparisons as well as the fact that calls to action can have different desired results—for instance, they may refer to actions to be taken on one of the three platforms investigated here, in other online spaces or indeed in offline settings. Online engagement is important—but so are the offline activities of citizens, such as attending political meetings or events, watching televised debates, or, indeed, casting your vote on election day. For our current efforts, we follow the example of previous research efforts (e.g., Heiss et al., 2018; Koc-Michalska et al., 2020; Larsson et al., 2024) and choose a broad definition of call to action as posts which “features explicit encouragements, often in imperative form, prompting the recipient to act” (Larsson et al., 2024, p. 4), thereby including off- as well as online activities.
Likes as a Metric of Success
Users can engage with social media posts in several and seemingly ever-expanding ways. Furthermore, such different opportunities for engagement vary across platforms and time. Indeed, “different social media platforms support different types of interactions” (Gruzd & Wellman, 2014, p. 1253), making it necessary to focus multi-platform studies such as the one at hand on “comparable types of engagement” (Davidson & Enos, 2024, p. 8) that could be argued to have “functional equivalence” (Heft et al., 2023, p. 9) across platforms. With these perspectives in mind, we use likes as our metric of post engagement. Common to all three platforms, likes have been described as “lightweight acts of communication” (Hayes et al., 2016, p. 172) and have been shown to be more frequently used than other varieties (e.g., Davidson & Enos, 2024; Koc-Michalska et al., 2020). This could be due to the act of liking supposedly demanding lesser cognitive effort to use than other, apparently more demanding modes of engagement (Eberl et al., 2020). Thus, the apparent ease with which likes are used has led them to be viewed as “a significant indicator of success” (Nave et al., 2018, p. 2).
Nevertheless, the specific, situated meaning of liking online content is seemingly impossible to grasp (Koc-Michalska et al., 2020). Regardless, such deeper understanding of user motivations for behaving in one way or another is arguably beyond the scope of the study at hand. For our current efforts, we can even question if what a like means for the user employing this mode of engagement even matters with regards to our emphasis here, post engagement. Regardless of such individual meaning-making, we can be rather certain that higher yields of likes are likely translate into broader post visibility, regardless of the underlying motives of the user choosing to like the post in question (Ozanne et al., 2017).
Use and Popularity of Calls to Action
Social media come and go, and those platforms that enjoy longevity will not only continually evolve, they will also see similarly changed and increased competition for the coveted clicks and attention of users (Blumler, 2015; Kreiss et al., 2017). With the context at hand in mind, most early work into political campaigning focused on Twitter (Kalsnes et al., 2014; Larsson & Moe, 2014), a platform used only by a minority of Norwegians—indeed, the initial years in the time period focused on here appear to be characterized by preference for Facebook over the other two platforms among surveyed citizens (e.g., Vaage, 2016). Thus, based on the initial popularity of Facebook in our case country, we hypothesize that calls to action will be more common on Facebook than on the other two platforms during the first years in our studied time period (H1a). Relatedly, given this initial popularity of Facebook among the Norwegian populace, we expect that Facebook posts containing calls to action received more likes than those posts that did not contain such calls (H1b).
While Facebook and indeed Twitter have allowed for the posting of audiovisual content for some time, Instagram is perhaps the social media platform most associated with the visual turn discernable in international studies on political social media use (e.g., Haßler et al., 2024; Veneti et al., 2019). Indeed, Russmann and Svensson (2017) suggest that “there has been a shift towards visual images in the ecology of social media” (2017, p. 1), a tendency visible also among Norwegian political actors (Larsson, 2019, 2021a; Magin et al., 2024) and citizens (Schiro, 2022). Beyond its role in this rise in popularity of visual content, Instagram is also characterized by a comparatively younger user base (Bekkengen, 2025; Kreiss et al., 2017). Indeed, younger voters have been pointed to as a particularly important group to sway for political actors (e.g., Loader et al., 2014). To be precise, research from the US (e.g., Bartels, 2000) as well as from the country studied here (e.g., Bergh & Aardal, 2019) has indicated that long-term partisan loyalty is more easily secured if the voter can be persuaded to support a party from an early age. With the theme of the study at hand in mind, the argument is made here that one way to at least attempt to secure such loyalty could be to provide calls to action—tying the potential supporter closer to the political party. Taking this preference for visual social media in tandem with the need for parties to direct their efforts to the comparably younger voters who are the primary users of the platform, we hypothesize that calls to action will be more common on Instagram than the other two platforms during latter years in our studied time period (H2a). Relatedly, we expect that posts on the specified platform containing calls to action received more engagement—likes—than those Instagram posts that did not contain such expressions (H2b).
Finally, for Twitter, we have already mentioned that this platform is the least used out of the three—albeit probably the most studied. This is most likely because Twitter data has been easier to archive for research purposes (Lomborg & Bechmann, 2014) but could also have to do with the types of users that have been found to frequent the platform at hand. Indeed, in Norway (e.g., Larsson & Ihlebæk, 2016) as well as elsewhere, Twitter has been pointed to as supposedly chiefly populated by societal elites, a “Twitterati” (Verweij, 2012) of “professionals engaged in political debate” (Bruns & Highfield, 2013, p. 672) who are “heavily invested in news and current events” (Theocharis et al., 2022, p. 672). However, as Twitter users are comparably few and far between, we don’t expect parties to prioritize calls to action here. Rather, we hypothesize (H3a) that throughout the entire studied time period, the share of calls to action will be lower on Twitter than on the other two platforms. Based on the supposed political interest of Twitter users, as well as on the “always-on” tendency that was associated with the platform in its early years (Hermida, 2010), we expect that tweets containing calls to action will be more liked on average than tweets not containing such calls (H3b).
Methods
Data Collection
The study of social media has been made difficult by the seemingly ever-changing ways that social media services allow for data extraction. Indeed, mentions of an “APIcalypse” (Bruns, 2019) and of a related “Post-API Age” (Freelon, 2018) would seem to be especially poignant in relation to longitudinal approaches (e.g., Heft et al., 2023), such as those presented here. Thus, different modes of collection were necessary in order to secure our sample of posts from Norwegian political parties.
Parties Included in the Study. Presented in Order of Vote % in 2021 Election
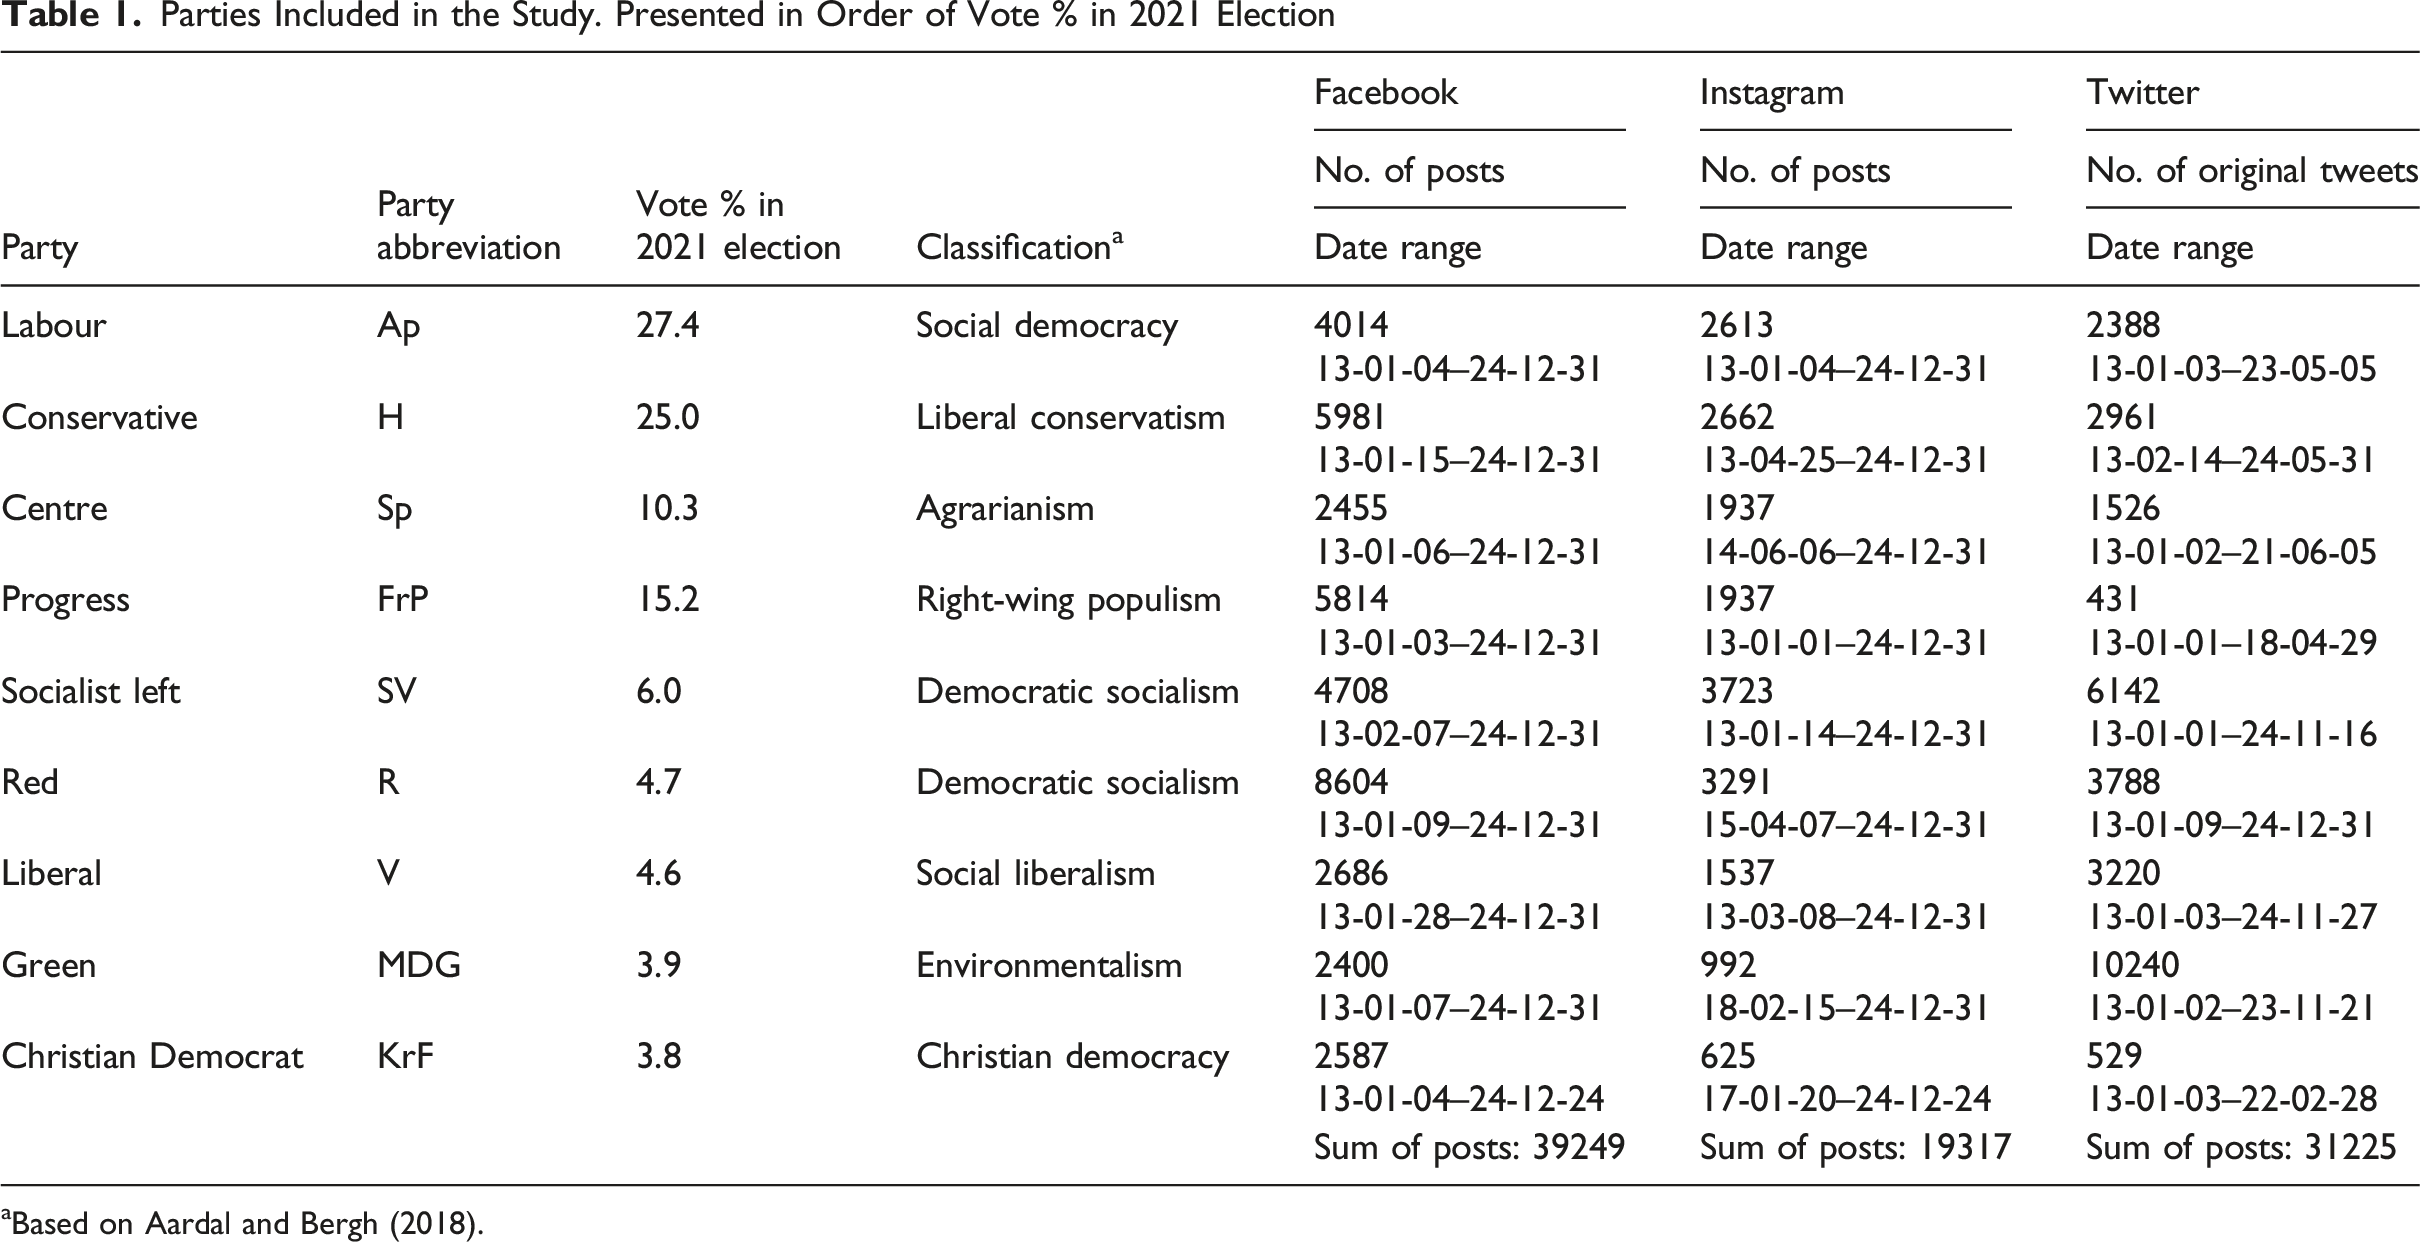
aBased on Aardal and Bergh (2018).
For the platforms operated by Meta—Facebook and Instagram—data was collected using the Meta Content Library, a service offered by Meta after the shutdown of CrowdTangle, the previous service that allowed researchers to export structured data from the mentioned platforms. For Twitter, two services were employed. First, a data set with the full history of the accounts operated by parties is shown in Table 1 since their inception and until the closing of the Twitter Academic API in early 2023. For the remaining time period, we used a custom-built Twitter archiving tool provided by apify.com. We filtered the resulting data set to focus only on the original tweets sent by the studied parties. Moreover, the two Twitter data sets were merged and checked for duplicate posts, which were removed. In total, 89,791 posts were collected across the three platforms.
Careful inspection of Table 1 also reveals a few apparent gaps in the collected data. Specifically, the dates reported in the table indicate that while all included parties hosted and were active on their respective Facebook accounts during the entire studied period, activity in this regard varied for Instagram and Twitter. For the former of these two platforms, a series of parties (Centre, Red, Green, and Christian Democrat) must be considered as comparably late adopters, given that their Instagram accounts were started—or at least that activity on these accounts started—at comparably later dates. For Twitter, a reverse pattern is identified. Indeed, the table shows that while all parties were active from the first year studied here, another group of parties (Labour, Centre, Progress, Green, and Christian Democrat) appear to simply stop using their Twitter accounts at different later points. Upon inspection of these accounts, none of them have been removed or deleted at the time of writing. Instead, they appear to be left behind as a sort of testament to the activity that was once undertaken there. Take, for instance, the Twitter (now X) account hosted by the Christian Democrats, which was still available at https://x.com/KrFNorge during early September 2025. Here, we can see that the last original post made by the party was provided on February 28, 2022. While further investigation into the reasons for such decline is beyond the scope of the paper at hand, it seems reasonable to assume this decline of Twitter use is at least in part related to issues of “dark participation” (Quandt, 2018) or “dark politics” (Nai & Maier, 2024) supposedly being rampant on the platform (e.g., Larsson, 2024).
While Table 1 provides some initial insights into the numbers of posts sent by our studied parties across each platform, it fails to provide more detailed insights into the year-by-year distribution posts. Thus, Figure 1 provides overall insights into platform party prioritization—regardless of whether calls to action were included in posts or not. Number of Posts per Platform and Year. x2 = 24555***, Cramér’s V = 0.37. * = P < .05; ** = P < .01; *** = P < .001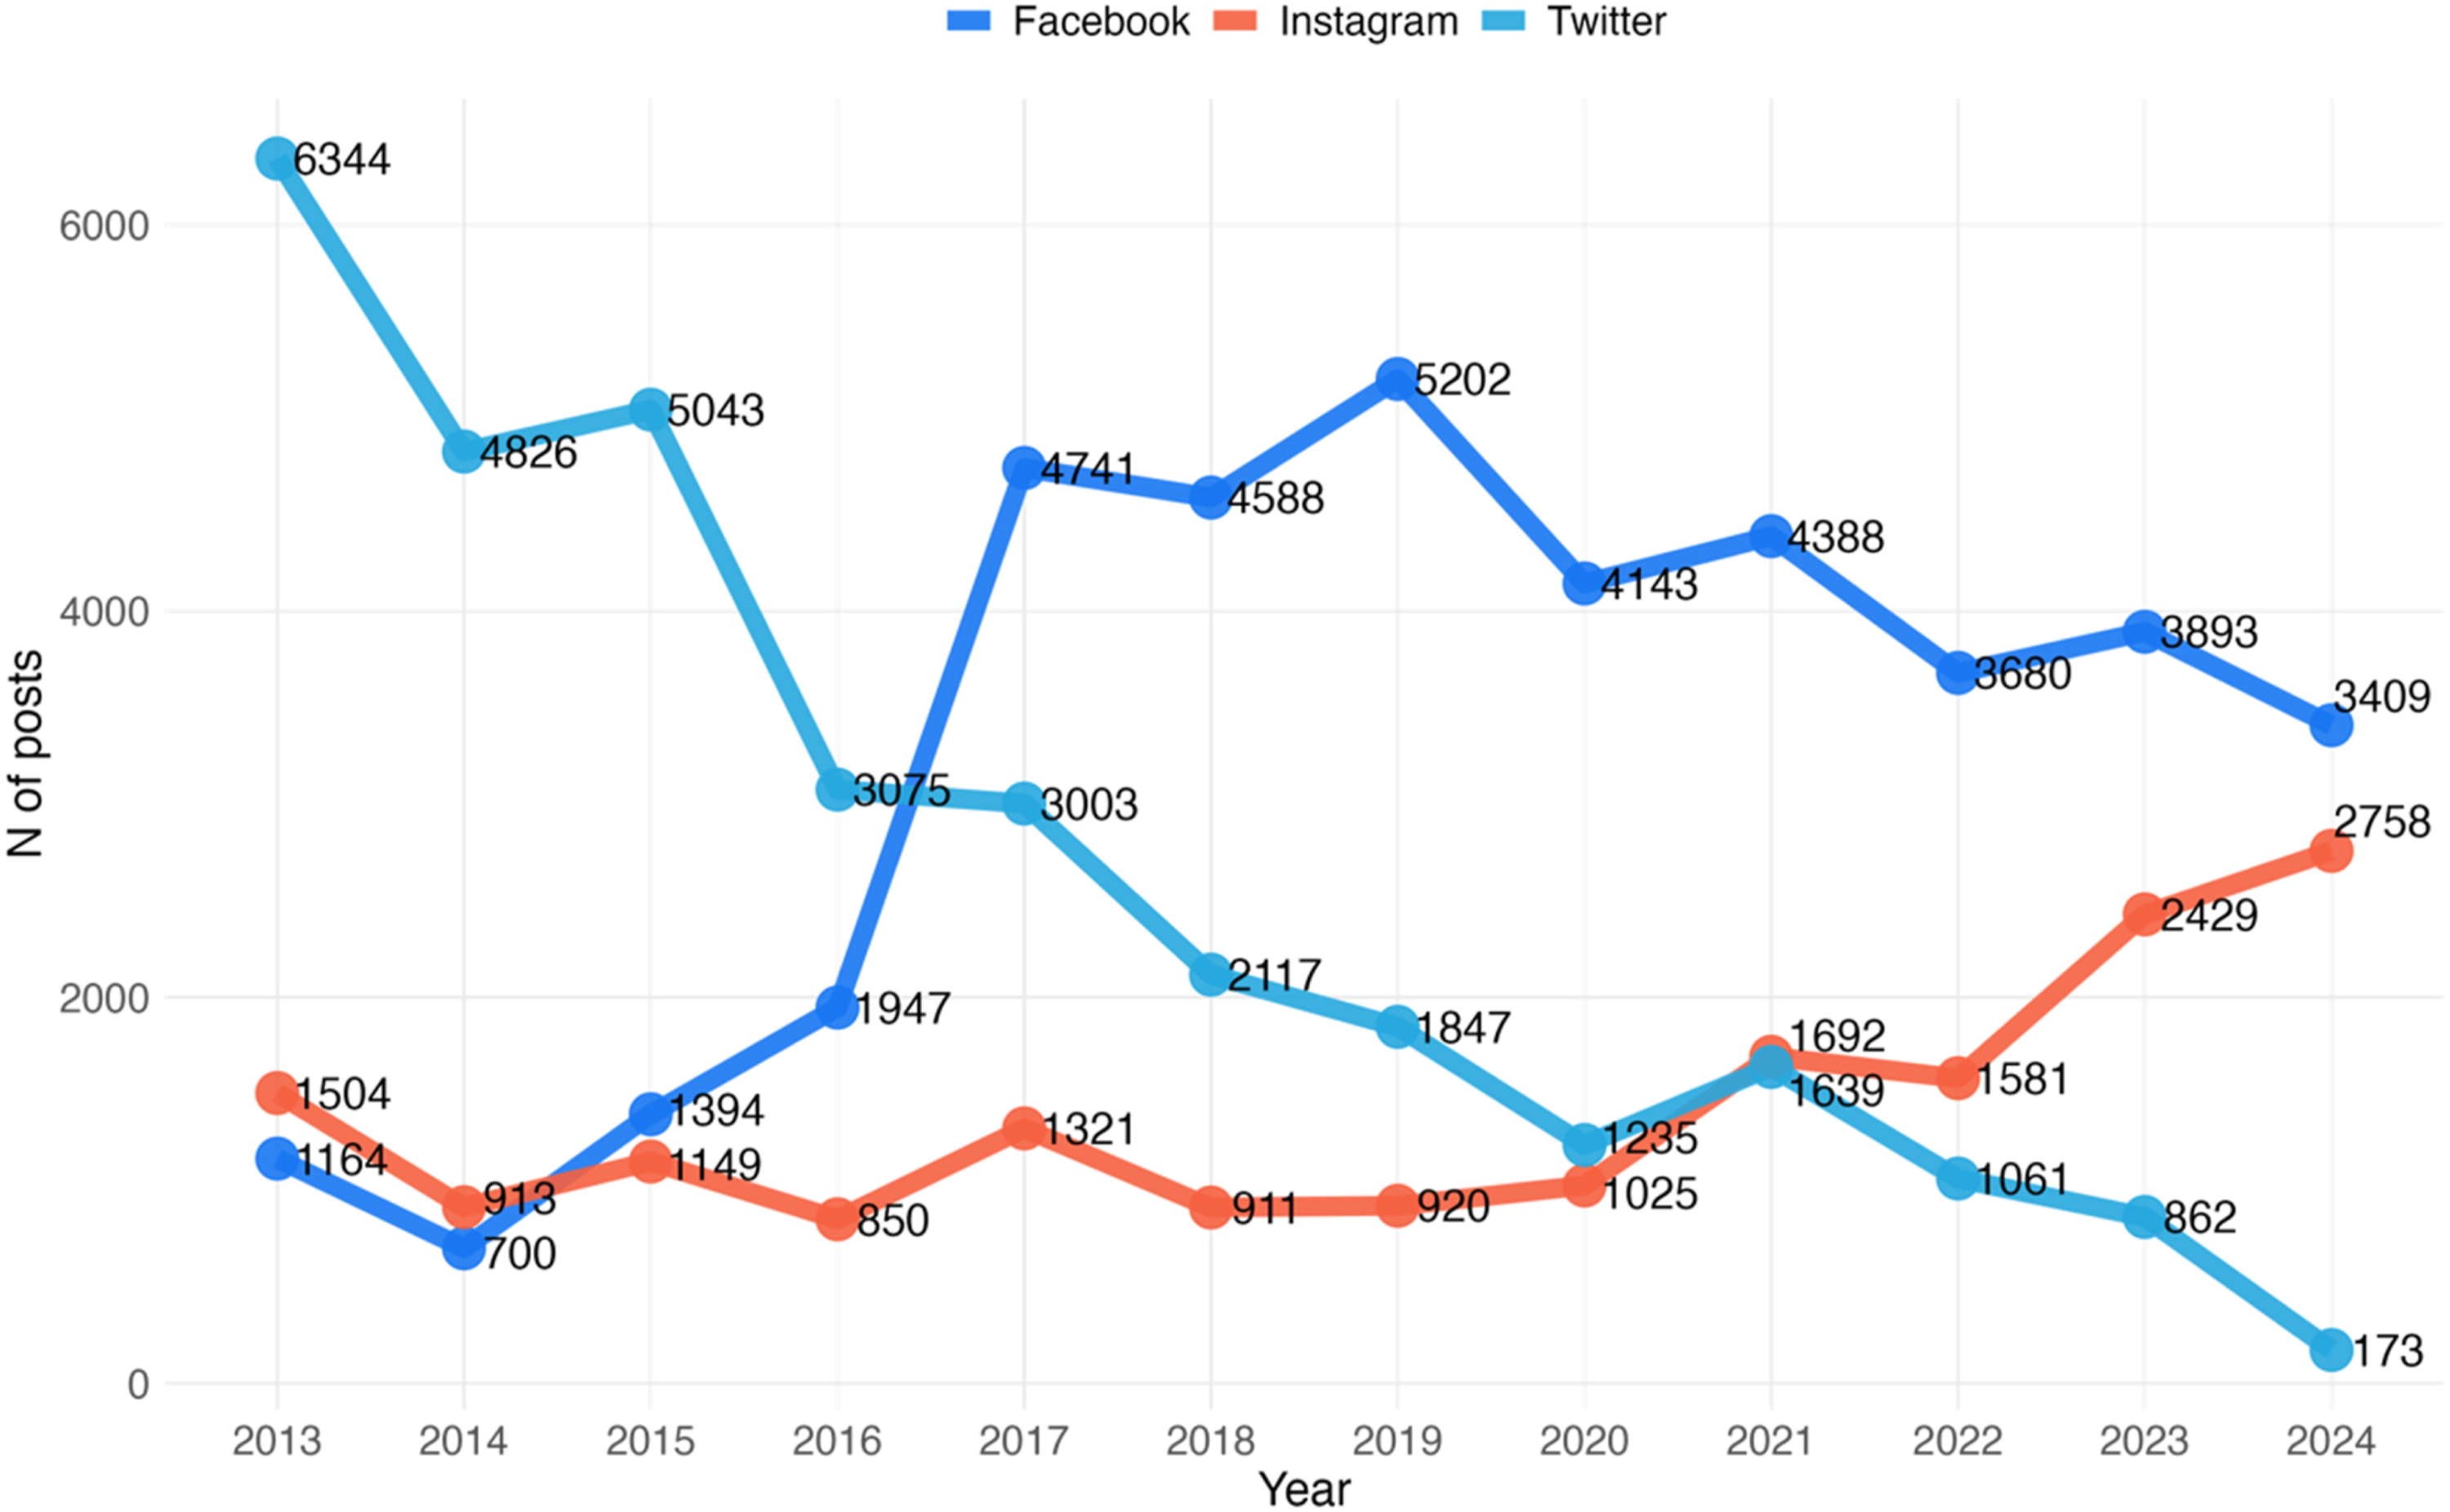
The light blue line representing Twitter suggests a clear decline of a platform that was once clearly dominating among “the established political commentariat of professionals engaged in political debate” (Bruns & Highfield, 2013, p. 672). As Twitter has been pointed to as perhaps too important (e.g., Lomborg & Bechmann, 2014; Theocharis & Jungherr, 2020) for research into political communication, the suggestion made by Hodson and co-authors (2021) that “[o]ther platforms are also important for public engagement” (2021, p. 157) rings especially true when one witnesses the rather dramatic decline of the corresponding line in Figure 1 (see also Larsson, 2024).
If Twitter has been seen as an elite medium (Magin et al., 2024; Theocharis et al., 2022), the dark blue line visible in Figure 1 denoting Facebook activity underlines the longevity of the platform and its status as “more of a mass medium” (Jacobs et al., 2020, p. 616). Rising to its dominant position during the 2017 parliamentary election year and reaching even higher during the subsequent 2019 regional election year, Facebook remains on the top throughout the remainder of our studied time period.
Regardless of such dominance, a downward tendency can nevertheless be identified for the dark blue Facebook line from this last election year and onwards. This descension is coupled with an ascension of the line representing Instagram activity—an upwards trend that seemingly also started in 2019. Enli (2017) reminds us that “social media election campaigns are constantly developing,” and while the line trajectories visible in Figure 1 suggest a stable yet somewhat diminishing presence for Facebook, Twitter’s descent and Instagram’s ascent nevertheless give testament to this quote. Interestingly, the 2021 parliamentary election year sees Twitter and Instagram almost overlap with regards to the number of posts made by the studied political actors—after this point, however, the two lines take very different trajectories, bringing to mind Bekafigo and McBride’s (2013) suggestion that social media “even Twitter, may come and go” (2013, p. 638).
Data Analysis
Assessment of the degree to which calls to action had been provided by Norwegian political parties across the specified platforms and years was performed in three steps. First, the llm_verify function from the Mall package for the R programming language (Ruiz, 2024) was employed to query all 88 520 posts for the presence or absence of calls to action. The Mall package allows for multiple large language model (henceforth LLM) predictions against a specified column in a data set. Specifically, the package makes it possible to work with locally installed LLMs (as recommended by Törnberg, 2024b) to perform common social scientific tasks such as content analysis. Precisely, the llm_verify function “allows you to check and see if a statement is true, based on the provided text” (Ruiz, 2024) returning true/false statements. Following the suggestions of previous efforts (e.g., Gruber & Votta, 2025), we used the open-source Gemma 3 LLM (Gemma Team, 2025) with 27 billion parameters provided by Ollama (Marcondes et al., 2025) by means of the ollamar R package (Lin & Safi, 2025). The prompt provided to the llm_verify function was inspired by previous scholarship as mentioned before as well as suggestions made by previous, similar efforts (e.g., Törnberg, 2024a; Weber & Reichardt, 2023) and read as follows:
Does the post ask the reader to take action? You should look for explicit encouragements asking the reader to take action in some way, either on- or offline. Please return the result “0” if the post does not contain these types of requests, and a “1” if the post does include them.
Employing LLMs for text classification tasks such as the one undertaken here has found models similar to the one used to perform on par with or even outperforming trained coders (e.g., Gilardi et al., 2023; Weber & Reichardt, 2023)—in particular when used to classify or annotate comparably shorter texts, like social media posts (e.g., Heseltine & Clemm von Hohenberg, 2024). Using the prompt disclosed above, we follow the example of previous, similar research efforts (Heseltine & Clemm von Hohenberg, 2024; Törnberg, 2023, 2024a; Weber & Reichardt, 2023) and employ what is commonly referred to as zero-shot classification where natural language instructions are provided to the LLM, much like instructions for classifications would be provided to a human coding assistant. As these kinds of relatively simple assessments have been deemed as suitable tasks for LLMs (e.g., Gilardi et al., 2023; Heseltine & Clemm von Hohenberg, 2024; Törnberg, 2023), the approach was seen as appropriate also for the classification task to be performed. Relatedly, in order to avoid what is sometimes referred to as hallucination or indeed too much creativity (e.g., Diers-Lawson & Lawson, 2024) in how the LLMs went about the annotation processes, we followed the recommendation made by Törnberg (2024a) who suggested that “[f]or data annotation, a lower temperature is usually recommended, such as 0” (p. 13). Settings were adjusted accordingly.
The second step involved the testing of intracoder reliability by having the same LLM recode a randomly selected 20 percent sample of the original 88 520 posts (N = 17 704). Given its suitability for binary coding and skewed, Brennan and Prediger’s κ distributions (e.g., Quarfoot & Levine, 2016) were used and gauged at .88—a result comparable to the one reported in Törnberg’s (2024b) study, where the LLM was asked to “make an educated guess” (2024b, p. 6) about the party allegiance of tweeting politicians.
The third and final step for our analysis of the provision of calls to action tested for intercoder reliability of the results. Inspired by the hybrid coding approach suggested by Heseltine and Clemm von Hohenberg (2024), the author recoded a random two percent sample of the original 88 250 posts (N = 1765). Again using Brennan and Prediger’s κ, reliability was gauged at .77. While this statistic is lower than the one reported for intracoder reliability, it can still be considered as “good” (Fleiss et al., 2003, p. 604) or as “substantial agreement” (Landis & Koch, 1977, p. 165; Viera & Garrett, 2005, p. 362).
In order to assess the popularity of posts containing and indeed not containing calls to action, we used likes as measurement of audience attention or indeed popularity in relation to the studied posts. To reiterate, while other ways of audience attention could certainly have been considered, our focus on likes was motivated by it being common to all three platforms and indeed the most frequently used type of “popularity cue” (Porten-Cheé et al., 2018) across platforms. Using the results from the post annotation process described in the previous section to investigate the relevant hypotheses, we chiefly use non-parametric tests given the skewed nature of our data.
Results
Our first research question asked to what extent did parties use calls to action on social media during our studied time period? Figure 2 provides us with insights in this regard. Percentage of Posts Containing Calls to Action per Platform and Year. x2 = 6176.3***, Cramér’s V = 0.34. * = P < .05; ** = P < .01; *** = P < .001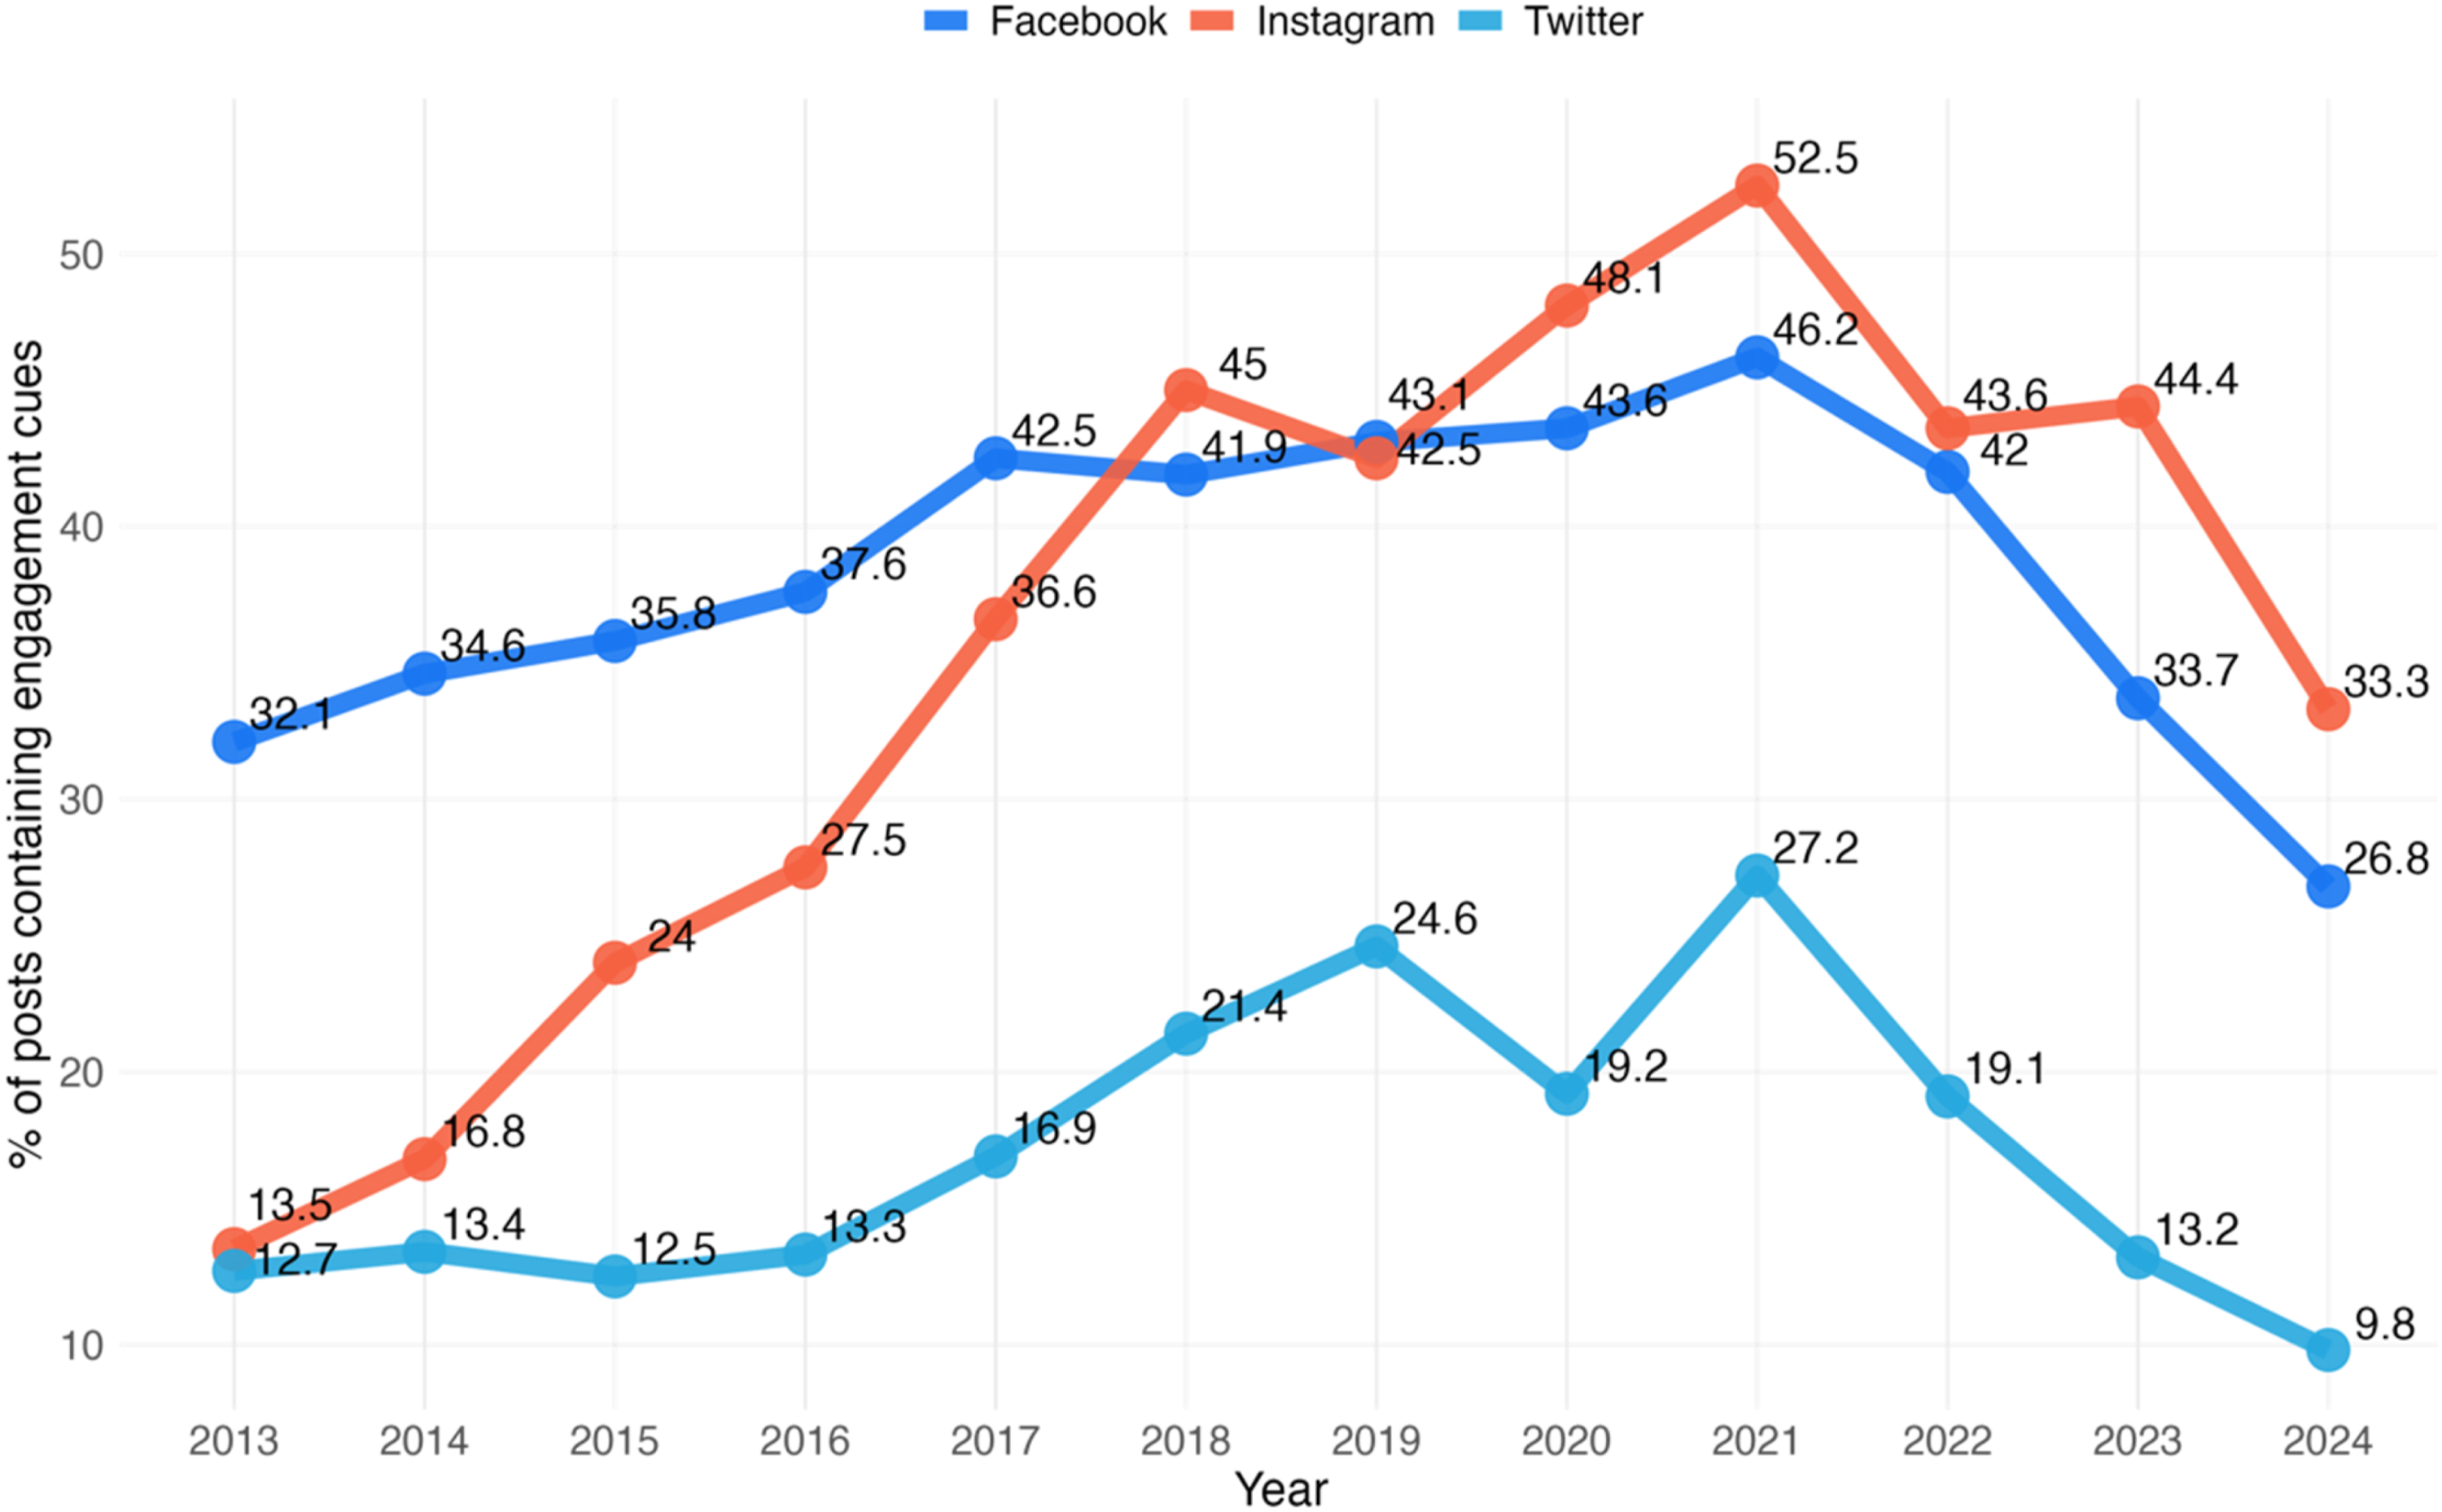
Figure 1 revealed the dominance of Facebook use among the studied parties during the time period under scrutiny. The line trajectories visible in Figure 2, however, suggest that for uses geared toward engaging potential voters in the ways discussed here, a different picture emerges. While Facebook takes the lead in this regard up until the 2017 election year (lending support to H1a, which suggested that this specific platform would be in the lead in the initial years), the remaining years see Instagram take a sometimes small, albeit clear, lead over the seemingly former go-to platform for these matters. This rise of Instagram at the apparent expense of Facebook is in line with H2a, which suggested that Instagram would come to dominate the later years in our study. While the light blue line representing Twitter activity sees upsurges during the 2019 regional and 2021 national elections, the large-scale general use for this platform visible in Figure 1 is not reflected in the more specific uses uncovered in Figure 2. This supports H3a, which stated that out of the studied platforms, Twitter would be the least employed for the purposes of calls to action. Regardless of platform, the trajectories of the lines suggest a similar pattern—while the general tendency up until the 2021 national election year appears to have been one of ascension, the final years included here suggest descending tendencies for the provision of calls to action across all three studied platforms.
Next, we move on to assess RQ2, which read to what extent were posts containing or not containing calls to action engaged with for each platform and year? Figure 3 allows for further investigation. Means of Likes per Platform, Year, and Calls to Action. Line Indicates Means of Likes per Year; Dots Represent Underlying Data Points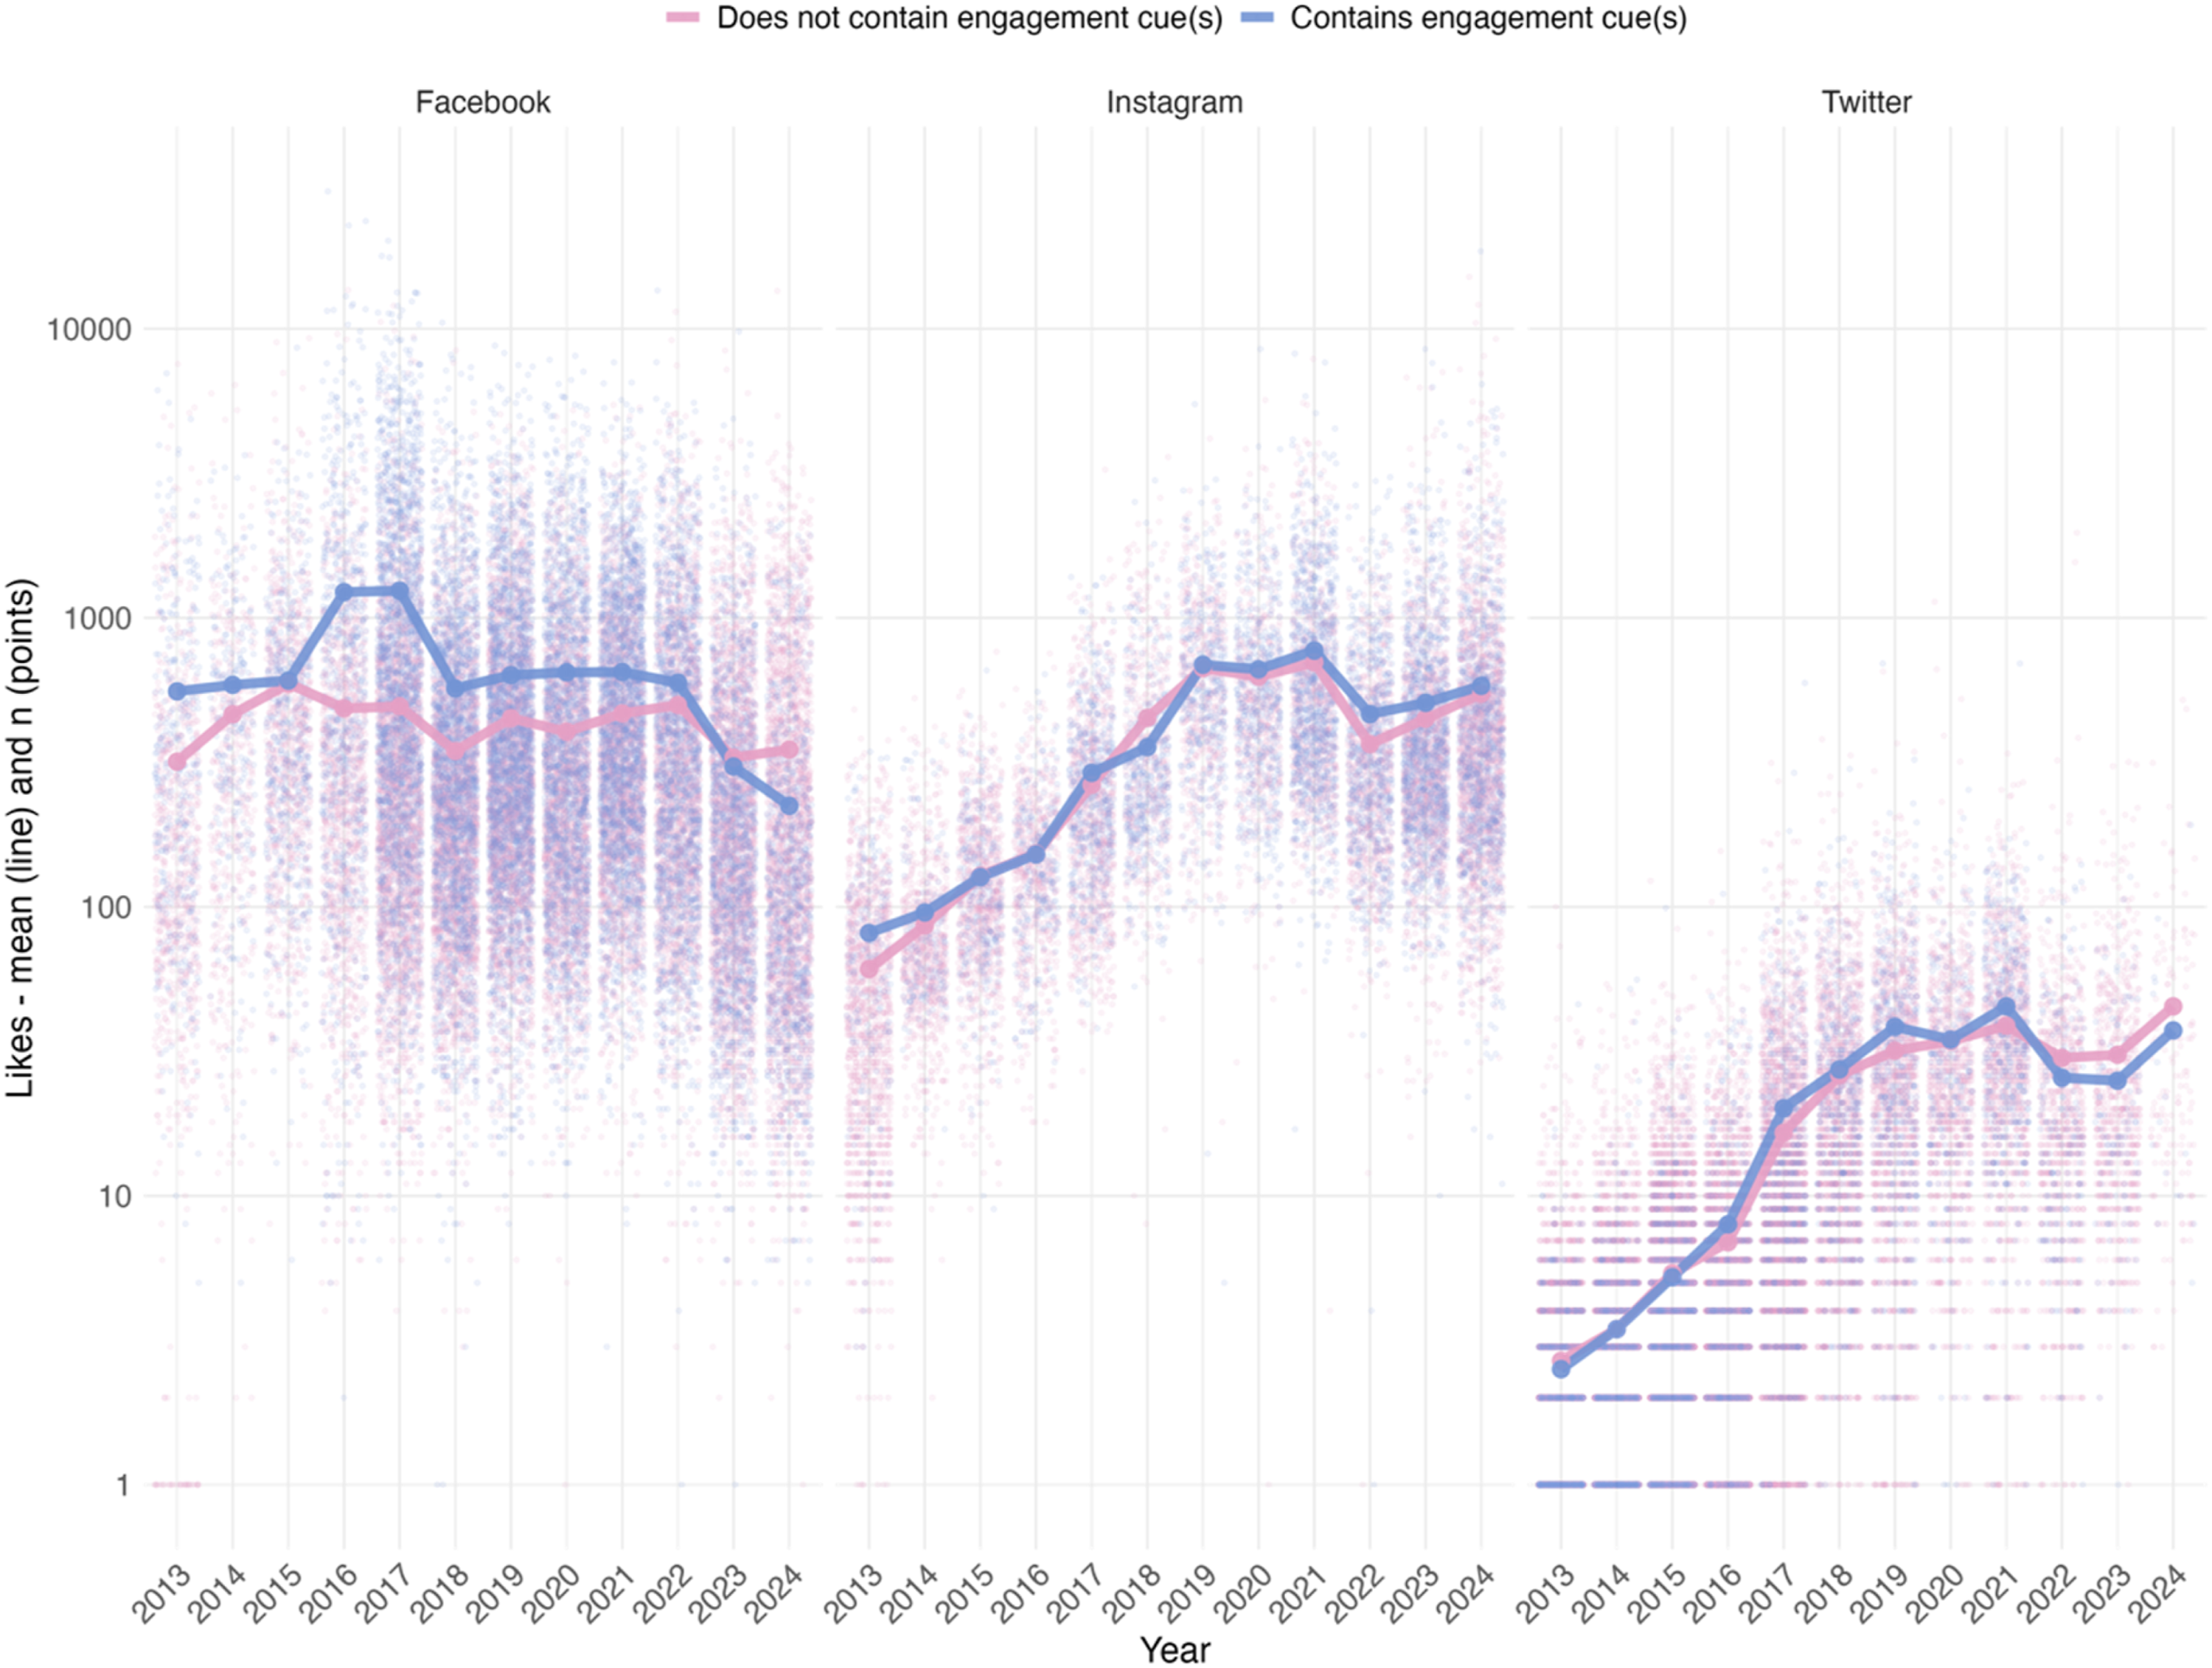
Figure 3 is divided into three panels—one for each platform. Each panel features lines and dots. The pink lines denote the mean of likes per year for posts containing calls to action, while the blue lines indicate the mean of likes for posts not containing such solicitations. Dots featuring these colors, then, represent the underlying data points—one dot equals one post on Facebook, Instagram, or Twitter—with the color of the dots corresponding to whether the post contained or did not contain calls to action.
Starting with Facebook, a series of Kruskal–Wallis tests were performed—one for each year—detailing the mean differences between posts asking and not asking for engagement. These tests emerged as significant for each year (P < .001) save for 2015 (P = .596)—results that appear to reflect the line trajectories visible in the left-hand panel of Figure 3. Indeed, out of our studied platforms, Figure 3 suggests that Facebook appears to be the one where calls to action gain the most traction in terms of securing more likes—especially, it would seem, during the first years during our studied time period (supporting H1b). As an example, the contrast between the high points in 2016 and during the subsequent 2017 election year and later years would be particularly clear in order to detail the apparent demise of liking activity in relation to calls to action.
The same process of statistical testing was employed for the results pertaining to Instagram (visible in the middle panel of Figure 3). With more closely tied line paths than those visible in the Facebook panel, non-significant differences between posts containing and not containing engagement calls were indeed abundant. Specifically, while the mean differences reported for 2014–2016, 2019–2020, and 2024 emerged as non-significant (P > 0.05 across all comparisons for those years), mean comparisons for all remaining years emerged as significant (P < .001 for all such comparisons). Keeping these statistics in mind while studying the line paths visible in the middle panel, we can see that much like the 3 year period starting with the 2021 election year and lasting until 2023 saw the mean of likes for posts containing engagement calls outperform that same statistic for posts not containing such calls, 2024 sees the same tendency with posts containing calls resulting in a mean of likes of 581,78 and posts not containing emerging with a mean of 546,63. While the difference during this last year did not reach statistical significance, the uncovered mean difference nevertheless follows in line with the tendencies shown during preceding years. Taking all these factors into account, we can confirm H2b, which suggested that Instagram would rise to prominence in this regard during the later years in our studied time period.
Finally, for Twitter, the lines in the right-hand panel in Figure 3 clearly show that the means for tweets containing and not containing calls to action are measured at lower levels than for both previous platforms. Taking the scale differences into account, the line trajectories visible in the specified panel are nevertheless somewhat reminiscent of those visible for Instagram (middle panel of Figure 3)—with one key difference. While the blue line indicating the mean of likes for posts containing calls to action increased for Instagram toward the end of our studied time period, a reverse situation can be distinguished for Twitter. This tendency is also reflected in the Kruskal–Wallis results—for Twitter, the mean differences visible in Figure 3 emerged as statistically significant for the years 2019 and 2022–2024. As the position of the blue line in this section of Figure 3 suggests, the regional (2019) and national (2021) election years saw more engagement from users in this regard, perhaps mirroring the aforementioned characteristic of Twitter as a platform for the politically engaged. That being said, while Instagram emerges in our final studied years as characterized by posts containing calls to action gaining more engagement as defined here, Twitter emerges as more similar to Facebook with regards to the degree to which platform audiences engage—or perhaps more fitting, do not engage—with post containing calls to action. With regards to H3b, which suggested that for the entirety of the studied time period, tweets containing calls would yield more likes than tweets that did not, this hypothesis cannot be supported based on the findings emerging in Figure 3.
Discussion
Assessing the provision of calls to action across social media platforms, our first research question asked: To what extent did parties use calls to action across platforms and years? The results presented in Figures 1 and 2 suggest some interesting discrepancies in relation to this initial question. As mentioned, Twitter has been extensively studied within digital political communication research—and while the platform did indeed seem to be important with regards to general use (as seen in Figure 1) it was the least employed for the provision of calls to action (as seen in Figure 2). This apparent underutilization of Twitter could have to do with a flip side of the often-described elite status of the platform. We can postulate that such more socially engaged actors might be difficult to persuade to act in desired ways—due to them having their own agendas or indeed goals for being on the platform in the first place. Increasingly professionalized (Hartleb, 2013; Strömbäck, 2007) and thus digitally savvy (Klinger et al., 2022) political party organizations are likely to have picked up on such tendencies, choosing as a result to direct their efforts to engage potential voters elsewhere.
On a more general note for Figure 2 and in relation to our first research question, while we see shifts in what platform appears to be most popular for parties with regards to calls to action, all three lines in the figure take downward directions following the 2021 national election year. This descent comes after previous years had shown chiefly ascending tendencies, suggesting new online strategies where parties increasingly appear to be abandoning the “engagement gaze” (Chadwick, 2019). While political organizations may have been more likely to employ social media in the ways studied here more extensively in the recent past (e.g., Stier et al., 2018), the decline shown here could perhaps be seen as a backlash to previously uncovered difficulties relating to getting citizens to interact (Larsson, 2012; Pineda et al., 2022)—difficulties that could be related to comparably recent tendencies of “dark participation” (Quandt, 2018) or “dark politics” (Nai & Maier, 2024) as mentioned before. While Norwegian political actors remain largely consensus-oriented, these dark concepts suggest a harsher climate in the comment fields and other virtual places that often accompany posts possibly containing calls to action. Such increasing harshness has been pointed to as being especially characteristic of Twitter (e.g., Oz et al., 2018; Southern & Harmer, 2019)—relating back to the lack of use identified on this platform as shown above. In a broader sense, such a dark turn in public discourse has been discussed as leading to “dissonant” (Koc-Michalska et al., 2023) or “disrupted” (Bennett & Pfetsch, 2018) public spheres, where personalized and emotional communication dominates and “traditional institutional mechanisms fail to moderate and resolve public conflicts” (Koc-Michalska et al., 2023, p. 3)—not an ideal environment in which to discuss with and seek to engage citizens to take action, it would seem.
Our second research question read: To what extent were posts (not) containing calls to action engaged with across platforms and years? Thus, the question dealt with the like patterns of posts containing—or indeed, not containing—calls to action provided to social media platforms by Norwegian parties. The popularity of posts was measured following the rationale introduced previously, using likes as a common measurement across Facebook, Instagram, and Twitter. The results presented in Figure 3 suggest that for Facebook, we see increasingly downward tendencies for post likes when the studied parties feature calls to action in their posts. Granted, Facebook appears to have been the platform where such techniques appear to have worked best for the bulk of our studied time period—not so much, however, towards the end.
Both of our other studied platforms—Twitter and Instagram—appear with reverse tendencies as shown in Figure 3. While Twitter starts from lower amounts of likes, the lines representing the platform show ascending tendencies towards the end. Nevertheless, Twitter also emerges as somewhat similar to Facebook in that the final years in our study see both platforms featuring higher amounts of likes for posts not containing calls to action when compared with posts that feature this type of content. While the study design featured here does not allow for any certain claims to be made about what might cause these developments, the previously discussed tendencies towards dark politics are likely to be at play here. This does not appear to be true, however, for Instagram. Featuring different line trajectories than the other two platforms described in Figure 3, both lines increase beyond those reported for Facebook, putting Instagram in the lead. Similarly, Instagram posts containing calls to action result in more engagement during these final years. Taken together, these findings suggest that Instagram may have—so far, at least—been spared from the aforementioned dark tendencies. Such a suggestion would seem to be in line with the suggestions made by previous research that political actor Instagram use will not necessarily feature political content (Ekman & Widholm, 2017; Larsson, 2017; Pineda et al., 2022), rather a more informal tone characterized by personalization and behind-the-scenes glimpses that apparently is more successful in terms of gaining engagement as defined here.
Overall, our findings speak to the over-time development and change of calling for action on social media. Not only do political actors, such as the parties studied here, need to adapt to new platforms as they appear—the longitudinal design employed here suggests that those seeking the engagement of potential voters must also continuously assess and be ready to amend their social media strategies as time goes by and as user potential for heeding imperatives to take action change, shift or indeed is minimized where it was previously clearly present. The introduction of more platforms—such as TikTok and WhatsApp—into the party campaign toolboxes will further complicate the prioritizations to be made by those seeking political office. Thus, in adopting a double-comparative approach—studying the use and popularity of calls to action across platforms and time—the work presented here makes a contribution to the growing field of comparative political communication work. That being said, the study has limitations which should be duly addressed. Indeed, while our current efforts have provided useful longitudinal comparative insights between three often studied platforms, there is real potential to expand these comparative approaches even further. Beyond looking into how these processes play out on a wider selection of different social media platforms is also a need to diversify between different types of calls to action. While the findings presented here provide a useful overview of how these imperatives are used by parties as well as followers across time and platforms, it is likely that different strategies are used in calling to action. For instance, while platform characteristics were dealt with to some extent in the work presented here, future work might find it useful to delve further into any differences that might stem from platform affordances. Furthermore, while our focus on political parties seemed suitable given the party-centered democracy where the study took place, the work at hand did not specifically differentiate between different types of parties. Thus, future research efforts might find it useful to incorporate comparative party-comparative approaches in their research designs. Similarly, a focus on other types of political actors than those dealt with here is likely to be useful. Specifically, while party-centered systems like the Norwegian one might be less incentivizing for “politicians to distinguish themselves or to directly mobilize voters on their own behalf” (Tromble, 2016, p. 4), Strandberg (2013) has pointed out that more candidate-focused democracies produce “benchmarks that are gradually adopted elsewhere” (2013, p. 1329). Thus, going beyond the parties themselves, further insights are needed into the use of calls to action by individual politicians in party-centered systems.
Footnotes
Funding
The author received no financial support for the research, authorship, and/or publication of this article.
Declaration of Conflicting Interests
The author declared no potential conflicts of interest with respect to the research, authorship, and/or publication of this article.