
Abstract
Corporate and government officials as well as social scientists studying smart cities are exploring gamification to help stakeholders engage with complex technological and societal issues. However, despite research addressing concerns of respondents’ engagement and the validity and reliability of the results of gamified research, there are hardly any empirical accounts of how respondent engagement, validity and reliability of results are affected by decision-making in multi-stakeholder processes of designing and producing gamified research. In this paper, we evaluate a gamified survey that we developed to do research about public perceptions and engagements with digitization and datafication in public space. We report and evaluate the ideas, discussions and decisions in the design and production of the gamified survey. These reflections offer insights into the politics of such a process and advice for other researchers considering the use of gamified research tools for examining seemingly invisible and intangible technological developments, whilst at the same time being critical of the validity and reliability of the outcomes that such a survey produced. Our analysis shows how and why pragmatism and stakeholder relations took precedence over academic and epistemological concerns. Whilst we produced a research tool that did provoke large numbers of different people to actually engage with the smart city, the resulting data were less rich than we had aimed for, and required additional, qualitative methods.
Introduction
It is becoming increasingly common for cities to use digital technologies, data and algorithms to manage their public spaces and their administrative responsibilities. With these so-called ‘smart city’ approaches, cities expect to get a grip on urban challenges related to growth, sustainability and liveability. Various scholars and activists have argued that these smart city projects provide us with biased images of urban processes leaning towards corporate and instrumental visions of the city rather than including and reflecting public values and citizens’ interests (cf., Engelbert et al., 2019; McFarlane & Söderström, 2017; Sadowski & Bendor, 2019; Shelton et al., 2015). Critics and others argue for a wider debate and aim to include more citizen input in smart city projects and programmes (cf., Andreani et al., 2019; Cardullo et al., 2019; De Waal & De Lange, 2019; Hill, 2013; Wylie, 2018). Urban managers and corporate actors similarly express the desire for more prominent inclusion of citizens and their perspectives in the smart city. And, increasingly, a growing movement of ‘city makers’ 1 is exploring alternative applications of digital and data technologies, expressed in experiments with citizen science, data commons, digital democracy or digital activism.
Smart city technology, however, is in many ways invisible to members of the public in several ways: physically, as cables are under the ground and wireless signals float through the air; technically, as the way data and algorithms work is beyond direct observation; and socially and politically, as these developments are hardly subject to public discussion. The challenge for all smart city stakeholders, then, is to find ways to render the smart city visible and tangible and therewith make it possible to discuss and reflect upon it. For many cities and their corporate partners such visualization has become part of the slogans and images of city branding (e.g. Yavuz et al., 2018). Urban activists and ‘city makers’ have taken to the methods of arts and design to raise awareness of digital technologies and data in the city (cf., Van Zoonen, 2020). Researchers have less of a tradition regarding these practices, but are increasingly engaging in research through design, speculative methods and gamified research (e.g. Auger, 2013, 2014; Barwick et al., 2018; Coulton et al., 2016; Harman et al., 2014; Schliwa, 2019) to make the smart city researchable. This paper aims to identify the epistemological and methodological challenges and consequences of working with a gamified survey, as well as reflect on its politics and pitfalls. We do so by examining the considerations and choices our research team made, firstly, in deciding to use a gamified survey, and secondly, in its design and execution. Our reflections are based in our systematic documentation, continuous memo-making and team discussions from the beginning to the end of the process.
In the next section, we first briefly explain the ‘look and feel’ of our gamified survey and the reasons to work with such a method. We then place our study in the wider context of gamified surveys. We describe the design and production of the game in chronological order, following the sequence of pitching the initial idea for our research game to relevant stakeholders, choosing an agency to design and produce the gamified survey, translating theoretical insights and empirical questions to playable scenes and visual context, meeting legal and ethical requirements, and sampling decisions and analytic techniques. We demonstrate the continuous tensions between pragmatic and epistemological considerations and conclude that our gamified survey produced high participant engagement but led to tentative rather than conclusive outcomes. We will discuss the consequences for the use of the gamified survey, and conclude with recommendations for gamified research tools more generally.
Our Case: Your Neighbourhood Your Data
We designed and used a gamified survey in 2018 to explore citizens’ knowledge (technical familiarity) of smart cities, and to assess their privacy concerns and actual privacy-related behaviour in smart cities (for the outcomes of this survey, see Rijshouwer et al.). The first reason to use such a gamified survey that includes a visual representation of a smart city is that there is no actually existing, recognizable ‘smart city’ where we can find all relevant aspects of urban datafication and where we could study respondents’ experiences and interactions with this environment (Pisani, 2015). Secondly, we considered a gamified survey as an effective (accessible, low threshold, inspiring, motivating) means to reach out to a wide audience, both to raise their awareness about smart cities, but also to collect sufficient data to make valid claims on the smart city knowledge, privacy concerns and privacy behaviour of the Dutch population. The third reason to use a gamified survey was that there is ongoing debate about the relevance of research when privacy concerns and behaviour are taken into account: the accuracy of respondents’ answers to privacy related questions and statements are disputed, as they supposedly differ from their actions in real life. Knijnenburg et al. (2017, p. 2) emphasize that, as a lot of privacy research is conducted post-hoc, the retrospective rationalizations of respondents do not necessarily correspond with their actual concerns and behaviours. In the literature this is captured in the term ‘privacy paradox’. 2 Through the gamified survey we were able to craft seemingly realistic situations and scenarios to test, at a large scale, how respondents would share their personal data in particular situations rather than asking them about their concerns and their past and potential behaviours in a traditional survey or an interview.
In terms of Adamou’s (2011) qualifications of different research games, our gamified survey was ‘avatar-based’ and took a ‘soft gamification’ approach. The survey included an online visual representation of a smart neighbourhood through which the respondents’ avatar could navigate, whilst answering questions, and solving puzzles. At several points in the game, respondents were asked to share personal data in exchange for financial benefits as well as for convenience, social and safety and security purposes. At two locations in the city, respondents had to identify digital technologies or institutes that collect data, such as public transport gates, the city hall, surveillance cameras or Wi-Fi trackers. At several points in the game, respondents would receive an award or badge. At the end, they were given feedback about where they shared data and where data were collected, as well as a personal profile about their knowledge and data sharing behaviour.
Gamified Surveys
Gamification is ‘the use of game design elements in non-game contexts’ (Deterding et al., 2011, p. 2). These elements are, among others: clearly identifiable rules and objectives; a story or narrative which participants can relate to; challenging tasks; rewards; feedback; and a motivating virtual, visual and often audio environment (Keusch & Zhang, 2017, p. 150). Gamification is considered an effective means to test and train (costly and complex) technical, medical and military situations, and, since the past decade, gamification has increasingly been used to conduct market and consumer research. ‘Research through gaming’, is, according to Adamou (2011) a situation in which organizations and researchers develop games to gain data from the actions respondents take whilst engaging in that game. However, according to Barwick et al. (2018, p. 232), ‘there has been little interest from the academic community in the potential opportunities that gamification presents in the research context’. The few academic reflections on gamified research concern basically two issues: gamification as a means to engage respondents in new and appealing ways, and the challenge to the validity and reliability of the data that gamified research produces. There is even less about the process or the ‘how to’ of designing gamified research and its consequences.
With regard to gamification as an instrument to engage participants in research, and specifically for gamified surveys, the standard argumentation is that respondents of ‘traditional’ surveys often suffer from survey fatigue, which compromises both response rates and the quality of the outcome of surveys. Especially in online surveys, respondents appear to be ‘straight-lining’ (i.e. clicking on the same position on successive similar scales), choosing random answers to speed up the survey, or not finishing the survey at all (cf., Turner et al., 2014, p. 4). Hence, scholarly papers are mostly concerned with identifying and evaluating which game mechanics to deploy that put (potential) respondents in an enjoyable situation that they find ‘both challenging and absorbing’ (Keusch & Zhang, 2017, p. 149), and which motivates them to respond sincerely to questions and challenges. Hoekstra (2020) identifies psychological and behavioural dimensions in legitimating the choice for a gamified survey, with psychological assumptions pertaining to motivation and pleasure of the respondents who fill in the survey, and behavioural assumptions being about higher completion rates and data quality. According to Hoekstra, several studies have found such higher engagement and completion rates. However, he also reports a study that compared completion rates of a standard text-based survey with a gamified text-based survey and found that the gamified version was less often completed than the standard version (Downes-Le Guinn et al., 2012 in Hoekstra, 2020). This study was subject to criticism because visual game elements were lacking and because the game itself had no connection to the survey topic (Keusch & Zhang, 2017). When these two elements of visuality and relevance are present in a gamified survey, both the psychological and the behavioural engagement of participants have been shown to increase.
With respect to the validity and reliability of the data generated by gamified surveys, Keusch & Zhang (2017, p. 151) state that ‘changing the context of a question [to make the survey more game-like] might also alter its meaning and jeopardize the validity of the question’. In other words, adding an image or a narrative scene to gamify a question possibly changes the meaning of the question. Whilst there is a long tradition of designing, testing and adjusting measurement instruments until they are considered ‘validated’ (e.g. Wright, 1997), the challenge of measurement error has not yet been systematically addressed for gamified surveys. Keusch & Zhang (2017), rather ambiguously, write that ‘measurement error can either be increased or decreased by introducing gamification in a survey’. (Keusch & Zhang, 2017, p. 151). This ambiguity is further reflected upon in the different viewpoints of opponents and proponents of gamified surveys. Dan & Lai (2013), for instance, argue that gamification shifts the focus of respondents away from the actual task, which is filling in survey questions, to game play in a ‘blithe and play-like atmosphere’ (Dan & Lai, 2013, p. 4376, quoted in Keusch & Zhang, 2017, p. 152). However, proponents argue that a game environment, provided that it is connected to the survey topic, brings people closer to their real-life experiences than written questions will do, and that it invites a wider variety of viewpoints in answering open questions (Turner et al., 2014).
From these reflections we can conclude that the design of a gamified survey should include the full array of gamification (including visuals, rewards, tasks and narratives that are all perceived as relevant) and that the moments of data collection in the game should be piloted and tested to assess their validity. This still leaves the subsequent question as to how to actually go through the work and decisions of designing a survey game. In other words: how do those involved in designing and producing gamified surveys struggle and deal with challenges of respondents’ engagement and validity of research data in practice? Turner et al. (2014) describe how practical constraints like time and money affected the design of their survey game necessitating decisions about, for instance tradeoffs between engagement and methodological rigour. These are, of course, constraints and consequence that are not unique to designing a gamified survey. Practical constraints also hold for more traditional methods of data collection, but in a gamified survey, like in other design methods, there is at least one other stakeholder who takes part in these discussions and decisions, which is the game designer. In many situations, there is also a third stakeholder in the form of a commercial or societal commissioning party. The design and production of a gamified survey is therefore often a multi-stakeholder process, with all the connected negotiations between actors and their various backgrounds, various concerns, various normative positions and various levels of autonomy and agency operating in the process. Whilst these negotiations have been theoretically well elaborated in science and technology studies (especially in actor network theory) or innovation theory (captured in the concepts of the triple and quadruple helix), their actual and practical manifestations in real-life cases have been much less examined. A noticeable exception, especially for the purpose of this paper, is the thick, historical description of the ideas, conflicts and obstacles surrounding the building of the data dashboards of the municipality of Dublin (Kitchin et al., 2015). Kitchen and his co-researchers followed an almost forensic method to trace all the actors, interactions and motivations that influenced the data and indicators that were included in the final dashboard. They were thus able to come to an analysis of the everyday and office ‘politics’ through which the dashboard eventually took shape. This is the method we will follow in this paper as well, by tracing how the negotiations between the stakeholders affected the design decisions for the gamified survey, articulating, in the end, both the social and epistemological potential of the gamified survey.
Approach and Sources
We analyzed the design and production process of a gamified survey, the various concerns and interests that the stakeholders (researchers, designers, commissioners) brought to the table and their impact on the engagement and knowledge potential of such a research tool. We asked and assessed how they come to their decisions; how they account for them; and how these (might have) affected the design and the possible outcomes of the survey. To answer these questions, we conducted an (auto-)ethnographic study of the design and development process, which took place between May and October 2018. This process was organized according to the so-called ‘agile’ method, meaning that in consecutive ‘sprints’ (i.e. intensive co-creative working sessions), various aspects of the gamified survey were iteratively designed, developed and tested with members of the target audience. The design team consisted of three researchers and the academic director of the Leiden-Delft-Erasmus Centre for BOLD (Big Open and Linked Data) Cities; and the CEO and the CTO, one creative director, one project leader, two UX designers, two illustrators, two developers, and one sound designer/data scientist from the game design agency. We held weekly meetings with the whole team to discuss progress and issues, and irregular meetings in sub-groups on sub-themes. One executive and one project leader of the Dutch Weekend of Science, who commissioned the research, reflected on the design after each sprint. The BOLD Cities researchers functioned as co-designers as well as embedded action-researchers and participant observers. We built an archive of stakeholders’ email correspondence and filed comments, concerns and designs through Google Docs, a designated Slack-channel (#bold-cities-game) and a Trello to-do page. We made a special point to keep notes and logs of the discussions and challenges we considered to be crucial for the actual result of the process. We used this material to reflect on a number of ‘critical moments’ in the collaboration in which different interests collided or conflicted. These are - our pitch to the Dutch Weekend of Science, which selected our gamified survey as their research showcase for the general public; - the selection of the design agencies that we invited to tender for the gamified survey; - the transformation of the research questions into game elements; - the gamification of the survey as a whole; - the dynamics of collaboration; - our conversations with legal and technical staff at our university.
In the following section, we describe and analyze decision-making and its (potential) impact for each critical moment of the gamified survey. We then discuss the launch of the survey and its quality as an instrument for data collection.
Making the Gamified Survey
Pitching a Gamified Survey to the Dutch Weekend of Science
Every year the Dutch Weekend of Science promotes a specific online research project that aims to examine a particular social or scientific issue or development that affects the Dutch population. The alluring prospect of attracting over 10,000 respondents, as previous editions of the research projects managed to do, made us eager to pitch for this opportunity. Besides contributing to our scholarly objectives, this platform would significantly support the realization of our academic impact targets, on which we are evaluated.
The LDE Centre for BOLD Cities pitched a gamified survey, called Jouw Buurt Jouw Data (Your Neighbourhood Your Data) to produce a lively and entertaining investigation into the privacy concerns and the behaviour of citizens in the smart city. The Weekend of Science chose our proposal as closest to their own objective of informing the general public on significant scientific and technological developments. What certainly helped was that we ourselves had a significant budget to invest in the project, from university funding and from the municipality of Rotterdam, which funds our work about data literacy and citizen engagement in the smart city. The Weekend adopted the project on the condition that we would design the survey in such a way that it would attract and be appealing to both older and younger members of the public, to less literate and also to rural publics (despite the smart city topic). We agreed to use visuals and a mode of address that would meet these conditions.
Selection of a Design Agency
As the budget of the project for the design of the gamified survey would exceed €50,000, Dutch procurement law obliged us to invite minimally three agencies to pitch a design, technical specifications and a budget for making the research tool. Given our close connection with the city of Rotterdam, we chose to invite Rotterdam based agencies: a well-known game developer; a successful marketing and communication firm; and a research-driven interaction design company. Although the first company had the most experience in game mechanics and the best ideas how to keep respondents engaged, we did not select them. Their storyline was based on a catching a hacker, which we thought would be helpful in informing respondents about the risks of urban datafication but which also would nudge our respondents beforehand to become protective of their data. Our aim was instead to find out how people handle their data in everyday unreflective situations. The second agency proposed to attract participants via a campaign with comical influencers. We did not select them either, because we did not expect the recruitment of participants to be an issue, based on the fact that previous Weekend of Science projects had drawn well over 10,000 participants. We also felt that more mature respondents would be less well addressed by young influencers, and we feared that their jokes would lead the participants to be less serious in doing the gamified survey.
Their idea of the third agency was that respondents could explore virtual neighbourhoods from a first-person perspective on their laptops and tablets, which would be close to their experiences in real life. The initial proposal was to use the Google Maps API to construct virtual city tours. However, practical considerations (following from the complexity and inflexibility of working with the API) and budget constraints made this agency propose to work with an award-winning illustrator. We were convinced by the vendor’s argument that illustrations would allow us to be in full control of the content and to be able to visualize whatever we required. 3 This helped us also to create a hybrid urban-rural municipality and thus comply with one of the Weekend’s requests.
Transformation of the Research Questions into Game Elements
In a deliberative, iterative, creative process, researchers and designers collaboratively worked to gamify our research on citizens’ knowledge, privacy concerns and behaviour regarding smart cities, both to inform as broad an audience as possible on the topic of smart cities and to motivate them to provide us with as valid and reliable data as possible. We tried to collect socio-demographic independent variables by having respondents construct an avatar with pre-given visuals. However, quite early in the design process we realized that the construction of an avatar could invite all kinds of cross-dressing and identity play, resulting in less valid and reliable data about these characteristics. Moreover, due to financial constraints the avatar could not be made visible in the actual game play of the survey, which made several participants who tested the survey in its early stages respond that they did not see the point of designing the avatar. However, as we figured that avatar-creation would stimulate at least some respondents to immerse themselves in the virtual smart city we designed, we decided to leave it in the game anyway. We added a short sequence of written questions about gender, age, education and residence to motivate them to sincerely provide the socio-demographic data we sought.
Our dependent variables concerned what people know about smart cities, what their concerns about their personal data are, and if and how they actually share their data in real-world situations (privacy behaviour; see Figure 1). Causal model to explain privacy behaviour in smart cities.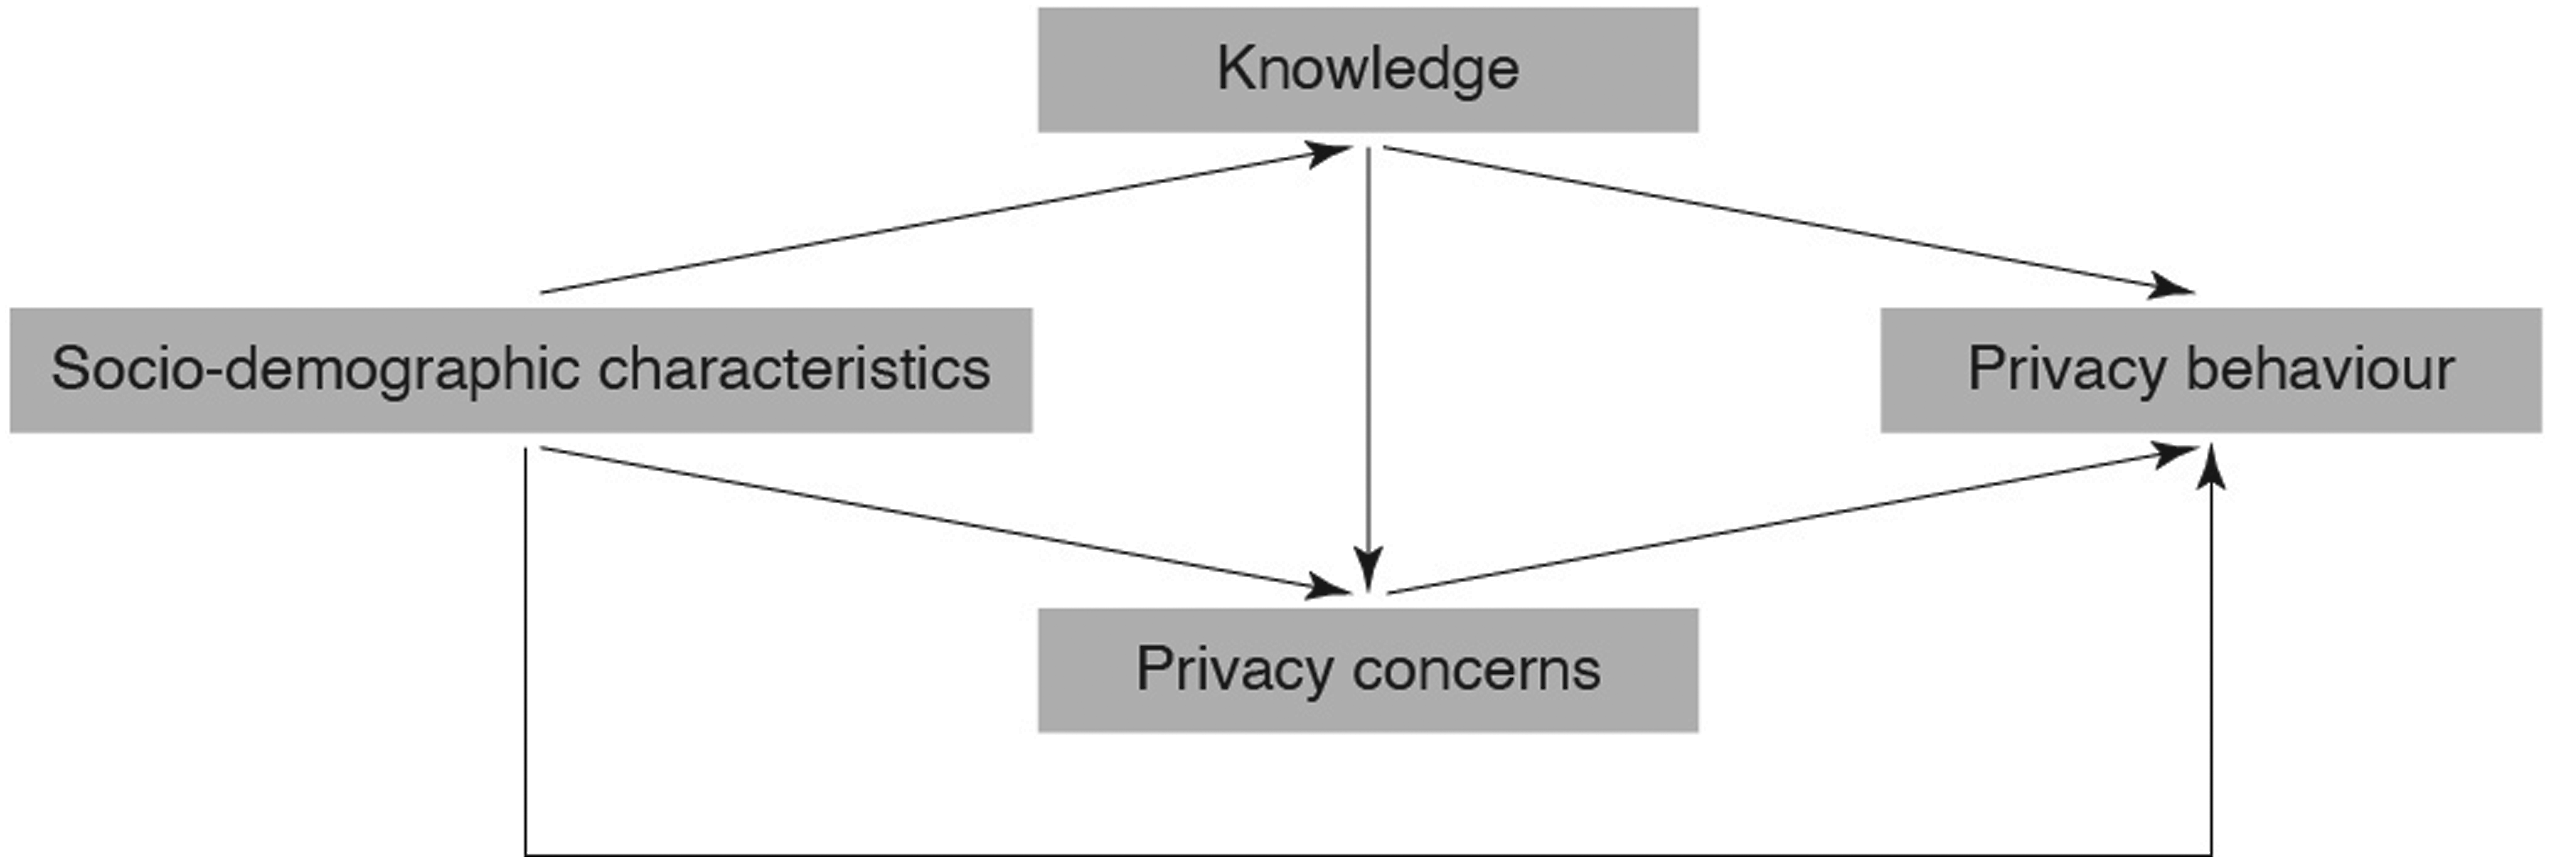
Knowledge
To assess respondents’ knowledge on smart cities, we followed the logic of our live data walks in which participants are asked to identify ‘data points’ (such as Wi-Fi trackers or surveillance cameras) and reflect on them. We assumed that we could measure respondents’ knowledge about the smart city in the survey game by presenting them with two scenes in which they had to search and click on a maximum of 10 data points per scene. We tried to integrate these as naturally as possible in a scene of a park and a square in our virtual smart city (Figure 2). We chose the data points on the basis of what we find during our data walks (see Appendix A for the complete list). To be able to control for people clicking randomly, we included 10 ‘non-smart objects’ in each search scene. Search pictures (illustration by C. Vercesi; We Are Reasonable People).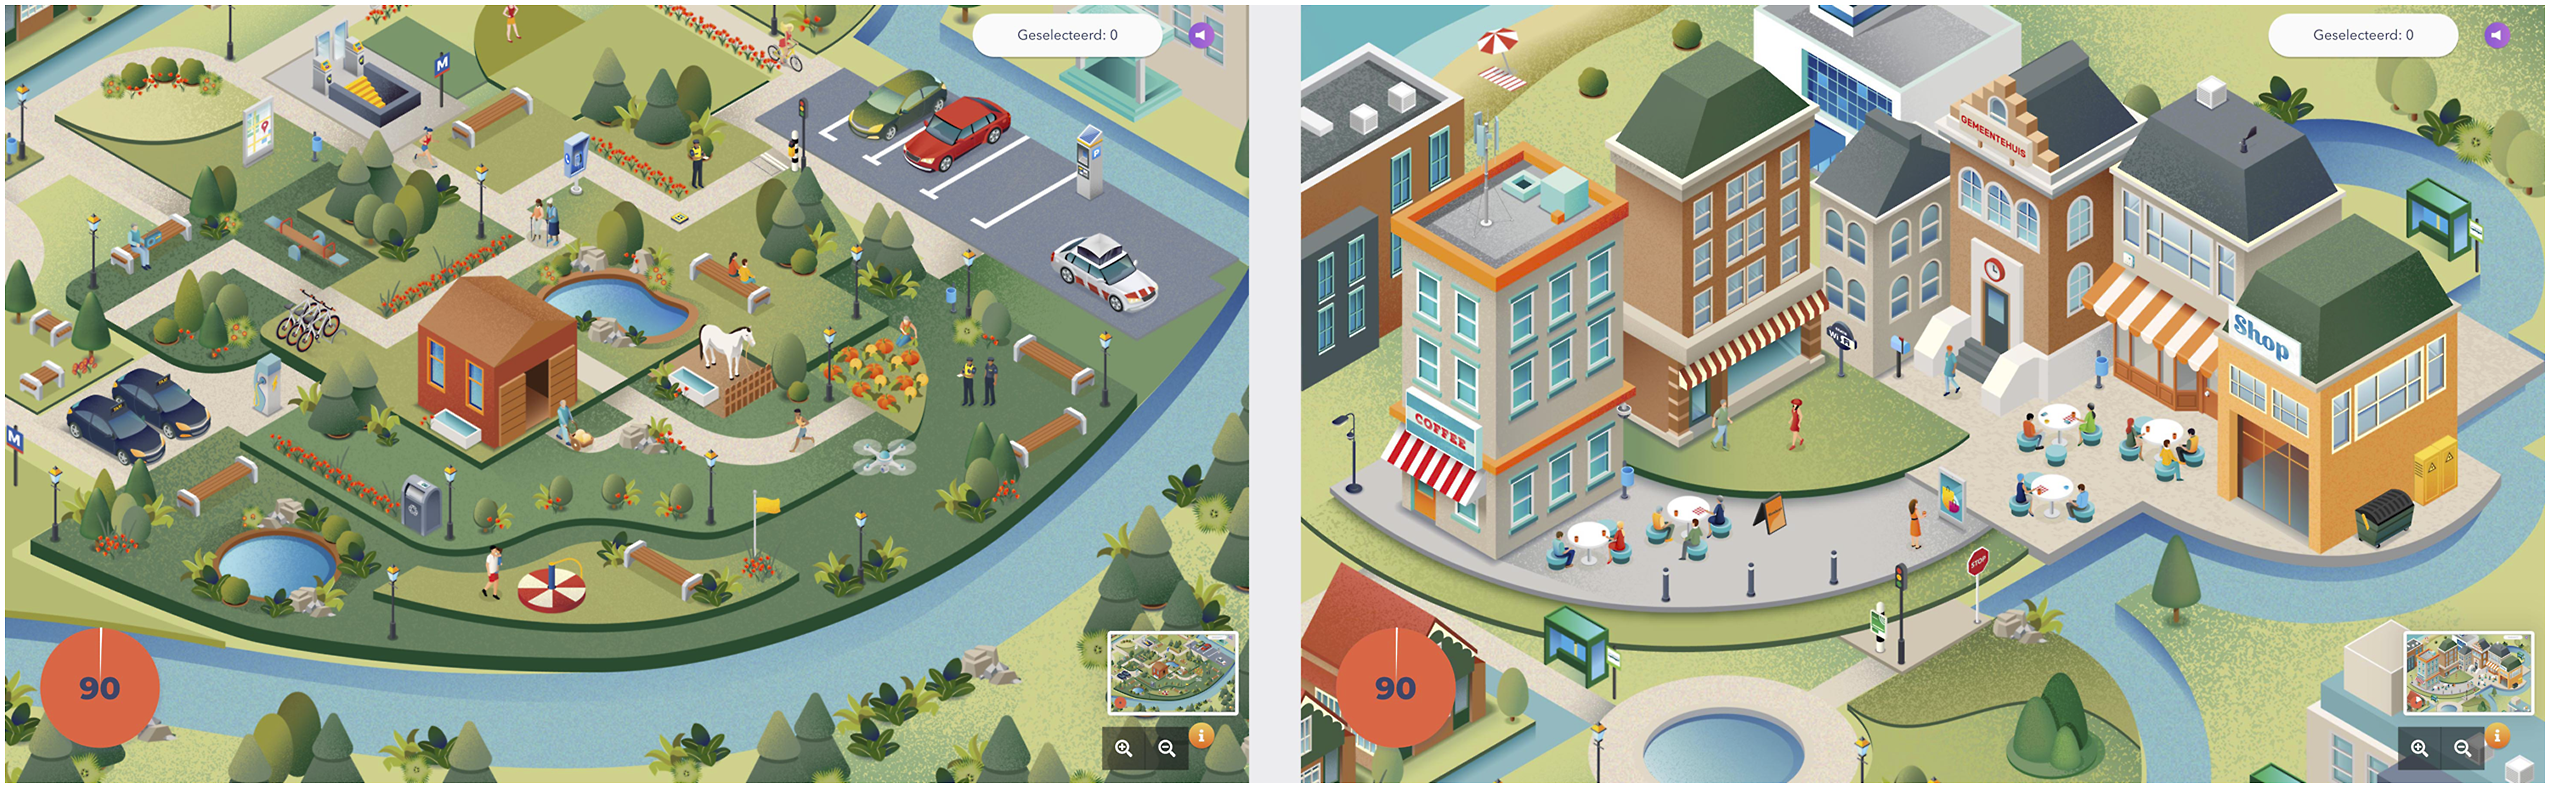
However, the design of the search pictures might have affected the data we collected on respondents’ knowledge of smart cities. We considered that ‘data points’ is a term our respondents would not immediately understand. Based on the responses during early tests, we concluded that many instantly thought they had to identify CCTV cameras and that many did not directly think of environmental sensors, mobile phones and public institutions as data points. Although this caused us to write explicit instructions of what they should be looking for in the search pictures, we learnt from events during the Weekend of Science, where people could play the game on public consoles, that most of the younger participants started searching and clicking without having read these instructionsthoroughly.
Respondents were assigned the task of identifying 10 data points within 75 seconds. Initially we did not intend to inform them on the maximum number of items that could be found in order to be sure that they actually did recognize the ones they selected. However, the developers of the game convinced us, based on their user experience expertise, that it would add to respondents’ engagement and motivation to provide them with a more specific task and goal.
Concerns About Personal Data
We chose to use Westin’s (2003) work about privacy concerns to measure the concerns of our respondents, the main reason being that Westin’s three questions and the resulting scale have been validated in earlier research, and that these would help us to add to an existing body of empirical work. However, precisely this motivation made it difficult to gamify these questions as any type of visualization or additional narrative would undermine their validation. We therefore decided to ask the Westin questions as textual intermezzos in the otherwise visually and narratively designed gamified survey. At three points, therefore, the gamified survey deliberatively had the look and feel of a standard survey.
Privacy Behaviour
We wanted to incorporate two intensively discussed aspects of privacy behaviour, privacy calculus and the privacy paradox. Privacy calculus concerns the conception that people assess a tradeoff between giving up their personal data for financial, security, convenience, social or other types of benefits. The privacy paradox concerns the discrepancy between people’s expressed concerns about their privacy and their actual data sharing behaviour. These two elements of privacy behaviour have been extensively discussed and explained related to, among other things, assessment of risks; the immediacy of the benefit; recent coverage of privacy and data-related subjects in the media; and respondents’ recent (negative) experiences with privacy issues (cf., Acquisti & Grossklags, 2003; Kokolakis, 2017; Wilson & Valacich, 2012). However, several pragmatic reasons (finances, duration of completing the gamified survey, disturbance of the game visuals and narratives, expected statistical challenges) made it impossible to also measure the range of explanatory variables that have been identified in these research projects. As a consequence, we therefore focused on the design of eight visual micro-narratives (scenes) in the gamified survey where respondents would arrive at a particular place or in a specific situation where they would be asked for personal data in exchange for convenience, financial, security or social benefits (see Figure 3 for an example; see Appendix B for the complete list). Respondent is asked to have her/his ID copied in order to be admitted to an event space (illustration by C. Vercesi; We Are Reasonable People).
In retrospect, it is clear that some types of questions were easier to gamify than others. Questions that require a thought (e.g. what do I think about data sharing) seem less easily gamified than questions that ask respondents to act (recognizing a data point; deciding to share data). The knowledge questions and the privacy behaviour question could be easily and convincingly transformed into, respectively, a search and click exercise and a number of real-life scenes about sharing data that respondents had to ‘play’. Along the way, we questioned whether we ultimately were measuring what we intended to measure. For example: when respondents chose the option to use a personal or an anonymized travel card, would they do so out of convenience, or for alleged financial benefits? The socio-demographic features were also difficult to gamify without loss of validity and reliability; this held for the attitudinal questions about privacy concerns as well. Whilst these challenges could possibly be attributed to a lack of finances and creativity of the design team, our own preferred reflection entails that in some cases gamification is unnecessary and contrived or simply not suitable for the concept at hand. Either way, in this particular project both researchers and designers experienced that, despite intensive tests and consultations, they lacked proof or certainty that respondents would interpret the designs they made in order to have them ‘experience’ specific aspects of the smart city in the way they were intended.
Moreover, there were pressures from the Weekend which kept emphasizing that the survey should not take too long (they pushed for 10 rather than 15 minutes); that it should not contain too much written text; that texts should not be too complex. The stakeholders were concerned to not lose the target audience’s (the general public’s) interest and to make it doable for people with lower education and for children starting from age 10. They challenged us to leave words such as privacy profile, public space, badge and Wi-Fi tracker out of the survey. Whilst their comments did help us to shorten our texts and to make them more understandable, we also felt that, as a result, the preciseness and exactness of our measurement were compromised. Most particularly, the Weekend did not want us to use the word ‘city’ in our gamified survey as they felt that such could possible alienate non-urban respondents and visitors of the Weekend; for a research centre like ours that focuses on ‘smart cities’ this was a hard compromise.
Gamifying the Survey
Turning questions and variables into game elements does not itself produce a gamified survey. We also needed a narrative, an element of play and competition and rewards. The narrative was that of a person visiting an unknown city and meeting places and people. The play element was designed by awarding badges for each part of the city they visited. The most important element, both from a respondent engagement and a scientific empirical perspective was the final reward for completing the gamified survey. Having reached the end of the survey, respondents were presented with an overview of the data points they (could have) identified and the instances in which they (could have) shared personal data. From these two dimensions we built a simple algorithm that classified our respondents as one of four types, depending on how they scored on each dimension: a ‘generous data sharer’, being a person identifying more than half of the data points and sharing personal data in more than half of the cases; a ‘frugal data sharer’, being a person identifying more than half of the data points and sharing personal data in less than half of the cases; an ‘unsuspecting data sharer’, being a person identifying less than half of the data points and sharing personal data in more than half of the cases; and a ‘aloof data sharer’, being a person identifying less than half of the data points and sharing personal data in less than half of the cases. The respondents would get an image with text saying, for instance: ‘You are a Generous Data Sharer! You identified quite a few places where data is collected. Although you indicate that you are very concerned when it comes to sharing personal data, in practice you do not seem to be very worried about whether you share your personal data and how it is used’.
Collaboration
The actual collaboration between the commissioning Weekend of Science, researchers and the design agency started in June 2018 immediately after the agency was selected. The project had to be finished within 4 months, by the end of September. The deadline was strict, as the gamified survey had to be launched in the Weekend of Science which takes place during the first weekend of October.
The project was planned in four phases: Research, Conceptualization, Development and Validation. The Development phase in particular turned out problematic. It took place in four so-called ‘sprints’, in each of which a part of the gamified survey was built. In each of these sprints, user-tests were included which would inform the next sprint. Ideally, by the end of each sprint, the team would conclude about the next course of action for all makers involved. In practice, however, this worked differently, as an example illustrates. The team as a whole had decided that having a personal avatar who would walk through the city would be engaging for respondents. Although Chung et al. (2007) found no proof for this assumption, Adamou (2019, p. 61–62) suggests that providing respondents with the opportunity to create an avatar ‘could help participants [in a gamified environment] behave as their true selves’. 4 The idea was that respondents could compose a personal avatar with which they would navigate through the streets, parks and squares of our gamified survey. They would be enabled to select a figure’s gender, skin colour, hairdo, wardrobe and accessories. However, the illustrators spent so much time on visualizing the various elements of the avatars and missed, as a result, every deadline to test if respondents understood and liked avatar-creation. Moreover, their focus on detail taxed the budget by making it possible that the avatars would actually move (in isometric projection) with the respondents through the virtual neighbourhood. Finally, the amount of detail made it impossible that the avatars would have worked in the standard browsers of respondents. Whilst we, as research team, did recognize the aesthetic merit in the designs, we were frustrated by the lack of attention to other requirements for the avatar and the neglect for the overall set of requirements that kept expanding based on insights we developed during the process of researching, designing and testing. The designers, on the other hand, became frustrated with what they considered to be an ever-increasing list of demands from the research team. The closer we approached the launch of the project, the more problematic these tensions became until, finally, the illustrators withdrew from communicating with the rest of the team to meet the deadline, as they explained. The agency’s project leader allowed this, and thus cut off the research team from a number of important design decisions. In the end, the first-person perspective in the game and hence the ‘data walking’ character was sacrificed, as was the adaptability to different devices (particularly tablet and mobile) and browsers other than Firefox, Safari and Chrome.
In retrospect, we recognize that all involved lacked experience in collaborating in such a complex, multi-stakeholder project, or underestimated it. Caught between the organizational culture of the design agency and the demands of the Weekend on the one hand, and our pursuit of methodological rigour on the other, we probably spent too long negotiating and trying to find compromise and consensus. We would have done better if we had issued stricter requirements and more definitive responses during the process. However, whilst doing research one inevitably develops insights one could not have had beforehand. The design agency, on the other hand, may have respected the autonomy of their creative staff too much and were thus not able to meet the needs of the research team and the Weekend. Professional experience of the participants who were all relatively young, could have mitigated some of these problems. Underlying these tensions, however, was a somewhat naive assumption that working in collaborative design sprints would automatically produce shared solutions and directions, and does not need clear and (if necessary) authoritative interventions. With the benefit of hindsight, we recognize that the ideology of self-organization and agile development that we all adhered to neglects issues of complexity, leadership and appropriate management – an issue that has been raised in the relevant management literature as well. Veneziano et al. (2014, p. 2), for instance speak of a ‘myth’ of agile working and write that an ‘over-reliance on what has become mainstream practice appears to have impaired critical assessment of whether the specific context (a project, a case study, a problem, an organization etc.) would benefit more from a less commonly used approach’.
Legal and Ethical and Bureaucratic Boundaries
There were a number of ethical and bureaucratic factors that also affected the design of our gamified survey. As standard in academic research with human subjects, we acquired ethical consent from the ethical committee of our university. In addition, Dutch and EU law required us to explicitly inform respondents about the purpose of the research, to ask their consent to use their input for pre-defined research matters, and to take specific measurements for the storage and use of data in order to guarantee respondents’ privacy. Hence, we had to ask participants a series of questions before they entered the gamified survey, such as their age and, for respondents under 16, whether their parents or caretakes gave them permission.
During an early test, respondents mentioned that they would find it invasive when being asked for their postal code, as they felt this could compromise their privacy. Since our purpose to ask for people’s residency was only meant to find out if people coming from urban areas had different privacy concerns and behaviours than people from suburban or rural areas, we chose to let them mention the name of their city or village, leaving us with less detailed location data. In addition, we gave respondents the option not to answer questions for personal information, which meant that we could not include every completed survey in our analysis.
In the wake of the introduction of the GDPR, our university established a privacy office, which informed, assisted and issued procedures to ensure data security. As we contacted the university’s ICT office to host the survey and corresponding data, we received a quote of €10,000 (and €7,000 of yearly recurring costs) for a set of heavily secured servers adding the justification that ‘If you are able to attract 20,000 respondents over the period of a year, then this is ‘only’ €0.50 per respondent’. Besides the fact that we were surprised that we would be charged so heavily for using our own institution’s servers for research purposes, we did not have €10,000 (plus a recurring €7,000) available for this project. As the design and development agency offered a supposedly secure hosting service at 5% of this budget, we gladly accepted this in offer to secure that we could run our survey, that we could contribute to the Weekend of Science’s awareness campaign, and that we could deliver on our academic validation obligations. The data coming from the project have been made publicly available through the national academic data centre DANS.
Launching and Running the Survey
A week before the Weekend of Science, the Dutch Minister of Education, Culture and Science was the first person to officially play the game. This moment was covered by regional and national broadcasters (tv and radio) and online and offline news outlets. The press releases of the Weekend of Science and our university also drew the attention of various media. This was not only important for the researchers and the Weekend of Science – as a means to attract a large audience to the survey as well as to other events of the Weekend – it also helped us to meet our university’s and research centre’s impact and valorization objectives.
During the Weekend itself, members of the research team were present at several locations of the event in order to motivate visitors to play the game. Soon we realized that people enjoyed playing the game and discussing questions and choices with family and friends, rather than completing the survey autonomously. This was great for the objective of informing a wider audience, and spurring public debate on smart cities; however, it compromised the quality and the reliability of the research data. The number of respondents and the number of completed surveys during the Weekend (respectively, 307; 227) and in the first month after the Weekend (respectively, 2,372; 880) did not meet our expectations. Besides that, it turned out that by recruiting respondents via online self-selection, as part of the strategy to cater for an as wide audience as possible, we created a selection bias: primarily young, male, well-educated respondents completed the survey. Hence, we decided to buy a representative sample of the Dutch population with Motivaction, a renowned Dutch marketing research company. This enabled a wider set of background variables to be included, such as respondents’ socio-economic status.
In the end, we were confident that, despite all odds, we ended up with a useful data set and useful outcomes (see Rijshouwer et al.). With a representative sample of the Dutch population (N = 2,039) we were able to test our causal model explaining privacy behaviour from a combination of privacy concerns, knowledge (technical familiarity) and socio-demographic variables (age, income, education). From the data we collected we concluded that, on average, respondents managed to identify half of the data points and were willing to share personal data in half of the situations. They shared their data mostly for surveillance purposes and security benefits. From our multivariate regression analysis we found that respondents’ privacy behaviour was most strongly explained by privacy concerns (see Figure 4): people who were more concerned about their privacy appeared to share less personal data than others. People’s ability to identify data points (knowledge), as well as their age, education and income appeared to have a much smaller effect on privacy behaviour. Respondents’ gender and place of residence did not have any effect on the dependent variables. Multivariate regression model to explain the privacy behaviour regarding smart cities of the Dutch population (Rijshouwer et al.). The significant relations and their sizes are visualized. Solid lines indicate positive effects; dotted lines indicate negative effects.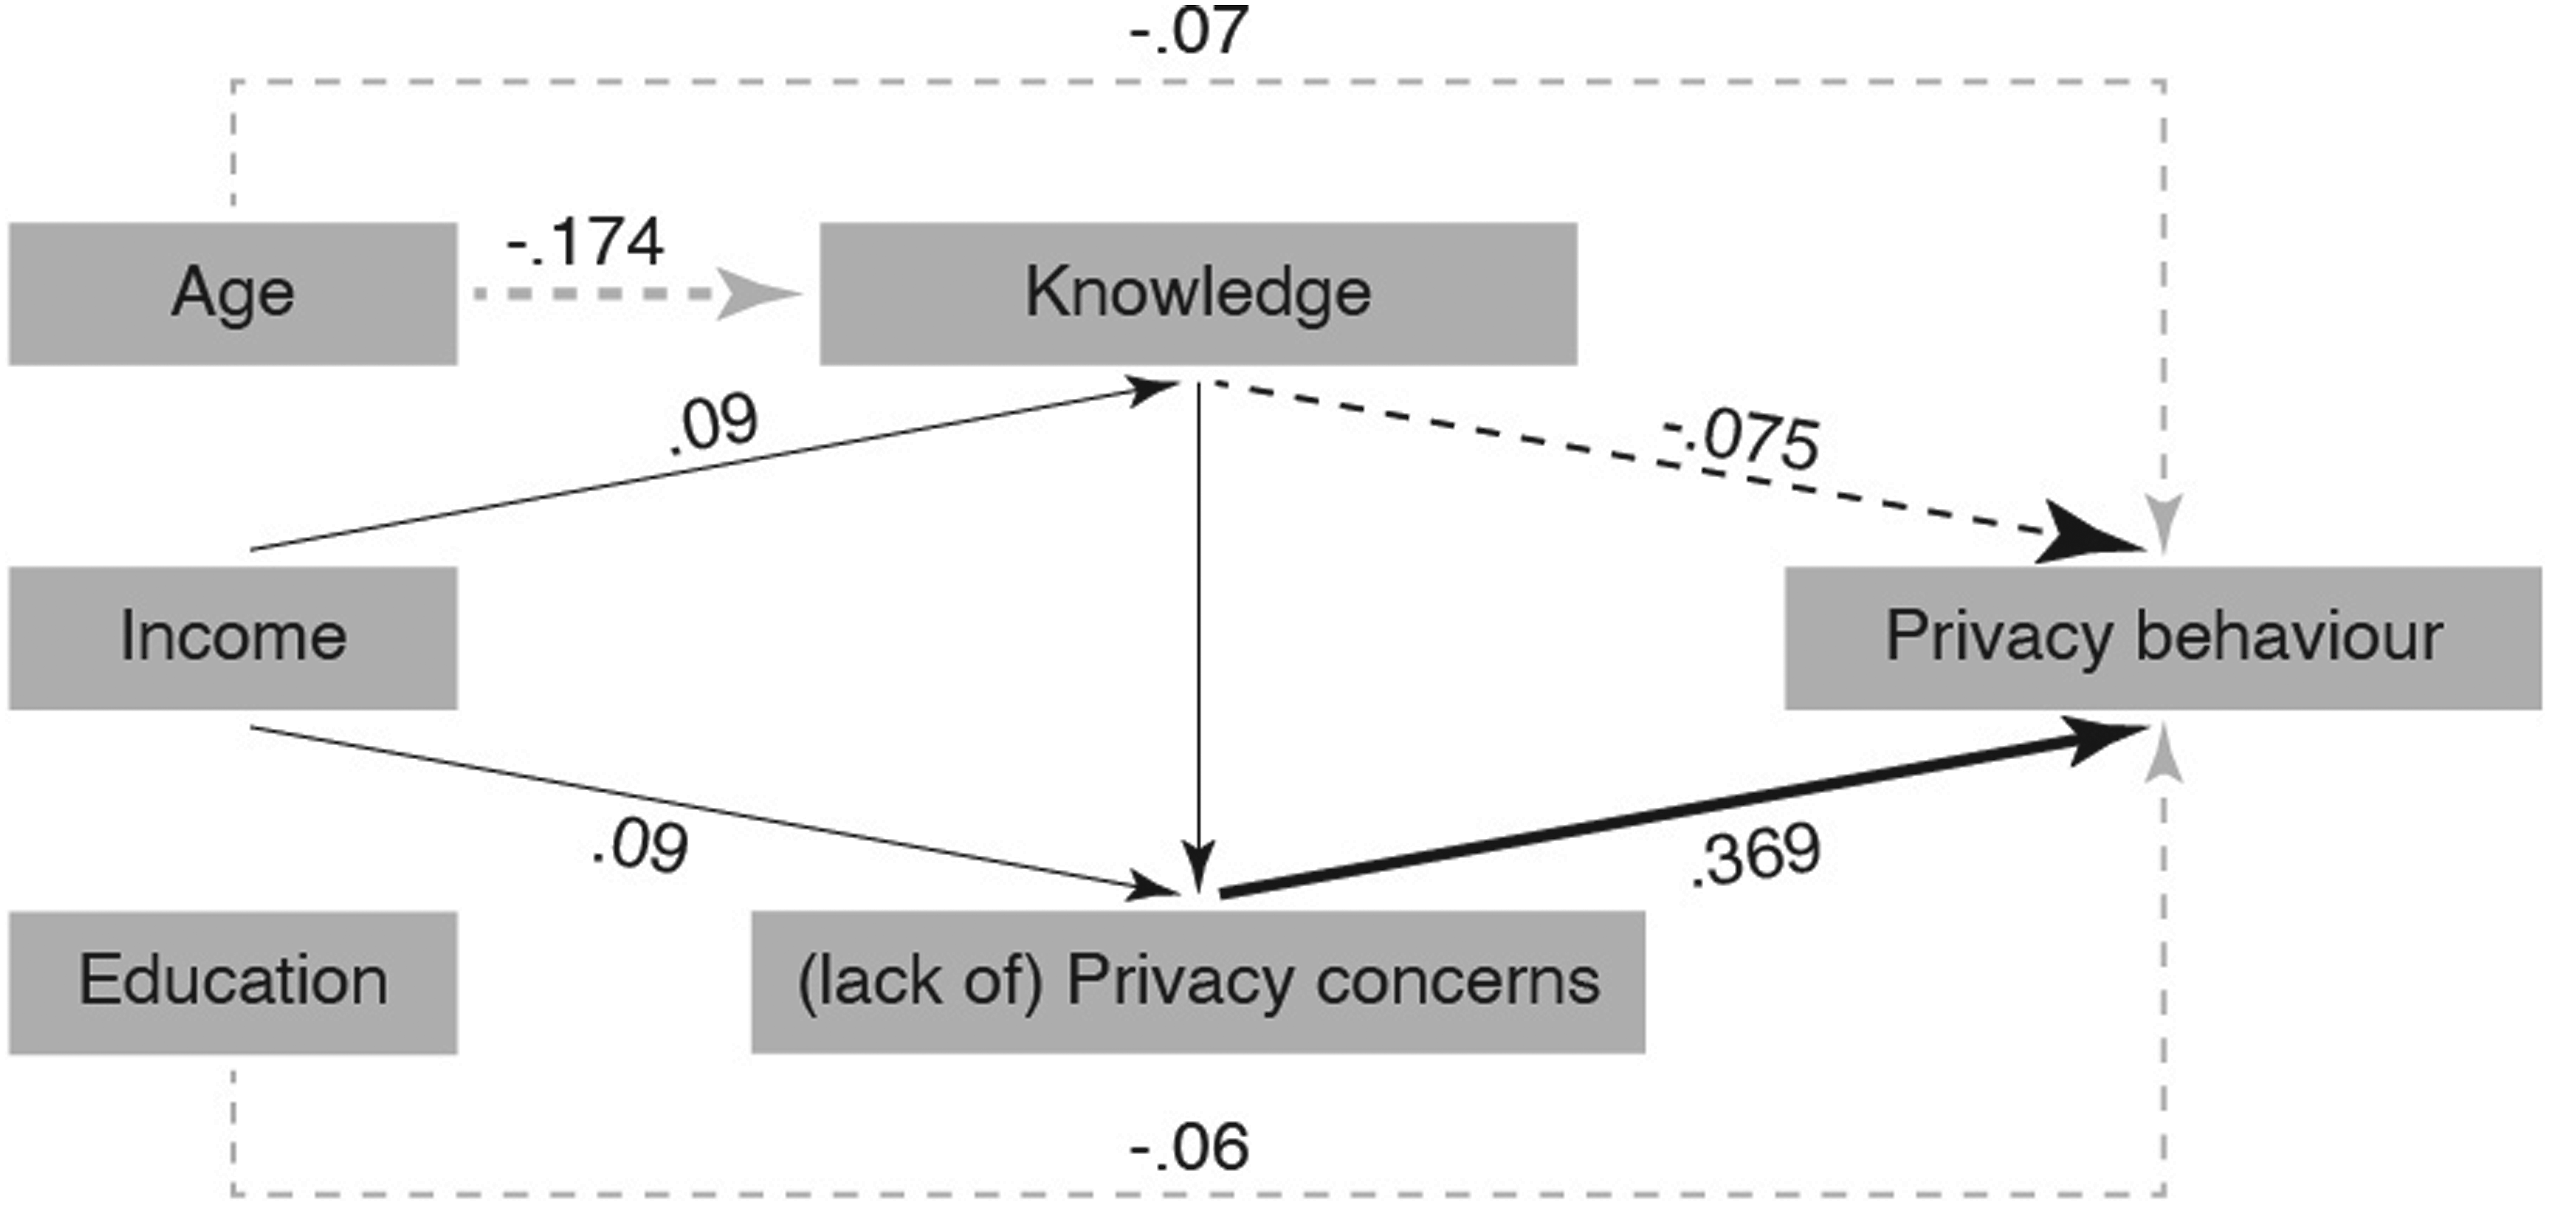
Discussion
This paper presents a theoretical and empirical account of the challenges that manifest in the complex, multi-stakeholder process of designing a gamified survey for smart city research purposes. It demonstrates that in the actual process of making decisions to realize both an engaging as well as relevant research tool, the variety of insights, considerations and concerns of the various stakeholders involved caused continuous tensions, and that the gamified survey is a compromise of pragmatic and epistemological considerations.
We chose to work with a gamified survey for three reasons: firstly, in the absence of a physical smart city in the Netherlands, we needed a convincing representation of a smart city that would confront people with its data dilemmas they are as yet little aware of; secondly to avoid the conundrums of the privacy paradox we needed a scalable method that would come close to their actual privacy behaviour in such a city; and, thirdly, we needed a method that would win the pitch for the Weekend and appeal to a wide majority of inhabitants of the Netherlands. An additional benefit was that working with the Weekend directly satisfied our own institutional assessments of producing knowledge transfer and societal impact. In retrospect, it is clear that the first two of these reasons could have been addressed with more traditional academic means: there are well-used methods to let people think about the potential consequences of seemingly new and invisible technological developments, as there are other better validated ways to examine everyday behaviour. Whether the Weekend would have fallen for another, more traditional pitch is unknown, but the fact that we brought our own funding certainly helped our proposal to win the project. However, it is unlikely that a more traditional approach would have produced a media event that the minister of Education, Culture and Science would find worthwhile to participate in. The resulting publicity was well appreciated by our universities and is likely to have played a role in the continuation of funding for our research centre.
Our summary of the trajectory of designing and executing the gamified survey clearly identifies when and how particular actions and pressures came about that seriously threatened the usefulness of the gamified survey as an academic research tool for understanding smart cities. The first of these occurred when the Weekend asked for a representation of a generic place rather than of a city; the next was that the context of the research as part of the Weekend of Science produced a continuous pressure to shorten survey response time and simplify language. It then became clear that the gamification approach favoured factual and behavioural questions, a limitation we had not encountered in the scarce but relevant literature which focused more on connecting the game to the research topic and including an adequate variety of game elements. Despite the fact that we were aware that design decisions would be political, as that they would impact the engagement of respondents and the validity and reliability of the survey’s outcomes, we ended up in ongoing discussions and doubts regarding how to evaluate each and every element of the game (and hence regarding the quality of the generated data); our somewhat naïve belief in co-creating the gamified survey with researchers and designers working on equal footing was frustrated by a mutual underestimation and lack of experience with complex collaborations; GDPR and academic ethical requirements prevented us from asking detailed background questions; and finally, the context of the Weekend and the live places were people played the gamified survey produced collective answers rather than the individual ones that the survey method assumed. Fortunately, we were able to counter the latter problem by buying a representative sample from a marketing research agency which provided us with valid and reliable data to conduct analysis with.
Our experience with designing and running a gamified survey, in connection with the scarce literature reflecting more generally on gamifying surveys makes us conclude that such a tool is helpful in two ways. Firstly, to engage members of the public with relatively unknown phenomena such as the smart city, and secondly to provide the basis for an empirical understanding of such phenomena that points to directions for deeper probing. In the end, our outcomes have produced sensitizing concepts for further discussions with various kinds of respondents through the use of focus groups or individual interviews. More generally, the account of this research design process helped us shine a light on the politics of designing and developing a gamified survey.
Footnotes
Acknowledgements
The authors would like to thank all involved in the process of designing the survey; the Dutch Weekend of Science for their support; and the anonymous reviewers for their valuable comments.
Declaration of Conflicting Interests
The author(s) declared no potential conflicts of interest with respect to the research, authorship and/or publication of this article.
Funding
The author(s) received no financial support for the research, authorship and/or publication of this article.
Availability of Data and Materials
Data and materials are available on request.
Notes
Data points in the search pictures.
Data Points and Non-Smart Objects in Search Picture 1. Data Points and Non-Smart Objects in Search Picture 2.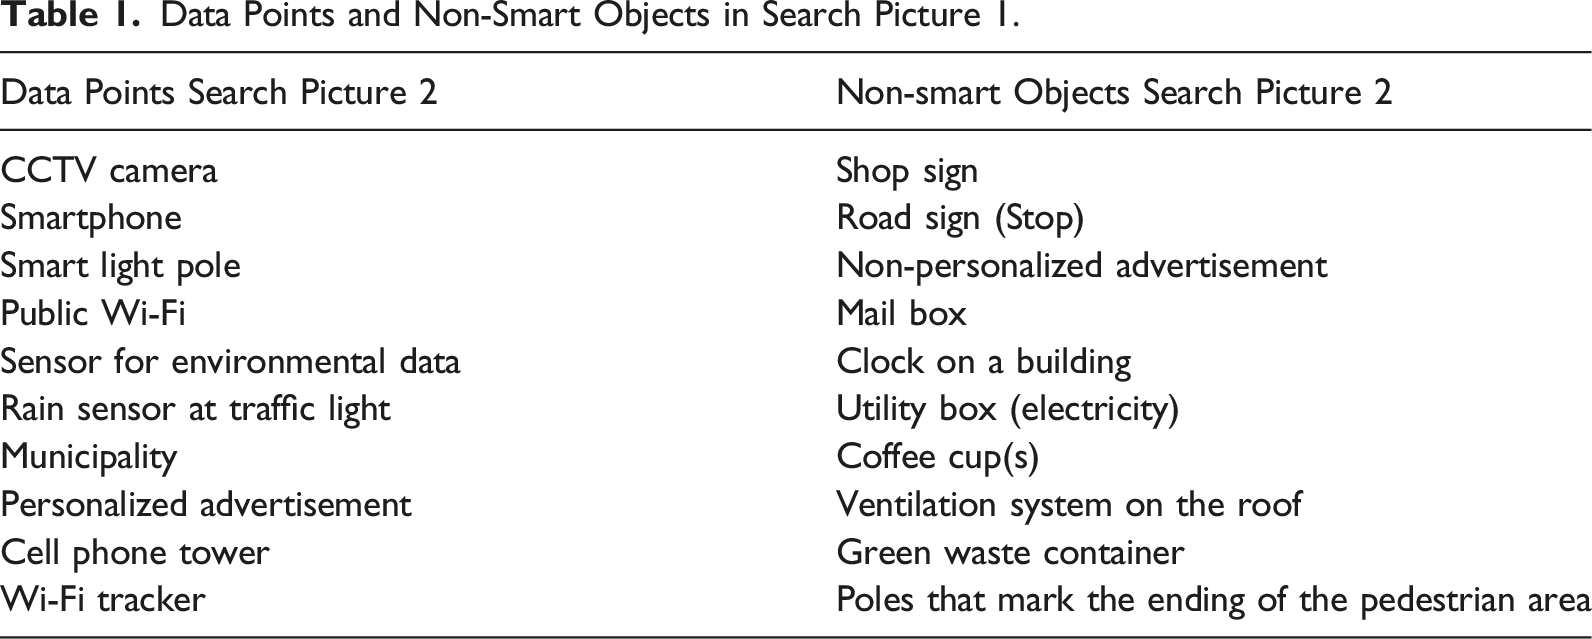
Data Points Search Picture 2
Non-smart Objects Search Picture 2
CCTV camera
Shop sign
Smartphone
Road sign (Stop)
Smart light pole
Non-personalized advertisement
Public Wi-Fi
Mail box
Sensor for environmental data
Clock on a building
Rain sensor at traffic light
Utility box (electricity)
Municipality
Coffee cup(s)
Personalized advertisement
Ventilation system on the roof
Cell phone tower
Green waste container
Wi-Fi tracker
Poles that mark the ending of the pedestrian area
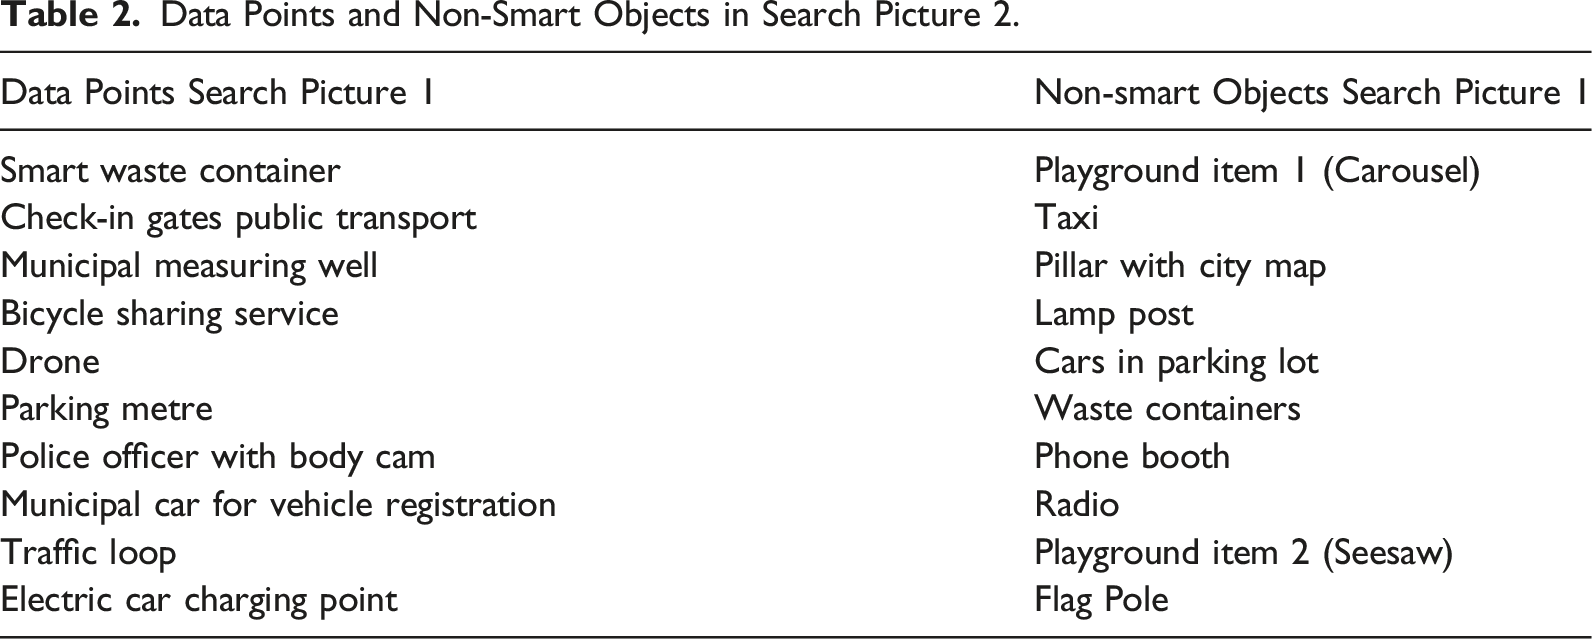
Data Points Search Picture 1
Non-smart Objects Search Picture 1
Smart waste container
Playground item 1 (Carousel)
Check-in gates public transport
Taxi
Municipal measuring well
Pillar with city map
Bicycle sharing service
Lamp post
Drone
Cars in parking lot
Parking metre
Waste containers
Police officer with body cam
Phone booth
Municipal car for vehicle registration
Radio
Traffic loop
Playground item 2 (Seesaw)
Electric car charging point
Flag Pole
Data sharing in the survey game.
Data Sharing in the Survey Game.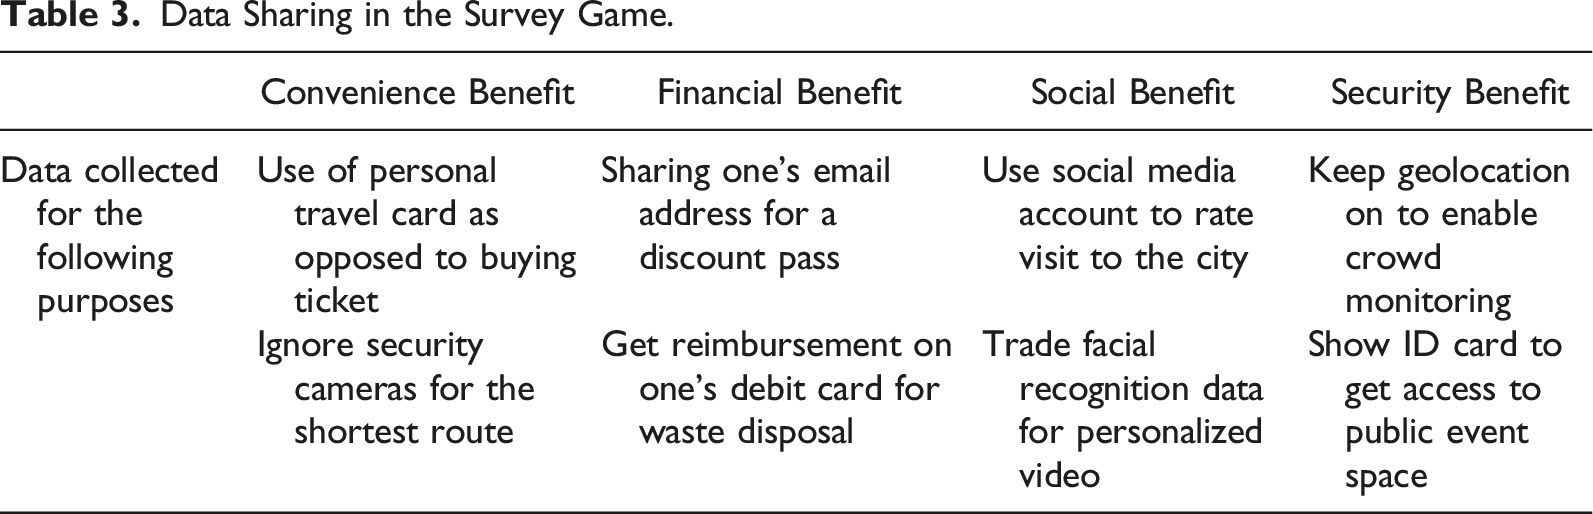
Convenience Benefit
Financial Benefit
Social Benefit
Security Benefit
Data collected for the following purposes
Use of personal travel card as opposed to buying ticket
Sharing one’s email address for a discount pass
Use social media account to rate visit to the city
Keep geolocation on to enable crowd monitoring
Ignore security cameras for the shortest route
Get reimbursement on one’s debit card for waste disposal
Trade facial recognition data for personalized video
Show ID card to get access to public event space