
Abstract
Background and purpose:
The COVID-19 pandemic has posed considerable challenges to people’s mental health, and the prevalence of anxiety and depression increased substantially during the pandemic. Early detection of potential depression is crucial for timely preventive interventions; therefore, there is a need for depression prediction.
Data and methods:
This study was based on survey data collected from 5001 Norwegians (3001 in 2020 and 2000 in 2021). Machine learning models were used to predict depression risk and to select models with the best performance for each pandemic phase. Probability thresholds were chosen based on cost-sensitive analysis, and measures such as accuracy (ACC) and the area under the receiver operating curve (AUC) were used to evaluate the models’ performance.
Results:
The study found that decision tree models and regularised regressions had the best performance in both 2020 and 2021. For the 2020 predictions, the highest accuracies were obtained using gradient boosting machines (ACC = 0.72, AUC = 0.74) and random forest algorithm (ACC = 0.71, AUC = 0.75). For the 2021 predictions, the random forest (ACC = 0.76, AUC = 0.78) and elastic net regularisation (ACC = 0.76, AUC = 0.78) exhibited the best performances. Highly ranked predictors of depression that remained stable over time were self-perceived exposure risks, income, compliance with nonpharmaceutical interventions, frequency of being outdoors, contact with family and friends and work–life conflict. While epidemiological factors (having COVID symptoms or having close contact with the infected) influenced the level of psychological distress to a larger extent in the relatively early stage of pandemic, the importance of socioeconomic factors (gender, age, household type and employment status) increased substantially in the later stage.
Conclusion:
Machine learning models consisting of demographic, socioeconomic, behavioural and epidemiological features can be used for fast ‘first-hand’ screening to diagnose mental health problems. The models may be helpful for stakeholders and healthcare providers to provide early diagnosis and intervention, as well as to provide insight into forecasting which social groups are more vulnerable to mental illness in which social settings.
Introduction
The COVID-19 pandemic has majorly impacted our lives. The pandemic’s devastation has had a marked effect on people’s mental health, leading to higher levels of anxiety, psychological stress and depression. A meta-analysis found that, during the early stages of the pandemic, the prevalence rates for stress, anxiety and depression were as high as 30% in the general population (Salari et al., 2020). Increases in psychological distress and mental illness have been documented after the pandemic struck. The prevalence of depression in China at the peak of the pandemic in 2020 was 20.4%, compared with a 4% prevalence in 2019 (J. Li et al., 2020b). In Norway, the prevalence of depression was three times higher than in pre-pandemic times (31% vs. 10%) (Ebrahimi et al., 2021). The mental health situation has not improved in the second year of the pandemic; according to the U.S. Centers of Disease Control and Prevention, more than 40% of adults reported symptoms of anxiety or depression between August 2020 and February 2021 (Vahratian et al., 2021). In the UK, four in 10 young women (43%) experienced depressive symptoms in 2021 (Williams et al., 2021).
Depression was identified as the most preventable mental disorder (Muñoz et al., 1996), and its negative impact can be largely improved by early detection and treatment (Halfin, 2007). Therefore, early identification of depression is vital for timely intervention to decelerate the severity of the disease and lessen public health burdens. However, early detection and treatment of mental health disorders are rather limited. Most validated laboratory tests for diagnosing depression in psychiatric research are based on self-reports of one’s mental status, and ‘a common concern on the part of psychiatrists is the fear that numerical assessment is dehumanizing (…) the subject’s individuality’ (Hamilton, 1980). Moreover, some psychiatric information can be less accessible in cases where people are severely ill, and the depression rate has been found to be substantially underreported for certain social groups (Moussavi et al., 2007). Therefore, there is a need to predict depression based on rapid and easily accessible information as a first-hand screening, and social determinants of mental health problems can provide useful information for such predictions.
However, whilst most social determinant studies have examined causal relationships or contributing factors to mental health, relatively few have incorporated the identified social determinants into models that systematically predict potential mental health outcomes. Existing predictive studies on mental health have mostly been conducted in the fields of psychology and psychiatry, with a focus on psychopathological aspects (e.g. Elhai et al., 2021; Prout et al., 2020). Nevertheless, social factors and environmental aspects are key stressors for mental health risks (Allen et al., 2014; Silva et al., 2016). COVID-19 studies have identified several social determinants of mental health problems, including income, work, living situation, demographics, social contact, family support and the practice of prevention measures (see, for example, a review article from Hossain et al., 2020). Studies that integrate social and environmental features to predict mental health may provide valuable insight into forecasting which social groups are more vulnerable to mental illness in which social settings. Such insights can also help in the planning and provision of mental health care and in taking preventive measures.
The current study focuses on the social determinants of mental health during the COVID-19 pandemic and takes the further step of predicting depression in Norway using supervised machine learning. The input features consist of socioeconomic status, demographic background and pandemic-related social epidemiological and behavioural factors. Using datasets from earlier and later phases of the COVID-19 pandemic, we will (1) explore important contributors to depression, (2) select models with the best predictive performance to forecast depression for each phase of the pandemic, (3) rank the importance of input variables in predicting depression and (4) map changes in the rankings between the two pandemic phases considered.
This study aims to contribute to the literature on the social determinants of health in several ways. First, while most previous studies have examined the relationships between certain factors and mental health, the current study contributes to predicting mental health. Using machine learning models, this study incorporates numerous input variables into its analysis and predicts depression based on a wide range of diverse and complex social realities. Second, the predictions of mental health problems in this study focus on social dynamics and people’s behavioural patterns in response to pandemic interventions. Psychological distress can be closely related to social and structural possibilities and limitations of people’s actions during the pandemic. This study considers social conditions, daily praxis, social contact and social support levels, as well as ongoing stressful circumstances and changes in daily life during the pandemic. It thereby provides a comprehensive view of the mental health crisis from a sociological perspective. Third, by classifying depression in different pandemic phases, this study provides insight into changes in variable importance; thus, it can be useful to adjust preventive measures targeting different social groups in different time periods. Finally, unlike traditional sociological studies that are hypothesis-driven, predictive models from machine learning are not solely based on our preconceived expectations. The machine learning models adopt a more inductive and explorative approach that facilitates the exploration of new relationships and the development of new theories.
Theories and Previous Studies
Social Determinants of Mental Health
Sociological studies in health and illness have assessed the role of social circumstances embedded within medical conditions and reviewed social determinants, such as socioeconomic status and environmental factors, that shape one’s mental health outcomes (Allen et al., 2014; Silva et al., 2016). Such an approach emphasises that mental health depends not only on individuals’ personalities or physiological functions but also on social conditions, such as demanding social roles, the level of social support, stressful circumstances and life events (Horwitz, 2009). Therefore, this perspective assumes that individuals with the same circumstances will have similar levels of mental health.
The current pandemic can therefore be viewed as a stressful event that triggers a series of mechanisms that frame diverse peoples’ mental health differently based on the circumstances in which they are situated. Previous literature has identified four groups of societal features that played important roles regarding people’s mental health status during the COVID-19 pandemic: (1) sociodemographic aspects, (2) socioeconomic status, (3) daily praxis and preventive measures and (4) social epidemiological factors. In the following subsections, we will explore how each of the four groups of social determinants contributes to higher levels of anxiety and distress during the pandemic.
Sociodemographic aspects
Sociodemographic aspects, such as gender, age, ethnicity, place of residence and household type, play an important role in predicting mental health status. The link between these factors and mental health can be understood from a life course perspective. Young adults’ and adolescents’ mental health has been threatened by limited social interaction, reduced communication and peer support and increased social isolation during the pandemic (Hawes et al., 2021). In addition to a ‘rite de passage’ with lockdowns and remote learning, the pandemic has also led to higher unemployment among younger people (Fana et al., 2020), resulting in higher levels of anxiety and depression (Varma et al., 2021).
Health consequences are also unequally distributed among men and women and among ethnic minorities and majorities. Compared to men, women have carried a heavier load in childcare provision during the pandemic, have been more likely to reduce working hours and, thus, have experienced a higher level of psychological distress (Zamarro & Prados, 2021). Ethnic minorities also have a substantially higher risk of poor health compared to the majority population (Proto & Quintana-Domeque, 2021). Additionally, minorities are more likely to have a job that is subject to higher infection through contact with others, and they often face higher risks of income loss, financial insecurity and unemployment during the pandemic crisis.
Finally, mental health status has been proven to be correlated with geographic residence and family structures during the pandemic (Grey et al., 2020; Stoye et al., 2020). People living in various residential areas can be differentiated by different interventions and indirectly measure the impact of interventions on anxiety levels. Considering household structure, the pandemic has increased the amount of time people spend at home. On the one hand, living with others can provide support and thus reduce loneliness (Grey et al., 2020). On the other hand, it may also increase the challenge of conducting professional activities from home (Wilder et al., 2020).
Socioeconomic Factors
The labour market structure has been significantly affected by the pandemic. Employment rates fell sharply, work hours were reduced and people with weak attachment to the labour market were most vulnerable to being laid off or losing their jobs (Eurostat, 2020; OECD, 2020). Income loss, as an immediate effect of job insecurity, leads to lower life satisfaction and higher mental distress (Hertz-Palmor et al., 2020). Thereby, constant worries about insecure work situations and low income had a significant impact on mental health during the COVID-19 pandemic (Bakkeli, 2021; Ganson et al., 2021).
People with different occupations were also faced with different levels of mental health challenges. Not all were able to work remotely from home, and many were subject to the risk of infection at work. Some researchers found that essential workers, such as medical staff and healthcare workers, were more likely to report depressive disorders and anxiety compared to other workers (Lu et al., 2020). Others have pointed out that an increased workload and the presence of job-related burnout might have a significant impact on anxiety and depression among healthcare workers (Kang et al., 2020). Among 26,174 surveyed public health workers in the U.S, 53% reported at least one mental health symptom, and the symptoms were more severe among those who had more working hours or less time off from work (Bryant-Genevier et al., 2021).
A growing body of studies has discussed how the work–life balance may impact one’s mental health. As remote work has become more common due to COVID-19, new challenges have also emerged. Employees working remotely have reported longer working hours in addition to juggling work and family responsibilities (Wegner, 2021). Previous studies have reported that compared to people who have achieved work–life balance, those who have often experienced conflict between work and family life are more likely to suffer from clinical mental health problems and depression (Frone, 2000). This also applies to remote work during the pandemic; work–life conflict has been negatively associated with psychological wellbeing and mental health (Bakkeli, 2021).
Daily Praxis and Protective Measures
There is a link between clinical depression and people’s daily experiences (Horwitz, 2009). Such experiences involve the perceptions of the risk situation, the willingness and ability to follow protective measures and the extent to which one sought support and social contact. Infection controls during the COVID-19 pandemic have mainly relied on nonpharmaceutical interventions (NPIs). These measures have substantially changed peoples’ daily routines, normative expectations, and interactive and mobility patterns. People with different experiences and perceptions of situations may adopt different behavioural responses to the pandemic, and different responses may have different psychological impacts on their mental health. For example, perceived health threats moderate social distancing behaviours (Singh, 2020), while the perceived effectiveness of pandemic interventions and compliance with social distancing measures protects an individual from stress, anxiety and depression (Zhao et al., 2020).
Emotional responses to pandemics, such as the fear of being exposed to the coronavirus, are essential for the actions and praxis people adopted. For instance, Harper et al. (2021) found that virus-mitigating behaviour was not caused by political orientation or moral foundation, but by fear of COVID-19. This might explain why the inability to follow preventive measures was shown to increase stress and anxiety levels (Lewis, 2020), and why people who quarantined voluntarily were more like to have depressive symptoms due to fear of the disease (Harris & Sandal, 2021).
Contact-seeking behaviours can also have an impact on mental health status. A longer period of staying at home was correlated with a higher prevalence of depression (Zhao et al., 2020), and social support reduces this risk (Grey et al., 2020). With limited possibilities for mobility, contact through digital tools has become an important means of communication and contact. There might be a correlation between contact-seeking and loneliness – people who feel lonely might be more contact-seeking. However, digital contact facilitates better mental health and wellbeing (Sommerlad et al., 2021), as social contact, whether face-to-face or digital, contributes positively to social relationships and support.
Social Epidemiological Features
Mental health problems are related to a series of epidemiological predictors. Examples of such predictors include whether one was infected with the COVID-19 virus, had COVID-19-like symptoms, belonged to a high-risk group that can become seriously ill from COVID-19, had close contact with someone who contracted the disease, or had someone close who contracted the virus. The disease has been associated with stigmatisation and social disruptions, and having a high risk of being transmitted (or already transmitted) implies stress related to the physical consequences of being ill and fear of severe consequences from the disease (Bo et al., 2021). For hospitalised patients with COVID-19, studies have detected severe levels of stress and depression (Zandifar et al., 2020). Depressive symptoms were also high for people who had suspected or confirmed cases among family members or relatives (G. Li et al., 2020a; Yuan et al., 2020).
Predicting Mental Health Problems
Using social, demographic, behavioural and epidemiological factors previously recognised as having important impacts on mental health, our study aims to explore the use of machine learning for early detection of depression in different COVID-19 pandemic phases. Machine learning applications have gained popularity in health and medical sciences as they offer faster processing to diagnose disease symptoms, advance clinical decision-support tools and improve the accuracy (ACC) of treatment protocols and health outcomes (Chen et al., 2017). Machine learning has been applied to the processing of disease biomarkers in applications such as detecting tumours (Bocchi et al., 2004), diagnosing neurodegenerative diseases (Salvatore et al., 2014), and predicting mental health disorders (Victor et al., 2019).
There have also been an increasing number of studies in the social sciences using machine learning methods with an aim to predict or forecast outcome variables. Unlike traditional sociological studies on health and illness that are often hypothesis-driven, or to investigate the mechanisms linking social factors to health, machine learning models are advantageous in studying social determinants of health and illness because they can effectively detect predictive patterns in the dataset and use large amounts of social variables combined in interactive ways. The use of predictive models makes it possible to explore generative models that reflect societal diversity and complexity, and help to understand the relationship between social circumstances and individual outcomes (Conte et al., 2012).
Theories can be used to guide machine learning model building, and the models can, in turn, contribute to the testing and further development of theories (Radford & Joseph, 2020). The computationally grounded theory approach combines previous knowledge with computational processing power and pattern recognition, efficiently produces theories grounded in producible results. For example, using social networks and feminist theory, Nelson (2020) constructed machine learning models to compare the dense connectivity between feminist communities and explained the rise of the second wave feminism in New York due to the city’s tighter network connections. By testing parameters to validate theory-based hypotheses, Bamman et al. (2014) developed machine learning models to account for the influence of extralinguistic information when identifying literary characters. Using Bayesian networks, Alvarez-Galvez (2016) explained the link between socioeconomic status and self-reported health by exploring various contextual differences, such as welfare regimes in different countries. Using theory-grounded models, machine learning can shed light on both predictions and explanations of social phenomena.
There are relatively few studies that have used only social determinants to predict health outcomes. Several have included psychological factors in their prediction model. For example, using psychopathology, sociodemographic, and exposure variables, Elhai et al. (2021) achieved from 65% to 75% root mean squared error (RMSE) when predicting anxiety and fear of COVID-19 using machine learning models. In another study, Prout et al. (2020) used demographics, emotion regulation and childhood trauma to predict anxiety, depression and post-traumatic stress. They found that the correlations between the predicted values and actual values were 0.71, 0.66 and 0.69, respectively, for the three mental health-related target variables. Therefore, it is interesting to investigate whether predictions regarding mental health problems using socioeconomic and social epidemiological predictors can achieve high performance and ACC, as well as to compare the results based on social factors and results predicted by biopsychosocial features.
This study will first briefly describe the mental health situations among different social groups in Norway. The main analysis will use machine learning models to predict depression in the earlier and later phases of the COVID-19 pandemic and select those models with the best performance for each pandemic phase. Furthermore, we will assess the importance of the contributing factors to depression and map the changes in importance between the two pandemic phases.
Methods
Data
The study used the 2020 and 2021 CorLife survey waves from Consumption Research Norway and the Work Research Institute. The data contained 3001 respondents in 2020 and 2000 respondents in 2021. The baseline data (
Sentio Research Norway and Norstat collected the data. The response rates for the three waves were 41%, 28% and 30%, respectively. The discrepancies were mainly caused by the maintenance of the panel since the consulting firms frequently included new respondents and deleted people who had stopped responding. However, most of the dropouts in such surveys are random. Analysing Norwegian surveys that used the same sampling method as Norstat and Sentio, Hellevik (2016) argued that the sampling methods in collecting survey data were robust, that the nonresponses often happened by chance and that the results based on such data should not be biased.
Variables
The target variable in this study was depression, which was measured by using the Symptom Check-List (SCL-5). The SCL-5 is a five-item scale based on the Hopkins Symptom checklist (HSCL-25). Compared to other indicators of psychological distress and mental health problems, such as SCL-25, the Short Form 36 (SF-36) and the five-time mental health index (MHI-5), the SCL-5 has shown high levels of reliability (Cronbach’s alpha = 0.87), specificity (82% with cut-off = 2.0) and sensitivity (96% with cut-off = 2.0) for capturing mental health problems, such as anxiety and depression (Strand et al., 2003; Tambs & Moum, 1993).
A cut-off point at
We used 55 feature variables to predict depression. Demographics and socioeconomic predictors included age, gender, education, income, size of geographic residence, household types, employment status, occupations and work–life conflict. Behavioural and social epidemiological factors were measured by social distancing behaviours, social contact, protective measures and nonpharmaceutical practices, self-reported disease exposure and corona disease-related risk factors and symptoms. Detailed information about the variables can be found in Supplemental Appendix A.
Analytical Strategy
We applied classification supervised machine learning algorithms with the target and the predictor variables. The wave 1 and 2 surveys were merged to conduct analysis for 2020, and wave 3 was used for analysis in 2021. Analysis for 2020 and 2021 was done separately for each year. For each of the datasets in 2020 and 2021, the entire dataset was then divided into training and test sets. The datasets were then cleaned, merged, recoded and imputed (see Supplemental Appendix B for data pre-processing). For the training set, we addressed imbalanced datasets in the minority class (people who were psychologically distressed) by synthesising a new sample using the synthetic minority oversampling technique (SMOTE). The balanced samples were used to fit different machine learning models. After hyperparameter optimisation and model tuning, we predicted psychological distress in the test set and evaluated the fit and performance of the machine learning models. See Figure 1 for the analytical framework of this study. Machine learning framework.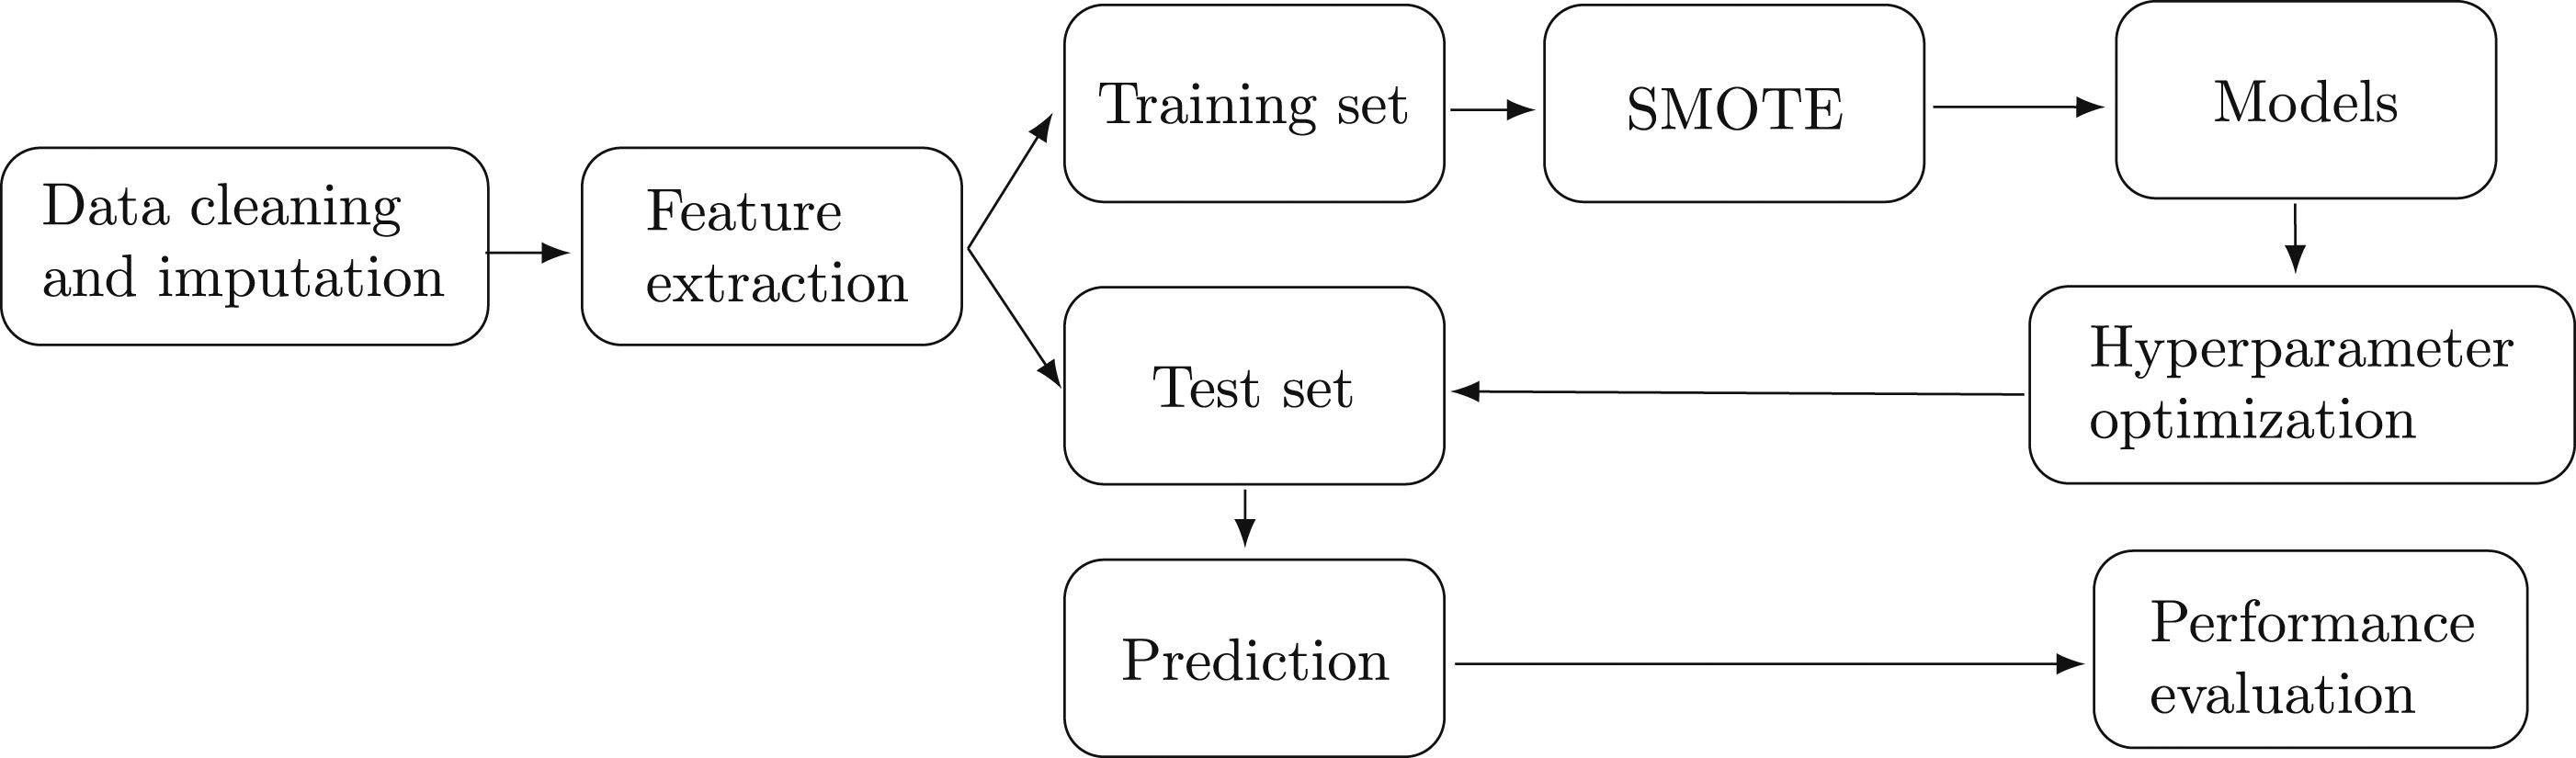
Machine learning predictions are based on the assumption that the test set is large enough to yield statistically meaningful results and representative of the dataset as a whole (He & Ma, 2013). Furthermore, the test set must be as similar to the training set as possible. If the test set has significantly different characteristics than the training set, the classifier may not perform well on the test set. Due to the size of the two waves, we randomly selected 60% of the sample to train the parameters in the model, and we performed 10-fold cross-validation (CV) to evaluate the models. The remaining 40% of the sample served as the unseen test set, which was used to predict depression outcome.
The original dataset contained fewer respondents who suffered from mental distress for both 2020 and 2021 compared to those who did not experience the same level of anxiety and distress. When there are too few minority cases for a model to effectively learn the decision boundary, there might be important consequences for the learning process (Haibo He & Garcia, 2009). An imbalanced classification may produce classifiers with poor predictive ACC for the minority class, that is, the distressed, while classifying most new samples in the majority class for those who were not distressed.
To improve classification performance, the synthetic minority oversampling technique (SMOTE) was applied for data balancing. SMOTE is an oversampling approach that creates synthetic minority class samples, and it first selects cases at random that are close in the feature space, and then it creates synthetic observations based on the existing minority observations (Chawla et al., 2002). The synthetic sample S′ is generated by adding the feature vector of the minority class sample X with the Euclidean distance between the minority class and its randomly chosen K-nearest neighbour
The machine learning algorithms predict the proportion of people suffering from symptoms of mental distress and anxiety. The selected models represent a broad approach to machine learning. Gradient boosting machines (GBM), random forests (RF) and classification trees (CT) are ensembled decision tree algorithms; support vector machines (SVM) construct hyperplanes to classify data; SVM with sigmoid kernel is also a two-layer perceptron neural network (NN); and ridge (RG), lasso (LS) and elastic net (EN) are regularised methods that penalise the weights in logistic regressions. See Supplemental Appendix C for descriptions of each machine learning algorithm and hyperparameter optimisation.
Model Evaluation
Several measures were used to evaluate model performance. Prediction ACC and mean misclassification error (MMCE) were used to assess the overall model performance in predicting depression. ACC is the proportion of predictions that are correct among the total number of predictions. The higher the ACC, the lower the error rate. However, ACC may overestimate model performance with class-imbalanced datasets, and not all types of misclassification errors are equal. The false negative error of wrongly indicating that a depressed person is healthy can be considered more serious than false positive errors, in which a healthy person is misclassified into the category of depression. To take different error types into account, we have adapted a cost-sensitive classification to adjust thresholds to map the depression and non-depression classes (see, e.g. Elkan, 2001).
The cost-sensitive classification considers two measures: sensitivity, or ‘true positive rate’, which shows the proportion of depressed people who were correctly identified (the fraction of true positives dividing the sum of true positives and false negatives), and specificity, or ‘true negative rate’, which refers to the proportion of correctly predicted non-depressed people (the fraction of true negatives dividing the sum of true positives and false negatives). We tuned the proportion of negative examples (the threshold) to make optimal cost-sensitive classification decisions. The optimal thresholds should achieve a balance between the true positive rate and true negative rate for each model, while at the same time having the lowest possible misclassification errors.
Two other relevant prediction results are precision and negative predictive value (NPV). Precision represents the proportion of people predicted to be depressed who are truly depressed (the fraction of true positives dividing the sum of true positives and false positives), and NPV indicates the probability that a person predicted to be healthy is indeed healthy.
The receiver operating curve (ROC) was plotted to illustrate the true positive rate (sensitivity) in the function of the false positive rate (1-specificity) for different cut-off points. The probability ROC curve and the area under the curve (AUC) indicate the models’ capability of distinguishing between classes. AUC ranges from 0 to 1, where a model that predicts 100% correctly has an AUC of one.
Finally, we ranked the importance of predictors by using a random forest algorithm. A random forest algorithm uses permutation feature importance to calculate how much each variable decreases the weighted impurity in a tree.
Results
Descriptive Statistics and Odds Ratio of Depression
Distribution and Odds Ratio of the Depressed.
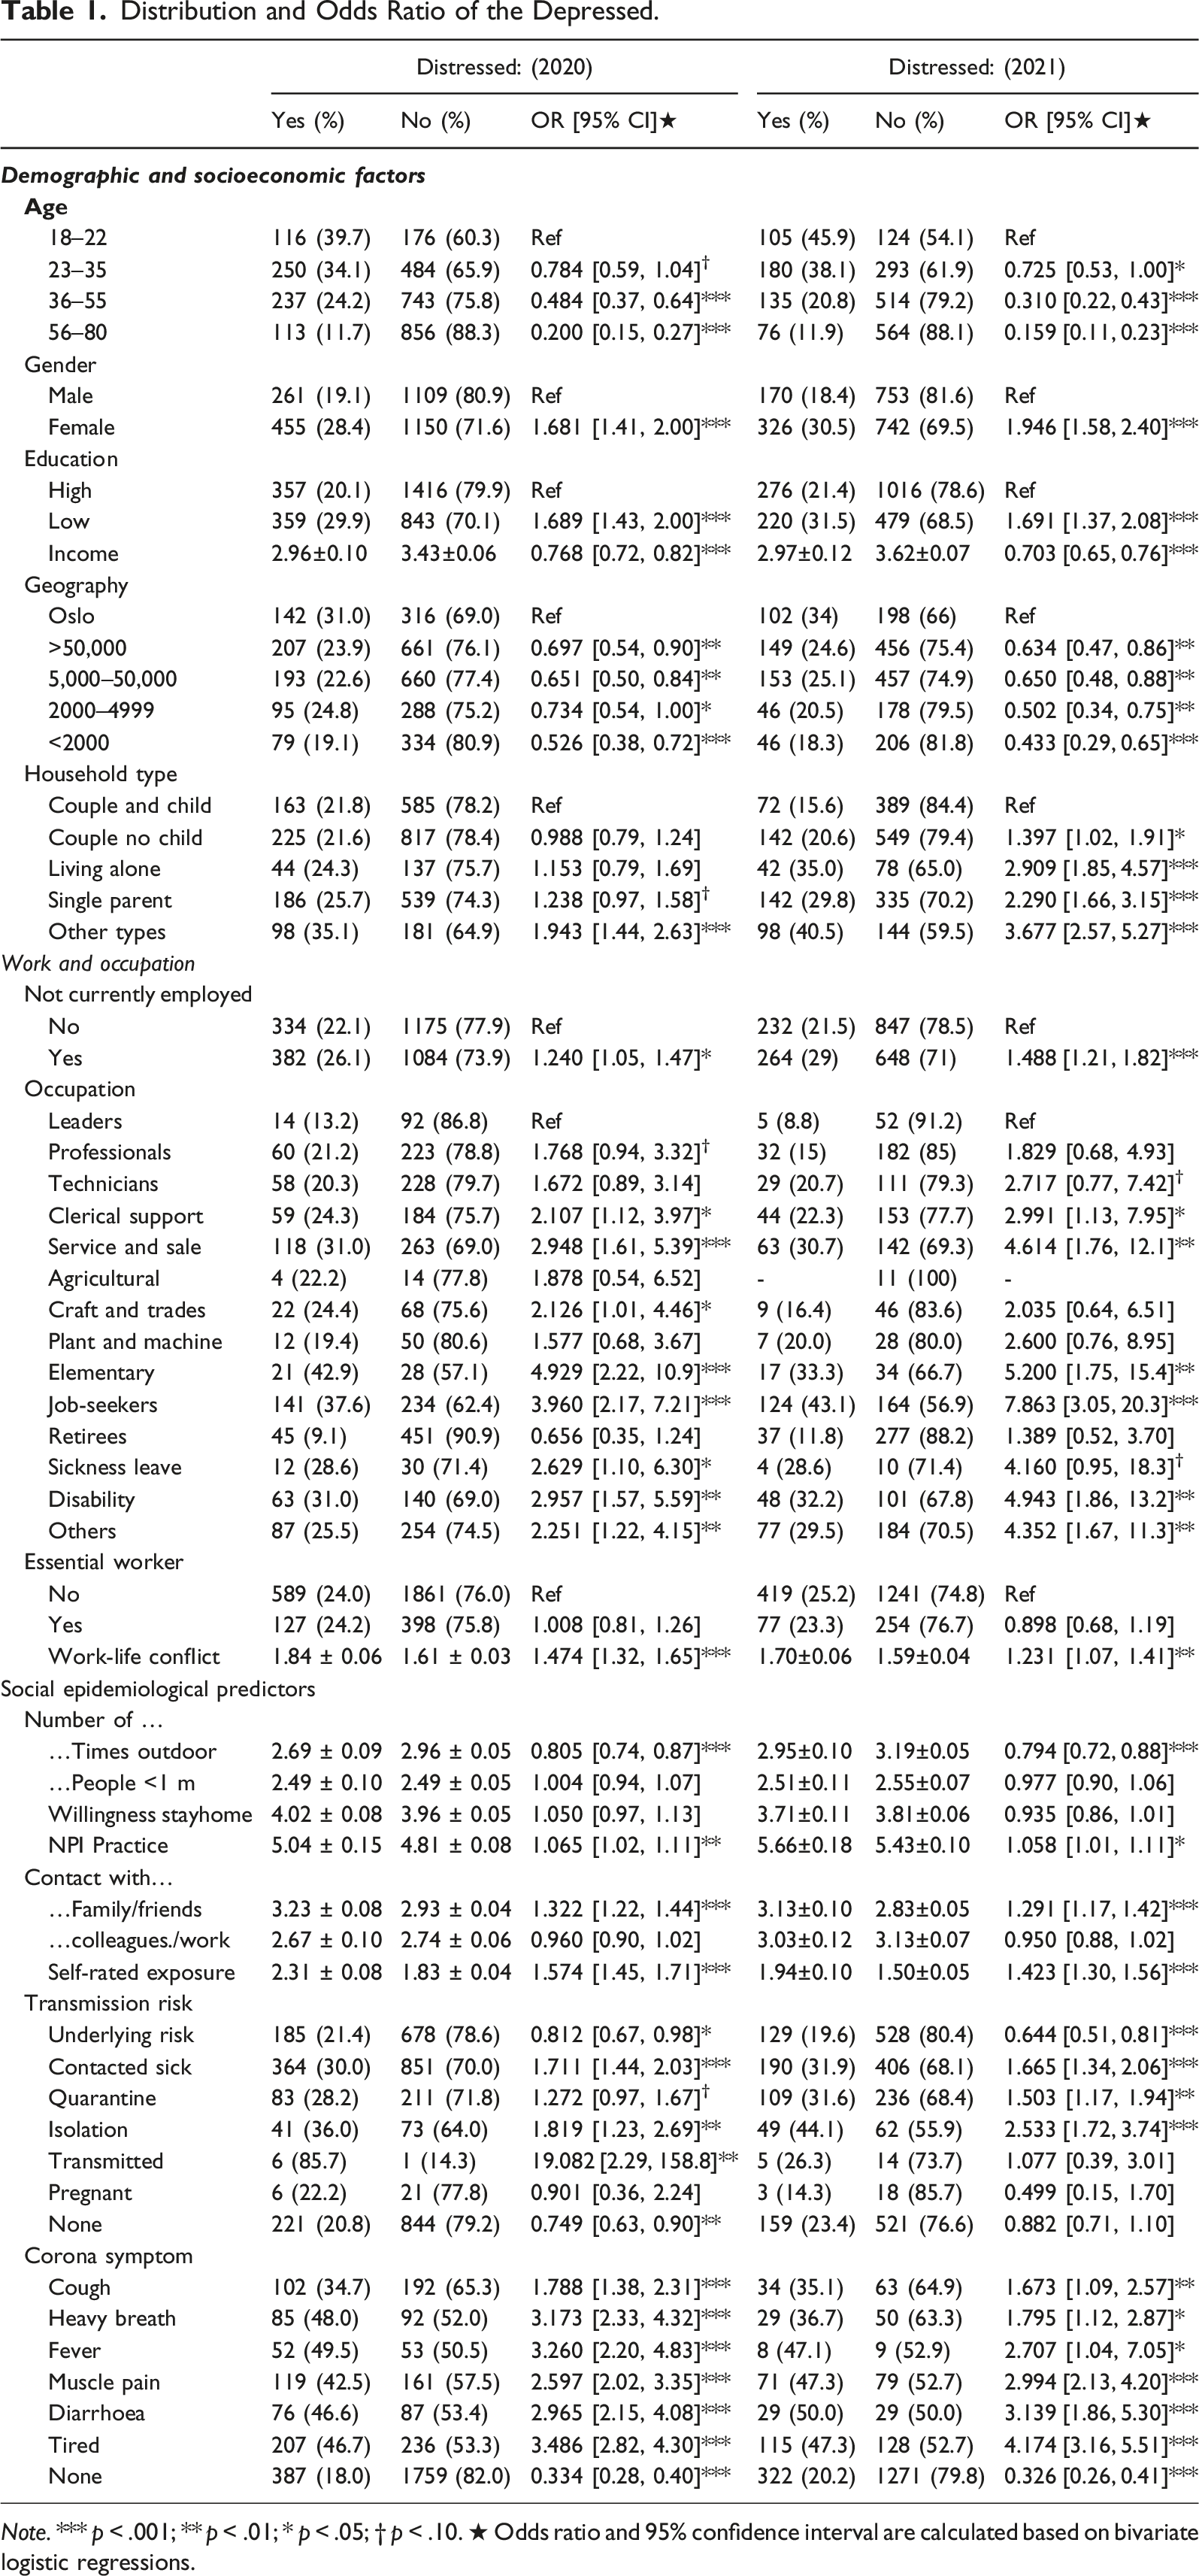
Note. *** p < .001; ** p < .01; * p < .05; † p < .10. ★ Odds ratio and 95% confidence interval are calculated based on bivariate logistic regressions.
The trends in 2020 and 2021 were very similar. The most distressed were those who were younger, female, had a lower level of education, poorer, lived in Oslo, and those who were not currently employed. Leaders were less distressed than almost all other occupational groups, while a larger proportion of people working in service, sale and elementary occupations suffered from depression. Jobseekers and sickness and disability benefit recipients were also more likely to be depressed. Moreover, those who were outdoors more often were more distressed than those who were less outdoors, and a higher degree of nonpharmaceutical practices correlated with increased anxiety. In addition, those who engaged in digitally contacting family and friends at a higher frequency had higher levels of depression. Anxiety also increased with self-rated disease exposure. Finally, several risk factors for disease transmission and COVID-19-related symptoms increased the proportion of depressed people.
When comparing the odds ratio of depression in 2020 and 2021, the descriptive statistics show that in 2020, only single parents and people living in other types of households were significantly more stressed compared to couples with children. In 2021, the proportion of depressed people among couples living with their children was significantly lower than in any other household type. When looking at occupational groups, even higher proportions of depressed people could be found among jobseekers, people working within service, sale, or elementary occupations, and those with sickness leave or receiving disability benefits.
Predicting depression
Percentage of Distressed in the Dataset: Original Data, Training Set and Test Set.
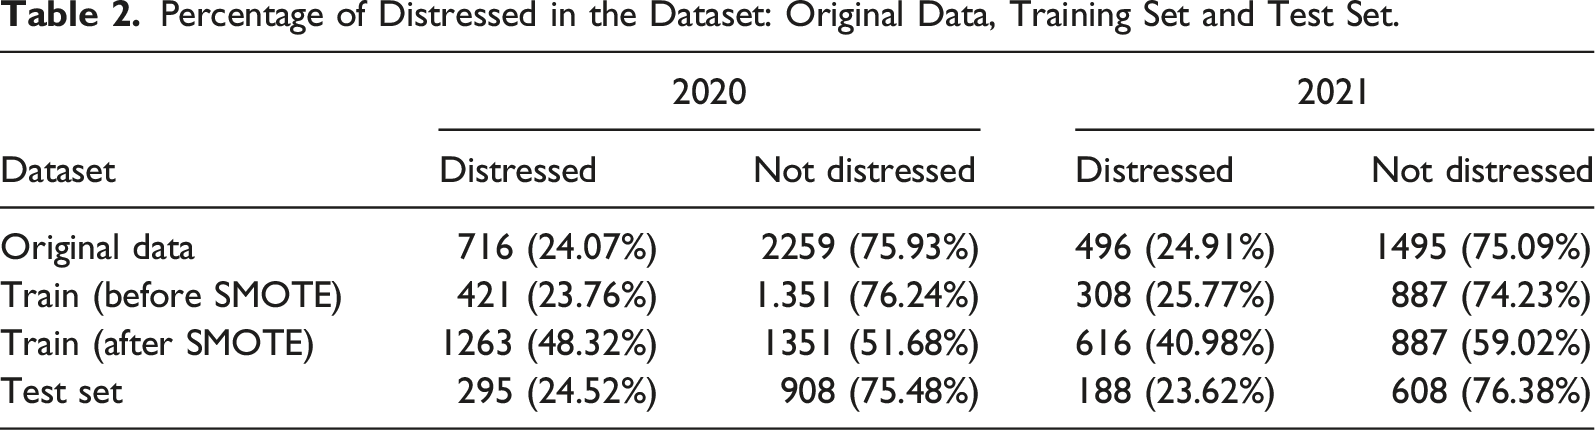
Figure 2 shows the comparison of the ROC curves of different models in 2020 and 2021. The ROC curve plots true positive rates (sensitivity) and false positive rates (1-specificity). The y-axis represents the probability of detecting a positive test given that a person had depression, while the x-axis shows the fall-out rate, which is the probability of falsely identify a healthy person as depressed. When predicting depression in 2020, random forest had the highest AUC value (AUC = 0.753), followed by elastic net (0.752), logistic regression with lasso (0.748) and ridge (0.745) regularisation, and GBM (0.744). AUC was lowest for the classification tree-model (AUC = 0.690). Predictive performance of machine learning models for depression, 2020 and 2021.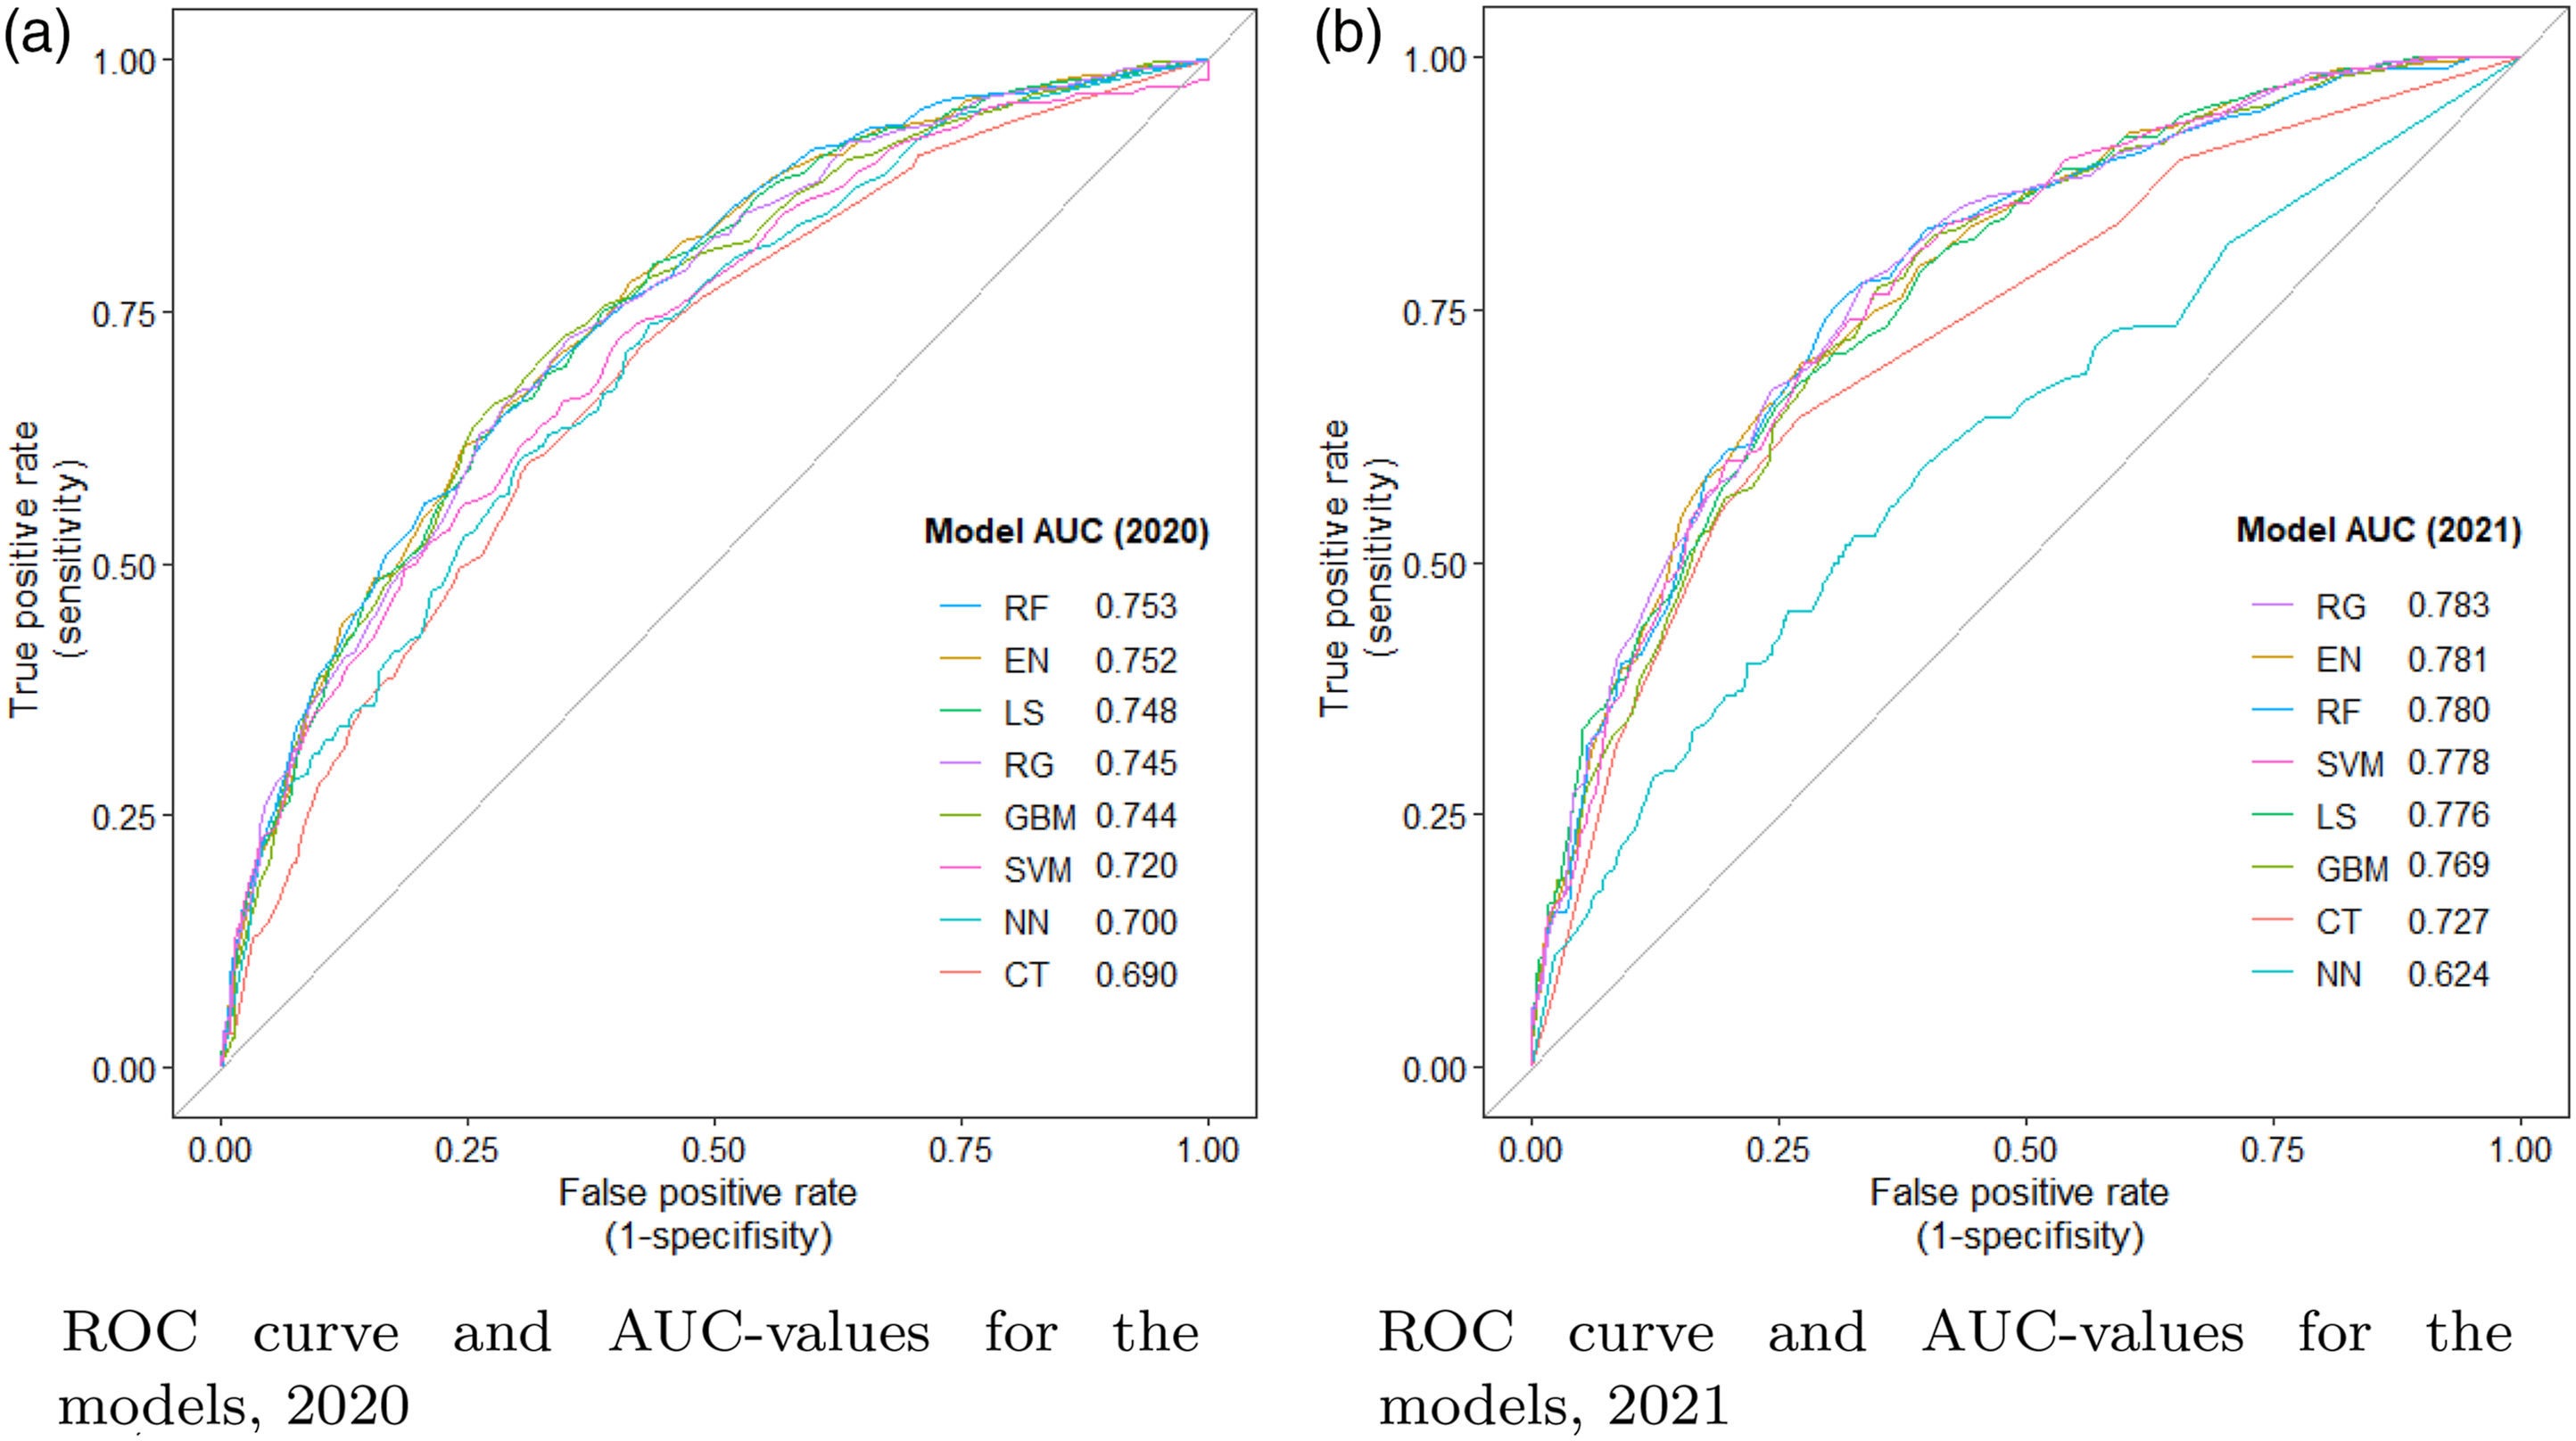
The 2021 AUCs were generally higher than the 2020 AUCs. When predicting depression in 2020, ridge regression had the highest AUC value (AUC = 0.783), followed by EN (0.781), RF (0.780), SVM (0.778) and lasso regularisation (0.786). The area under the ROC curve was lowest for SVM-model, with an AUC value of 0.624.
There were two possible outcomes to be predicted: whether a person was depressed or not. All individuals are assumed to belong to one of the two populations. The most pressing goal was to detect the risk of being depressed given various social and epidemiological conditions within the timeframe in which individuals were situated, either in an earlier or later stage of the pandemic. A key factor affecting the entries of the prediction is the cost assigned to different types of prediction errors. The consideration of relative costs can be understood as the relative preferences. The choice of cost depends on how willing we are to avoid a certain kind of prediction error at the expense of another error type (Berk, 2008).
The empirical cost ratios were realised by adjusting the probability thresholds for different models (see, e.g. Elkan (2001) for optimal cost-sensitive decisions). Threshold is the proportion of negative examples. Based on the threshold, we can calculate, given a certain false negative rate (falsely classifying someone as not depressed), how much more costly it would be to receive false positive results (wrongly predicting healthy people as being depressed). For example, a threshold of 0.5 equally weighs the two types of errors. When the threshold is reduced to 0.33, the cost of missing out an actual depressed person is twice as costly as predicting a healthy person as mentally distressed. For a threshold of 0.25, false negative errors weigh three times as high as the false positive errors. See Supplemental Appendixes E and F for classification thresholds for equal true positive rate and true negative rate in each model.
In this study, we illustrated results that were tuned to achieve a sensitivity level of at least 60% and a mean classification error below 30%. Figure 3 shows how sensitivity and mean classification error changed with the thresholds for the different models. The higher the threshold, the lower the sensitivity and classification error. The horizontal reference lines were also the baselines for 60% sensitivity and 30% classification error. When predicting depression in 2020, sensitivity for the penalised regressions (RG, LS and EN) was relatively high even with a threshold of around 0.5. In other words, these models did not require that more weight be given to false negative rate to achieve a desired proportion of true positive rate. Furthermore, for the SVM-models, sensitivity fell right below 60% with a threshold of 0.5. Thus, the thresholds needed to be slightly lower than 0.5. Finally, for the decision tree models (GBM, RF and CT), the thresholds needed to be much lower than 0.5 to achieve acceptable results for sensitivity. Sensitivity and mean classification error with varying threshold.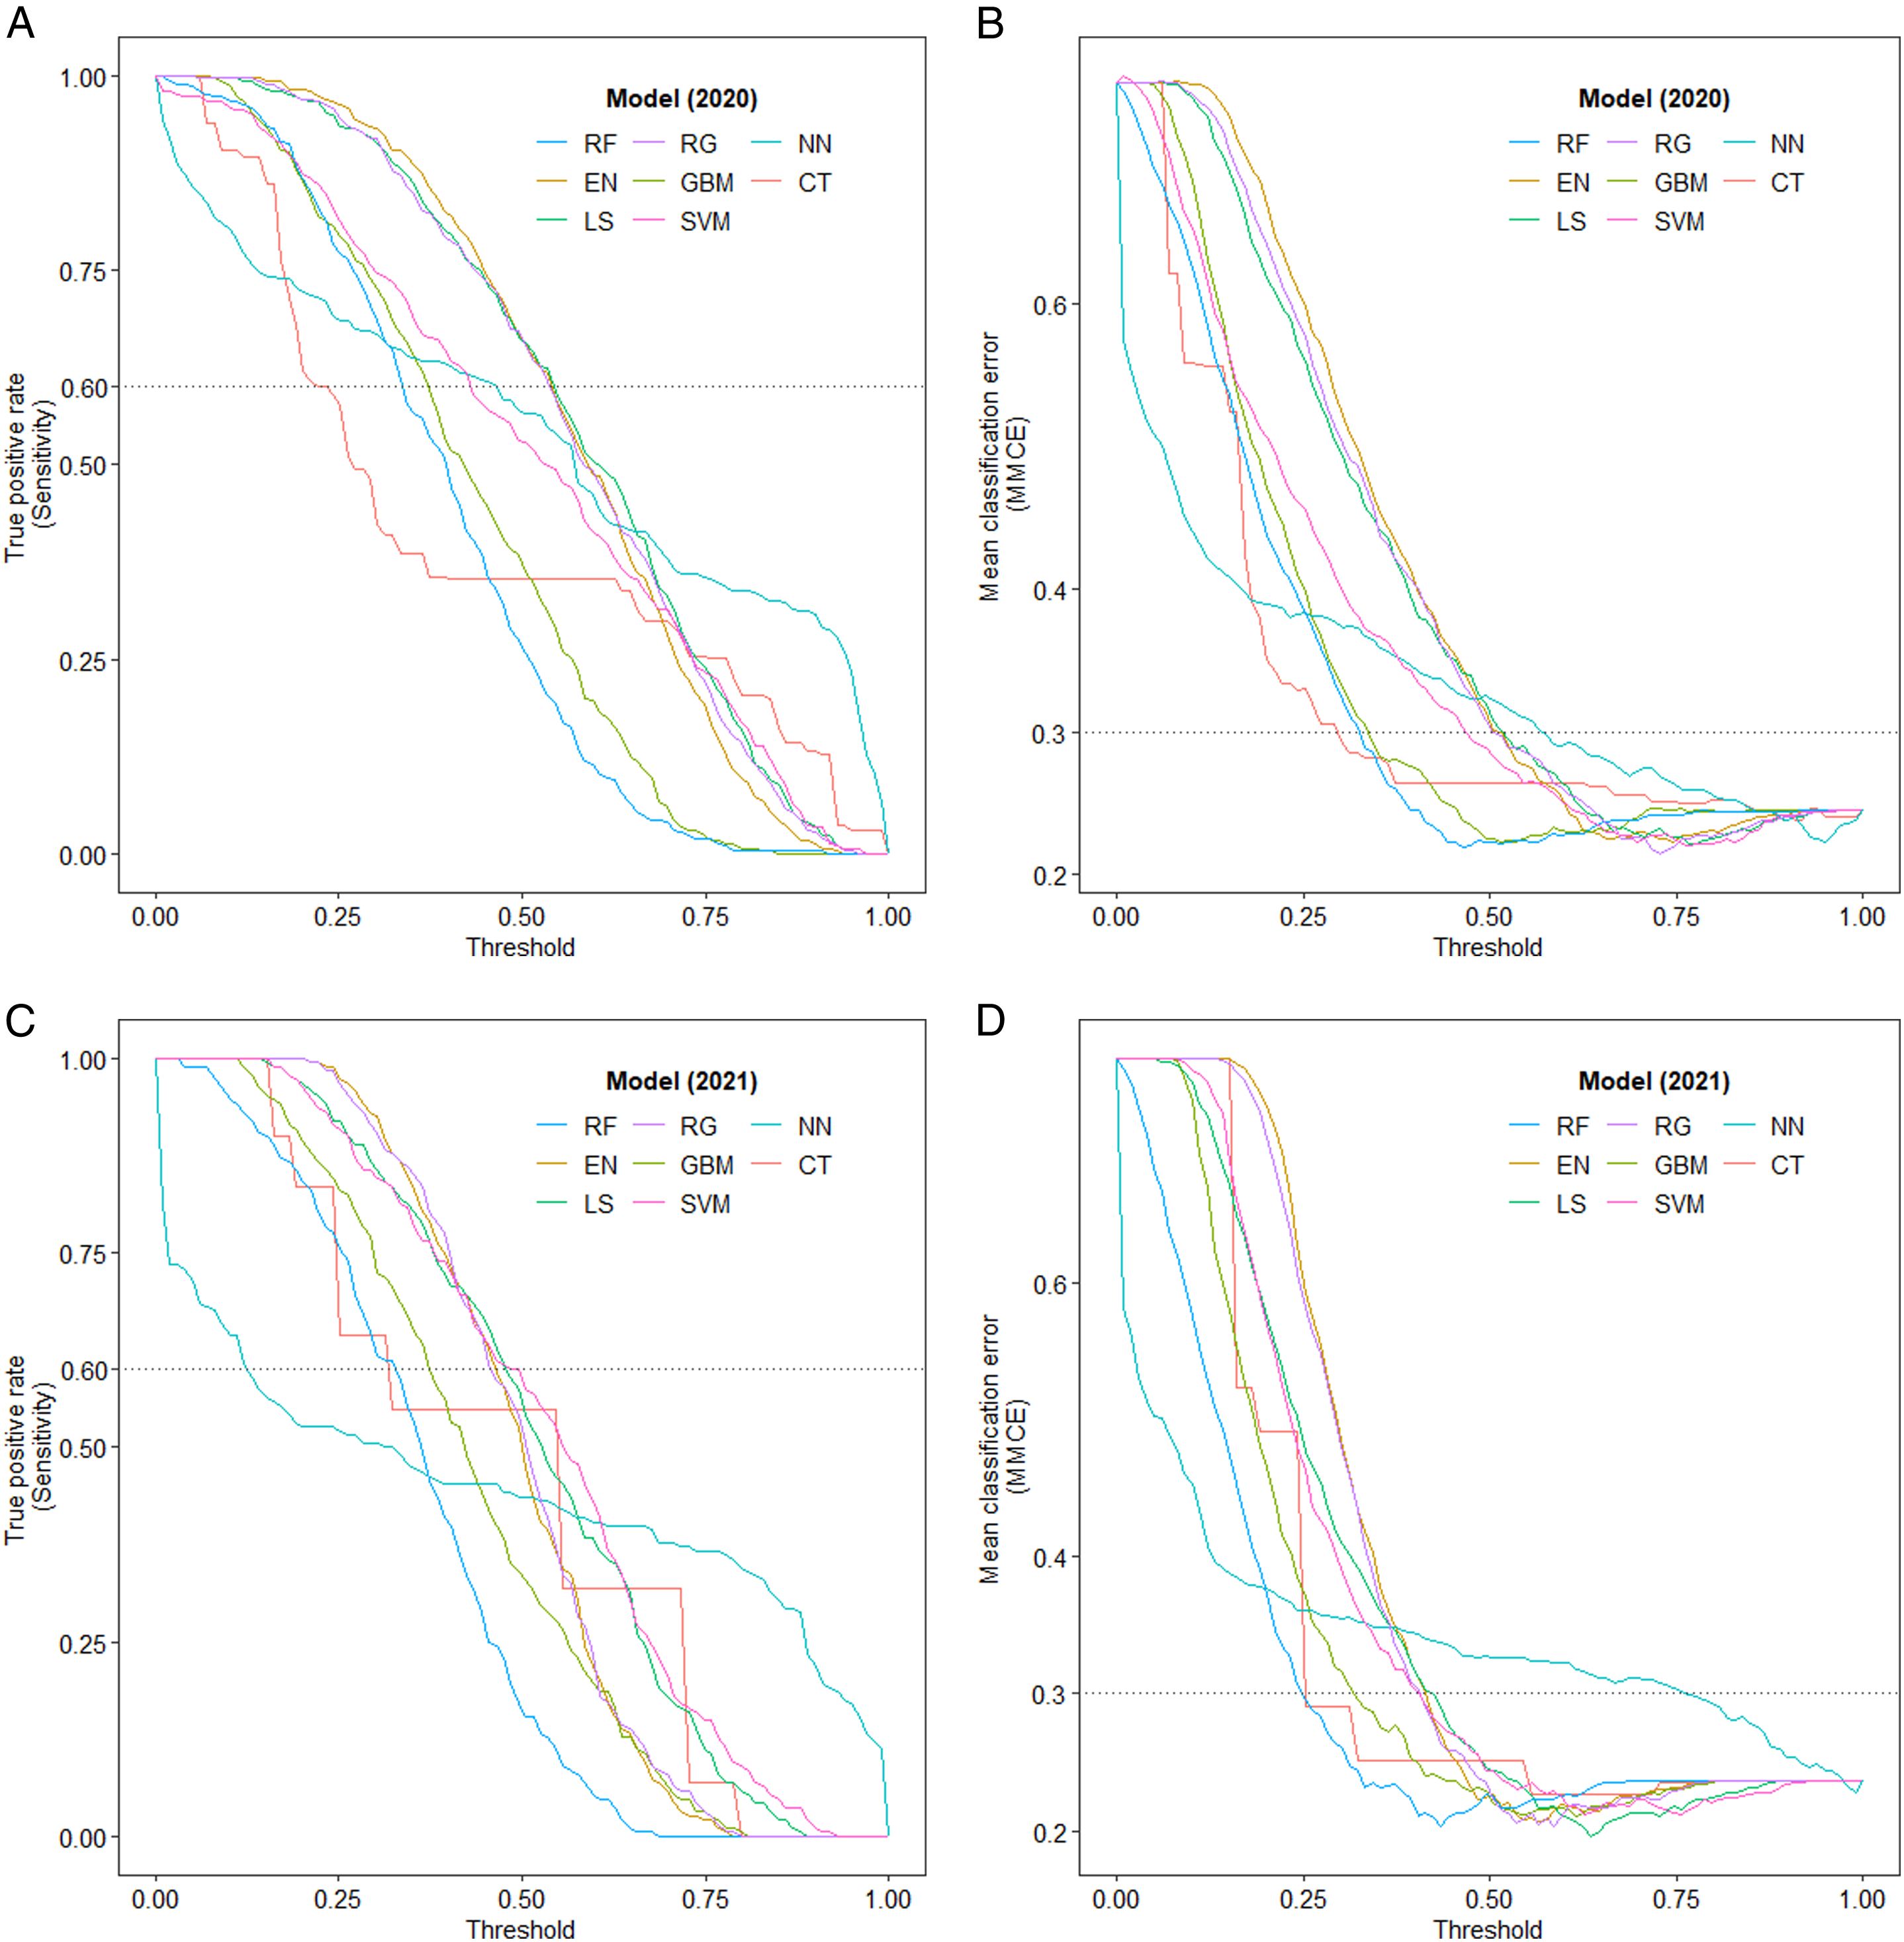
A similar pattern can be observed in the 2021 models: Thresholds for the tree models were the lowest to achieve a reasonable true positive rate of at least 60%. For the SVM-models and the penalised regressions, the threshold did not need to be significantly lower than 0.5.
In addition to threshold tuning, the models were optimised to achieve higher accuracies. When using models with selected hyperparameter and threshold, most of the machine learning models had an ACC rate of around or above 70% when predicting the test set. Figure 4 shows the results from resampling model accuracies based on the final models. With the optimised thresholds, regularised logistic regressions, GBM and SVM-radial had the highest median accuracies in 2020, whereas regularised regressions, SVM-radial and tree models had the highest median accuracies in 2021. While NN had the lowest ACC and the highest mean classification errors in both 2020 and 2021. Resampling of accuracies when predicting the test set with chosen hyperparameters.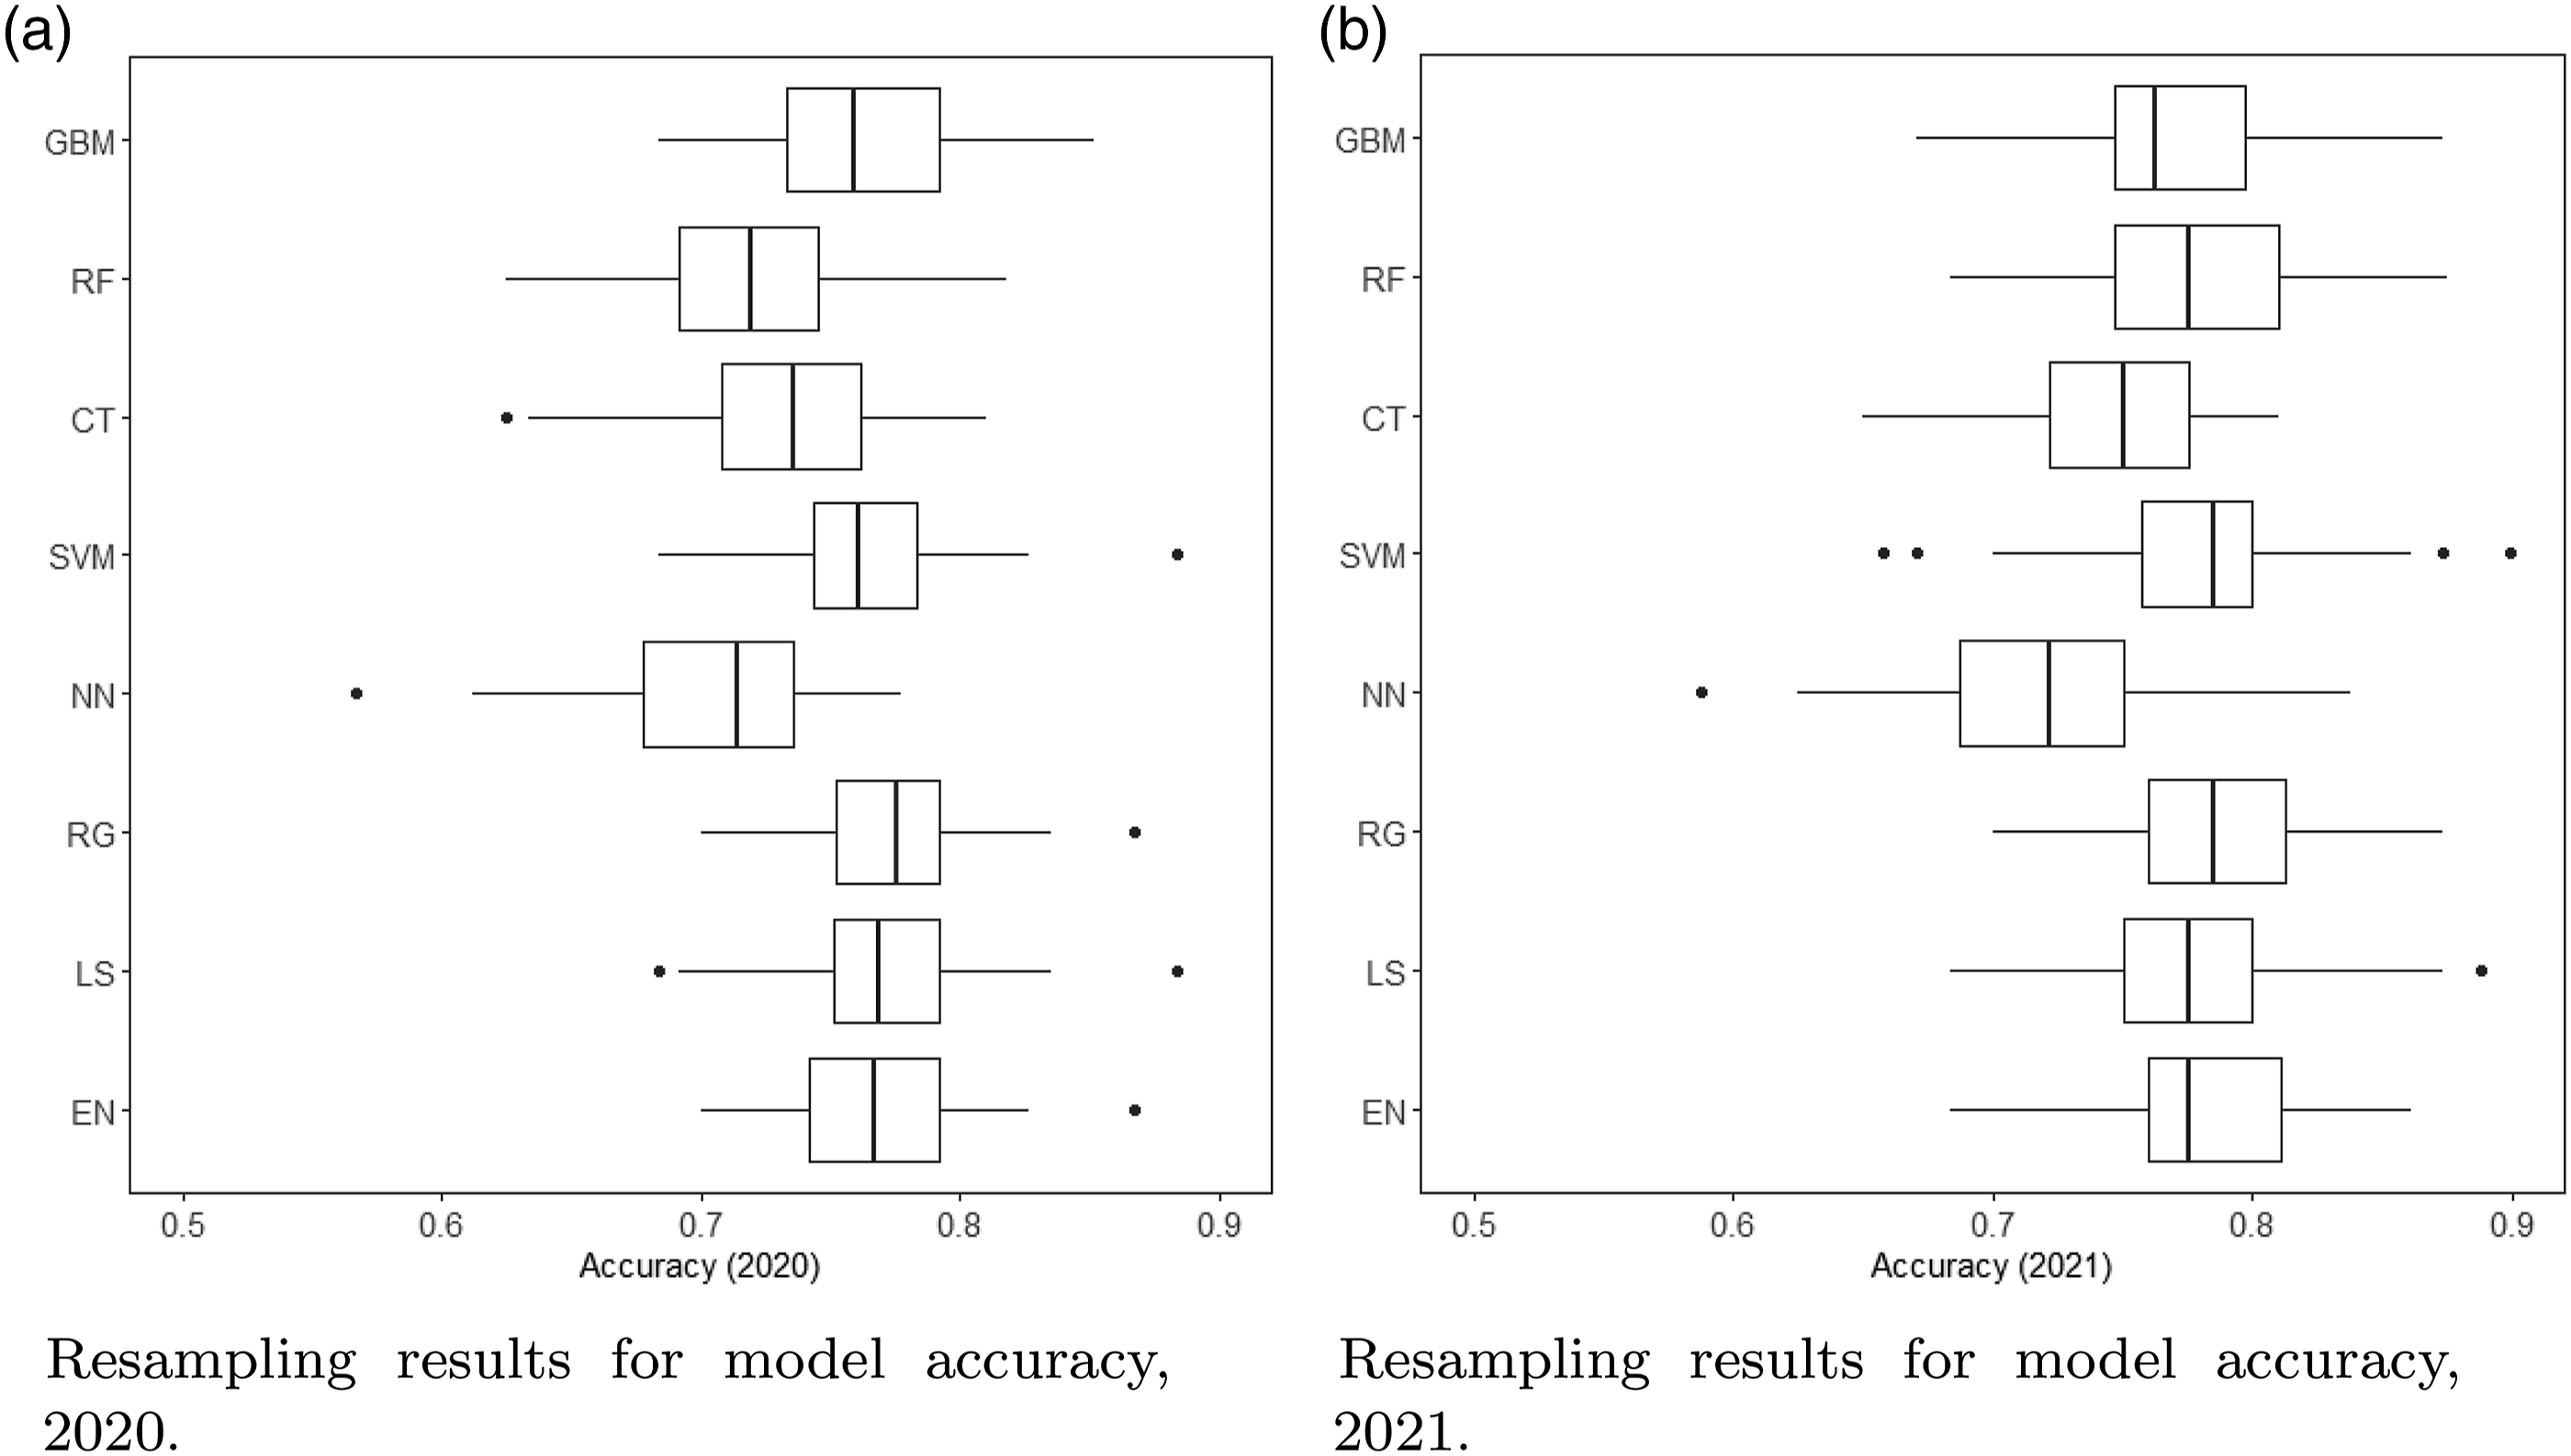
Prediction Performance of Depression, 2020 and 2021.
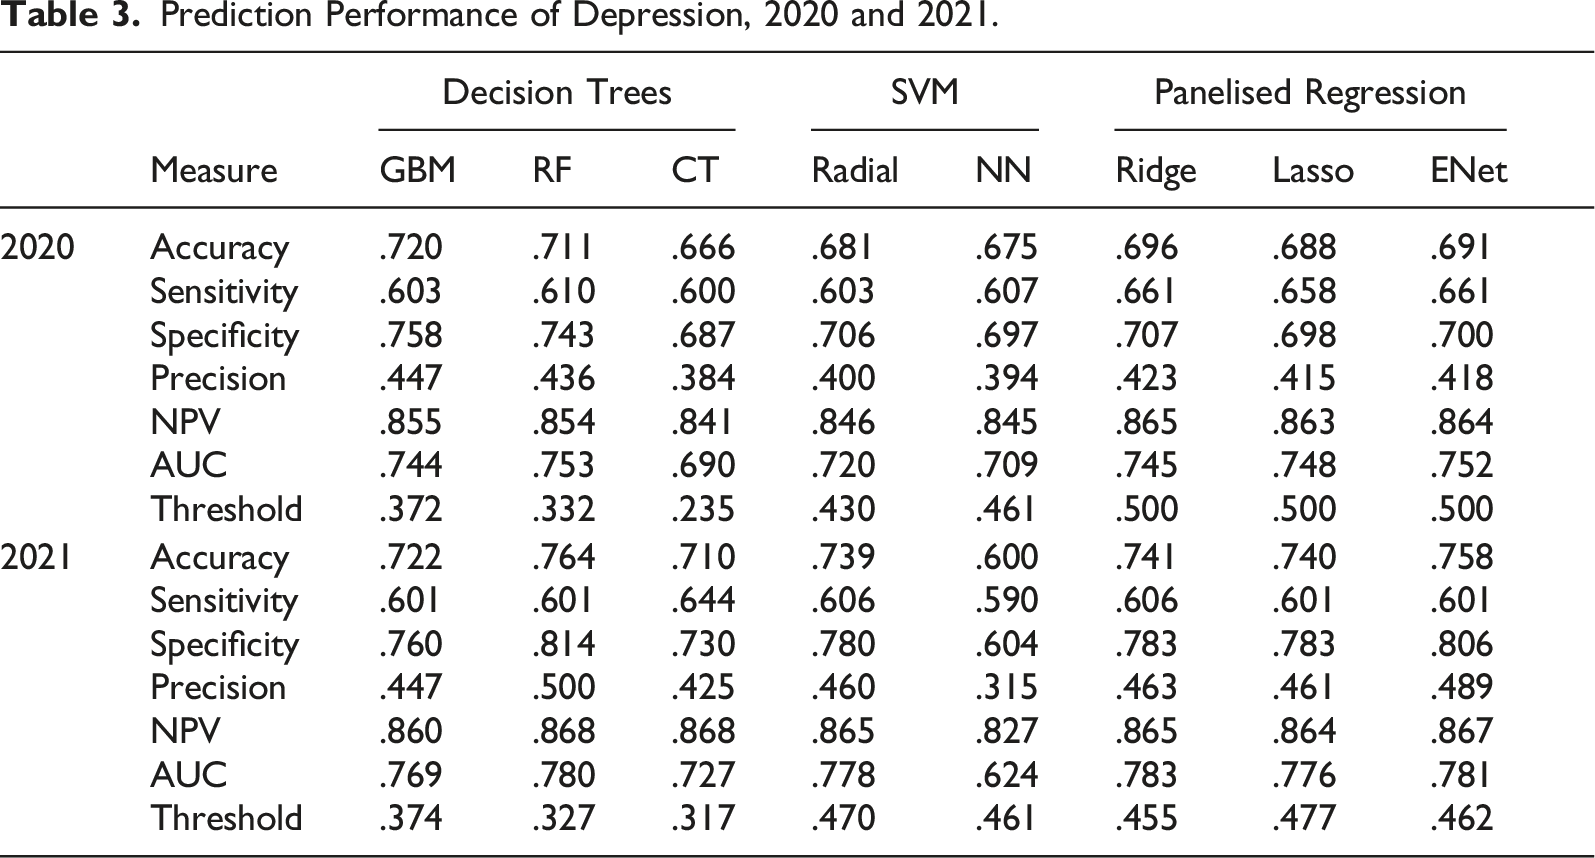
In sum, the best models for predicting depression for both years of the pandemic were algorithms based on a set of decision trees and the regularised logistic regressions.
Importance of Predictive Variables
Due to its overall positive performance in both years, we used random forest to map out how significantly each feature contributes to predicting depression. Figure 5 shows the top 20 most important variables in 2020 and 2021. For both years, self-reported risk for disease exposure was ranked as the most important variable in predicting depression. Other important variables that were stable over the 2 years were: household income, how often a person went outdoors, the extent to which one has followed nonpharmaceutical measures, the frequency of contacting family and friends, age between 56 and 80 years, and work–life conflict. The rank of variable importance also changed over the 2 years. For example, not having any COVID-19-related symptoms was the second most important feature in predicting depression in 2020, but became less important in 2021. The youngest age group (between 23 and 35 years) and gender became more important in predicting depression in 2021, compared to their relative rank in input importance in 2020. See ranking of all 55 input variables in Supplemental Appendix G. Ranking of the 20 most important variables in 2020 and 2021.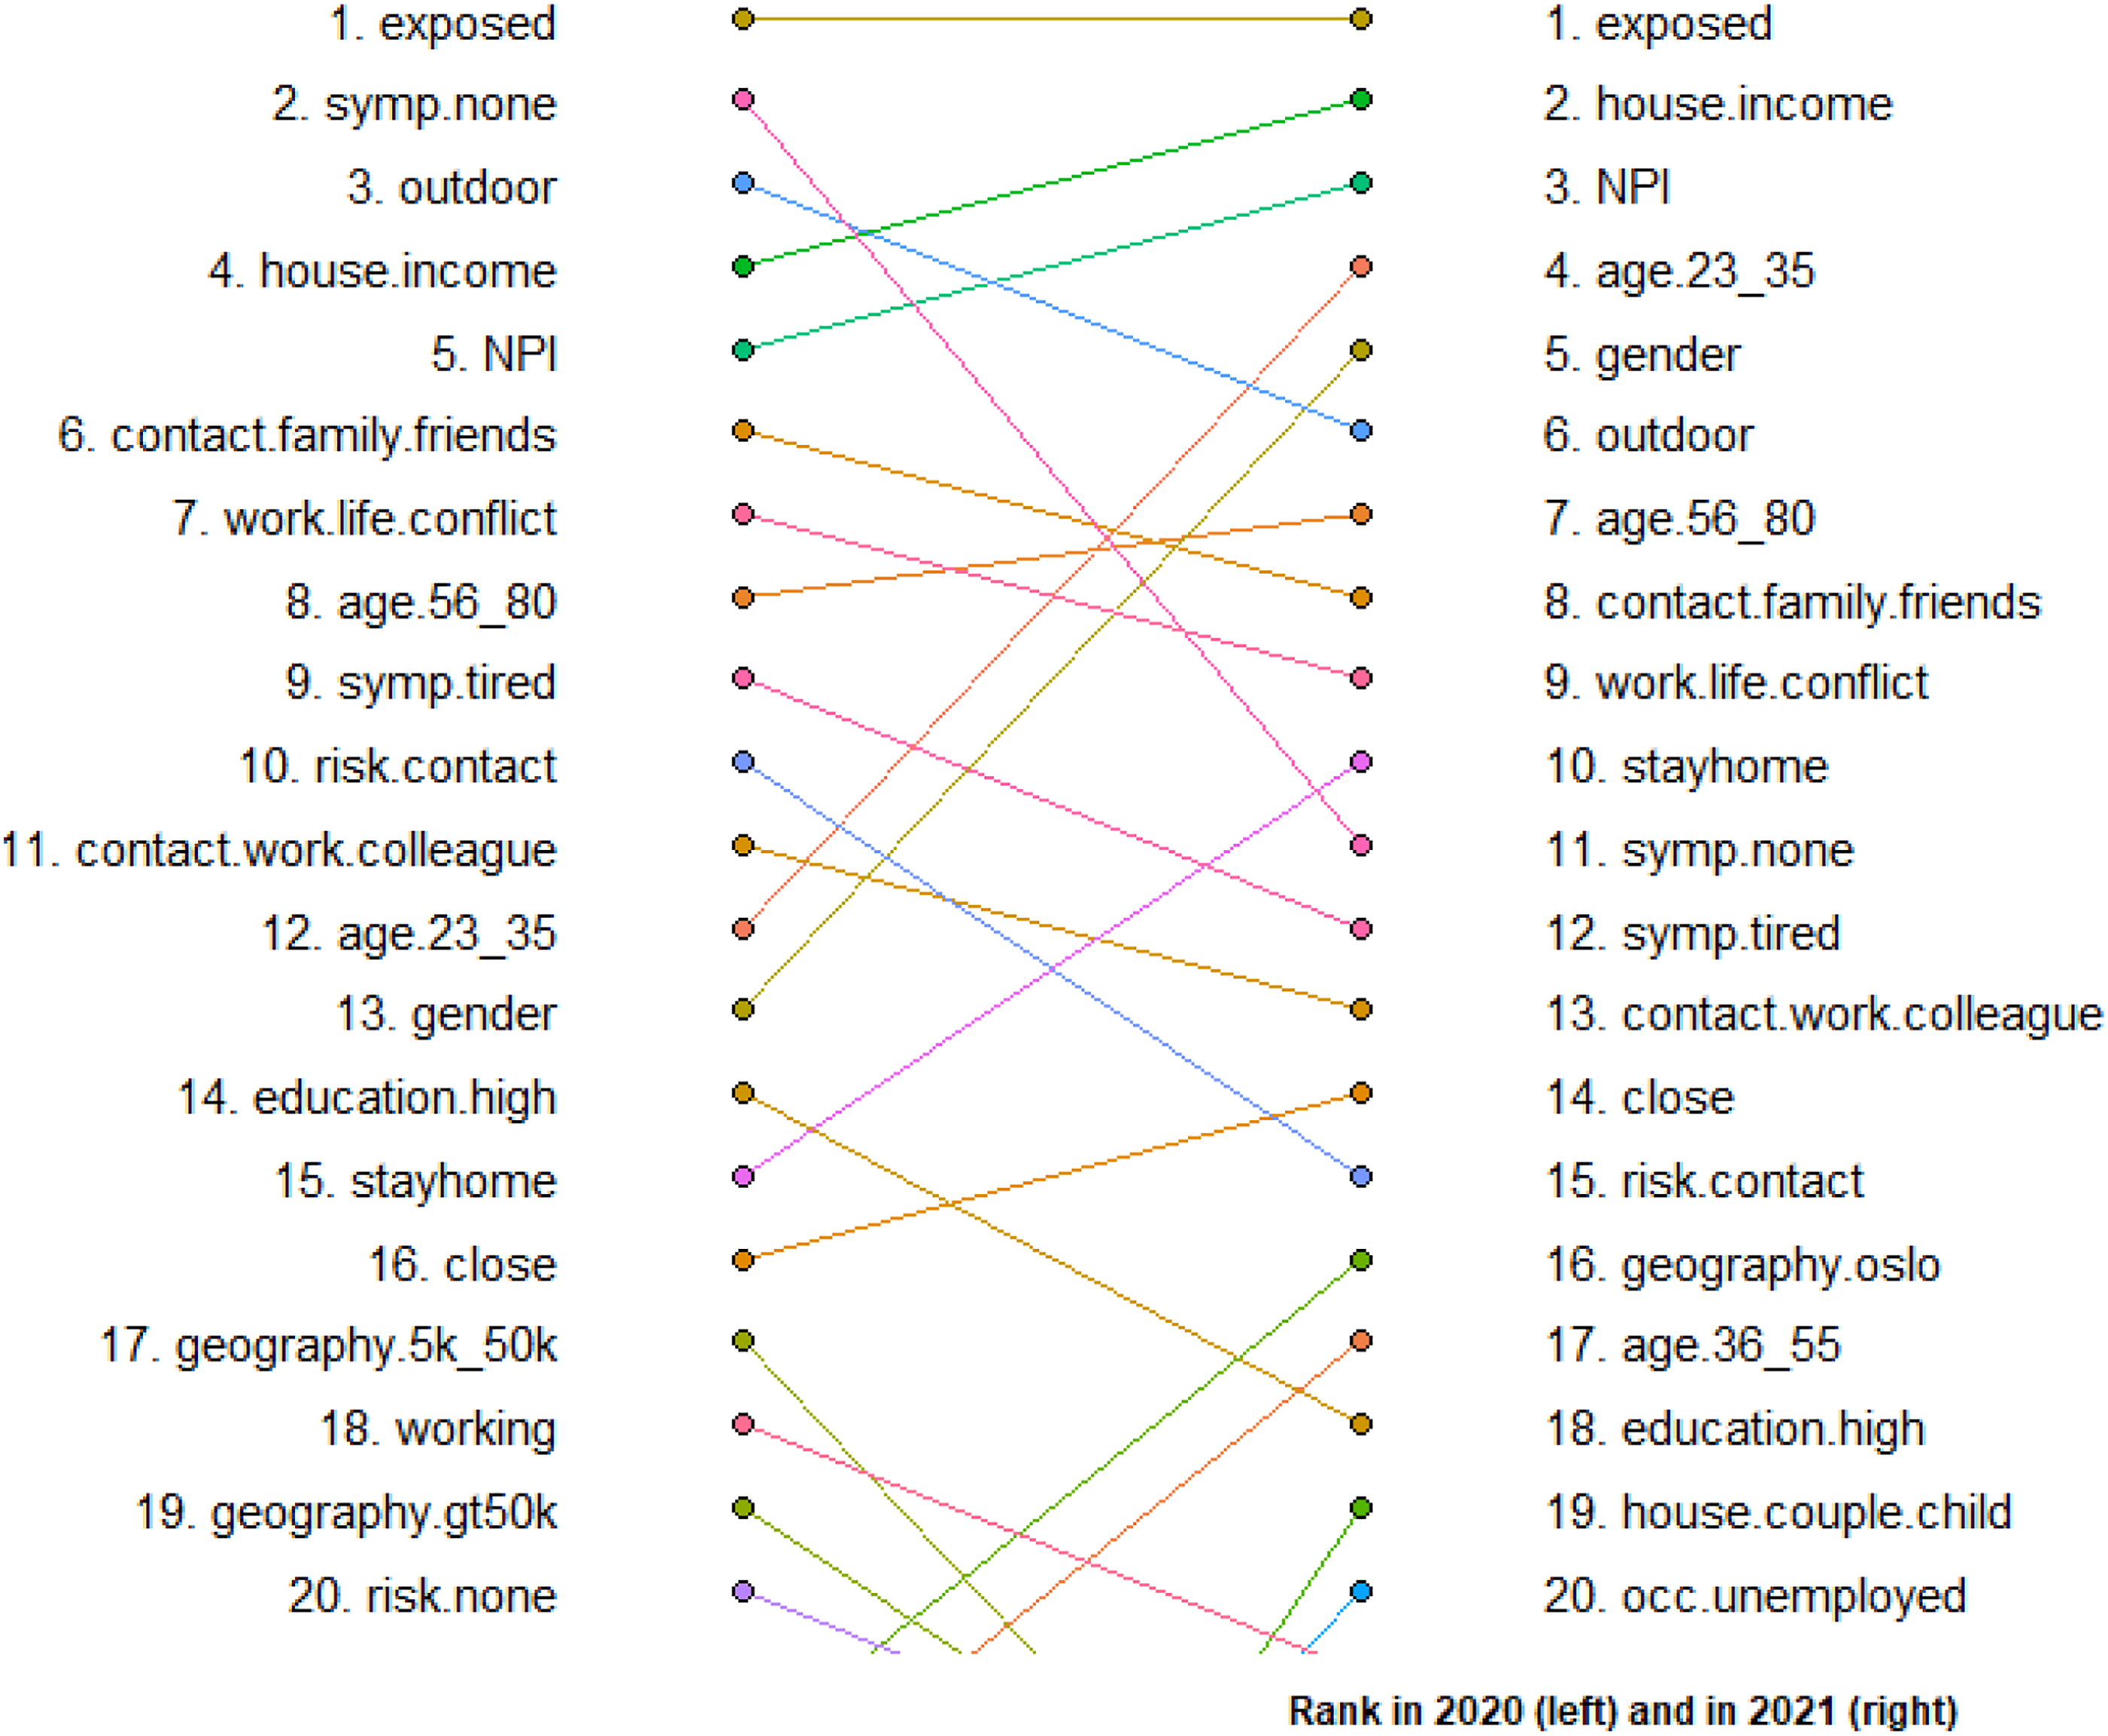
Finally, Figure 6 shows feature importance measured by mean decrease Gini using random forest. The mean decrease in Gini measures how each variable contributes to the homogeneity of the nodes and leaves in the RF model. The higher the value of mean decrease Gini, the more important the variable in predicting depression. The red and blue dots represent variable importance in 2020 and 2021, respectively. The figure also shows the difference between the 2 years in mean decrease Gini scores for each variable, illustrated by the distance between the red and blue points. Variables that have a large distance are household income, NPI, age between 23 and 35, gender, willingness to stay at home, living in Oslo, household type of being a couple with children, unemployment and being isolated due to COVID-symptoms/transmission. All the mentioned variables have contributed more to predicting depression in 2021, compared to in 2020. Variable importance in 2020 and 2021 measured by mean decrease Gini.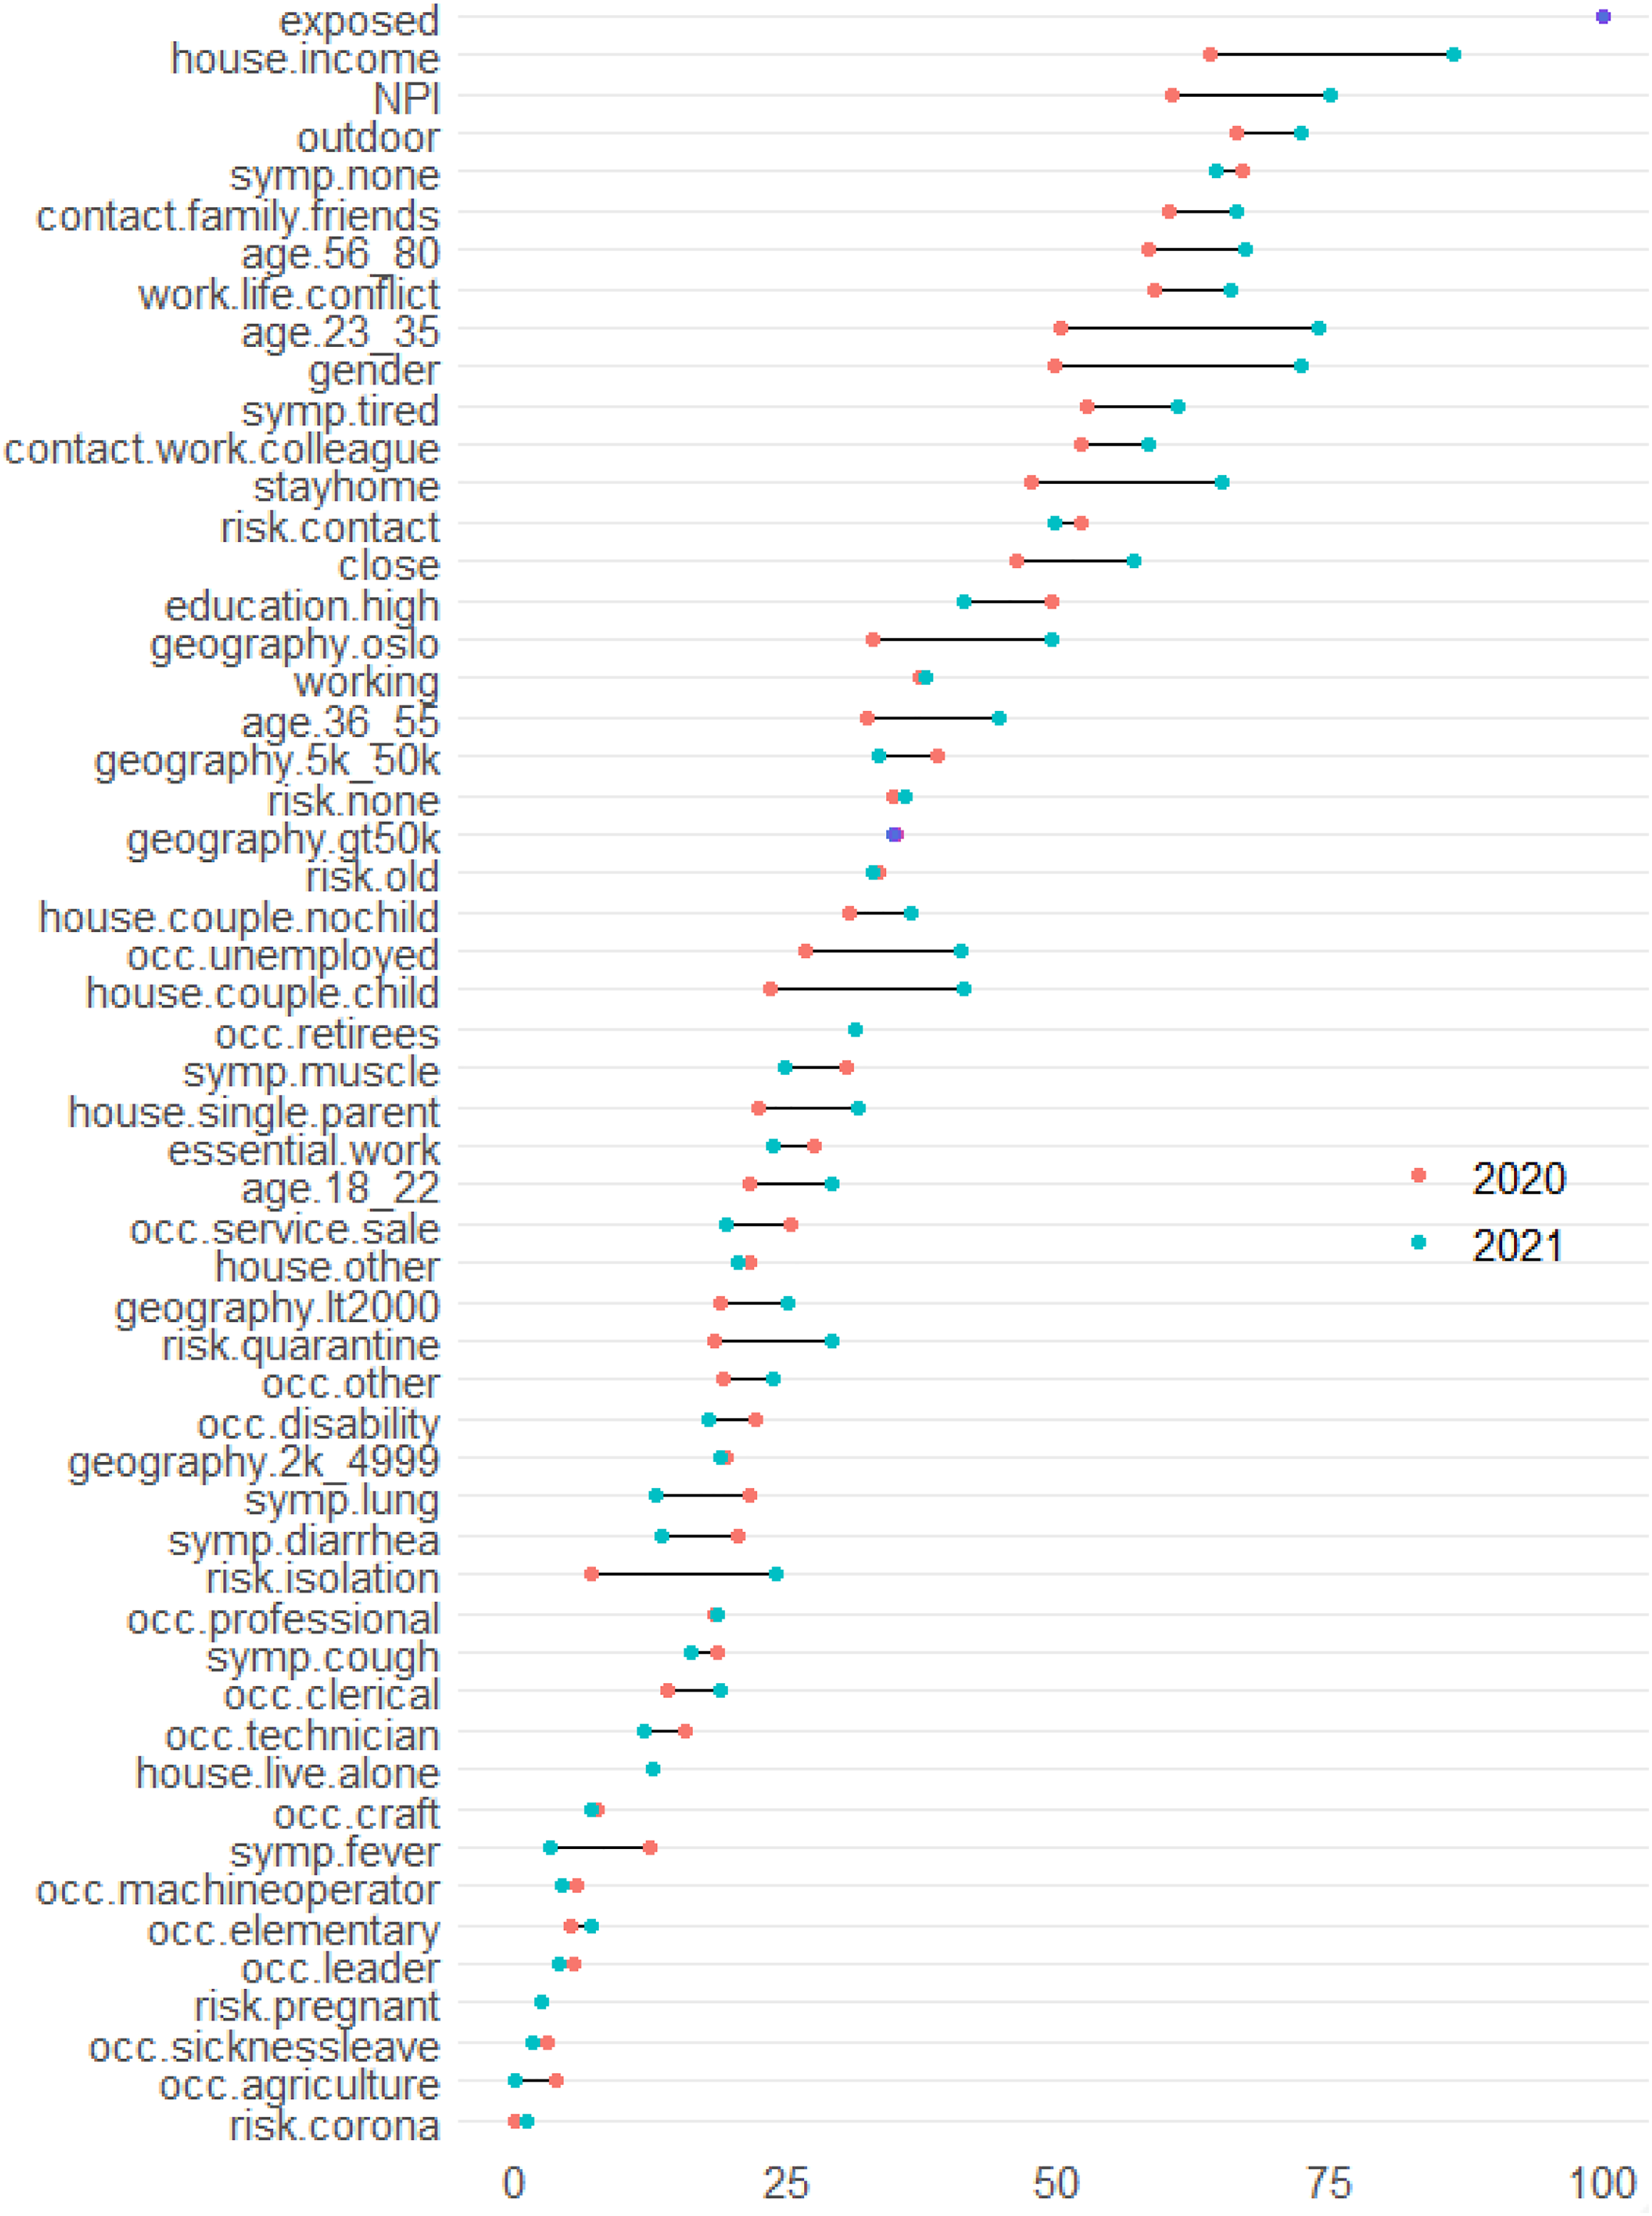
Discussion and Conclusion
This study is based on datasets from 2020 to 2021 that include demographics, social aspects and epidemiological and behavioural factors. We used machine learning models to diagnose depression in different pandemic phases. The results show that the net benefits of the models differ depending on threshold. The decision tree models (gradient boosting machines and random forest algorithms) and regularised regressions (elastic net and ridge and lasso) offer the best performance for predicting depression when evaluating the cost-sensitive balance between different error types, ACC and AUC.
The tree models and penalised regressions offer relatively high performances. With both accuracies and AUCs fall between 0.7 and 0.8, we can conclude that, even without considering psychometric instruments or the psychopathological causes of anxiety and depression, predictive models with social determinants achieve desirable results in predicting psychological distress. This supports the view that beyond the psychological and psychiatric causes of depression, social and environmental factors are important for predicting and explaining mental illnesses and disorders (Shim & Compton, 2020).
Psychiatrists and mental health professionals are proficient in identifying various driving factors for mental illness, such as poor choices and adverse health behaviour. However, when they attempt to intervene at the level of these factors, it is often too late (Shim & Compton, 2020). Scholars have thus advocated moving interventions further upstream and seeking the social origins of the risk factors, namely, the social determinants of mental illness (Shim & Compton, 2020). Pandemic context, life situation and social position can jointly influence individual choice, behavioural patterns and mental health. Therefore, our predictive models based on social factors are congruent with the widely adopted biopsychosocial model for understanding mental disorders and social circumstances.
A crucial point is the discussion concerning how to weigh different kinds of prediction errors: to miss out a true depressive individual, or to falsely diagnose a healthy person. On the one hand, false positives can be harmful as it may lead to unnecessary public expense and financial burdens, and sometimes higher levels of distress (Klinkman et al., 1998). On the other hand, false negatives may delay people’s diagnosis, which lead to significantly more psychiatric disorders and functional impairment (Leon et al., 1999). The relative costs assigned to type of errors affect the predictions made, and the cost ratios can be a policy matter and should be decided by relevant stakeholders. These discussions merit more attention and should be subject to future studies.
Important Predictors of Mental Health Problems
Among the predictor features, the self-perceived risk of contracting the coronavirus was the most influential factor for predicting depression. This is in line with previous research showing that fear increases anxiety in healthy individuals and intensifies mental illness for those with pre-existing disorders (Elhai et al., 2021; Fitzpatrick et al., 2020). Self-perceived exposure risk is naturally connected with certain circumstances during the pandemic – whether or not a person needs to travel by collective transport or has the possibility of working remotely from home. Therefore, the current mental health crisis cascading from the COVID-19 pandemic has exposed biological and mental expressions of social inequalities.
The study reveals highly ranked predictors of mental health that remain stable over time, including income, compliance with NPI, frequency of being outdoors, contact with family and friends and work–life conflict. These findings support studies that have suggested that social distancing interventions and home shielding have different impacts on mental health: people with a higher level of social and family support are less vulnerable to mental health problems (Grey et al., 2020), while those who were not able to follow protective measures or were exposed to the coronavirus to a greater extent exhibited higher levels of anxiety and distress (cf. Harris & Sandal, 2021).
Variables such as age, gender, education, employment status and geographical location were also among the 20 most important predictors of mental distress and depression in both 2020 and 2021. This is in line with previous studies that found that, during the pandemic, younger adults and women are more vulnerable to stress and depression (Ausín et al., 2021; Varma et al., 2021), and that people having lower educational attainment, who were unemployed or who experienced job loss have higher overall mental distress and anxiety (Ganson et al., 2021; Mazzi et al., 2020).
Many important predictors of depression may be intertwined with a complex social reality. For example, (in)ability to comply with NPIs and social distancing measures may reflect structural and socioeconomic inequalities. Some people have work or life situations in which they are more likely to contract the disease than others, and not all had digital competence or could afford to buy food and daily necessities online. Women are likelier to carry a heavier share of childcare and were therefore under greater pressure from work–life conflict; students who rent apartments in big cities but only received remote lectures are likelier to feel lonely; the unemployed or those who lost their jobs may experience lower self-esteem, greater economic challenges and be more worried about the future. These inequalities may, in turn, lead to more psychological distress. Thus, social inequalities may be translated and reinforced by the pandemic and made visible by emotional burdens and mental illnesses. This also confirms the importance of social risk factors in differentiating mental health outcomes among people with different socioeconomic statuses.
Changes Between Early and Later Pandemic Stages
Certain epidemiological factors (i.e. not having COVID-19-related symptoms and the transmission risk of having close contact with the infected) and living in a small or medium–sized city noticeably declined in importance between 2020 and 2021 as predictors of mental distress. At the same time, the importance of demographic, socioeconomic and behavioural variables such as younger age groups, gender, employment status, couples living with children, living in Oslo and willingness to stay at home increased substantially.
While self-perceived exposure was consistently important for people’s psychological wellbeing, epidemiological features such as having COVID symptoms or was in close contact with the infected influenced the level of psychological distress to a larger extent in the relatively early stage of the pandemic. When the pandemic was an unknown event and local governments were experimenting with different measures, people became anxious because the disease seemed close and the situation uncertain. After the pandemic evolved and progressed through the first year, new norms were settled and social differences represented by gender, age, region, household type and employment situation started to emerge. Younger age groups were more exposed to social isolation, couples with children struggled more with balancing life, work and free time, gender inequality became more visible, the unemployed were put under even greater pressure, and long-term social distancing led to loneliness and depression. The lagged effects of social inequalities are embodied in mental health status, and thus, the mentioned social determinants became relatively more important later in the pandemic.
Residential regions implemented different preventive measures and structural conditions during the pandemic, which may impact people’s stress levels and mental health status. In 2020, the preventive measures were rather similar between larger cities, while they were more relaxed in smaller places due to lower transmission rates. In 2021, while lives gradually became rather normal in other regional areas, Oslo implemented stricter lockdown policies and preventive measures. Therefore, the pandemic might have a larger impact on feelings of isolation, anxiety and distress for citizens living in Oslo than in other parts of Norway.
From Predictive Models to ‘First-Hand’ Screening
Predictions made by machine learning algorithms are often flexible, and their performance criteria are often easy to modify with respect to optimising parameters for ACC and adjusting for certain types prediction error. The present study considers the trade-offs of different types of errors and considers false negative errors as being costlier than false positive errors. Applications of these models in future studies may consider the cost benefits of certain prediction outcomes with the involvement of stakeholders such as health professionals and decision makers.
Additionally, traditional methods, such as linear or non-linear regressions, are often unsuitable for including many explanatory variables, as they are prone to overfitting and are challenged by poor predictive performance. Machine learning models are advantageous for handling numerous variables. This study overcomes these challenges and includes a wide range of social, demographic, behavioural and epidemiological factors when predicting depression. By leveraging studies on identifying the social determinants of mental health to predict outcomes, machine learning models can lead to rapid diagnosis and treatment, as well as translation of data for decision makers to bridge process gaps and promote overall preventative public health. Stakeholders will be able to forecast vulnerability and risk factors that have central roles in aggravating depressive symptoms, and the prediction models can help them implement interventions that prevent persistent mental health problems. See detailed information about usability of the machine learning models in Supplemental Appendix H.
The study has some limitations. First, it does not include important psychometric, genetic or epigenetic markers in predicting mental health. Studies with such variables may achieve higher ACC and better model performance. Second, the study only used a measure of depressive diagnosis. It would be interesting to look at the type of and the severity of depressive symptoms. Furthermore, the survey focuses on the pandemic situation in Norway, and can therefore not be generalised to forecast mental health for other countries. However, the predictive variables used in this study are relatively convenient to access. In addition to a standard screening process, the models can contribute in situations when information is less accessible, for example in situations where people are severely depressed, or when interview meetings may not be suitable. It may also help stakeholders and mental health practitioners to perform a simple and fast ‘first-hand’ screening to diagnose people who are more likely to suffer from depression in the pandemic situation.
A major clinical challenge in mental health is that traditional diagnostic systems perform poorly in terms of the detection of the early stages of mental disorders (Hickie et al., 2019). There is a large group of low to moderate cases of mental illness that are often underserved due to constrained resources – the healthcare system often prioritises people with severe mental disorders. Therefore, the dimension of inequality in treatment and screening does not only originate in individuals’ socioeconomic positions; it is also rooted in the practical decisions that have been adopted in the traditional mental healthcare system, as well as unequal resource allocation and structural deficiencies. Instead of conventional health service models of ‘majority in-clinic and minority web-delivered’ care, a flipped digital solution may deliver better mental health services in response to public health crises during the pandemic (Davenport et al., 2020). In addition, the use of technology-enabled care coordination contributes to improving mental health outcomes and reducing potential deaths by suicide (Iorfino et al., 2021). Furthermore, this type of care increases the capacity of primary care and healthcare practitioners (Young & Nesbitt, 2017). Therefore, the predictive models in our study may potentially be integrated with digital tools to provide faster and easier accessible mental health prediction for people with low to moderate mental distress. As early detection of depression is crucial, such a first-hand screening tool may help with the early diagnosis of mental health problems and contribute to timely preventative interventions.
Supplemental Material
sj-pdf-1-ssc-10.1177_08944393211069622 – Supplemental Material for Predicting Psychological Distress During the COVID-19 Pandemic: Do Socioeconomic Factors Matter?
Supplemental Material, sj-pdf-1-ssc-10.1177_08944393211069622 for Predicting Psychological Distress During the COVID-19 Pandemic: Do Socioeconomic Factors Matter? by Nan Zou Bakkeli in Social Science Computer Review
Footnotes
Acknowledgments
Thanks to Torbjørn Skardhamar, Svenn-Erik Mamelund and Åke Brännström for discussion and feedbacks, and thanks to the editor and anonymous referees for valuable comments.
Declaration of Conflicting Interests
The author(s) declared no potential conflicts of interest with respect to the research, authorship, and/or publication of this article.
Funding
The author(s) disclosed receipt of the following financial support for the research, authorship, and/or publication of this article: This paper is part of the project ‘CorRisk: Early COVID-19 wave in Norway: Social inequality in morbidity, compliance to nonpharmaceutical interventions and labour market consequences’, funded by a grant from the Research Council of Norway, grant no. 312716. Oslo Metropolitan University and Consumption Research Norway (SIFO) has funded data collection for this study.
Supplemental Material
Supplemental material for this article is available online.
Author Biography
References
Supplementary Material
Please find the following supplemental material available below.
For Open Access articles published under a Creative Commons License, all supplemental material carries the same license as the article it is associated with.
For non-Open Access articles published, all supplemental material carries a non-exclusive license, and permission requests for re-use of supplemental material or any part of supplemental material shall be sent directly to the copyright owner as specified in the copyright notice associated with the article.