
Abstract
This experimental study focuses on exploring the mechanical characteristics and characterization of fractured surface of polyethylene terephthalate with 15% carbon fiber (PETCF-15) composite in fused deposition modeling (FDM) process. Extrusion temperature, printing speed, layer thickness and raster angle are considered in this study. Taguchi’s design of experiments (L9) is used to perform experiments considering four process parameters: extrusion temperature (275–285°C,), layer thickness (0.1–0.3 mm), print speed (50–150 mm/s), and raster angle (0°–90°). The tensile testing performed in this work is in accordance with the standard tests prepared in the shape of dog-bone style. The printed PETCF-15 specimens exhibited the maximum tensile strength 62 N/mm2, a yield strength of 15.81 N/mm2 and maximum strain value of 10.9 %, as determined from the experimental results. The weighted grey Taguchi method is used to determine the optimum parametric setting values that would correspond to maximum tensile strength, yield strength, and elongation at break. The tests revealed that the best combinations are extrusion temperature of 275°C, print speed of 50 mm/s, layer thickness of 0.1 mm with the raster angle at 0°. The extrusion temperature (37.67%) and raster angle (49.88%) are identified as the most influential parameters affecting the grey relational grade, as determined through grey relational analysis. The experimental results obtained were verified with finite element analysis using ABAQUS. Fracture surfaces after tensile tests are analyzed using a scanning electron microscopy (SEM) that allows understanding of failure modes and the microstructure of the fractured surface. The strong correlation between experimental, numerical, and microstructural results validates the robustness of the approach and confirms the potential of optimized PETCF-15 components for high-performance structural applications in the aerospace and automotive sectors.
Introduction
Additive manufacturing (AM) has significantly transformed conventional manufacturing processes by enabling the fabrication of components with complex geometries, ranging from prototypes to fully functional parts. AM technology has demonstrated considerable advantages across several industrial sectors such as aerospace, automotive, semiconductor, and biomedical engineering due to its high design flexibility, adaptability and higher dimensional accuracy.1,2 Additive manufacturing offers significant advantages in producing complex structure while minimizing material wastage and reducing overall production time as compared with conventional manufacturing techniques such as casting, forming and machining.3,4
Fused Deposition Modeling (FDM) has gained substantial attention due to its low cost, operational simplicity, accessibility and compatibility with wide range of thermoplastic materials among various additive manufacturing techniques. In the FDM process, a thermoplastic filament is heated and extruded through a nozzle which deposits the material in layered manner to make a prototype/product. Compared with other AM technologies such as selective laser sintering (SLS) and selective laser melting (SLM) FDM offers low equipment cost, simpler operation and reduce material waste, making it one of the most widely adopted techniques for polymer based additive manufacturing.5–7
Despite these advantages, components produced using FDM often exhibit limited mechanical strength and anisotropic properties, which restrict their application in load bearing and structurally demanding environments.8–11 These limitations arise primarily from the weak interlayer bonding, the presence of internal voids and inherent process-induced defects. To overcome these challenges, researchers have explored the use of polymer matrix composites, where reinforcing materials are incorporated into thermoplastic metrices to enhance structural performance. The addition of reinforcement materials such as carbon fibers significantly improves stiffness, strength and dimensional stability, thereby enabling the fabrication of components with enhanced functional properties.12–14
The fabrication of fiber reinforced thermoplastic composites using additive manufacturing has therefore attracted considerable research interest. Carbon fiber reinforced polymer (CFRPs) has been widely investigated due to their excellent strength to weight ratio and superior load bearing capabilities.15,16
Shofner et al. 17 examined the mechanical performance of carbon fiber reinforced polymers (CFRPs) and demonstrated their suitability for structural applications requiring high strength and stiffness.18–20 However, the incorporation of continuous fibers into FDM printed parts often requires specialized printing system designed to handle continuous reinforcement materials. Consequently, achieving effective reinforcement while maintaining printing stability remains a major challenge in the development of high performance FDM composites. 3
Ulkir and Akgun 21 predicted the compressive strength of FDM printed ABS parts using Taguchi-fuzzy logic approach. Infill density, printing speed and layer height were found significant to affect the mechanical performance. The reported study confirms the effectiveness of statistical optimization and predictive modelling in FDM process analysis. Moghanlou et al. 22 combined FDM parametric optimization with FE analysis using COMSOL Multiphysics to evaluate the mechanical performance of chopped carbon fiber reinforced polymer components. Such approaches support the use of FE tools like ABAQUS in the present work for validating experimentally observed mechanical behavior of printed PETCF15 components. Gunes et al. 23 developed and experimentally validated a 3D printed flexible strain sensor using finite element modelling in COMSOL Multiphysics. The study demonstrated the importance of simulation-based characterization. Similar study on composite modelling and performance evaluation highlighted the growing role of combined experimental-computational approaches in understanding of advanced polymer composite.
Various thermoplastic materials have been utilized in the FDM process, including polylactic acid (PLA) polypropylene (PP), polyethylene (PE) and acrylonitrile butadiene styrene (ABS), which are widely used due to their ease of processing. Engineering grade thermoplastics such as polyamide (PA), polycarbonate (PC), polyetheretherketone (PEEK), polyetherimide (PEI), polyethersulfone (PES), and polyphenylene sulfide (PPS) are also available for applications requiring superior mechanical and thermal properties. 24 In recent years polyethylene terephthalate (PET) has attracted incremental attention as an additive manufacturing material due to its balanced combination of mechanical strength, thermal stability and processability.
Mangalampalli et al. 25 discussed the complex multi-scale synergistic mechanisms governing the interaction between carbon reinforcement and PETG matrices. The study reported significant improvements in mechanical performance and their increasing relevance in additive manufacturing applications. Simopoulos et al. 26 reported significant improvement in tensile strength and electrical conductivity due to hierarchical micro/nano filler networks in short carbon fibers and carbon nanotubes PETG ternary composites. These findings emphasize the complex multi scale synergistic mechanisms governing the performance of reinforced PETG composites in additive manufacturing. Sapkota et al. 27 investigated that extrusion temperature and printing profiles significantly affect the tensile properties of 3D printed PETG, nylon and TPU yarns. The research highlights the optimization of process parameters for improving structural performance in applications such as flexible tooling and soft robotic components.
PETG (PET mixed with glycol) is extensively investigated in FDM printing due to its improved printability and reduced warping. PETG components have demonstrated relatively higher tensile and flexural strength, particularly when optimized printing parameters such as lower layer thickness and higher infill density are used. Portoaca et al. 28 investigated the tribological performance of PETCF15 components fabricated using FDM and reported that infill pattern and layer height significantly influence friction and wear behavior. Similarly, Tarfaoui et al. 29 conducted experimental and numerical investigation of CF-PETG structures with rectilinear and honeycomb patterns at different densities. Honeycomb infills demonstrated higher strength and stiffness in tensile tests demonstrating elastoplastic behavior. Ferreira et al. 30 analyzed the experimental data (mechanical, microscopic, and thermal) to analyze the functionality of PETG parts with reinforced and without reinforced short carbon fiber. The study reveals that the increment of Young’s modules and flexural modules by 70% and 191% but decrease in tensile strength by 28% due to void formation by addition of fiber.
Rybarczyk et al. 31 evaluated standard thermoplastics says PLA, PA12, ABS and PETG alongside carbon fiber-reinforced polymers and reported improvements in the tensile and bending strength for reinforced materials. Although issues related to process instability and long build times were observed. Patil et al. 32 investigated the effect of infill patterns and densities on the compressive strength of CF-PETG components, reporting a maximum compressive strength of 39.16 MPa at 80% infill density using tri-hexagon infill pattern. El Mehtedi et al. 33 explored the influence of machining parameters on surface finish of PETG reinforced with short carbon fibers, highlighting the importance of optimizing post processing conditions for improved dimensional accuracy. O’Driscoll et al. 34 analyzed anisotropic mechanical behavior in recycled PET specimen’s parts fabricated using FDM and found that the layer thickness significantly influenced the mechanical characteristics of printed components.
Ulkir 35 investigated the thermomechanical behavior of FDM printed metal and fiber reinforced PLA composites using thermomechanical analysis with AI based predictive models. Such studies highlight the importance of robust experimental measurements integrated with advanced modeling approaches for accurate evaluation and optimization of additive manufactured composite materials.
Some studies also reveal that processing parameters such as raster orientation, layer thickness and printing speed significantly enhances the mechanical performance of carbon-fiber reinforcement of printed thermoplastic composites. These parameters govern interlayer bonding, porosity formation and overall mechanical behavior of carbon fiber reinforced thermoplastic composites.36–39
Despite extensive research on FDM printed polymer composites, most existing studies have primarily focused on widely used thermoplastic materials such as PLA, ABS and PETG including their carbon fiber reinforced variants such as PETG-CF. These investigations mainly emphasize parameter optimization, mechanical characterization and basic reinforcement effects. However, most of these studies are limited to PETG based system and do not fully explore higher crystallinity PET based carbon fiber composites, which may offer improved structural performance.
Previous investigations evaluated mechanical properties or process parameters independently while integrated studies combining experimental mechanical testing, microstructural analysis and finite element simulation for PETCF15 components remain largely unexplored. Therefore, there is a clear need for a systematic investigation to better understand the mechanical characteristics and failure pattern of PETCF15 composites fabricated using FDM. The present study aims to systematically investigate the mechanical behavior and fracture characteristics of FDM printed PETCF15 components at different printing conditions to address this research gap.
The novelty of this research lies in the integrated experimental-computational framework which combines mechanical characterization, microstructure analysis, and finite element modeling to comprehensively evaluate the structural response of PETCF15 composites. This integrated approach contributes to the optimization of processing parameters for providing high performance lightweight components and provides valuable insight into the process-structure-property relationship of PETCF15 composites. The outcome of this study is expected to support the broader application of PETCF15 materials in advance engineering fields such as automotive, aerospace, tooling and robotics systems where lightweight structure with enhanced mechanical reliability and structural integrity are increasingly required.
Materials, methods and measurements
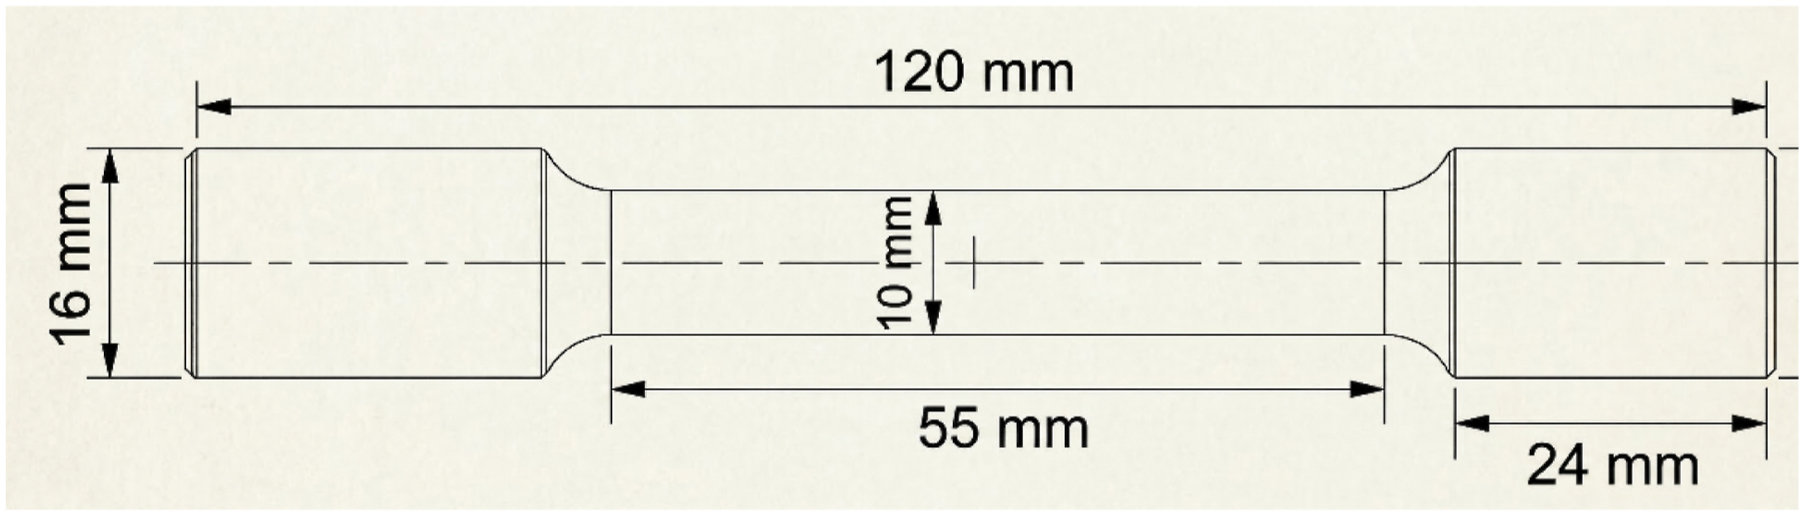
The PETCF15 jet-black filament spool (2.85 mm diameter) is selected to fabricate the components using BCN3DEpsilon W50 3D printer. BCN3D Epsilon W50 3D Printer is shown in Figure 1. The specimen geometry is designed using Solid Edge software and the dog-bone-shaped design is shown in Figure 2. The completed CAD model is then exported in Standard Tessellation Language (STL) format, enabling it to be processed by the BCN3D slicing software. The build volume of the printer used is 420 mm × 300 mm × 400 mm. BCN3D Epsilon W50 3D printer. Details of dog boned shaped tensile test sample (units mm).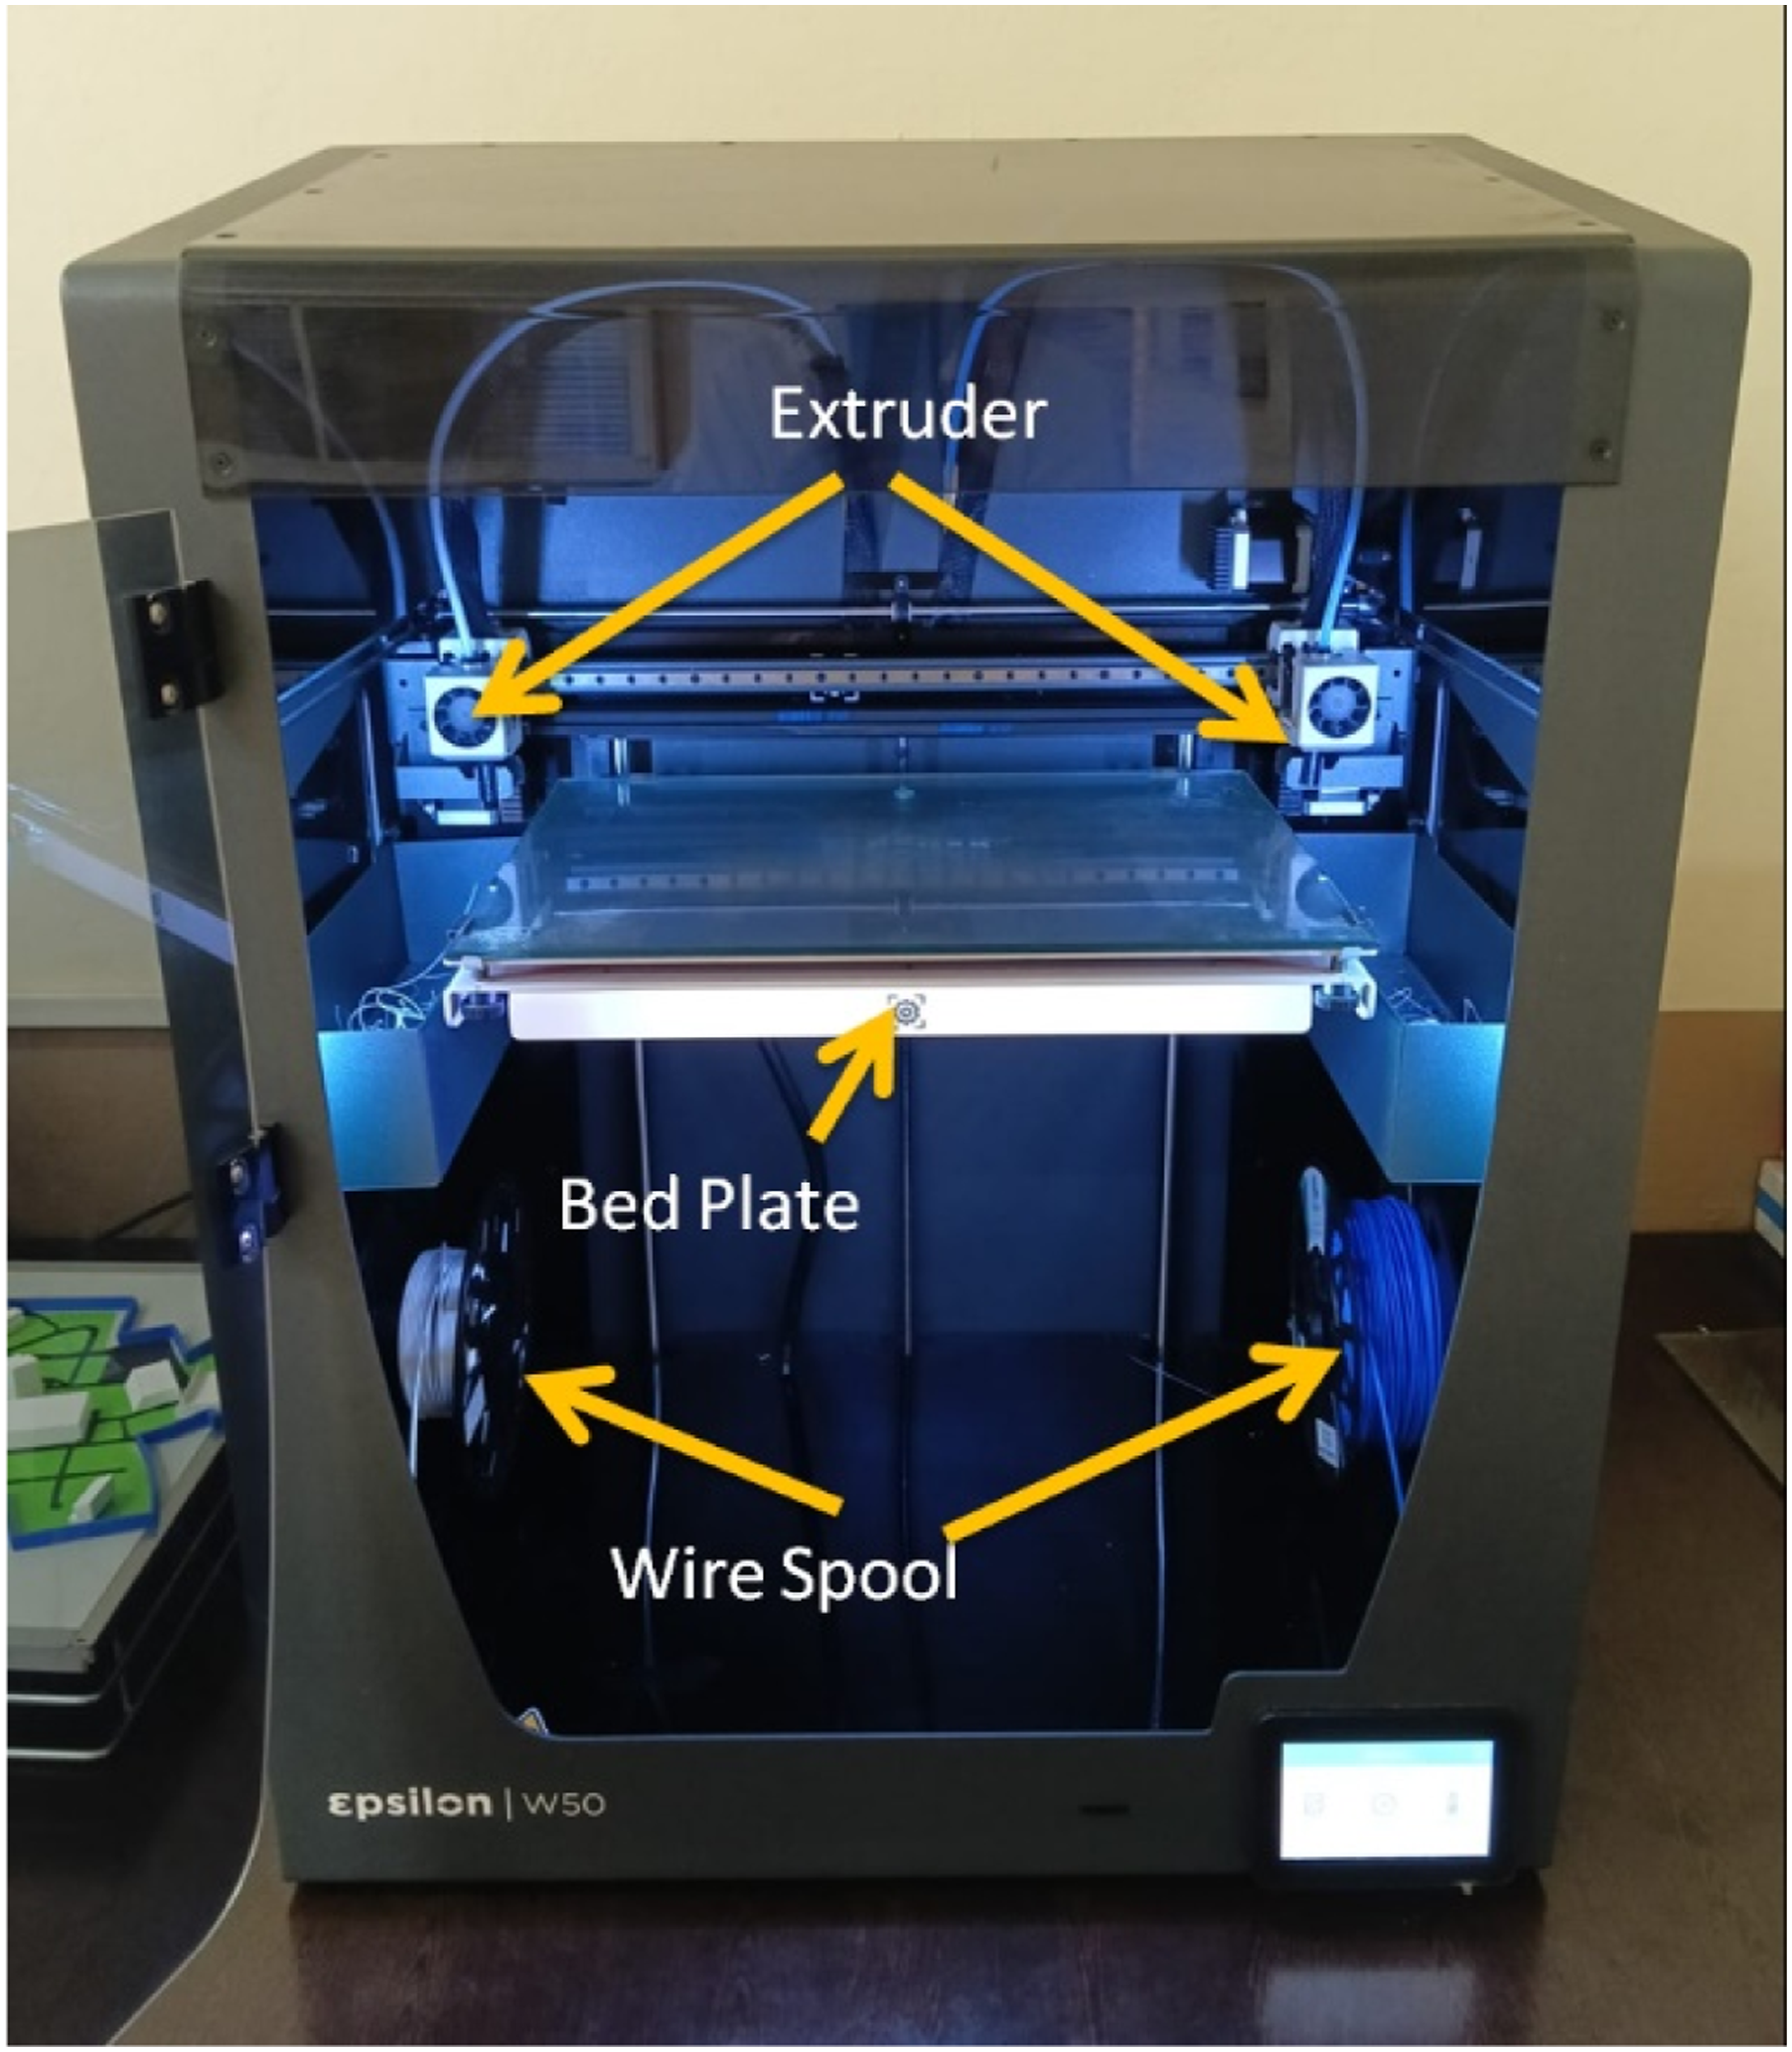
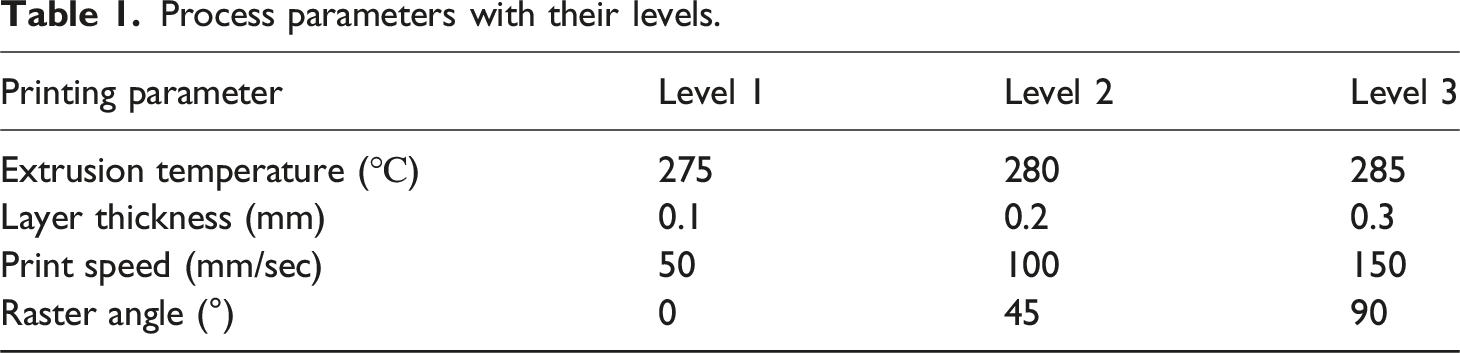
The mechanical performance of FDM-printed PETCF-15 is highly responsive to process parameters that control melt flow behavior, interlayer bonding, carbon fiber-PET interaction, and anisotropic load transfer. In this study, extrusion temperature, layer thickness, print speed, and raster angle were selected as the main process parameters to directly influence the tensile strength, yield behavior, and failure mechanism of PETCF 15 composites. Extrusion temperature governs polymer melt viscosity and carbon fiber-PET matrix adhesion, which are critical for effective stress transfer in printed PETCF-15 composites during tensile testing. Layer thickness affects interlayer contact area and void formation, thereby influencing strength and ductility. Print speed controls the material deposition rate and cooling rate, which impacts the interlayer bonding quality, while raster angle determines the printing direction relative to the loading direction, influencing the anisotropic material behavior. Accordingly, these parameters with their selected levels were considered for focused investigation due to their dominant and combined effect on mechanical integrity after printing the PETCF-15 specimen. The other printing parameters such as nozzle diameter, bed plate temperature, infill pattern, infill density, and printing orientation were kept constant based on manufacturer recommendations and to minimize experimental variability. The selection of parameter levels based on processing constraints is consistent with approaches reported in the literature. 40
Process parameters with their levels.
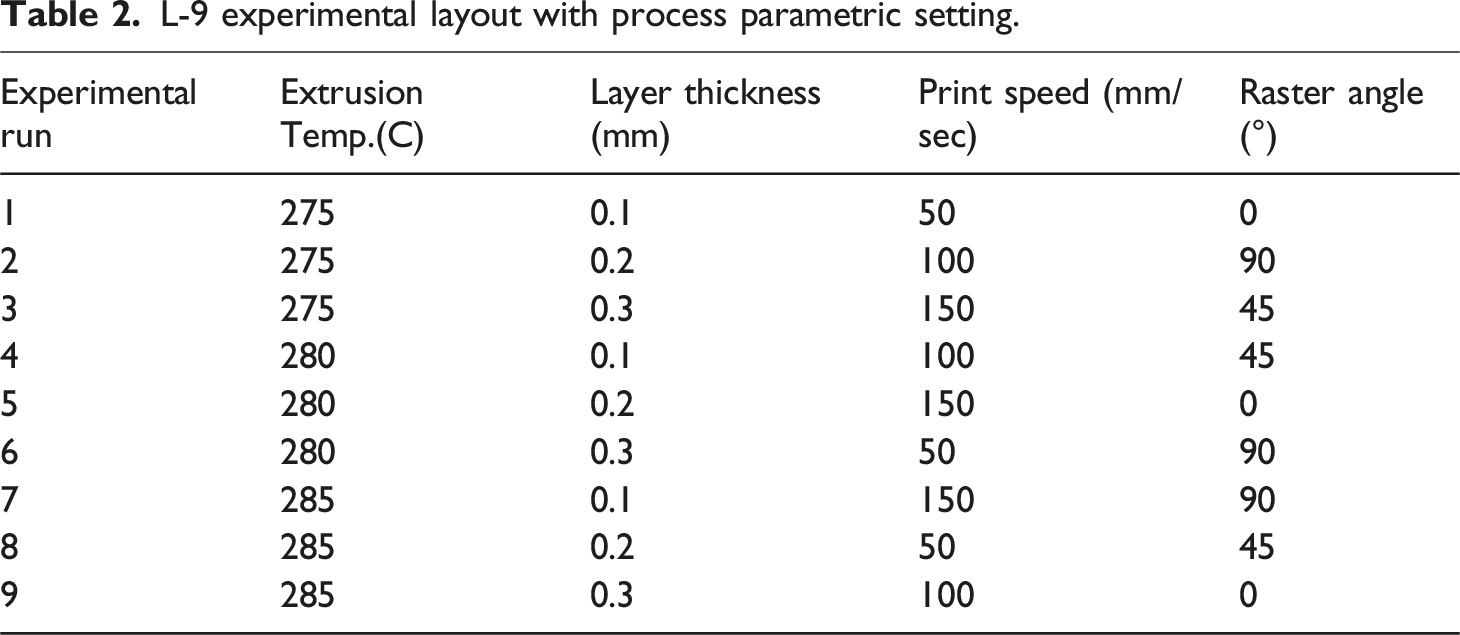
L-9 experimental layout with process parametric setting.
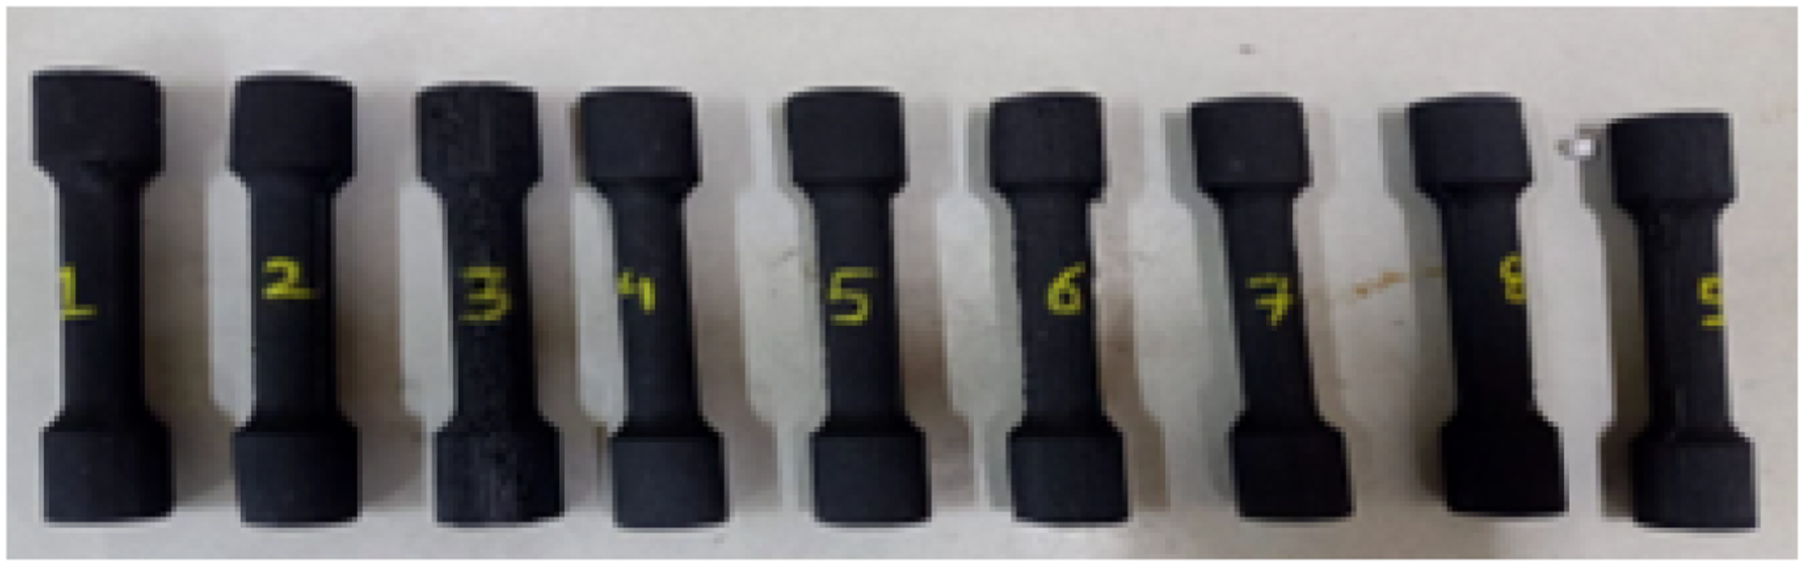
Printed samples.
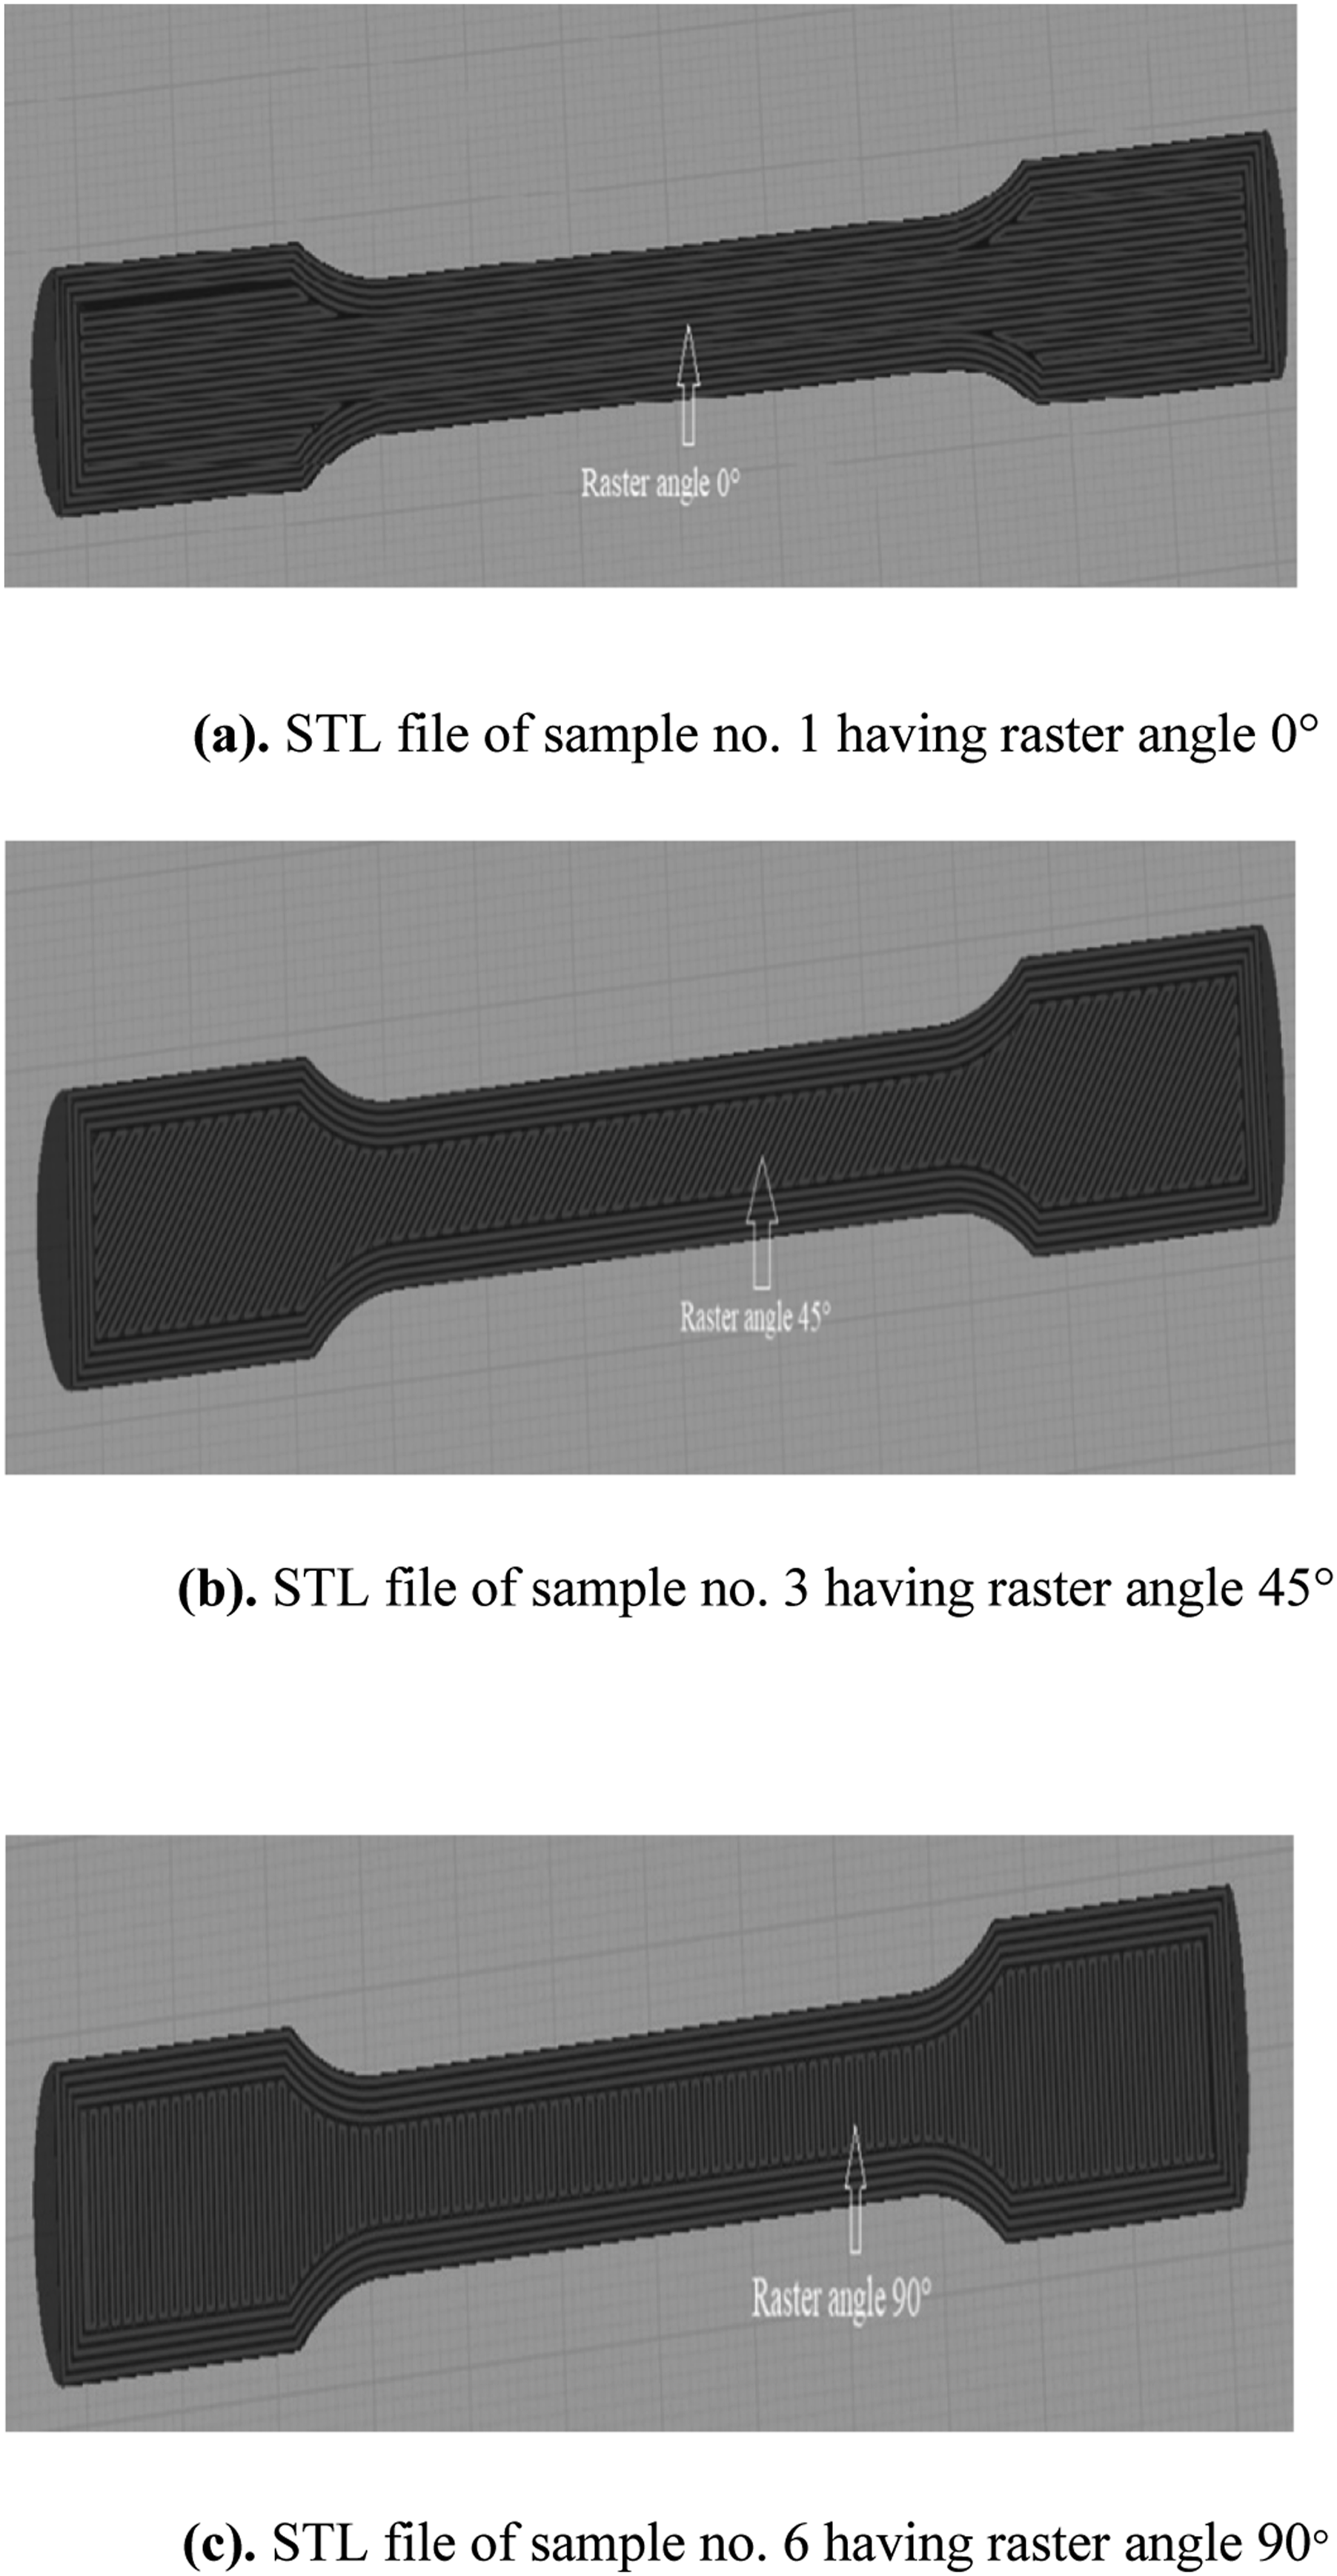
(a). STL file of sample no. 1 having raster angle 0°. (b) STL file of sample no. 3 having raster angle 45°. (c). STL file of sample no. 6 having raster angle 90°.
Olsen Universal Testing Machine (Model H50KL) is utilized for performing tensile test for each printed specimen (Figure 5). The sample is gripped with the help of pneumatic grip. The samples are subjected to constant strain rate (5 mm/min) till its failure. Throughout each test, the applied load and corresponding elongation are recorded continuously to determine the mechanical response. Tinius Olsen universal testing machine, model H50KL.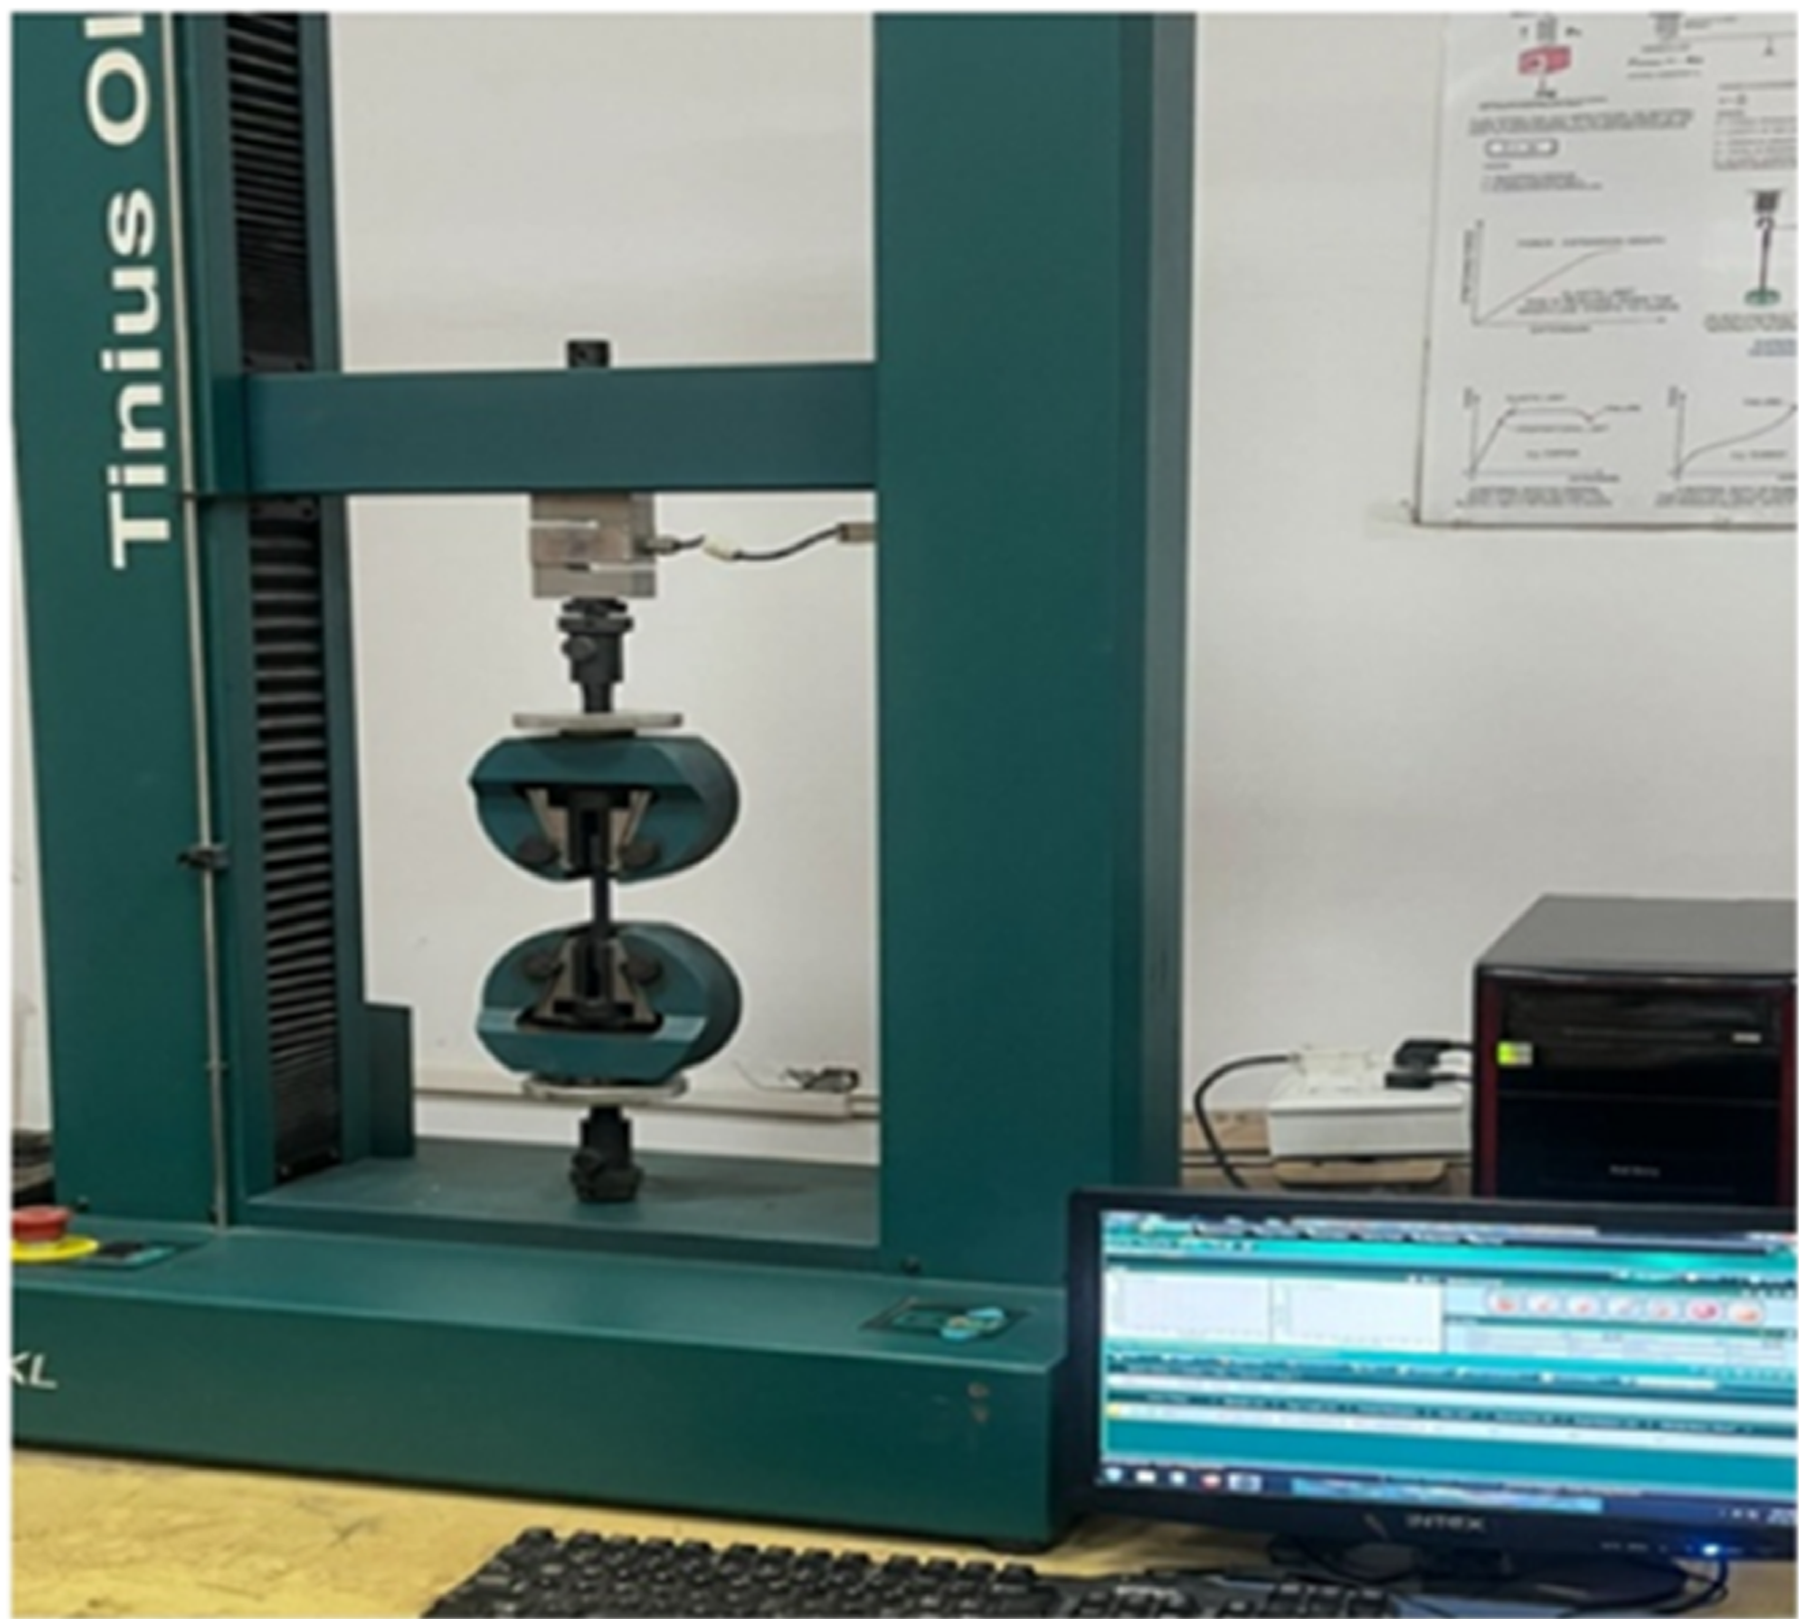
The following mechanical properties are calculated after collecting experimental data.
Tensile Strength (σut): Tensile strength is calculated by dividing the applied maximum load (N) to original cross-sectional area of gauge length (mm2) of the specimen.
Yield Strength (MPa): The yield strength is measured by 0.2% offset method. After plotting stress strain diagram, yield point is marked by the point where permanent plastic deformation begins to start.
Ductility/Percentage Elongation (%): This is obtained by following equation.
Lf = Final gauge length after fracture.
Lo = Original gauge length.
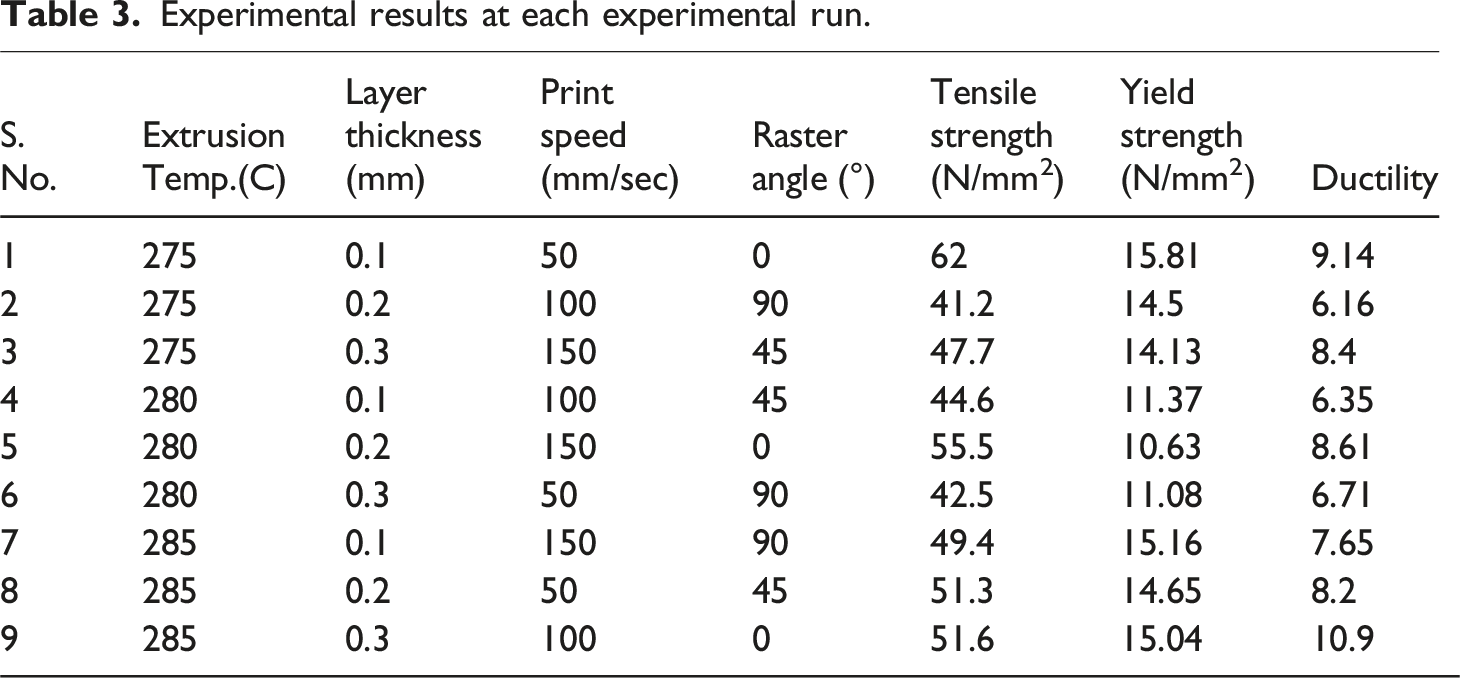
Experimental results at each experimental run.
Computation of Grey Relational Grade (GRG).
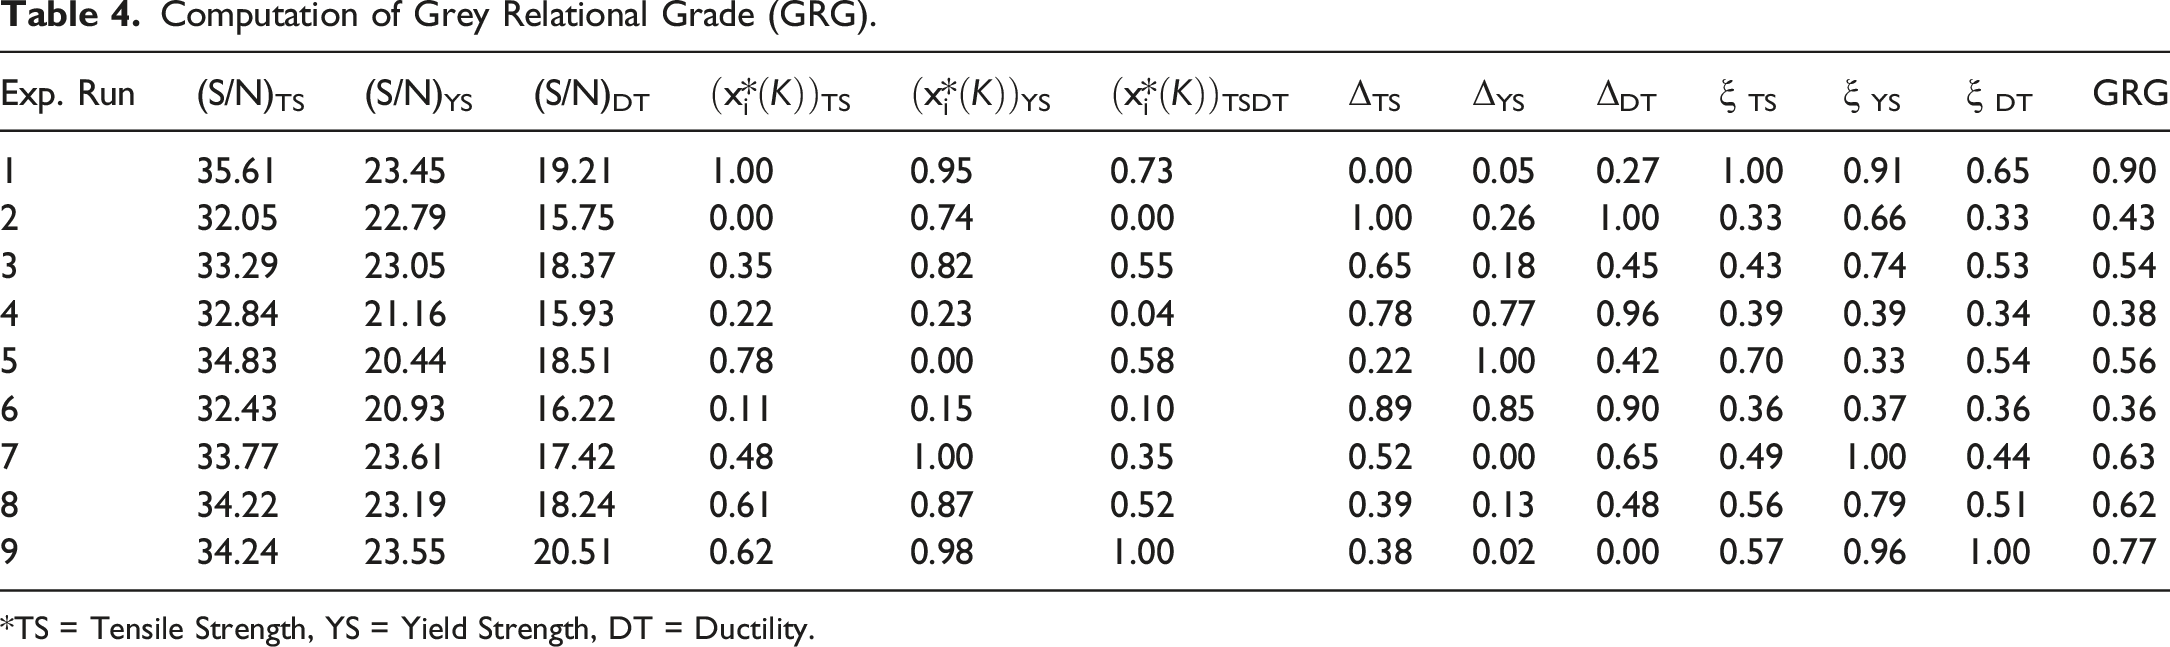
*TS = Tensile Strength, YS = Yield Strength, DT = Ductility.
Results and discussion
Effect of process parameters on tensile strength
It is evident from Figure 6(a) that maximum tensile strength (50.59 N/mm2) is observed at the maximum level of extrusion temperature (285°C). Extrusion temperature is found to be influential factor (37.67 %) to affect the grey relational grade (GRG) as discussed in the multi response optimization using weighted grey Taguchi methodology section. The elevated extrusion temperature reduces the melt viscosity and enhances the flow, fiber wetting and interlayer diffusion, which is critical for strong bonding in printed PETCF-15 composites. The insufficient fusion, higher viscosity and limiting coalescence results in lower tensile strength reported at 280°C and 275°C. (a) Mean effect plot between printing parameters and tensile strength. (b) Mean effect plot between printing parameters and yield strength. (c) Mean effect plot between printing parameters and ductility (% elongation). Analysis of variance of Grey Relational Grade (GRG). The bold digits are used to show the percent contribution of significant process parameters.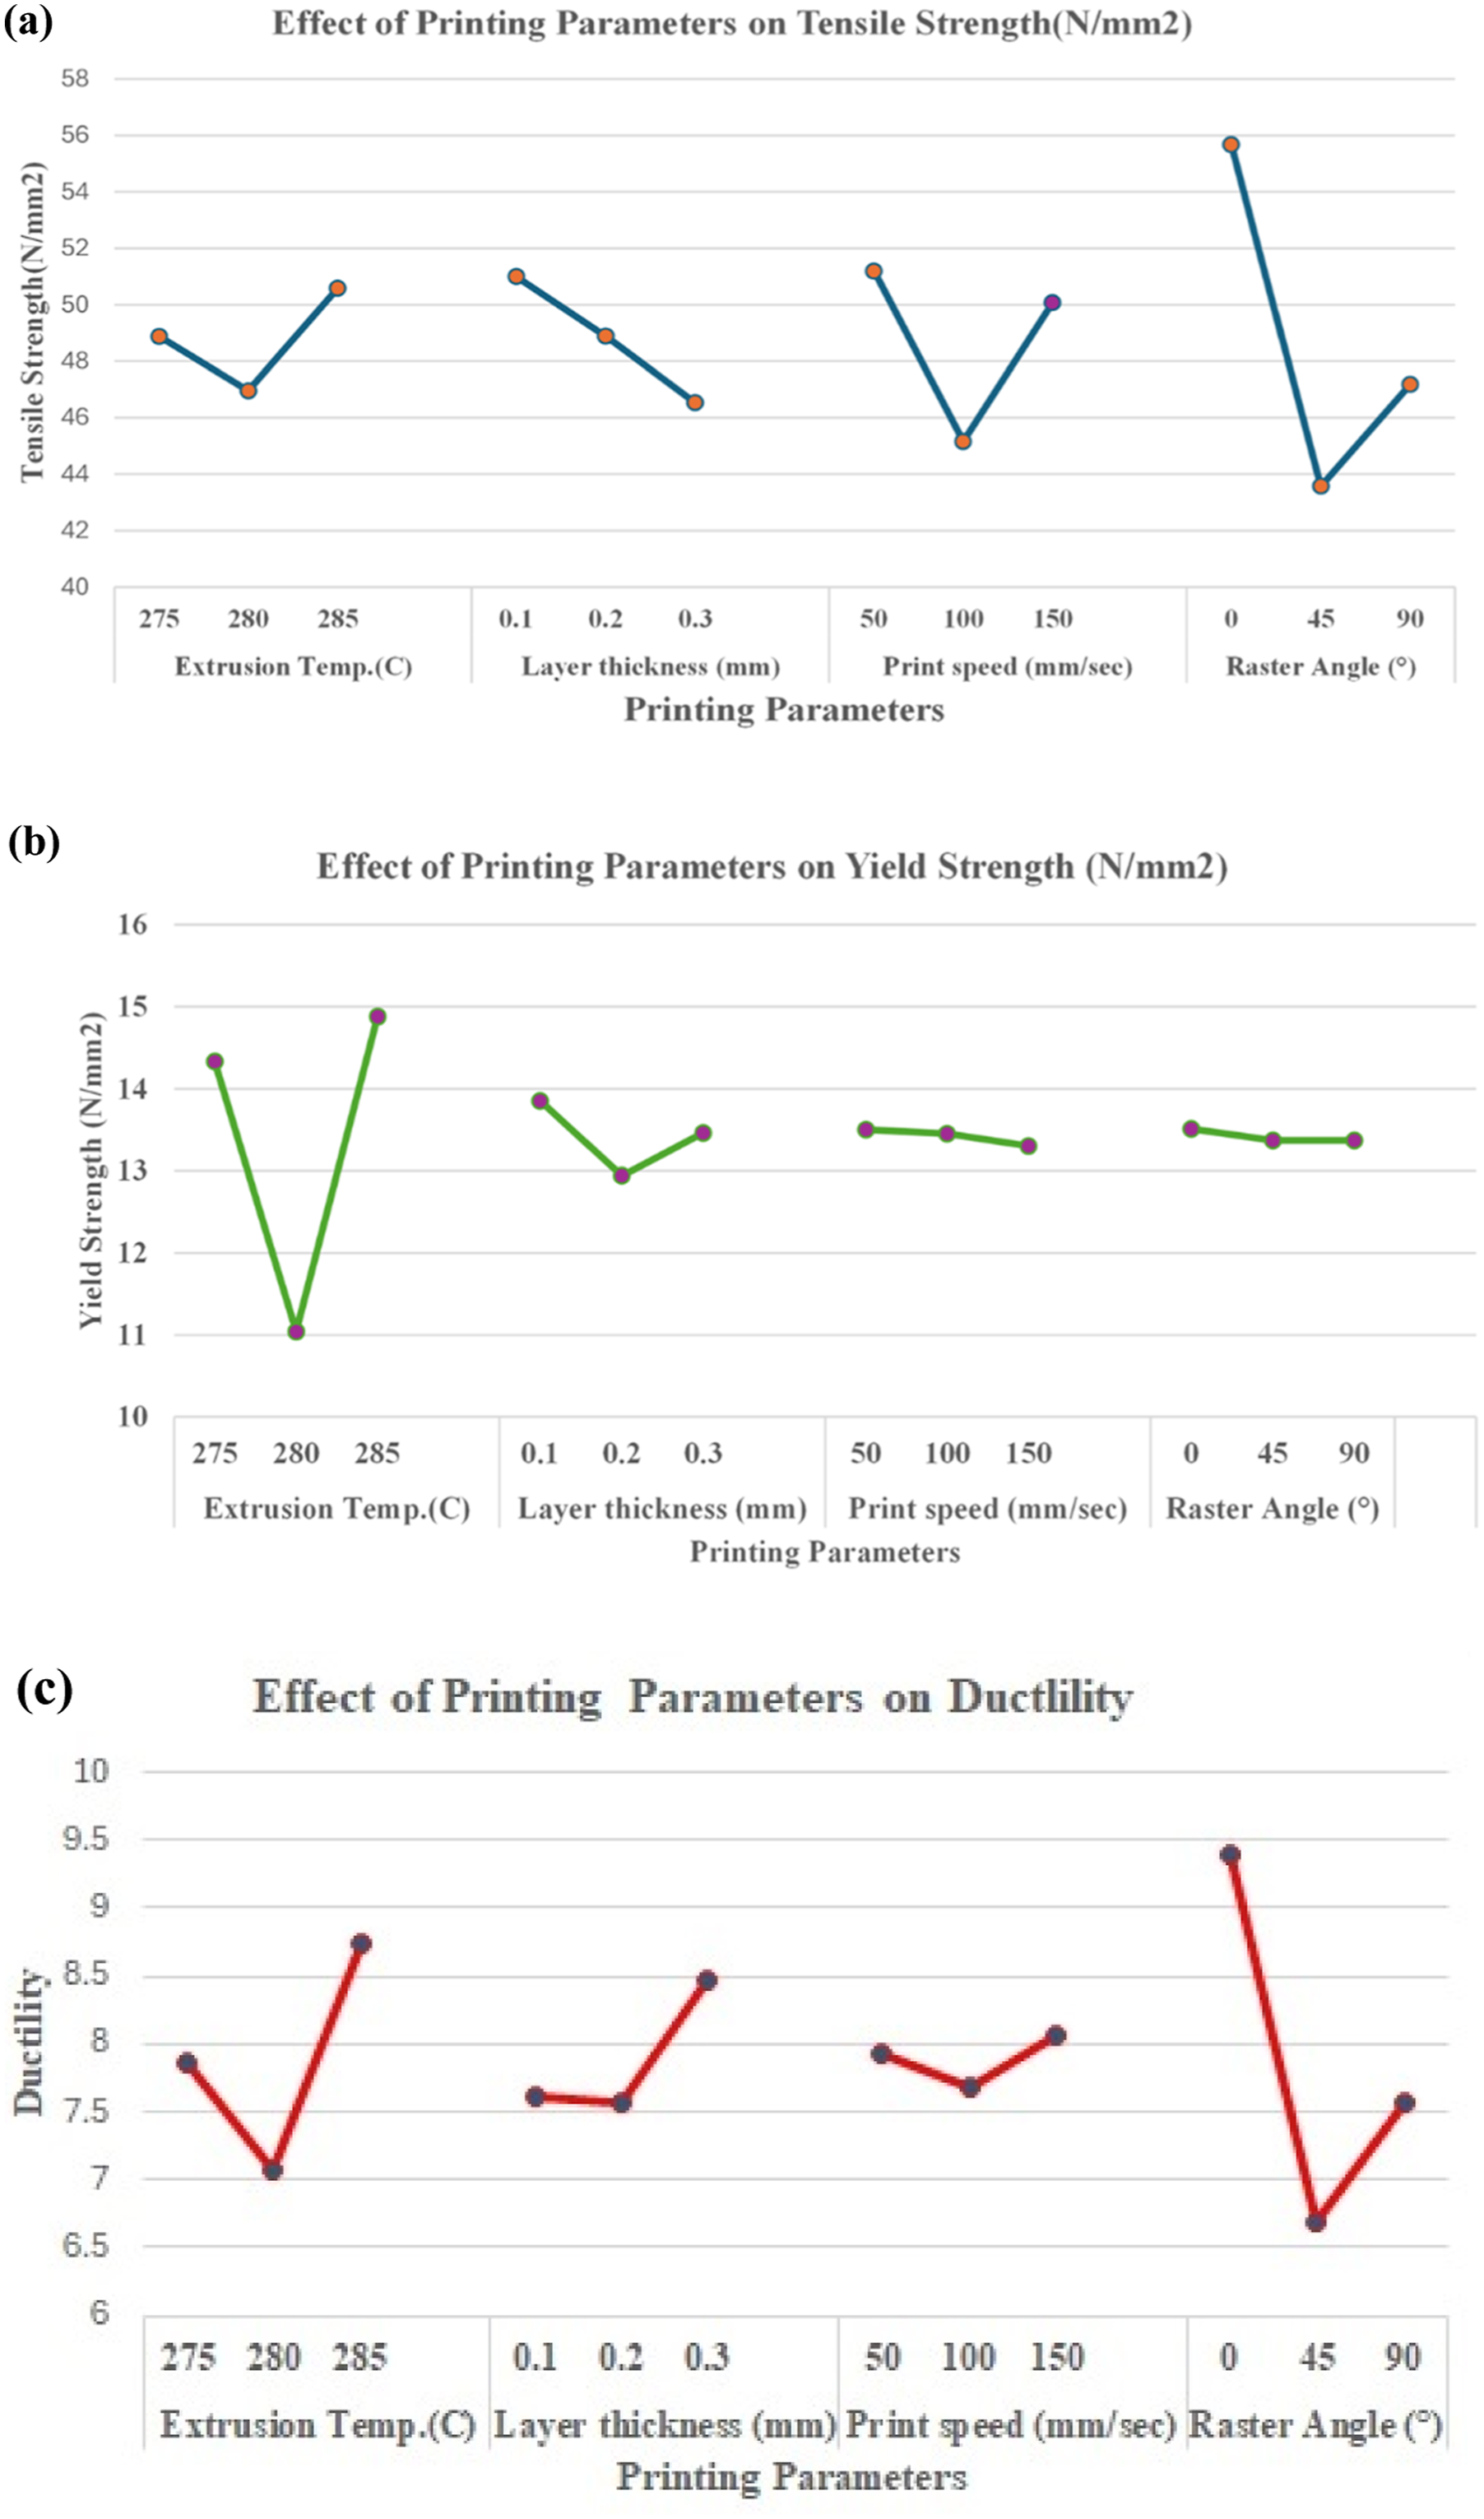
The 0.1 mm layer thickness is found to be the best value for achieving the maximum tensile strength (51 N/mm2). The lower level of layer thickness increases the interlayer adhesion resulting in increased tensile strength. The tensile strength is found to decrease to (46.53 N/mm2) at the 0.3 mm layer thickness. The lower layer thickness increases the thermal reheating cycle during printing process. The increased reheating cycle promotes the better interlayer molecular entanglement and minimizes the porosity of printed layer. It improves the bond integrity in the build direction resulting in increased tensile strength of PETCF-15 samples.
The specimen printed at 50 mm/sec exhibited the highest tensile strength (51.2 N/mm2). The tensile strength is found to be minimum at the 100 mm/sec printing speed and slightly again increases at the printing speed of 150 mm/sec. The slow deposition rate during the printing process extends the nozzle residence time. It facilitates adequate heating, cooling and crystallization responsible for enhanced interlayer adhesion and carbon fiber- PET interaction in viscous melt in printing process.
Raster angle 0° exhibits highest tensile strength (55.68 N/mm2) while tensile strength is found to be the lowest at 45° raster angle (43.57 N/mm2). It may be attributed to the fact that if the raster paths are aligned with loading direction, then stress transferred is improved significantly. Raster angle found is to be most influential factor (49.88 %) to affect the grey relational grade (GRG) as discussed in the multi response optimization using weighted grey Taguchi methodology section. The raster angle at 0° aligns the short carbon fiber with deposited raster parallel to the uniaxial loading direction. It facilitates efficient axial stress transfer, fiber bridging and reduced shear at inter-raster and interlayer interfaces of PETCF-15 samples during tensile tests. The raster angle at 45° orientation introduces the significant shear stresses which promotes the premature interlayer delamination or matrix failure at weaker interfaces. The tensile strength at 90° raster angle improves significantly as compared to 45° raster angle due to lower shear dominance. The tensile strength is lower at 90°as compared to 0°, as short carbon fibers are oriented to transverse to the loading direction which reduces the effective fiber reinforcement in matrix and subsequently the matrix must carry the applied load resulting in lower values of tensile strength.
Effect of process parameters on yield strength
The impact of key printing parameters on the yield strength of 3D-printed PETCF15 specimens is shown in Figure 6(b). The specimen printed at 285°C exhibited the highest yield strength (14.88 N/mm2). The results indicate that the yield strength is significantly varying with change in the extrusion temperature The increased yield strength is linked to elevated extrusion temperature. The higher extrusion temperature decreases the viscosity of the material coming out at the exit of the nozzle. The subsequent enhanced material flow increases carbon fiber wetting and interfacial bonding. It results into better stress transfer and delayed yielding.
The layer thickness at lower value (0.1 mm) exhibits the highest yield strength (13.85 N/mm2.). The Yield strength is reported to be minimum (12.94 N/mm2) at 0.2 mm layer thickness and subsequently slightly increased to 13.46 N/mm2) at 0.3 mm layer thickness. The lower layer thickness improves the interlayer contact between the two consecutive layers resulting in reduced porosity and subsequently increased molecular diffusion during printing. It leads to increased yield strength of printed PETCF- 15 specimen.
The effect of print speed shows minor changes, though there is a slight reduction in strength at printing speed of 150 mm/s. Higher printing speed reduces the residence time available at the exit of the nozzle. It causes insufficient time for interlayer fusion subsequently leading to weaker molecular entanglement and poor adhesion between two consecutive printed layers. It causes the yielding of material earlier under applied load.
The yield strength is slightly varying with the change of raster angle from 0° to 45° and 90°. The highest yield strength (13.51 N/mm2) reported at 0° raster angle, as the carbon fiber aligned with principal stress maximizes the yield performance in PETCF-15 composite at 0° raster angle.
Effect of process parameters on ductility (% Elongation)
Figure 6(c) represents the effect of printing parameters (extrusion temperature, layer thickness, print speed, and raster angle) on the ductility (% elongation) of carbon-fiber-reinforced PET (PETCF15) specimen.
The highest ductility (% elongation) is reported as 8.75 at 285°C extrusion temperature. The lowest ductility (% elongation) is found to be 7.069 at 280°C extrusion temperature. The higher amount of ductility at elevated temperature could be attributed to fact that melt flow, enhanced fiber-matrix bonding and reduced interfacial stress concentration results in the larger plastic deformation before failure.
The ductility (% elongation) is reported to be slightly influenced while changing the layer thickness from 0.1 mm to 0.2 mm layer thickness while the highest ductility (8.479 % elongation) is obtained at 0.3 mm layer thickness. The effect of printing speed on ductility (% elongation) is seen to be less influential and it can be concluded that highest amount of ductility (8.062 % elongation) is found at 150 mm/sec.
Raster angle at 0° shows the maximum deformation capacity (9.4 % elongation) of PETCF-15 prints while 45° raster angle represented the restricted elongation (6.697% elongation) which may be due to misalignment and stress localization in printed samples. Raster angle at 0° aligns the fibers to bear tensile loads more effectively along the stress direction. It results in ductile failure mode due to fiber pull-out, matrix shearing in efficient manner. In contrast, the 45° raster angle misaligns fibers orientation relative to the applied load, which leads to stress localization and shear-dominated failure. It results in brittle like material behavior with restricted elongation.
The results obtained are in good agreement with recent studies reported by Ammar S et al. 41 and M. Dhouioui et al. 42 on carbon fiber reinforced composites fabricated using FDM processes. These studies demonstrated that printing parameters such as raster angle, printing speed, extrusion temperature and layer thickness significantly influence the mechanical and microstructural characteristics of printed components. A raster angle of 0° aligned with the loading direction provides higher stiffness and strengths, whereas a 90° orientation led to more brittle fracture behavior (as confirmed in Figure 14(c)). Higher printing speed tends to increase porosity and reduce stiffness while elevated extrusion temperature enhanced interlayer bonding and overall mechanical performance. These observations closely corroborate the trends obtained in present study.
Stress- strain behavior of PETCF-15 samples
Figure 7 highlights the stress-strain curve of the printed PETCF15 specimens. All 9 samples display the initial elastic region followed by nonlinear deformation till failure. The variation in stress and strain among the nine printed samples reflects the influence of process parametric conditions for printing, fiber dispersion and interfacial bonding between PET matrix and carbon fibers. Stress–strain curves of 3D printed PETCF15 specimens fabricated under L9 experimental setting.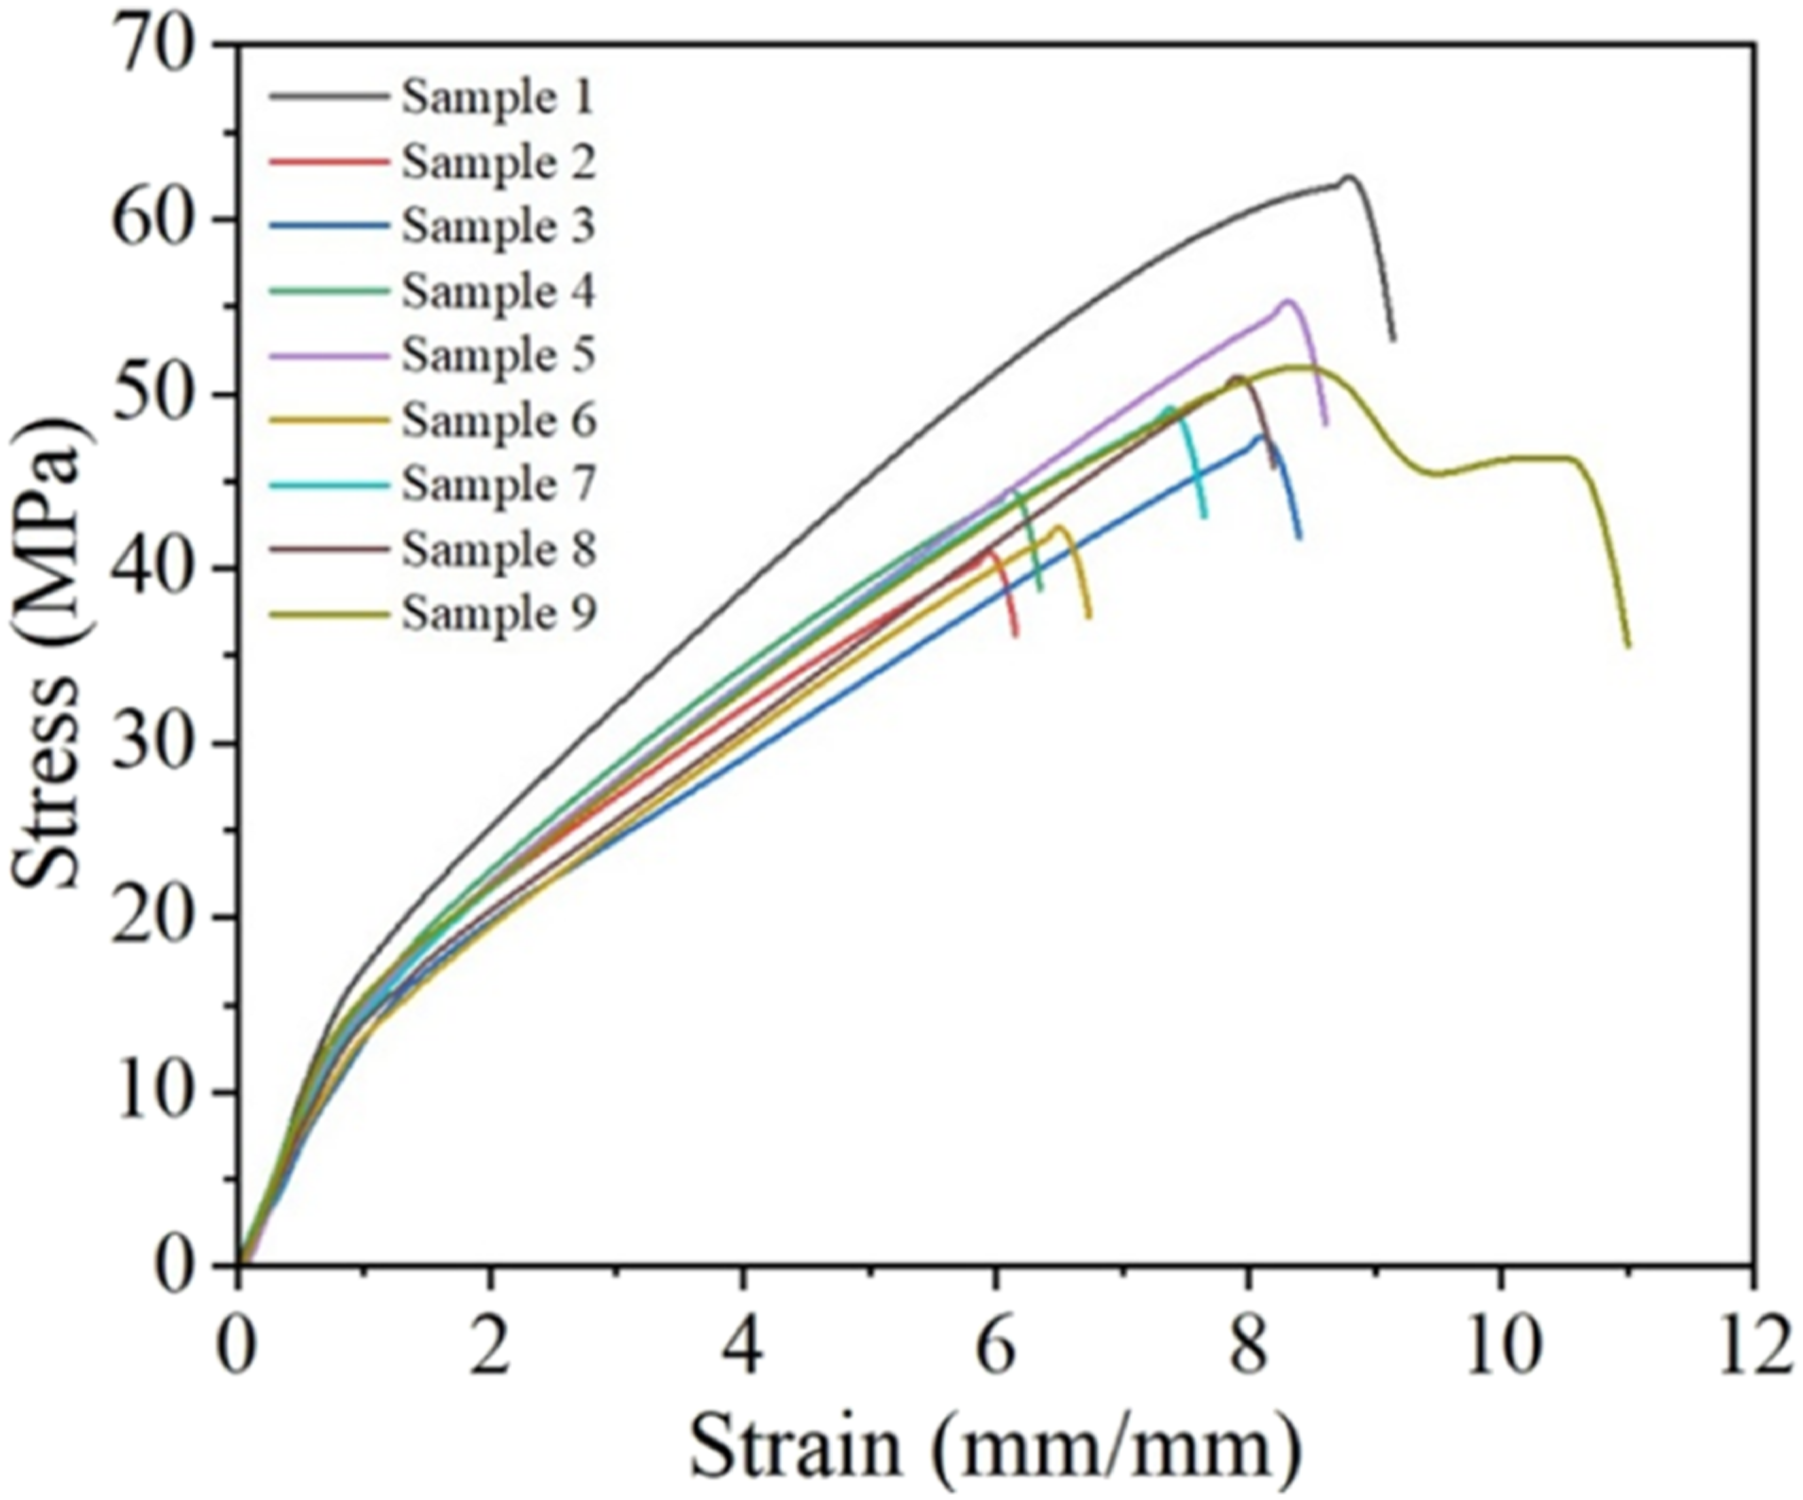
Printed sample 1 exhibits the maximum stress (62 N/mm2) demonstrating the effective stress transfer between the PET matrix and the carbon fibers. Strong fiber-matrix adhesion and decreased interfacial slippage are revealed by the steeper slope in the elastic region. However, this enhanced load bearing tendency comes at the expense of ductility, as reflected in moderate value of strain (9.14). Conversely, printed sample 9 exhibits the highest strain values (10.9 mm/mm) with slightly reduced tensile strength (51.6 N/mm2).
The higher ductility indicates that localized stress concentration is accommodated at the optimized level specifically due to improved layer fusion or reduced thermal gradients allowing the matrix to deform plastically even after partial fiber-matrix deboning. The printed samples in the range of 2 to 8 exhibits the intermediate performance in terms of tensile strength between 40 and 55 N/mm2 and strain ranging from 6.16 to 8.61 mm/min. The reduction in stress observed in stress strain curves indicates the failure modes of printed PETCF-15 composites due to interfacial bonding, micro-void initiation and weak layer adhesion.
The higher tensile strength may be attributed to the fiber-matrix wetting and reduced void content. The higher ductility may be due to the more uniform stress distribution and reduced interfacial stress concentration. The variation of mechanical properties such as tensile strength, yield strength and ductility is also depicted in Figure 8. Comparison of mechanical properties of 3D printed PETCF15 specimens fabricated under L9 experimental setting.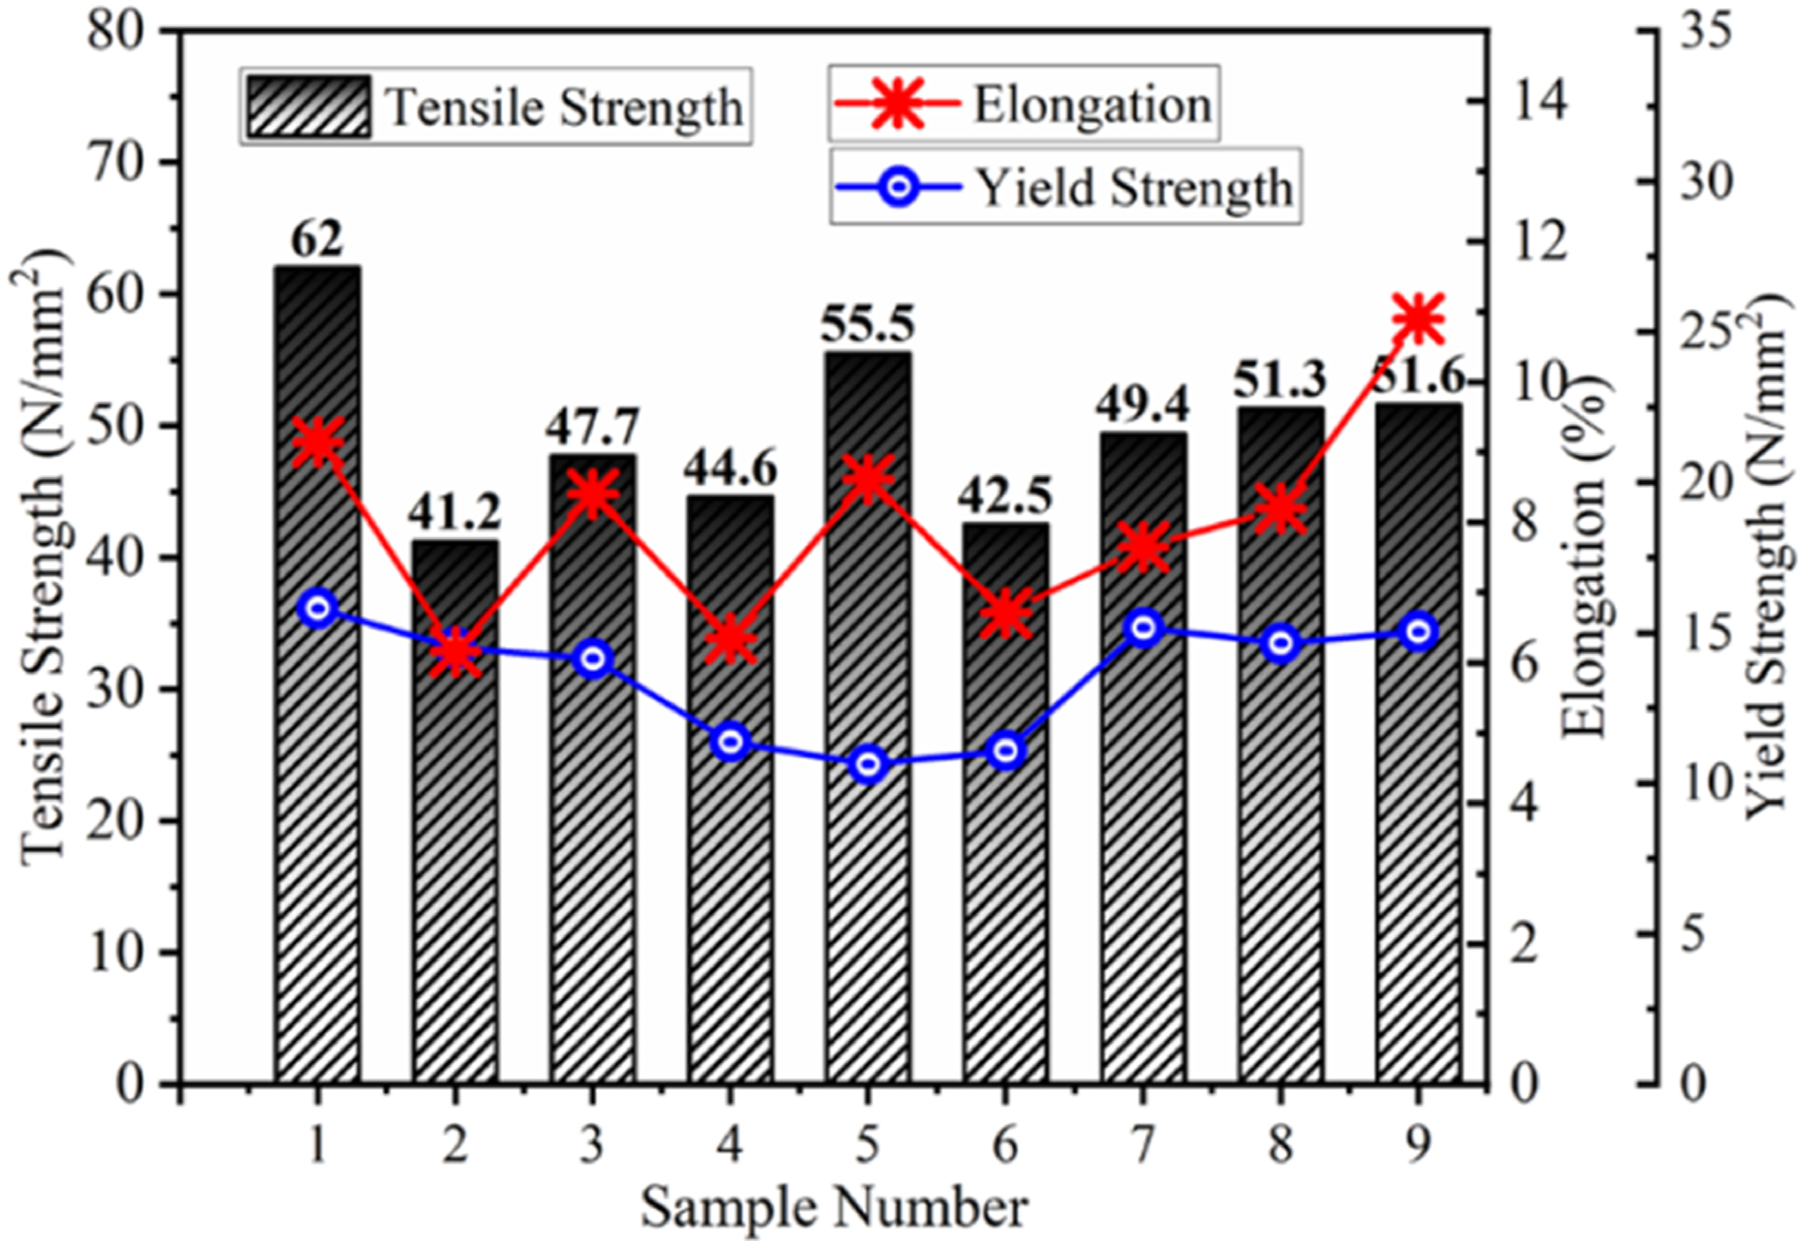
The above results indicate a significant improvement over the previously reported PETG and PETG based carbon fiber reinforced materials used in FDM process. Ferreira et al. 30 reported tensile strength of 41.51 ± 0.99 MPa for PETG (without reinforcement) and 29.80 ± 1.30 MPa for PETGCF-20 (with short carbon fiber reinforcement). In contrast, the PETCF-15 specimen developed in the present study achieved a significantly higher tensile strength of 62 MPa. The current reported tensile strength indicates the improvement of approximately 49% over near PETG and more than 100% over PETGCF-20 samples reported in study. 31 Rybarczyk et al. 31 reported tensile strength of 32.8 MPa and 45.61 MPa of PETG and PETG (with 10% carbon fiber) samples respectively in FDM process. The current study demonstrates the 36% and 90% improvement of tensile strength as compared to reported study. 31
The above improvement of tensile strength in PETCF-15 as compared to PETG/PETGCF-20/PETGCF-10 is primarily attributed to the higher crystallinity of PET. PETG is largely amorphous due to glycol modification, which suppresses crystallization, PET can develop a high degree of crystalline region. Increased crystallinity enhances stiffness and promotes more effective stress transfer between carbon fiber and PET matrix. In addition, optimized process parametric conditions and raster orientation reduces the internal defects and improved interfacial bonding between printed layers resulting in better mechanical properties.
It is imperative to balance the tensile strength, yield strength along with ductility to ensure that PETCF15 composite achieve high stiffness with adequate toughness for structural application. These tensile test results are subsequently analyzed through the weighted grey Taguchi method to simultaneously optimize tensile strength, yield strength, and ductility, with the goal of establishing the most effective parameter settings for fabricating PETCF15 parts with improved mechanical response.
Multi-response optimization using weighted grey Taguchi methodology
In this study, a hybrid weighted grey Taguchi analysis is adopted to optimize the mechanical properties of 3D printed PETCF15 specimens. The output responses (tensile strength, yield strength, and ductility) considered in this study could contribute differently to the overall performance of the composite. In this study, the weights of 0.5 for tensile strength, 0.3 for yield strength, and 0.2 for ductility were assigned based on the functional demands of the PETCF15 composite parts, which are intended for lightweight brackets in automotive applications, robotic arms, structural frames, and other general-purpose functional components produced by FDM 3D printing. Tensile strength may be considered as the most critical mechanical property which determines the maximum load bearing capacity before fracture. Its weightage is assigned 0.5 considering its importance in structural integrity of the printed part. Yield strength mainly governs the onset of plastic deformation which influences the dimensional stability and operation safety of the parts under loading conditions. The weightage of 0.3 is assigned to yield strength for the same reason. Ductility contributes to the toughness and damage tolerance of the material avoiding brittle failure. Considering its influence on mechanical performance of printed parts its weightage is assigned as 0.2.
The following steps are considered to implement the weighted grey Taguchi methodology.
Calculation of Signal-to-Noise (S/N) Ratios for Each Response: The S/N ratio for each response is calculated using the larger-is-better criterion, as higher values of tensile strength, yield strength, and ductility are desired for improved mechanical performance. The S/N ratio is determined using the following expression: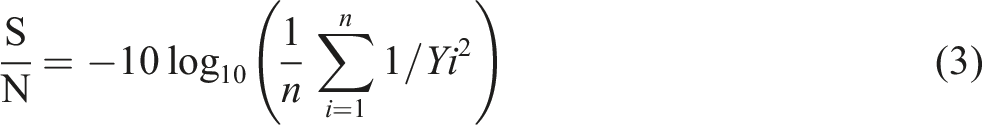
Normalize the S/N Ratios for Each Response: To enable comparison across different responses, the S/N ratios are normalized according to the larger-is-better objective using the following equation: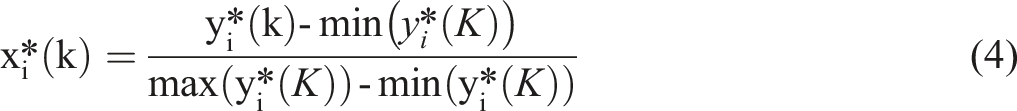
Assignment of Weights: To account for the relative importance of each response in the overall performance, the following weights are used:
Tensile strength: 0.5, Yield strength: 0.3, Ductility: 0.2.
Calculation of Grey Relational Coefficient (GRC): The next step involved determining the Grey Relational Coefficient for each response in every experiment. First, the deviation sequence is calculated as:
Computation of GRC: The grey relational coefficient is calculated in following manner: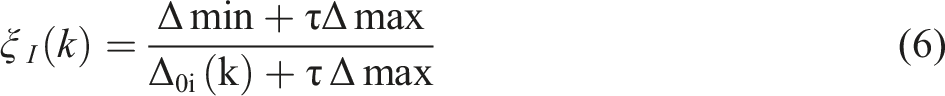
Computation of the Weighted Grey Relational Grade (GRG): The overall performance index, the Grey Relational Grade, is then computed for each experiment as a weighted sum of the GRCs for all responses (Table 4):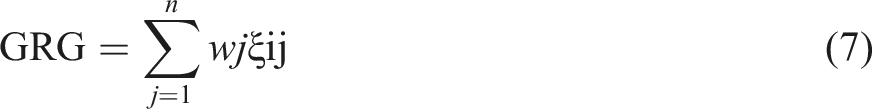
Identify Optimal Parameter Settings: The mean effect plot is plotted to identify the optimized printing parameters influencing the grey relational grade of this study (Figure 9). The mean effect plot indicates that of extrusion temperature- 285°C, layer thickness −0.1 mm, print speed – 50 mm/sec and raster angle-0° are the optimized parametric levels for highest grey relational grade. Mean effect plot between Grey Relational Grade (GRG) and printing parameters.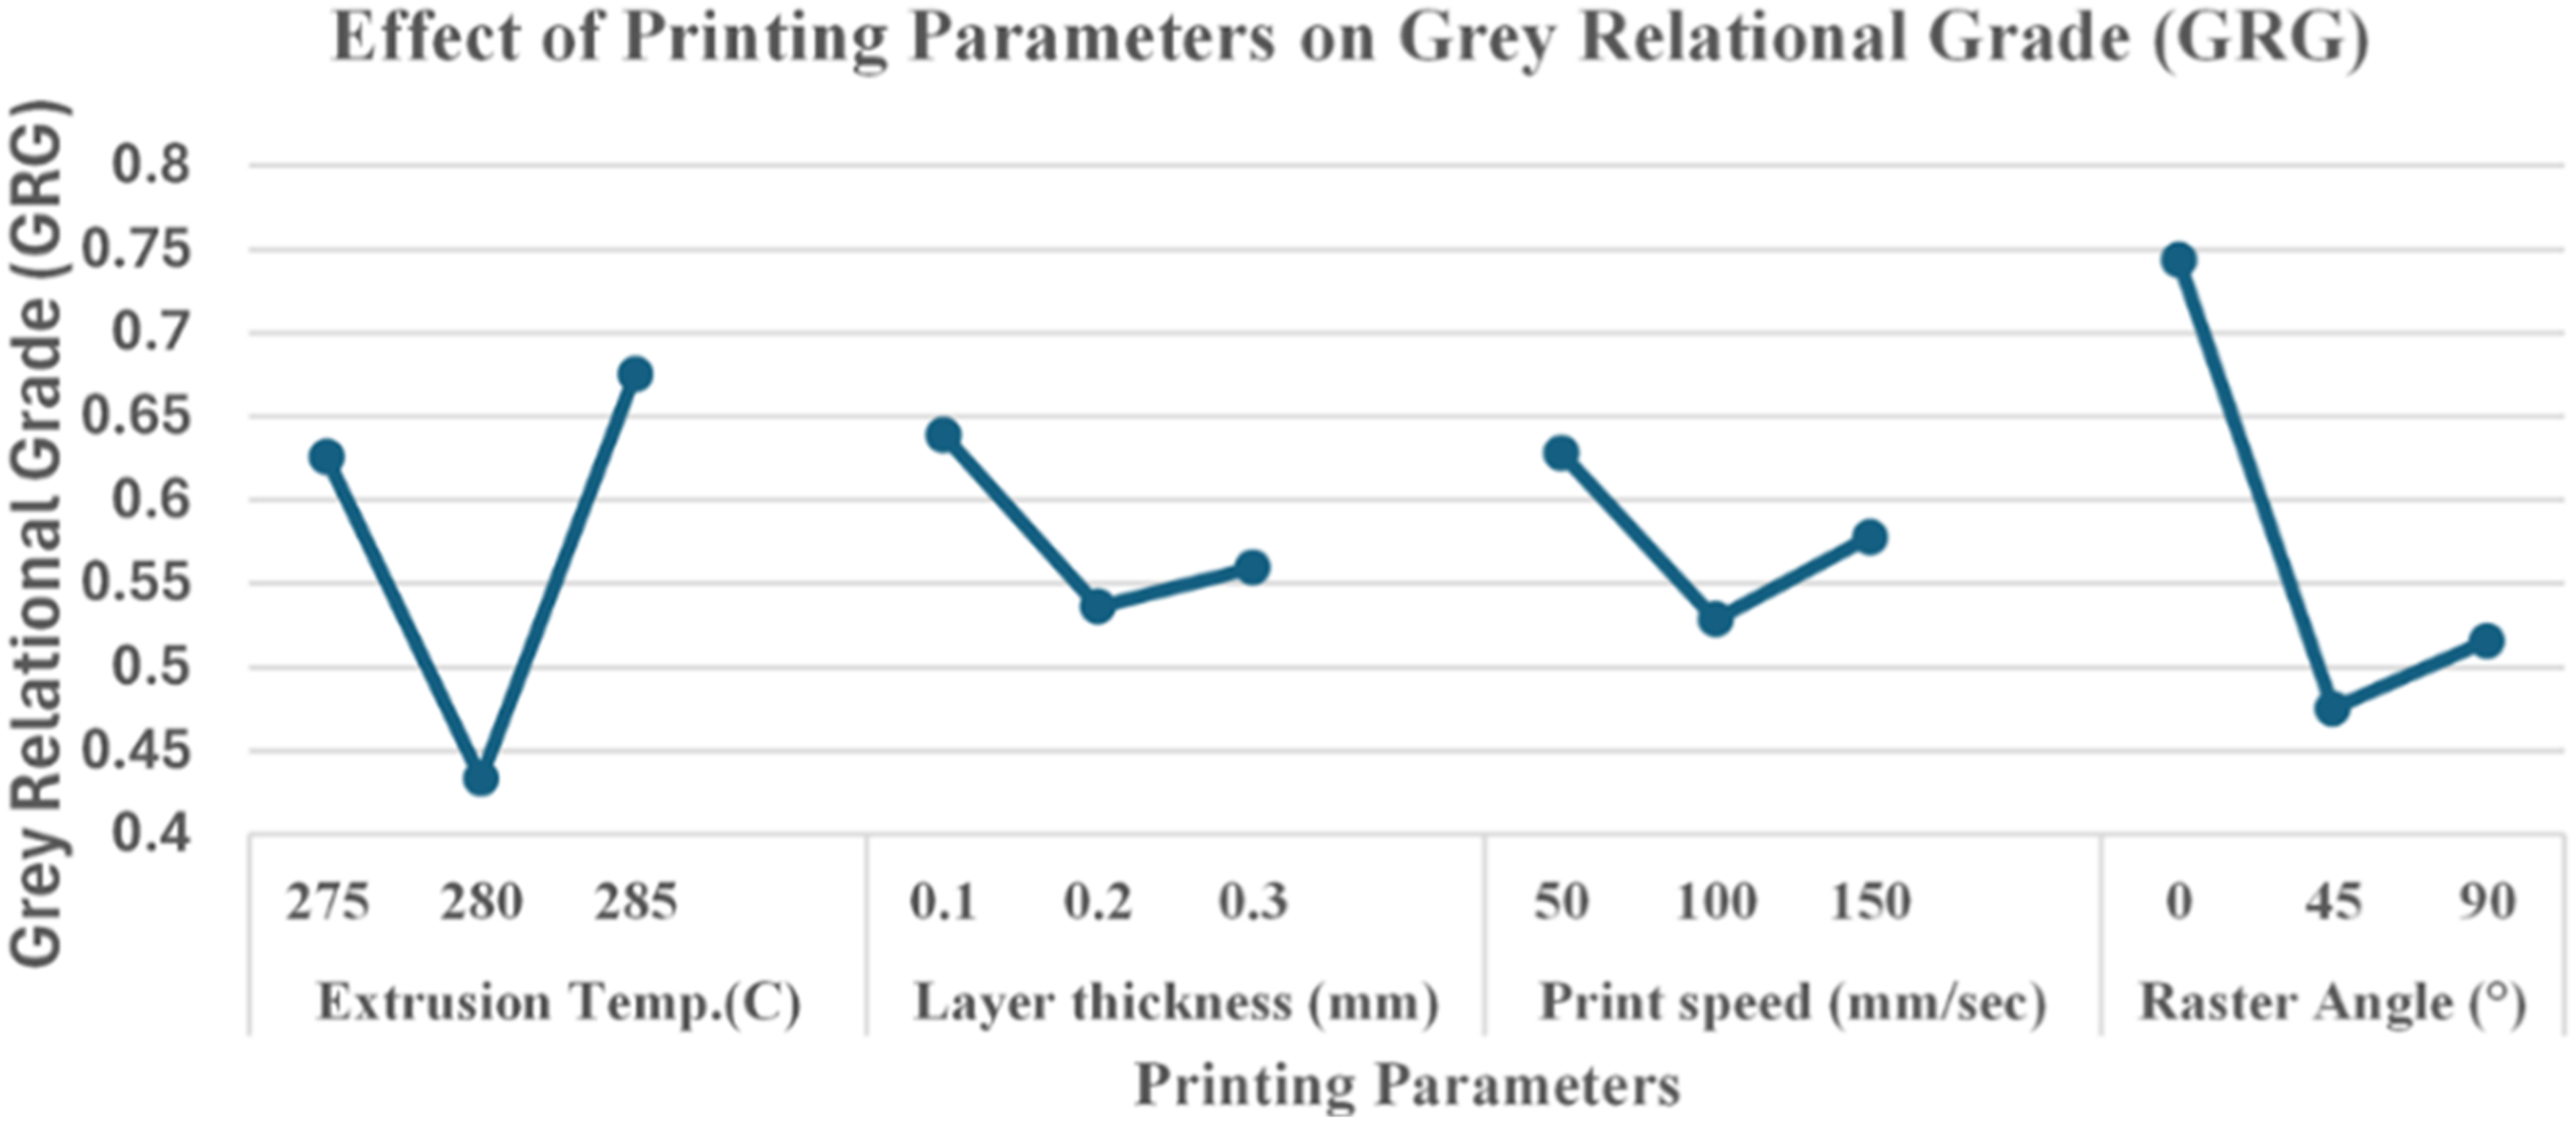
ANOVA of grey relational grade (GRG)
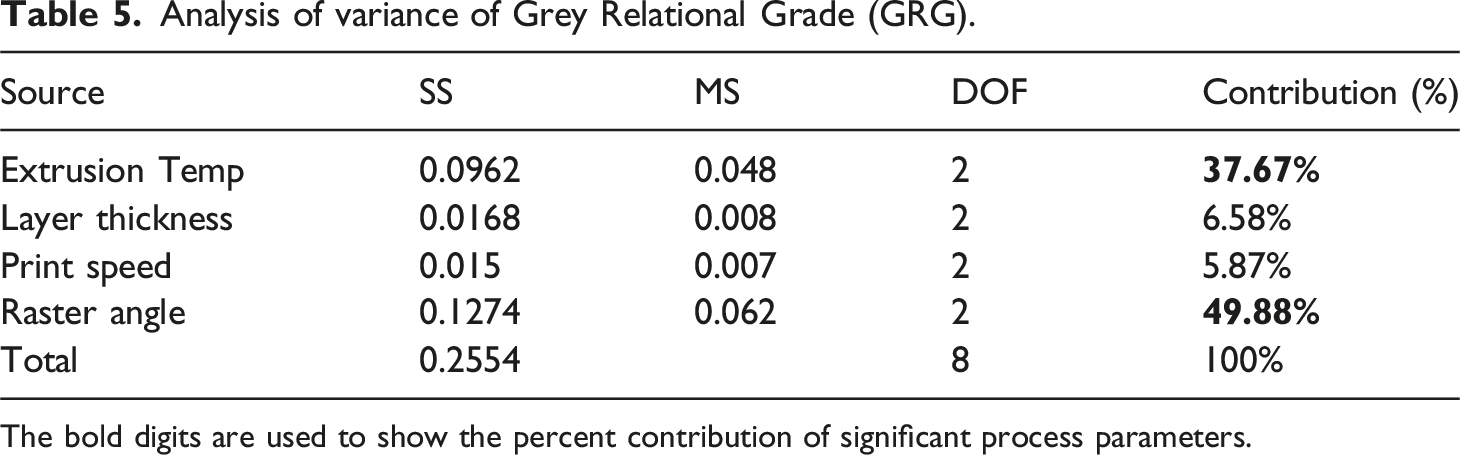
An analysis of variance (ANOVA) is performed on the Grey Relational Grade (GRG) to determine the relative contribution of each process parameter (Table 5). The results indicate that raster angle (49.88%) and extrusion temperature (37.67%) are the most influential factors affecting the combined mechanical properties of the PETCF-15 specimens. Layer thickness and print speed contributed 6.58% and 5.87%, respectively. This suggests that adjusting the raster angle and extrusion temperature are influential process parameters to control the mechanical properties of PETCF-15 in 3D printing process.
ANOVA result indicated that raster angle (49.88%) and extrusion temperature (37.67%) are found to be significant on grey relational grade (GRG) obtained from multi response optimization of tensile strength, yield strength and ductility for PETCF-15 specimens. Ulkir and Akgun 21 reported infill density (37.39%) and printing speed (26.95%) as key factors influencing compressive strength in ABS, while layer thickness contributed to 17.51%. These differences highlight the material and mechanical property dependent influence of FDM parameters. Infill density and printing speed primarily govern void reduction and material’s cooling/thermal behavior in amorphous ABS during compression testing. Whereas raster angle and extrusion temperature critically affect anisotropic stress transfer and interlayer bonding in PETCF-15. This aligns with emerging evidence that process optimization must be tailored to specific polymer type and loading conditions. 21
Confirmation experiment
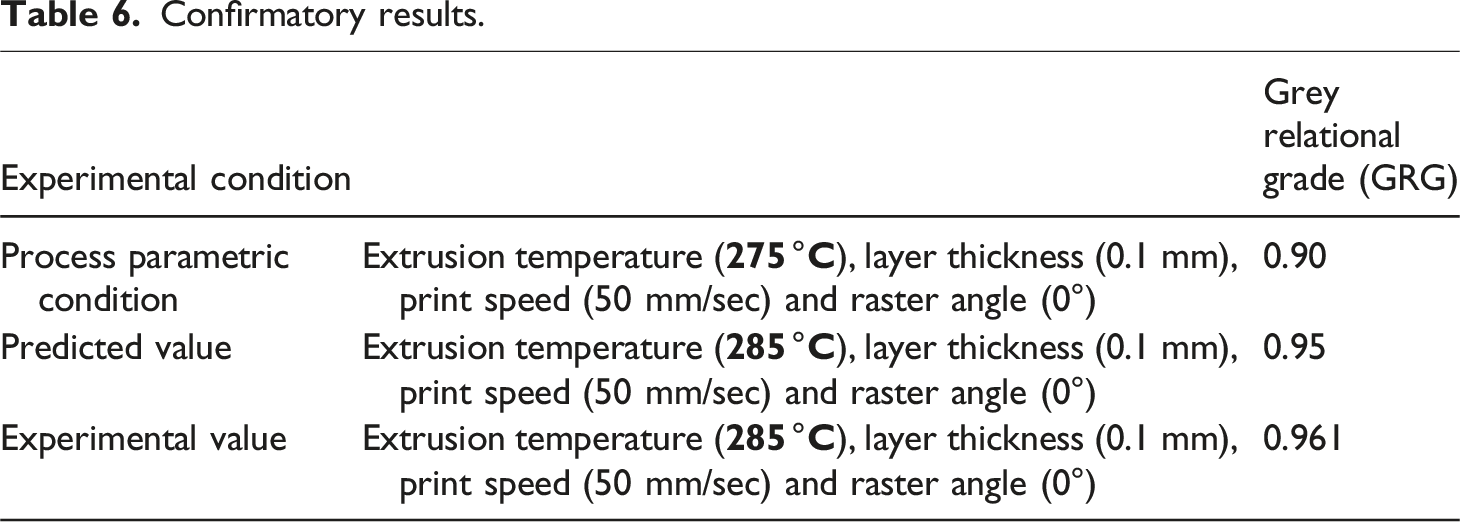
The confirmatory experiment is conducted to validate the results of GRG obtained under optimized parametric conditions. The predicted GRG is calculated by the following formula.
Confirmatory results.
Finite element analysis (FEA) Methodology
Mechanical properties of PETCF-15 considered for FEA.
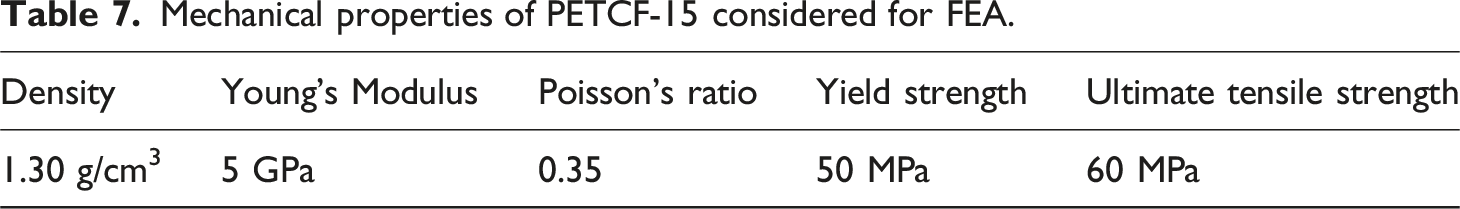
Figure 10 shows the Finite Element Analysis (FEA) of tensile testing simulation for a specimen considered in this study. The specimen is discretized using 3D solid elements C3D8R in ABAQUS with a refined mesh in the gauge region to capture stress concentration precisely. Mesh convergence study is conducted to make sure the solution is independent of the element size. In the simulation one end of the sample is constrained in all directions. The other end is given a specified displacement at a constant strain rate. A mesh sensitivity analysis is performed to identify the optimal element type and mesh density. Three-dimensional solid element (C3D8R) is utilized with refined mesh applied in gauge section to accurately capture localized deformation. The total simulation time is defined according to the experimental test duration, ensuring that the complete stress–strain response of the material is obtained. The analysis provided insight into the deformation behavior, stress distribution, and failure initiation of the PETCF 15 specimen under tensile loading. Finite Element Analysis (FEA) of tensile testing simulation for a cylindrical specimen: (a) Geometry and boundary condition setup, (b) Meshing of the model, (c–h) Stress distribution and deformation progression during tensile loading, illustrating necking and final failure stages.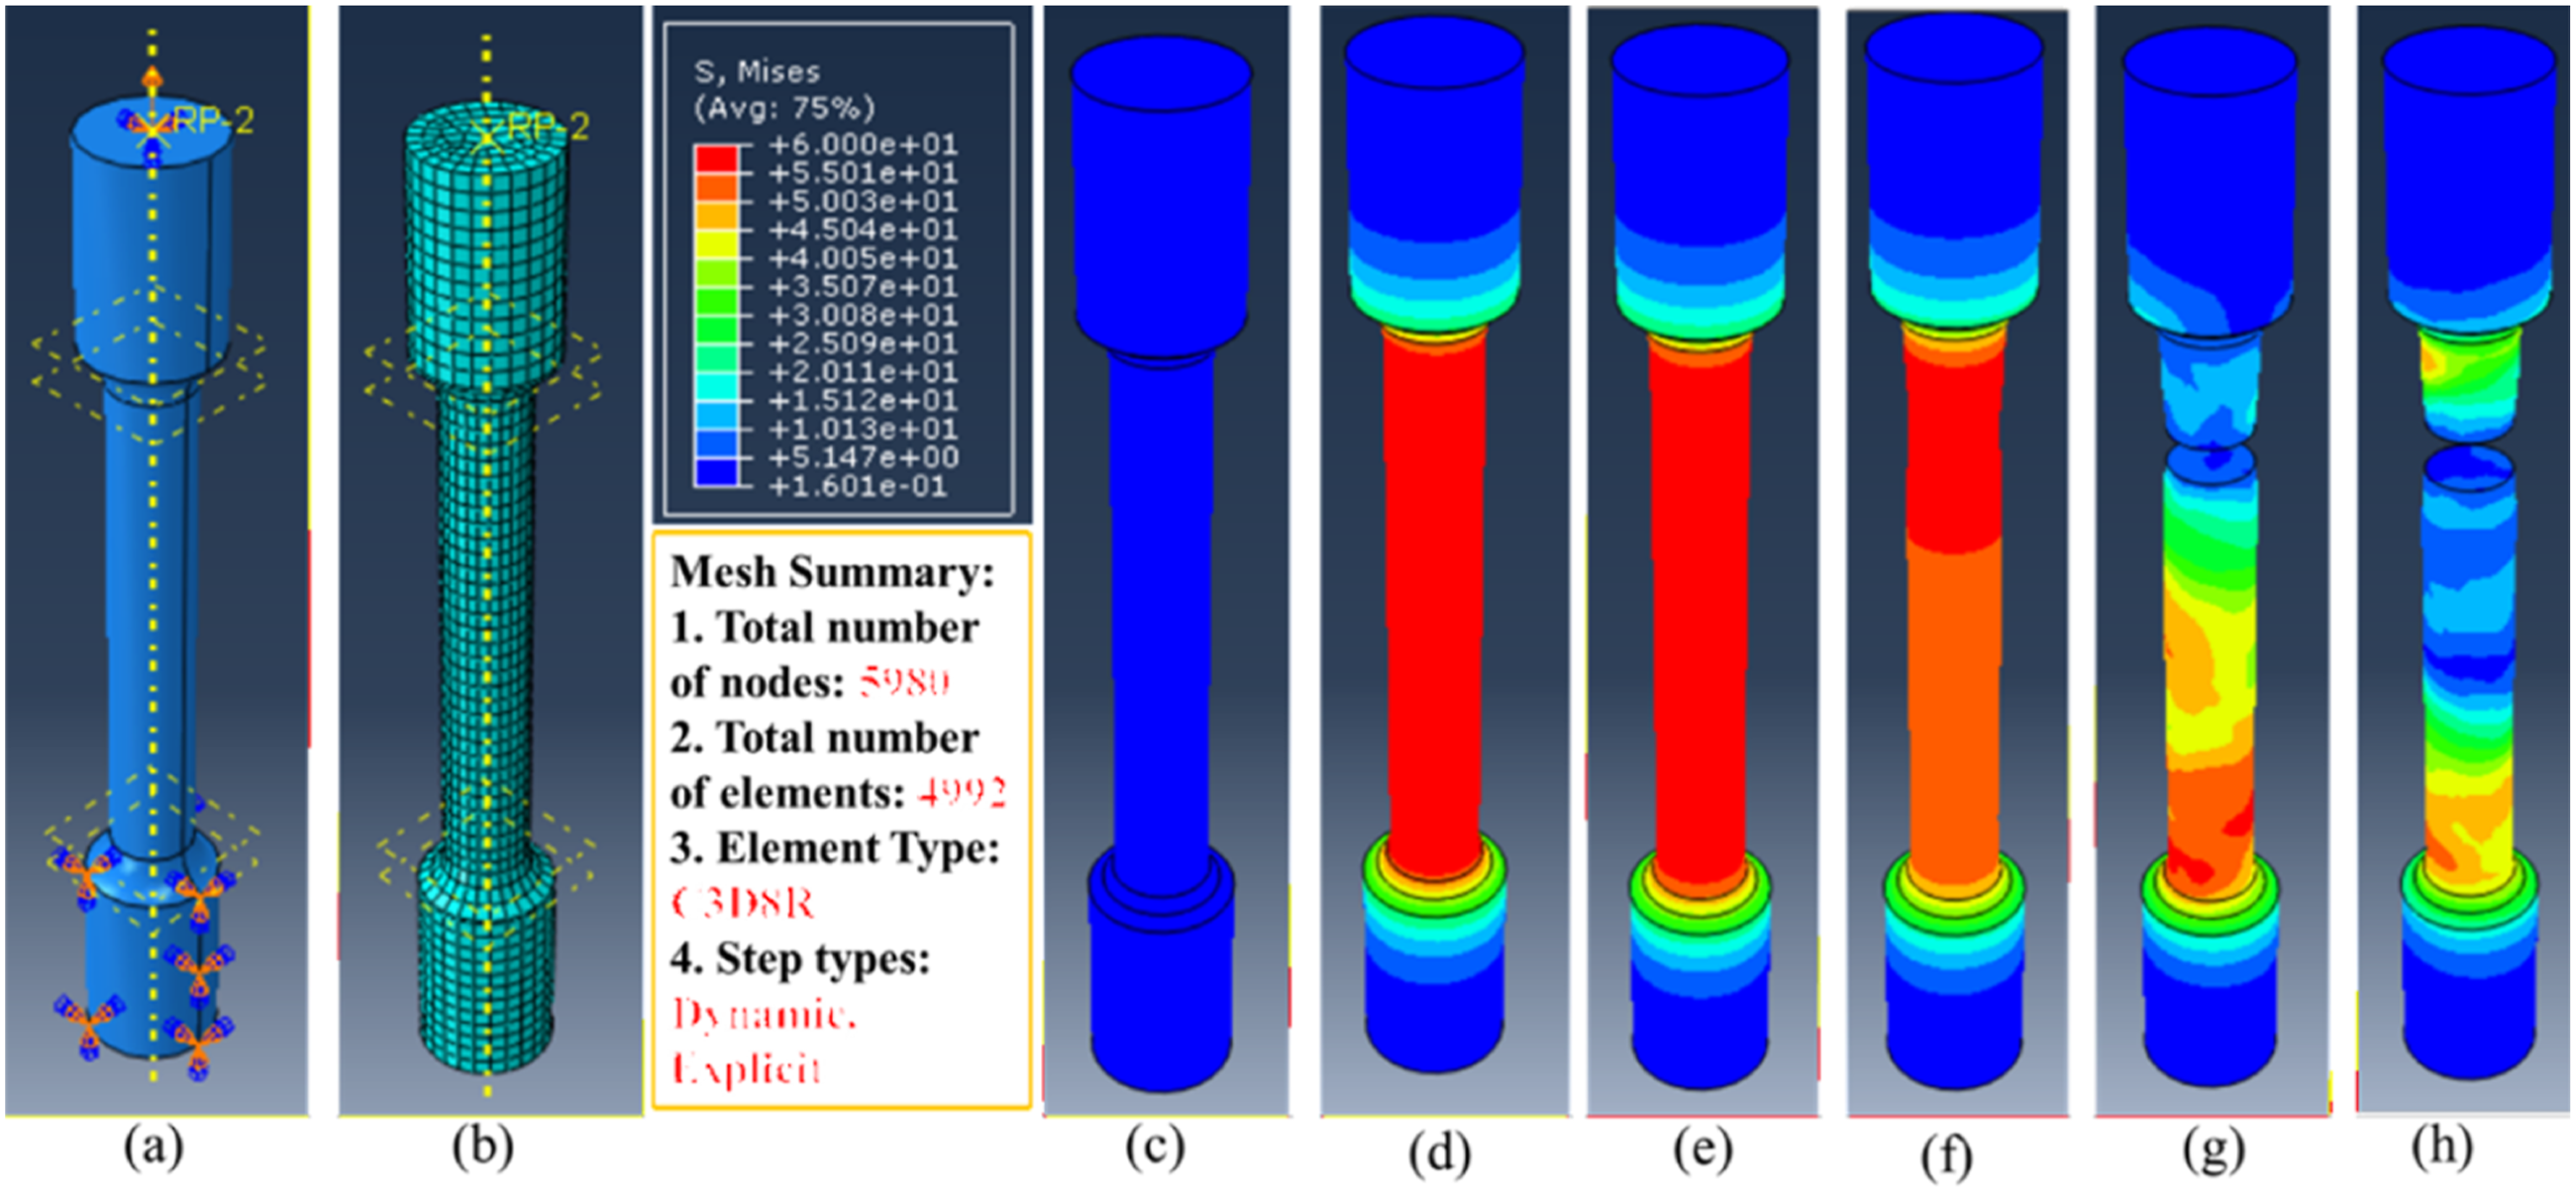
Figure 11 represents the comparative stress-strain curves for the experimental and numerical (simulation) results of a PETCF-15 sample. Both curves show similar elastic and plastic deformation trends, indicating a strong correlation between simulation and experimental results. The close match between the ultimate tensile strength (UTS) and strain to failure validates the finite element model, despite the simulation slightly overestimating the stress in the plastic region. For the specimen’s tensile strength, a strong correlation is discovered between the experimental and FEA results. The maximum 5-8% deviation is observed between numerical and experimental values validating the mechanical behavior of printed PETCF15 in tensile tests. Comparison of experimental and simulated stress–strain response.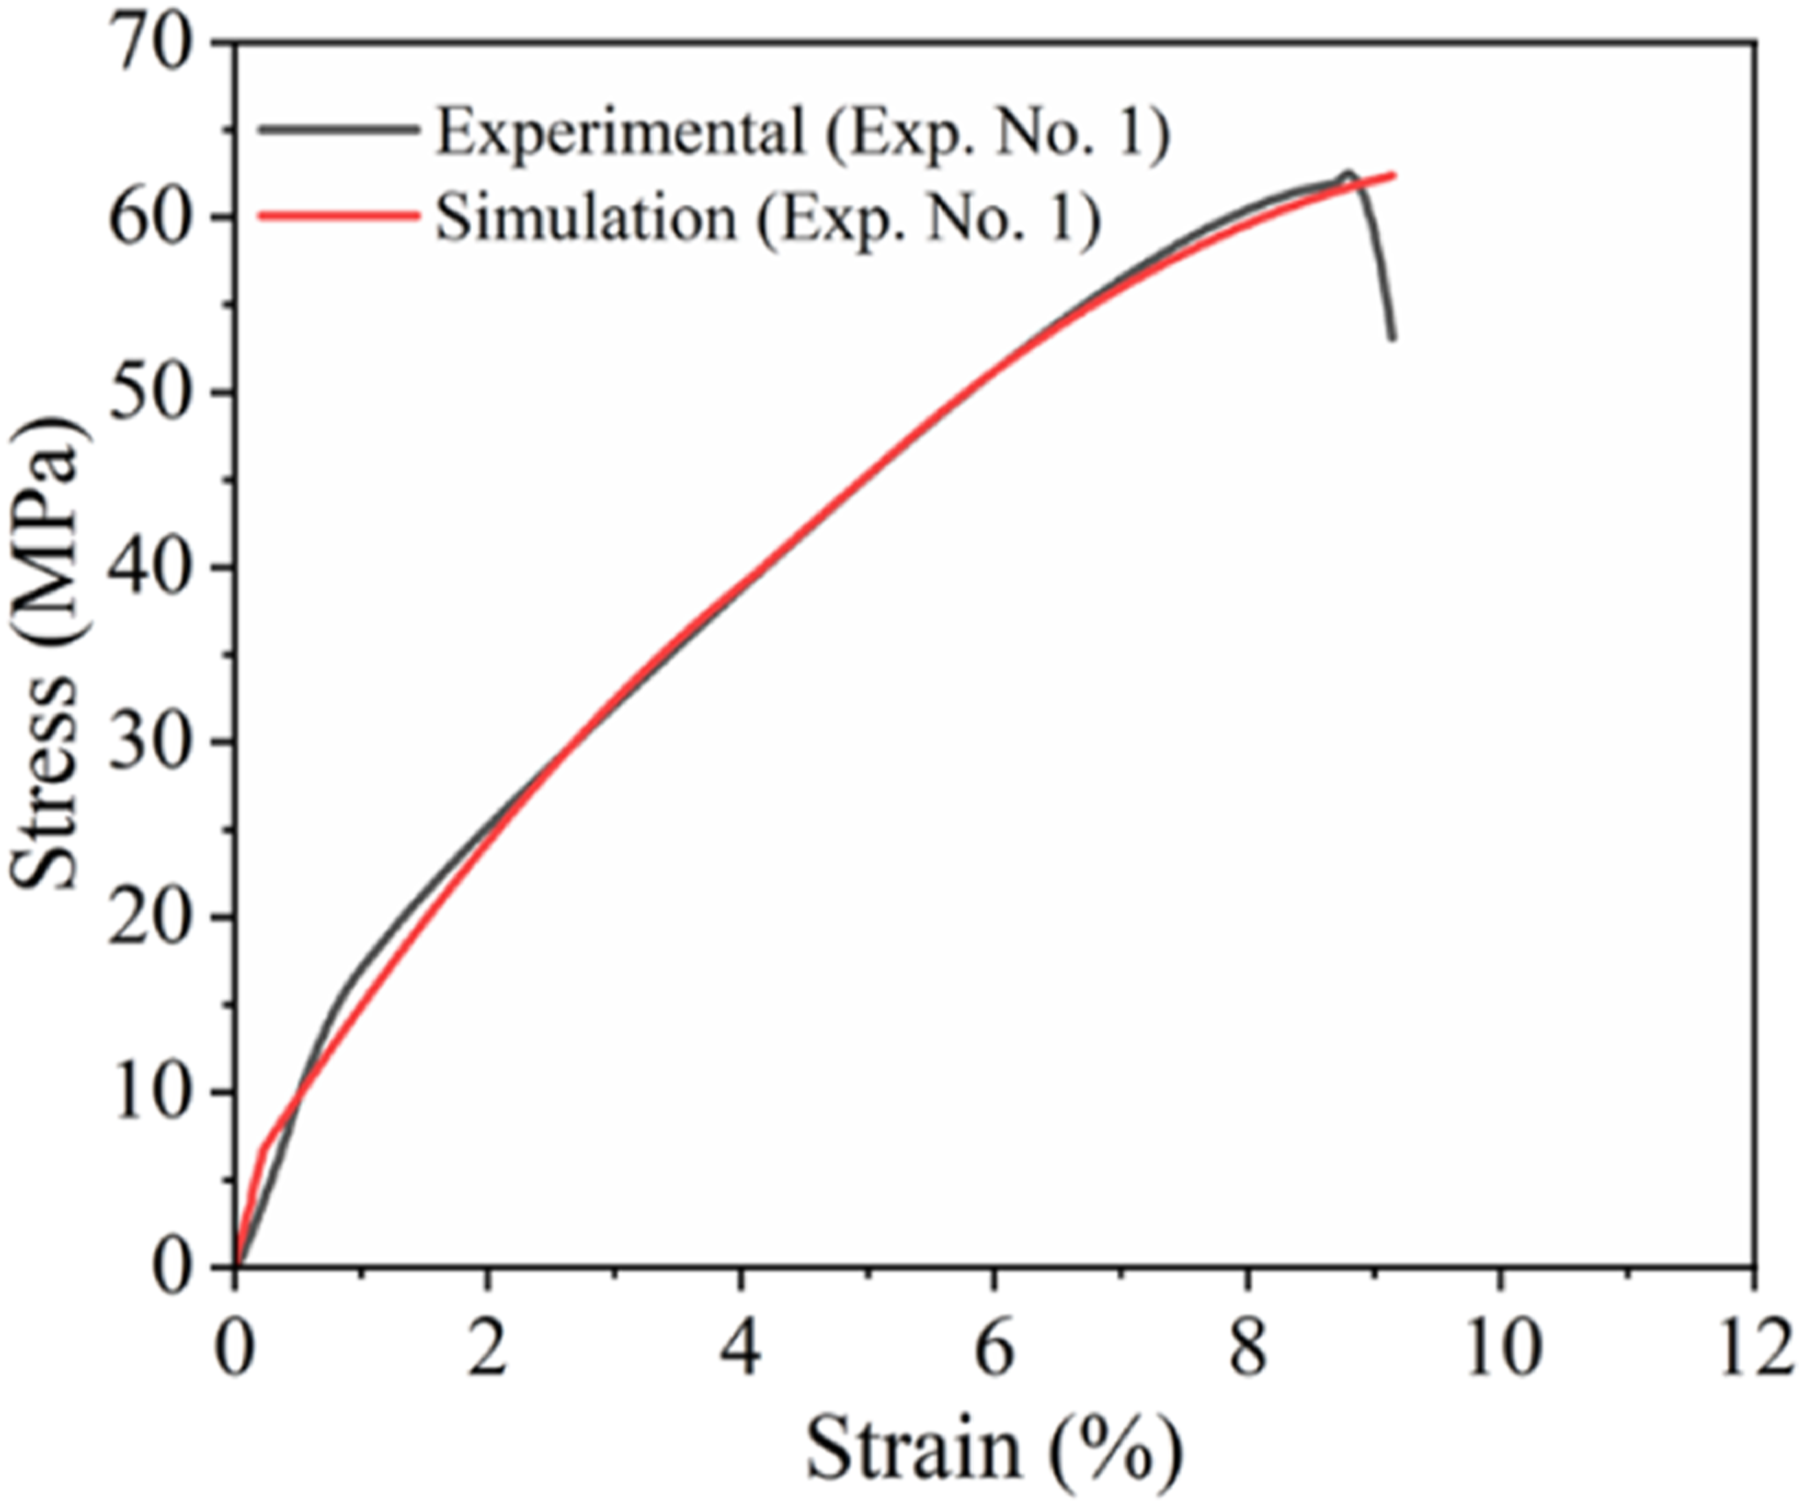
Figure 12 presents a comparison between fracture patterns of experimental sample and finite element simulation. It can be shown in Figure 12 that sample 1 fractured at gauge length. FEA model accurately predicts the stress localization and fracture in the same region as corresponds to experimental sample. The fracture is observed near the shoulder section due to geometric stress concentration in sample 3 correlating to fractured sample after tensile test. The phenomena of crack initiation, progressive strain accumulation and necking before final fracture at mid gauge section can be clearly observed in the simulation results of sample 6 matching with actual failure of tensile test sample. Experimental and simulated fracture comparison of tensile specimens: Sample 1 (gauge fracture), Sample 3 (shoulder fracture), and Sample 6 (mid-gauge necking).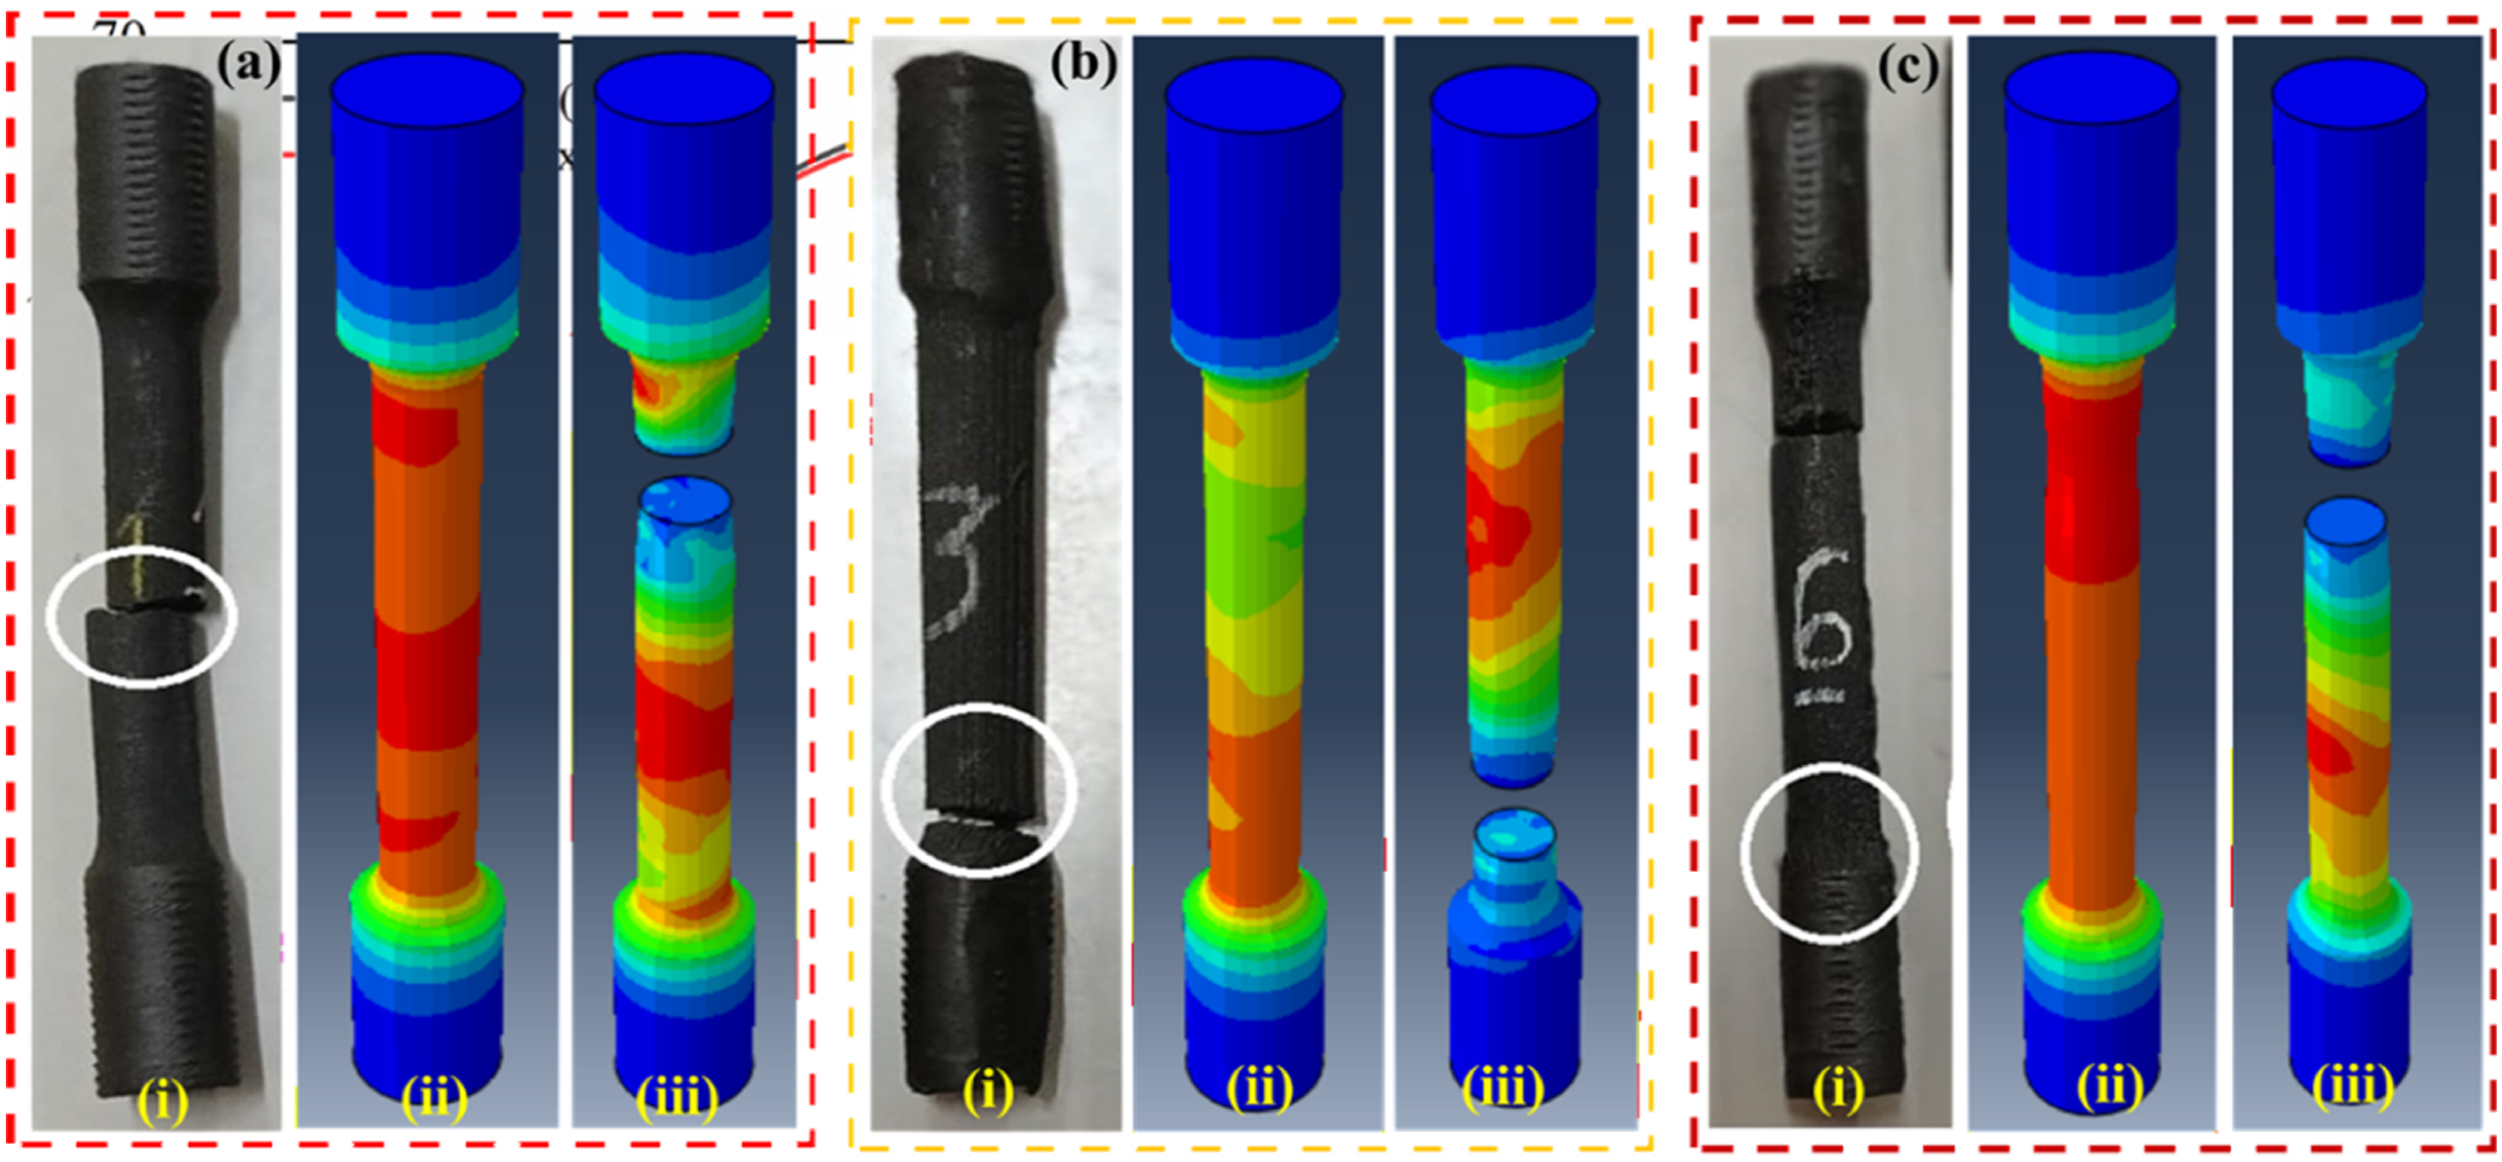
The close agreement between experimental observations and numerical predictions demonstrates the reliability of the finite element model in replicating deformation and fracture behavior under tensile loading.
Fracture analysis using scanned electron microscopy (SEM)
The detailed microstructural analysis is conducted on fractured samples (sample 1, 3 and 6) considered in Table 3. Scanned Electron Microscopy (SEM) is conducted at the cross-section of the fractured sample as shown in Figure 13. Direction of analysis for observing the fractured surface by SEM.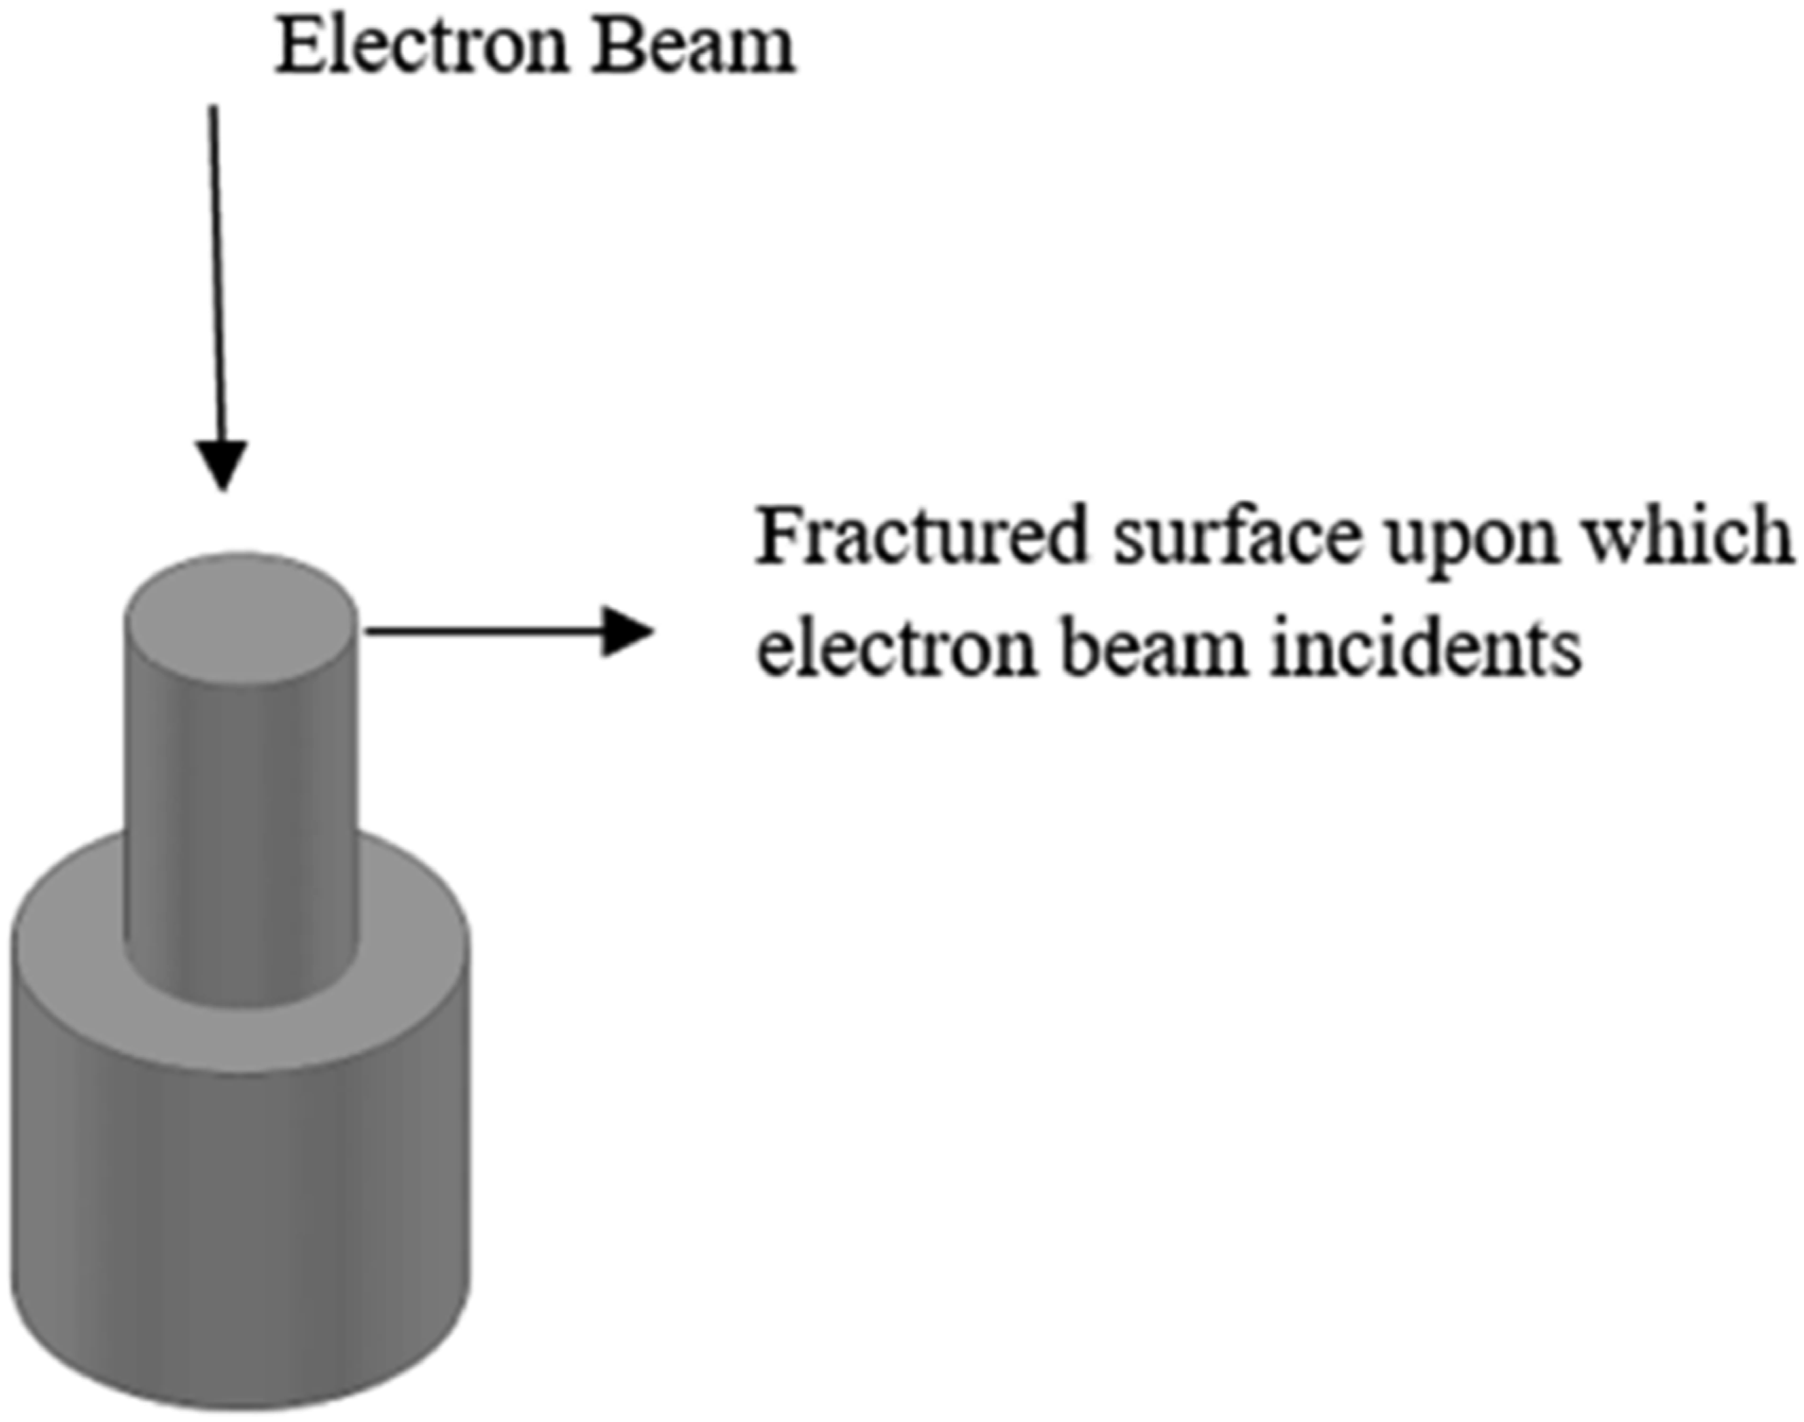
SEM image of fractured sample 1
Figure 14(a) represents a Scanned Electron Micrograph (SEM) of the fractured surface of a tensile specimen printed under the process parametric condition (extrusion temperature- 275 (a). SEM image of fractured sample 1 under tensile loading- Printing parameters: Extrusion Temp. (275 C), Layer thickness (0.1 mm), Print speed (50 mm/sec), Raster Angle (0°). (b). SEM image of fractured sample 3 under tensile loading- Printing parameters: Extrusion Temp. (275 C), Layer thickness (0.3 mm), Print speed (150 mm/sec), Raster Angle (45°). (c). SEM image of fractured sample 6 under tensile loading- Printing parameters: Extrusion Temp. (280 C), Layer thickness (0.3 mm), Print speed (50 mm/sec), Raster Angle (90°).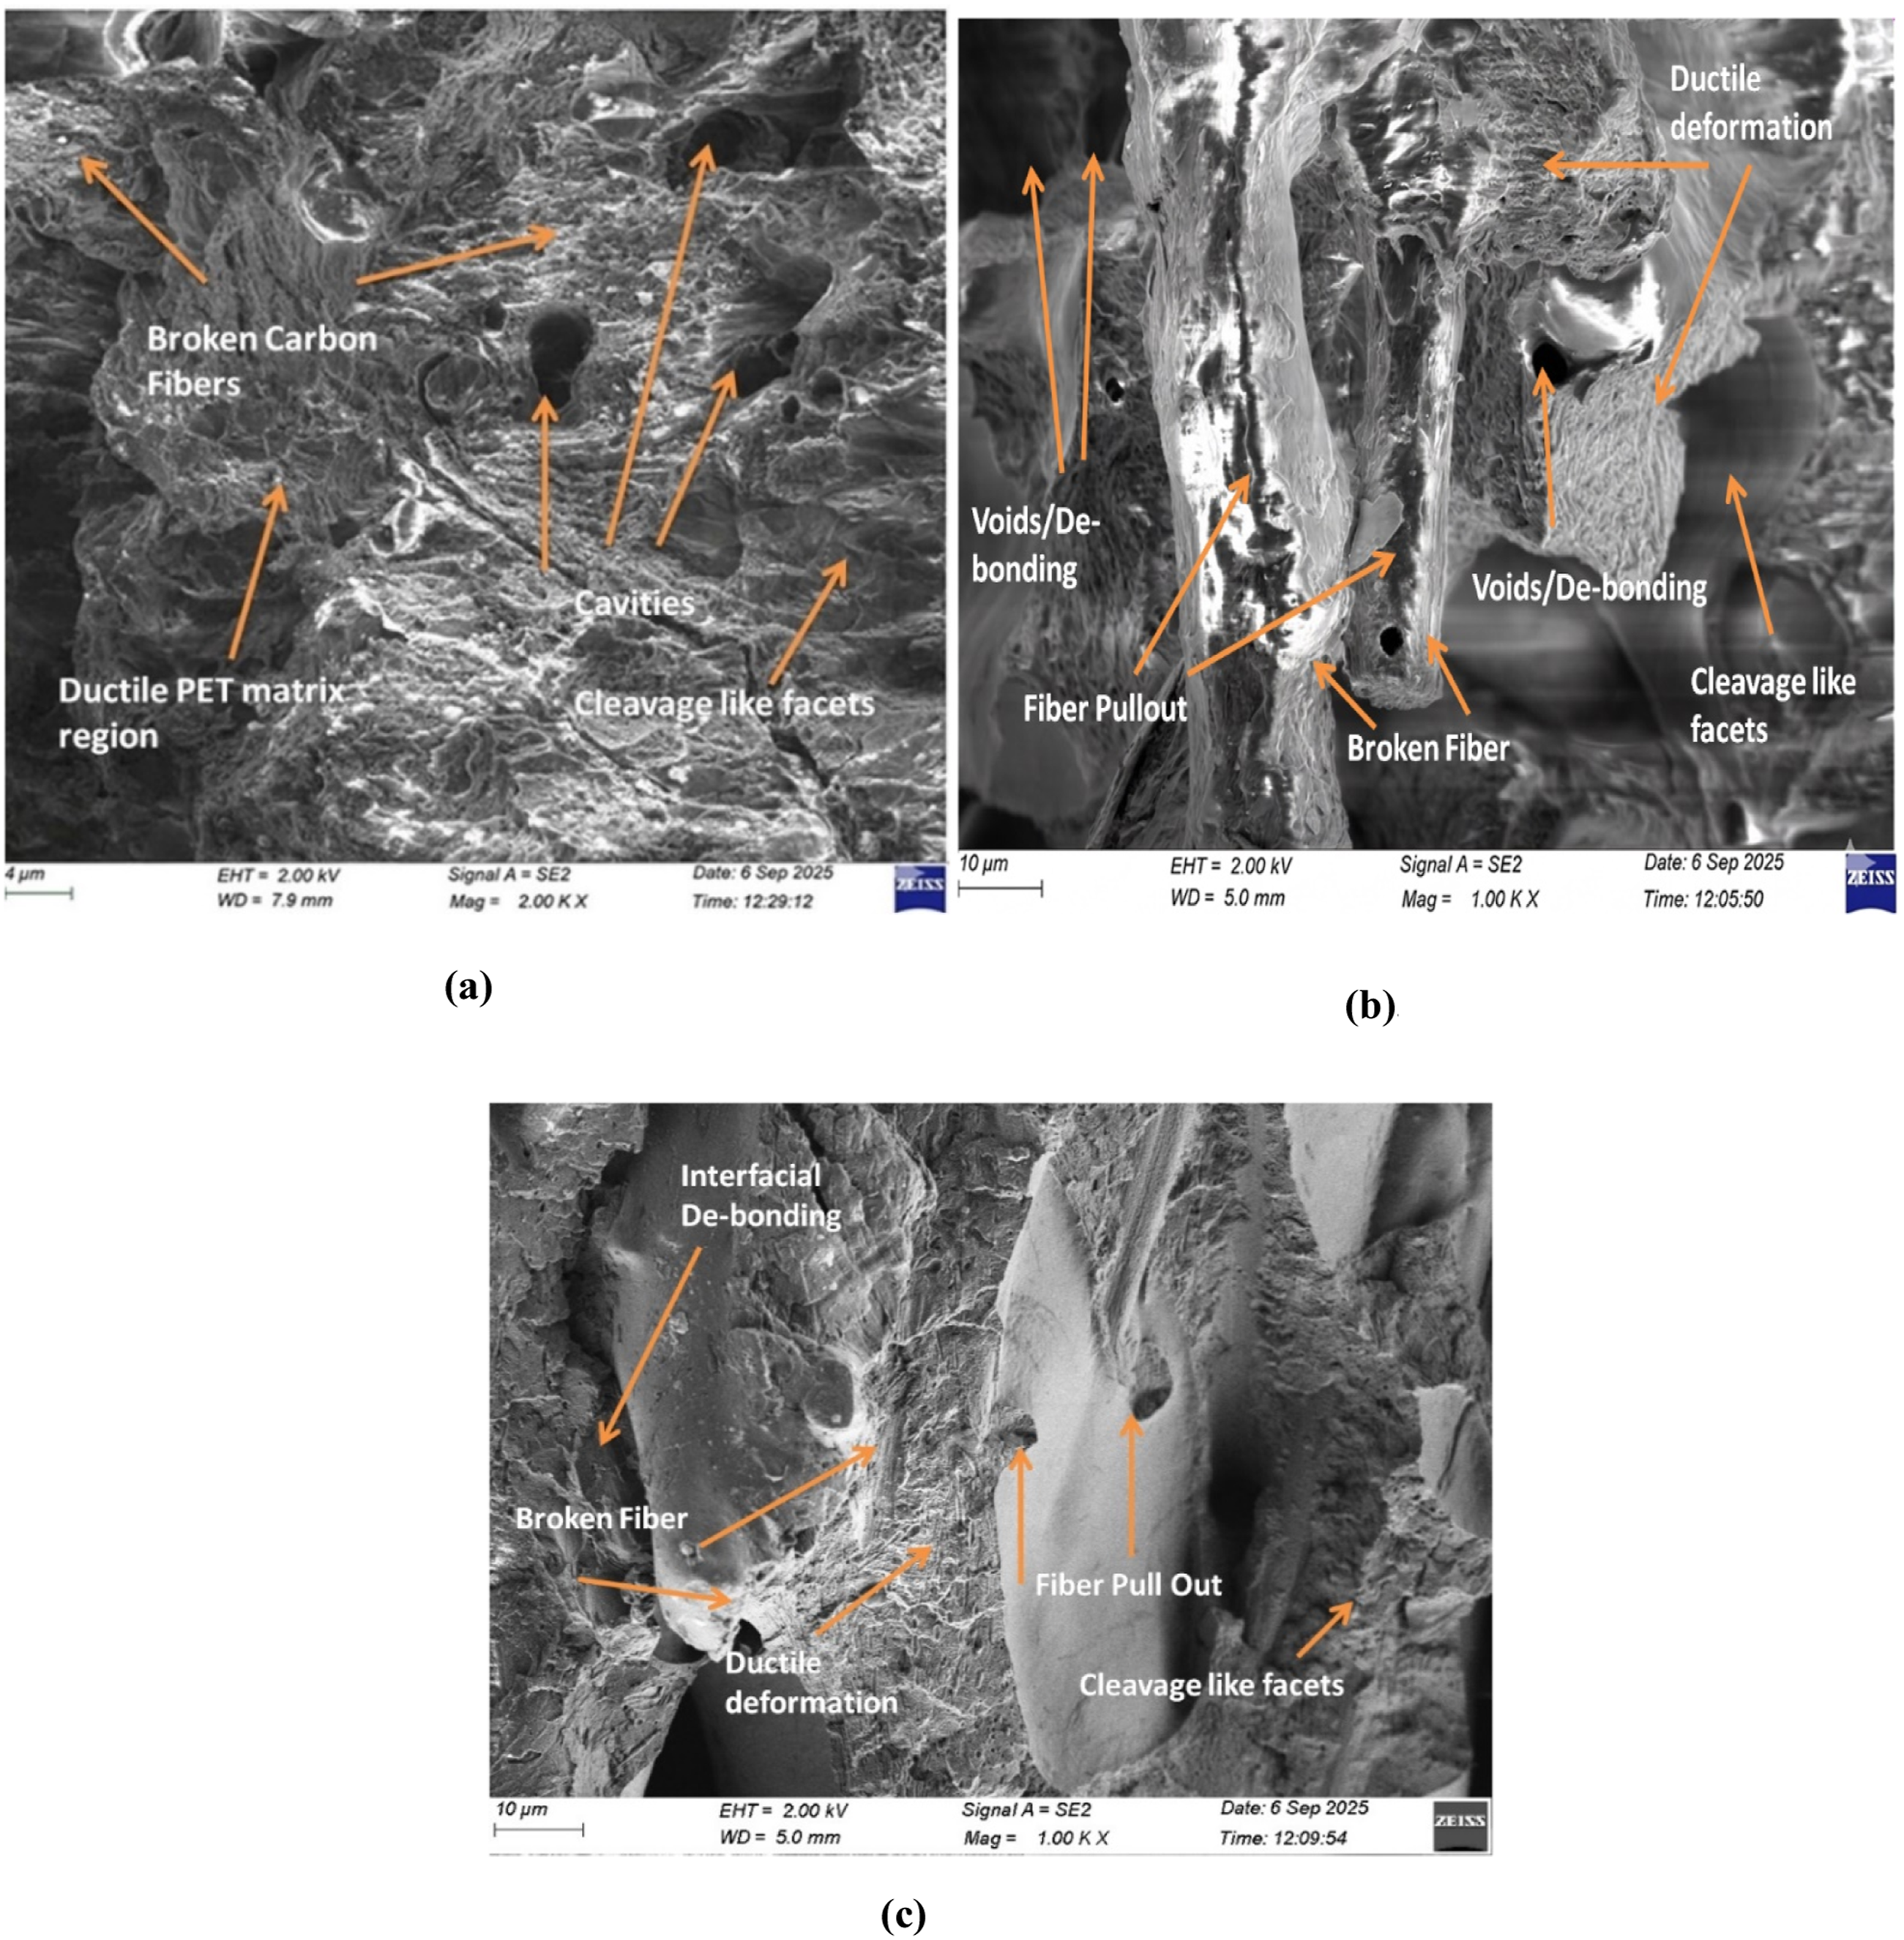
Bright fractured carbon fibers are visible in Figure 14(a) representing that the carbon fibers are embedded in the PET matrix. The fiber breakage surfaces are predominant over the fiber pull out regions near the cavities which indicates that the carbon fibers restrict the crack propagation by bridging the microcracks. The fracture morphology is characterized by a mixed-mode mechanism combining the ductile and brittle fracture. The PET matrix shows the region of cleavage-like facets, which reflects the localized brittle fracture. The cleavage planes are most evident around the large voids. The rapid crack initiation and propagation occur in this region due to localized stress concentration. Fiber breakage, limited de-bonding, ductile tearing and cleavage are the main constituent phenomena of failure of the sample as confirmed by the SEM analysis.
SEM image of fractured sample 3
Figure 14(b) represents a Scanned Electron Micrograph (SEM) of the fractured surface of a tensile specimen printed under the process parametric condition (extrusion temperature- 275
The SEM image reveals the several information such as fiber pull-out, fiber fracture, ductile matrix deformation, interfacial de-bonding and microcracks. The relatively higher layer thickness (0.3 mm) combined with high printing speed (150 mm/sec) may reduce the effective interlayer diffusion and bonding during deposition. This could promote the formation of voids and interfacial defects with printed structure. These defects are visible in the SEM image as voids/de-bonded region around the fibers.
The cavities and interfacial debonding around the fibers act as potential crack initiation sites. These sites could accelerate crack propagation under tensile loading and resulting in relatively lower tensile strength (47.7 N/mm2) of the specimen.
The fiber pull out may be attributed to the weak interfacial adhesion between carbon fiber and PET matrix which might be protecting the matrix by allowing the fibers to slide out rather than fracture. Conversely the broken fibers with clean end are also identified which reveals the strong bonding between PET matrix and carbon fiber. The fiber could have been broken only after carrying enough stress.
The rough river like fracture surface exhibits the ductile deformation indicating localized plastic deformation. The cavities found on the fractured surface show the interfacial de-bonding around fibers. These de-bonded regions might serve as imitation sites for crack propagation subsequently leading to failure. The overall fractured surface reveals the mixed mode deformation consisting of the brittle fiber fracture and ductile matrix deformation.
FEA revealed a significant geometric stress concentration at the shoulder causing peak stress to exceed nominal gauge stress as depicted in Figure 13. This is corroborated by SEM micrograph Figure 14(b) of the corresponding specimen. The potential crack initiation sites such as voids, debonding, fiber pull out and broken fibers are the main reasons behind it. FEA predicts early interfacial debonding and microcrack initiation at the stress concentration sites near shoulder limiting the widespread necking in the gauge. Another reason for the failure near the shoulder section is also due to the raster aligned at 45° with the applied load causing shear stresses developed at the section.
SEM image of fractured sample 6
Figure 14(c) represents a Scanned Electron Micrograph (SEM) of the fractured surface of a tensile specimen printed under the process parametric condition (extrusion temperature- 280
Although higher level of extrusion temperature (280°C) promotes the sufficient melting of the PET matrix, yet higher layer thickness (0.3 mm) may reduce the interlayer contact area and diffusion between successive layers. This promotes void formation and interfacial defects during deposition in printing process. The raster angle (90°) also causes the applied tensile load acting transverse to the filament direction resulting in limited load transfers across the adjacent raster.
The large voids and cavities shown in SEM (Figure 14(c)) exhibit the interfacial debonding cause of crack initiation sites following the crack propagation. This causes the relatively lower tensile strength (42.5 N/mm2) observed under the given parametric combination. The bright fractured fiber ends reveal the strong interfacial bonding permitting the fibers to sustain the tensile load till failure. In addition, the rough layered pattern (river like pattern) exhibits the plastic flow of PET matrix leading toward the ductile matrix deformation.
The large sized voids and cavities reveal the interfacial de-bonding initiating from region having weak bonding between PET and carbon fiber. The all above factors contribute to the fracture of the printed specimen under tensile loading.
Although the present SEM analysis primarily reveals micro-scale features such as fiber pullout and matrix deformation, polymer composites often exhibit multis-scale synergistic reinforcement mechanism that enhances the overall mechanical performance. Similar observations regarding the structure-property relationship in carbon fiber reinforced PETG composites discussed in recent studies. 25 The improved mechanical performance of the printed PETCF15 composites suggests their potential for advanced engineering applications. FDM fabricated fiber reinforced thermoplastics are increasingly explored not only for load bearing structures but also for functional devices such as sensors, highlighting the expanding role of additive manufacturing in customized engineering components. 22
Expanded fracture surface analysis
SEM analysis (Figure 15 (a)–(f)) of samples 2, 4, 5, 7, 8 and 9 shows that the raster angle and extrusion temperature strongly influence fracture behavior. The 0° raster specimen (Sample 5 and 9), which exhibited the highest tensile strengths (55.5 and 51.6 N/mm2) display clearly broken carbon fibers with minimum pull-out and smoother fracture paths. The SEM image reveals efficient axial load transfer and enhanced interlayer fusion at elevated extrusion temperatures. The 45° samples (4 and 8) exhibit stepped fractured surface pattern arising from the oblique raster orientation. The cavities observed on the fractured surface indicate incomplete filament overlapping, trapped air and shrinkage mismatch. These cavities act as a crack initiation site. The 90° raster specimens (2 and 7), showing the lowest strengths (41.2 and 49.4 N/mm2) display pronounced interlayer separation and extensive fiber pullout cavities. These features result from limited transverse load transfer and insufficient melt vetting. Overall, these observations confirm that raster angle primarily govern crack propagation and fiber fracture, while extrusion temperature controls interlayer bonding quality and cavity formation. (a): Sample 5; Extrusion temperature (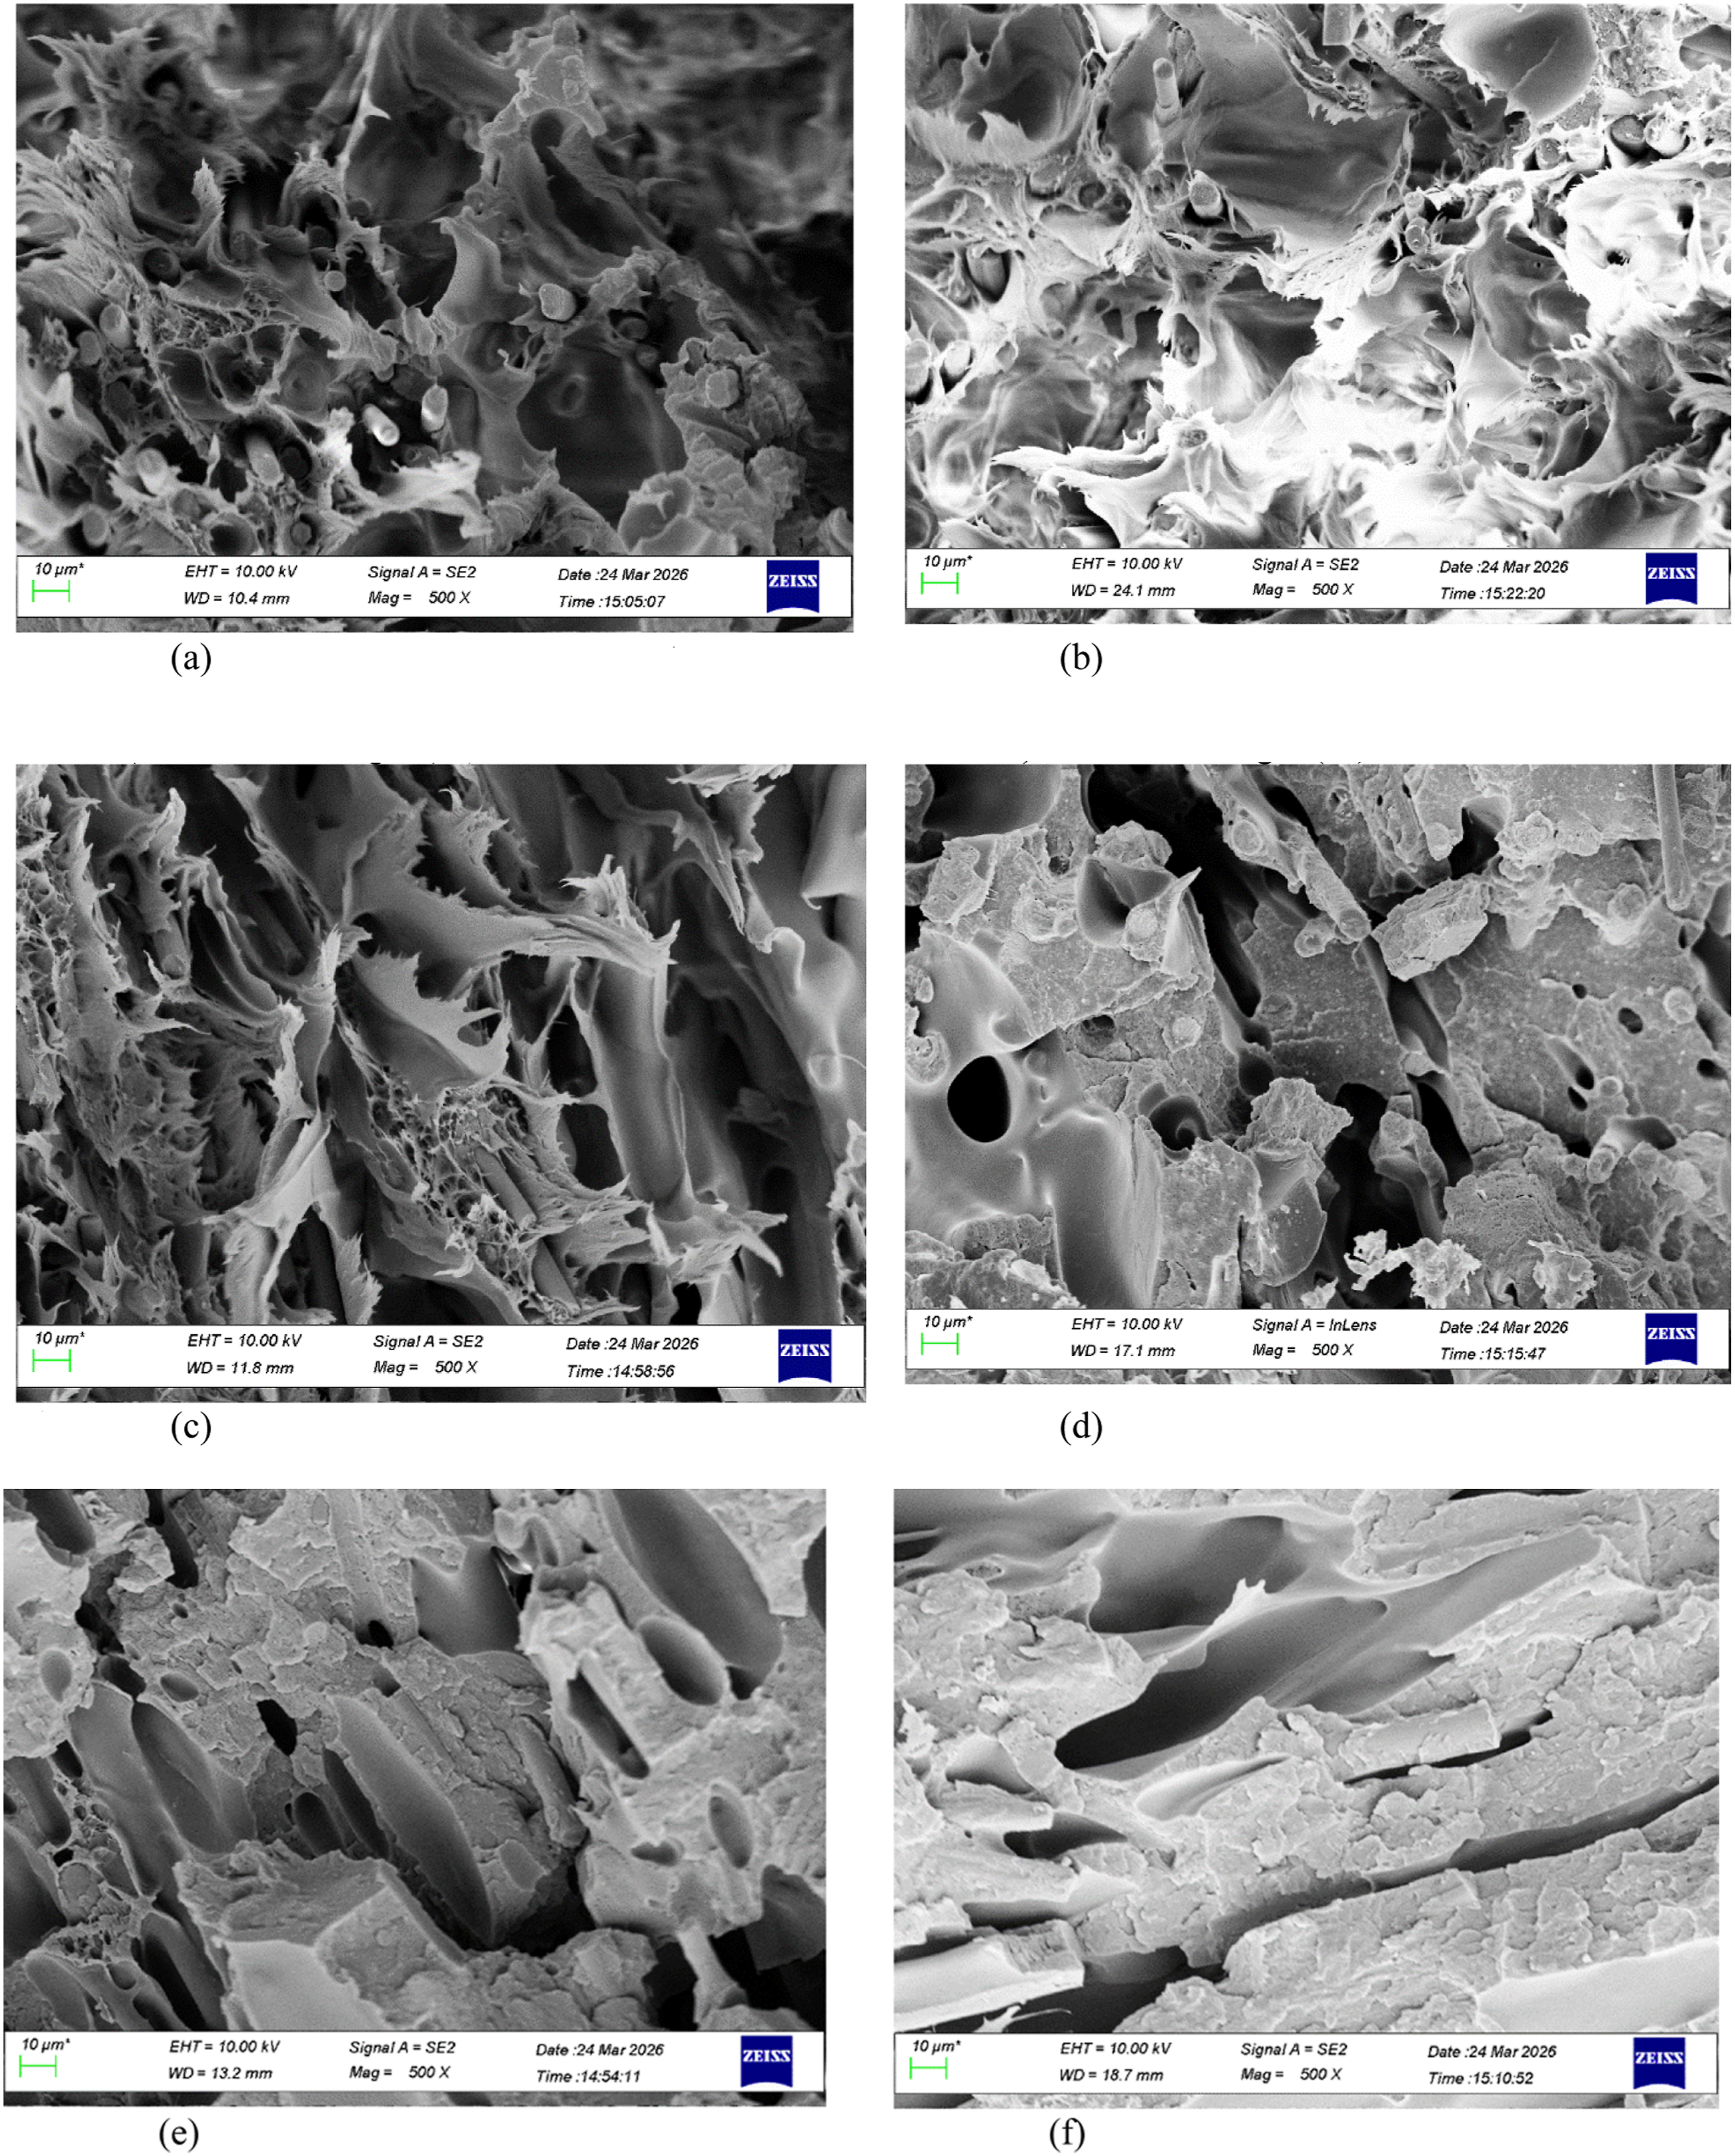
Conclusion
The present study systematically investigated the influence of key FDM process parameters on the mechanical characteristics of PETCF15 composites. It is established that the optimal combination of exclusion temperature (285°C), layer thickness (0.1 mm), printing speed (50 mm/s), and raster angle (0°) yields superior tensile and yield strength due to enhanced inter layer bonding and favorable raster alignment along the loading direction. However, improved ductility is observed at the higher layer thickness and printing speed which is attributed to better fiber–matrix wetting and reduced stress concentration. The multi-response optimization using the weighted grade Taguchi methodology confirmed this optimal parameter set, with raster angle (49.88%) and extrusion temperature (37.67%) identified as the most influential factor. Notably the developed PETCF15 specimens exhibited a significantly higher tensile strength of 62 N/mm2. The tensile strength is reported to be improved approximately 36–49% over neat PETG and up to 90–100% over previously reported carbon fiber reinforced PETG systems. The findings are attributed to the higher crystallinity of PET compared to the largely amorphous PETG matrix, enabling improved stiffness and more efficient stress transfer at the fiber matrix interface. The experimental findings are further validated through finite element analysis using ABAQUS. The results exhibited strong agreement with the tensile behavior, with only 5 to 8% deviation and accurately captured stress distribution and failure locations. The analysis reveals that stress concentration near the shoulder region, leading to early interfacial debonding and microcrack initiation, which limited uniform deformation in the gauge section. The observation is corroborated by SEM micrographs confirming the presence of voids/porosity, fiber pullout, broken fiber and interfacial debonding. The fracture mechanism indicated a mixed mode combining ductile and brittle characteristics. Additionally, raster orientation contributed to the localized shear stresses influencing failure behavior. The extended SEM analysis further shows that raster orientation and extrusion temperature strongly dictate fracture morphology. Specimens aligned with 0° raster angle display clean fiber breakage and improved fusion, while specimens aligned with 45° and 90° raster angles exhibit stepped surfaces, cavities and interlayer separation. These microstructural features correlate with mechanical performance and confirm the parameter dependent failure behavior. Overall, the integrated experimental-numerical-microstructural investigation demonstrates that optimized FDM processing of PETCF15 significantly enhances the mechanical performance and provides a reliable framework for understanding deformation and failure mechanisms. The strong agreement across all analysis highlights the potential of PETCF 15 as a promising material for high strength functional application. Future work should focus on evaluating fatigue, impact and thermal aging behavior to assess long term reliability of printed PETCF15 components. The advanced fiber orientation control during printing may further enhance the mechanical performance and expand application readiness.
Footnotes
Declaration of conflicting interests
The authors declared no potential conflicts of interest with respect to the research, authorship, and/or publication of this article.
Funding
The authors received no financial support for the research, authorship, and/or publication of this article.