
Abstract
With the increasing popularity of fused deposition modelling (FDM), an improved understanding of the interdependence between process-structure-property (P-S-P) of FDM manufactured (FDMed) parts is imperative. This paper proposes models for linking the microstructure and degradation of properties during the FDM process with the mechanical properties. Through careful and elaborate finite element (FE) modeling, it is demonstrated that there is definite material degradation during the FDM process, which cannot be attributed only to extra voids generated during printing. A novel hybrid multiscale model is proposed to estimate the degradation parameter and utilize this information to predict the printed coupons' properties. Additionally, two methods for generating representative volume element (RVE) are demonstrated using scanning electron microscope (SEM) imaging and density data. For the experimental validation, polyamide (PA) and polylactic acid (PLA) filaments and dogbone samples with multiple raster orientations were tested. The use of degradation parameter during modeling leads to very accurate results for both PLA and PA. Also, it presents insights into the limitations of the FDM process and possible improvements.
Keywords
Introduction
Material extrusion is an additive manufacturing (AM) process desired for fabricating parts with specific features that are easily customizable. This method is also referred to as fused deposition modelling (FDM). The feedstock for FDM is a filament wire. Several process variables affect the overall performance of the FDM process. The most studied parameters under static loading have been raster angle,1–6 build orientation,7,8 raster width, 9 and layer thickness. 10
Prior research established the effect of raster orientation on FDM printed parts. For example, Shashikumar et al. 11 found that the ±45° raster configuration exhibited the highest tensile strength at 35.2 MPa compared to 0°, 45°, and 90° configurations. El Magri et al. 12 also noted that specific orientations, such as [0°, 15°, −15°] relative to the test bar's long axis, yielded the highest tensile properties. Similarly, Jain et al. 13 observed that tensile characteristics improve as the raster angle decreases from 90° to 0°. Şık et al. 14 investigated the tensile behaviour of ABS, examining various raster and build orientations through experimental and analytical methods. The study revealed that the [±45°] part exhibited a higher elastic modulus compared to the [0°/90°] part. Furthermore, it was found that the elastic modulus reached its maximum value with a [±45°] raster angle for a flat orientation. These studies have concluded that anisotropy is an inherent characteristic of the FDM technique because of the physics of the solid-state coalescence of beads and how the materials are deposited. The raster angle mainly influences the meso-structure that FDM produces, along with the inter and intra-layer bonding.
Some studies indicated that parameters such as the number of external contours, 15 shell thickness, 7 and the distance between the raster 16 are important factors affecting the overall performance of the printed part. Shells are always the first areas to be printed per layer, depicting the number of layers on the exterior of an FDM part, and also tend to affect the internal structure of the finished part. Improving the shell thickness can increase the tensile strength of the FDM part. Also, to avoid voids in the FDM part, the rule of thumb is to design shells to be a multiple of nozzle diameter. 17 If the nozzle diameter is 0.4 mm, commonly used shell thicknesses are 0.8 mm and 1.2 mm.
Conventionally, the most accurate and direct method for identifying the overall properties of FDM printed parts is by conducting experiments. However, experimental test campaigns can be expensive and time-consuming. Hence, the focus has steadily shifted towards building analytic models and conducting numerical simulations.
Huang and Singamneni 18 used experimental and analytical methods to demonstrate that material constants are sensitive to varying meso-structures. Tensile testing on samples with varying raster angles (0°, 30°/150°, 45°/135°, 60°/120°, and 90°) showed that ultimate tensile strength and Young’s modulus decreases when the raster angle increases. Analytical models utilizing the plane stress approach were also developed for elastic moduli, strain, and stress. A good agreement was ascertained between analytical and experimental values validating the models.
Many studies have been conducted to estimate the mechanical characteristics of FDM printed parts by building representative volume element (RVE) and subjecting them to numerical analysis. Lei et al. 19 propose the scanning electron microscope (SEM) method for modeling micromechanical RVEs of FDM-printed carbon fiber-reinforced polylactic acid (PLA/CF) laminates. Using the finite element (FE) based numerical homogenization method, the effective modulus of the PLA/CF part was estimated. Investigations were performed for raster angle, deposition configuration, and layer thickness. It was suggested that the layer thickness can alter the constitutive behavior of the 0° part from orthogonal to transverse isotropy. The 0°/90° part displays transversely isotropic characteristics in the thickness direction. The parts with a 45° raster angle have stronger longitudinal and interlayer bonding strength. This infers that the deposition configuration had no significant effect on the shear modulus in the thickness direction of the part. Rao et al. 20 presented a model to estimate the elastic properties of ABS polymers employing machine settings and material (filament) properties as variables. The final product's orthotropic properties were evaluated using numerical homogenization and assuming the filament material properties to be isotropic. The finding depicts that the porosity affected the transverse modulus, unlike the longitudinal modulus, which was slightly affected by the printing conditions. It was noticed that the predicted modulus had a somewhat higher value than reality because of the omission of inner voids in the beads and the poor interface/interphase between deposited beads. Finally, the authors concluded that instead of assuming isotropic filament properties, orthotropic characteristics of filaments should be incorporated to investigate properties.
Sheikh et al. 21 propose a multiscale method to calculate the stiffness matrix of the FDM part. The isotropic PLA filament was utilized for fabricating the laminate, but the final constitutive properties differed from the filament material. The proposed method shows an error of 6% for Young’s modulus and 5% for shear modulus for the 0° part. For the 0°/90° part, the error is reported as 8% for Young’s modulus and 6% for shear modulus. These errors are due to the assumption of calculating the stress value as the average over the elements (RVE), which does not consider the effect of the triangular voids. Moreover, the deviation in the values could be because of the micro-voids in the macro scale because of manufacturing, which is not incorporated in this method.
Guessasma et al. 22 studied the mechanical properties using experimental and numerical methods. A linear elastic isotropic material model is analyzed to predict the mechanical performance of the polylactic acid (PLA) part. The Poisson’s ratio and modulus values were taken from the technical data sheet the material supplier gave. Two modeling approaches were considered. The first is a quasi-static linear model, and the second is an elastic-damage model. The comparison of mechanical properties between the as-received and printed PLA demonstrates that there is a degradation in mechanical performance. The discrepancy between the experimental and predicted modulus represents 21%. This overestimation may be associated with the bond quality among the PLA beads or material degradation. In a recent publication, Shah and Jain 23 confirmed this observation and reported experimental data for the mechanical properties of printed parts and filament. The former was shown to be significantly lower. The reasons ascribed were molecular realignment during the printing process, confirmed by XRD studies.
According to the literature cited above, the numerical homogenization methods are helpful tools to describe the effective modulus of parts created by the FDM technique. However, in all the existing numerical models, the input properties are taken from online material databases or previous literature. Generally, most studies do not address filament properties and their degradation, which is a novel aspect explored in this work.
The accuracy of any modeling depends strongly on the input parameters selected. Currently, there are no well-defined methods for identifying these parameters. This becomes critical, considering that the material properties can change during printing. Secondly, accurate meso-structure interpretation of the printed part is desired to attain a finite element (FE) methodology that might enable the examination of the entire structure fabricated by FDM.
The rest of the paper is structured as follows: Section 2 presents the experimental methodology. Section 3 shows the results of density estimation and tensile testing of filaments and printed samples. Section 4 proposes the method for stiffness calculation to build RVE models based on image analysis and density drop. Section 5 compares the predicted and experimental modulus to validate the accuracy of the proposed methodology. Finally, in Section 6, conclusions are outlined.
Experimental methodology
Feedstock material
Polyamide (PA) and polylactic acid (PLA) filaments, having diameters of 1.75 mm, were selected as the feedstock material for this study. PLA filament was purchased from Fil tech 4.0 s, India, and PA filament was supplied for e-Sun, China. A thorough review of material databases for PA filament feedstock, including e-Sun in China, was undertaken. Generally, manufacturers provide extensive physical, chemical, mechanical, and thermal properties specific to the 3D printing filament material. Unfortunately, the suppliers of PA did not furnish data on how filament properties vary with different build orientations. 24
PLA is easy to print in an FDM machine, as it flows smoothly through the nozzle. In addition, it sticks to the platform well, so a hot base is not necessary, unlike in PA, where a heat bead is mandatory. The low extrusion temperature and excellent dimensional accuracy make PLA suitable for various applications like aesthetic models, medical devices (orthotic and prosthetic devices), jigs and fixtures, etc. 23 On the other hand, PA is the first semi-crystalline polymer for the FDM process. 25 Though PA shows high strength, excellent wear, and good chemical resistance, a limitation is the fact that it exhibits low humidity resistance. 26 Application areas include bio-medical implants, automotive, and consumer goods, and can also be used for low-volume production parts with less demanding functional parts.
Specimen design and printing parameter selection
The test coupons were printed utilizing a Creality Ender-3 Pro FDM printer. The dogbone specimen's geometry was designed based on the ASTM D638-14 Type V
27
in SolidWorks CAD software (refer to Figure 1) and exported in a standard tessellation language (.stl) file to the Ultimaker CURA. This software was used to convert the .stl file into a .gcode file by selecting process parameters, such as layer thickness, raster angle, print speed, nozzle and bed temperature, etc. Overall, five raster orientations were chosen for this study: 0°, 30°/150°, 45°/135°, 60°/120°, and 90°. Line infill patterns and 100% infill density were selected for printing the specimens for all the raster orientations. The chosen printing process parameters in CURA software are summarized in Table 1. ASTM D638-14 Type V dogbone sample. All dimensions are in mm. Printing parameters.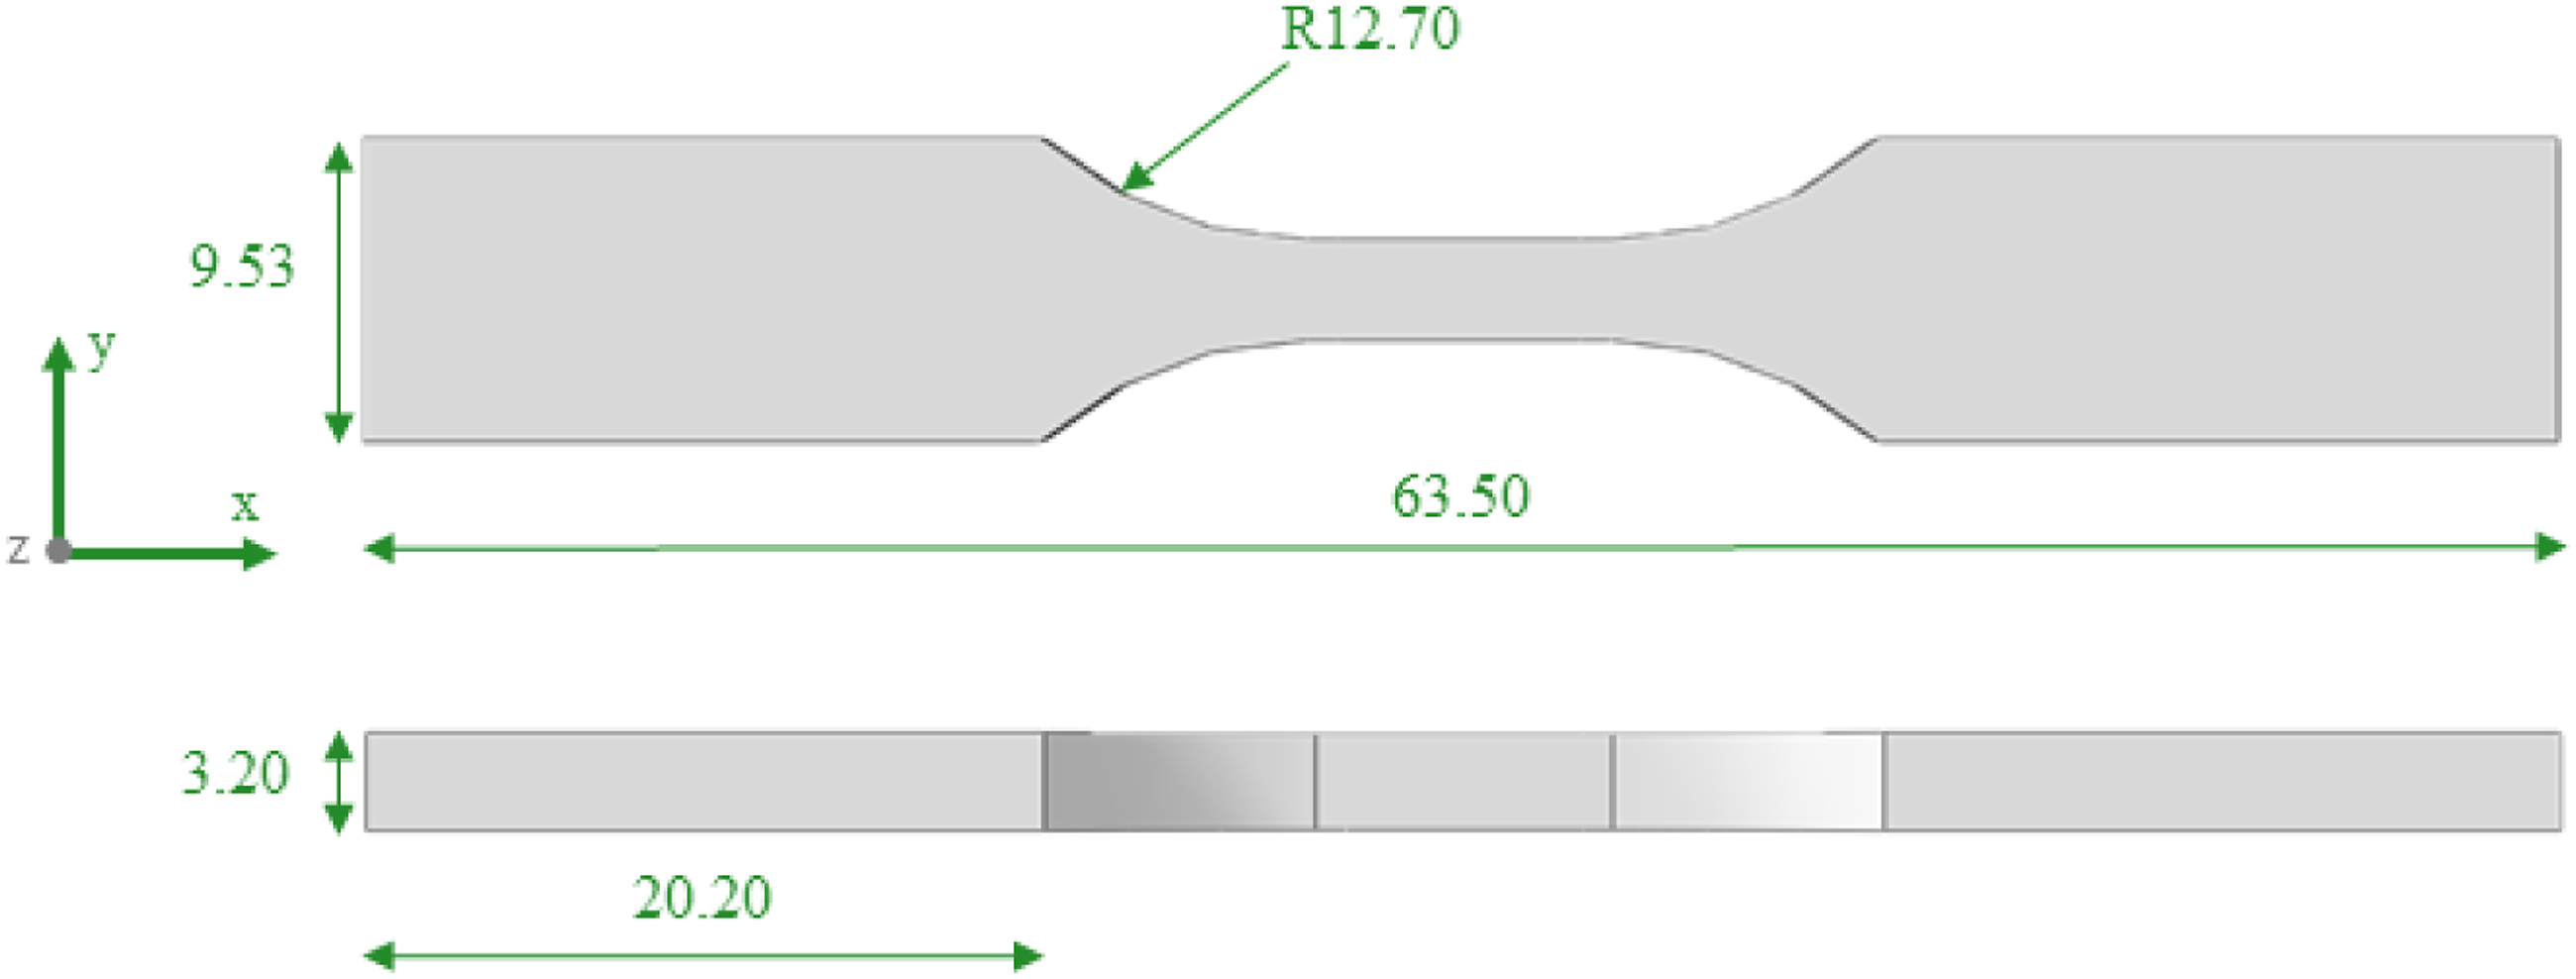
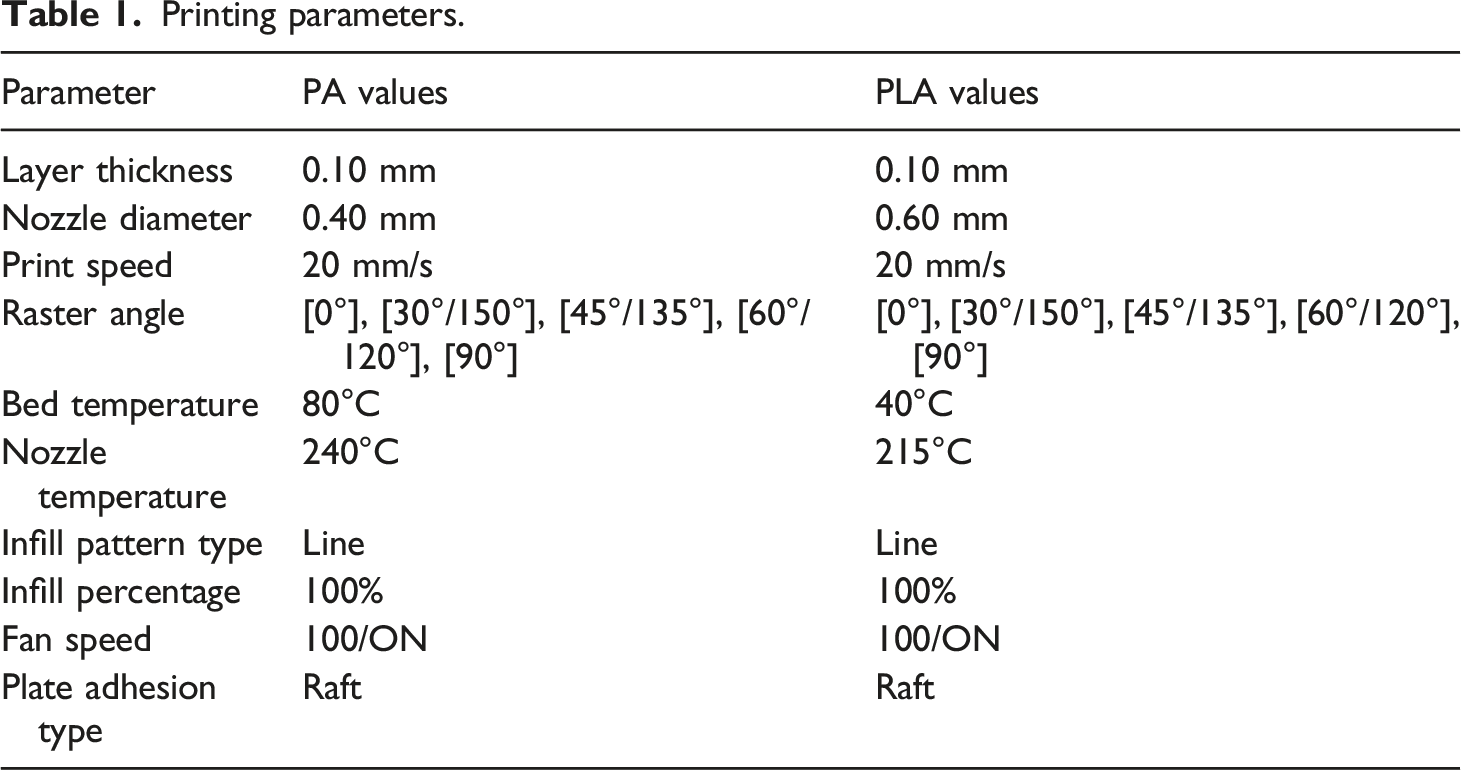
Smaller nozzle diameters offer improved mechanical properties but increase production time and potential clogging issues. Larger nozzle diameters have somewhat lower mechanical properties but decrease production time. The choice of nozzle diameter often involves trade-offs based on practical material-specific experience. A 0.4 mm nozzle diameter was chosen for PLA, and a 0.6 mm nozzle diameter was selected for PA to prevent clogging. PLA flows smoothly due to its brittleness. However, using a 0.4 mm nozzle with PA led to clogging because of its highly ductile nature, causing increased backpressure and filament flow obstructions.
Density estimation
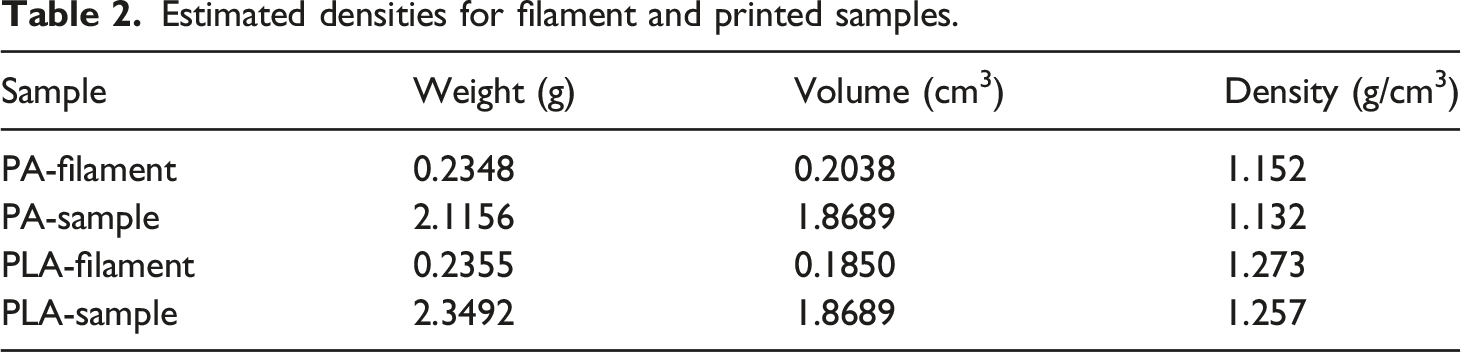
For computing the weight of the filament and FDMed samples, a weighing balance (Mettler Toledo Comparator XRR26 C) was used, gauging to the closest 0.0001 g. Vernier caliper was used to measure the diameter of the filament at 20 random locations. Subsequently, assuming filaments to be cylindrical in shape with an average diameter, the volume of the PA and PLA filament was measured. For the printed part, dogbone samples were considered, the outer surface of the printed part was first rubbed with sandpaper to remove the additional spread out, which can result in incorrect results. Then, by measuring the dimensions of the printed sample and taking those dimensions in the CAD modeling software, the volume of the printed samples (i.e., the volume of the CAD model) was calculated. 28
Tensile testing and SEM analysis
Quasi-static tensile testing was done on a Tinius Olsen universal testing machine with a 5 kN load cell with ±0.5% accuracy. Filaments and dog bone samples were tested. The geometry of the ASTM D638-14 Type V dog bone specimen is shown in Figure 1. The filaments (gauge length = 60 mm) and printed specimens (gauge length = 25 mm) were tested under ambient conditions (22°C and 60% humidity). At least six samples of filaments and each raster orientation were examined.
After tensile testing, scanning electron microscope (SEM) images of the microstructure were captured using a Zeiss Gemini 2 FESEM at an accelerating voltage of 10 kV and an emission current of 20 mA. The conductive coating was done with Au-Pt alloy utilizing a current of 40 mA and an evaporation time of 90 s. SEM was used to examine the material microstructure of fracture dogbone specimens and, specifically, the deposition sequence of adjacent filaments.
Experimental results
Density drop estimation
Estimated densities for filament and printed samples.
Tensile test results
The experimentally derived Young’s modulus (YM), both mean and standard deviation, are shown in Figure 2. The YM decreases with the rise in raster angle for the PA and PLA FDMed material. The 0° raster-orientated part demonstrated the highest stiffness with the average Young’s modulus value of 293.27 and 1778.68 MPa for PA and PLA, respectively. On the contrary, the 90° raster-orientated part were the least stiff, with the average Young’s modulus value of 280.06 and 1434.44 MPa for PA and PLA, respectively. In the 0° part, the tensile load was employed in a direction parallel to the direction of each bead. Instead of the interfacial bonding, the individual beads carry most of this load. However, for the 90° part, the bead deposition orientation is perpendicular to the direction of tensile load. Hence, the interfacial bond carries a significant part of the load in this case. Due to this, the tensile modulus of 90° parts is somewhat decreased. The tensile test results suggest that FDMed parts with different raster configurations display anisotropic properties. The processing conditions influence these properties as these properties impact the bead-to-bead bond strength. This also means that the stress heterogeneity depends on how the layup is arranged.
29
Bar chart of filament and printed samples for PA (left) and PLA (right).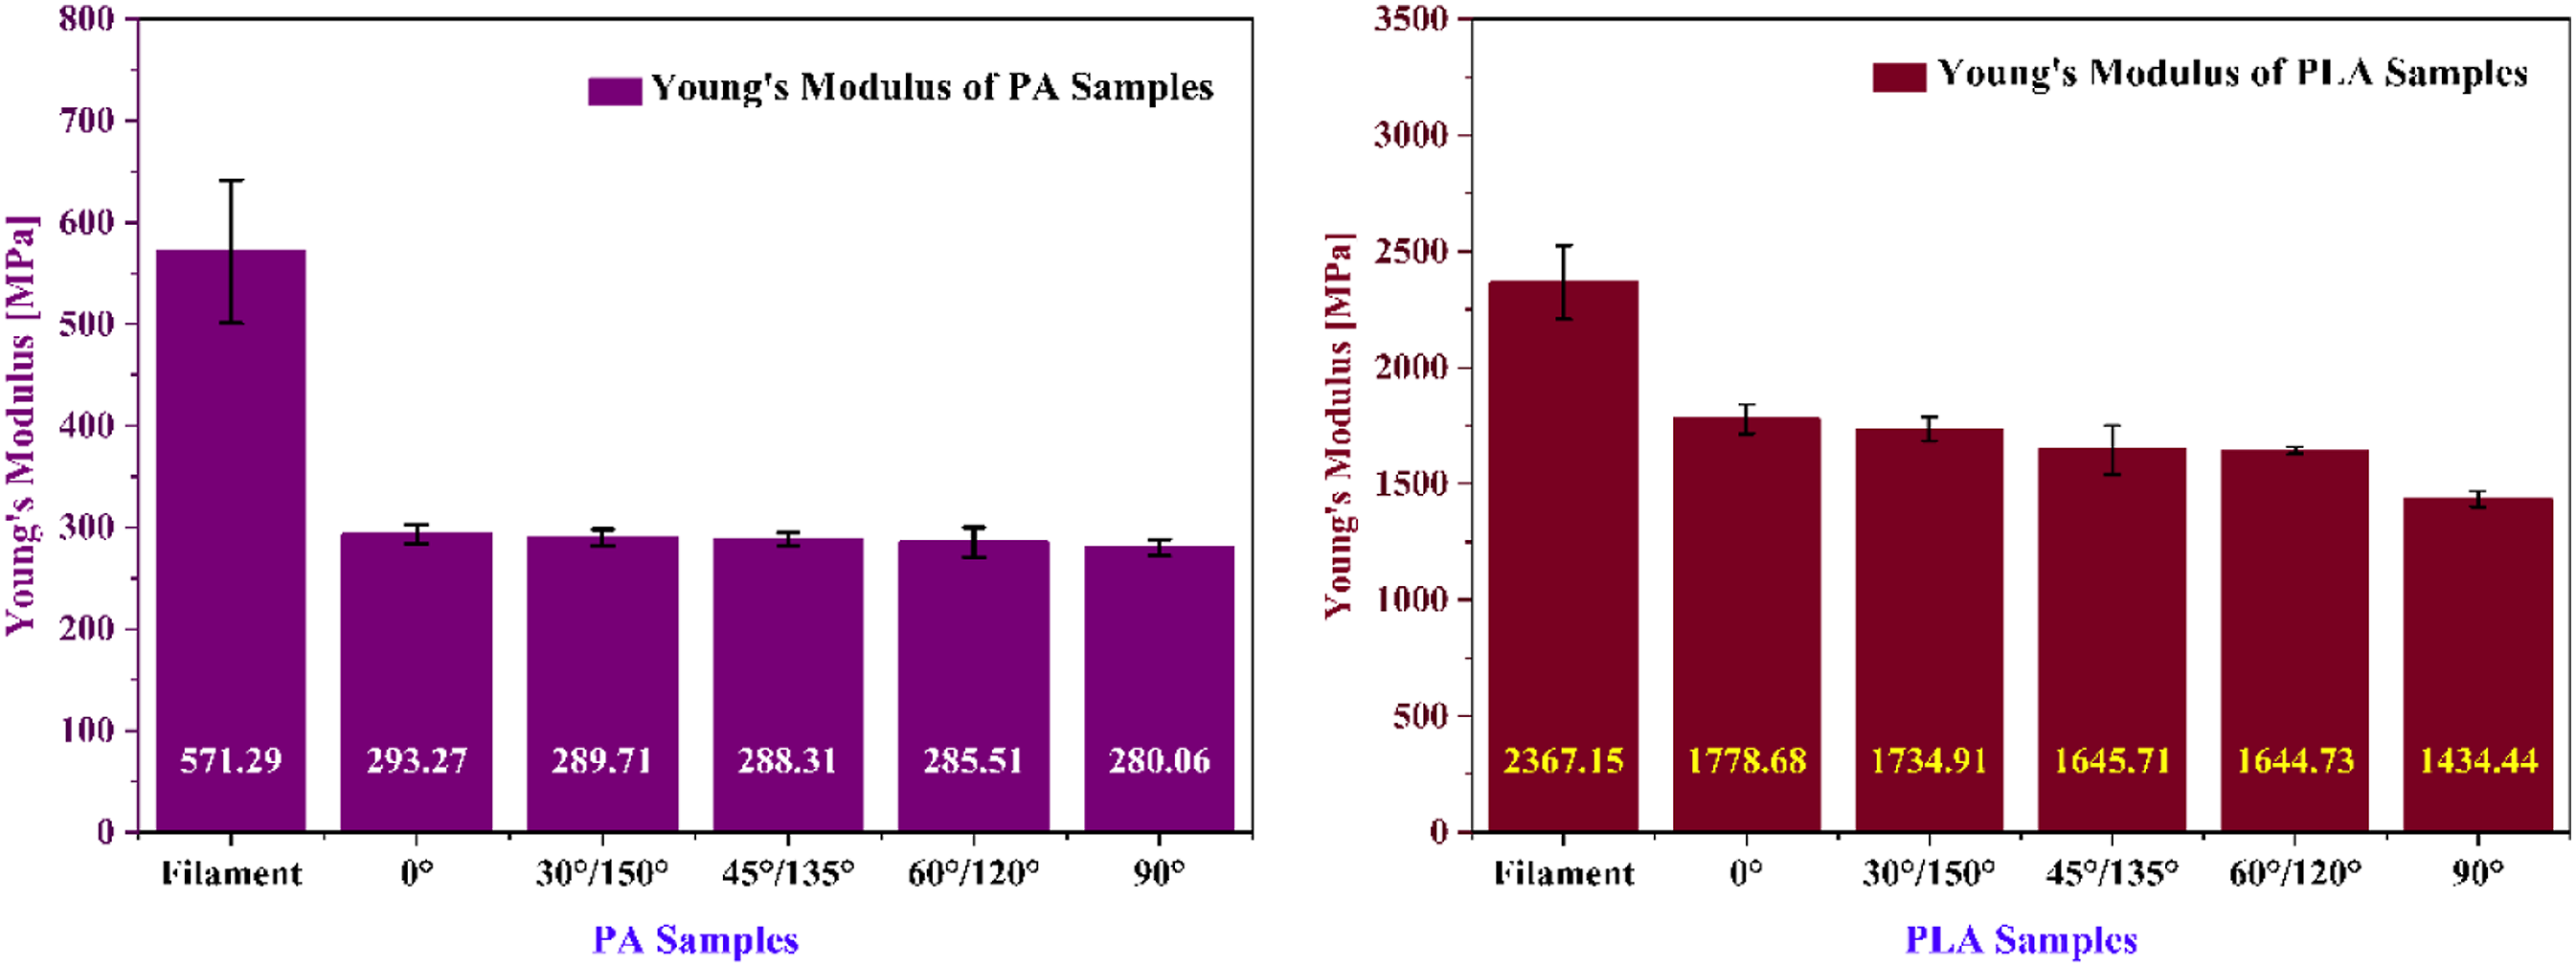
Degradation of material properties
The tensile test results demonstrate that the modulus of filaments is significantly higher than the corresponding printed specimens for both PA and PLA material. The percentage decline in modulus value from the filament to the printed sample for 0°, 30°/150°, 45°/135°, 60°/120°, and 90° raster-oriented PA test coupons is 48.67%, 49.29%, 49.53%, 50.02%, and 50.97%, respectively. Likewise, the same drop for 0°, 30°/150°, 45°/135°, 60°/120°, and 90° raster-oriented PLA test coupons is 24.86%, 26.71%, 30.48%, 30.52%, and 39.40%, respectively.
The following factors can be attributed to the printed part’s poor performance relative to the filament. The first thing is the inadequate inter-bead and intra-bead cohesion and voids generated during the FDM printing process. The lack of interfacial bonding between the adjacent beads generates most of the voids. The second feature is the presence of micro-voids within the filament itself. These micro-voids within the printed beads play a critical role in the straining of the filament wire during the laying down process with velocities that are more incompatible with the viscous state of the polymer. 29 The load transfer for filaments and printed parts also explains the degradation in performance. For printed samples, loading includes both tension and shearing, while the filament material is simply subjected to pure tension. The deformation modes are different for both filament and samples. The presence of such voids causes stress heterogeneity in the printed parts.
In contrast to the stress heterogeneity that occurs in the FDM-printed part, the stress distribution within the filament under tensile loading is more uniform if the stress concentration at the grips is eliminated. Guessasma et al. 22 explain that the tensile testing of the as-received filament is homogeneous along a major portion of its length. On the other hand, the FDM-printed parts enable only a confined part of the filament to be strained, resulting in non-uniform deformation. Karakoc et al. 30 concluded that the higher stiffness for both PA and PLA filament than the 0° raster angle specimen is probably due to the way filament and printed samples have been extruded or fabricated.
In this work, the author believes that the processing conditions of filaments and FDMed samples are entirely different. Quenching was done for filaments prior to spooling to retain the amorphous state in the filament wire so that melting can be easily performed during FDM printing. In the case of printed samples, melting/solidification of the printed part occurs over a period of time. In both conditions, the cooling rates are different,26,27 resulting in a difference in modulus values of the filament and printed part. It is known that the processing can alter the properties of thermoplastic. 31 There is also evidence and conjecture that the matrix undergoes some molecular realignment during the FDM process, which leads to decreased modulus of the bulk material.23,32,33
Methodology for stiffness calculation
Microstructure generation
For mesoscale analysis, two methodologies were used for generating the representative volume elements (RVEs) to perform finite element (FE) based numerical homogenization. For a part printed with thermoplastic material, the RVE comprises the matrix and the voids generated during the FDM processing. The first method is based on SEM mapping to establish a representative microstructure and RVE, and the second method is based on the density degradation due to inherited voids from the FDM printing strategy.
The generated RVE models have the following assumptions: perfect bonding between the adjacent beads, each bead in the mesostructure has a uniform shape, and the alignment of the voids is in line with the orientation of the beads. Moreover, it is presumed that voids are arranged sparsely.
Based on SEM mapping
Image processing is performed on the gauge area section for SEM-based measurement to evaluate the bead height and width using Image J. The threshold algorithm estimates the dimension of the deposited beads and the void volume fraction (VVF) of the meso-structures. 19
Figure 3 shows the diagram of the SEM voids mapping method for 0° PA and PLA FDM printed parts, respectively. In both the micrographs of PA and PLA, only in the lower half of layer thickness the full fusion appears. Thus, the voids formed are analogous to the geometry of a triangle in which the bottom base is flat, and the top corners are rounded. In the 0° part, along each bead intersection, the voids were developed. The measured VVF of PA and PLA are 1.74% and 2.35%, respectively. FE models from SEM images. PA (top) and PLA (bottom).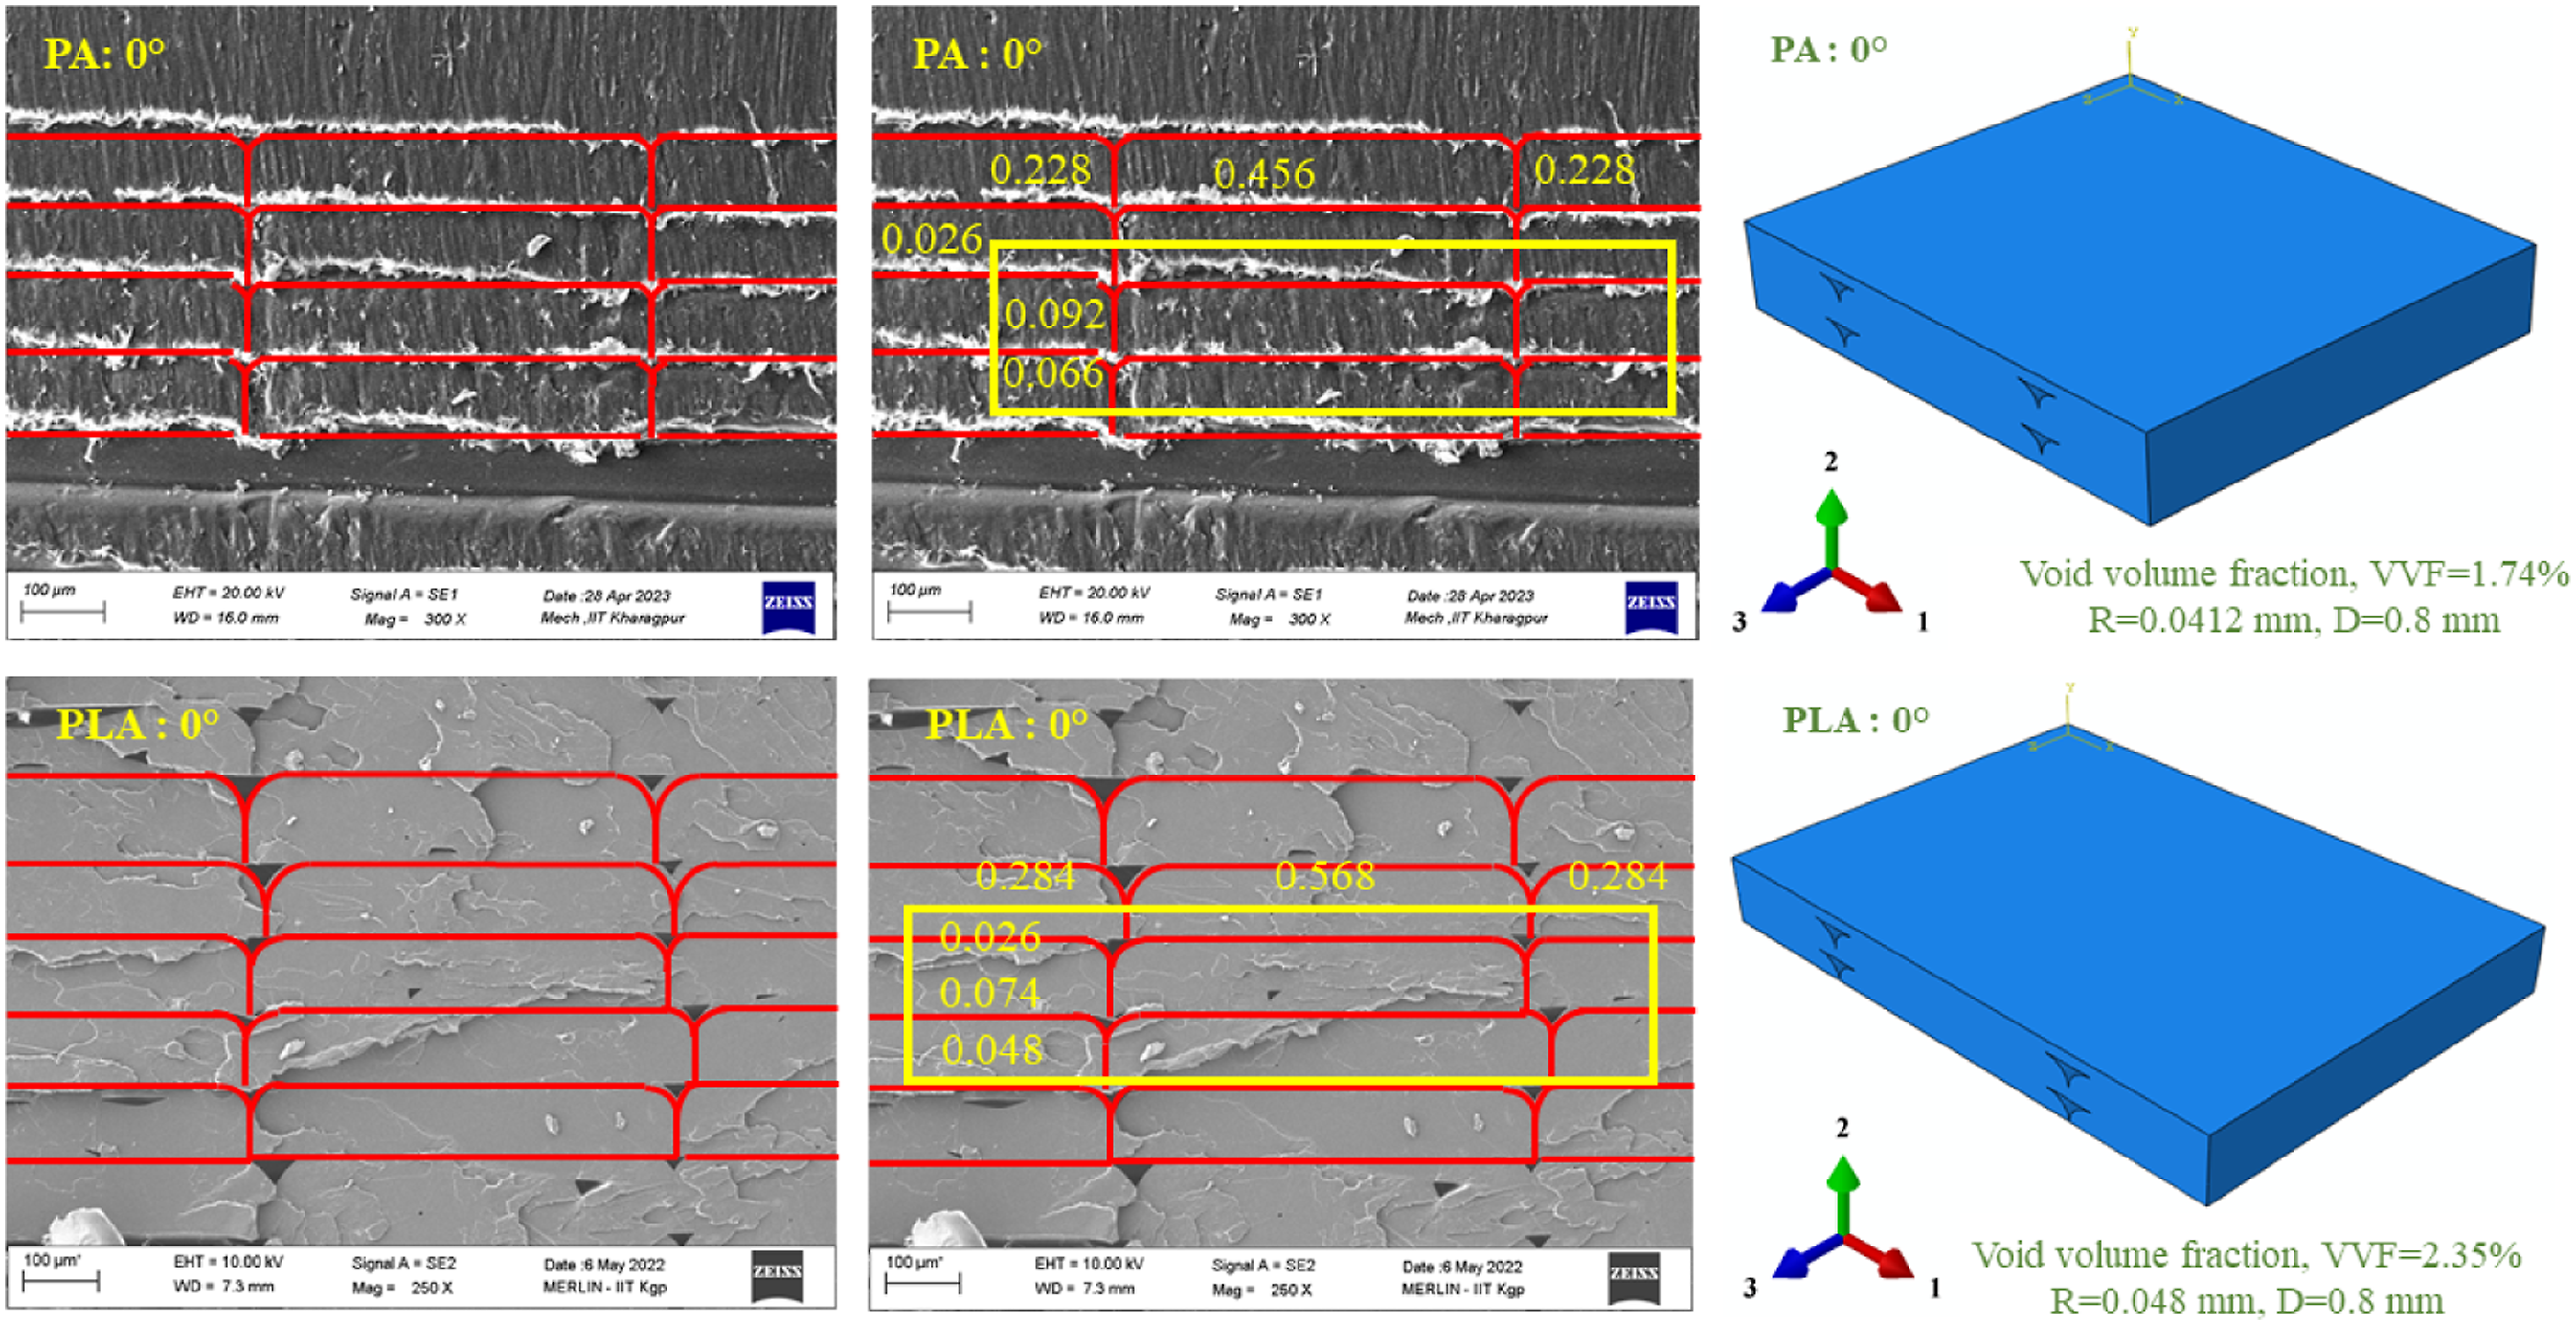
In CURA software, the nozzle diameter selected for PA and PLA was 0.4 mm and 0.6 mm, respectively. Although, layer thickness (=0.1 mm) is common for both materials. In the case of the PA 0° SEM micrograph, the mean bead width (0.456 mm) is slightly higher than 0.4 mm, but the mean bead height (0.092 mm) is nearly close to 0.1 mm. On the contrary, in the PLA 0° SEM micrograph case, the mean bead height (0.074 mm) is slightly lower than 0.1 mm, but the mean bead width (=0.568 mm) is close to 0.6 mm. The SEM-obtained values for bead height and width for both PA and PLA are slightly deviant from the printing process parameters selected in CURA software (refer to Table 1). This deviation is likely caused because of the viscosity and rapid solidification of the melted thermoplastic filament, restricting the perfect filling of the filament material. 34
RVE is considered to include one complete bead at the center and portions of beads surrounding the central bead, forming a cuboid. Periodicity of the microstructure is ensured. The length (l), height (h), and depth (d) of the 0° RVE model of PA and PLA are l = 0.912 mm, d = 0.8 mm, h = 0.184 mm, and l = 1.136 mm, d = 0.8 mm, h = 0.148 mm, respectively.
Based on density degradation
For recreating the representative volume element (RVE) using the density data, it is assumed that the layer thickness to layer width ratio (also referred to as Aspect ratio) is the same as programmed in CURA. This assumption is common and has been reported previously.35–37 The shape of the bead is idealized as a rectangle with quarter-circle edges on the top. The radius of the quarter circle is back-calculated based on the loss in density, assuming extra voids generated during the FDM process are the same as the drop-in density.
In CURA software, the selected layer thickness is 0.1 mm, and the nozzle diameter for PA and PLA is 0.4 mm and 0.6 mm, respectively. Therefore, the aspect ratio in PA and PLA is assumed to be 1/4 and 1/6, respectively. The radius of the quarter circles for PA and PLA estimated using the void volume fraction of 1.74% and 1.25% (the measured density drops as reported in Section 3.1) was 0.0412 mm and 0.048 mm, respectively.
Finite Element (FE) modeling
A linear elastic isotropic material model is considered to assess the tensile behavior of the FDM-printed PA and PLA. The Young’s modulus, (E) and Poisson’s ratio, (
A free meshing technique with C3D10 M (a 10-node modified quadratic tetrahedron) element type was considered for all the RVEs. When contact is present in the model, using the C3D10 M element is recommended because this element is robust for large-deformation and contact problems and exhibits minimal shear and volumetric locking. 38
To avoid mesh dependency and ensure convergence of the simulation results, the RVE models were meshed with an approximate global size of 0.015, identified by refining the mesh to obtain proper mesh quality for the finite element (FE) results. Additionally, it was ensured that further reduction of the mesh size did not lead to a change in the calculated properties by more than 1%. The chosen mesh size led to a total number of 217852 and 248306 elements for the PA and PLA RVE, respectively.
According to Nemat-Nasser et al.,
39
the macroscopic stress and strain tensors 

Six independent strain boundary conditions employed on the RVE models (Figure 4) are as follows: three normal strains ε11, ε22, ε33 = 0.1 and three shear strains ε12, ε13, ε23 = 0.1 and the average response correlated (equation (2)) to estimate the equivalent modulus. In the FE model, displacements corresponding to the required strain are prescribed, and Dirichlet’s boundary condition (DBC) is employed. For further confidence in the FE results, the same RVE was subjected to periodic boundary conditions using the Easy PBC plug-in tool.
40
It is confirmed that the effective response by the two methods is nearly identical. Therefore, all further FE models were subjected to DBC. Boundary conditions for three normal strains, three shear strains, and the corresponding engineering constants derived.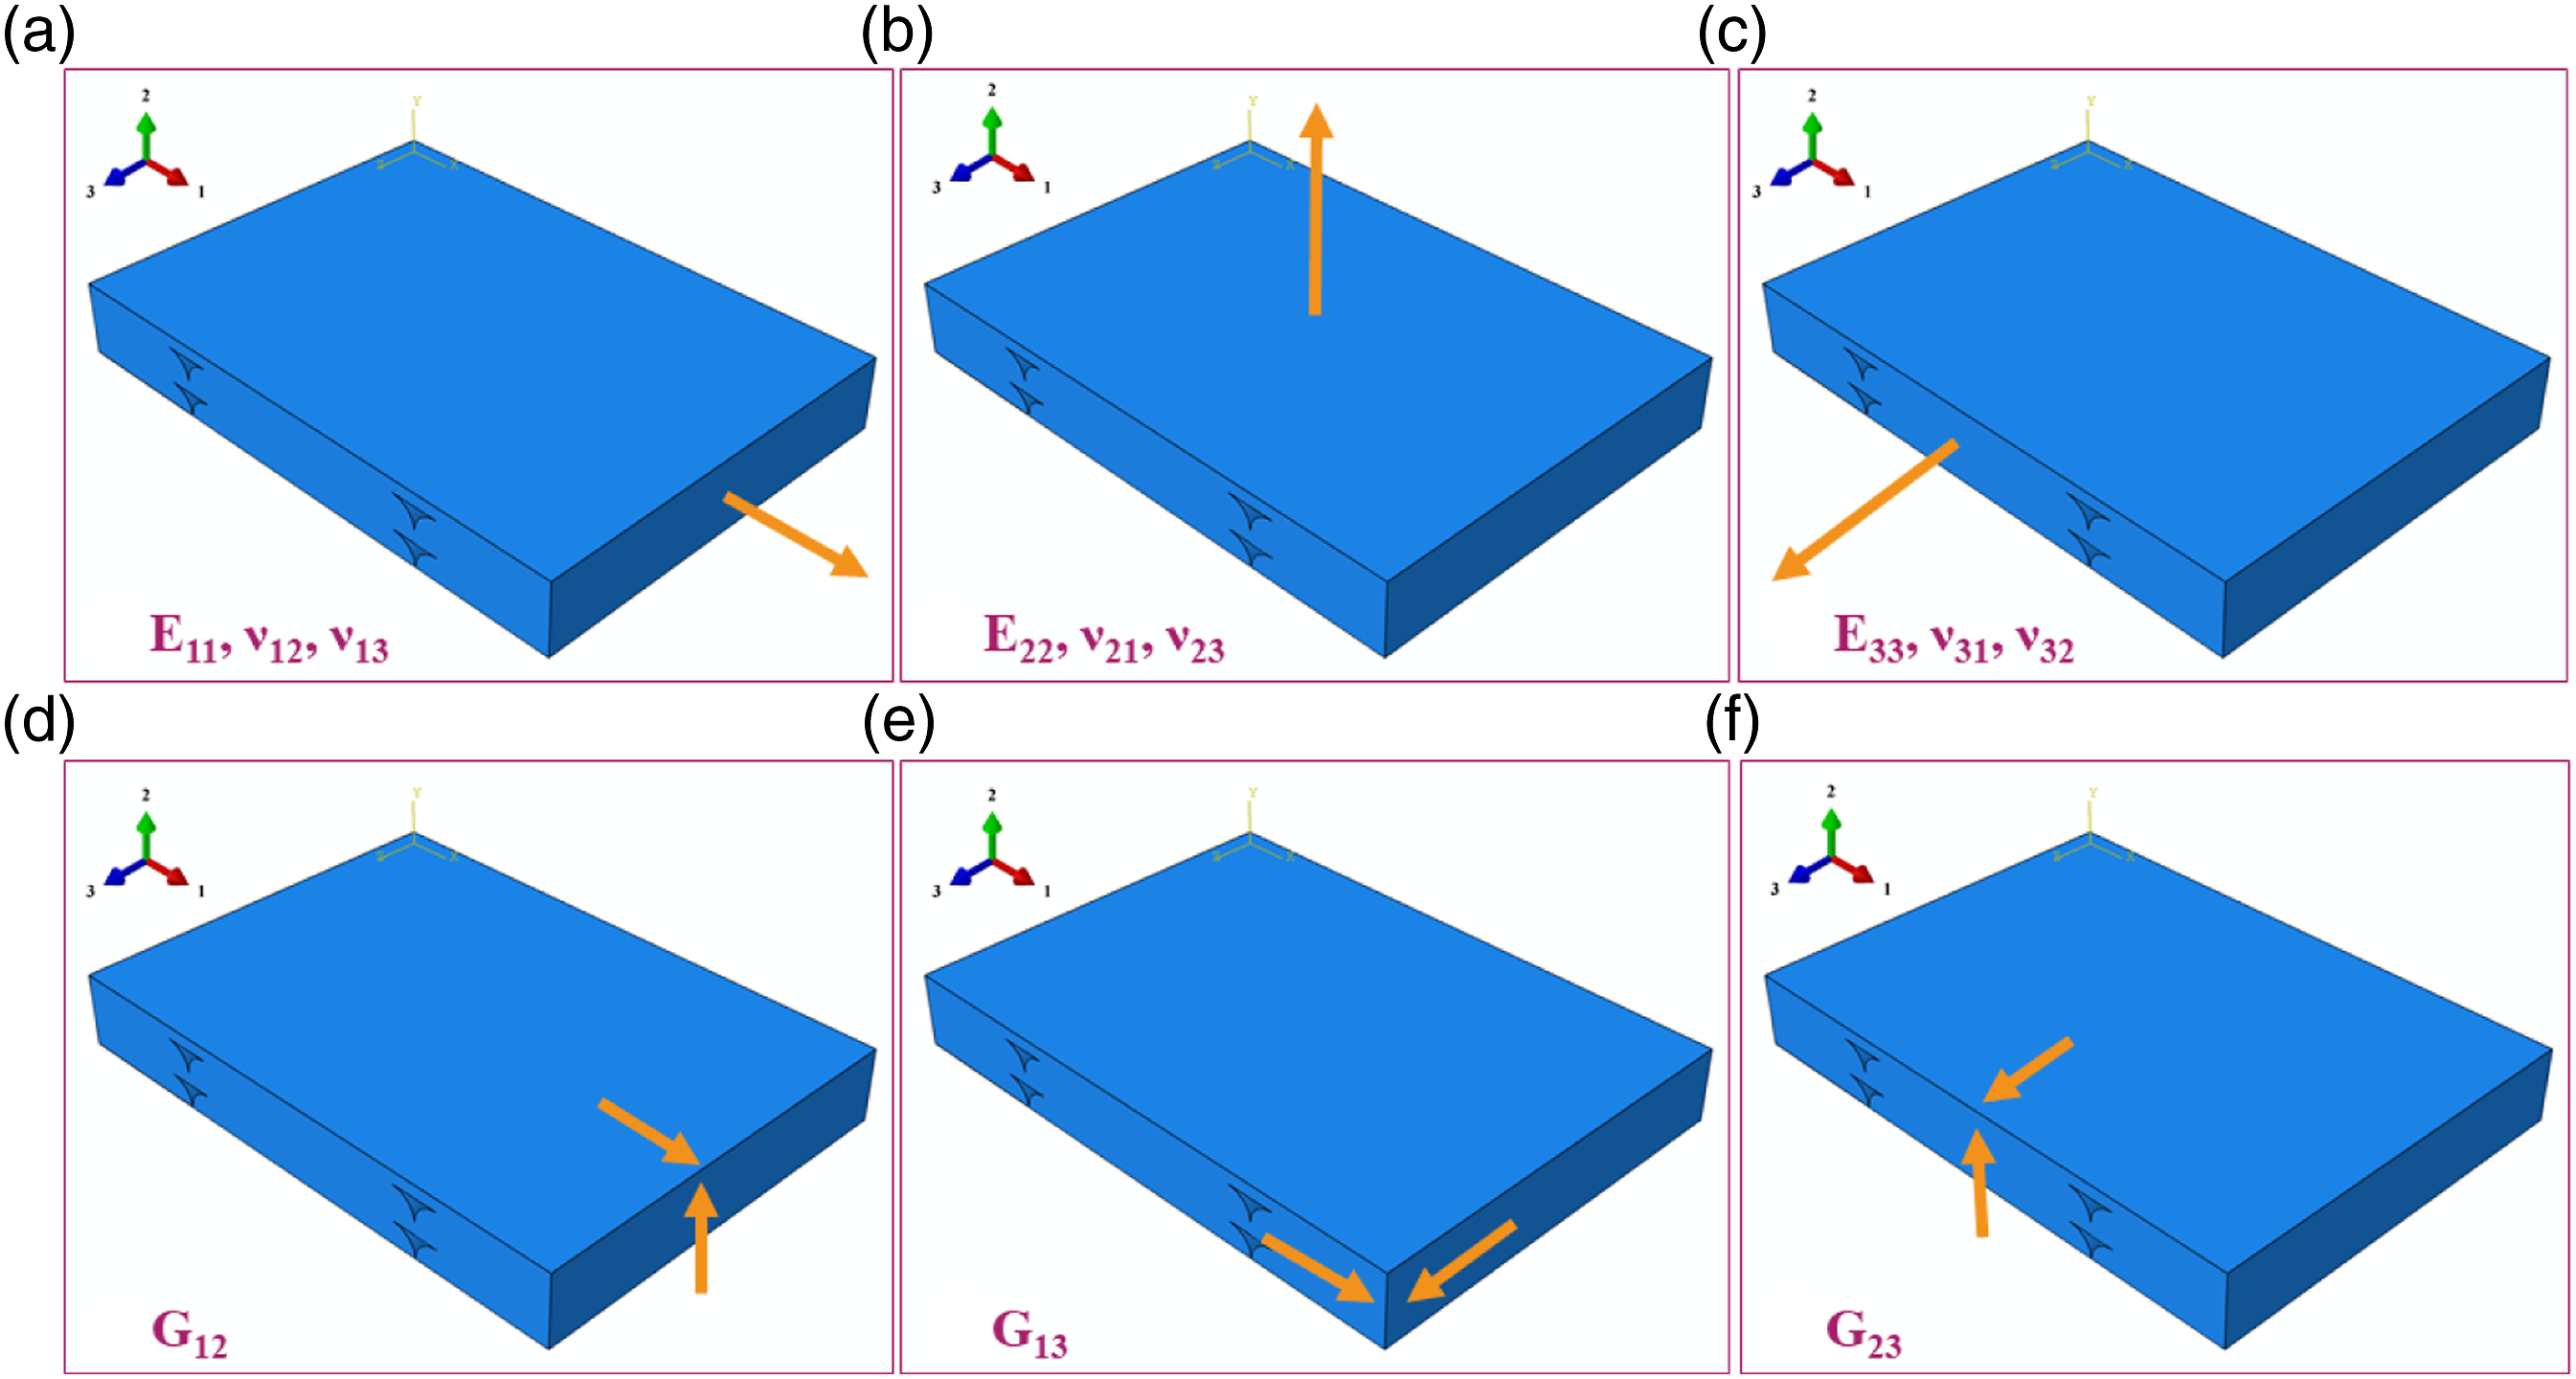
All FE calculations were done for the 0° raster orientations. To capture the effect of other raster planar orientations, the transformation of the stiffness tensors is utilized, which can be written as:
Shells are printed parallel to the print bed. The outer shells are printed in solid density and composed of one wall. The printing direction of the wall is aligned, transverse, and angular with the 0°, 90°, and 30°/150°, 45°/135°, and 60°/120° FDM printed parts, respectively (refer to Figure 5). In the schematic representation of the gauge area section (refer to Figure 6), the printing order of the outer shells and the infill for the 90° part are shown from the top view. Schematic representing the gauge length area of different raster orientations along with the outer shell. Schematic representing the outer shell thickness and infill of 0° part in the gauge area section.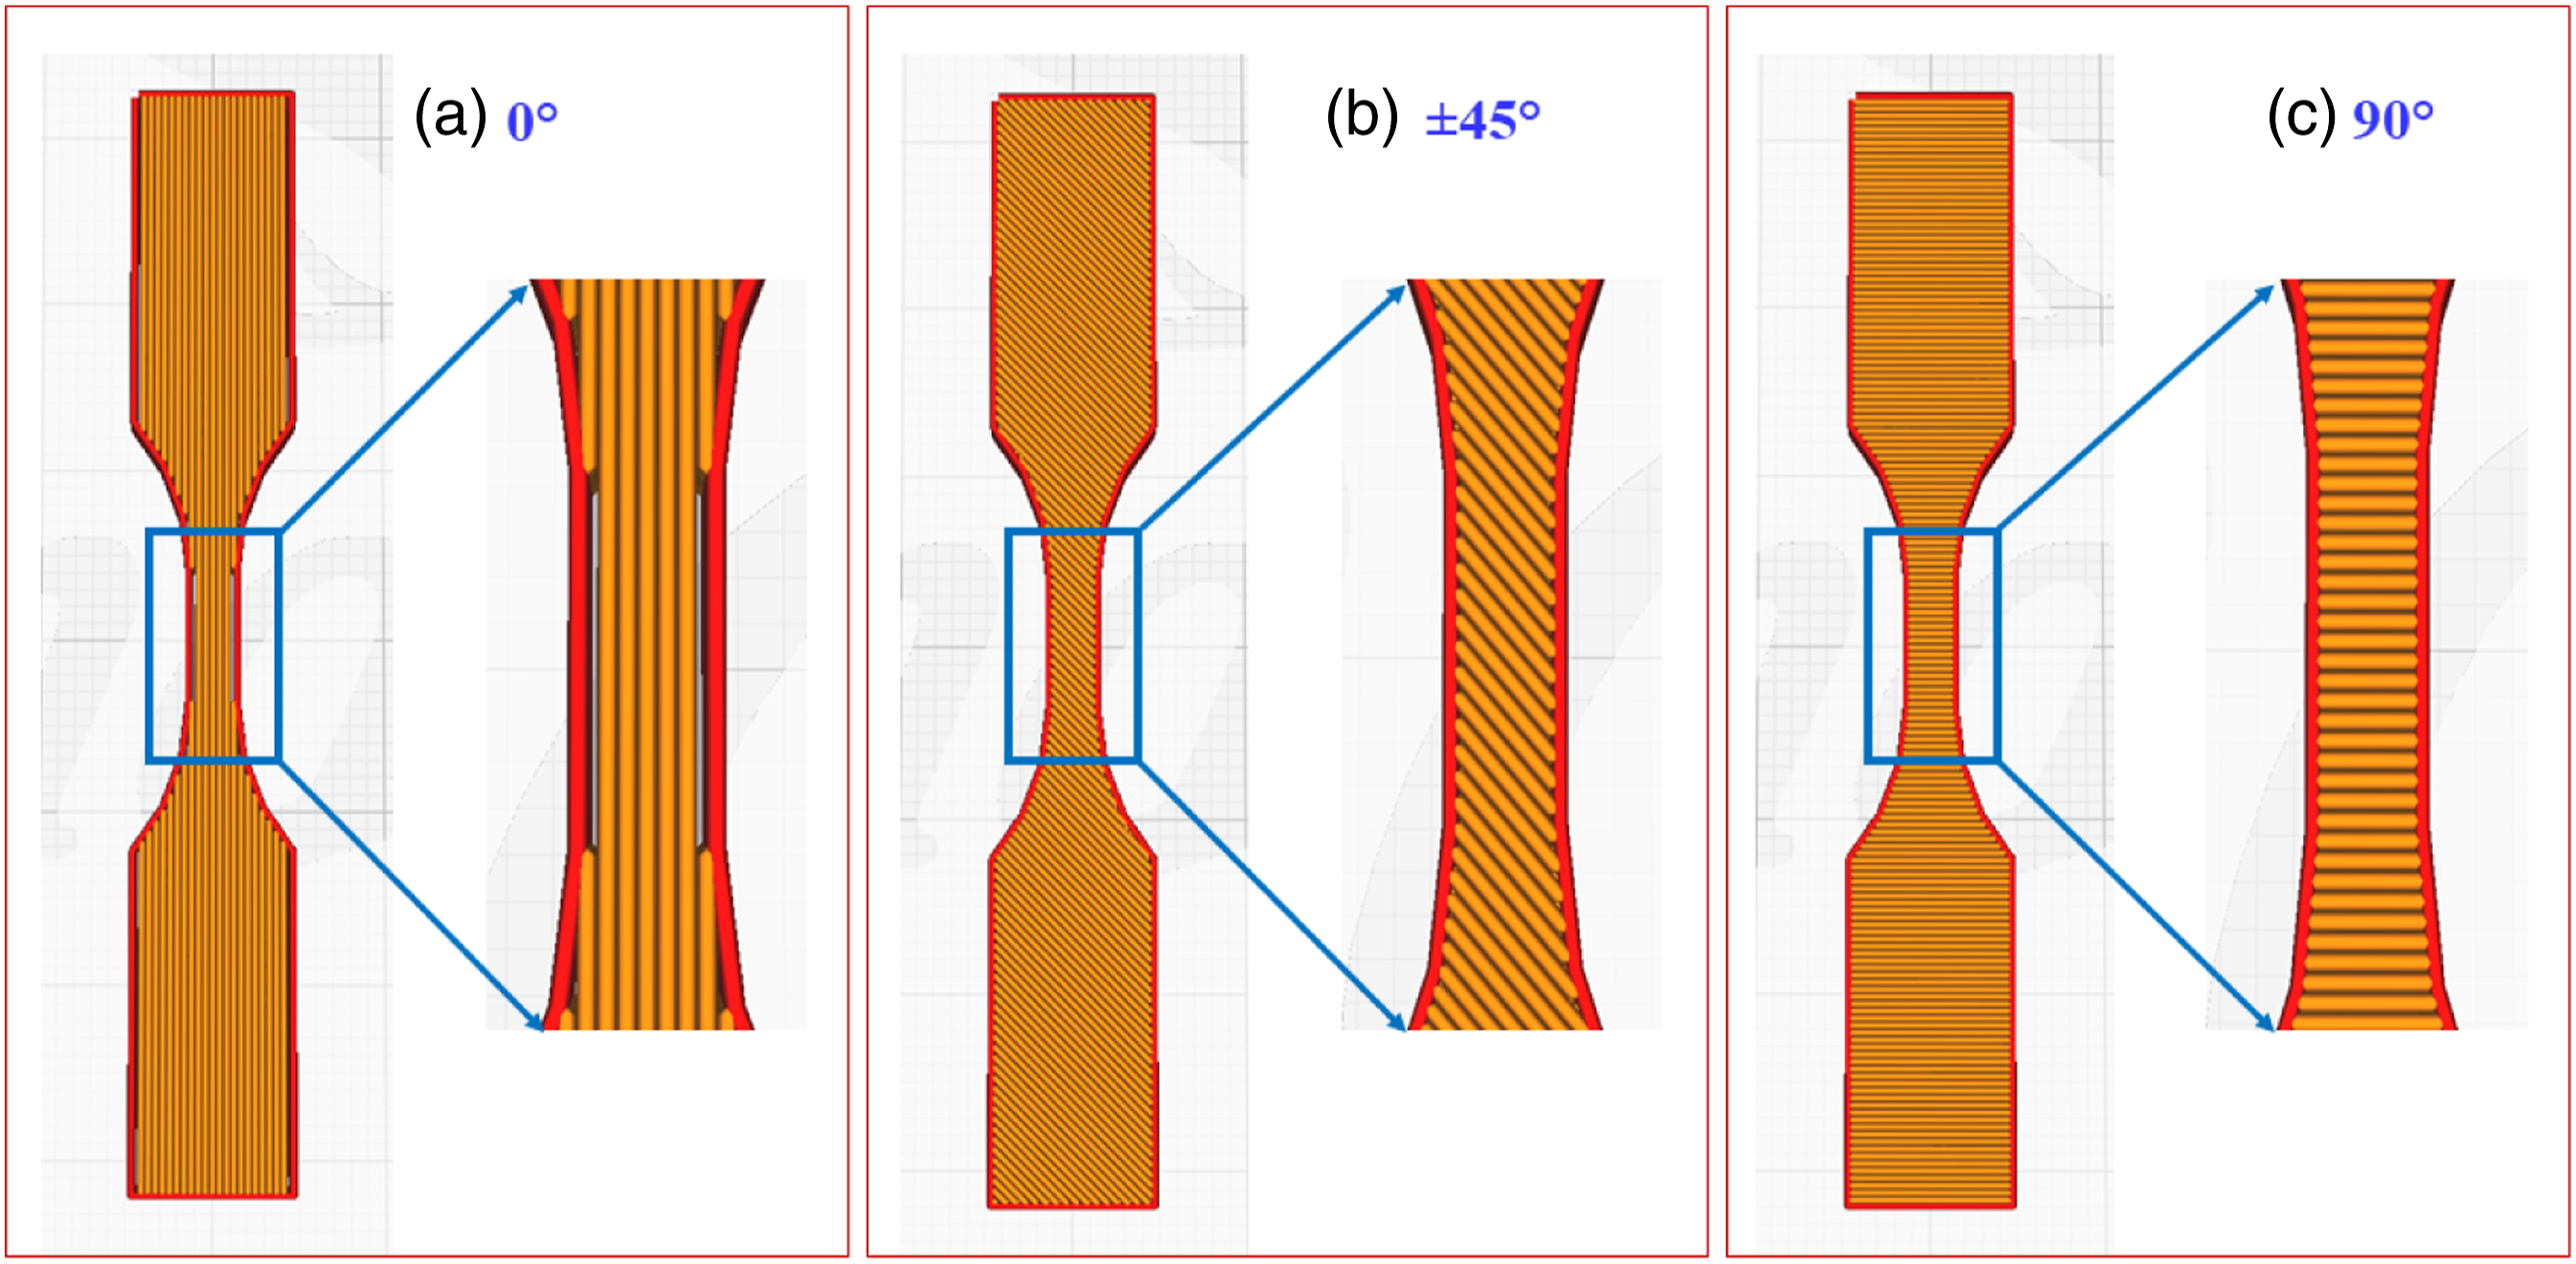
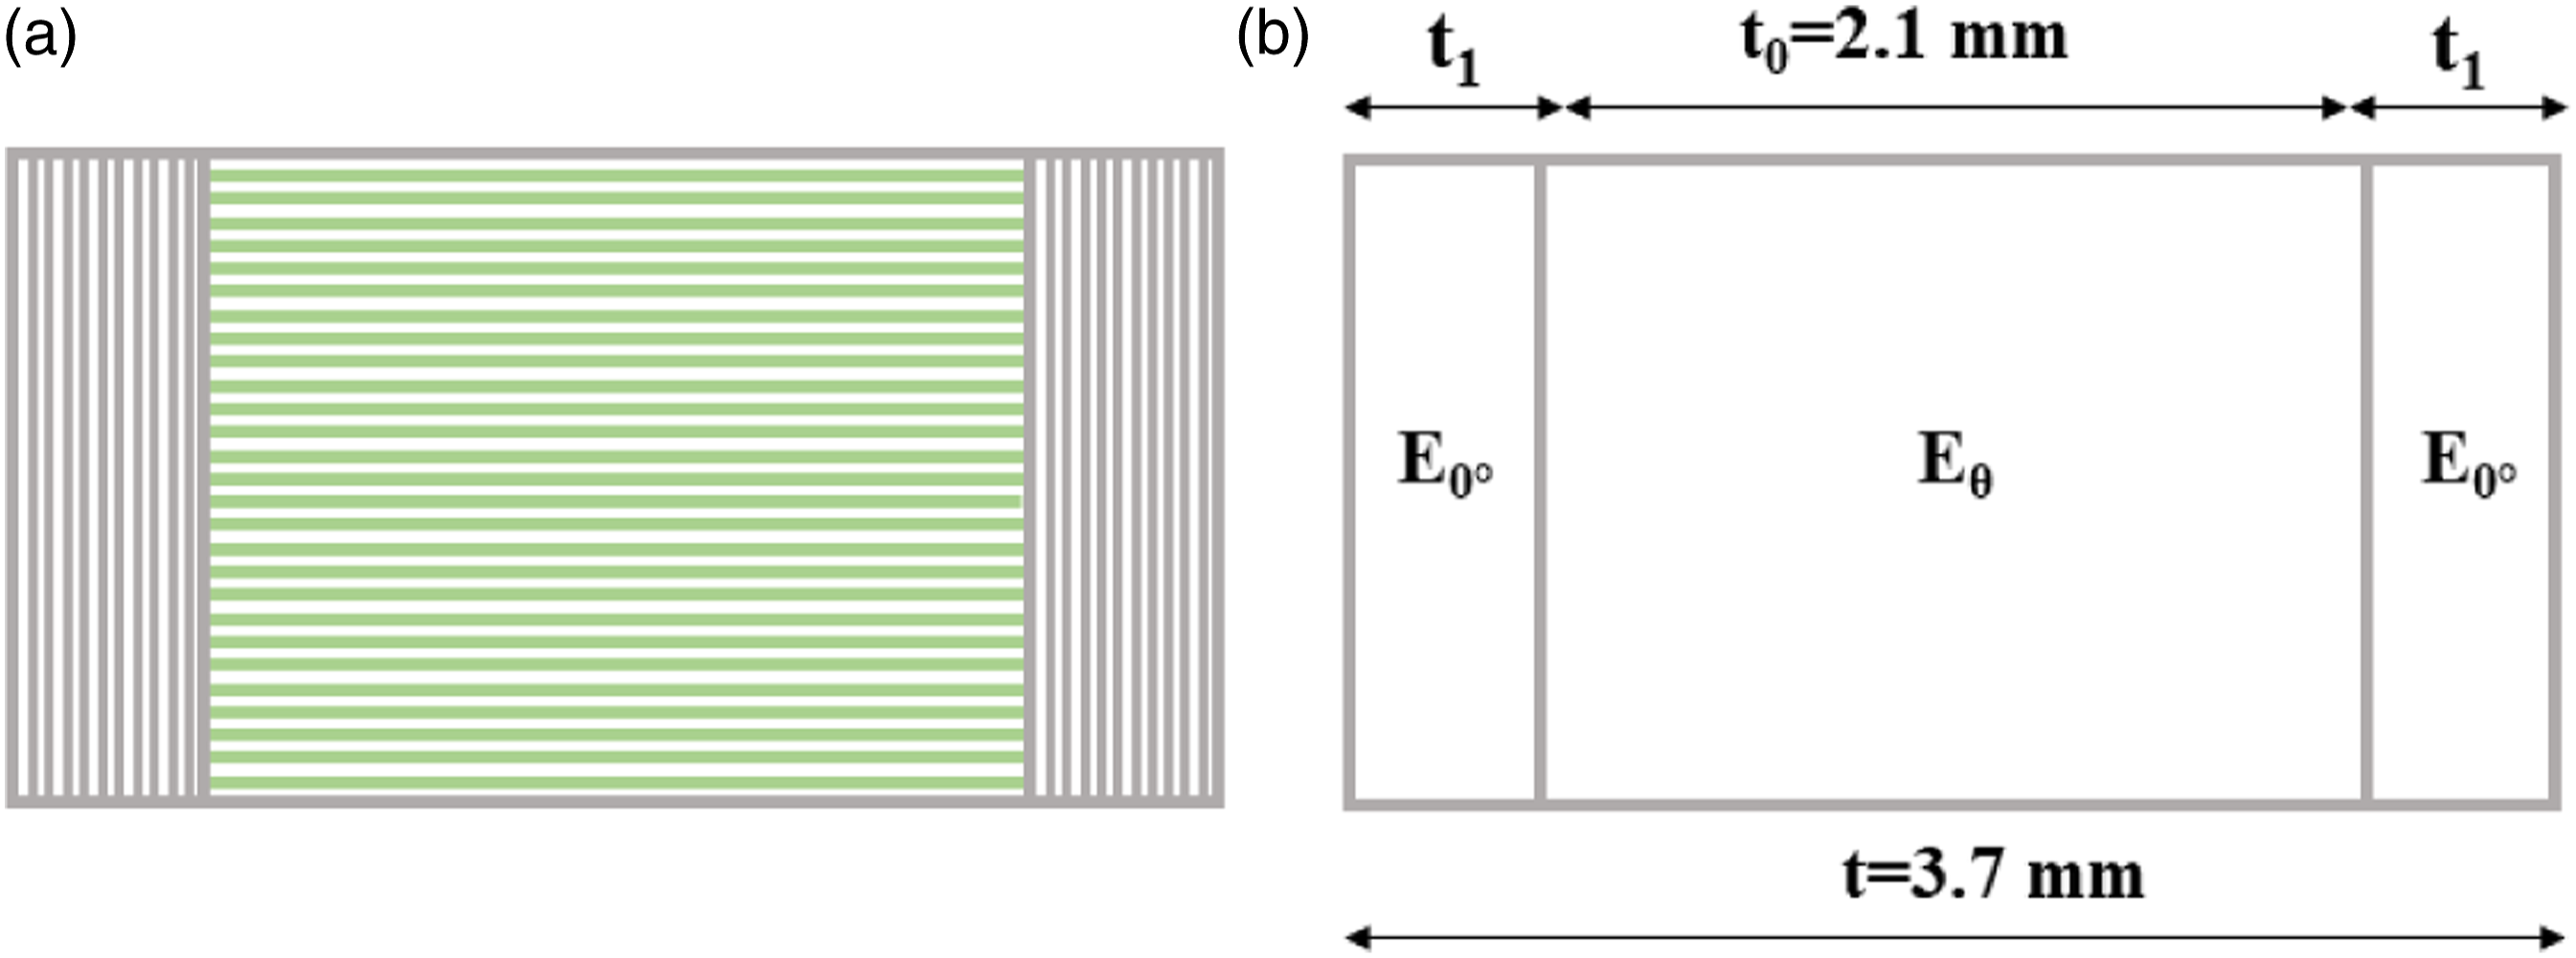
As mentioned above, to avoid voids, shells should always be designed to be a multiple of nozzle diameter. Here, one wall having 0.4 mm thickness is provided for all samples. The total thickness of the sample in the gauge area is 3.7 mm, in which shell thickness accounts for 0.8 mm (i.e., 0.4 mm on each side of the samples), and the remaining thickness corresponds to infill is 2.1 mm. By incorporating the shell thickness, the following equation will be used for predicting the effective modulus
Numerical results
Predicted properties of printed part with filament properties as input
Modulus values of PA and PLA using DBC.
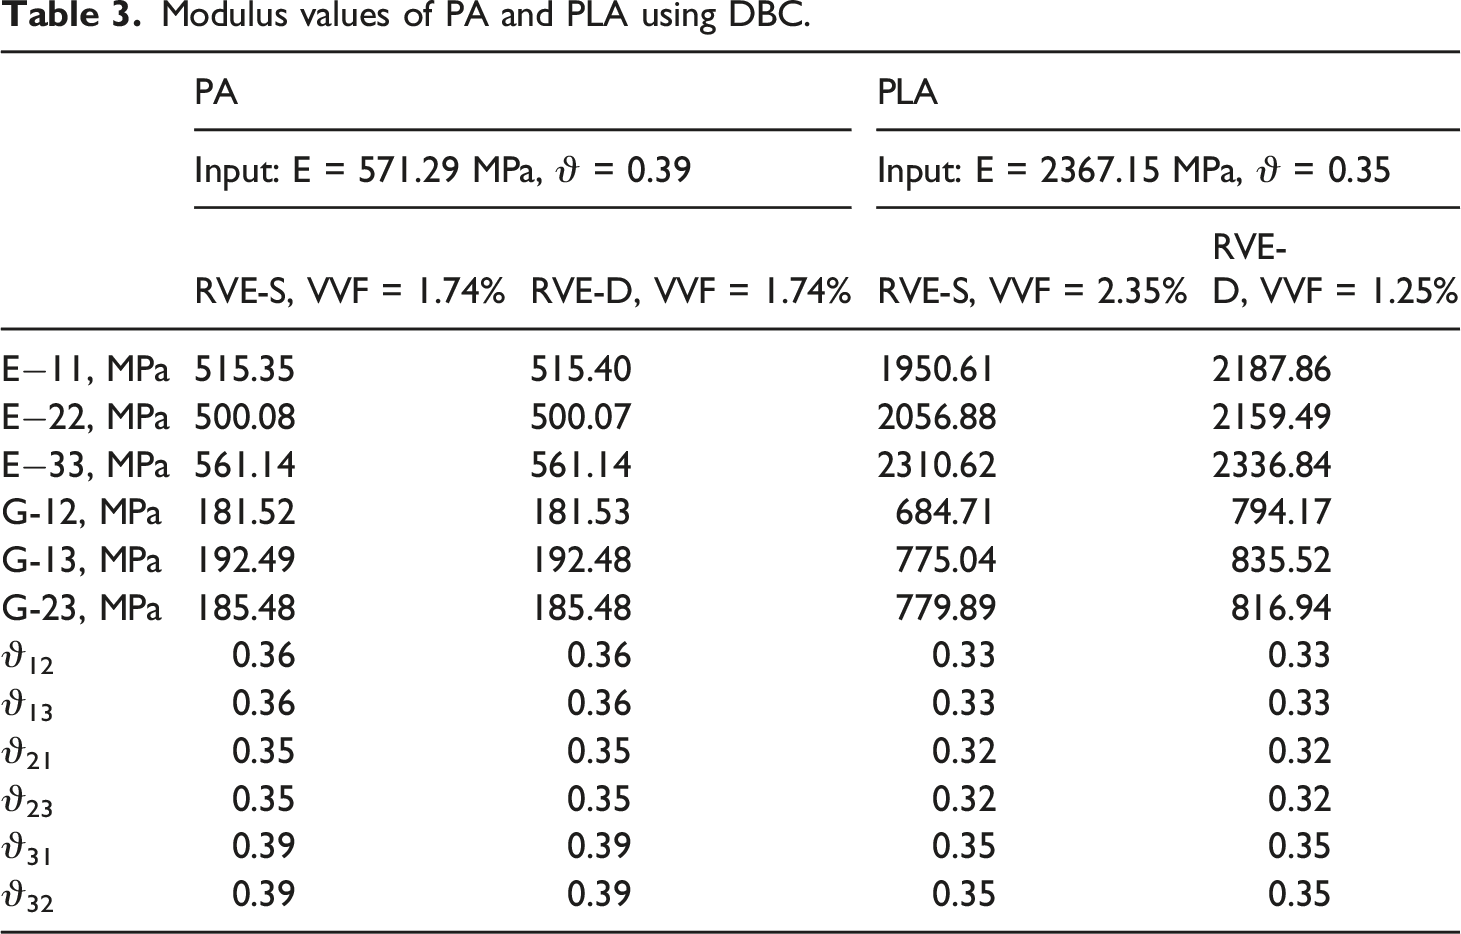
Since the VVF is alike for both the RVEs of PA, their modulus values are almost equivalent. However, for PLA, lower VVF leads to higher stiffness. Initially, for both RVEs of each material, the properties of filaments (Section 3.2) were utilized as input to the finite element (FE) model. The predicted elastic properties for both materials using RVE-S and RVE-D are tabulated in Table 3.
Expectedly, the modulus values are lower than that of the filament in all 3-directions due to the existence of voids between the beads. Also, as expected, Young’s modulus along the direction of the beads (i.e., E−33) Young’s modulus was the highest. The E−11 and E−22 responses depended on the contact area between the beads. The existence of voids minimizes the area of load transfer. Considering that the stress is concentrated on the smaller region, the effective average stress is smaller than that in bead directional straining. Similarly, the shear modulus values in the 1-3 plane are highest for all the RVEs of both PA and PLA material, followed by the 2-3 plane and 1-2 plane.
Figure 7 shows the deformed contour of the PA models for various boundary conditions. From the numerical results of the finite element (FE) models with 0° part, it is evident that the critical stress value is developed at the junction of the neighboring bead. This phenomenon is caused by the fact that the shape of the deposited beads deforms quickly (because of the less availability of material) at the intersection of adjacent beads, contributing to stress concentration, which will probably lead to the development of microcracks during loading, and eventually causes debonding/delamination failure. Deformation of RVE subjected to 6 different uniaxial boundary conditions, both deformed and undeformed RVE, are shown.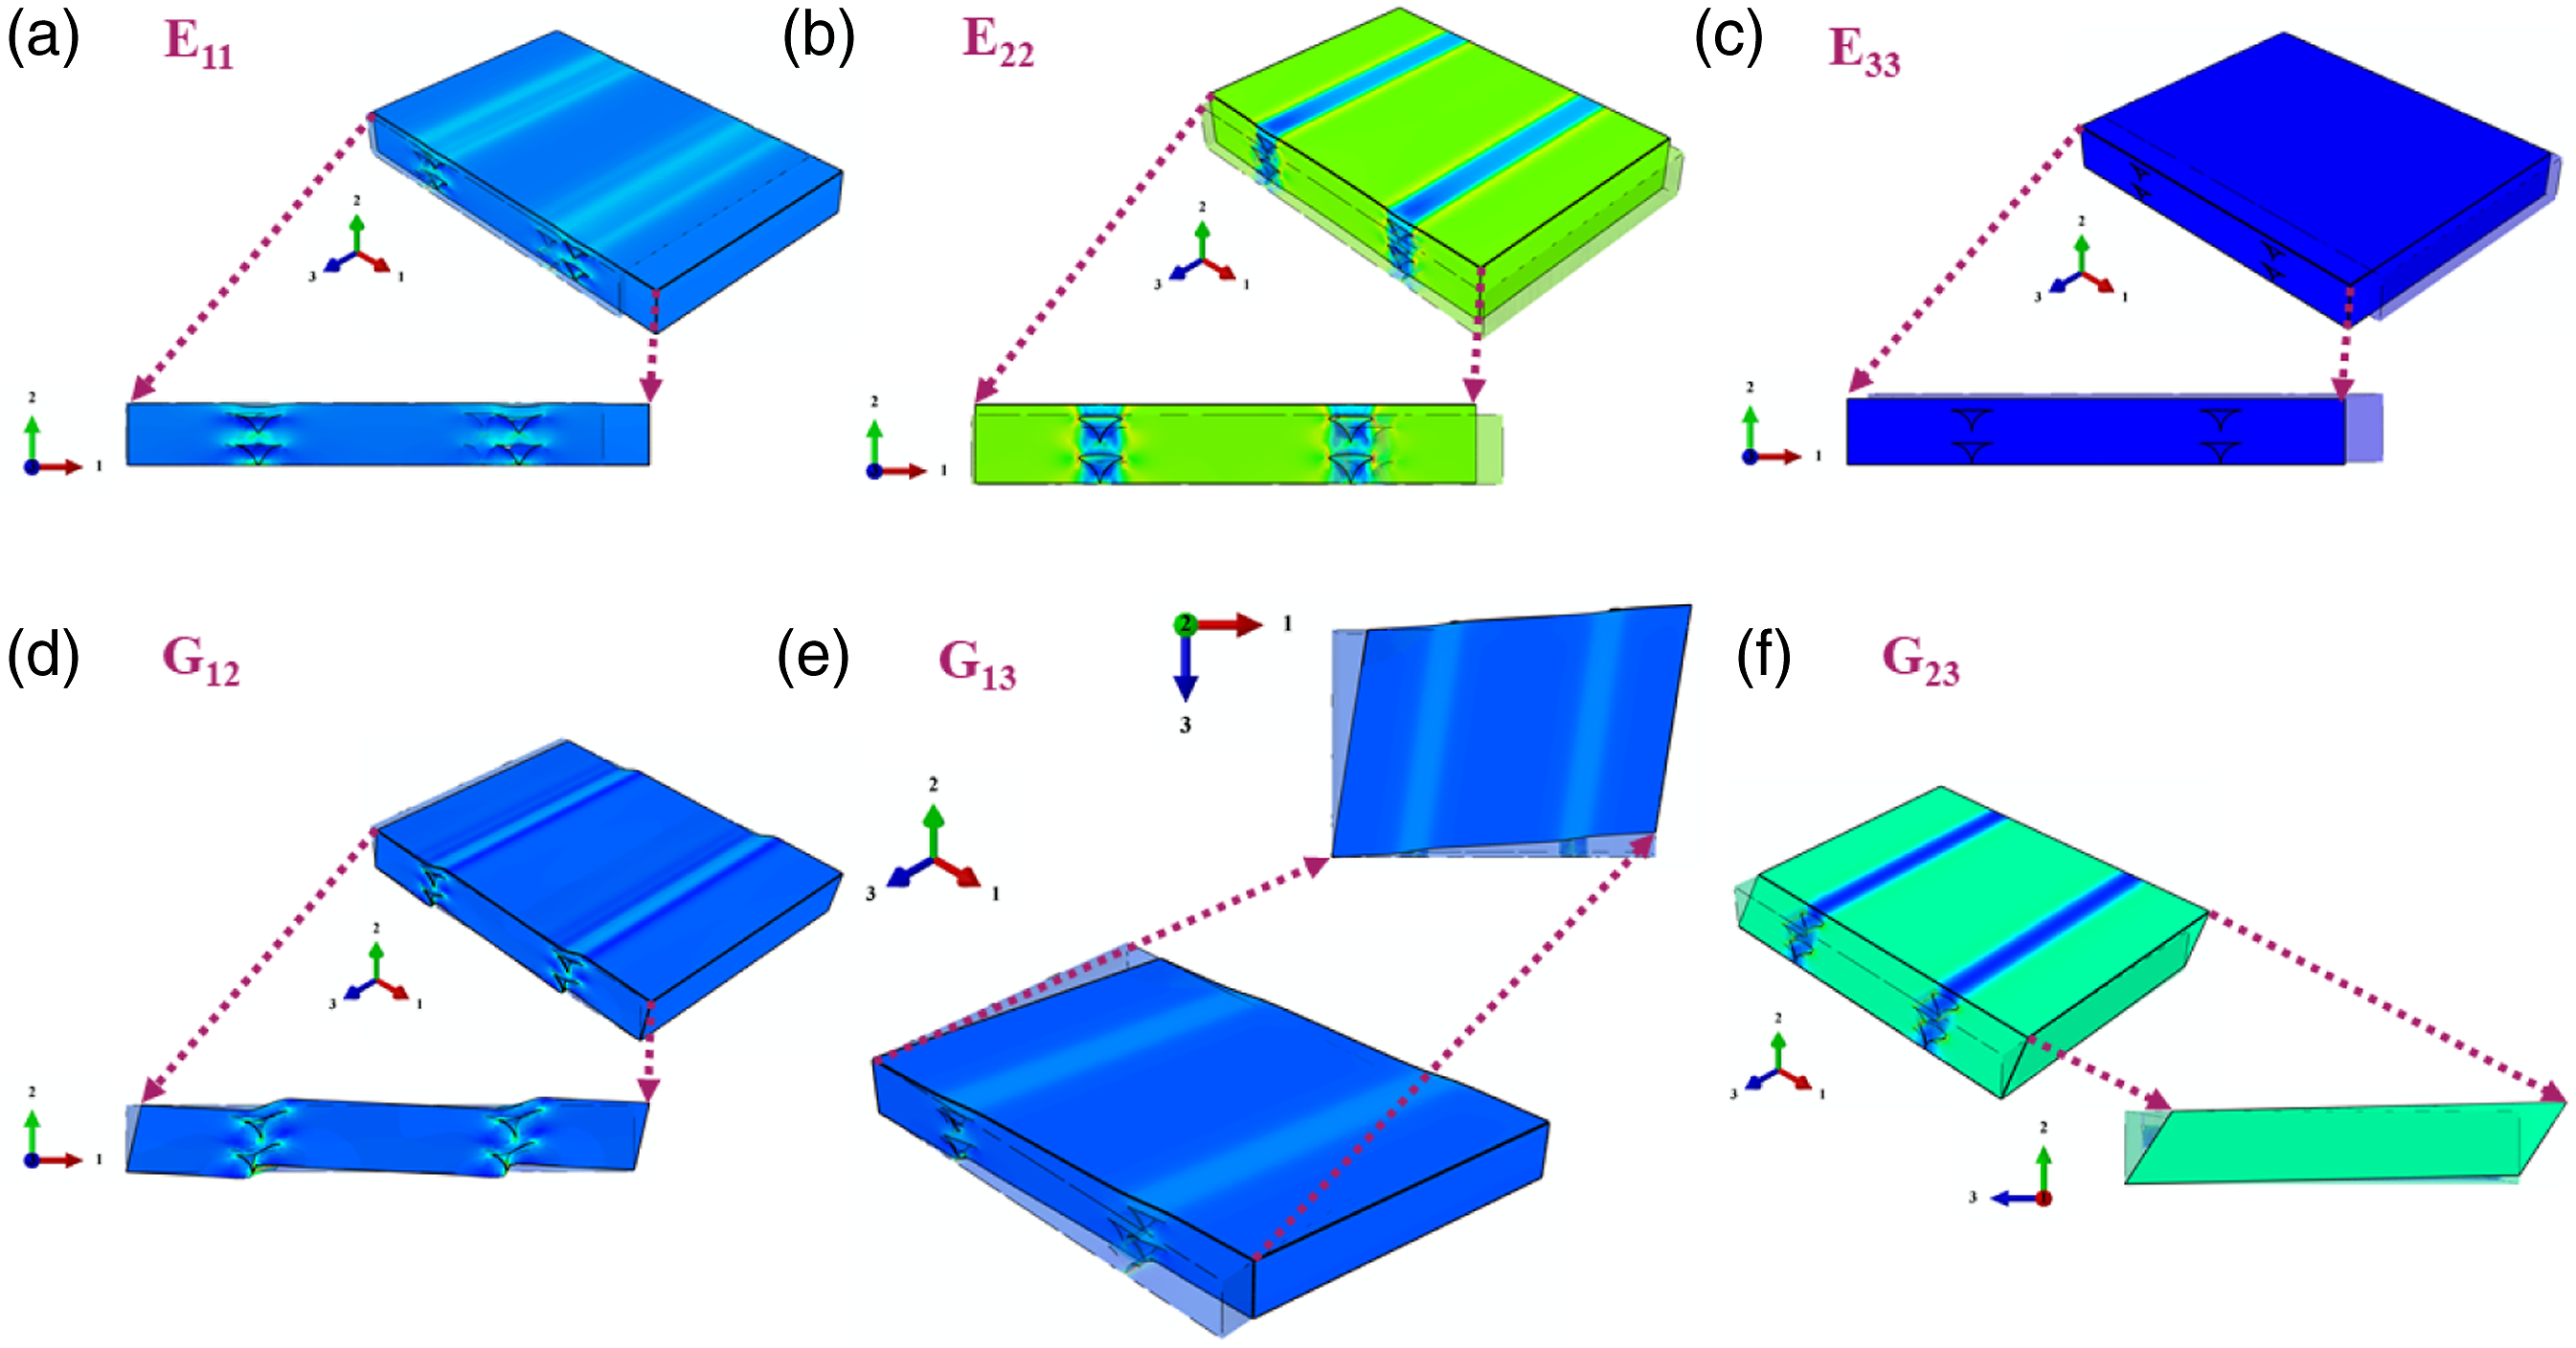
Comparison of experimental and predicted modulus of PA and PLA
The comparison of the experimental and numerical Young’s modulus is shown in Figure 8. Since the values of RVE-S and RVE-D for PA are approximately equal, therefore only RVE-S values have been plotted. Alternatively, PLA values of both RVEs (i.e., RVE-S and RVE-D) are shown. It is seen that the predicted modulus overestimates the experimental modulus values for both PA and PLA. In the case of PA samples, the percentage error between the predicted and experimental modulus values for 0°, 30°/150°, 45°/135°, 60°/120°, and 90° is 47.74%, 47.48%, 47.03%, 47.01%, and 47.67%. i.e., approximately a 50% drop in modulus values was reported if we used the filament modulus of PA as input to FE models. Similarly, for PLA, the error between the predicted and experimental modulus values for 0°, 30°/150°, 45°/135°, 60°/120°, and 90° in case of RVE-S and RVE-D is 23.02%, 22.25%, 24.29%, 22.89%, and 31.89% and 23.89%, 24.82%, 27.96%, 27.41%, and 36.31%, respectively. Experimental and predicted modulus values for PA (left) and PLA (right).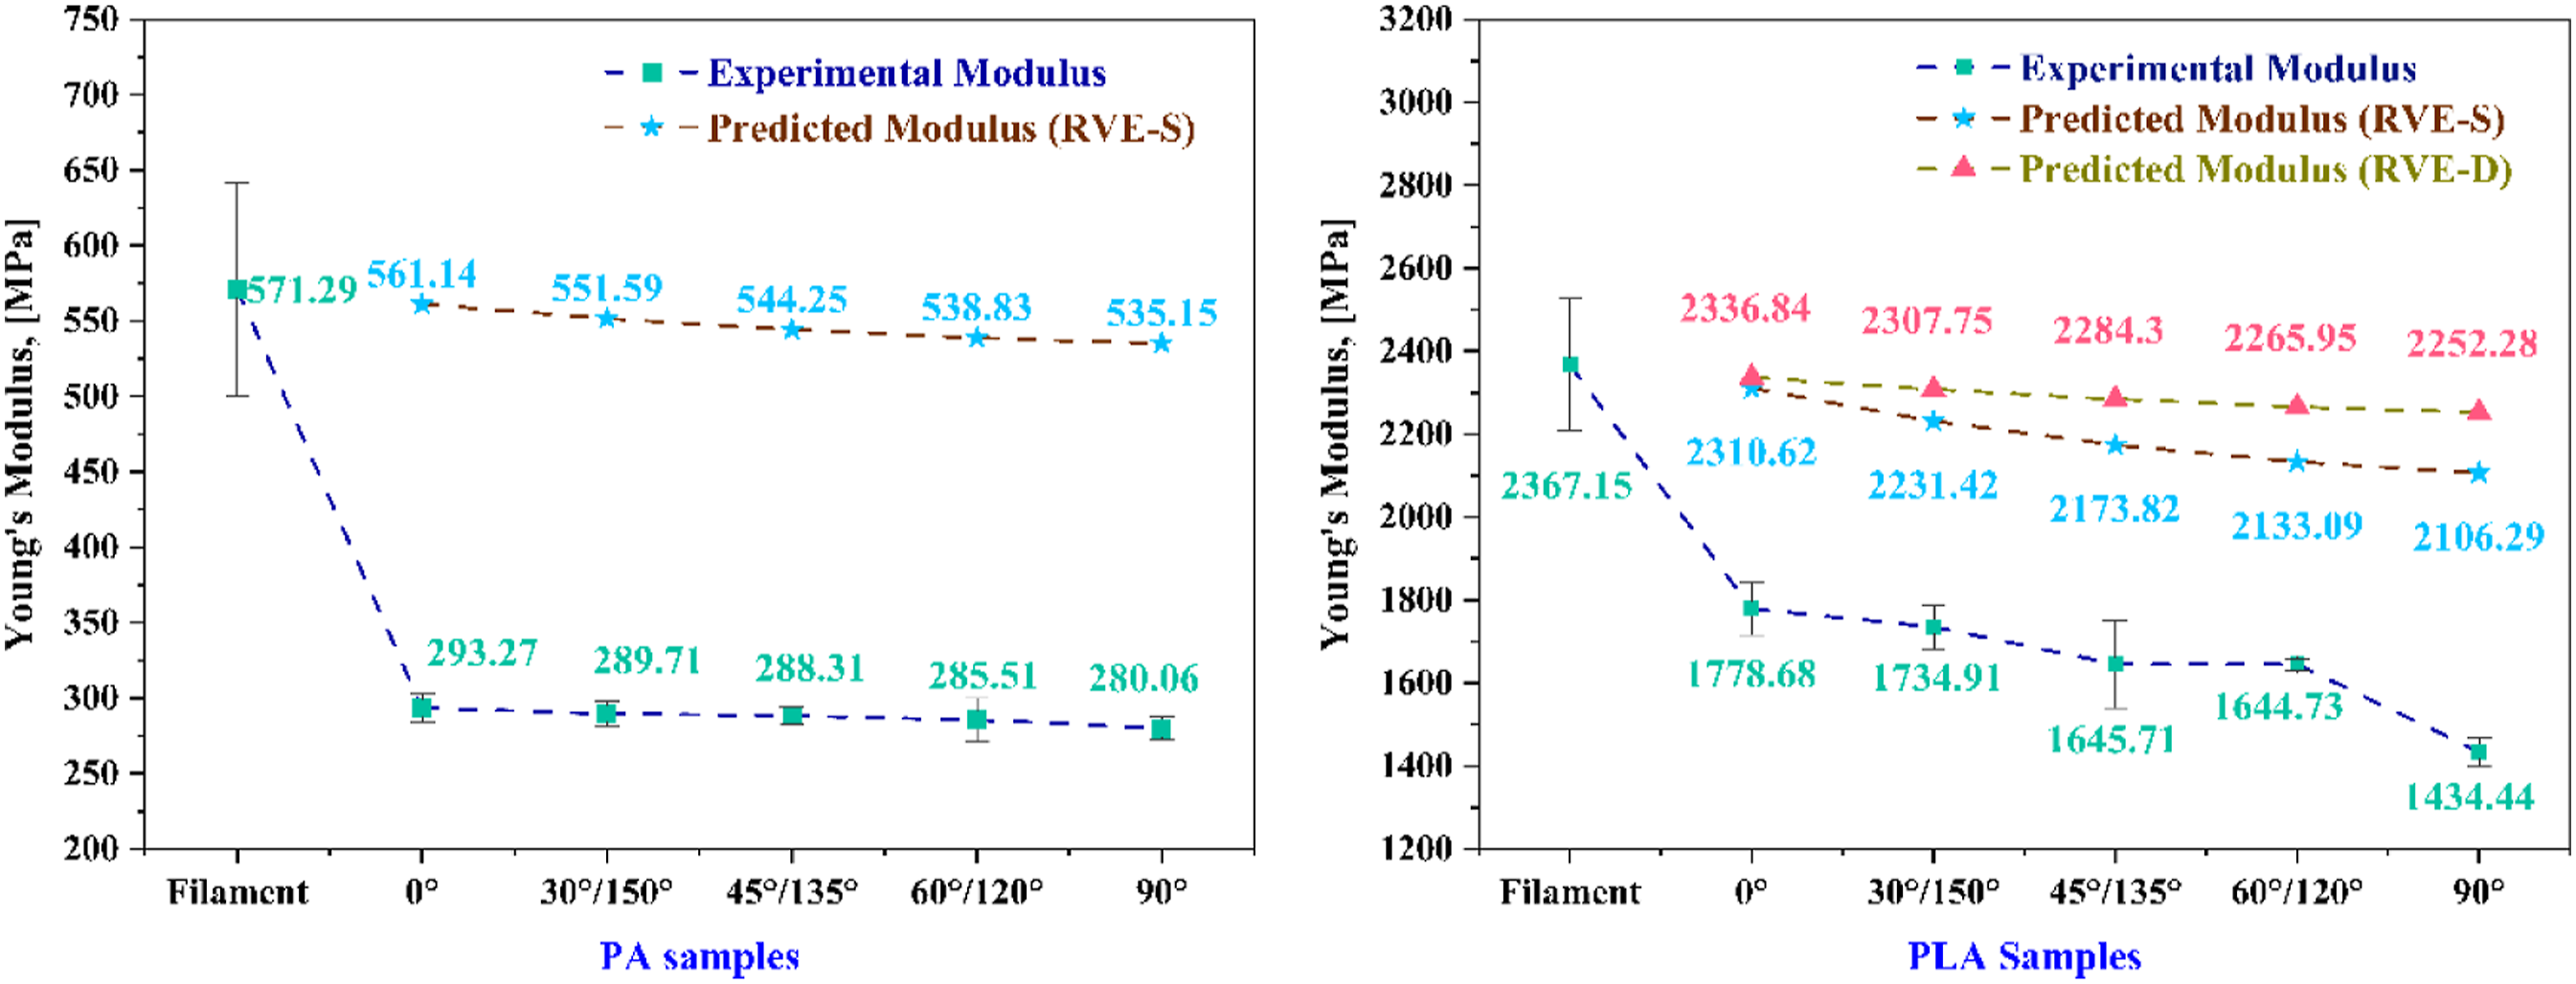
It is worth noting that the over-estimation of the properties is despite accounting for the voids generated during the FDM process and carefully accounting for the meso-structure developed during the printing. Therefore, it can be established that there is a definite material degradation for both PLA and PA. The degree of degradation is dependent on the thermoplastic. Hence, filament properties cannot be assumed as input parameters. A degradation factor is introduced to incorporate this phenomenon, which is discussed in the next section.
Estimation of degradation factor, DF in 0° (
)
A degradation factor is an empirical quantity used to describe the overall loss in modulus during the FDM process. As described earlier, there can be various reasons for this drop. It is not possible to accommodate all of these factors during the finite element (FE) modeling due to the inherent challenges. For example, it is not easy to model the molecular realignment and relate it to the stiffness of the bulk material. Similarly, the imperfect bonding between the different beads is hard to quantify and include in the FE models. A pragmatic solution is proposed wherein accurate FE models are built, and the bulk properties of the bead back are calculated through the hit-and-trial approach (see Figure 9). The input properties of the FE model are varied, and the effective properties are estimated. This is done multiple times until the experimental properties of the 0° are correctly calculated. By using this method, for PA, if we use 298.57 MPa, and for RVE-S and RVE-D of PLA, if we use 1822.23 MPa and 1800.74 MPa, respectively, we can get the FE predictions very similar to the experimental results for the 0° coupon. This indicates that the effective property of the bulk material for PA dropped from 571.29 to 298.57 MPa, while that of PLA dropped from 2367.15 to 1822.23 MPa and 1800.74 MPa, for RVE-S and RVE-D, respectively. Predicted modulus of printed parts as a function of the input properties. RVE generated by SEM was used for identifying the inputs for FE models of PA (left) and PLA (right).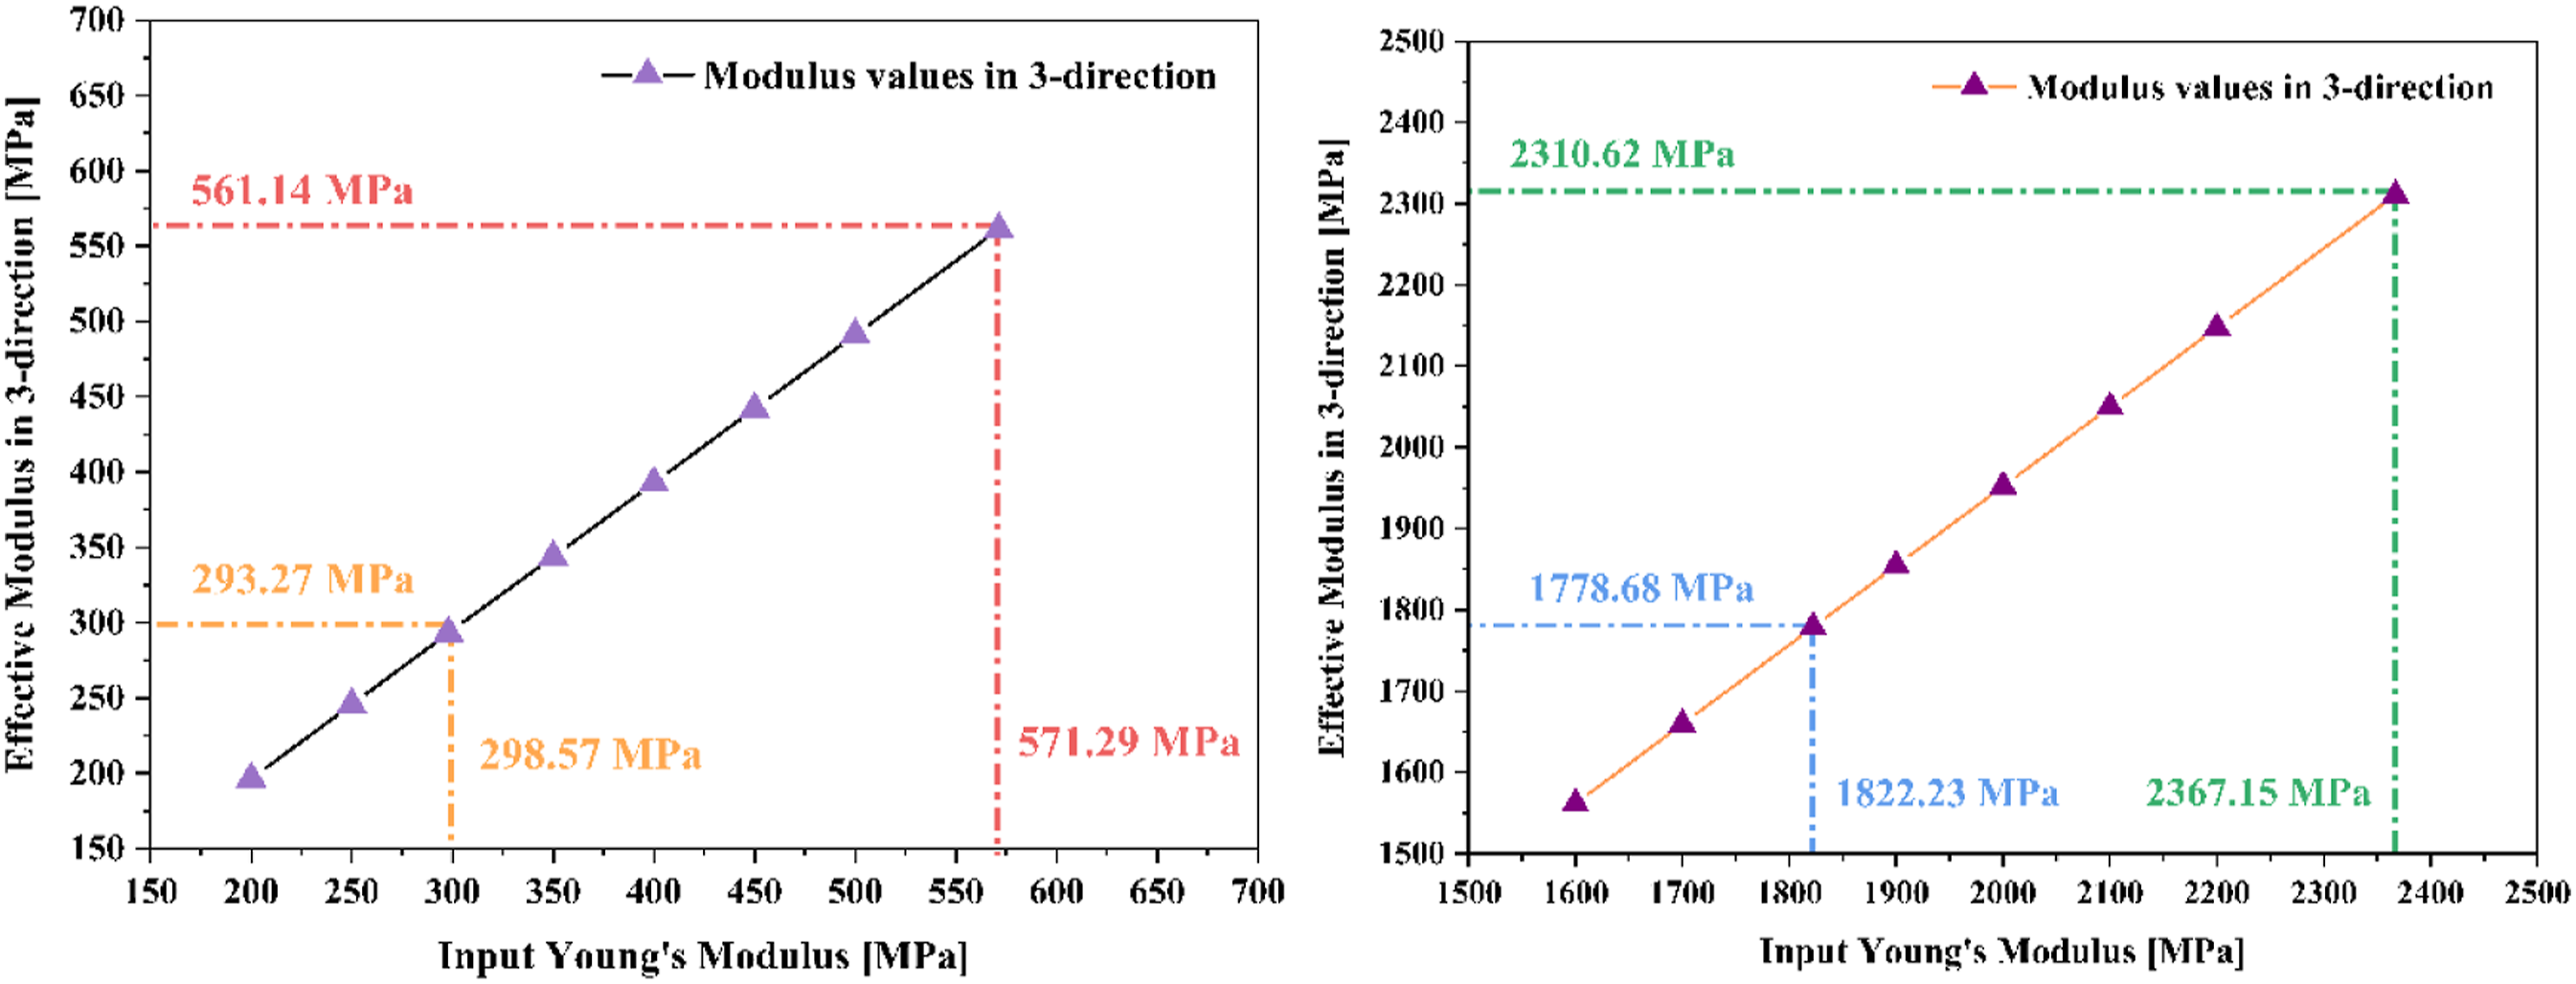
Defining the degradation factor as the loss in modulus during the printing process, one can estimate the values as shown below.
For PA from SEM
For PLA from SEM
For PLA from density
For further analysis, 298.55 MPa, 1822.23 MPa (RVE-S), and 1801.74 MPa (RVE-D) were used as an input parameter for the RVE models of PA and PLA, respectively.
A simplistic assumption made here is that the material degradation is uniform in all directions. This is likely not the case, but modeling degradation in different directions would require the transverse modulus of the filament, which is not easy to measure experimentally.
Comparison of experimental and predicted modulus of PA and PLA using (
)
The modulus of PA and PLA printed parts predicted by the proposed modeling technique were verified by experimental tensile modulus (Figure 10). It can be observed that the predicted moduli obtained correlate extremely well with the experimental values. Comparison of modulus values using DF for PA and PLA.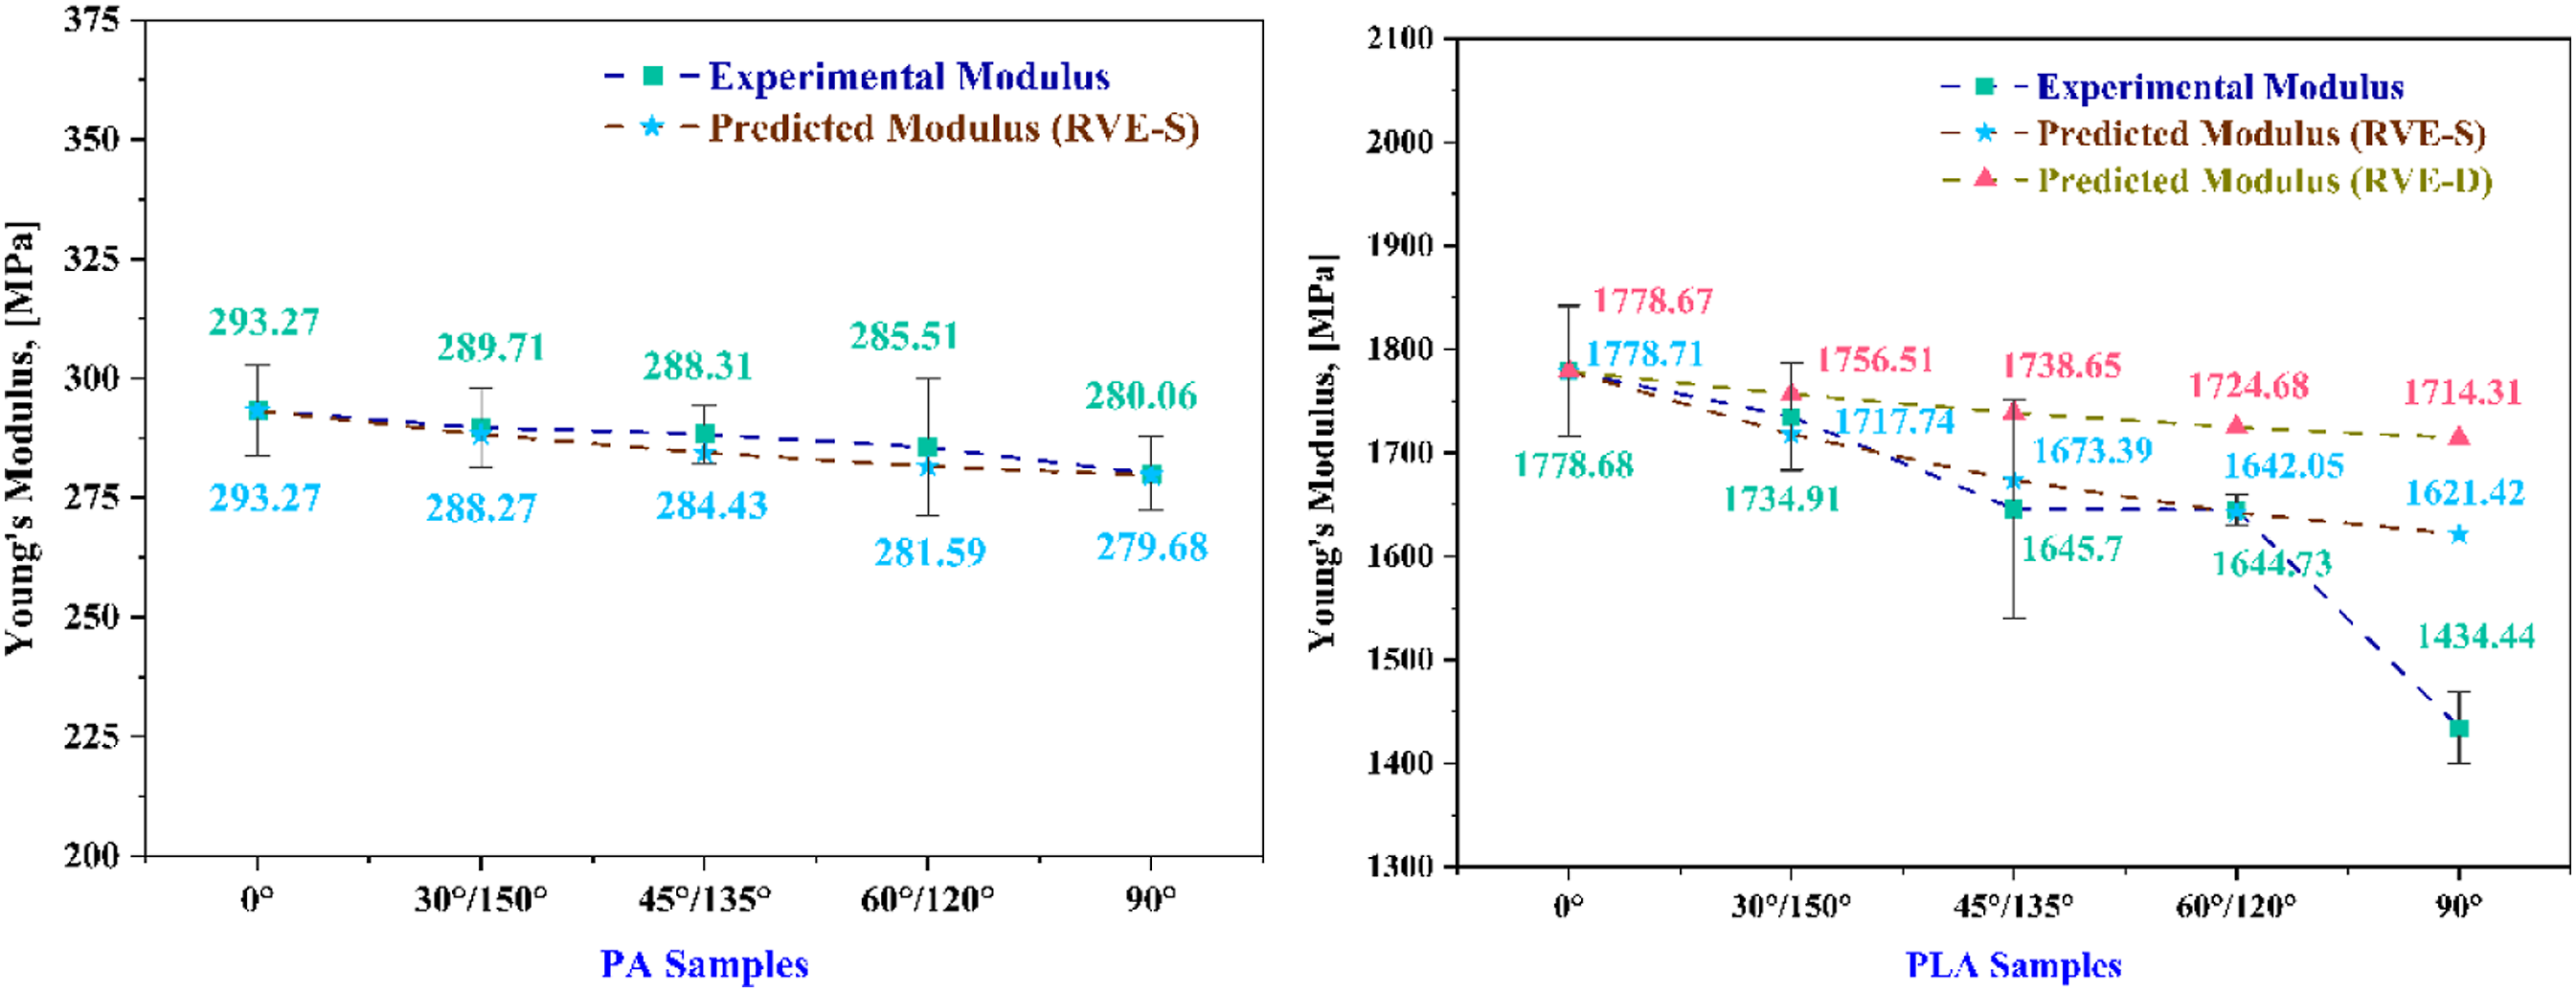
For PA, the error between the predicted and experimental modulus for all five raster orientations is less than 4%. For PLA samples, the same error is less than 2% and 5% for RVE-S and RVE-D, respectively. Except for the 90° PLA part, the error is slightly higher for both RVEs of PLA. Two primary reasons for the higher error in predicting the 90° PLA specimen can be: (a) the experimental modulus of the 90° raster-oriented PLA sample is notably lower due to common uncertainties in FDM printed part testing, often showing significant scatter and outliers 5 and (b) another factor could be the direction-dependent nature of the assumed degradation parameter, as the analysis assumes an isotropic and raster orientation-dependent degradation parameter. Verifying this is complex due to the difficulty of determining the transverse modulus of the filament.
Also, it is worth mentioning at this point that the percentage error between the predicted and experimental 90° PLA modulus is 31.89% without considering the degradation parameter and 11.53% with its inclusion, highlighting its modeling advantage.
The proposed methodology combines both material-specific and process-specific elements. For the chosen materials and process parameters, PLA has a degradation parameter of 0.24, and PA has a parameter of 0.48. These values may change with alterations in materials or process parameters. For example, decreasing print speed for PLA while keeping other parameters constant is expected to improve printed part properties, with filament properties unchanged. 41 This change in the degradation parameter would require repeating FE calculations.
Apart from its predictive capability, the degradation parameter concept can quantify the suitability of specific process parameters for a particular thermoplastic. While some degradation during printing is inevitable, a higher degradation parameter value indicates room for improvement in the process parameters.
Moreover, from the accurate estimation of the properties, the degradation parameter also gives an indication of the robustness of the FDM process for a specific material. For PLA and PA, the degradation parameters were 0.24 and 0.48, respectively. It indicates that the FDM process yields performance attributes about a quarter and a half less than what would have been ideal. It can be said the FDM process is more suited for PLA as it leads to lesser degradation. Future work for engineers and developers of the FDM process could be altering the FDM process to lower the degradation parameters.
Conclusion
A model for process-microstructure-performance modeling of unidirectional FDM printed polymers is presented in this work. The tensile behavior of filaments and dogbone samples of PA and PLA were studied. In addition, the impact of five raster configurations on Young’s modulus of printed samples was evaluated. The isotropic PA and PLA filaments were used for printing the FDM parts, but the final properties of the printed parts differed from the filament material. The tensile test results of filament and printed samples show a 48.67% and 24.86% drop for Young’s modulus from the filament to 0° part for PA and PLA, respectively.
Two methodologies were proposed to generate the RVEs. In the first case, RVE is based on periodic arrays of voids identified from the SEM images. In the second case, RVE accounts for the same void volume fraction obtained from the decline in density from filament to printed sample level. Numerical analysis of mesoscale RVE based on the fractured morphology of 0° part was utilized to predict the effective properties in remaining raster-oriented samples.
Through careful finite element (FE) modeling, it is confirmed that this decrease in Young’s modulus cannot be attributed to the existence of voids alone. Several other factors exist, like molecular realignment during the FDM process and imperfect bonding between the different layers. A novel degradation parameter is proposed to improve the FE models' predictions and quantify the FDM process's suitability for different thermoplastics. The main hypothesis in this paper is the existence of a degradation parameter which is incorporated to the modelling framework. It is suggested that the degradation parameter is orientation-independent. In other words, for a given identical set of process parameters and for a specific thermoplastic, the properties of different raster orientations can be predicted using filament properties and 0° coupon properties based on the calculated degradation parameter.
Similar to other attempts at developing predictive models,21,42 the methodology is demonstrated for the optimal process parameters (based on experience with the aim of producing the highest quality parts) for specific thermoplastic materials. This study demonstrates the model for a single set of process parameters for both materials. The main focus is neither on a characterization study nor on studying the dependence on process parameters. Instead, the objective is to introduce an innovative hybrid modeling approach that includes the degradation parameter. However, if one would like to use the model for different process parameters, it is possible. The FE calculations and the estimation of the degradation parameter will have to be repeated every time the process parameters are changed.
In the proposed model, after incorporating the effect of the degradation factor, the predicted modulus results showed a very good agreement with the experimental modulus, where the percentage discrepancy was not greater than 4% and 5% for PA and PLA, respectively. The inputs of the proposed model include tensile properties of the filament and 0° coupon and any one of the SEM images or density measurements.
Future directions of this work would include enhancing the proposed model’s accuracy using different materials and predicting the elastic properties of the FDM-printed reinforced thermoplastic material based on the void distribution from micro-CT findings, introducing material non-linearity into the models. Future research may also be aimed at developing direction-dependent degradation parameters through innovative testing procedures.
Footnotes
Acknowledgments
Indian Institute of Technology Kharagpur is thanked for funding this research via the Institute Scheme for Innovative Research and Development (ISIRD). Prof. Kumar Shanmugam from the University of Glasgow is thanked for his insightful comments and discussion.
Declaration of conflicting interests
The author(s) declared no potential conflicts of interest with respect to the research, authorship, and/or publication of this article.
Funding
The author(s) received no financial support for the research, authorship, and/or publication of this article.