
Abstract
This work gives an in-depth discussion on prediction and optimisation of the mechanical properties of FDM-printed polyethylene terephthalate glycol (PETG) parts by applying statistical and machine learning methods. Experimentally, the influence of the three important process variables on the surface roughness (SR) and ultimate tensile strength (UTS) was studied: the melting temperature, the height of the layer, and the infill density. The predictive capacity of the Artificial Neural Network (ANN), Random Forest Regression (RFR) and Response Surface Methodology (RSM) models were developed and compared. RFR model was found to be more accurate than other models with the following values of R2 = 0.94 (training) and R2 = 0.83 (testing) and mean absolute error (MAE) = 2.51 when predicting UTS. The mean error between the experimental and predicted values was lower than 5% accounting for the robustness of the developed model. The process parameters were optimised with multi objective Genetic Algorithm (GA) and produced an optimum UTS of 38.39 MPa and a minimum surface roughness of 5.65 um at 82.42% infill density, 0.26 mm layer height, and 230.26 C melting temperature. The findings are also validated by carrying out microstructural study using SEM image. These findings show how the mechanical performance and surface quality of PETG components that are FDM-printed can be enhanced by combining machine learning and evolutionary optimisation.
Introduction
Polyethylene Terephthalate Glycol (PETG), launched in the late 1960s, is a high-performance engineering thermoplastic that has been recognized for its high strength, chemical resistance, transparency, and ease of printing. 1 In Fused Deposition Modeling (FDM), mechanical and surface properties such as roughness and hydrophobicity are highly sensitive to process parameters such as layer height, temperature, printing speed, acceleration, and flow rate. 2 Because of its well-rounded mechanical properties and printability, PETG has been widely applied in the aerospace, automotive, and medical industries. Although there have been studies on the effects of printing parameters at room temperature, there is little research on the properties of PETG at cryogenic and ultra-low temperatures. Thus, this research aims to explore the strength and ductility of FDM-printed PETG at chilled and deep-freeze temperatures. 3
Fused Deposition Modelling (FDM) has attracted considerable attention in additive manufacturing due to its capability to produce complex PETG components with minimal material waste and dependable printability. 4 Although earlier research has examined the effects of parameters such as infill density, layer thickness, and build orientation on mechanical properties, studies specifically addressing compressive behaviour, infill pattern optimisation, and specimen geometry remain comparatively limited.5,6,7 Recent investigations have explored anisotropic behaviour, interfacial bonding, and porosity using experimental approaches and computational techniques such as FEM and homogenisation to enhance structural response prediction. 8 Furthermore, advances in slicing strategies and metamaterial design underscore the importance of internal architecture in controlling mechanical performance, although detailed PETG-focused studies in this context are still scarce. 9 Compared with widely studied materials like PLA and ABS, PETG research continues to evolve, particularly regarding the combined effects of processing parameters, post-processing treatments, and material functionality. 10 Optimisation techniques such as Taguchi design and grey relational analysis have been broadly applied to enhance tensile, flexural, and hardness characteristics, alongside growing interest in sustainable natural-fibre-reinforced composites within additive manufacturing. 11
PETG is a biocompatible thermoplastic with applications in the biomedical field, especially when reinforced with natural fibres like silk, which improve the compressive strength, elastic modulus, printability, and surface finish, making way for better fibre-reinforced PETG printing techniques.12,13,14 Nonetheless, FDM-printed components usually exhibit poor interlayer bonding, leading to research on thermal annealing to enhance tensile and flexural properties, particularly when reinforced with carbon or Kevlar, although dimensional stability remains a concern. 15 As fused filament fabrication continues to expand, recycling has become an important area of interest; while PLA recycling has been widely investigated, PETG recycling remains relatively unexplored, highlighting the need to examine its printability, mechanical performance, and dimensional stability after recycling cycles. 16 Most of the research on FDM-printed PETG has been conducted on parameters such as layer thickness, orientation, and infill pattern, mainly examining their effects on surface finish and static mechanical properties. However, limited attention has been given to the influence of deformation or strain rate on tensile behaviour, even though PETG is widely used in dynamic applications such as protective and medical components. To address this gap, recent studies have evaluated the tensile response of PETG at different test speeds and layer thicknesses. 17 Furthermore, while mechanical properties have been extensively studied, research on dimensional accuracy remains limited; consequently, investigations have focused on how printing speed and layer thickness influence hole dimensional precision in PETG parts. 18 Research shows that incorporating carbon fibres into PETG considerably improves the mechanical performance of FDM-printed components, although integrated experimental–numerical investigations of PETG/carbon fibre composites remain limited; recent studies address this gap by analysing cellular structures through combined experimental testing and simulation approaches. 19 Print speed has also been shown to influence microstructure development and mechanical degradation, highlighting the need for process optimization in PETG-based FFF manufacturing. 20 As PETG becomes more widely adopted due to its strength, recyclability, and ease of printing, studies have investigated how infill geometry, density, temperature, and layer thickness affect structural performance, supported by statistical modelling and SEM analysis. 21 Additionally, recent research emphasizes the impact of build orientation, raster angle, and infill characteristics on tensile behaviour, helping to address the limited availability of reliable mechanical data for PETG. 22
State of the art
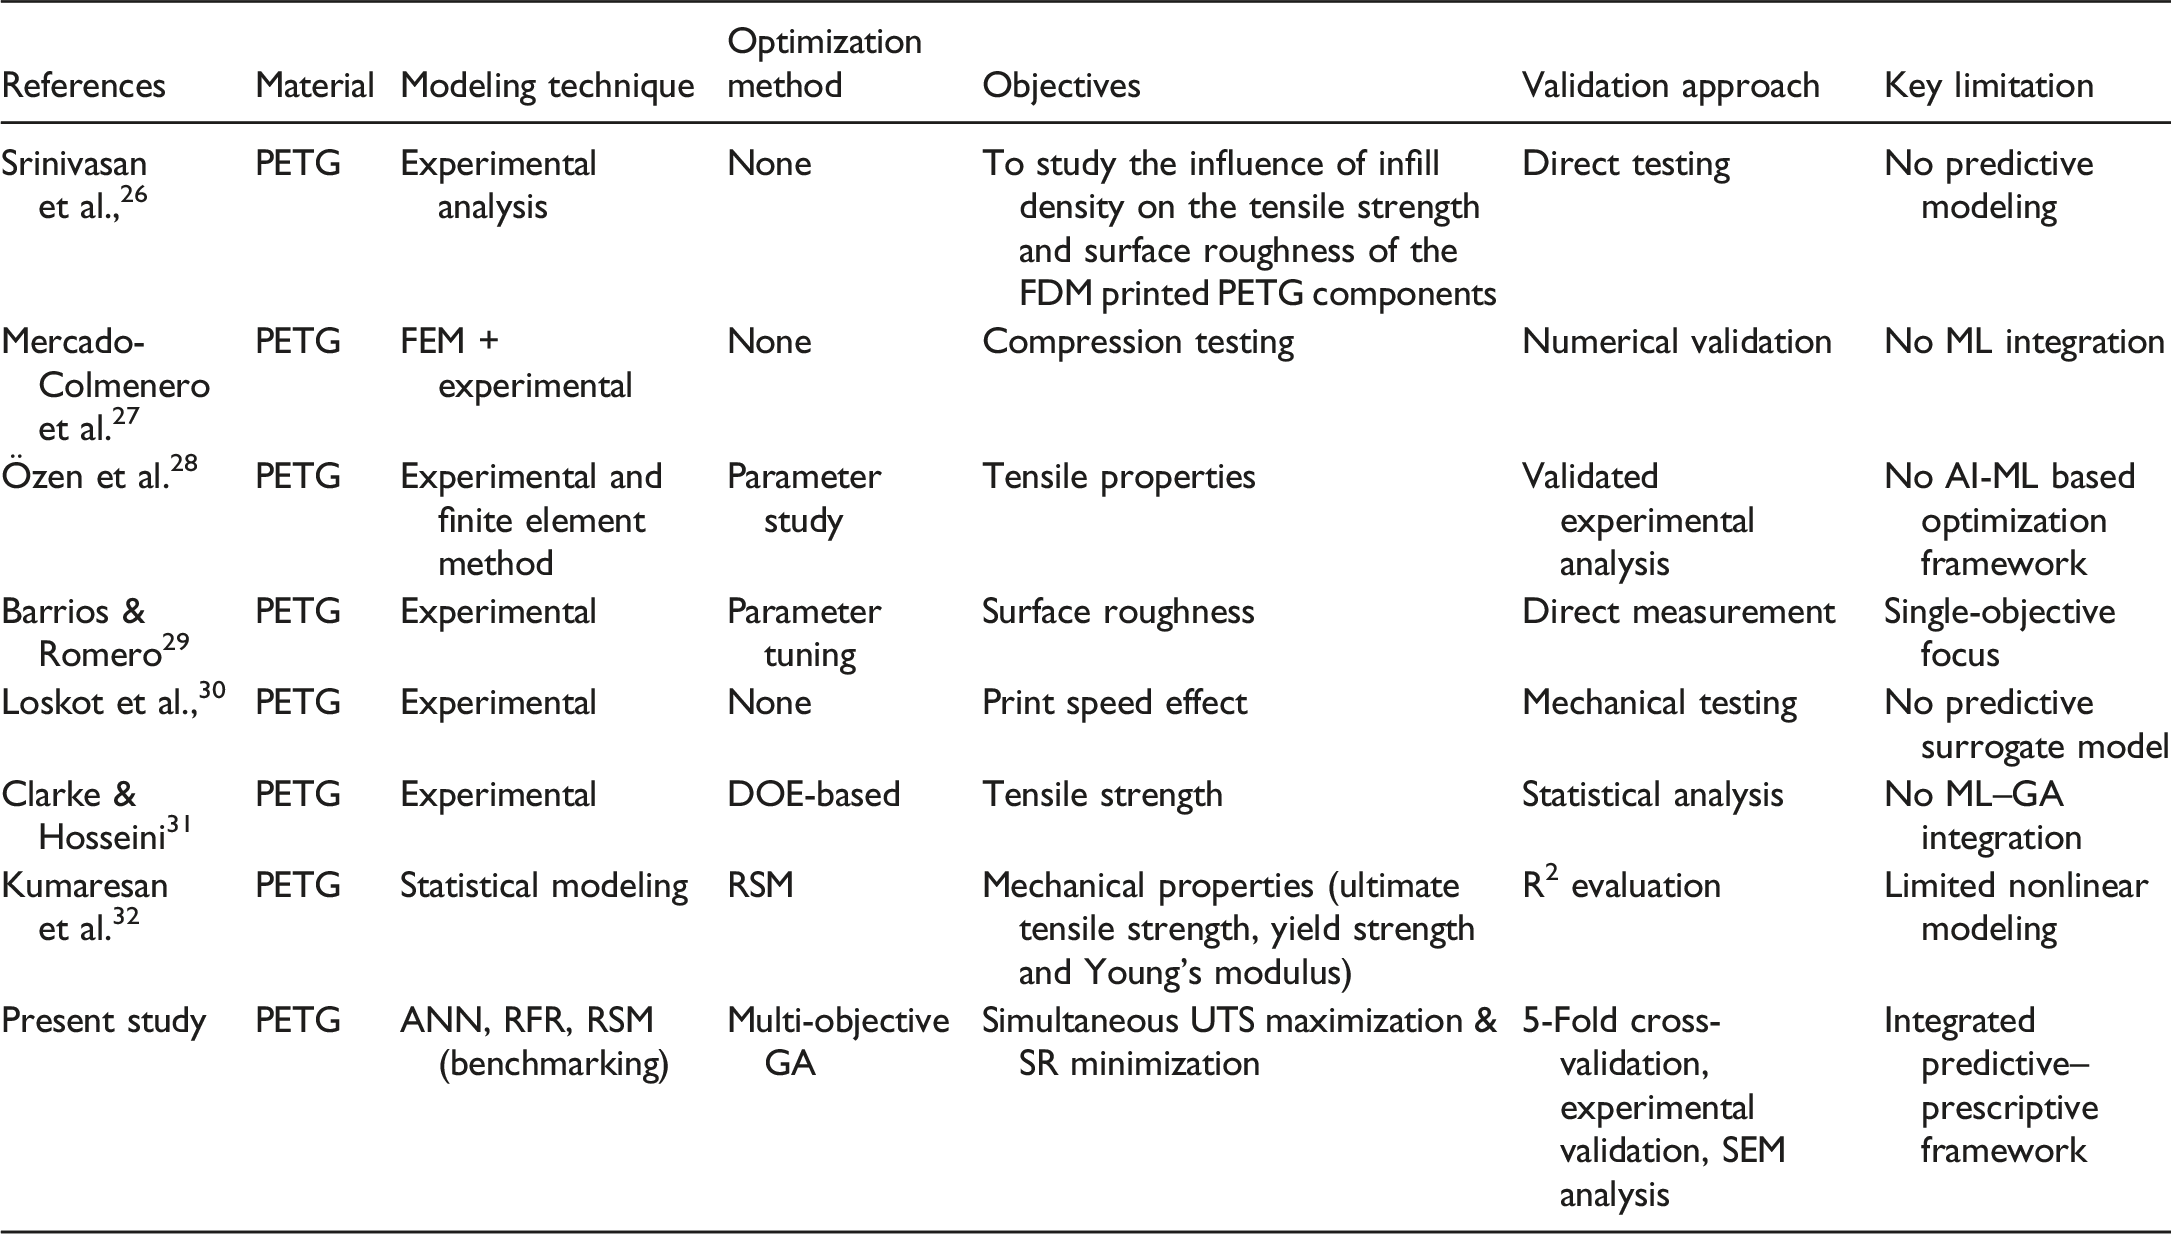
A considerable number of researchers analysed the mechanical behaviour of FDM manufactured PETG. Few of them examined the influence of infill density, layer height, build orientation and printing temperature effects on tensile and compressive properties. For instance, Srinivasan et al. (2020) 26 investigated the influence of infill density on PETG tensile strength and Mercado-Colmenero et al. Magic et al. (2020) 27 carried out experimental and numerical characterization under compressive loading. Similarly, Özen et al. (2021) investigated the microstructural effects of manufacturing parameters on PETG mechanical behavior. 28 Several other studies have targeted surface properties and dimensional precision. Where Barrios and Romero (2019) enhanced surface roughness with hydrophobicity of PETG parts. 29 More recent research has focused on the effects of printing speed and raster orientation on tensile behaviour. Additionally, statistical modelling techniques like Response Surface Methodology (RSM) and Taguchi methods have also been used to optimize FDM parameters. Although these methods reveal about the importance of parameters but fails to capture high-order nonlinear interactions fully. Recently, machine learning methods like Artificial Neural Networks (ANN), Random Forest Regression (RFR) and Support Vector Regression (SVR) have been proposed to predict mechanical properties of additively manufactured polymers. Most of these studies are limited to single model forecasting, single target optimization or do not deal with PETG materials. Furthermore, very few studies incorporate surrogate ML models in the context of multi-objective evolutionary optimization.
Contributions of the present study
The present research overcomes the addressed research gaps by proposing a comprehensive data-driven framework (represented in Figure 1) for FDM-printed PETG components. The major contributions include. 1. Development and benchmarking of three predictive models (ANN, RFR, and RSM) using a controlled Taguchi L27 experimental dataset. 2. Implementation of five-fold cross-validation to enhance model robustness and reduce the risk of overfitting. 3. Integration of the best-performing surrogate model (RFR) with a multi-objective Genetic Algorithm (GA) for simultaneous optimization of Ultimate Tensile Strength (UTS) and Surface Roughness (Ra). 4. Experimental validation of optimized parameter combinations. 5. Microstructural analysis (SEM) to correlate process optimization with polymer welding and interlayer bonding mechanisms. Conceptual roadmap for Integrated ML–GA Framework for Multi-Objective Optimization of FDM-Printed PETG used in the present study.
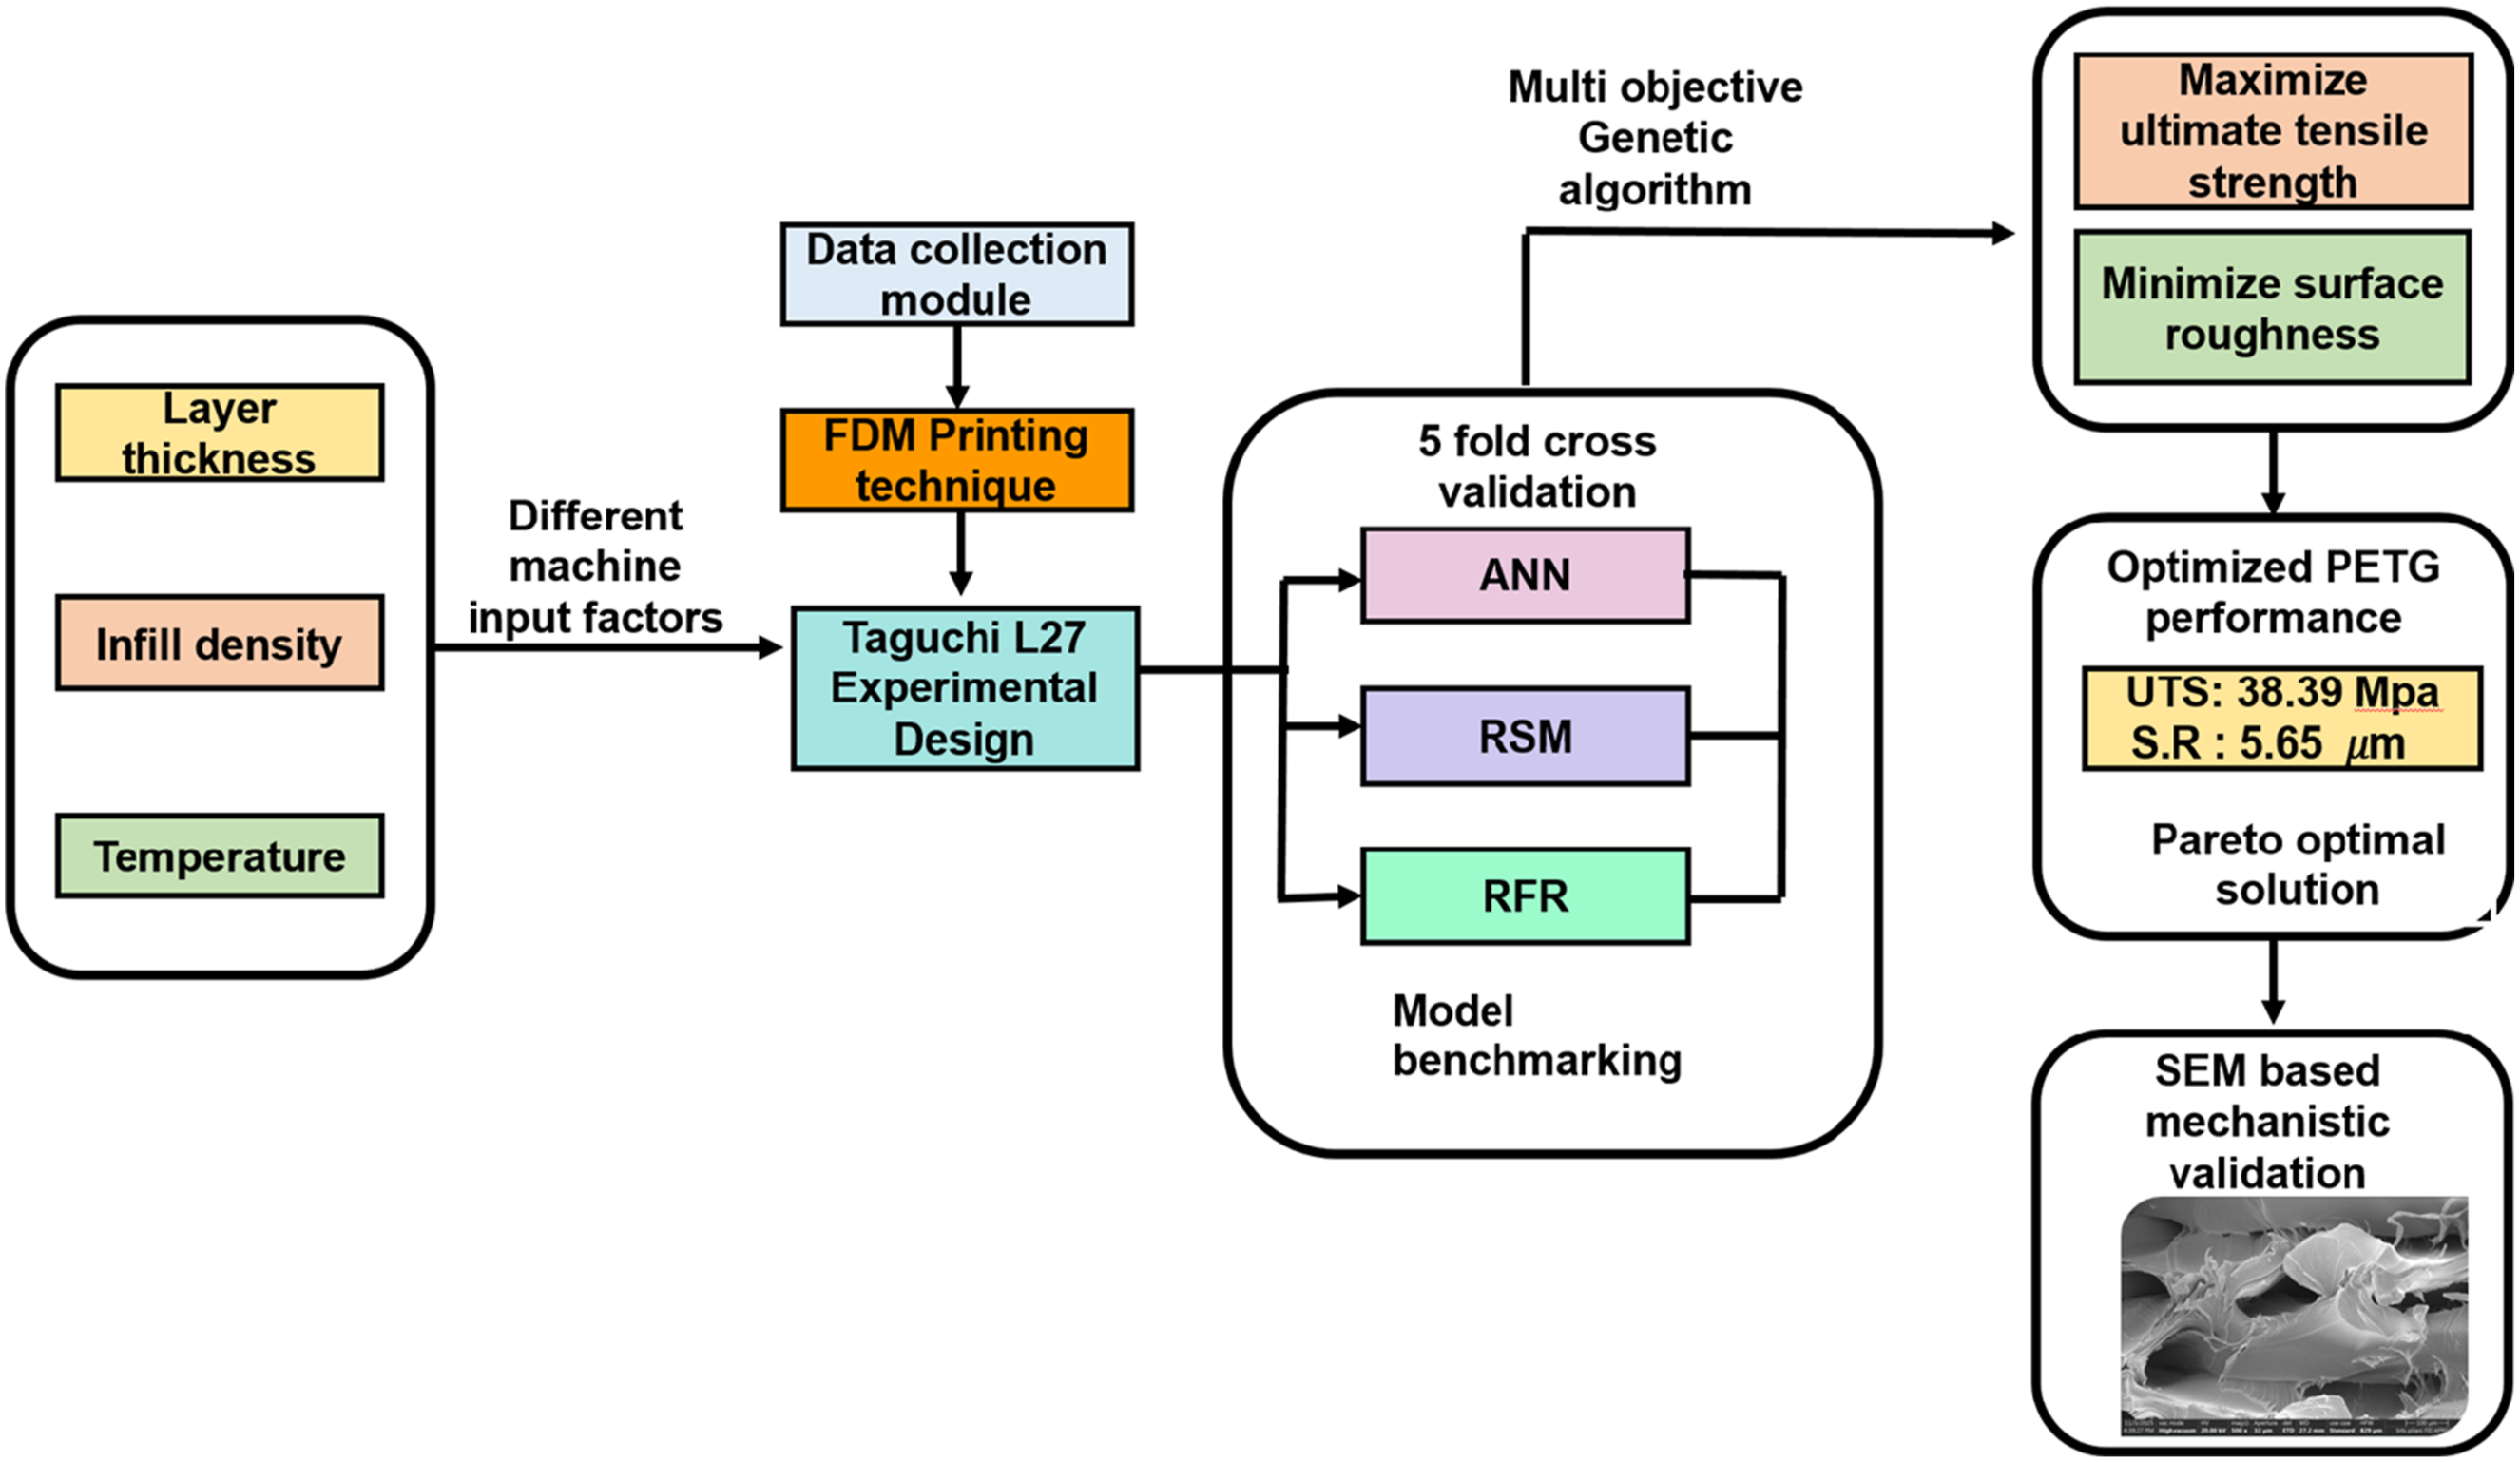
This integrated predictive–prescriptive based framework provides a scalable and generalizable methodology for intelligent parameter optimization in polymer additive manufacturing. The flowchart of the proposed methodology is provided in the Figure 1 below.
Material and methods
Process variable and their levels.
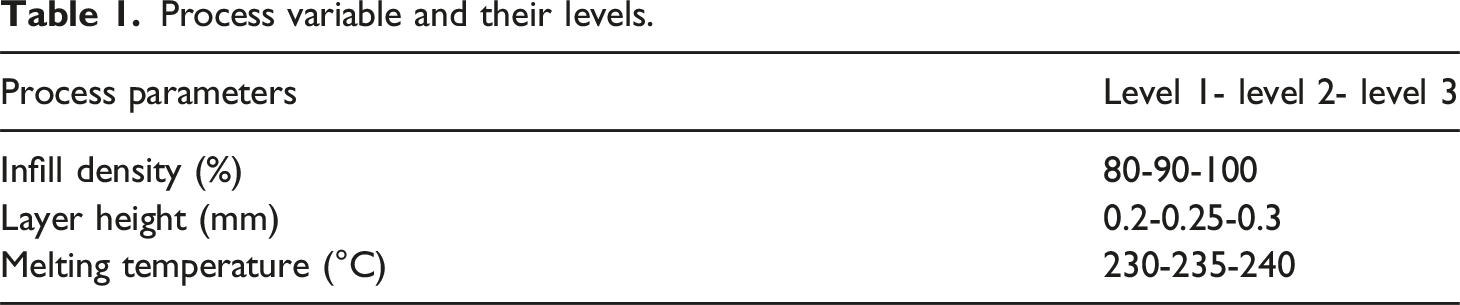
The infill density has a significant influence on the mechanical properties, weight, and material efficiency of PETG parts. Higher infill densities result in fewer voids inside the parts, thus improving tensile and compressive strength and load-carrying capacity, but with higher material consumption and longer printing times. On the other hand, lower infill densities result in lighter and faster-to-print parts with lower structural integrity. Likewise, the layer height is critical in defining surface finish, dimensional accuracies and inter layer bonding. Reduced heights of layers tend to increase surface quality and Z-direction strength because interlayer fusion is improved, but increased height of the layers decreases printing time and can result in rougher surfaces and lower interlayer adhesion. Both the choice of the infill density, layer height, and the melting temperature were informed by the process physics and statistical modelling. These parameters directly affect the thermal history, interlayer diffusion, bead morphology and internal porosity which are the main processes that control the tensile strength and roughness of surfaces in FDM-printed PETG. The reason is that preliminary screening experiments and the available literature have found that the variables are more sensitive to mechanical performance and surface quality than secondary parameters. Raster angle, speed of print and build orientation were kept constant in order to isolate the thermal-geometric influence of the melt temperature, layer height and infill density. This procedure has provided statistical strength, reduced interaction, and interpretability in Taguchi L27 experimental model.
The melting temperature is one of the most critical factors that determine the quality of prints and interlayer adhesion as well as mechanical performance of FDM-printed PETG components. A good melting point ensures total softening of the filaments and steady extrusion, which helps to create good inter-layers bonding and enhance mechanical strength. At too low temperatures, under-extrusion, low adhesion and low structural integrity may occur because of incomplete melting. On the other hand, high temperatures will lead to an overheat, stringing, dimensional error, and surface finish damage. Also, a long-time contact with the high temperatures may result in the thermal degradation of PETG, reducing the strength and durability. Thus, it is necessary to choose the appropriate melting temperature to find a compromise on the level of mechanical properties, surface quality, and dimensional stability during PETG printing.
The tensile specimens were fabricated in accordance with ASTM Type I standard geometry, and the specimen dimensions are illustrated in Figure 2. The CAD model of the specimen was developed using Autodesk Fusion 360 and subsequently exported as an STL file. The STL model was imported into Ultimaker Cura (version 3.1.3) for slicing, where the required process parameter levels were assigned based on the design of experiments prior to printing. Dimension of the ASTM-D638 type I.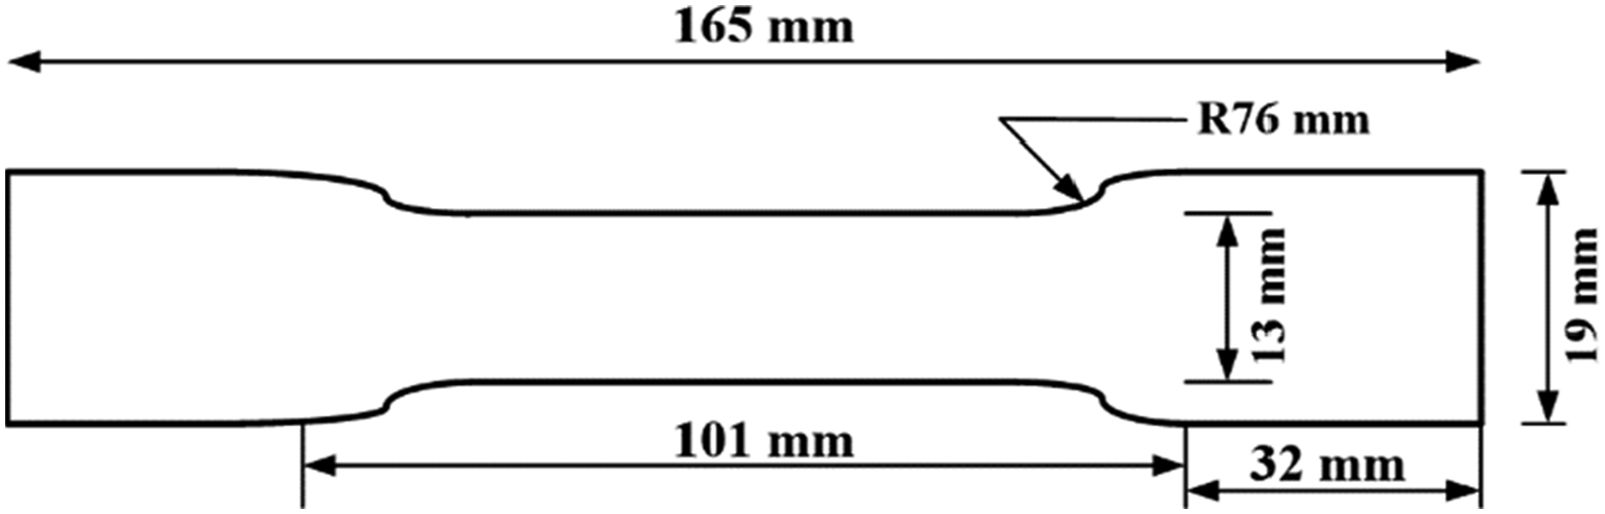
The Bambu Lab. A1 FDM printer with a 256 × 256 × 256 mm build volume, direct drive extruder, 1.75 mm filament system, 300°C nozzle, 100°C heated bed, and textured PEI build plate was employed for the fabrication process. Surface roughness was measured using a Mitutoyo SJ-210 surface roughness tester with a 25 mm cutoff length. The arithmetic average roughness (SR) represents the mean absolute deviation of the profile height within the evaluation length. Three measurements were taken at different locations on each specimen, and the average value was reported. A universal testing machine (Model: Instron 8801) with a 100kgf load capacity is used to perform a tensile test to determine this strength. The FDM experimental setup used to print PETG components and gauge their reactions is shown in Figure 3. The outcomes of the experiments are also shown in Table 2. FDM printing and mechanical testing setup. Experimental results showing mean ± standard deviation obtained from three replicate measurements.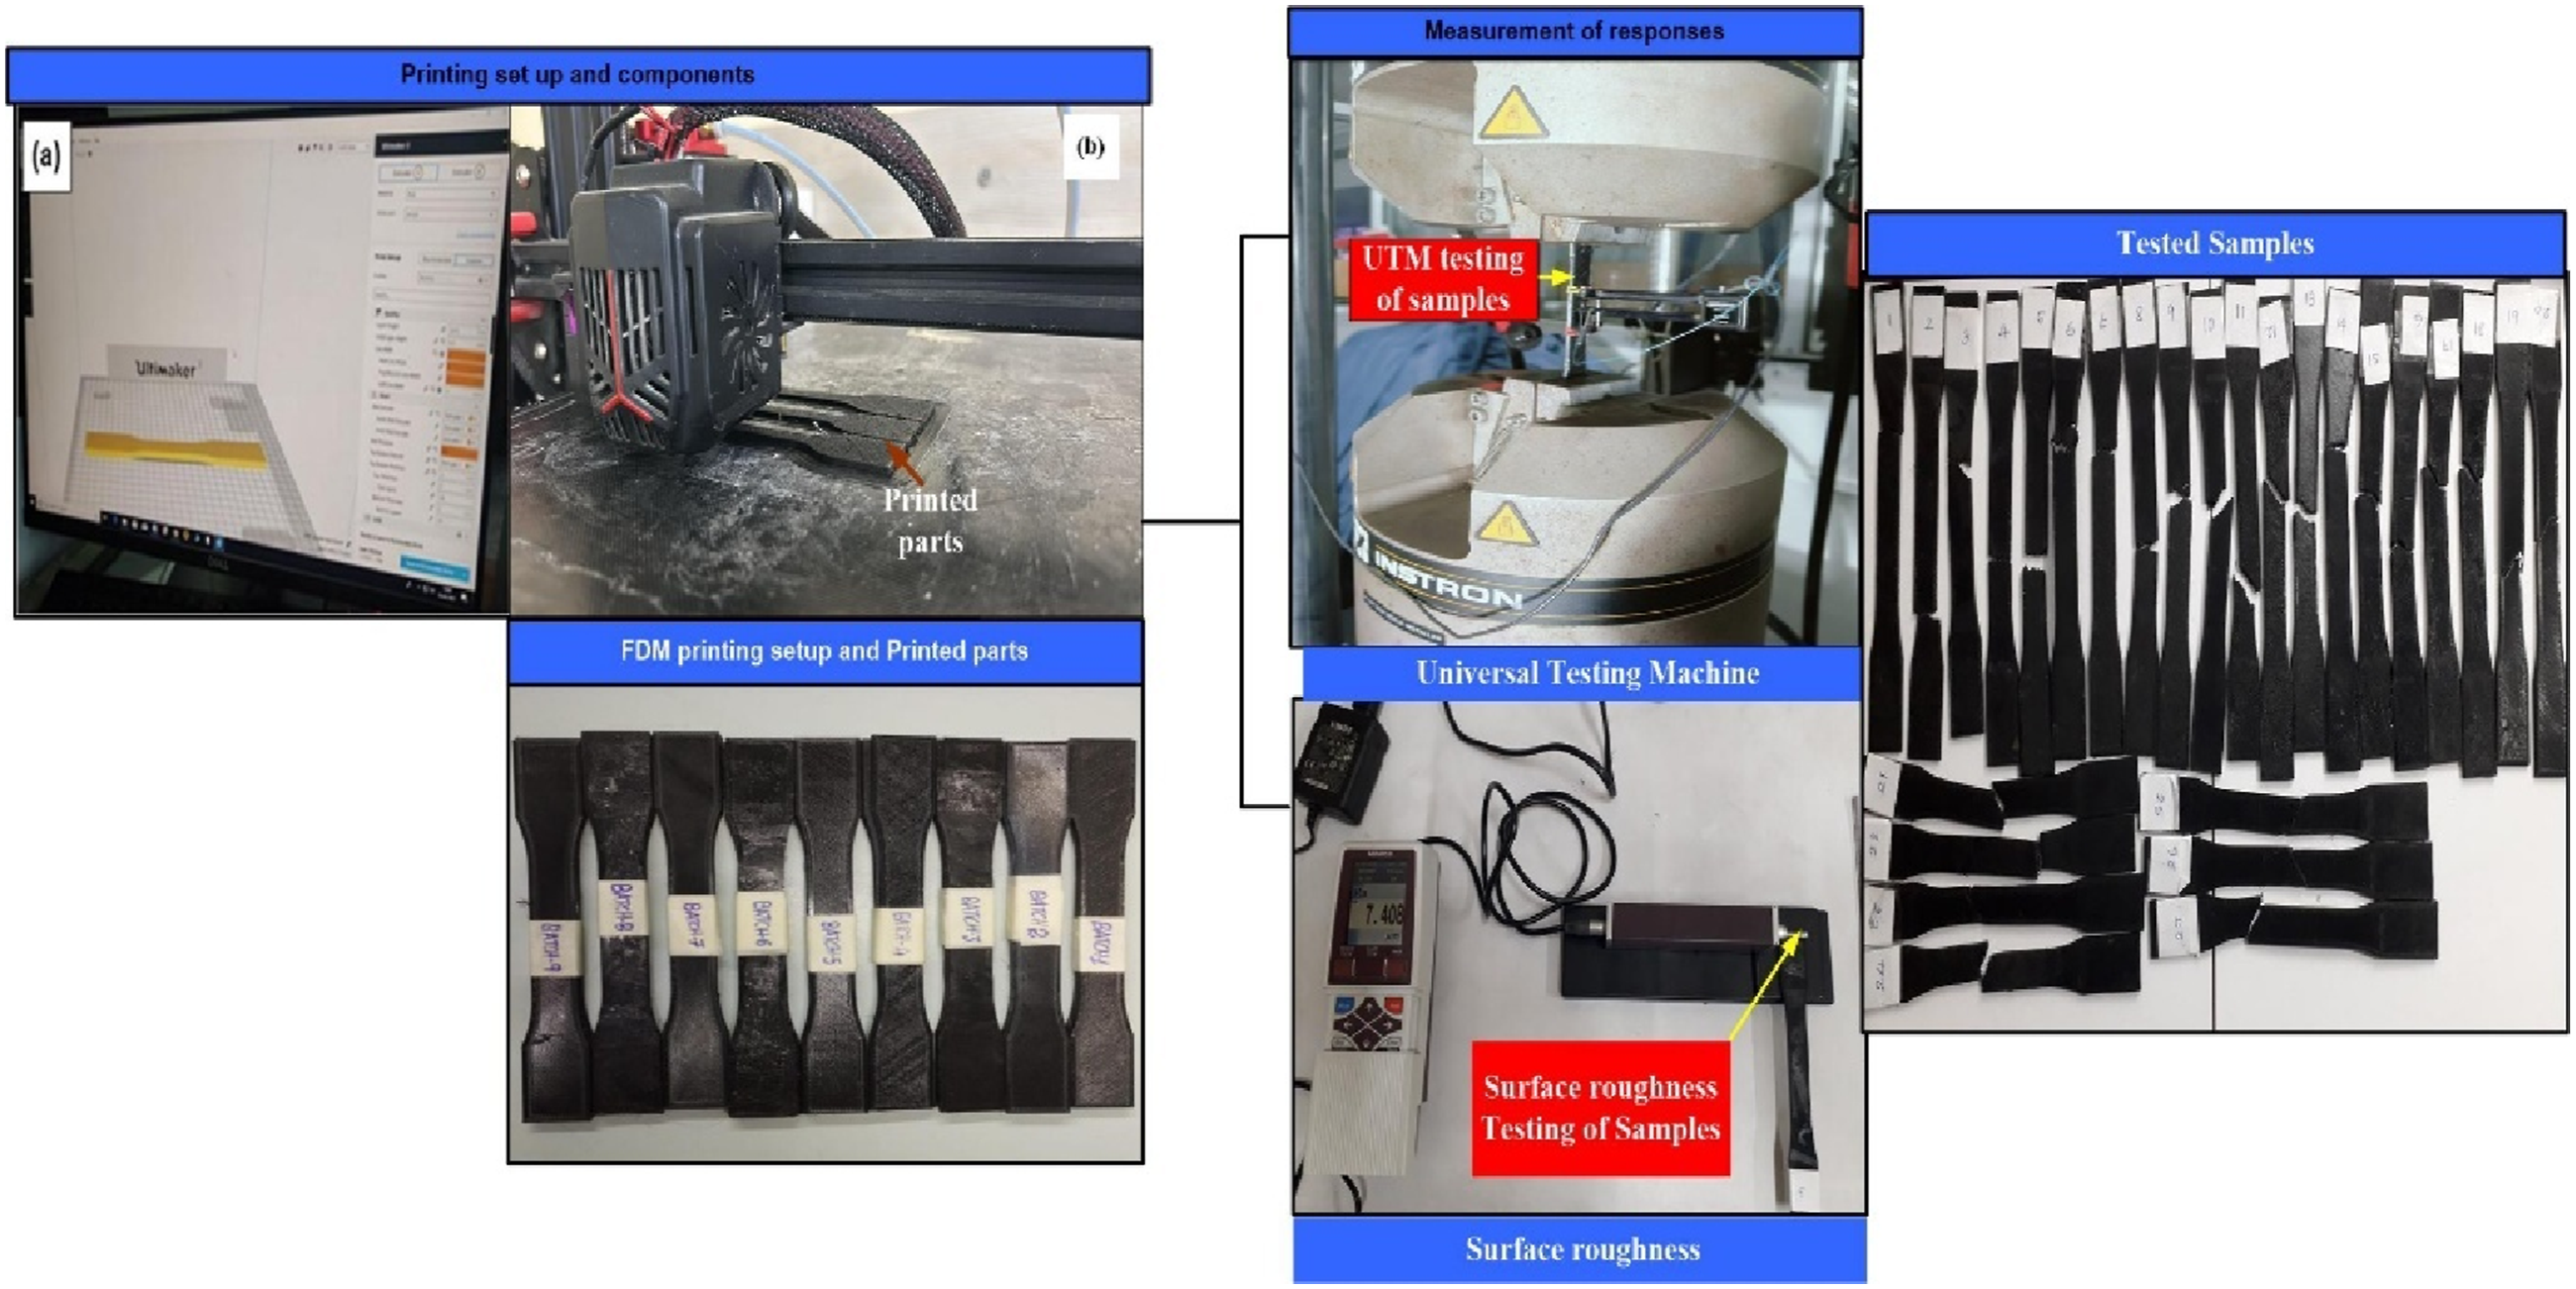
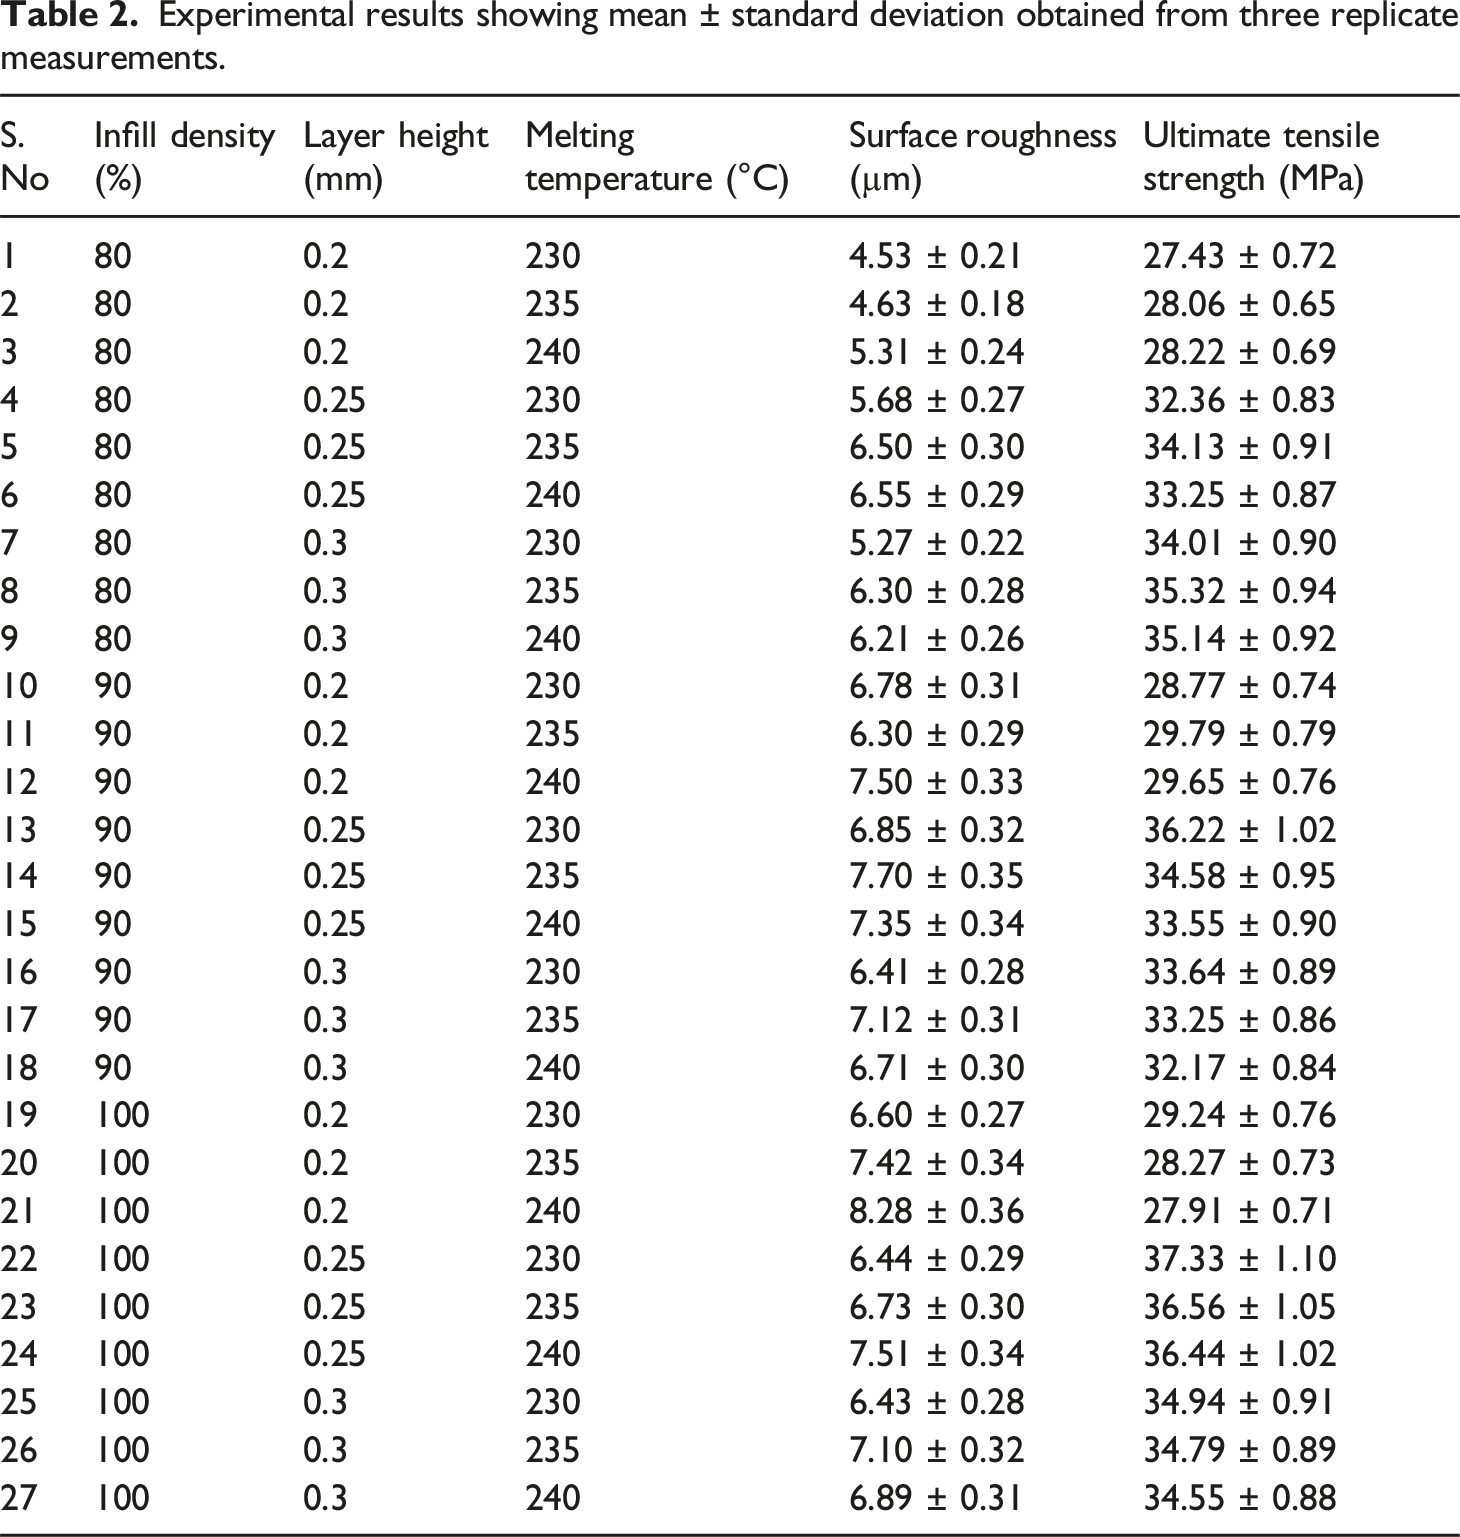
For each of the conditions determined in the Taguchi L27 design of experiments, three tensile tests were performed on specimens fabricated to account for variability in the experimentally measured data that is inherent in additively manufactured polymer parts. The ultimate tensile strength (UTS) in Table 2 is given as the average of three tests, and standard deviation (SD) is included to represent the spread of measured data. By taking multiple data points in the experiment, it is more realistic to assess the relationship between process and property for FDM-printed PETG parts. As part of the research study, an experimental investigation was conducted to determine the surface roughness and ultimate tensile strength of a polymer. Two different machine learning algorithms, artificial neural network (ANN) and random forest regression (RFR) were used to more accurately predict experimental results. Additionally, the mechanical responses were optimized using a genetic algorithm (GA). Source codes were developed using the Python® Ver 5 (spy-der) software package.
Predictive modeling
Regression algorithms are common in order to model and forecast continuous target variables with reference to input features. 33 The strategies are diverse using several techniques, which have different advantages and disadvantages which enable them to be effectively used in several practical situations. The fundamental linear regression technique finds a linear relationship between inputs and the required output by reducing the square difference between the numerical forecasts and the real values. 34 Advanced regression approaches known as decision trees, random forests and neural networks have been developed to model complex and nonlinear relationships. Decision trees break the feature space into successive partitions while producing predictions that use average or majority values in each partition. 35 The prediction accuracy and overfitting reduction is achieved through random forests by combining multiple decision trees. Neural networks recreate complex non-linear input-output transformations by having interconnected structural layers. 36
The regression approaches find valuable application across different fields such as finance and healthcare and engineering because predictive accuracy drives successful decision-making process. The prediction for 3D-printed Polyethylene Terephthalate Glycol (PETG) specimen surface roughness and ultimate tensile strength adopts random forest regression along with response surface methodology and artificial neural network and Genetic algorithms. The illustration of methodology and complete workflow is depicted in Figure 4. Research methodology followed.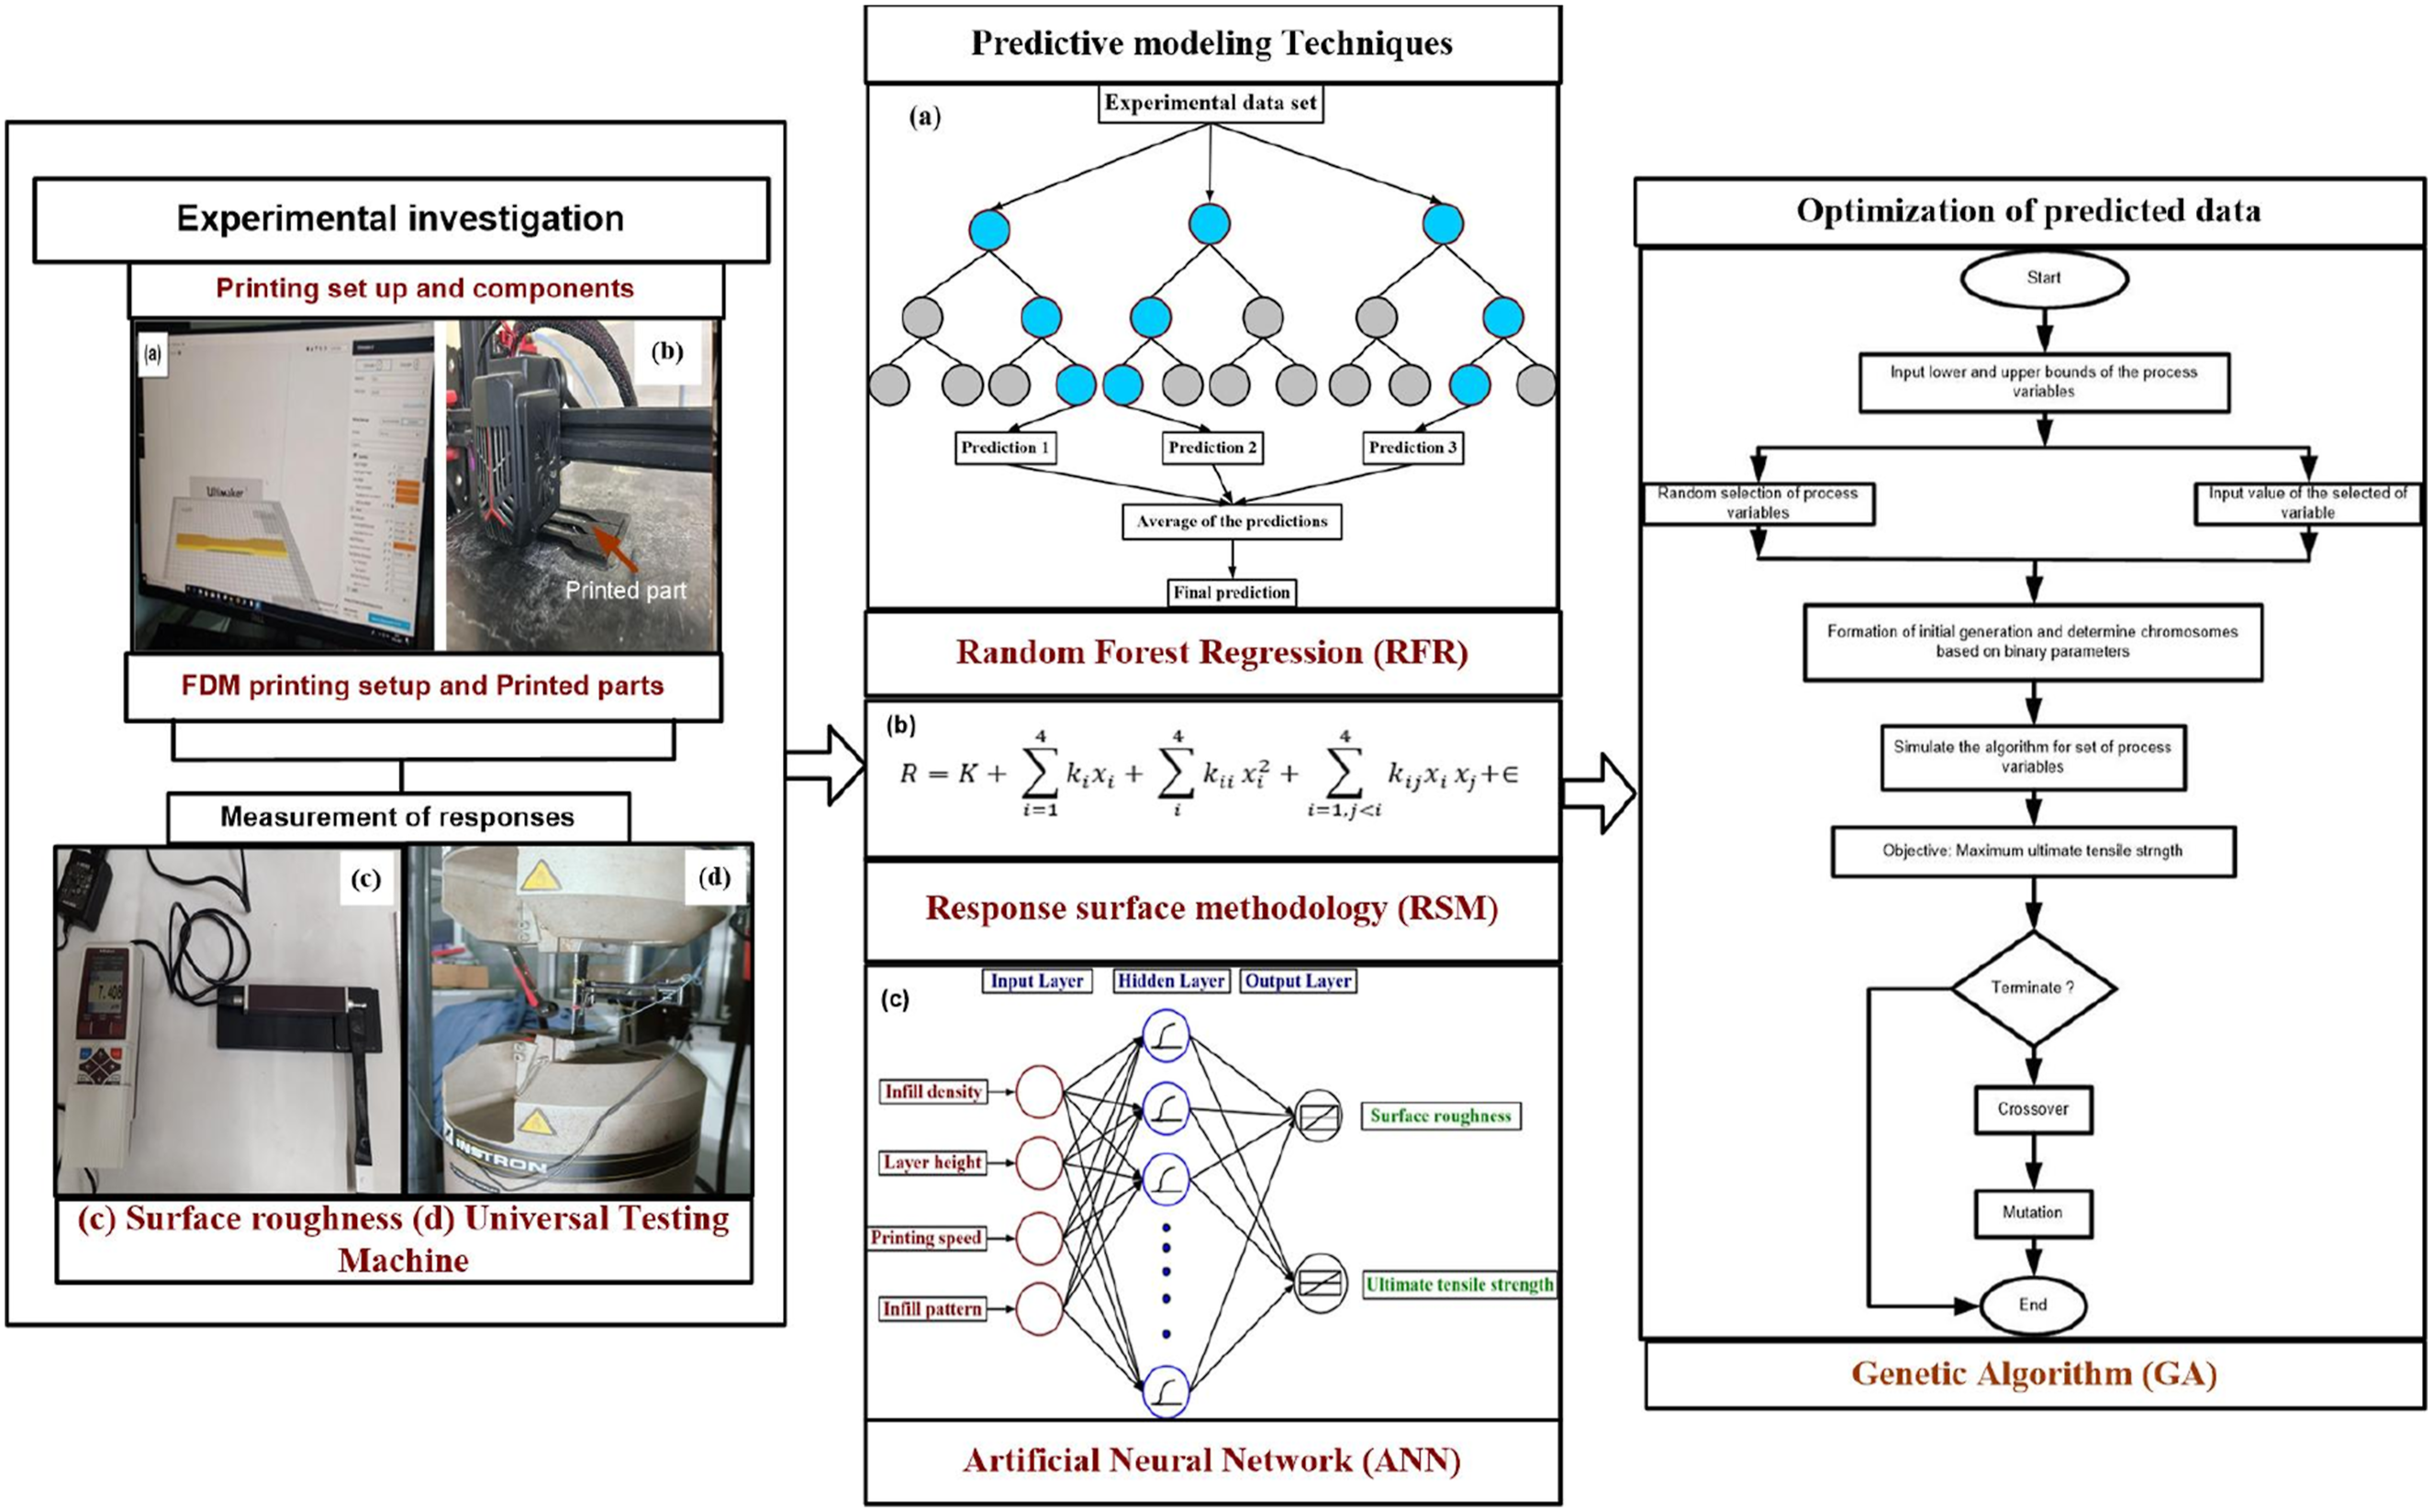
Random forest regression (RFR)
Random Forest (RF) represents a common ensemble learning technique which exhibits excellent classification capabilities especially when applied to image classification applications. 37 Within its training phase the system produces multiple decision trees which it unifies through a majority vote technique for classification or an averaging approach for regression purposes. RF stands out because it provides successful operation alongside scalable design features together with strong abilities to process data of any dimension. RF finds widespread application in various fields including finance, medicine, ecology and social sciences because of its several advantages. 38
Random Forest improves prediction accuracy in combination with model generalization through its collective use of multiple decision trees. The final classification decision in minority voting tasks is determined by Random Forest whereas regression prediction occurs through the averaging of all tree predictions. The ensemble method reduces the danger of overfitting while providing superior model robustness than single decision trees do.
39
The aggregation of multiple decision paths through Random Forest enables analysis of feature importance that yields predictive influence understanding about various predictors. Random Forest supports parallel data processing of large-scale high-dimensional datasets thanks to its efficient structure design.
40
Figure 5(a) presents the structure of the Random Forest Regression (RFR) model, and Figure 5(b) illustrates the corresponding network architecture. (a) RFR network model (b) RFR Network architecture.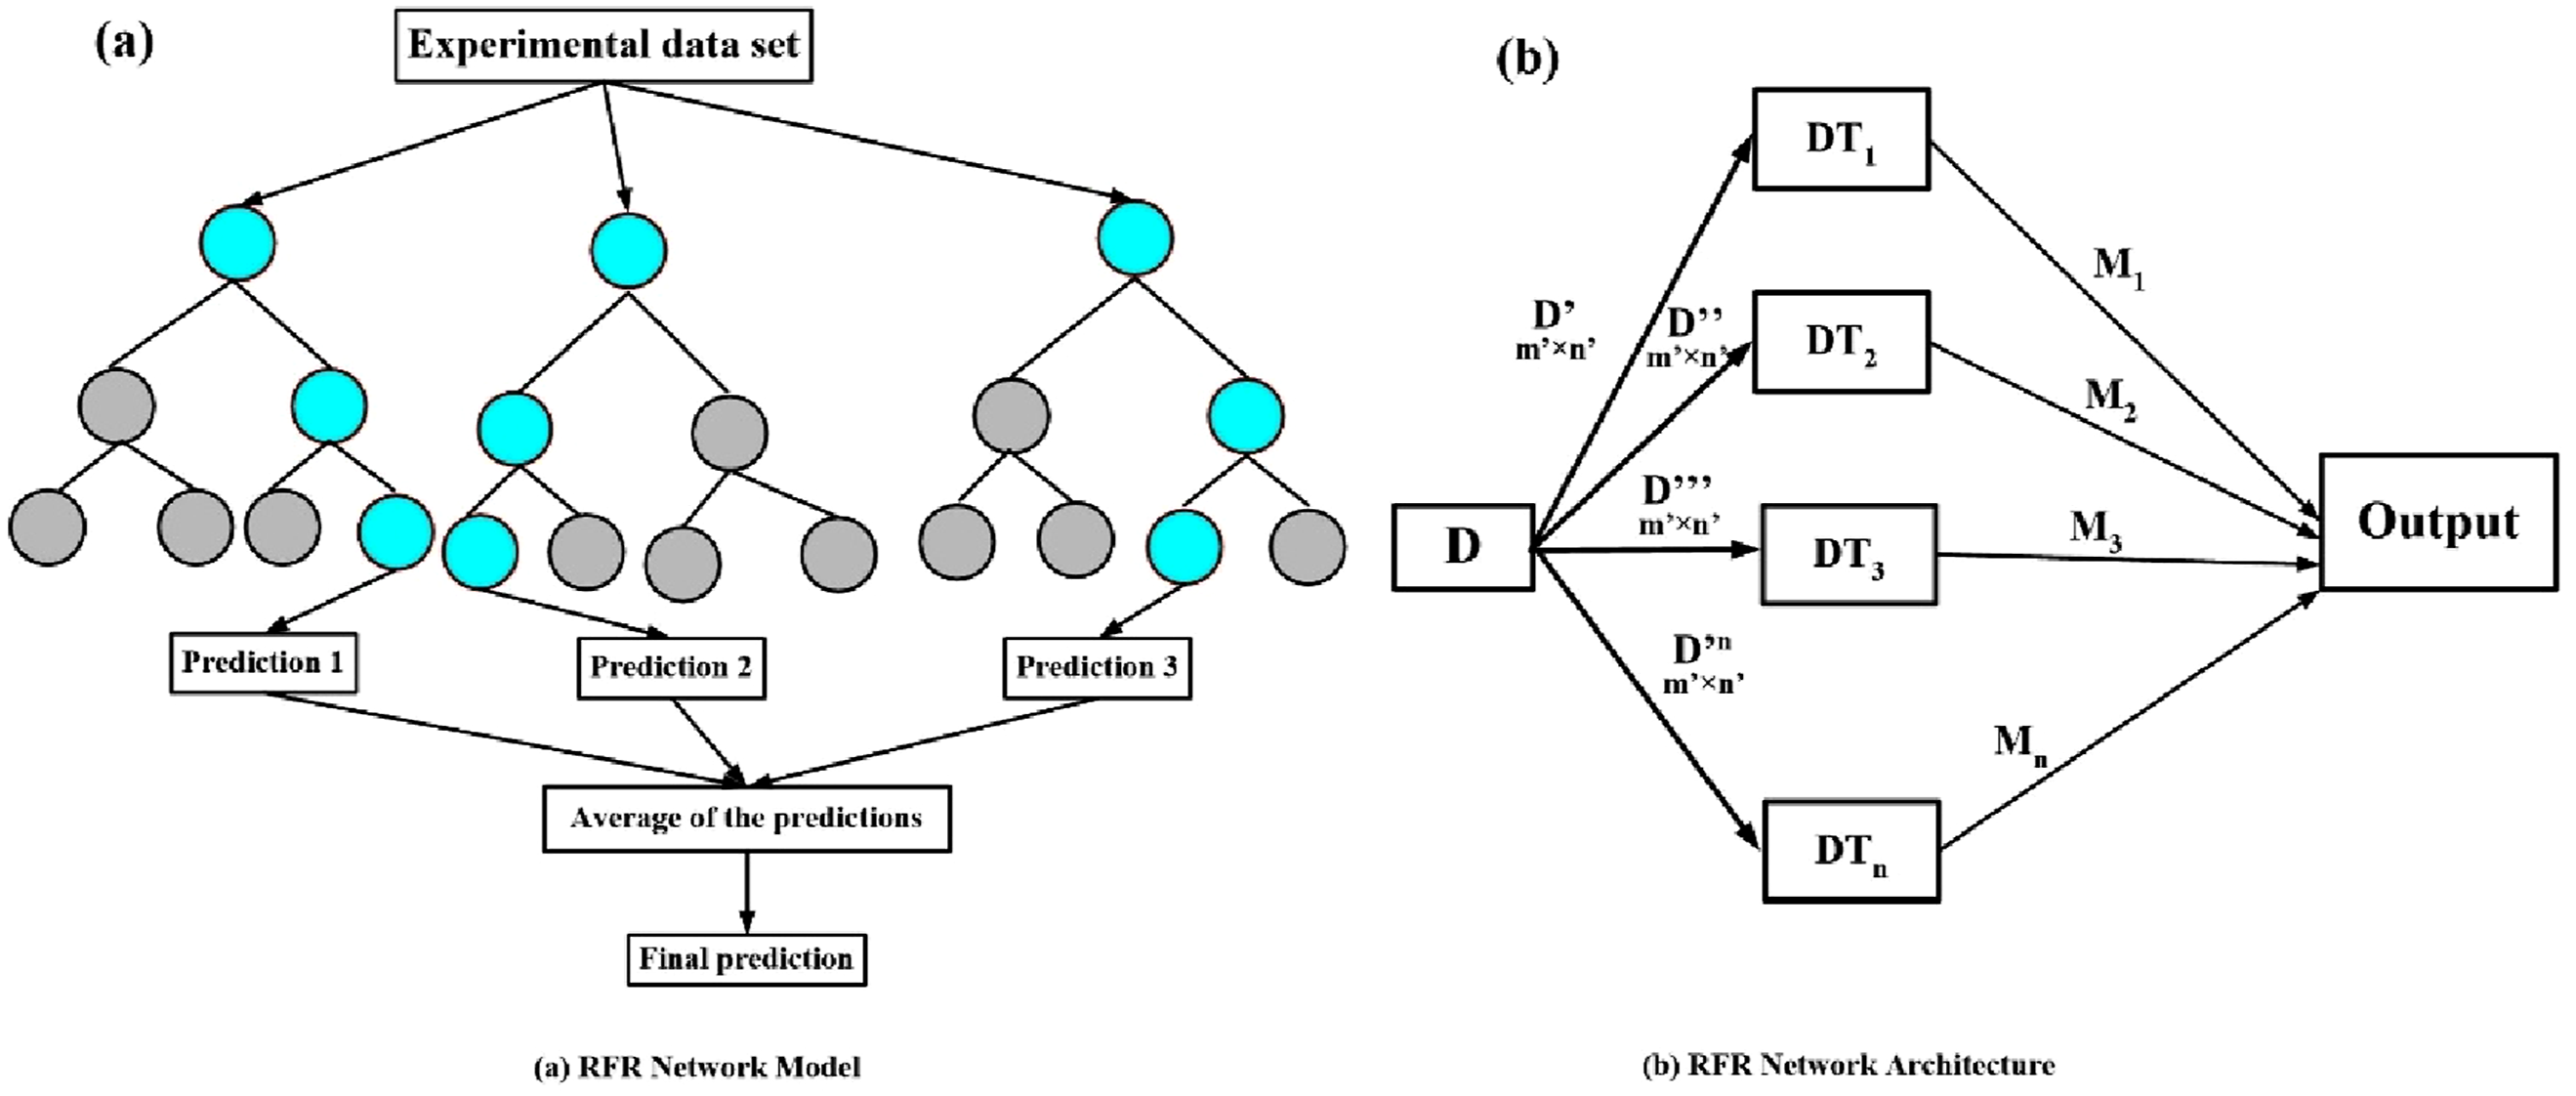
Random Forest operates as an ensemble learning technique which utilizes many decisions trees to build predictive systems that achieve higher performance rates. Random Forest functions for both regression problems and classification problems. Each decision tree receives training through Bootstrap Aggregation (also known as bagging) using randomly picked data subsets. The classification problem uses majority vote as its output determination method and regression problems calculate results using the mean of individual predictions. Through aggregation methods the model achieves better accuracy and decreases overfitting as well as becoming more robust.
Researchers identify the Random Forest algorithm as an effective machine learning technique which delivers accurate predictions for diverse regression and classification purposes. Random Forest demonstrates excellent capabilities when handling both big datasets with multiple features while providing improved results because of ensemble learning. RFR methods produce reliable results for numerical prediction by calculating multiple decision tree outputs according to Vinci et al. (2018).
41
The research data allocation included 70% for training and 30% for testing purposes. Performance metrics from running the RFR algorithm on the subsets revealed metrics for the testing data that included R2 = 0.83 and both MSE = 10.01 and MAE = 2.51. The training data metrics amounted to R2 = 0.94 and MAE = 0.35 along with MSE = 0.20. Both subsets received regression plots for performance evaluation of the model, with the results presented in Figure 6(a) for surface roughness and Figure 6(b) for ultimate tensile strength. RFR Regression plot (a) Surface roughness (b) Ultimate tensile strength.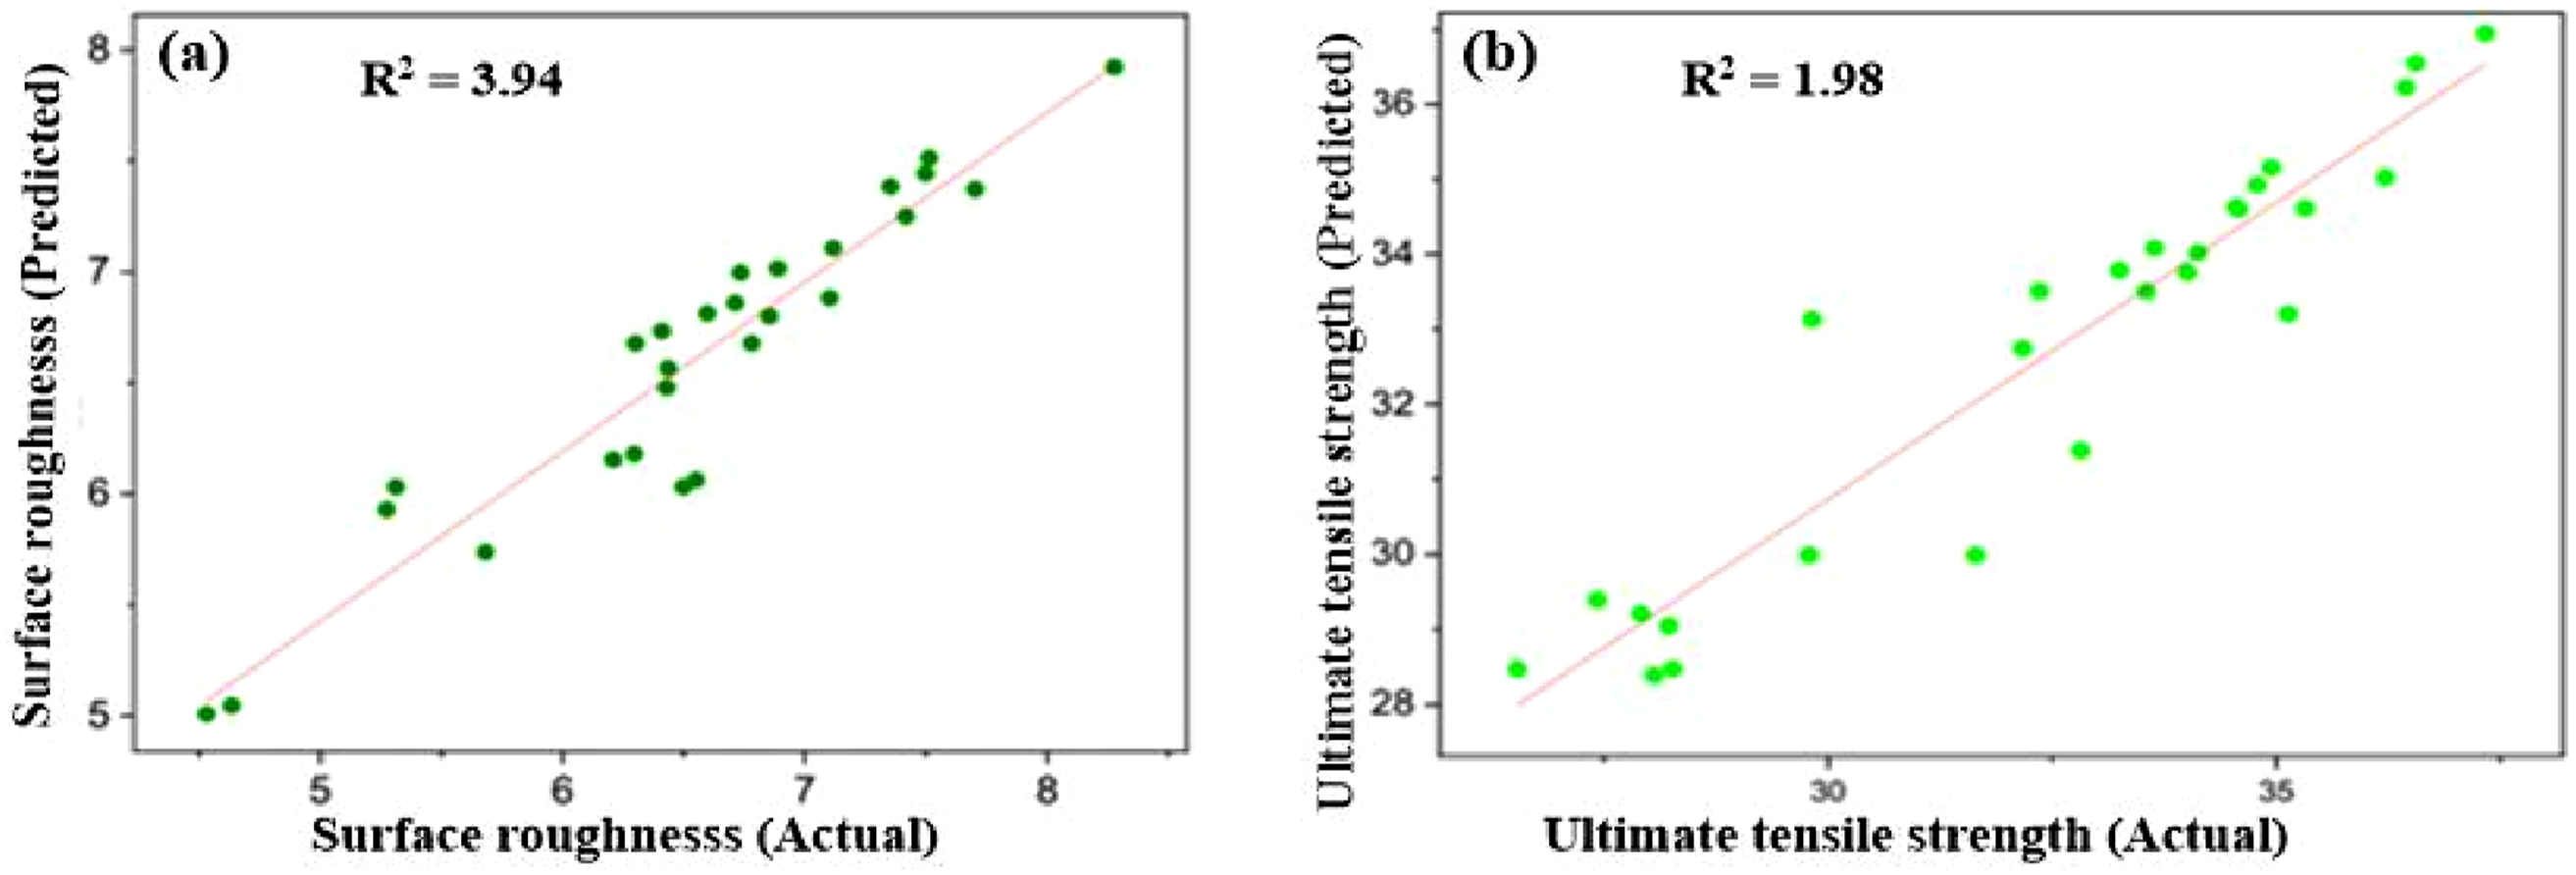
To assess model reliability and reduce the risk of overfitting, a five-fold cross-validation strategy was adopted. In this approach, the dataset was divided into five subsets, with each subset used sequentially for validation while the remaining data were used for training. Although the dataset consists of 27 experiments derived from a Taguchi L27 orthogonal array, such statistically balanced designs are considered adequate for predictive modelling when model complexity is carefully controlled and validation procedures are rigorously applied. Figure 7 presents the cross-validation results for surface roughness (SR) and ultimate tensile strength (UTS), showing fold-wise variations in R2, MAE, and MSE to evaluate robustness and generalisation capability. As illustrated in Figure 7(a)–(f), the model demonstrates strong and consistent predictive performance for both responses. The R2 values remain high across folds (0.75–0.88 for SR and 0.73–0.89 for UTS), indicating that the models effectively capture the variability in the data under different training–validation splits. Surface roughness exhibits slightly larger fluctuations in MAE and MSE, suggesting greater sensitivity to the nonlinear and stochastic nature of surface formation during printing. In contrast, UTS shows lower and more stable error values, reflecting a more deterministic relationship with the selected process parameters. Overall, the limited spread in performance metrics confirms that the models generalise well and are not overfitting the data. The observed variability further highlights the inherently more random behaviour of surface morphology compared to mechanical strength response. Five-fold cross-validation results.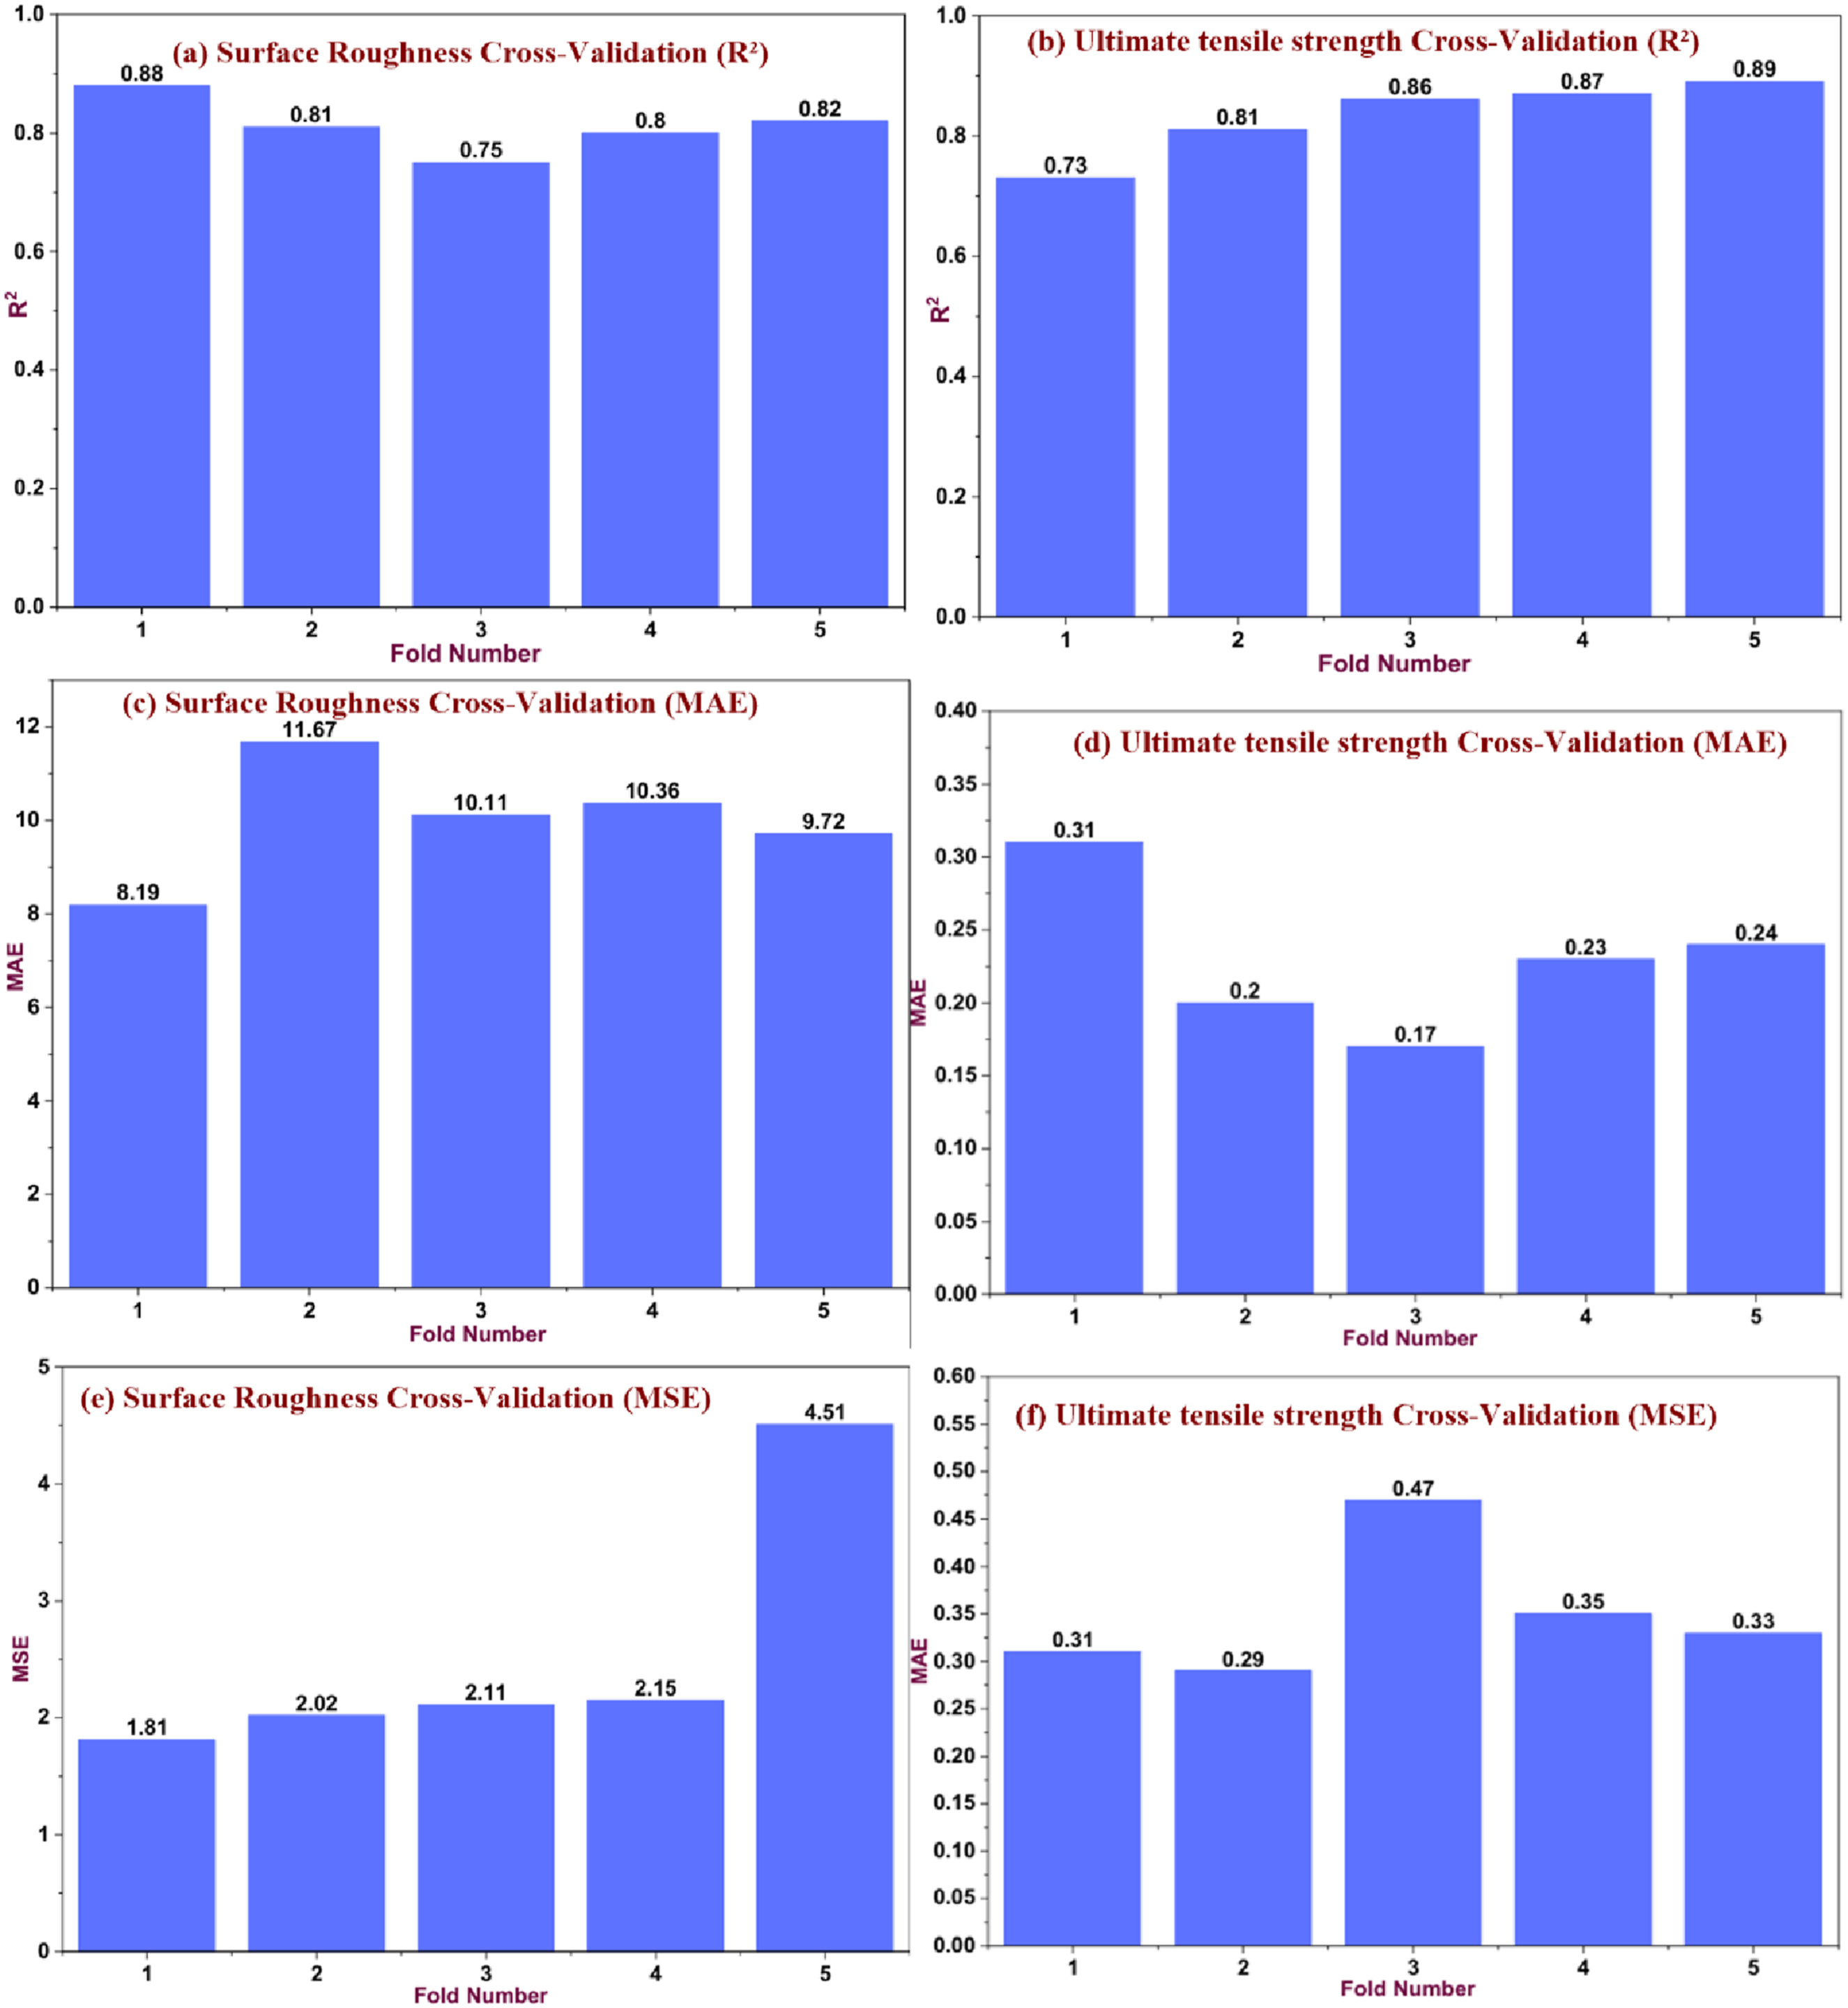
Artificial neural network (ANN) modelling
The development of predictive models uses a combination of statistical approaches together with soft computing techniques where soft computing methods prevail as the primary method in current research. Soft computing methods employ neural networks with fuzzy logic due to their strength in processing complex and nonlinear data relationships. Neural networks demonstrate capabilities to detect patterns while learning from data while simulating highly complex variable interactions. Such attributes give them exceptional capability to detect both nonlinear relations and interaction effects in experiment-based datasets. 42
This study aims to create a forecasting model which determines the ultimate tensile strength combined with elastic modulus and surface roughness measurement in 3D-printed PETG components. The model arrangement includes three fundamental components which are input followed by hidden and concluding with output layers that contain several connectivity-based nodes. The nodes communicate through synaptic weights that establish the level of signal strength between them. The placement of one or multiple hidden layers between input and output layers provides the model with capability to detect intricate relations within the data. Predications that both reliable and accurate require splitting available data between training and testing and validation datasets. However, there is no standardized formula for determining the optimal quantity of data to be allocated to each category.43,44
A feedforward network with a multilayer perceptron (MLP) configuration was implemented to predict the mechanical characteristics of PETG components produced through fused deposition modeling (FDM). These are roughness of surface and ultimate tensile strength which are targeted. The model will be created in such a way that it is possible to determine the correlation between those responses and the corresponding process parameters. It has four input neurons that take the form of the processing variables chosen and three output neurons that form the mechanical properties being studied. Training requires that the number of neurons in the hidden layer should be determined first. Each neuron generates an output by computing the weighted sum of its inputs from the previous layer and adding a bias term. Equation (2) calculate the output of the hidden process.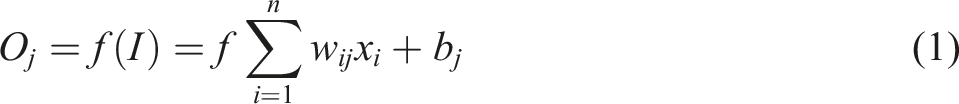
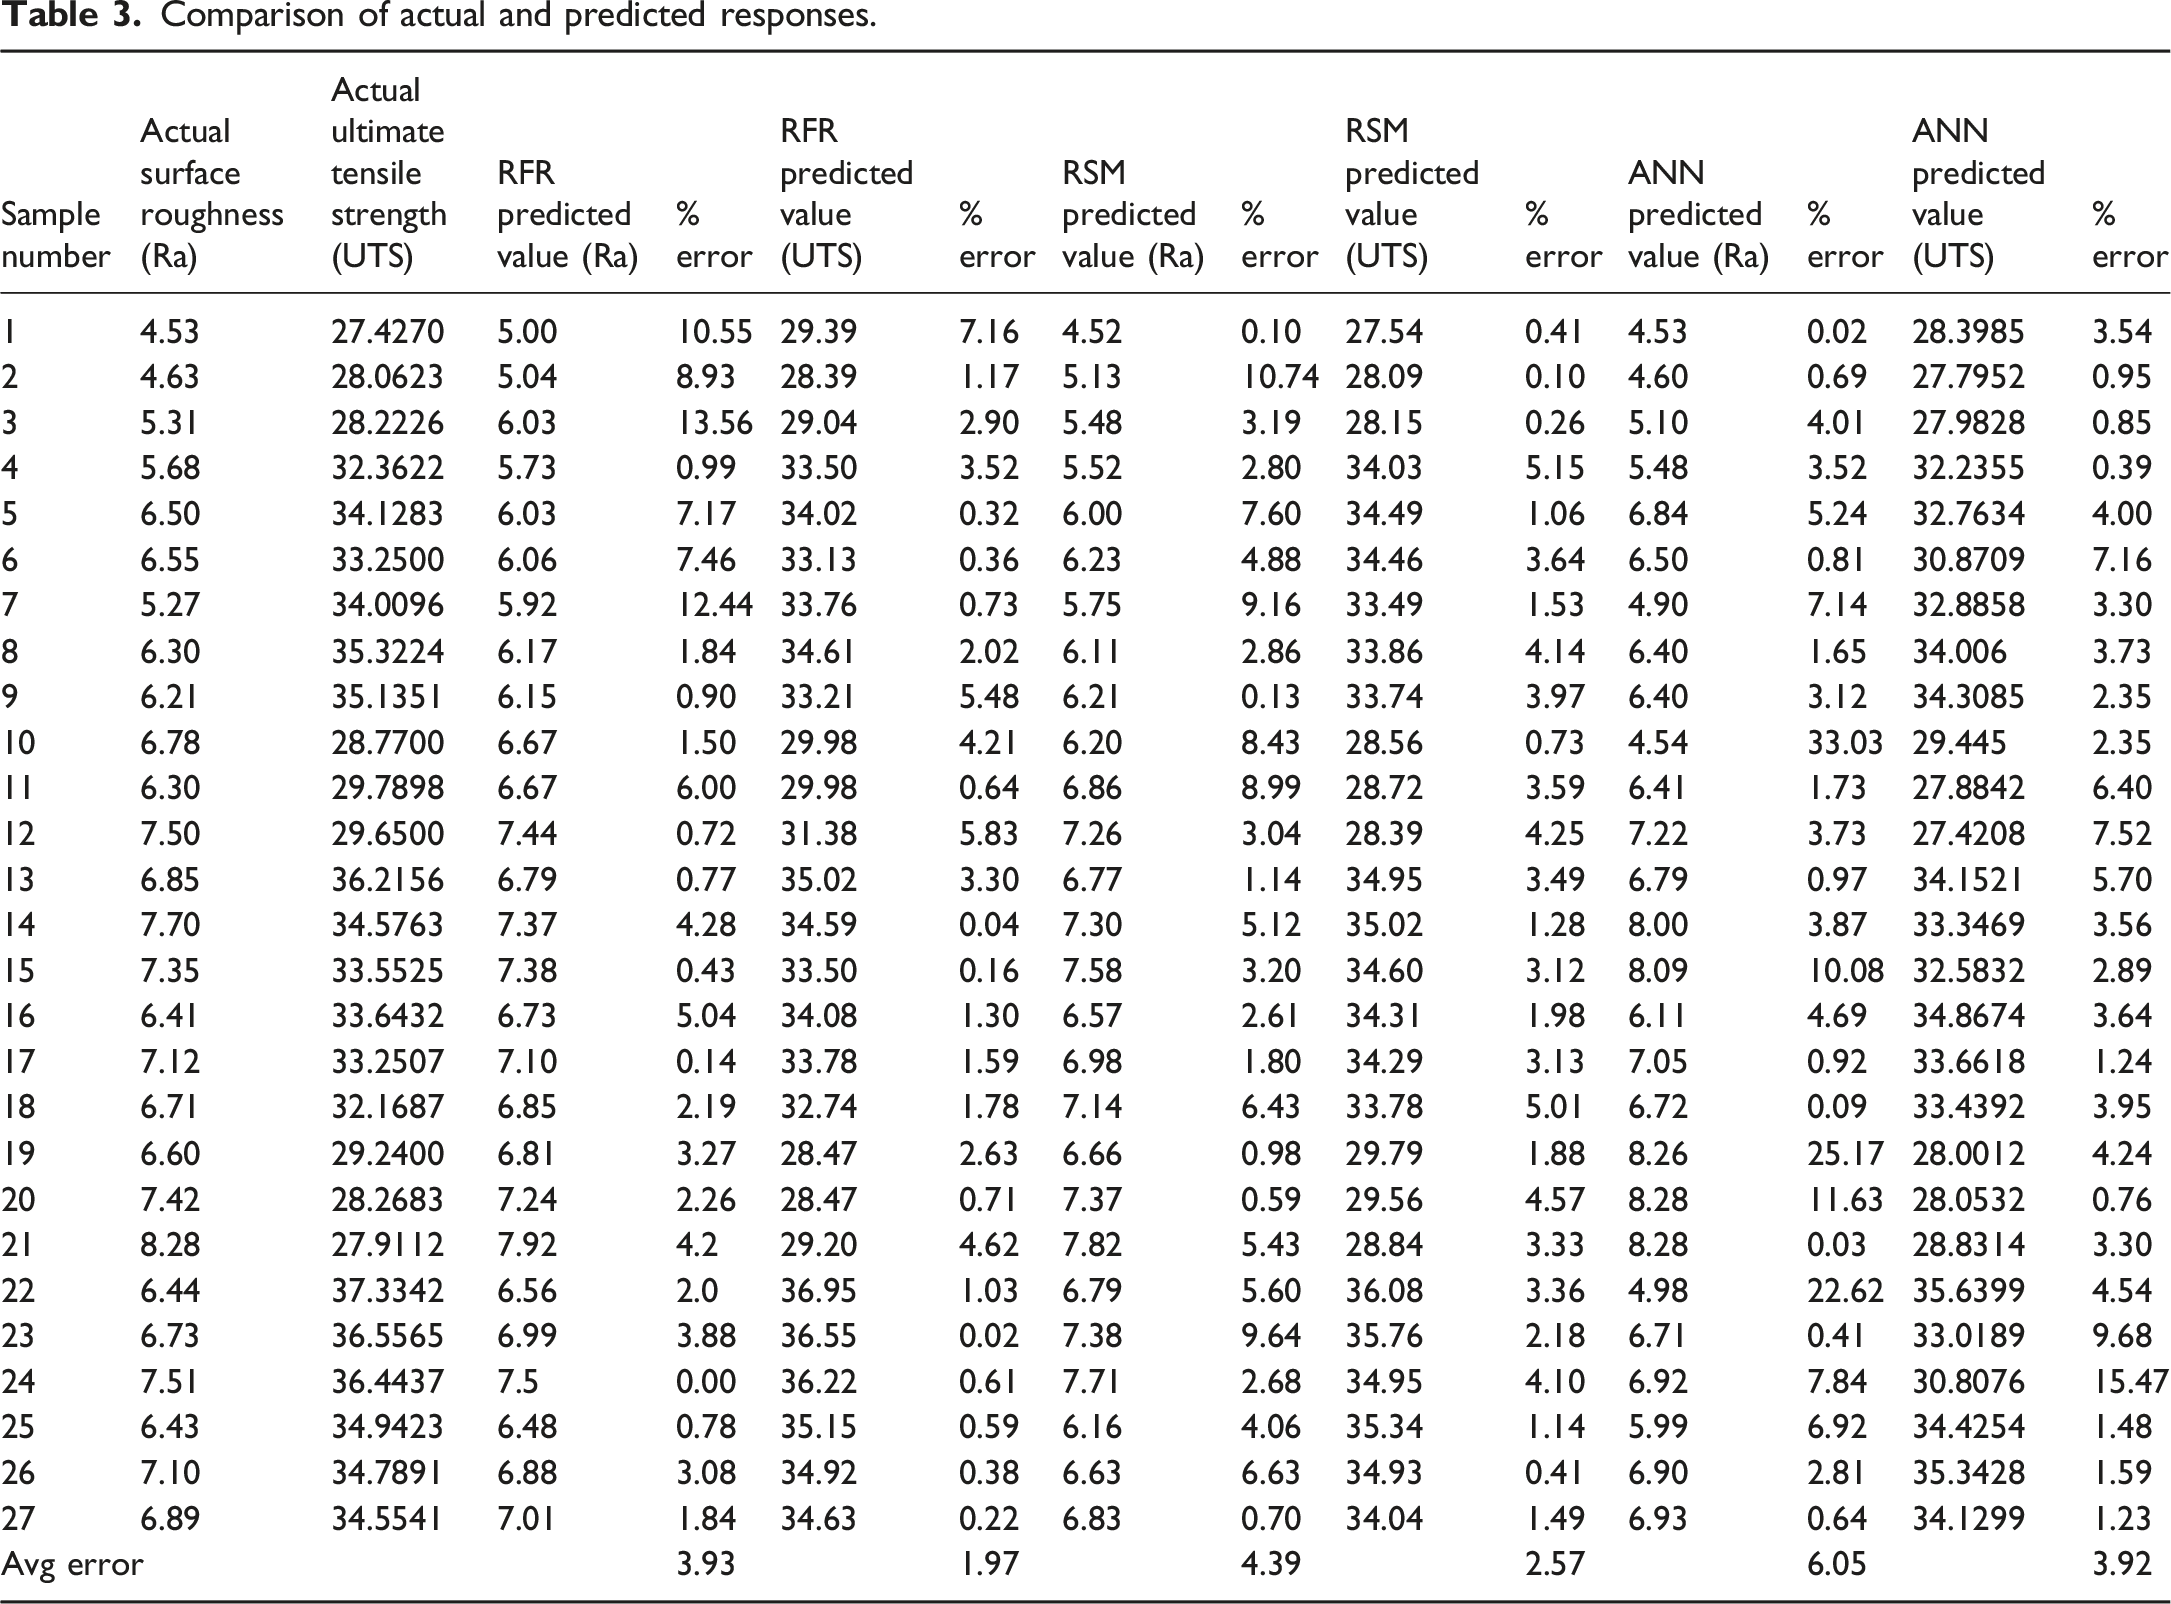
A neural network model with a 3–12–2 structure was developed using 70% of the dataset for training, while 15% was used for testing and the remaining 15% for validation. The high correlation coefficient close to one represented in the performance and regression plots as shown in the respective figures indicates that the model has a great potential to represent the relationship between the process parameters and the output responses. The regression plots of all the individual response variables are shown in Figure 8. Besides, Table 4 shows the comparison of the experimental results and the predicted ones concerning surface roughness and ultimate tensile strength. The comparison table shows the predictive and actual values of all the three responses variables in 27 samples and the percentage error made. The average error of the ultimate tensile strength estimated by the model was 4.33%, surface roughness was measured with a deviation of 6.05. These narrow margin errors indicate that the model is very accurate with respect to its predictions. This allows concluding that the mechanical properties of the 3D-printed material of PETG were estimated successfully and reliably. ANN architecture.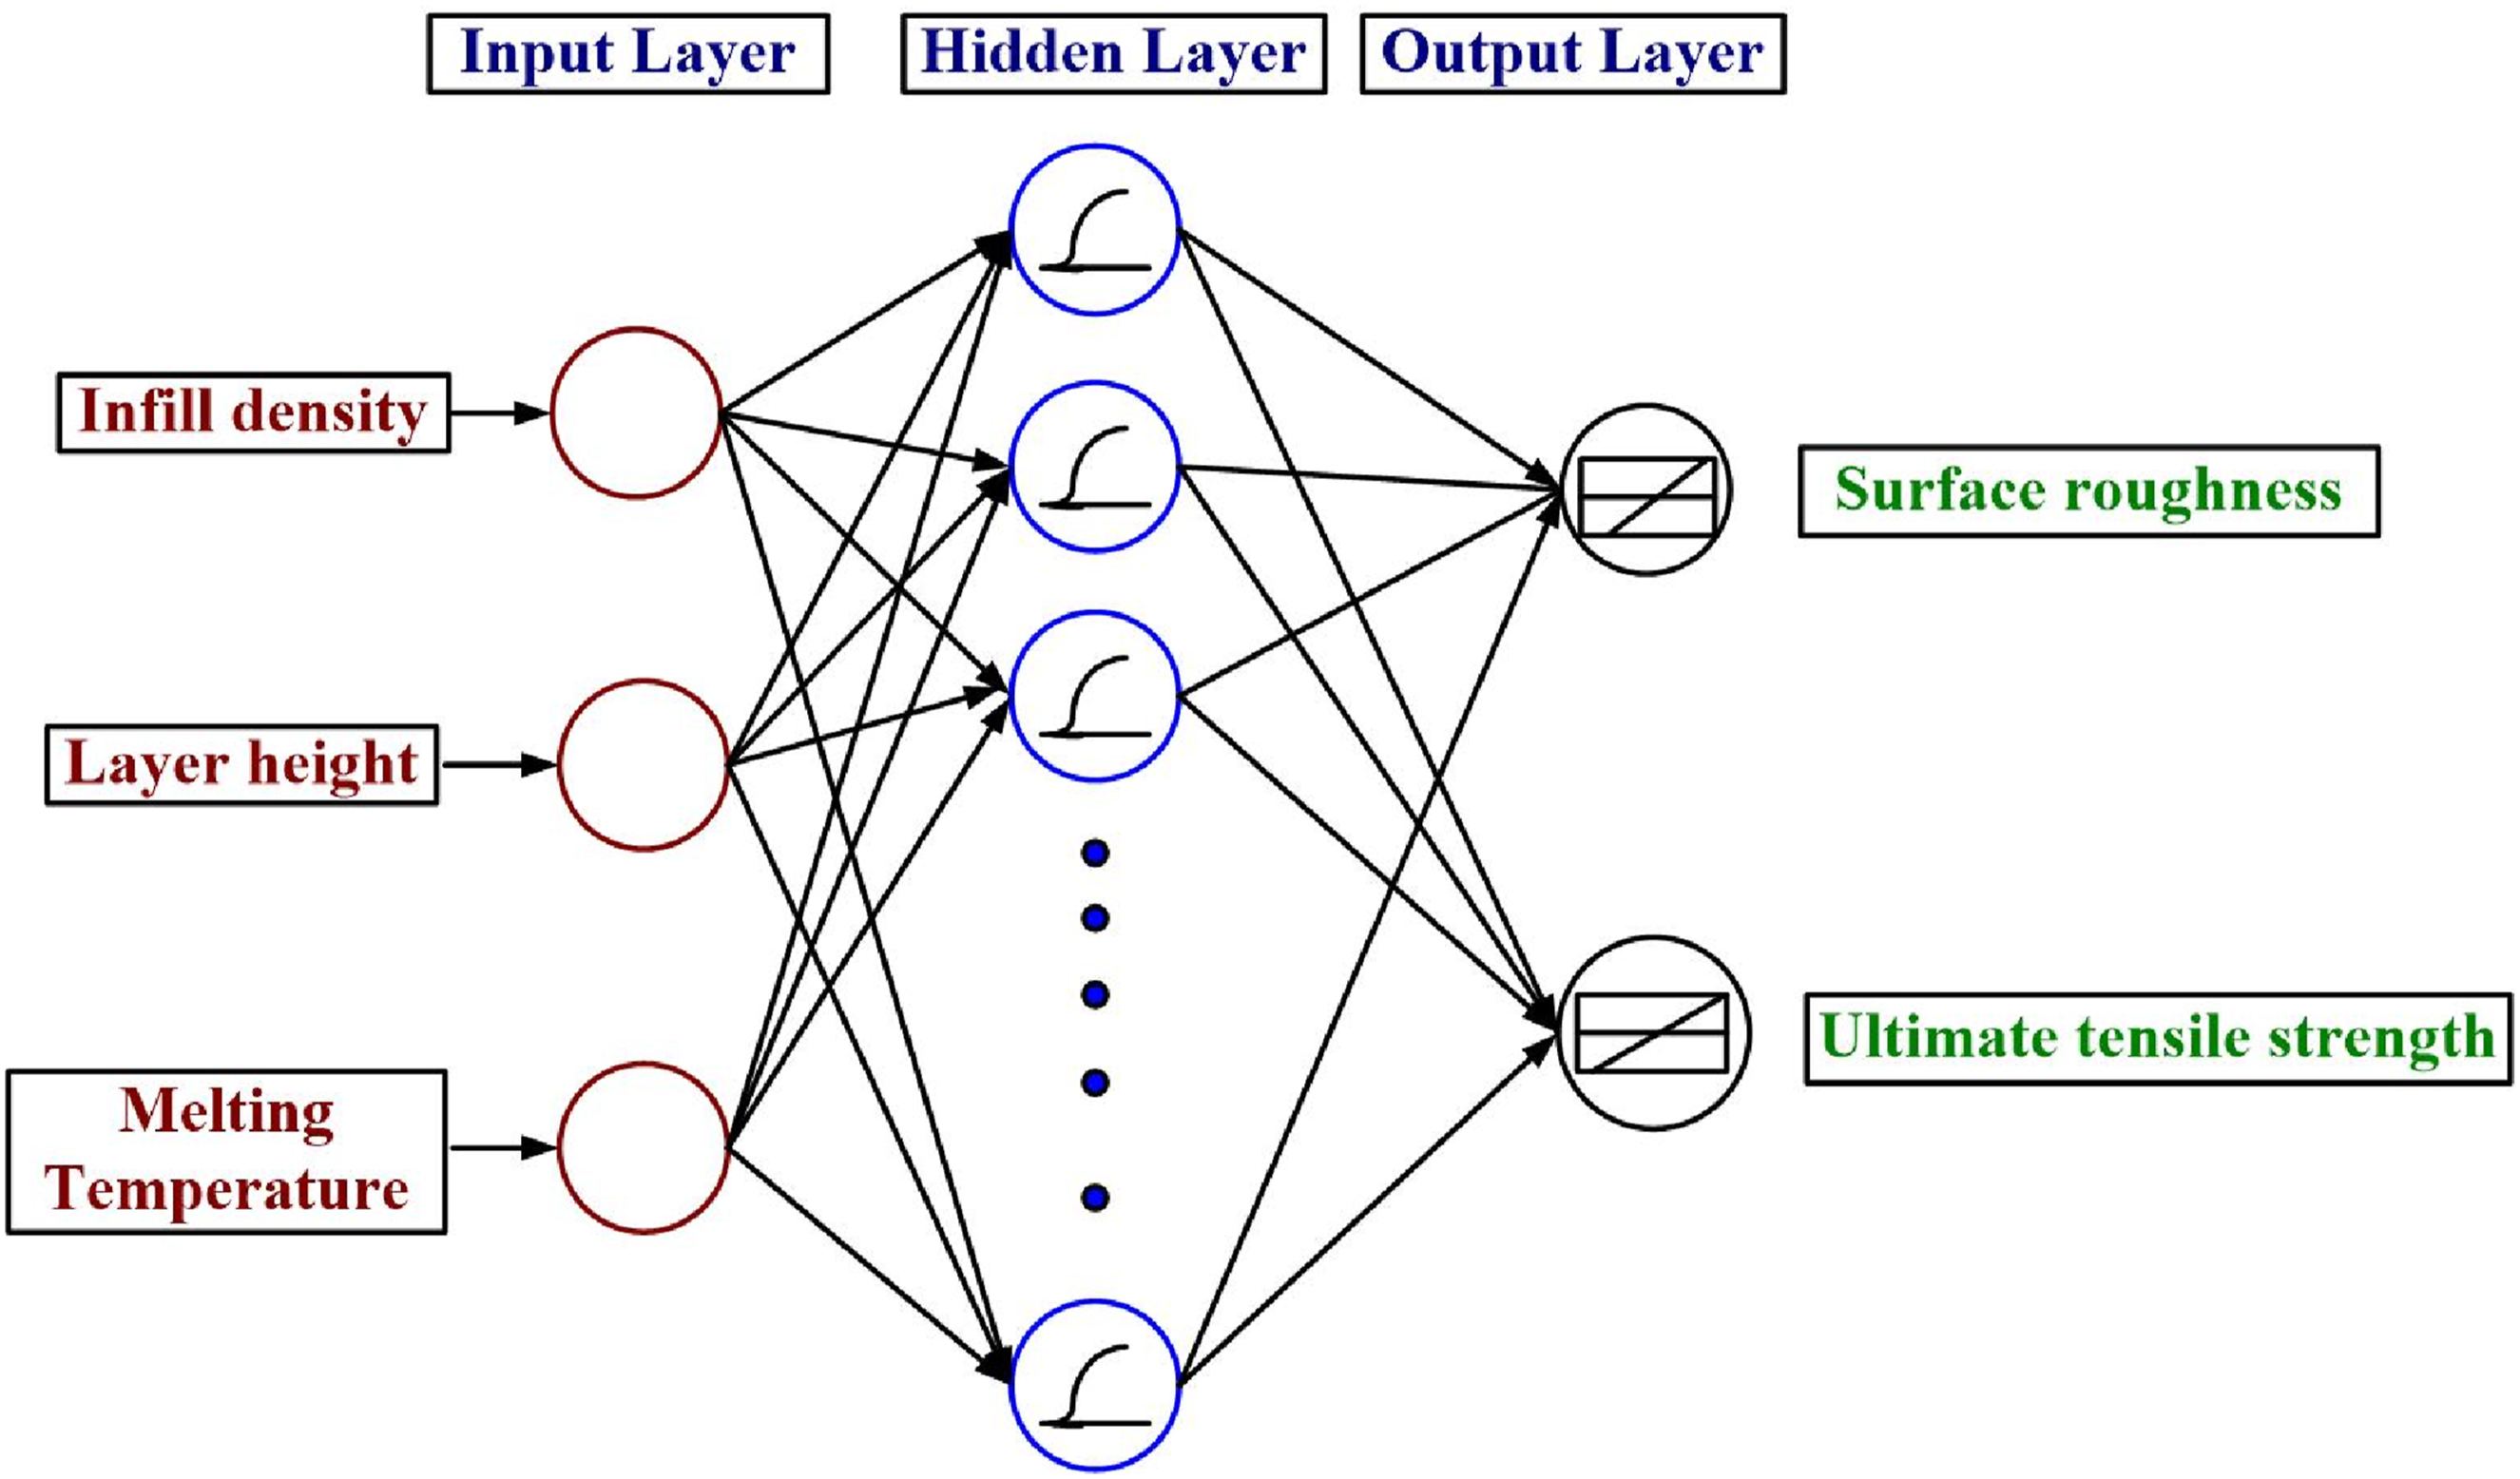
Figure 9 illustrates four plots used to assess the performance of a neural network model in predicting surface roughness (SR). In plot (a), the mean squared error (MSE) is plotted against the number of training epochs. The lowest validation error (0.17,307) is observed at epoch 0, after which the error levels off, suggesting that further training may lead to overfitting. The training set’s regression results are shown in plot (b), where the expected and actual SR values are nearly identical. With a correlation coefficient of R = 0.82,364, the regression line shows a strong relationship and follows the equation Output = 1.1 × Target +0.49. While there is still some deviation from the ideal line, the regression analysis for the test set in plot (c) demonstrates somewhat better performance with a regression equation of Output = 1.1 × Target +0.25 and a higher correlation coefficient of R = 0.93,689. For a thorough analysis, plot (d) integrates training and test data, yielding the equation Output = 1.1 × Target +0.52 and a correlation coefficient of R = 0.8166. Although minor discrepancies in the test results suggest room for improvement to improve generalization, the model generally exhibits dependable predictive accuracy. Performance and regression plots for SR from ANN modelling.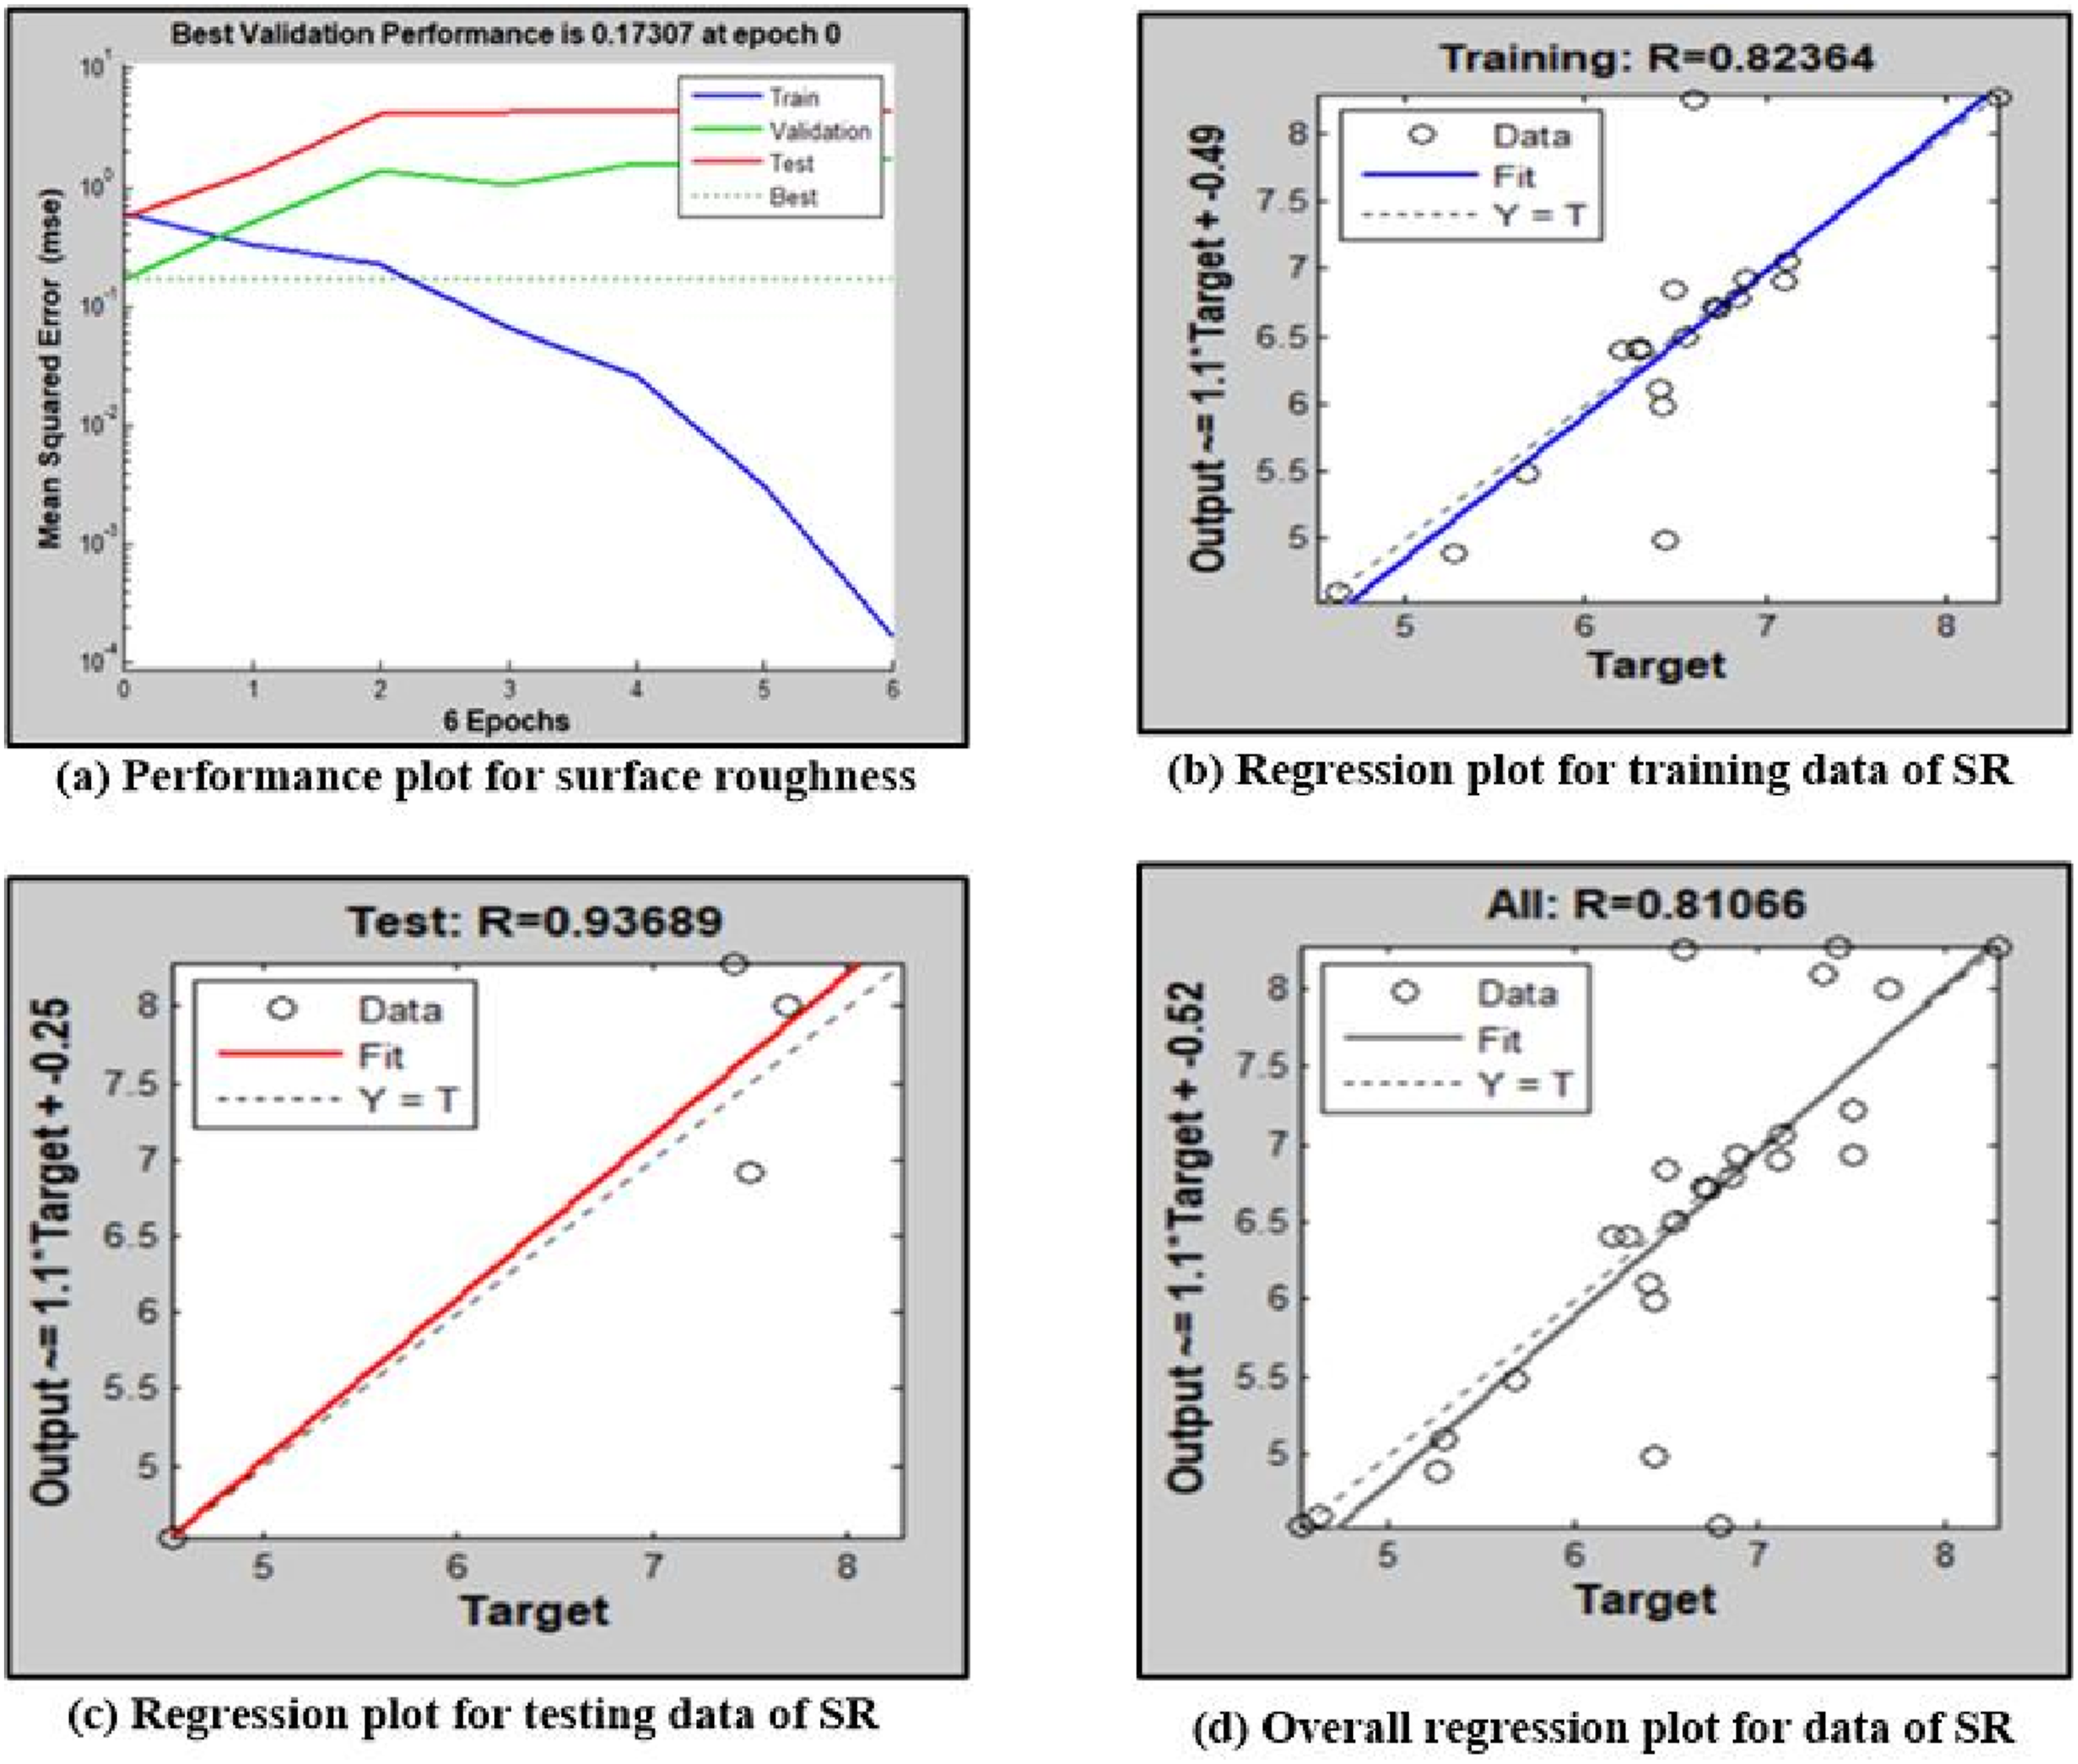
Four plots examining the effectiveness and regression outcomes of an artificial neural network (ANN) model for predicting ultimate tensile strength (UTS) are shown in Figure 10. A performance plot of the mean squared error (MSE) versus the number of epochs is displayed in the first plot (a). Training, validation and test errors decrease drastically during the first epoch and level off thereafter. Epoch 2 has the highest validation score (9.1342) indicating that the model is fast to converge. The expected and actual UTS values of the second plot (b) are strongly correlated (R = 0.94,846) and is also a regression plot of training data. Having predictions that are near the ideal Y = T line, the regression equation Output = 0.84 Target +5 shows that it is a good fit. The third plot (c) illustrates the regression outcomes of the testing dataset based on which the regression equation Output = 0.62 Target +9.8 and R = 0.78,516 show that the correlation is very strong. The model is also useful to unseen data despite the slight difference between the red fit line and the Y = T line. The regression analysis of the entire data (both training and testing) is demonstrated in the fourth plot (d) and its predictive capability of the ANN model is good with R = 0.82,249 and the equation: Output = 0.71 * Target +8.5. ANN can be able to model UTS; this can be confirmed by the high correlation coefficients in all datasets; the deviations are small indicating that the model is accurate. Performance and regression plots for UTS from ANN modeling.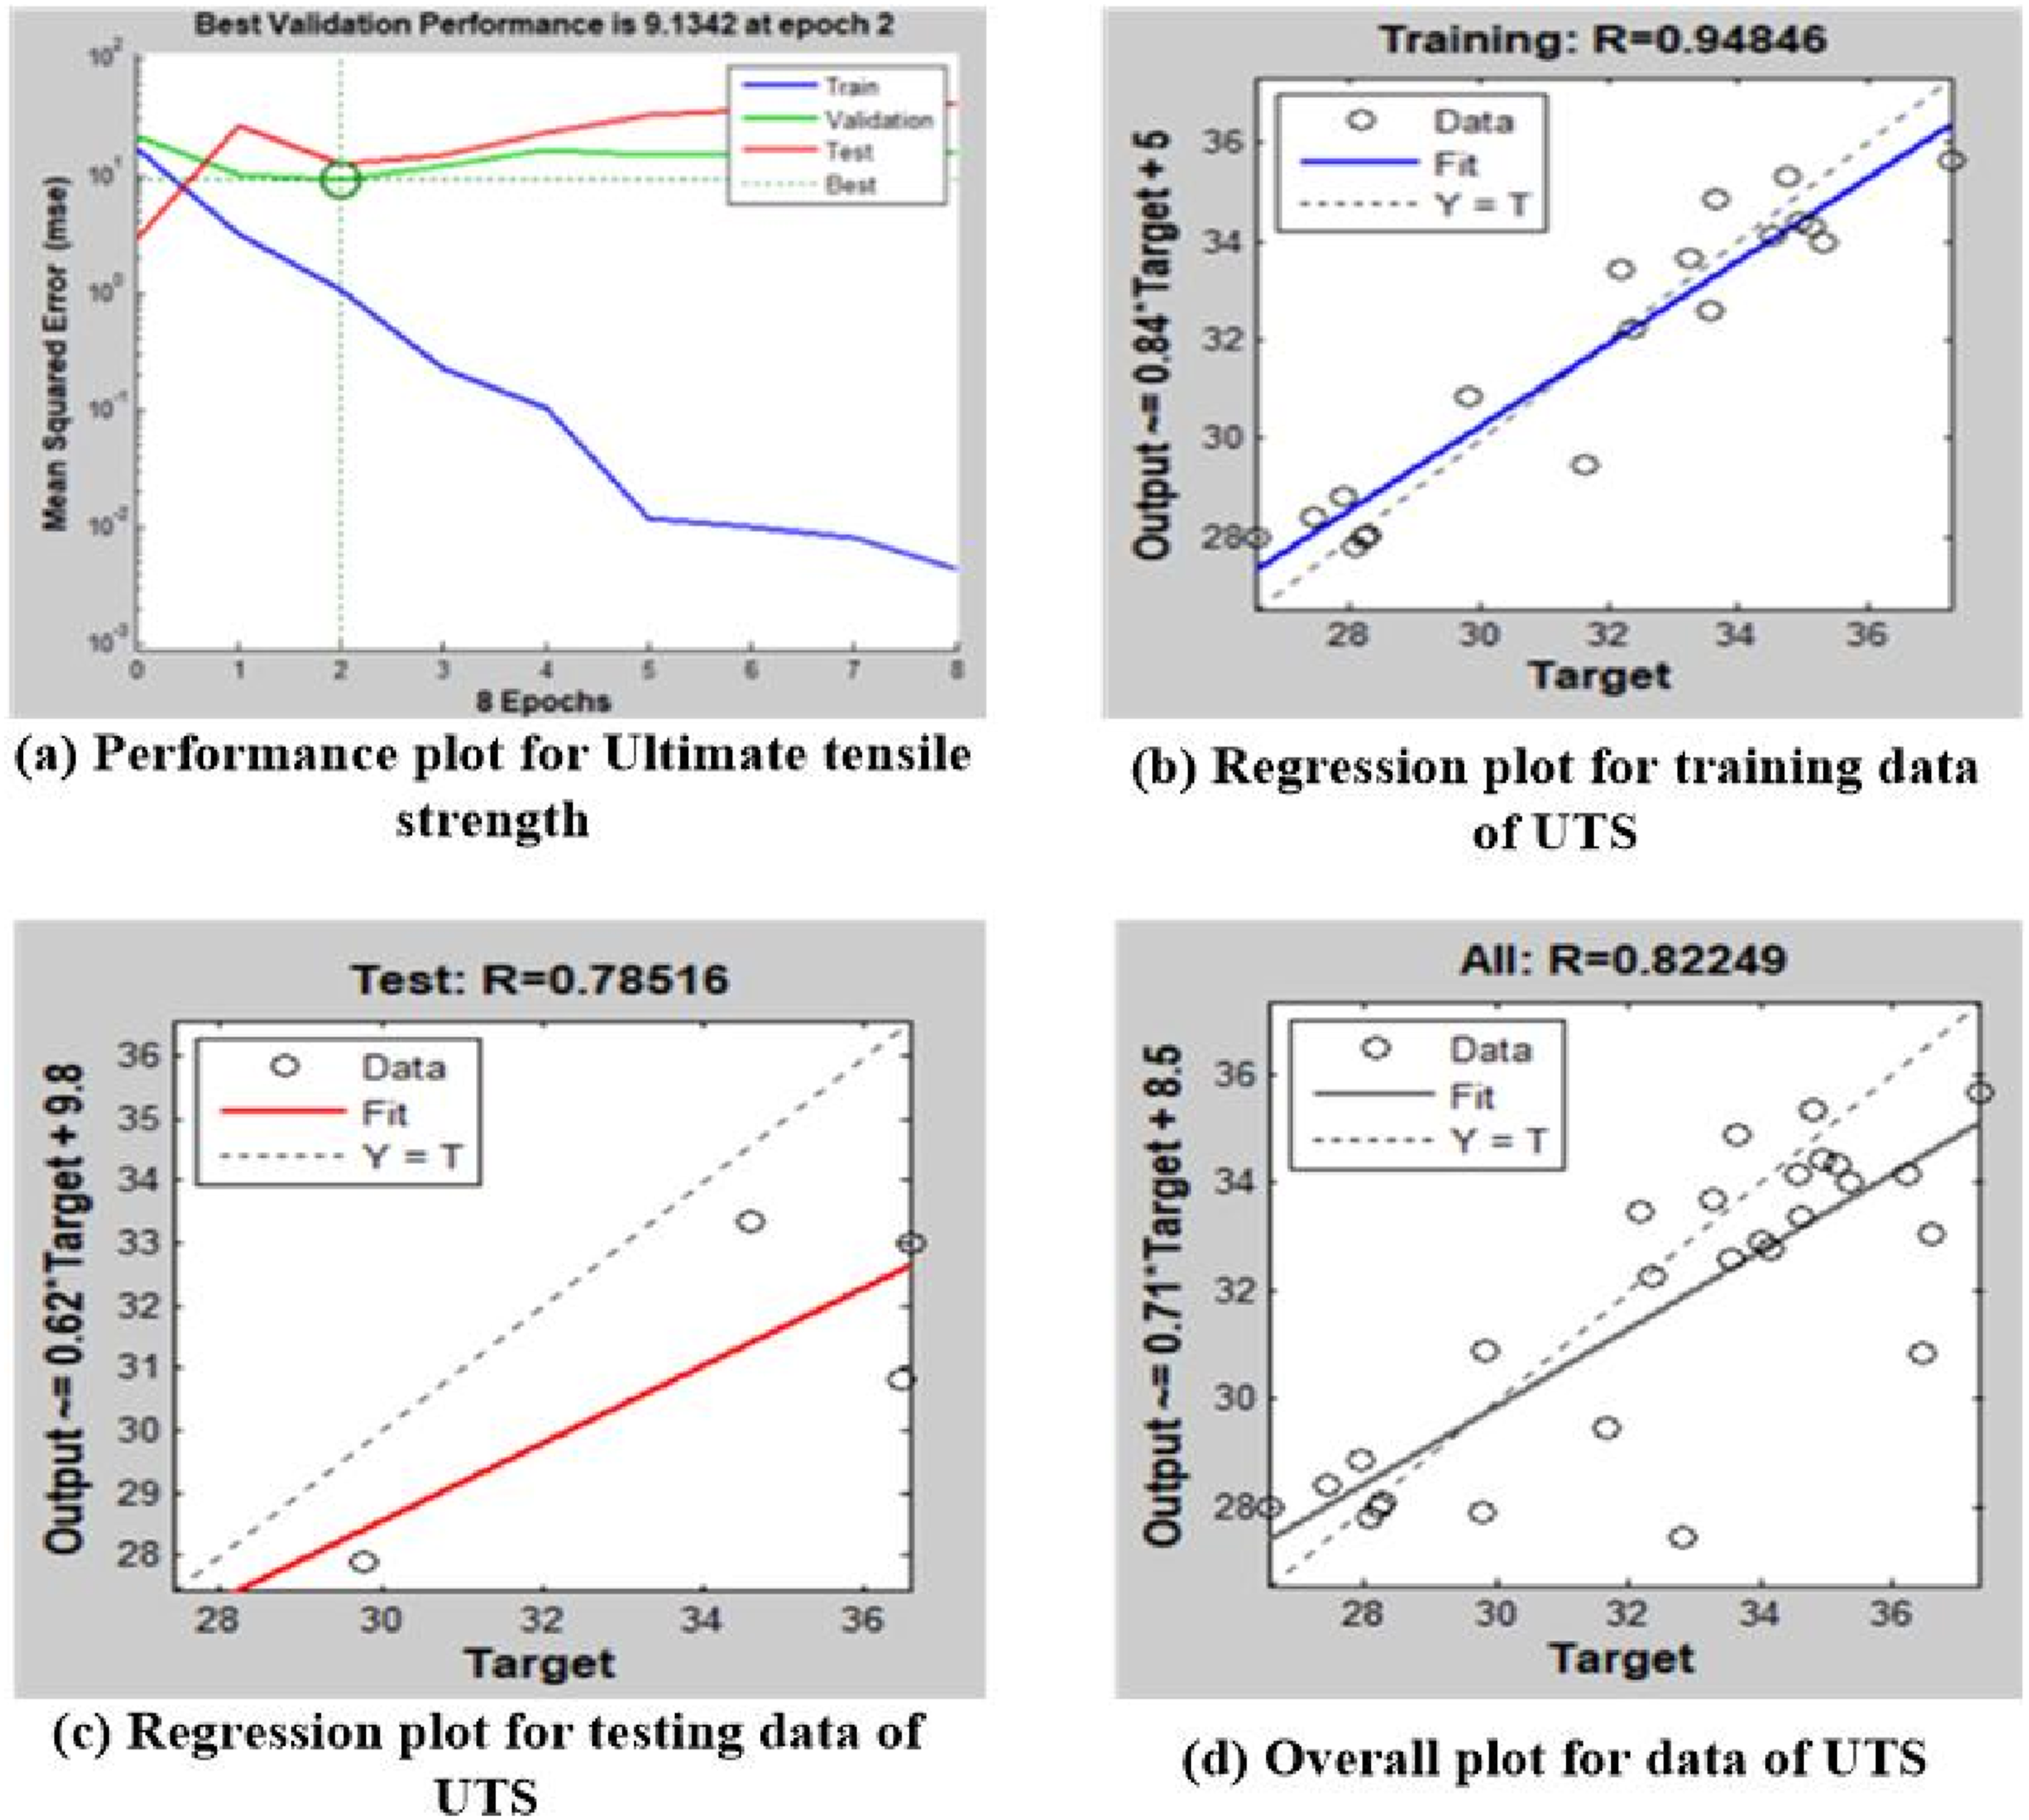
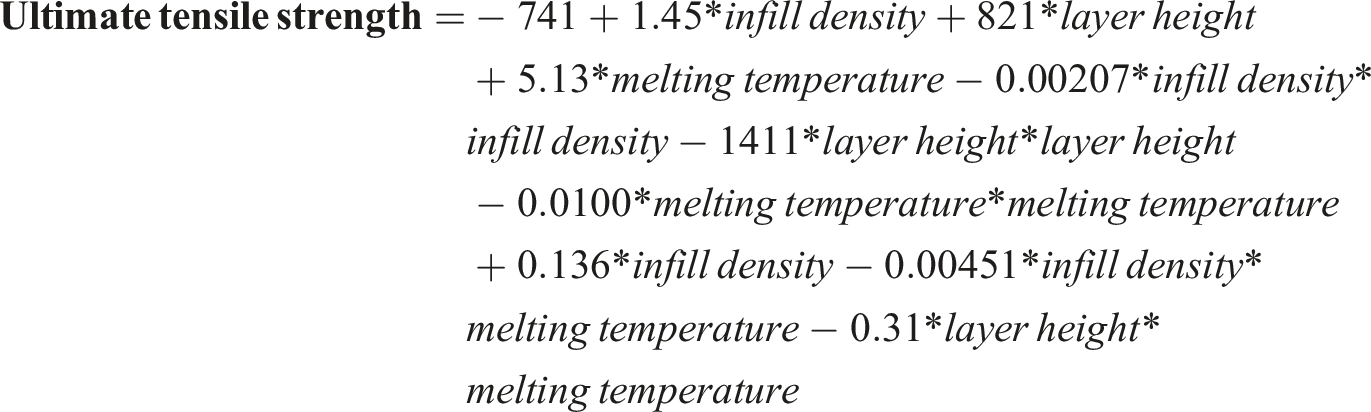
Response surface methodology
Response Surface Methodology (RSM) is a widely used statistical package to construct predictive models based on regression methods. It simplifies the study of interactions among one or more response variables with multiple independent variables, which can be combined to form an entire so-called response surface. This methodology is particularly helpful when analysing and optimizing complex processes due to the opportunity to determine the interaction between variables and predict the way the system will act in various conditions.
45
RSM is very famous in modeling and optimization of processes in various scientific and engineering processes. This paper analyses how four significant process parameters influence the response surface-based statistical model of the performance characteristics of 3D-printed PETG components. The generalized mathematical expression that was used in correlating the process parameters with respective responses is given in equation (2).
The response variable (R) is model using a second-order polynomial equation that incorporates linear, interaction, and quadratic terms, xi is the FDM process parameters. Polynomial form of equation (2) displayed in equation (3).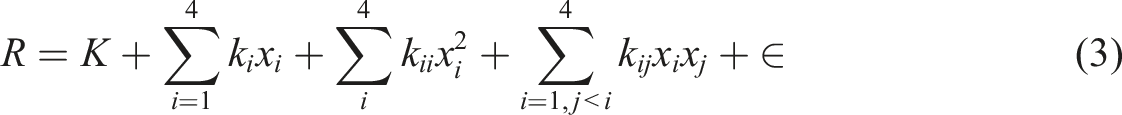


The R2 and adjusted R2 values of the developed mathematical model were calculated to evaluate the level of agreement between the predicted and experimental results. Both values exceed 70%, indicating a high degree of model accuracy and reliability for predictive applications (Figure 11). Regression plot RSM for (a) Surface Roughness, (b) Ultimate tensile strength.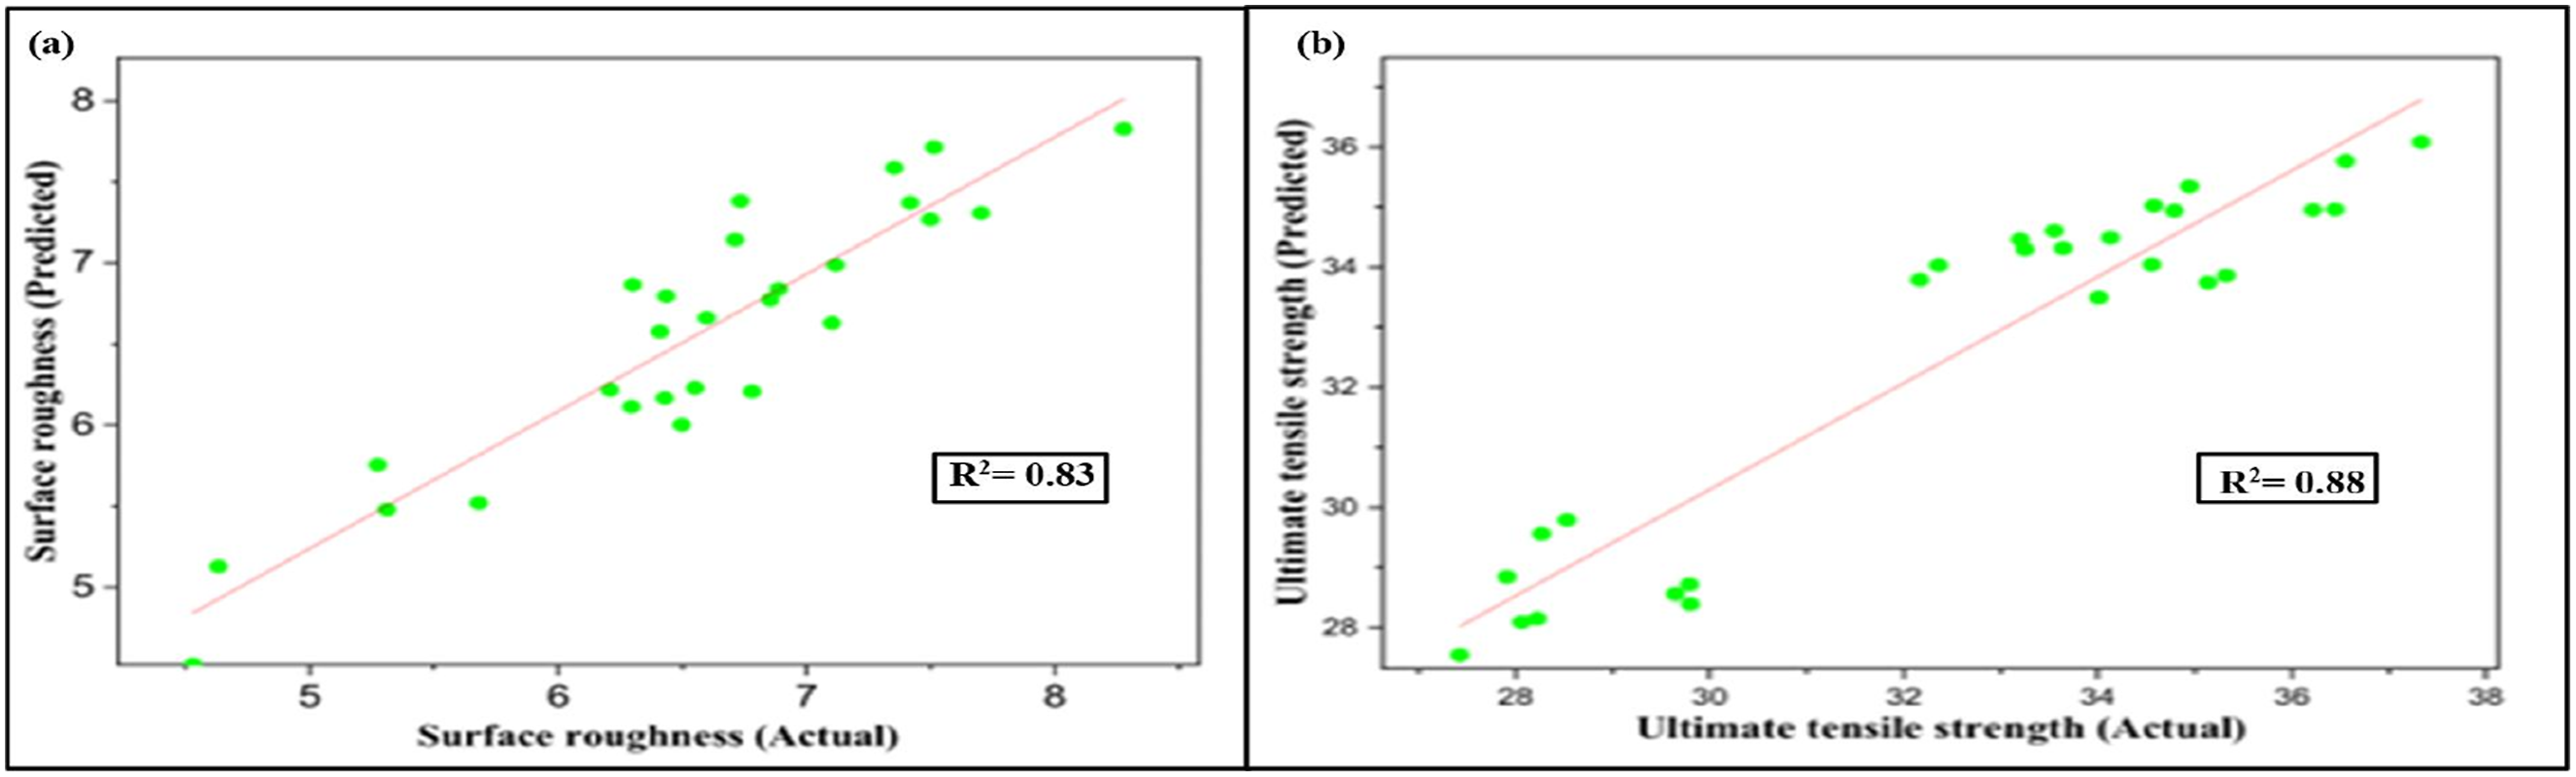
Comparison of actual and predicted responses.
Parametric study
Parametric study using contour and surface plots
Parametric study of surface roughness
Together, the contour and surface plots show how important FDM process variables—namely, melting temperature, layer height, and infill density—affect surface roughness. Surface roughness is reduced at moderate infill densities (roughly 90–95%), lower layer heights (about 0.22–0.25 mm), and optimal melting temperatures, according to the contour plots (Figure 12(a)–(c)). In particular, lower layer heights improve interlayer fusion and lessen the stair-stepping effect, which results in finer surface finishes. Similar to this, a higher melting temperature promotes polymer flow and layer bonding; however, too high of a temperature can result in flaws like material oozing or thermal degradation. Additional information about the relationships between these parameters can be found in the 3D surface plots (Figure 12(d)–(f)). Because of inadequate bonding and more noticeable layer lines, increasing the infill density and layer height while maintaining a constant melting temperature causes increased surface roughness. Raising the melting temperature enhances surface smoothness up to a certain point at a fixed layer height. Moreover, smoother surfaces are obtained at moderate melting temperatures and lower layer heights with constant infill density, highlighting the significance of precisely adjusting thermal and geometric parameters to produce high-quality surface finishes in FDM-printed parts. Contour and surface plot for surface roughness.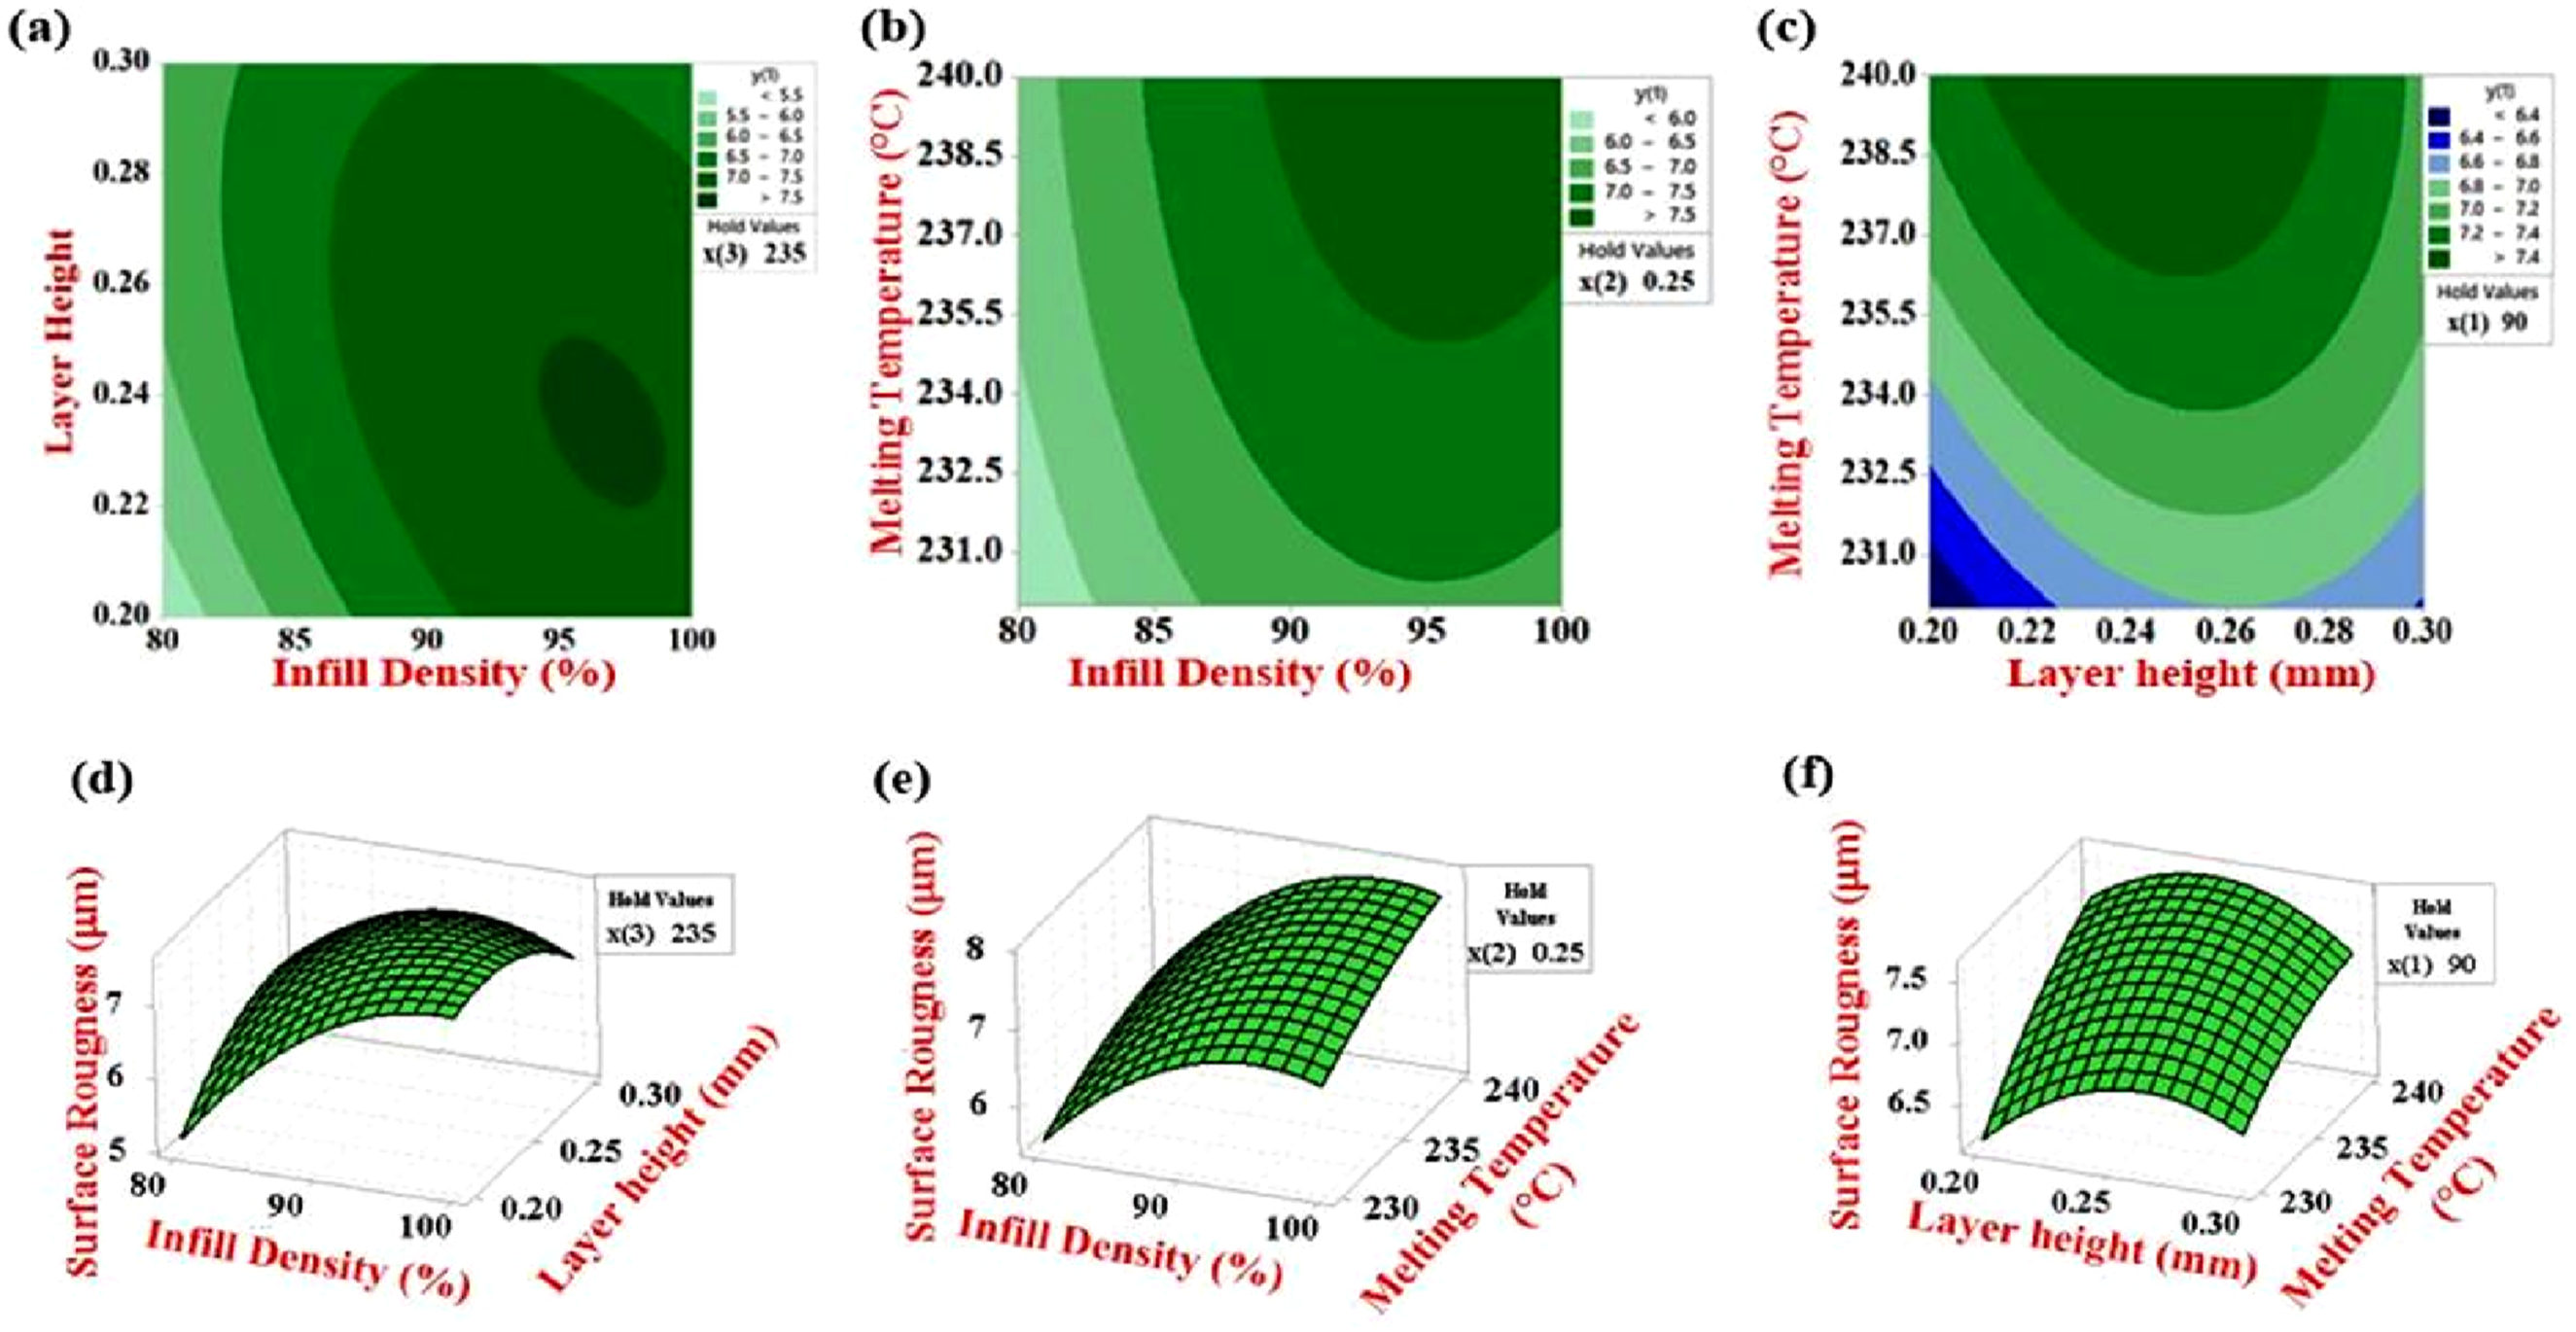
Parametric study of ultimate tensile strength
The intricate surface and outline plots of Figure 13 illustrate the association amid infill density, layer height and melting temperature and 3D printing ultimate tensile strength (UTS). The former plot reveals that with low layer heights and infill density, higher ultimate tensile strength is achieved. Increased infill grades enhance the structural properties of printed components through less formation of internal voids. The second plot relationship states that the maximum value of UTS will be obtained when the melting temperature and infill density have attained the ultimate value. The increased melting temperature enhances interlayer bonding that results in enhanced fusion of the layers. The third graph shows that UTS values increase with the range of layer height of the printer as it warms up to a higher temperature. This tendency is dictated by a higher level of surface finish with the optimal layer heights and high level of interlayer adhesion. On the whole, the findings show that a combination of high infill density, high melting temperature, and a high layer height enhances the mechanical strength of 3D-printed parts significantly. Surface and contour plot for UTS.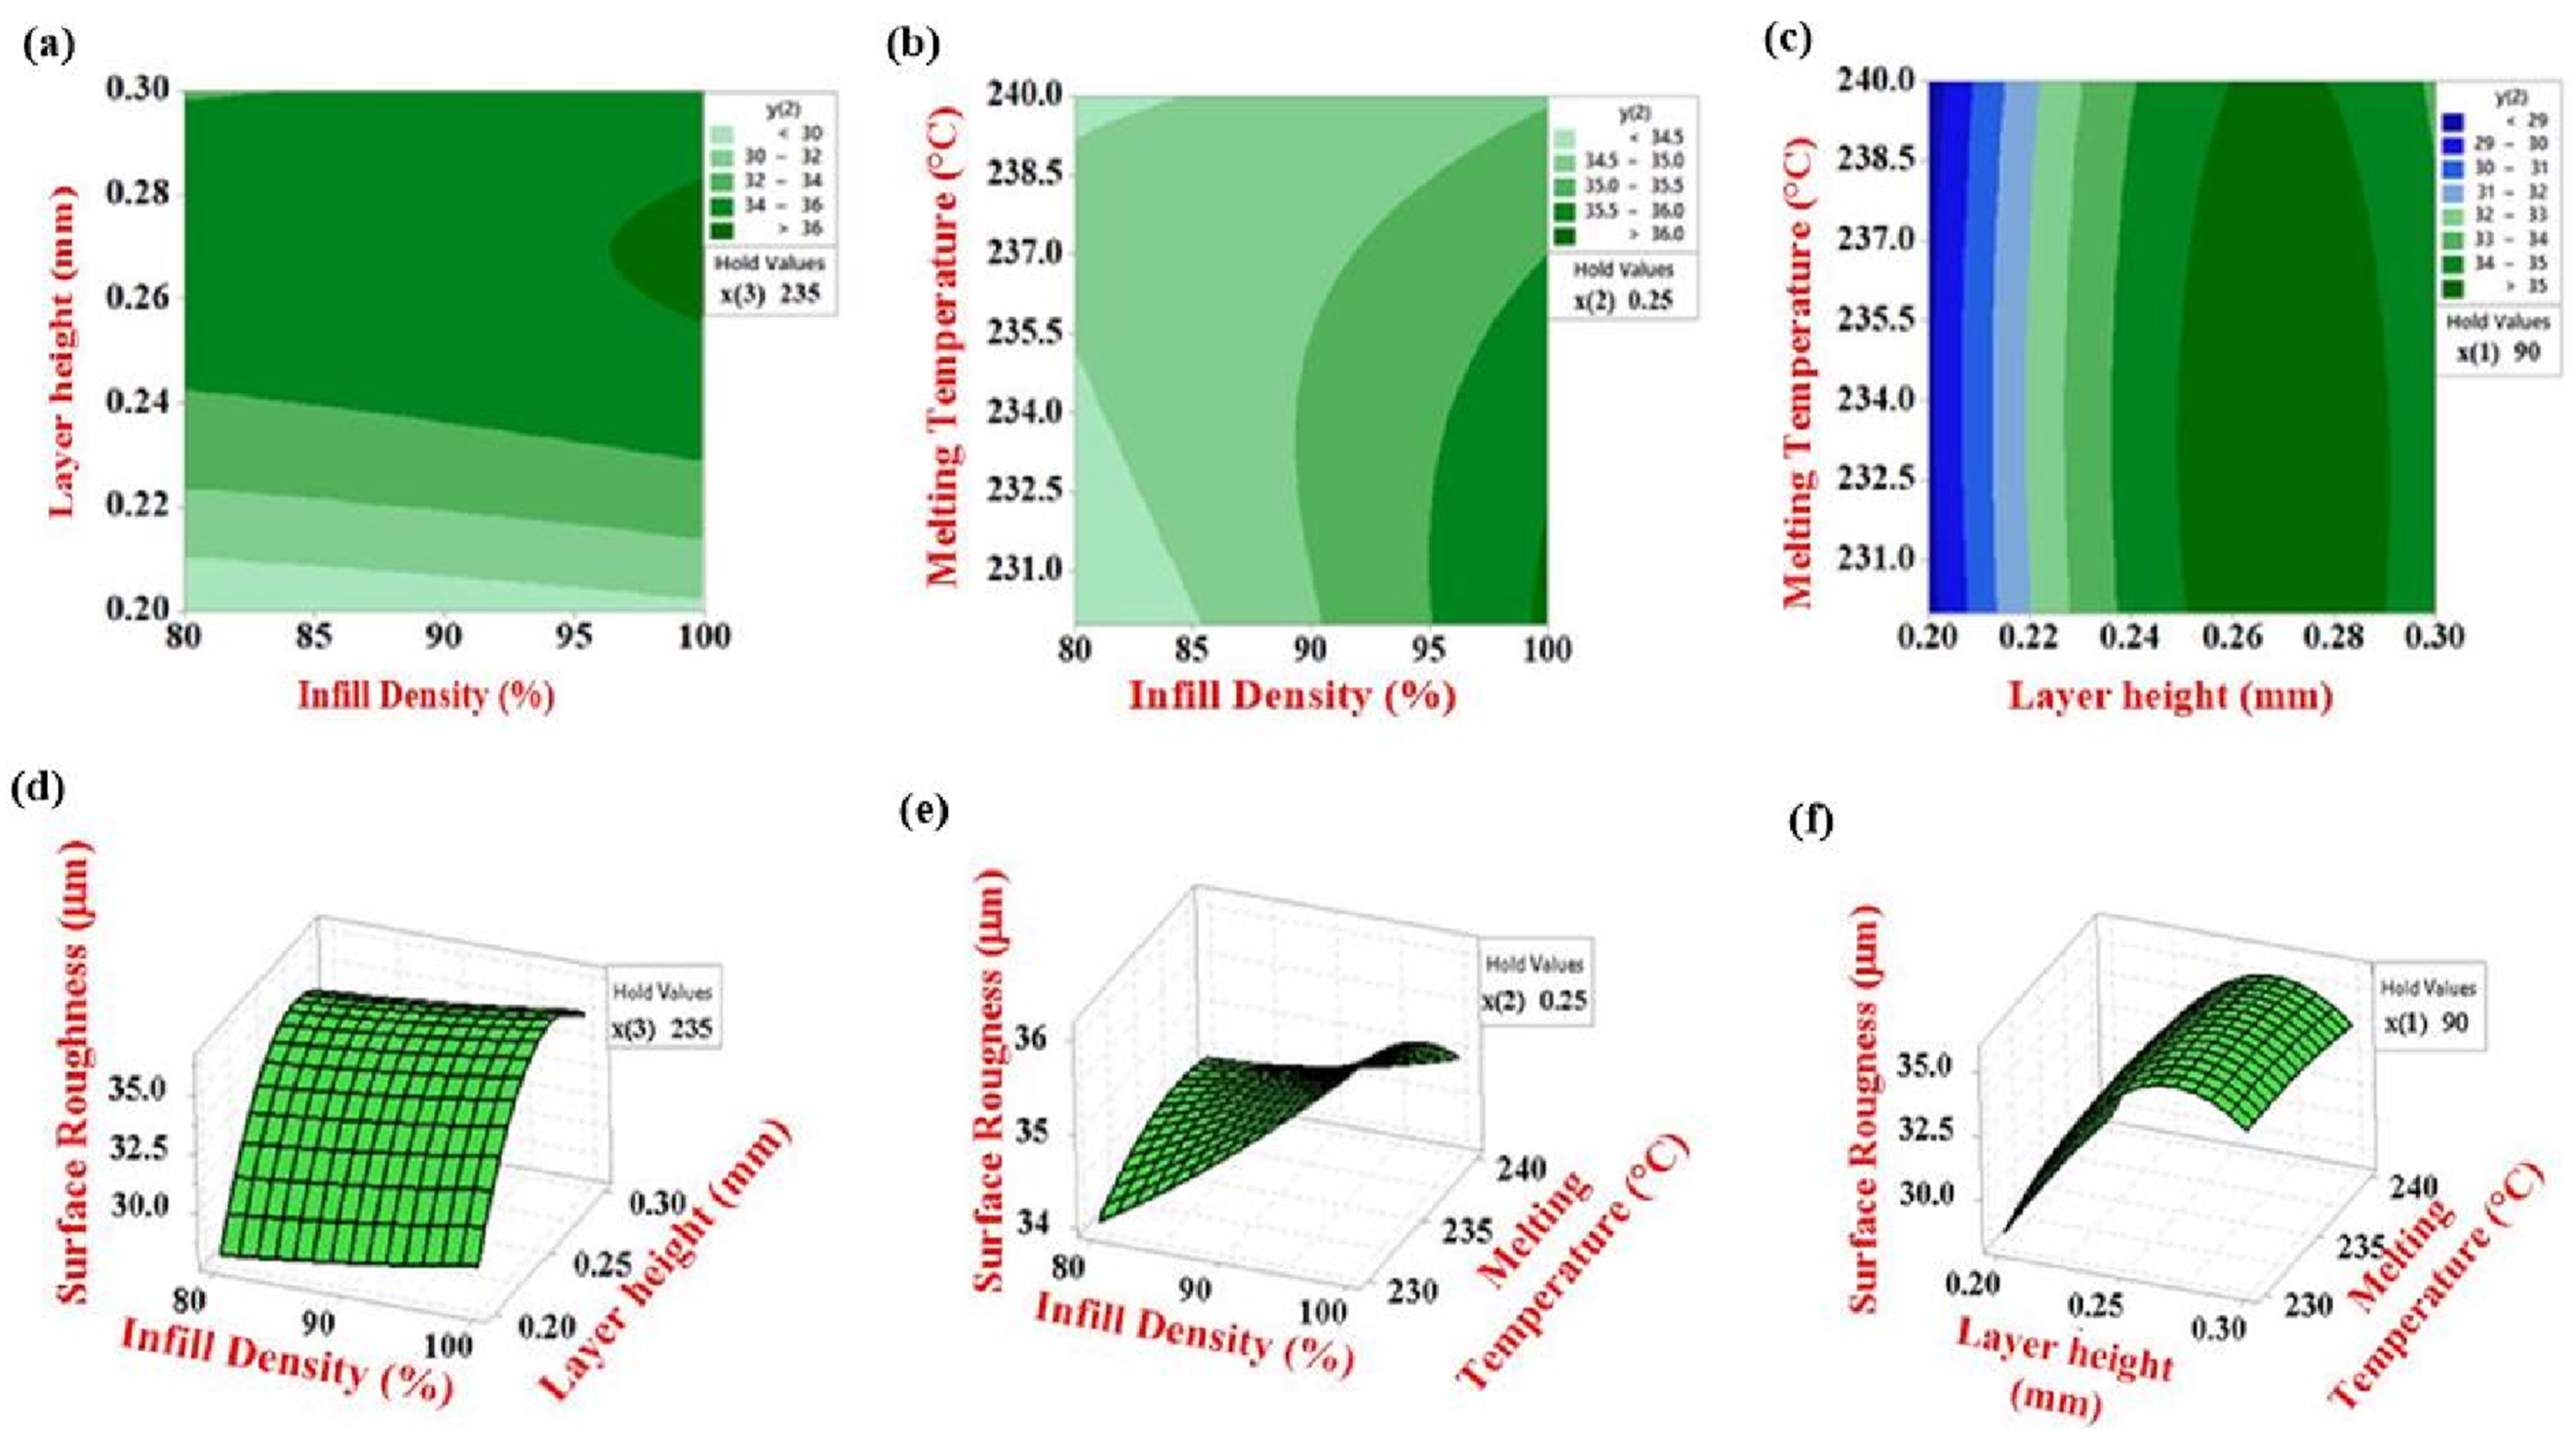
Shapley analysis
The SHAP values presented in Figure 14 provide clear mechanistic insight into how FDM process parameters influence surface morphology and mechanical performance through different physical mechanisms. In the case of surface roughness, the intense dependence of infill density and layer height implies that the formation of surface-topography depends mainly on the attributes of the geometric deposition. His positive SHAP values are connected with increased infill densities and greater layer heights indicating an increase in roughness owing to more pronounced staircase effect, altered bead spreading, and lessened surface consolidation at extrusion. Melting temperature on the other hand exhibits a relatively constrained SHAP distribution, which implies that in the chosen processing conditions, thermal input primarily brings extrusion flow to a halt as opposed to specifying surface texture per se. The most influential parameter is revealed to be layer height in order to obtain the ultimate tensile strength and this parameter is closely associated with the interlayer diffusion and effective bonding area. Higher layer height tends to enhance the strength due to the high level of transfer of load on deposited rasters, but the small layer height infuses more interfaces that can be the source of stress concentrtime. Density of the infill as well positively impacts the tensile properties by reducing the amount of internal voids and enhancing structural continuity and again melting temperature is of secondary importance, indicating that the chosen temperature range provides adequate polymer intertwining. In general, it can be seen that the SHAP outcomes demonstrate that process-structure-property relationship in FDM printing is evident where the geometric parameters mainly define mechanical integrity and surface quality and the higher level between the thermal parameters optimize bonding efficiency. These results also suggest that there are certain trade-offs that need to be struck with and found in the process of multi-objective optimization of additively manufactured components. SHAP analysis showing parameter influence on FDM properties.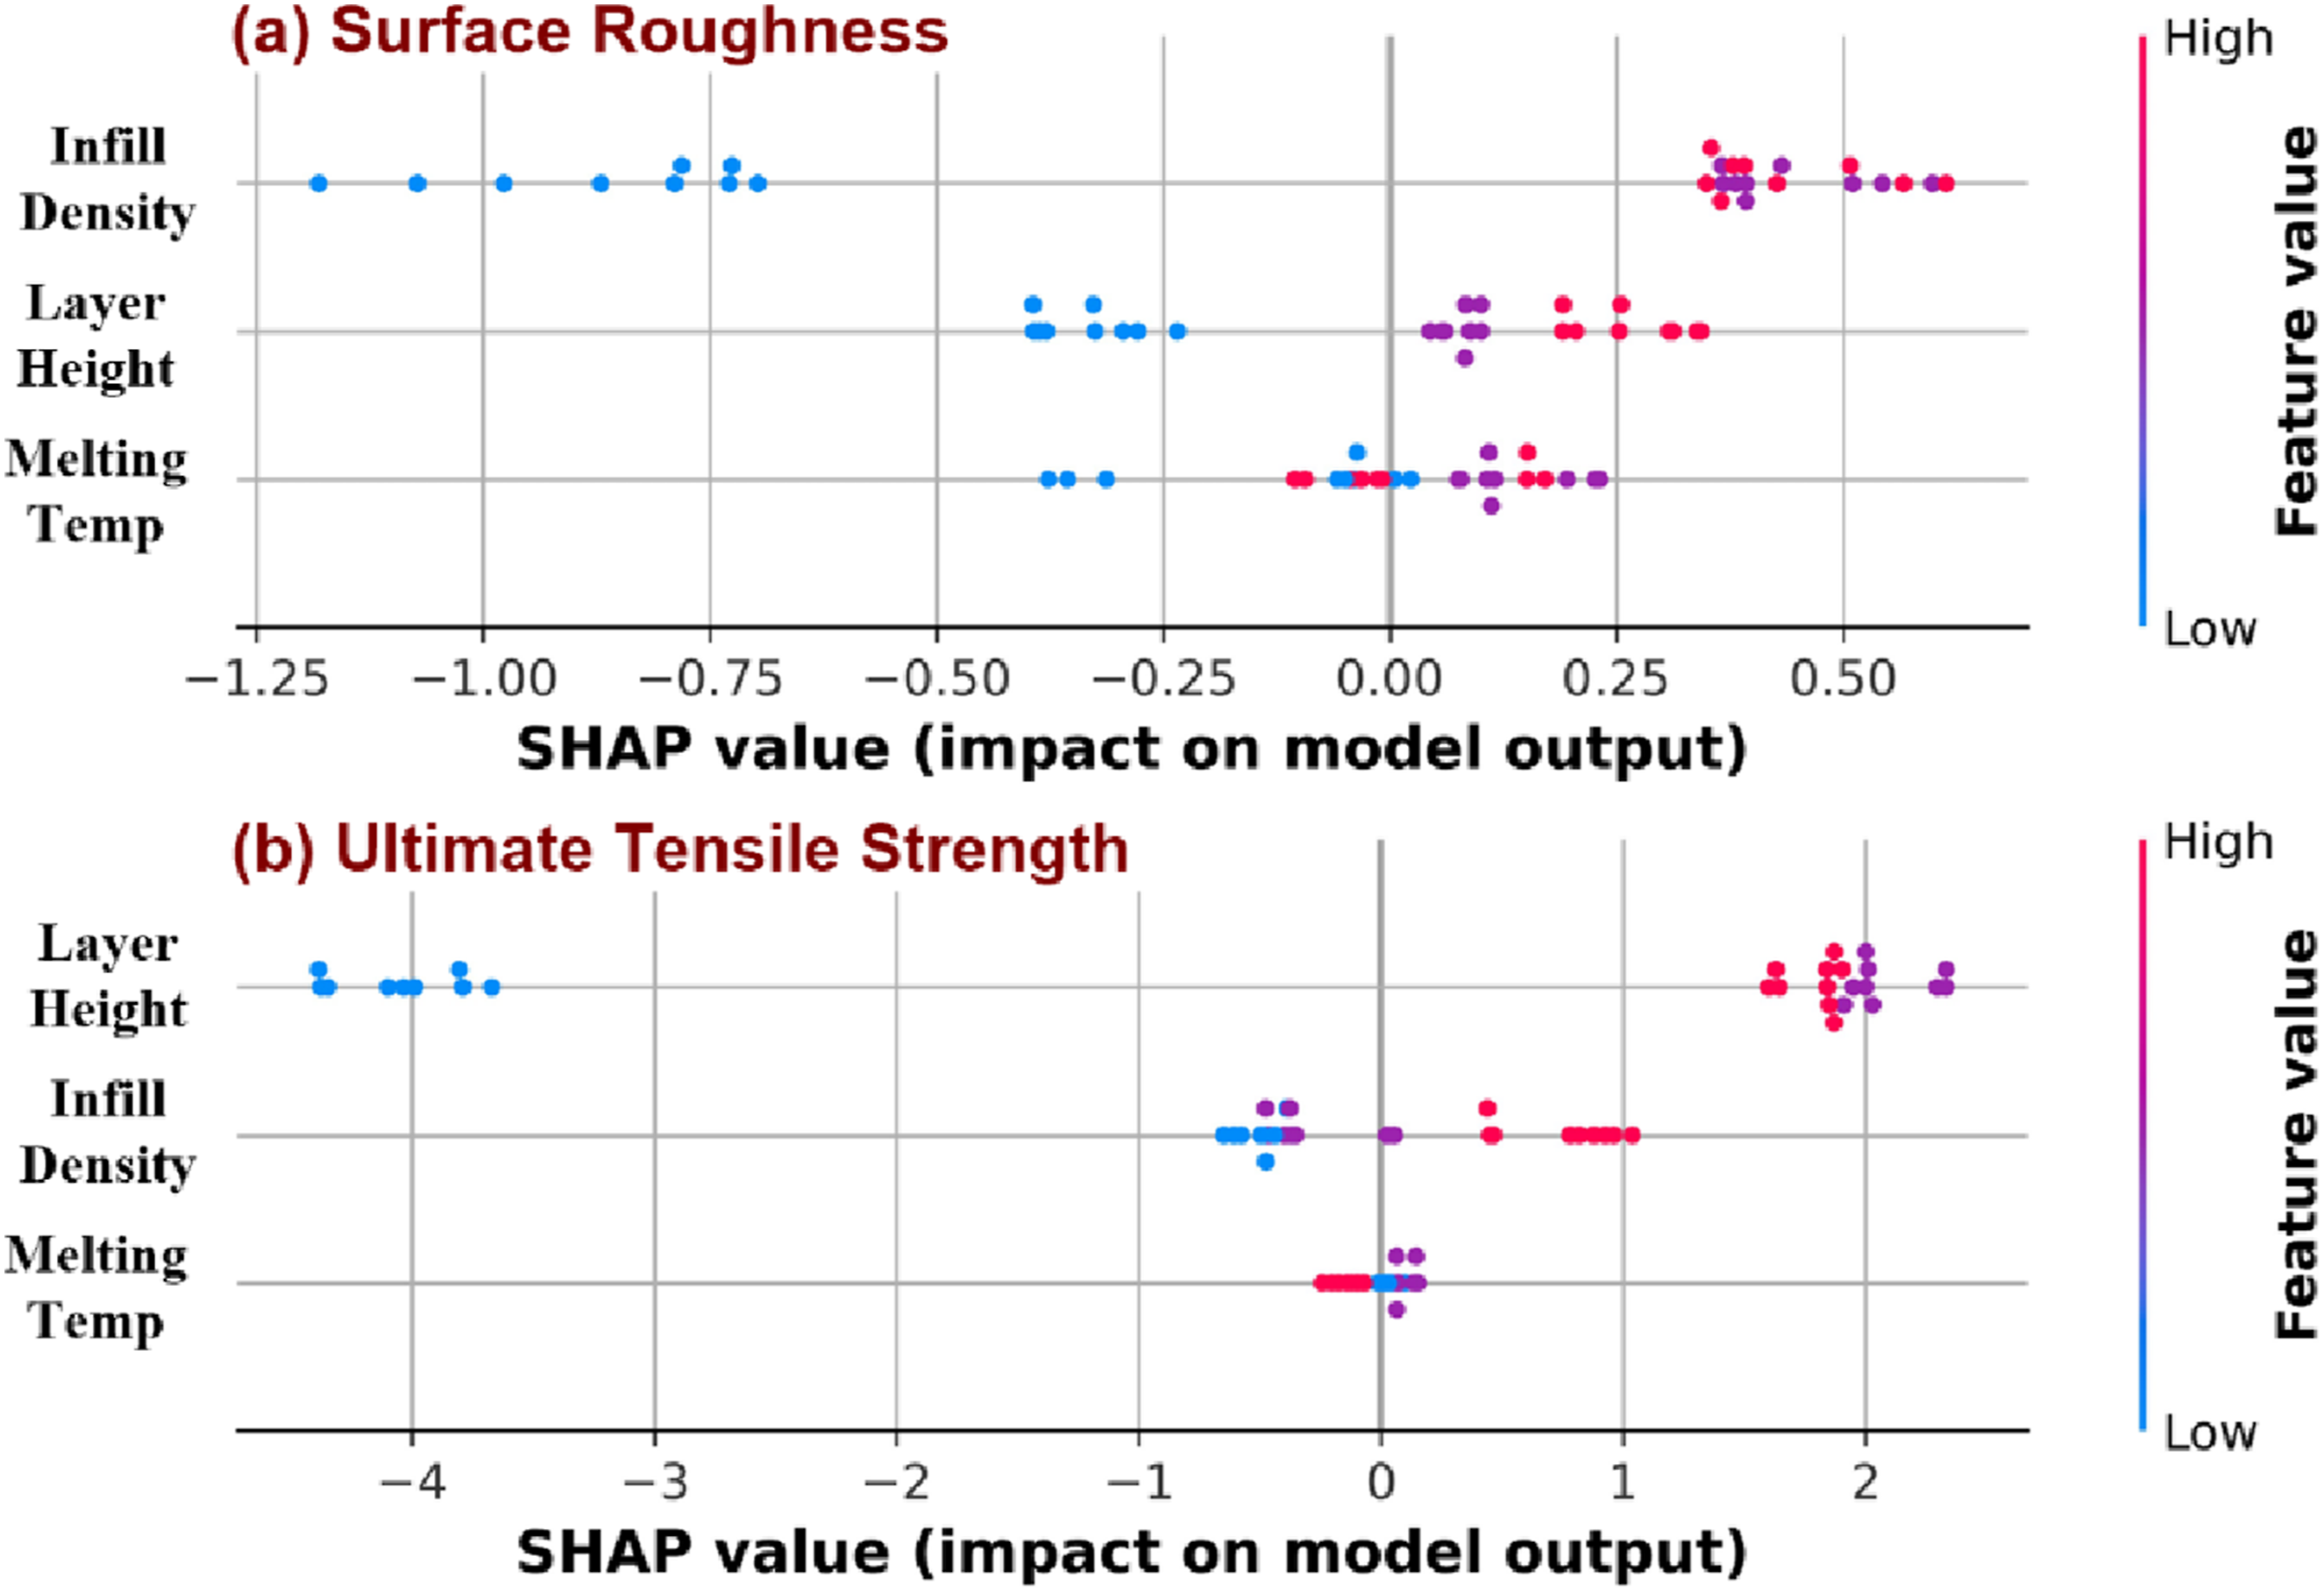
Multi objective optimization using genetic algorithm (GA)
Genetic algorithms (GA) are inspired by the concepts of natural evolution particularly the theory of survival of the fittest.
46
A single form, the Non-dominated Sorting Genetic Algorithm (NSGA) has been shown to be effective in finding global optima in complex, multi-variable search spaces, in particular those affected by evolutionary effects.
47
The constraints of the melting temperature (230-240 degC), the layer height (0.2-0.3 mm), and the infill density (80-100%) are constraints of the optimization problem in this case. GA works by iteratively improving a population of possible solutions, mimicking the process of natural selection. A fitness function is used to evaluate these solutions, which are encoded as chromosomes. Lower-performing individuals are eliminated, while high-performing solutions are chosen and recombined using genetic operators like crossover, mutation, and selection to create the next generation.
48
Until an ideal or well-fitting solution is found, this cycle is repeated. The work flow of genetic algorithm is depicted in the Figure 15 below. Workflow of GA.
Optimum process parameter setting for required responses in industrial application.
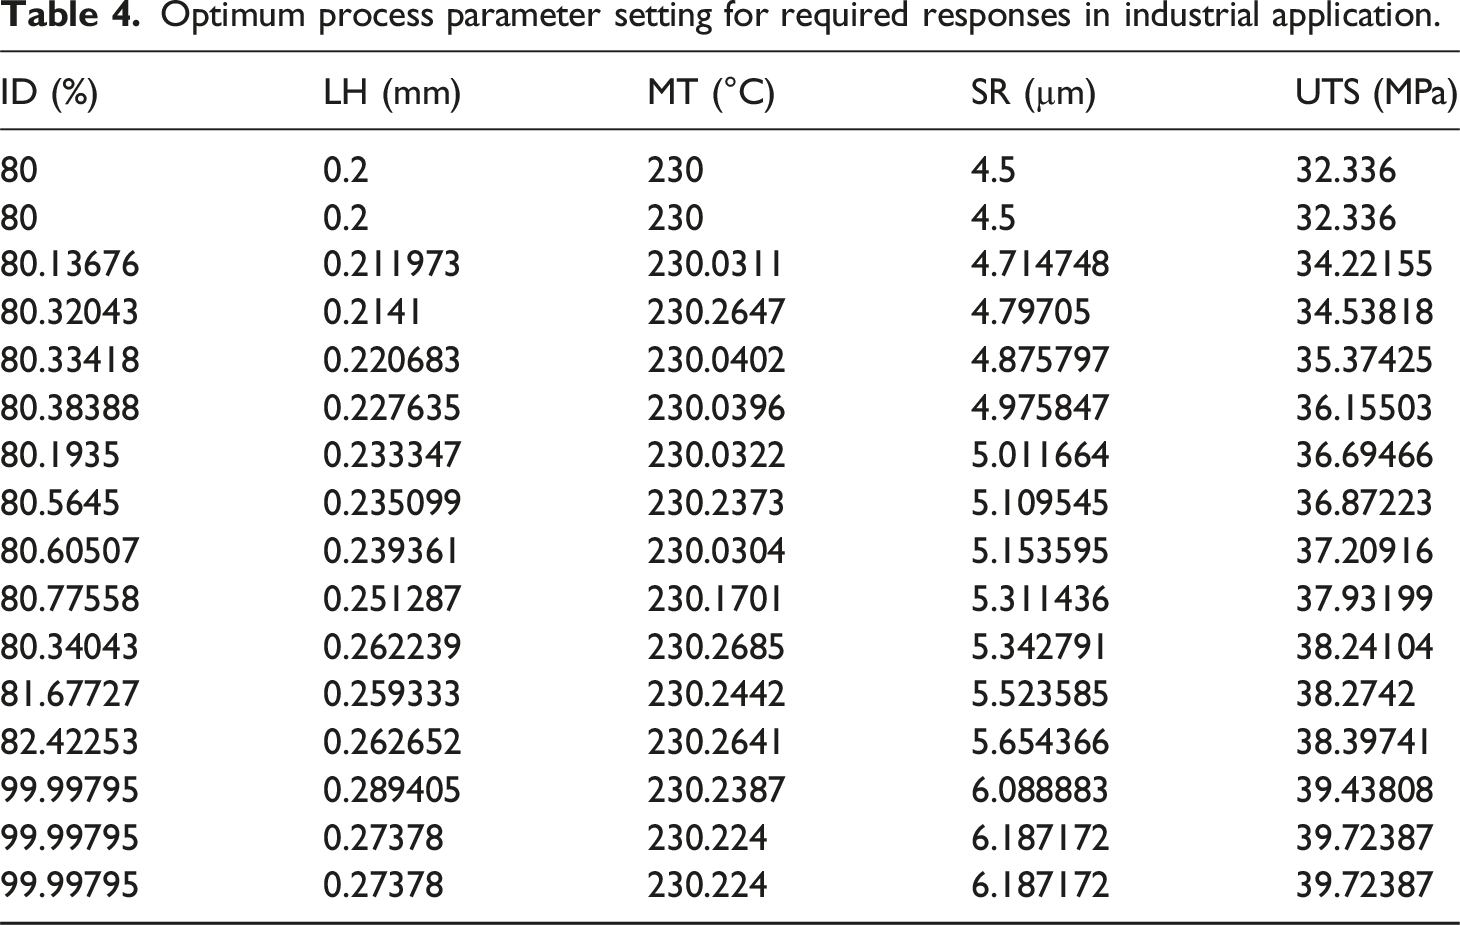
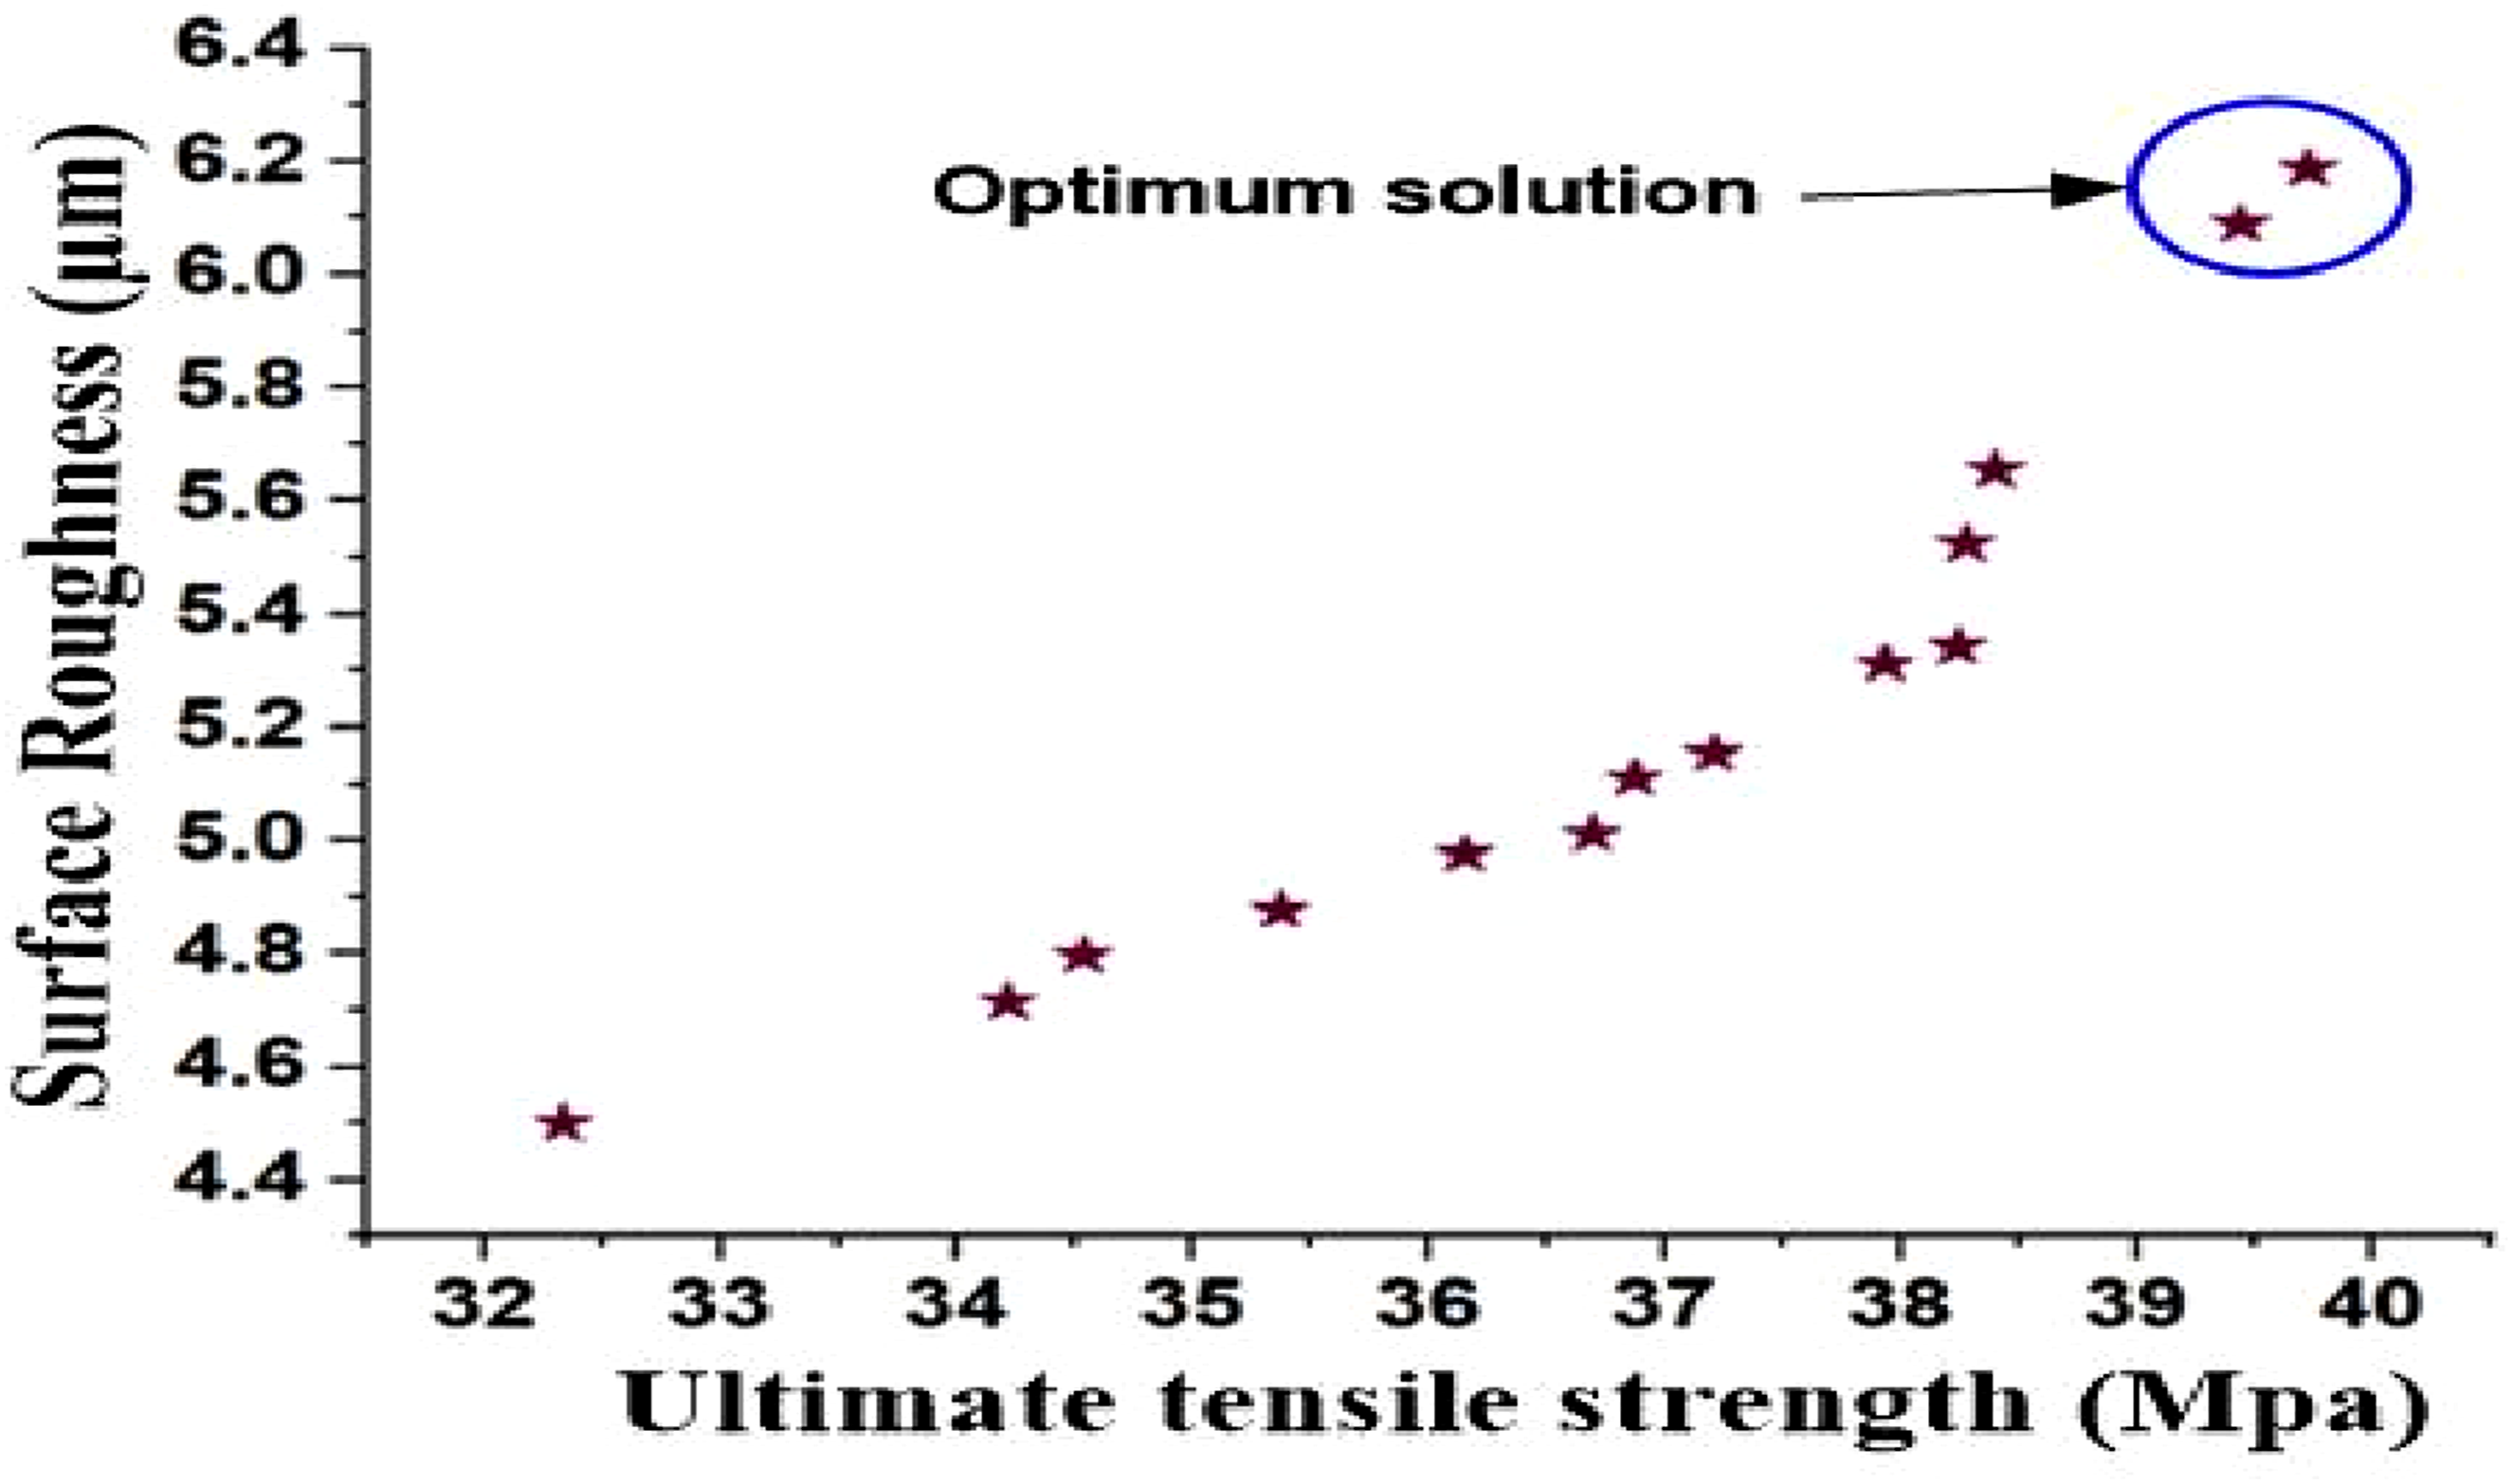
Pareto optimal solution.
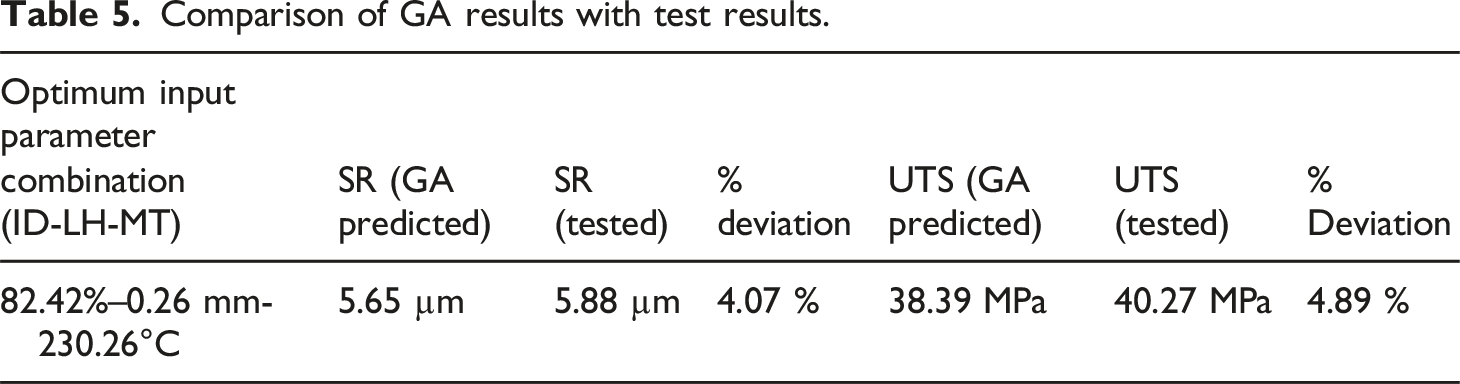
Comparison of GA results with test results.
Even at 100% infill density, it is not possible for FDM-printed parts to attain theoretical density levels comparable to injection-molded polymers due to the presence of inter-filamentary porosities, incomplete fusion between adjacent layers, and interface boundaries between adjacent rasters. The tensile strength of injection-molded PETG is generally in the range of 40–60 MPa 1 due to high-pressure compaction of the material, which ensures a nearly pore-free structure. The maximum tensile strength obtained in the present study (≈38 MPa) represents 70–80% of the tensile strength of fully dense molded PETG. This is due to the presence of porosities and imperfect fusion between adjacent layers characteristic of the material extrusion process. The obtained strength levels, however, suggest a high level of structural efficiency for FDM-printed PETG components.
Microstructural analysis
The differences in mechanical strength between the two PETG samples are directly related to the process parameter-dependent polymer welding behavior, as is obvious from the SEM micrographs. Although both samples were printed at 230°C, the high-strength sample in Figure 17(a) (100 % infill density, 0.25 mm layer height) has a dense, homogeneous structure with very few voids and well-melded interlayer regions, while the low-strength sample in Figure 17(b) (80 % infill density, 0.2 mm layer height) has a highly porous structure with very little filament coalescence and well-defined interlayer boundaries. These microstructural differences are directly related to the optimized mechanical properties. The higher infill density leads to a greater contact area between the filaments, and the increased layer height leads to a greater thermal mass, which allows the interfacial temperature to stay above the glass transition temperature (Tg ≈ 80°C) for a longer time. In such a case, the SEM micrographs depict a flatter neck development and reduced content void in between the beads which is an indicator of enhanced molecular diffusion and reptation across the interfaces. Variability in results obtained from measuring tensile strength is also consistent with the heterogeneous nature of FDM-printed polymers. It is also important to note that even though all the specimens were printed under the same conditions, variations may still be present owing to local variations in fusion of the beads, porosity of materials, and rate of cooling. The addition of repeat results and standard deviation values gives a more realistic view of the mechanical properties of FDM-printed PETG materials. (a) SEM image for sample 22, (b) SEM image for sample 1.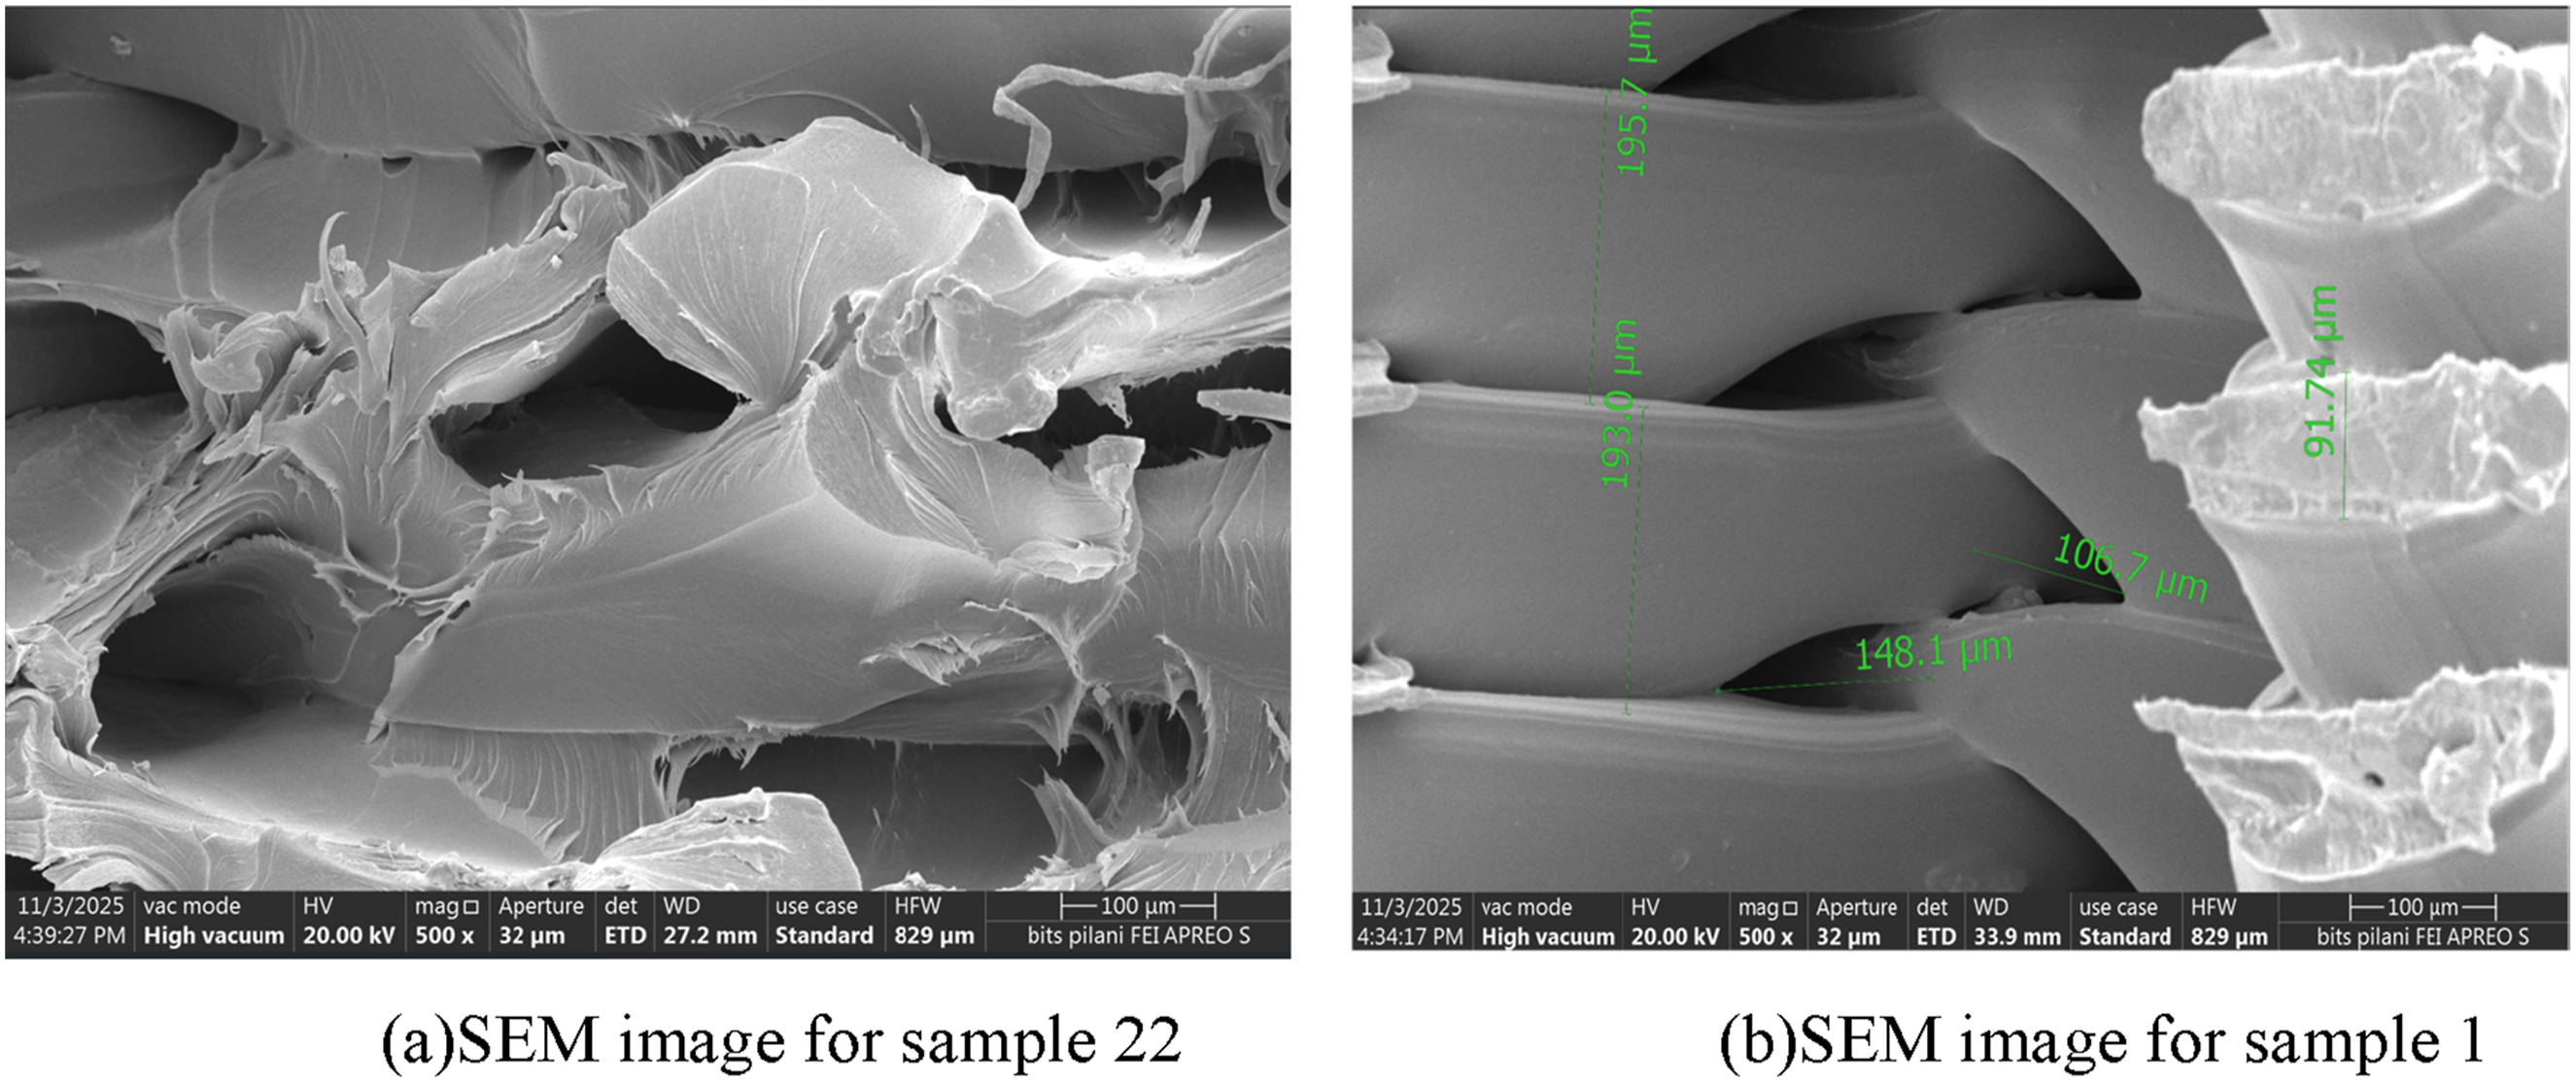
On the other hand, the low-strength specimen exhibits thermally arrested bonding. The reduced infill density translates to high programmed voids and lower interlayer contact, and the smaller layer height promotes faster cooling rates, thereby restricting the welding time needed for adequate chain interpenetration. SEM analysis shows the retention of filament boundaries and unheated circular bead patterns, which serve as stress concentrators and trigger early interlayer failure. The lack of full coalescence indicates that bonding is primarily mediated by secondary forces rather than molecular entanglement, thereby explaining the brittle fracture response and lower tensile strength. Therefore, the SEM results offer conclusive microstructural confirmation that optimized infill density and layer height combinations enhance thermal diffusion, void removal, and interlayer bonding, and consequently, mechanical properties. In conclusion, the findings clearly illustrate the existence of a structure-property relationship in FDM-printed PETG, where superior thermal history enhances interfacial healing and ductile fracture properties, while suboptimal thermal exposure results in porous structures and mechanically inferior parts. These SEM results further confirm the micromechanical reasoning that lower porosity and improved coalescence of filaments improve the effective load-carrying capacity of the material, which in turn increases the tensile strength of printed specimens.
Conclusion
The work is distinguished by the effective integration of statistical modeling and machine learning to forecast and enhance the mechanical behavior of PETG components that are FDM-printed. With an R2 value of 0.94 for training and 0.83 for testing, the RFR model was the only manufactured model with the highest predictive accuracy, demonstrating its applicability in dealing with nonlinear and multi-parametric relationships. The ANN model also proved to be a reliable tool with an average prediction error of less than 5%, which confirms the complex interrelationships between the process parameters which can be captured by the ANN model. Multi-objective optimization of ultimate tensile strength (UTS) and surface roughness (Ra) was performed using a Genetic Algorithm (GA), which established the optimum conditions of 82.42% infill density, 0.26 mm layer height and 230.26°C melting temperature, which produced a better UTS of 38.39 MPa and a minimum Ra of 5.65 um. Exploratory experiments demonstrated that the optimal results fell below 5% of the estimated results that was enough to assure precision in the form of the model. The inclusion of replicate experimental measurements and statistical analysis again verifies that this combination of parameters is within a statistically reliable region of the process space. The findings show that the joint ML-GA model is a systematic and scalable technique of optimization of parameters applied in the additive manufacturing that can potentially be applied to other thermoplastics and other performance measures: modulus, fatigue strength, and dimensional stability.
Footnotes
Declaration of conflicting interests
The authors declared no potential conflicts of interest with respect to the research, authorship, and/or publication of this article: On behalf of all authors, the corresponding author states that there is no conflict of interest.
Funding
The authors received no financial support for the research, authorship, and/or publication of this article.