
Abstract
The increasing demand for sustainable and eco-friendly materials has driven research on renewable fillers for polymer composites. Conventional fillers are costly, prompting the exploration of alternatives driven by agricultural waste. Rice husks, an abundant agricultural waste, are a low-cost and sustainable source of high-purity biosilica nanoparticles. This study explored the synthesis and characterization of biosilica nanoparticles from rice husks for use as a sustainable and renewable filler in a polyurethane foam matrix. Rice husks characterization involved the analysis of the physical composition. The rice husks exhibited variable moisture content and high ash content of 46–49% before pretreatment with hydrochloric acid and 49–54% after pretreatment. Through controlled combustion at 600°C and acid pretreatment, high-purity amorphous silica nanoparticles (86% purity) with an average crystallite size of 7.33 nm were obtained, as confirmed by X-ray diffraction, Fourier transform infrared spectroscopy, and energy dispersive X-ray analyses. The nanoparticles exhibited a spherical morphology and a stoichiometric Silicon:Oxygen ratio (1:1.7), while surface silanol groups enhanced their compatibility with polyurethane matrices. Response surface methodology was used to optimize the effects of nanoparticle concentration, mold temperature, and curing time on the resultant physical, mechanical, and thermal properties. The developed polyurethane foam nanocomposites were lightweight, with densities in range of 34.6-150.7 kg/m3, and their compressive strength peaked at 2.7 MPa. The thermal conductivity ranged between 0.0429 and 0.0507 W/mK. Images obtained using a Zeiss Stemi 508 stereomicroscope showed that the optimized foam had a more uniform cell structure than the control foam. The water absorption of the optimized foam was lower than that of the control foam. The optimized foam was more chemically stable in an oxidizing environment than the control foam. The results demonstrate that rice husk-derived biosilica nanoparticles are a promising eco-friendly alternative to conventional fillers, with potential applications in lightweight and insulating polyurethane foams.
Introduction
Polymeric materials are mainly classified as plastics, rubber, and fibers. Plastics account for approximately 70
PU foams are classified into flexible and rigid types, respectively. Flexible PU foams are used as comfort materials in beds, furniture, and car seats, whereas rigid PU foams are used mainly for heat and sound insulation. 3 Flexible PU foams can also be used for heat and sound insulation, depending on the density attained during foam synthesis. Flexible PU foams can be classified into low-density flexible PU foams, which are used in low-income bedding and packaging of fragile materials, and standard-density flexible PU foams, which are used in bedding, cushioning, soundproofing, and clothing. High-density flexible PU foams are used in bedding and thermal insulation on roofs, refrigerators, and boilers. The use of high-density flexible polyurethane in thermal insulation has not been fully explored, although these materials are considerably cheaper than rigid PU foams. Polyols, isocyanates, and other additives, such as surfactants, flame retardants, catalysts, and fillers, are important for synthesizing PU foams. Most of these raw materials are obtained by refining crude oil, which contributes to greenhouse gas emissions. It is estimated that oil will run out in approximately 50 years. 4 Therefore, replacing petroleum-based raw materials with renewable raw materials is a significant global challenge. Additionally, the use of renewable materials is becoming increasingly important because of the rising cost of crude oil and sustainable development. 5 The circular economy seeks to minimize waste by utilizing existing waste as raw materials in production. Greenhouse gas emissions can be reduced by using renewable raw materials, incorporating waste into production, and enhancing the thermal conductivity of materials used in construction. 6
One of the raw materials for PU synthesis can be sourced from renewable raw materials in the form of agricultural waste. In 2021, Uganda produced 727,000 tonnes of rice.
7
This generates large amounts of waste (husks), approximately 145,400 tonnes, which contains more than 50% cellulose, 25–30% lignin, and 15–20% silica. Most rice husks are often burned in open fields, a practice that creates negative environmental impacts by emitting greenhouse gases.
8
Rice husks can be combusted under controlled conditions to generate rice husk ash (RHA) with a high silica content (80
For example, nanoclays employed as fillers in PUFs have improved their thermal and mechanical properties and reduced their cell sizes. 10 Silica nanoparticles dispersed in polyols exhibit improved resilience and thermal stability. 11 The mechanical properties of polyurethane foams primarily depend on their cell structure, including cell size, cell content, and wall thickness. During the molding process, the ambient temperature, raw material ratio, molding temperature, material temperature, and curing time significantly affect the final cell structure and morphology of the polyurethane foam. 1 Mohan et al. 12 conducted a microscopic experiment. Tests showed that polyurethane foams treated at low temperatures produced an anisotropic cell content of uniform size, resulting in increased stiffness. Elevated temperatures produce isotropic spherical cells with large size variations. 12 Furthermore, Xiang et al. 13 investigated the effect of mold temperature (40°C, 60°C, 80°C, and 100°C) on the mechanical properties of injection-molded PUFs. The stress-strain curves obtained indicated that an increase in the mold temperature led to a decrease in the tensile strength. 13 Current studies do not provide statistics on the changes in cell size due to variations in the mold temperature. One way to reduce the cell size is by incorporating fillers into the polyurethane foam matrix as nucleating agents. These particles can improve the stiffness, strength, and thermal stability. The effect of biosilica nanoparticles as fillers in flexible polyurethane has not been fully explored, as most studies have focused on rigid polyurethane foams.
The flexibility, rigidity, density, and thermal conductivity of PU foam are determined by the type and amount of chemicals used during its manufacture and the process methodology. 14 Manufacturers typically control and regulate the process conditions and raw materials to obtain products that meet the required specifications. Low-molecular-weight polyols produce a more flexible foam that bends and compresses easily. In contrast, high-molecular-weight diisocyanates lead to greater crosslinking during the reaction, resulting in foams with higher rigidity. The mold temperature also influences the final properties of the PU foam, as an increase in the mold temperature correlates with a decrease in the average density, compressive modulus, and yield strength. Utilizing biosilica nanoparticles from rice husks in polyurethane foams may create a sustainable and high-performance composite material. Optimizing processing parameters is crucial for enhancing the mechanical, physical, and thermal properties of materials and broadening their application scope. Various fillers have been used to reinforce polyurethane foams. However, each of these fillers has significant limitations. Ground tire particles interfere with the polymerization reaction owing to competing hydroxyl groups, 15 whereas coffee husks cause density fluctuations owing to poor filler integration. Oak sawdust contains macro-sized particles that lead to agglomeration, causing a decrease in the compressive strength of the foam. 16 In contrast, banana and bergamot peels caused a small improvement in the foam compressive strength owing to weak filler-matrix bonding. 4 Modified fillers, such as silica nanoparticles and aerogels, are effective in mitigating these limitations; however, they are costly and have environmental concerns due to the chemicals used in the modification. The use of hybrid fillers still falls short of overcoming the issue of matrix incompatibility. This study therefore aimed to optimize the process parameters for manufacturing polyurethane nanocomposite foams using biosilica nanoparticles from locally sourced rice husks as fillers. The effects of process parameters, namely mold temperature, nanoparticle concentration, and curing time, on the density, compressive strength, and thermal conductivity of the developed polyurethane foam nanocomposites were evaluated.
Materials and Methods
Materials
Rice husks were collected from Namulonge, National Crops Research Institute, located in Busukuma Sub-County, Wakiso District, Uganda. The polyol, toluene diisocyanate (TDI), silicone oil, amine, stannous octoate, and methylene chloride were sourced from local firms and companies that manufacture foams. The polyol used for this PUF nanocomposite preparation was Wanol F3110P Viscosity (746 mPa.s at 25°C), OH Number 43 mg KOH/g) purchased from Rajchem Polymers Uganda Limited. Toluene Diisocyanate (TDI) was used as the isocyanate.
Characterization of Rice Husks
Rice husks weighing 10 kg from the super variety were obtained from a local rice mill, sorted to remove large particles, and washed with clean water to remove dust. The moisture content of the rice husks was determined using the official methods of analysis.
17
A 3-g sample of rice husk was placed in a pre-weighed crucible and spread using a spatula. The crucible was then placed in an oven at 110°C for 24 h. After this period, the sample was removed and transferred to a desiccator to cool before being weighed. The moisture content was calculated using equation (1).

The dried sample was then refluxed with 1M Hydrochloric acid for 90 min, washed with distilled water, and oven-dried for 24 h at 110°C. This dissolved cellulose and hemicellulose in the aqueous phase, leaving behind solid residues mainly lignin and inorganics.
18
The ash content of the treated sample was determined according to the standard laboratory analytical procedure of NREL.
17
A 3-g sample of the treated rice husk was placed in a dried and pre-weighed crucible. The crucible was then carbonized until no smoke was produced. After allowing the sample to cool, the crucible was placed in a furnace at 600°C for 3 h until a constant weight was achieved. Once cooled in a desiccator, the ash content was calculated using equation (2).

Extraction of biosilica nanoparticles from rice husks
Ten grams of the resulting ash was refluxed with 6 M hydrochloric acid at 65°C for 3 h. The acid-treated ash was then thoroughly washed with distilled water to remove residual acid and oven-dried for 6 h. Next, 10 g of dried, refluxed RHA was stirred in 80 mL of 2.5 M sodium hydroxide at 700 rpm for 14 h using a magnetic stirrer. 19 Alkaline thermal treatment induces cleavage of ester linkages in lignin removing it from the solid phase. 18 To obtain a silica gel, 2.5 M sulfuric acid was added dropwise until a pH of 8 was achieved. The resulting silica gel was washed repeatedly with warm deionized water until the pH was 7. The gel was then oven-dried at 50°C for 28 h to obtain biosilica nanoparticles. 20
The morphology of the biosilica nanoparticles was examined using a field emission scanning electron microscope (FE-SEM), carl Zeiss sigma 300 vp, Germany. The samples were prepared in manageable sizes so that they could be accommodated by the SEM mounting. A thin layer of carbon coating was applied to the samples using a sputter coater. The prepared sample was placed on a specimen holder/stub and secured. After placing the samples in the SEM chamber, imaging was performed under an accelerating voltage of 10 kV and high vacuum conditions, providing insights into the particle size and shape of the biosilica nanoparticles. The working distance and magnification were adjusted to optimize the visualization of the surface features. Energy-dispersive X-ray spectroscopy (EDX) integrated with SEM enabled the identification of elements such as silicon and oxygen.
The degree of crystallinity of the extracted nanoparticles was assessed using an X-ray Diffractometer (XRD-7000 Shimadzu, Japan) with CuKα (λ = 1.5406 Å), operated at a constant current of 30 mA and an applied voltage of 40 kV. The fine powder of the biosilica nanoparticles was placed on a sample holder and placed in the XRD machine. The data process condition smoothing was set to Auto, and the data were generated within 45 min. The diffraction angle
Fourier-transform infrared spectroscopy (FTIR) spectra were recorded using an IR Tracer-10 FTIR, Japan. A small quantity of the prepared sample was selected using a magnifying glass and placed on the Attenuated Total Reflection (ATR) crystal surface. A pressure knob was adjusted to secure the sample in its position. Infrared radiation was then directed onto the sample through the ATR crystal, and the attenuated infrared radiation was measured and analyzed to generate the spectrum. The FTIR spectral resolution was set to 4 cm−1 using a deuterated triglycine sulfate (DTGS) detector. A total of 64 scans were recorded over a wavenumber range of 400 – 4000 cm−1. 21
Design of Experiments
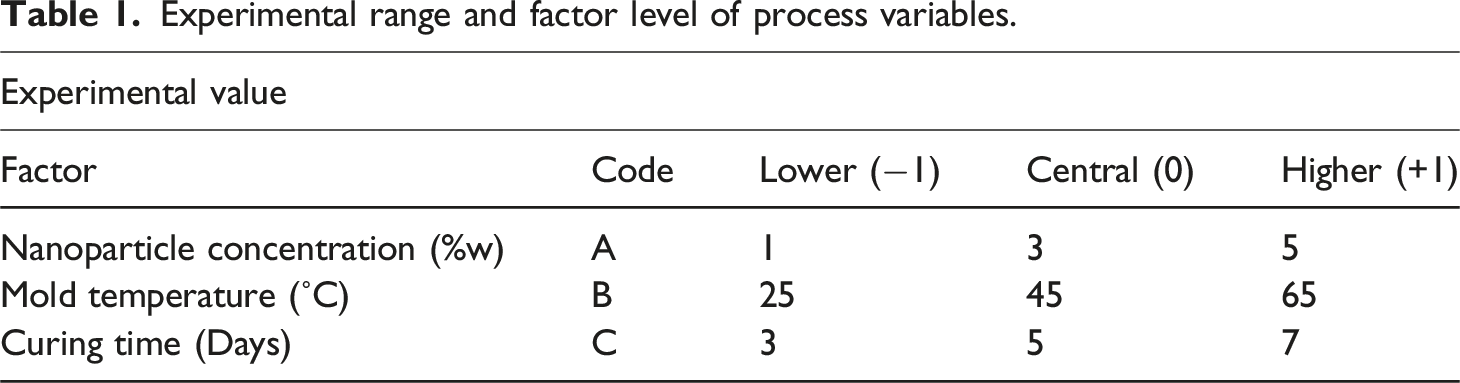
Experimental range and factor level of process variables.
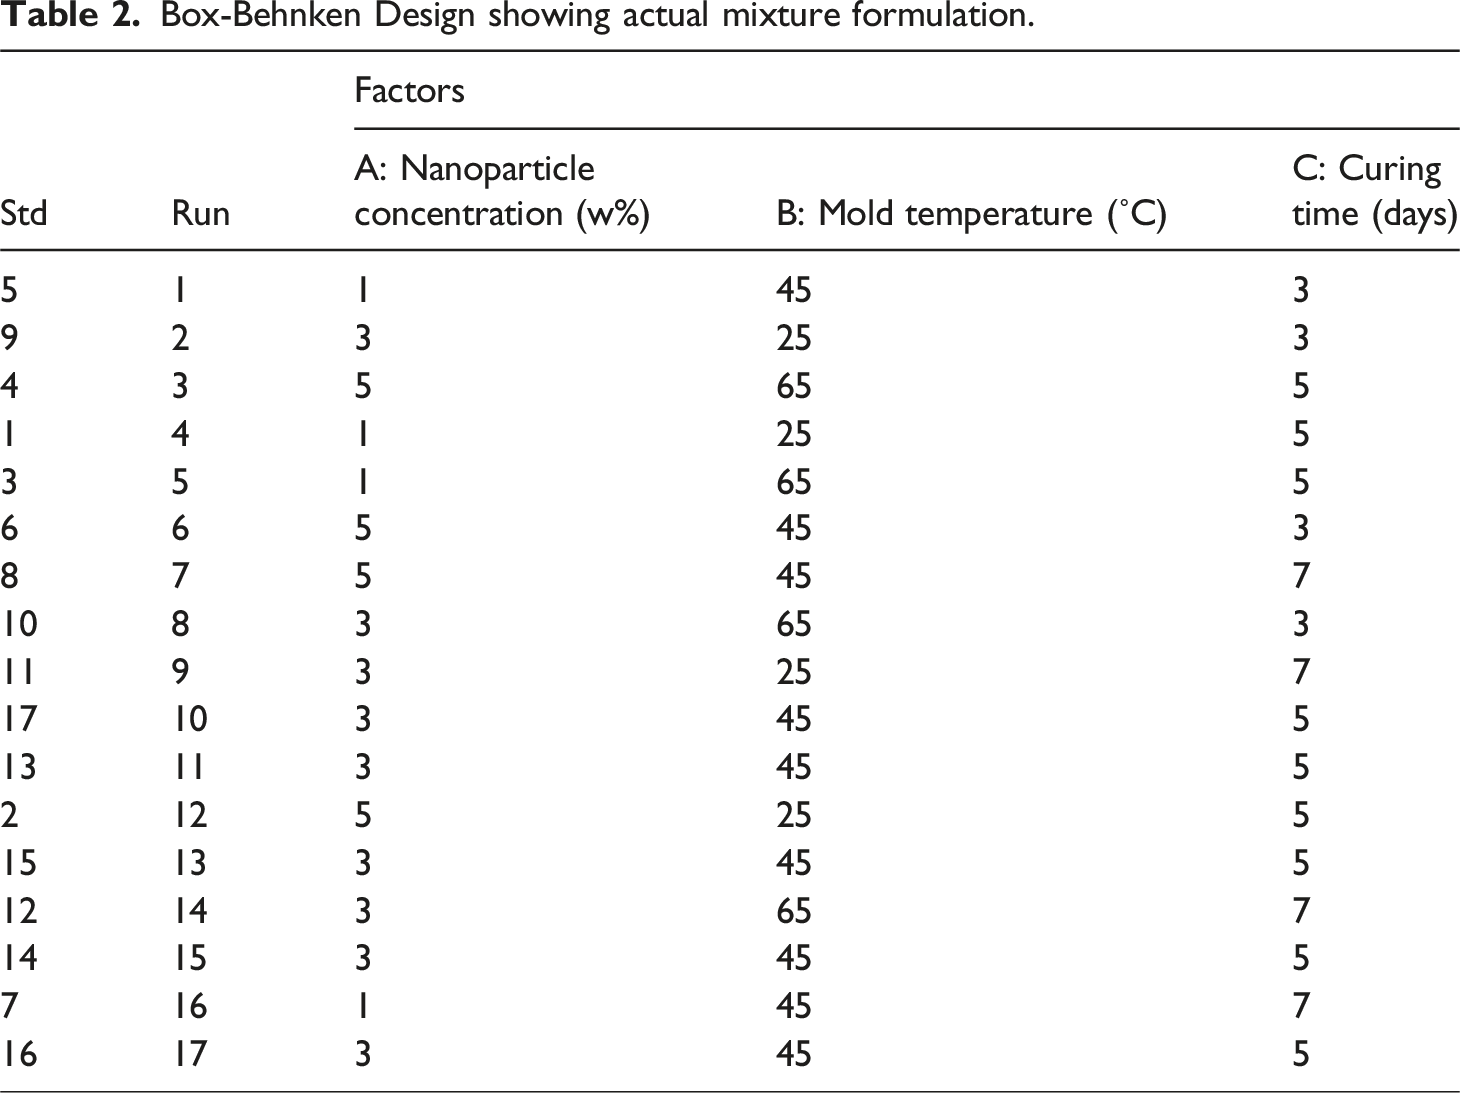
Box-Behnken Design showing actual mixture formulation.
Production of polyurethane Nanocomposites
Additives as a relative percentage of polyol.
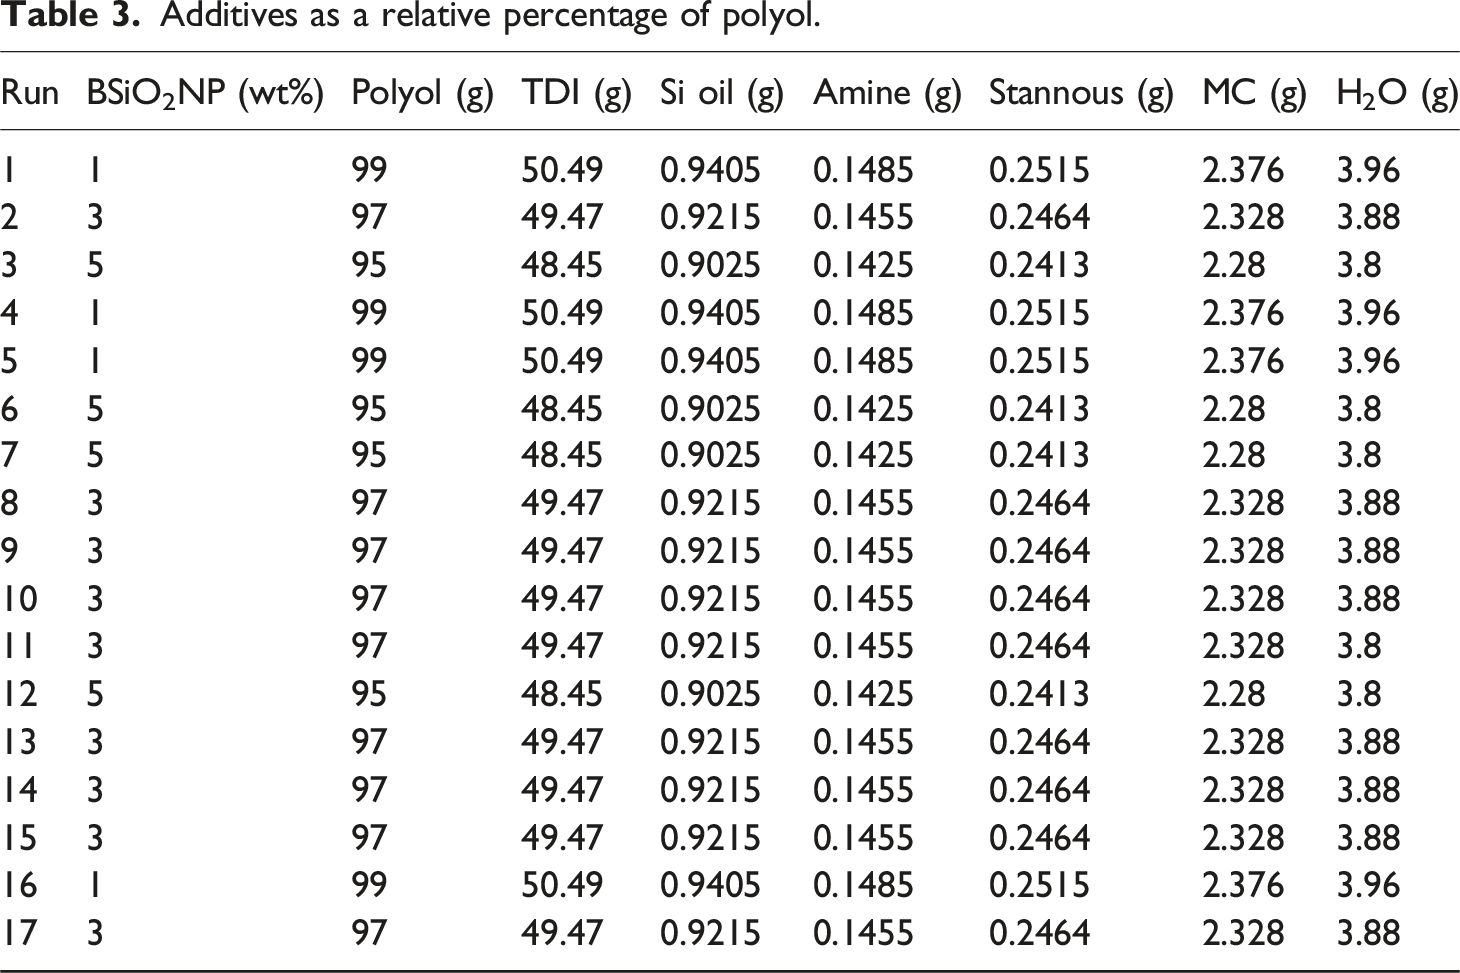
The PU foam nanocomposites were prepared using a one-step procedure. First, the polyol (99 wt%) and biosilica nanoparticles (BSiO2NP, 1 wt%) were vigorously stirred in a 250 mL plastic beaker using an agitator for 5 min to integrate air bubbles and form a uniform emulsion. An aqueous mixture containing 3.96 g of distilled water, 0.9405 g of silicone oil, and 0.1485 g of amine catalyst was added. Additionally, a catalyst mixture comprising 2.376 g of methylene chloride and 0.2515 g of stannous octoate was added to the blend. The entire mixture was stirred for 2 min and labeled as part A. Next, a pre-weighted amount of toluene diisocyanate (TDI, 50.49 g) was added quickly to the beaker under continuous stirring. The final mixture was then poured into a preheated mold maintained at 45°C, and the mold was sealed for 30 min to allow foam formation. Subsequently, the PU foam nanocomposite was demolded and placed in a desiccator to cure for 3 days before undergoing characterization.
Characterization of polyurethane nanocomposites
Surface morphology
The cell structure and morphology were examined using a Zeiss Stemi 508 stereomicroscope (Carl Zeiss Microscopy GmbH, Jena, Germany). The system, consisting of a microscope, camera, computer, and Uninterruptible Power Supply (UPS), was switched on in the order of computer, screen, microscope, and finally, camera. Samples were cut into thin slices perpendicular to the direction of rise and positioned centrally on the insert plate. A suitable light source was switched on using the side rotary knobs and adjusted to the most appropriate brightness. A lower magnification was set using the zoom knob and was later adjusted to the highest magnification. A single image was captured using the camera.
Fourier transform infrared spectrum
The functional groups present in the control and optimized samples were identified using an IR Tracer-10 Fourier-transform infrared (FTIR) spectrophotometer, Japan. A small quantity of the prepared sample was selected using a magnifying glass and placed on the Attenuated Total Reflection (ATR) crystal surface. A pressure knob was adjusted to secure the sample in its position. Infrared radiation was then directed onto the sample through the ATR crystal, and the attenuated infrared radiation was measured and analyzed to generate the spectrum. The FTIR spectral resolution was set to 4 cm−1 using a deuterated triglycine sulfate (DTGS) detector. A total of 64 scans were recorded over a wavenumber range of 400 – 4000 cm−1. The positions of the absorption bands corresponding to the specific vibrations of the urethane linkages were determined using an automatic peak-finding feature. 23
Dry density
The dry density of the optimized and control samples was calculated as the ratio of the dry weight to the volume of each sample, in accordance with ISO 845:2006 standards.
For each sample, the length, width, and height were measured three times using a ruler, and the calculated average values were used to determine the sample volume in cubic millimeters.
The samples were weighed, and their masses were determined in grams. The density of the sample in kilograms per cubic metre was calculated using equation (4).
Water absorption
The water absorption of the optimized and control samples was determined following the guidelines specified in ASTM C272/C272M-18 standards. Three samples (75 mm × 75 mm × 10 mm) were weighed for each material. The samples were then immersed in distilled water for 24 h. The samples were removed from the water, and the water was removed from the outer surface. The samples were weighed again, and the water absorption was calculated as the percentage of the dry weight using equation (5).
Thermal conductivity
The thermal conductivities of the optimized and control samples were determined using a Quick Thermal Conductivity Meter (Model QTM 500, 00,258, Japan), following the guidelines specified in the ASTM C1113-90 hot-wire method. 24 Each sample, with external dimensions of 100 × 50 × 35 mm, was placed in a probe box and closed with a sensor probe. The coefficient of thermal conductivity was then recorded on the display.
Compressive strength
The compressive strength of the control and optimized samples were determined following the guidelines specified in ASTM-D1621-16-2023 on an electrohydraulic servo universal testing machine (24,100,650, China) using a crosshead (strain rate) of 2.5 mm per minute. First, a sample from the experimental runs with external dimensions of 60 mm × 60 mm × 30 mm was placed on the lower compression platen, ensuring that the sample center line was aligned with the center line of the compression platen. Subsequently, the sample was compressed using a similar platen connected to the load cell. All compressions were performed at a controlled rate with a computer synchronized with the testing setup, plotting a stress versus strain curve. The compressive strength was obtained by interpreting the stress–strain plot for each sample. 3
Solvent resistance
The resistances of both the optimized nanocomposite polyurethane foam and the control sample of polyurethane foam were determined following the guidelines specified in ASTM D543-95. Identical samples of polyurethane foam were cut with external dimensions of 20 mm × 20 mm × 60 mm. The initial mass and appearance of the samples were recorded. The samples were then fully submerged in prepared solutions of 5% hydrochloric acid, 5% NaOH, and 5% hydrogen peroxide. 25 The samples were then carefully removed, rinsed, and oven-dried at 50°C for 24 hours before recording their final mass.
Results and discussion
Physical composition of rice husks
The combustion analysis demonstrated a significant ash yield ranging from 46 to 49% for the raw rice husks and 49-54% for the acid-treated samples. This increase confirmed the effectiveness of the acid pretreatment in removing organic components and enhancing inorganic components. The FTIR spectra further validate this observation (see Figure 1). After pretreatment, the intensities of the silanol (Si-O) and Si-O-Si functional group peaks increased. Ftir spectra for raw RH, treated RH, and RH ash.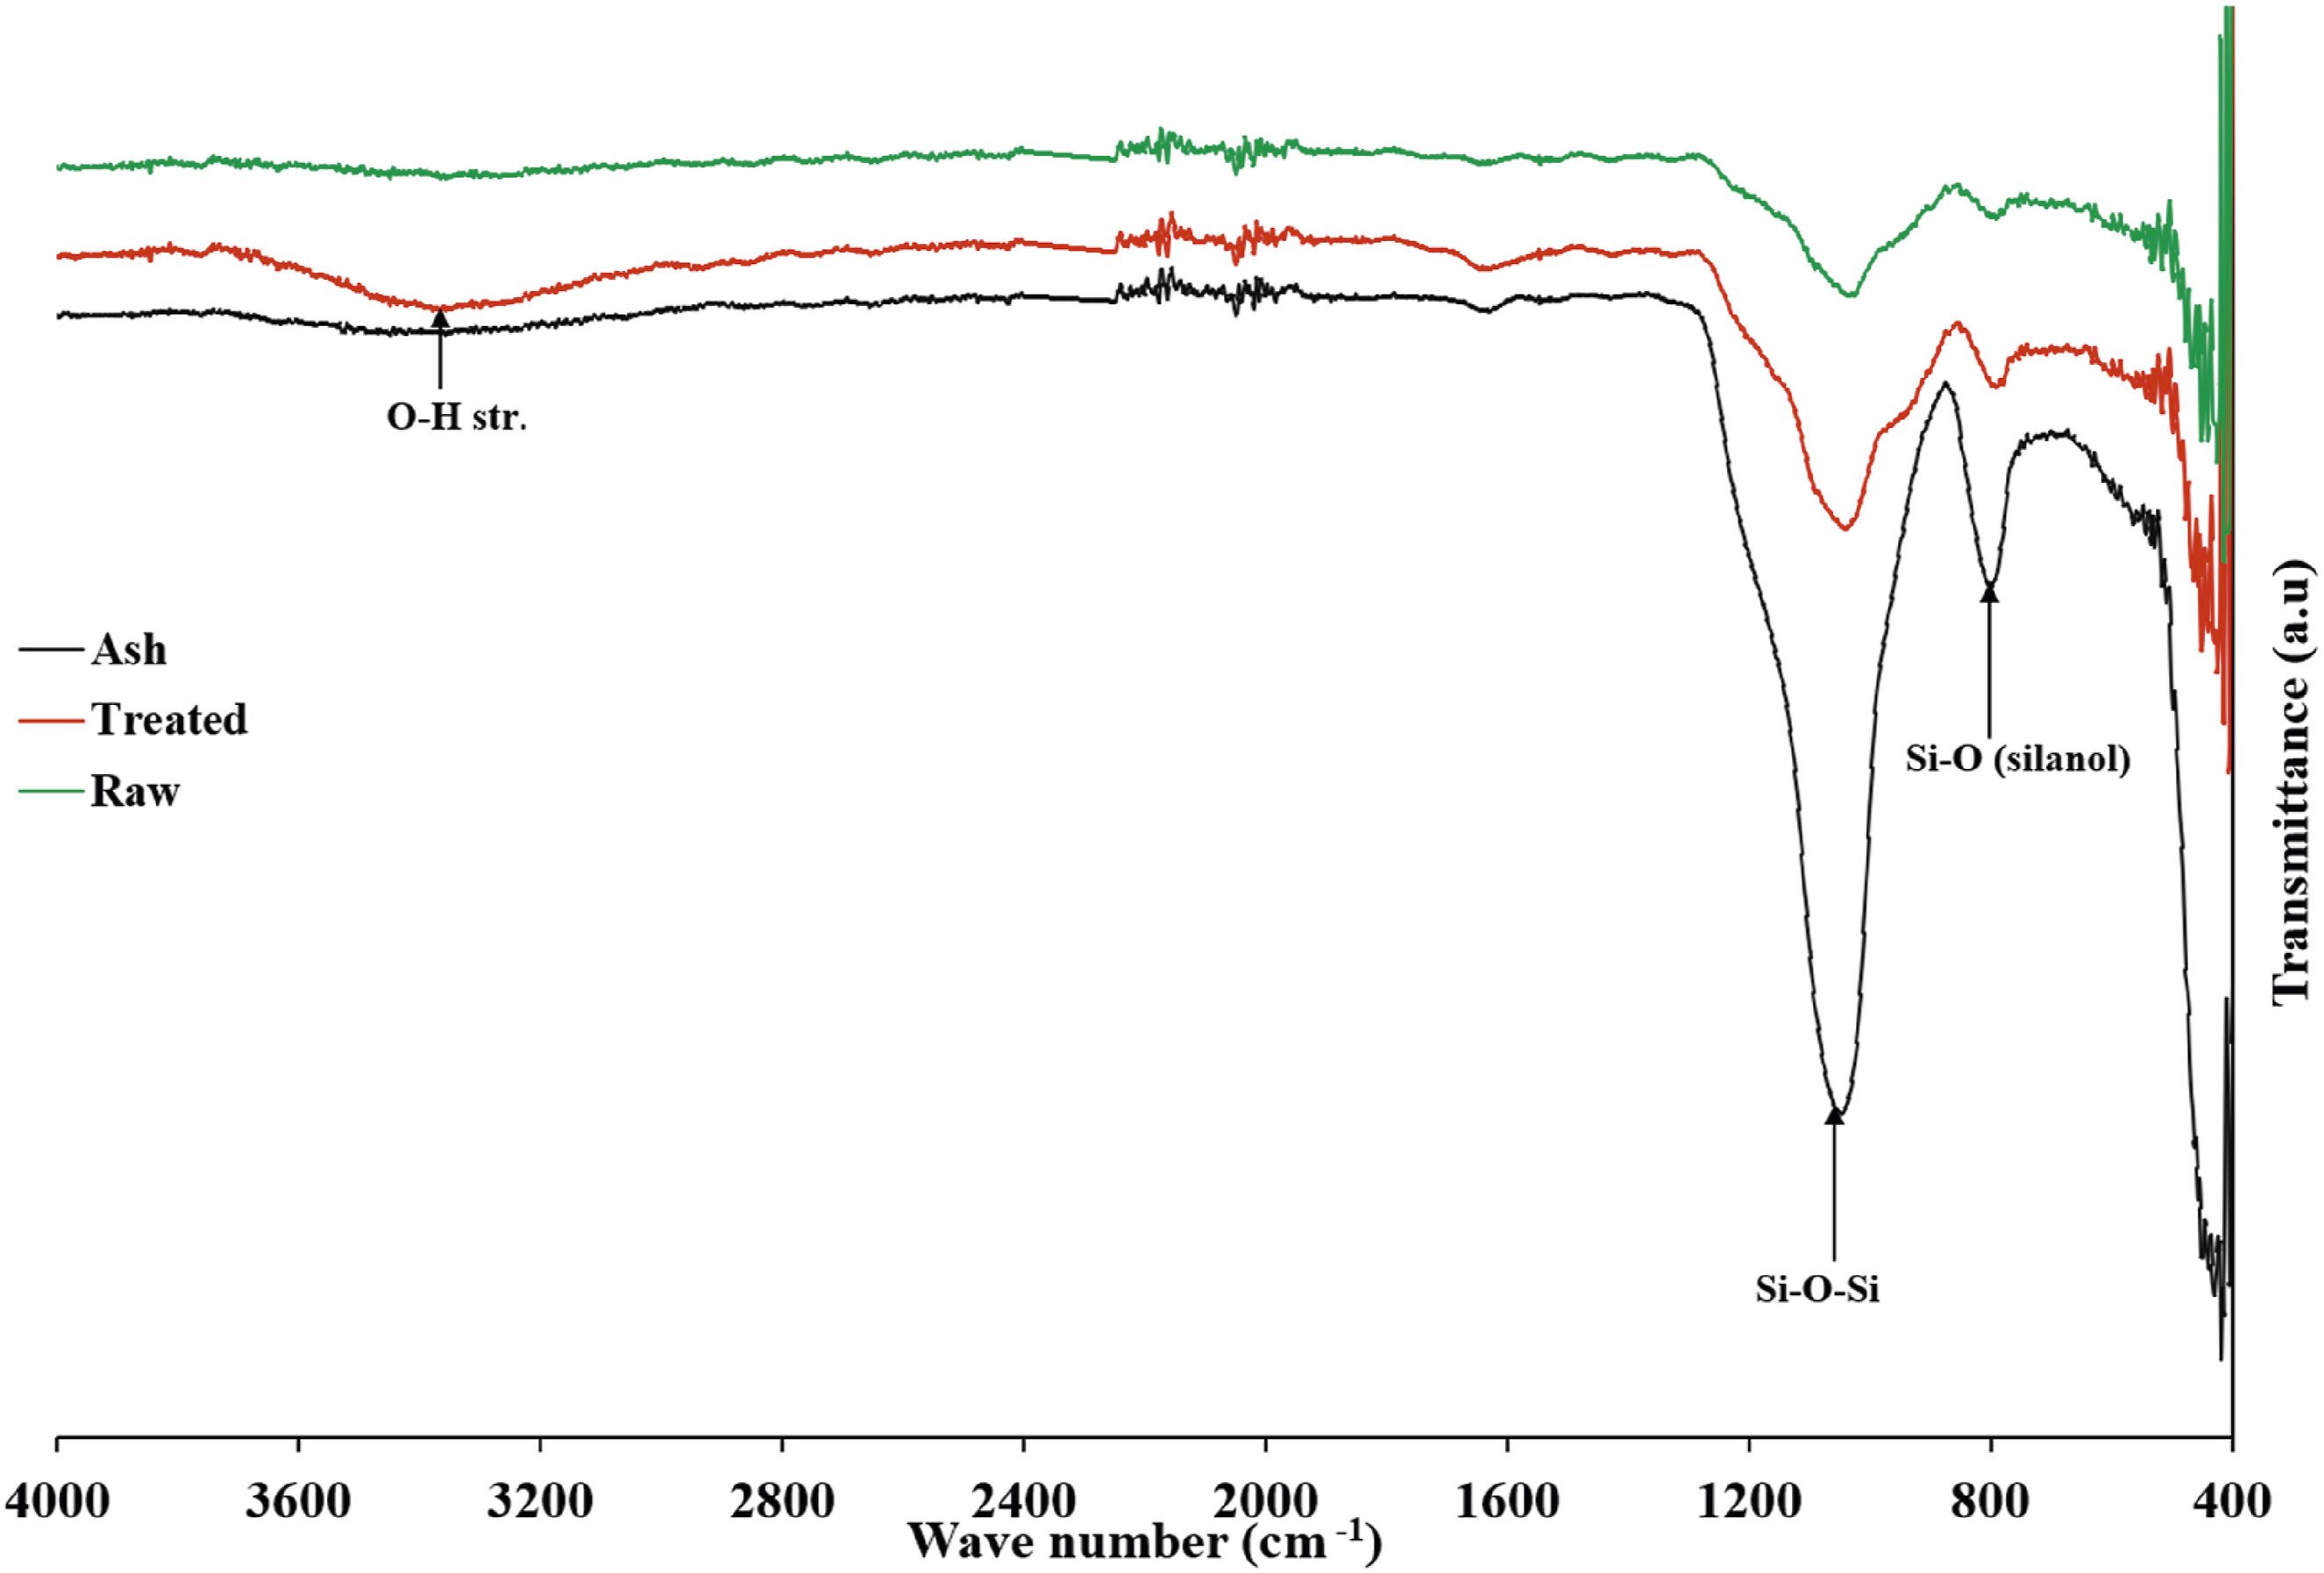
These values are significantly higher than the 31.15% reported by Menya et al. 26 for the super rice variety, which can be attributed to changes in soil chemistry, climate, and type of fertilizer, all of which are known to influence silica deposition in rice husks. 26 The consistently high ash content across the treated and raw rice husk samples further validated the suitability of rice husks from the super variety as a precursor for silica production for industrial applications.
The moisture content measurements of the raw rice husks yielded 10.50 ± 1.7%, indicating moderate variability in the samples and showing the hygroscopic nature of the rice husks before pretreatment. The measured moisture content fell within the range of 9.16
Characterization of biosilica nanoparticles
Scanning electron microscopy
Figure 2 presents the Scanning Electron Microscopy (SEM) images of the biosilica nanoparticles. The micrographs revealed spherical biosilica nanoparticles that tended to form clustered aggregates, indicating inter-particle interactions. The observed spherical morphology and aggregation behavior of the biosilica nanoparticles (see Figure 2) aligned closely with previous studies of rice husk-derived silica by Dorairaj et al.,
28
and Kim et al.,
29
confirming process reproducibility. SEM images of the biosilica nanoparticles 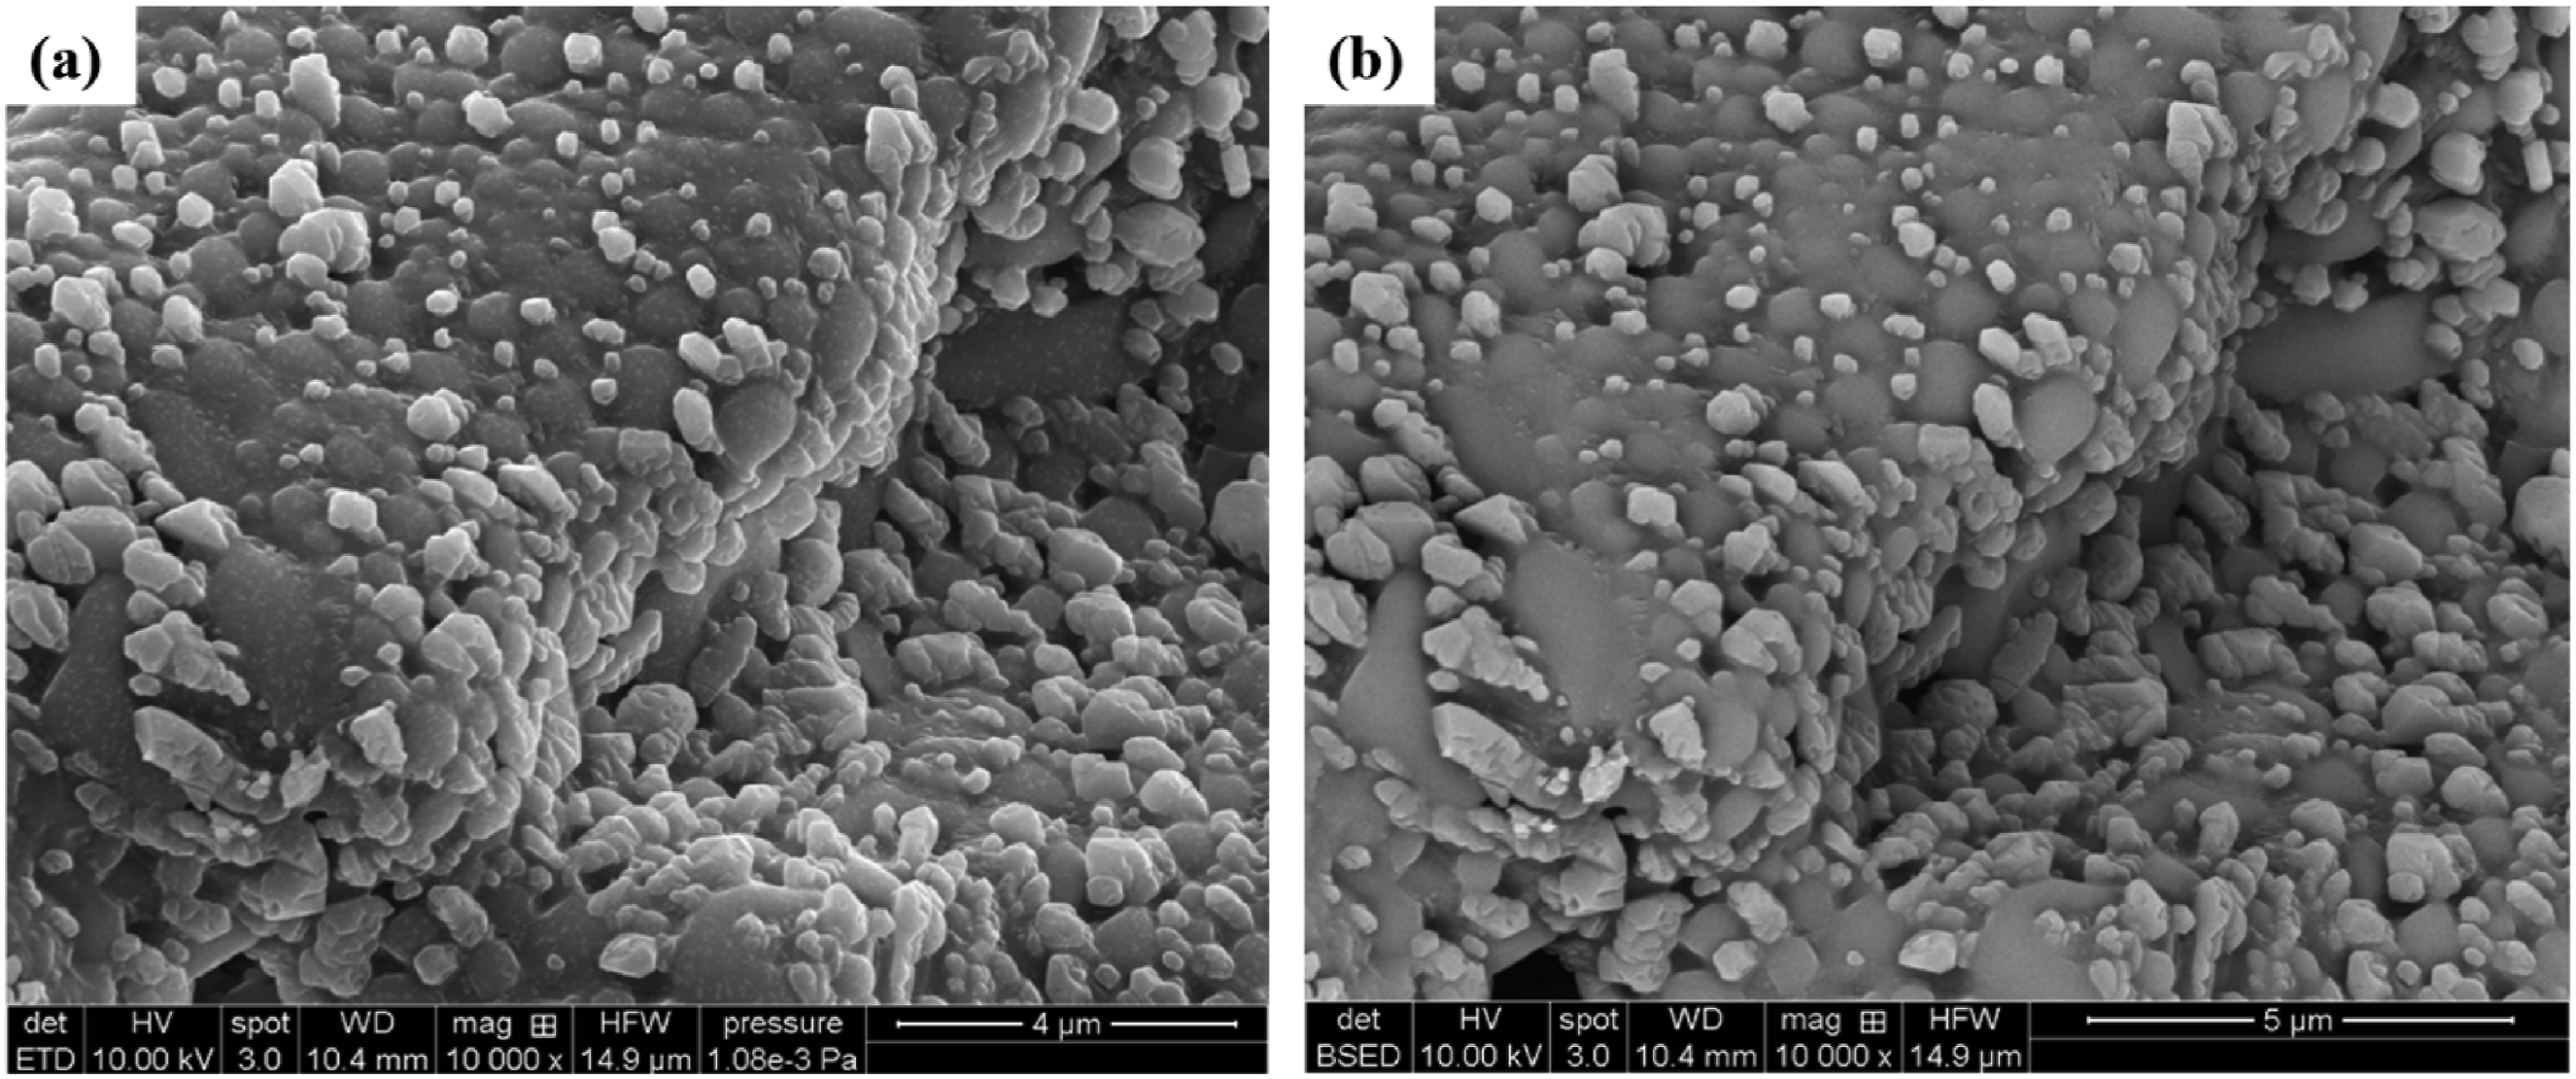
Energy dispersive X-ray analysis
Energy-dispersive X-ray (EDX) analysis (see Figure 3) revealed that the biosilica nanoparticles contained silicon (Si) and oxygen (O) with trace amounts of carbon (C). The observed Si: O atomic ratio of 1:1.7 is closely related to the theoretical stoichiometry of silica (SiO2), confirming the 86% purity of the extracted biosilica nanoparticles. Elements such as Ca, K, Na, Fe, Al, and Mg were not reported in the biosilica nanoparticles, demonstrating the effectiveness of our acid treatment. EDX graph.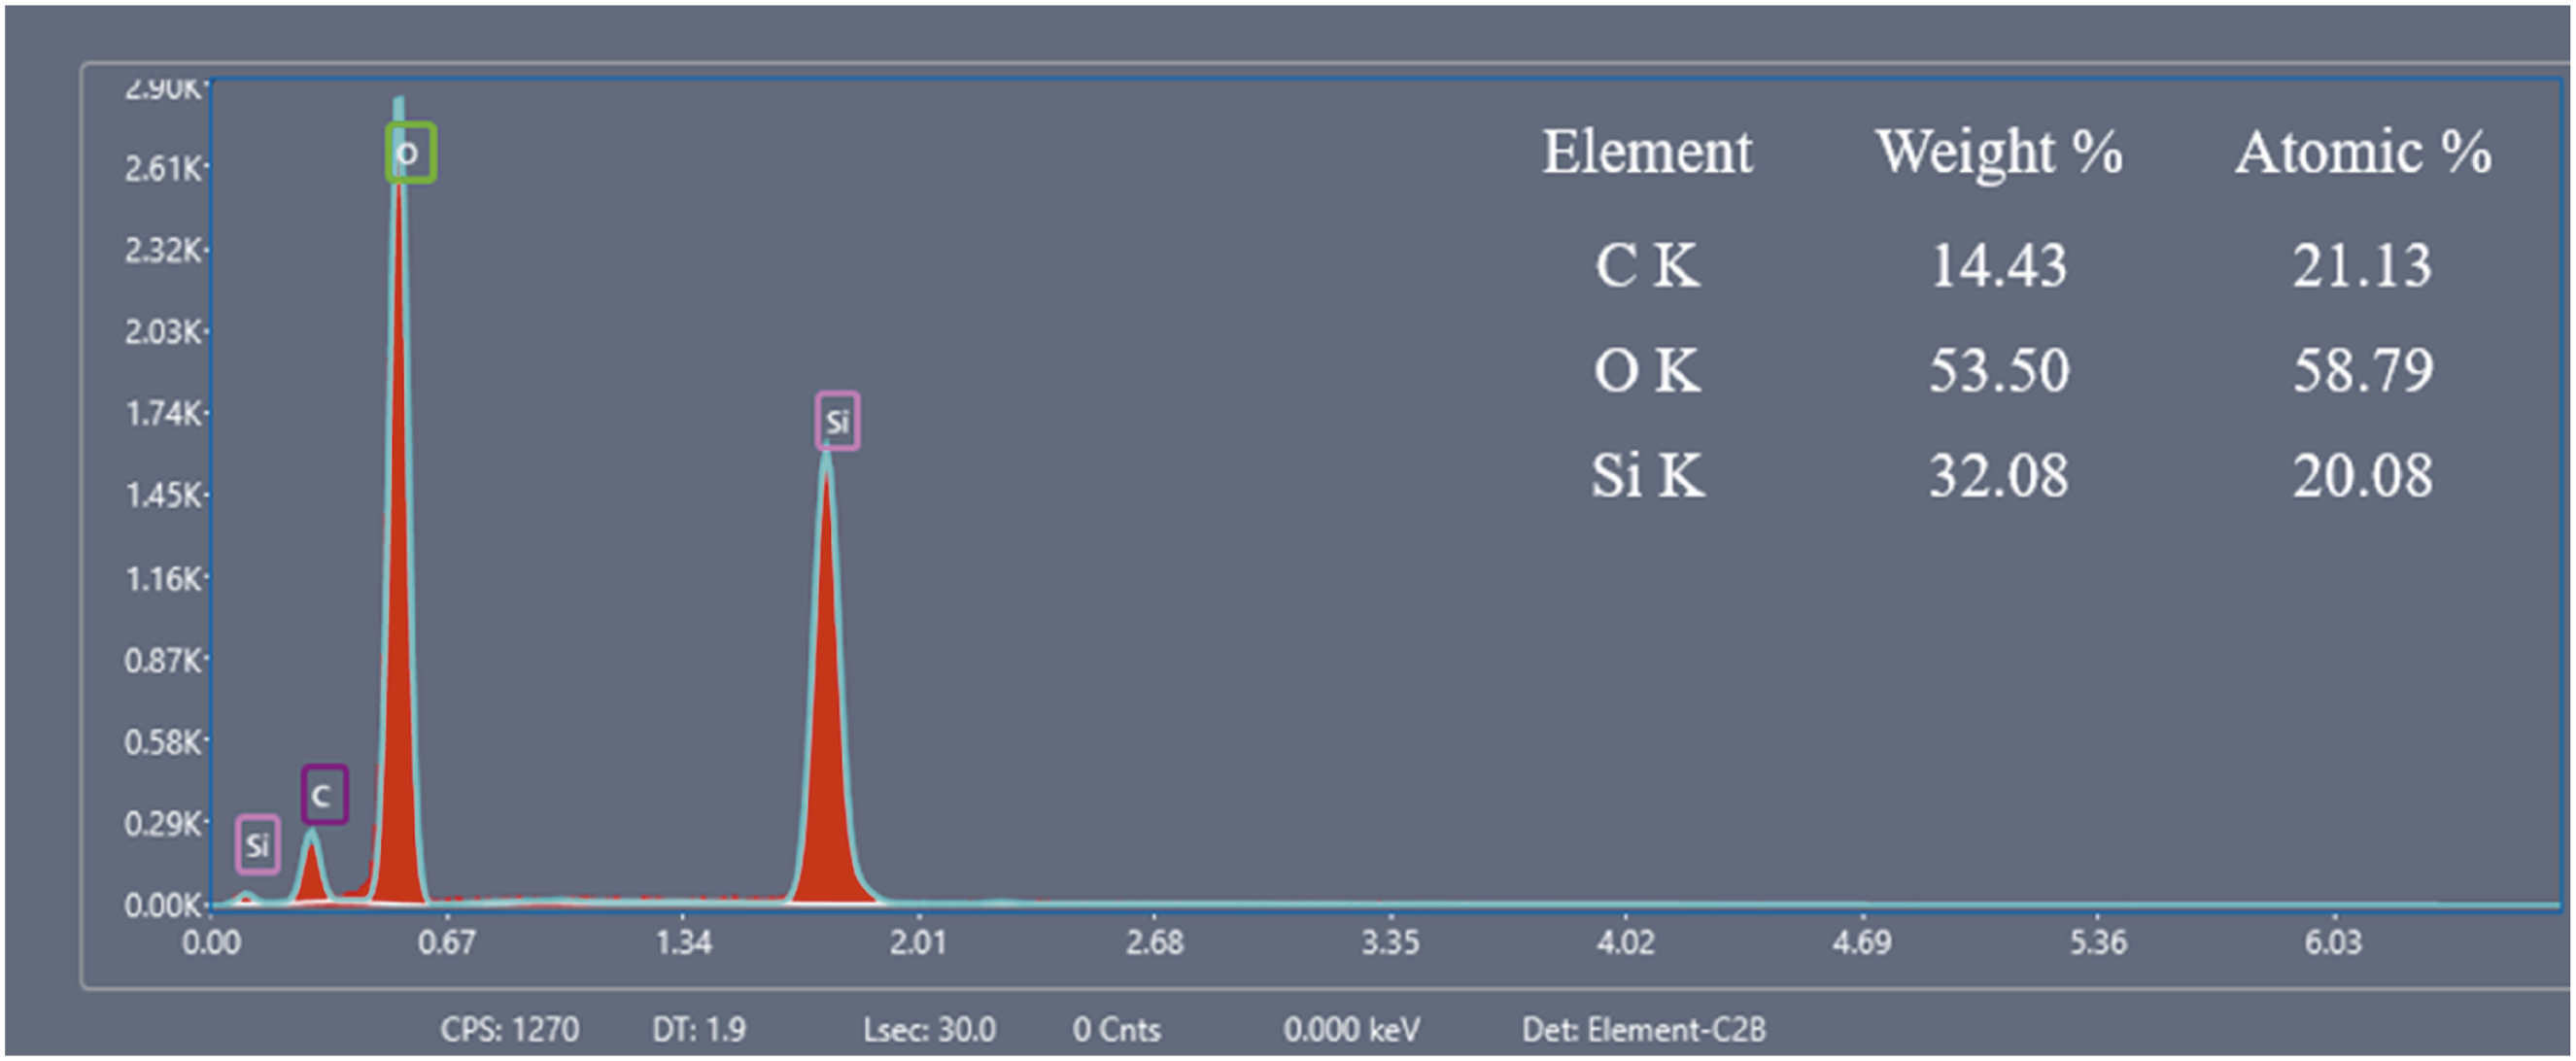
The Si:O atomic ratio of 1:1.7 closely matched the 1:1.5 reported by Anh Tuan et al., 30 confirming a good stoichiometric ratio in the obtained biosilica nanoparticles. However, the measured purity of 86% was lower than that reported in previous studies, 100%, 30 96%, 19 and 98.88%. 21 This difference primarily results from the low combustion temperature of 600°C compared to 650-700°C used in the cited studies, which might have allowed residual organic matter to persist in the biosilica nanoparticles.
X-ray diffraction analysis
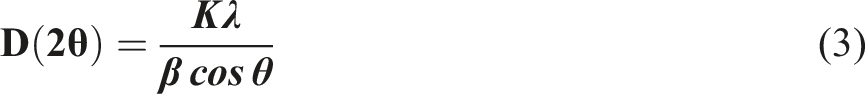
The XRD pattern of the biosilica nanoparticles exhibited three distinct diffraction peaks at 22.77°, 24.15°, and 21.67° (see Figure 4). The Debye-Scherrer diffraction equation was applied to the prominent XRD peaks, yielding an average particle size of 7.33 nm for the biosilica nanoparticles. The characteristic amorphous silica patterns at 2θ = 21.67°, 22.77°, and 24.15° aligned with the broad peak at 22° reported by Ezzat Rafiee et al.,
21
and Moosa & Saddam,
19
This confirmed the amorphous nature of the biosilica nanoparticles. The calculated crystallite size of the biosilica nanoparticles (7.33 nm) agreed with the literature values (3.4 XRD Pattern of biosilica nanoparticles.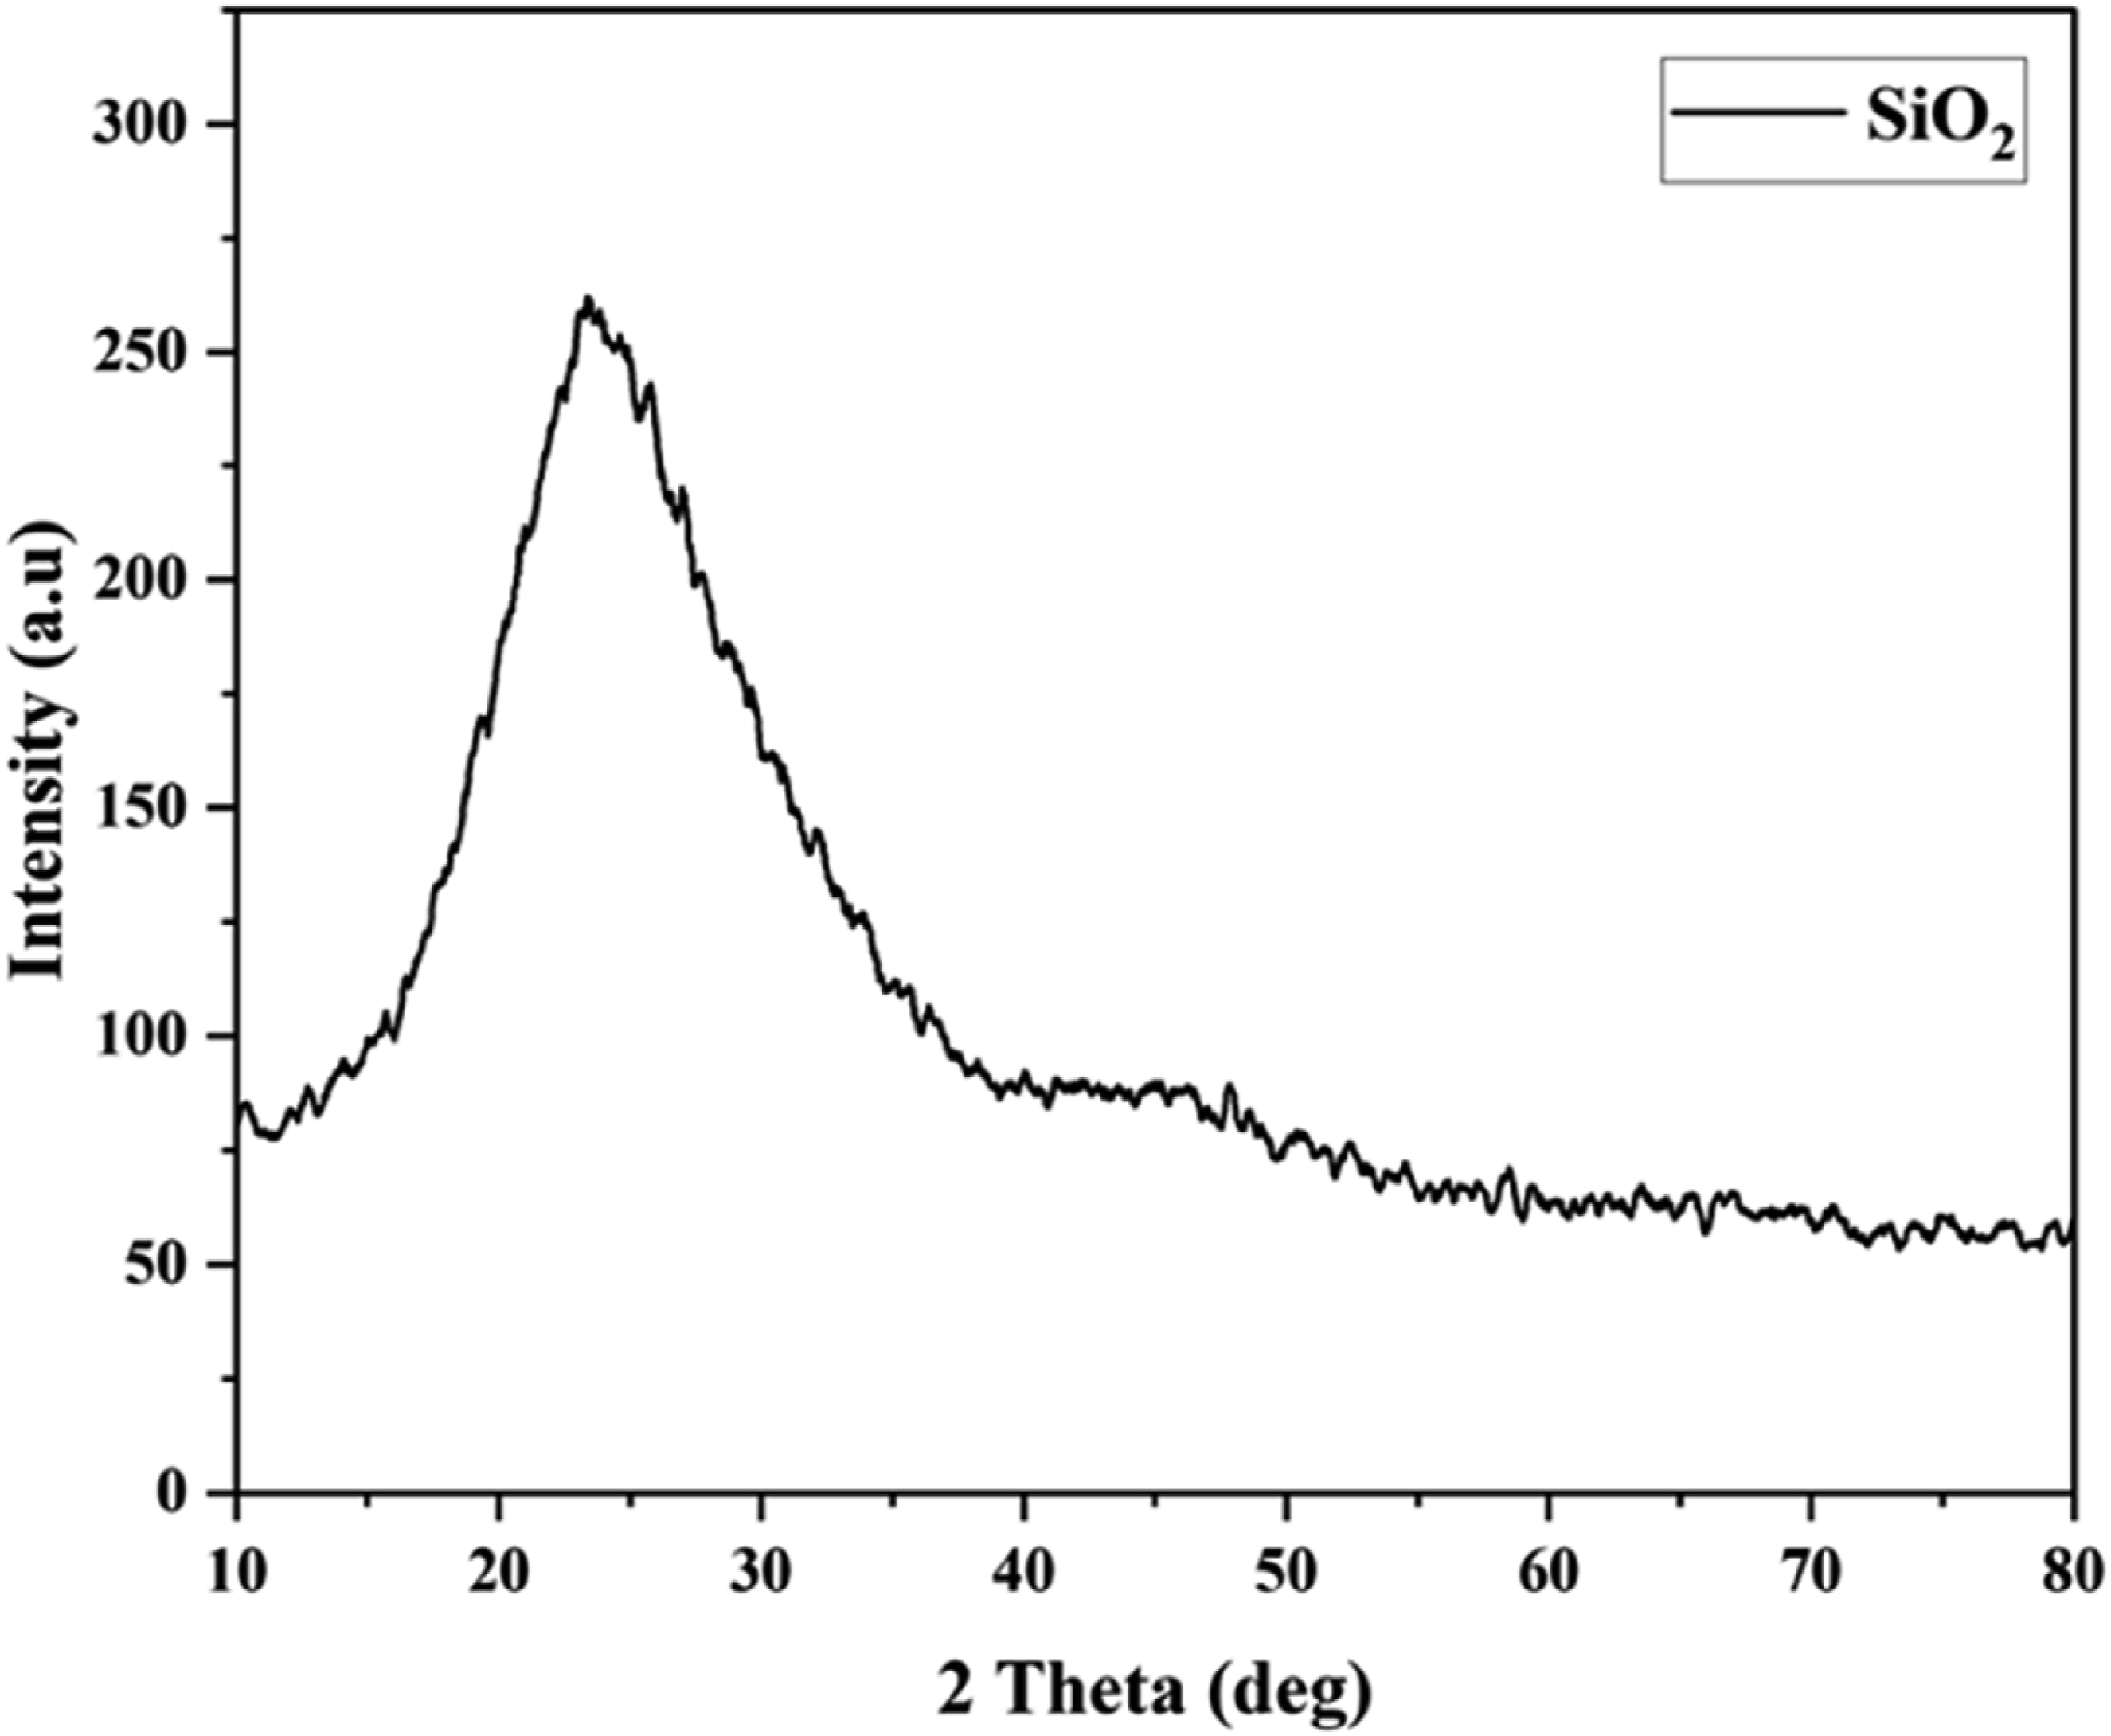
Fourier Transform Infrared Spectrum analysis
The Fourier Transform Infrared Spectrum (FTIR) in Figure 5 displayed characteristic absorption bands, confirming the biosilica structure of the samples.
31
Three different vibration modes of silica were observed: an intense asymmetric stretching of Si-O-Si bonds at 1056 cm−1, symmetric O-Si-O stretching at 790 cm−1, and Si-O bending vibration at 422 cm−1. Additional bands at 3389 cm−1 and 1637 cm−1 correspond to the O-H stretching of surface silanol groups (Si-OH) and H-O-H bending of absorbed water molecules. FTIR Spectrum for biosilica nanoparticles.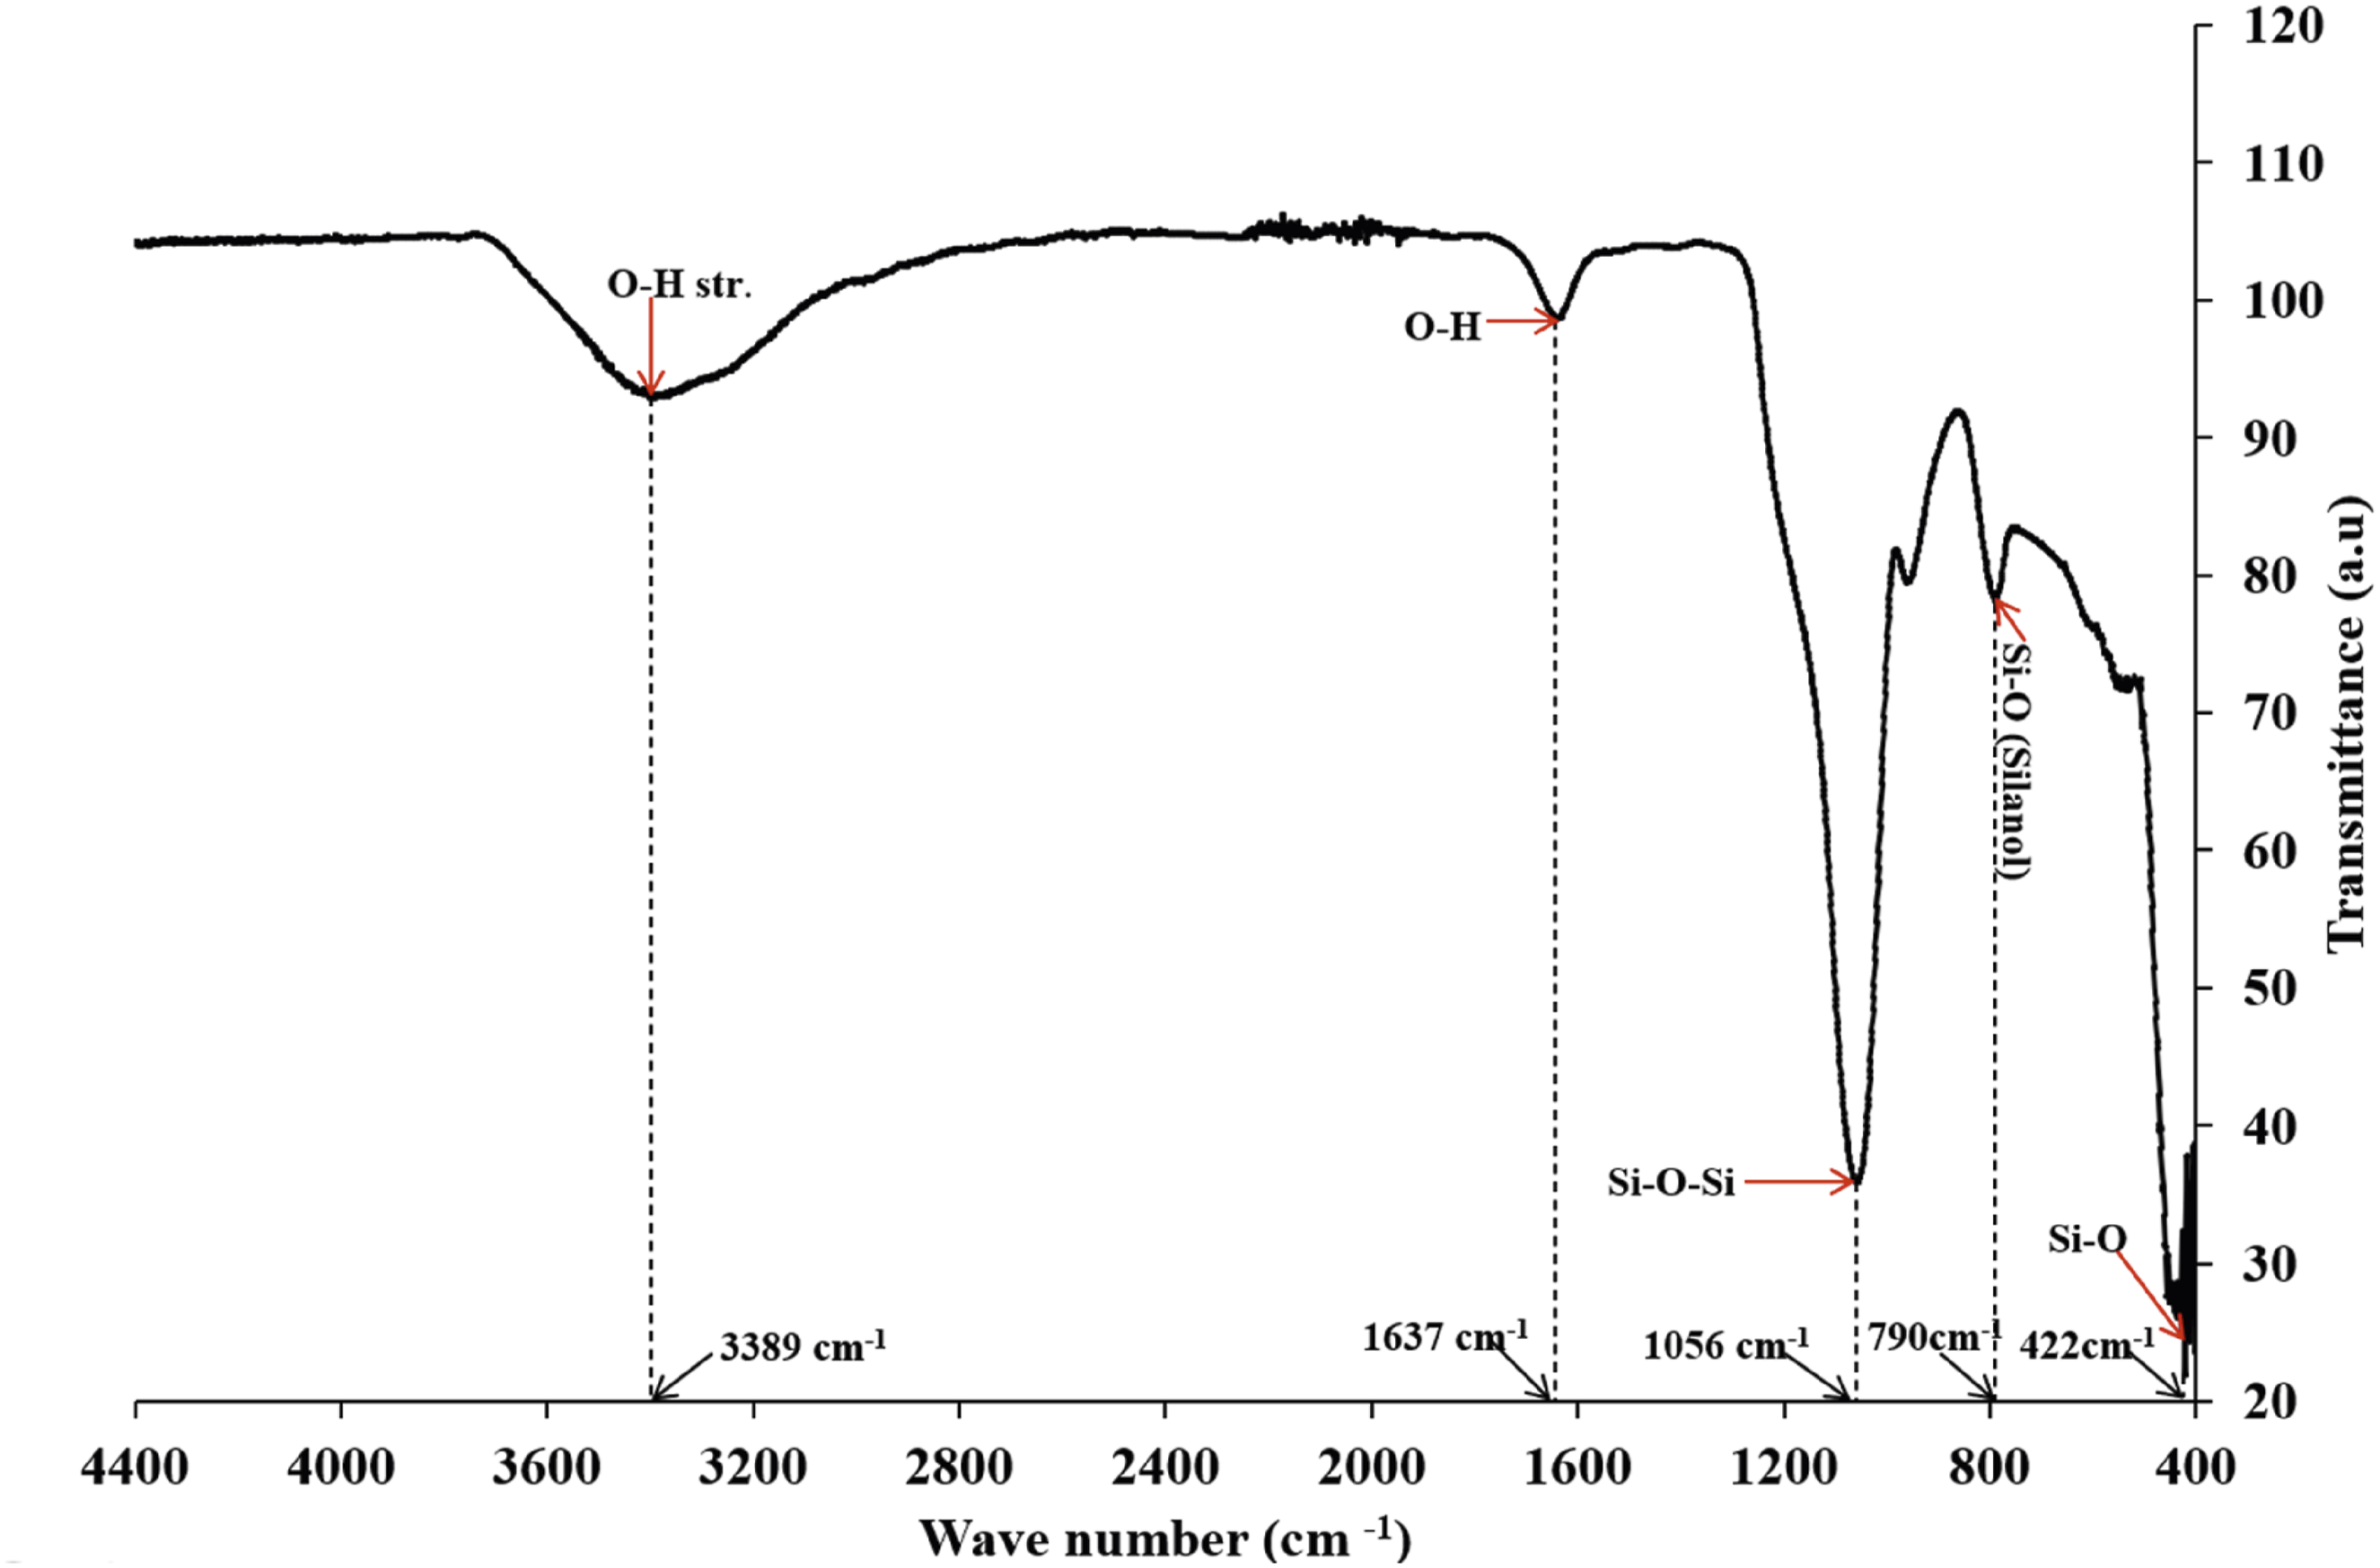
The observed bands at 1056 cm−1 (asymmetric Si-O-Si stretching), 790 cm−1 (symmetric O-Si-O stretching), and 422 cm−1 (Si-O bending vibration) correspond to the spectra reported in previous studies.19,21,28,29 The presence of surface silanol groups, evidenced by the O-H stretching band at 3389 cm−1, suggests that these biosilica nanoparticles would serve as an effective filler for polyurethane foam matrices. The hydroxyl groups participate in hydrogen bonding with proton donors and proton acceptor sites in the polyurethane matrix, contributing to the better dispersion of the biosilica nanoparticle filler. Additionally, the hydrophilic nature of the biosilica nanoparticles provides more nucleation sites for bubble formation, leading to larger volumes of polyurethane foam. 32
Polyurethane foam nano composite properties
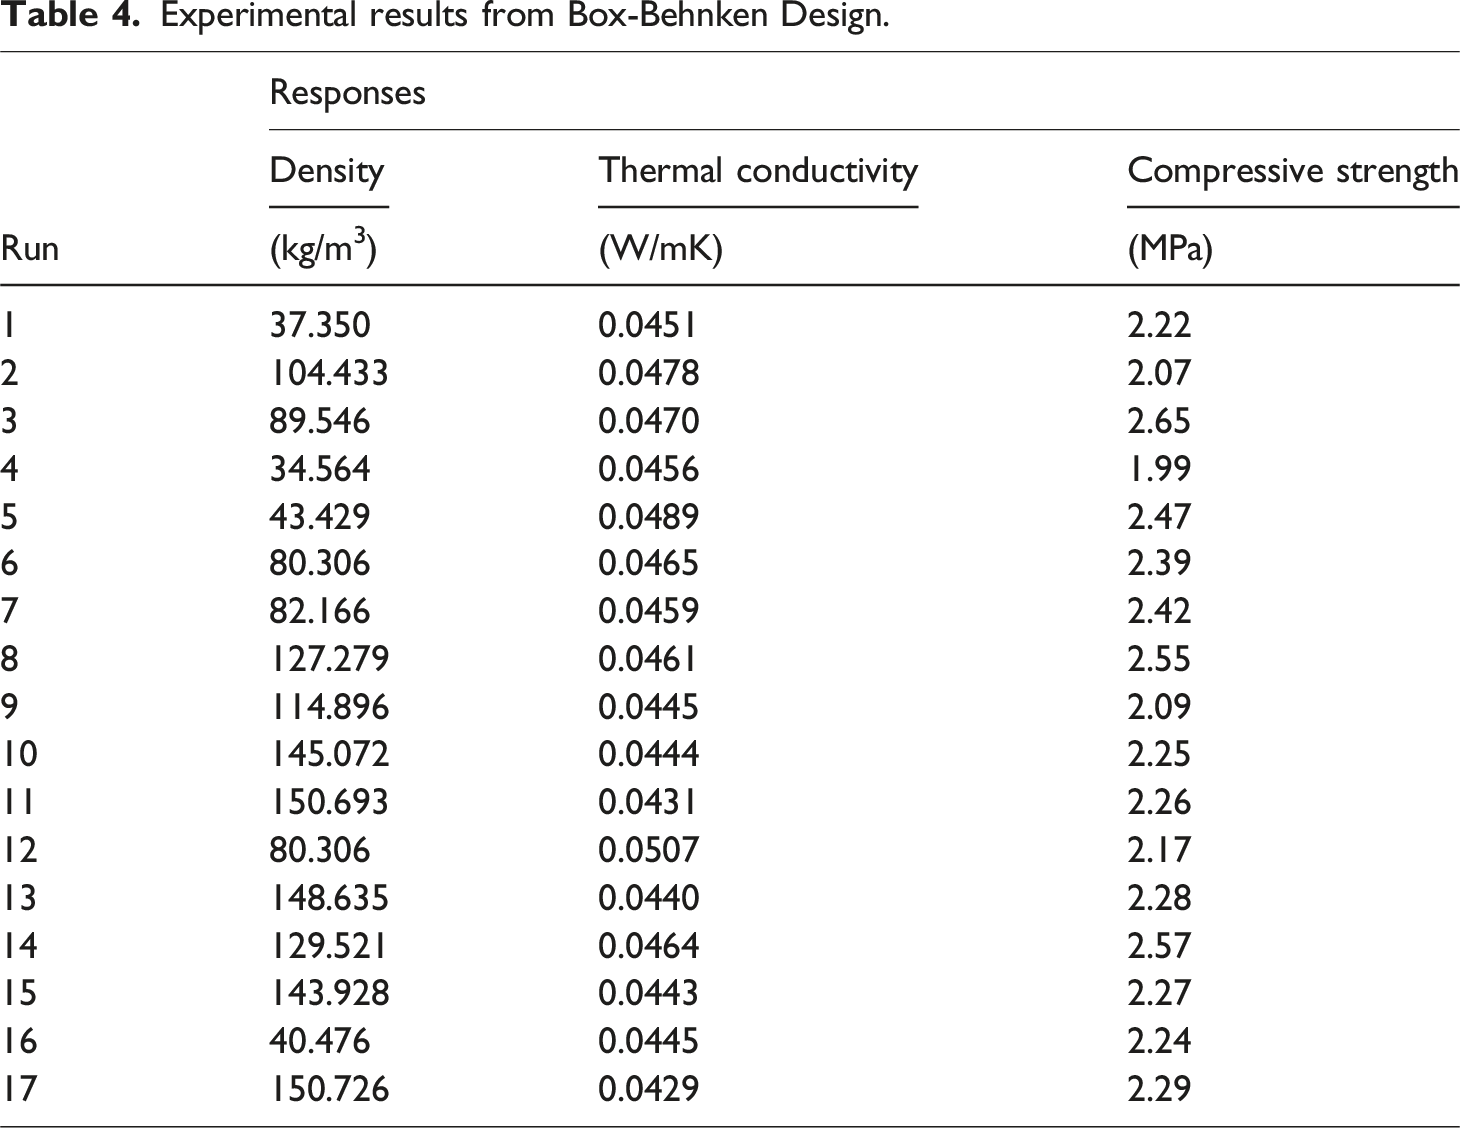
Experimental results from Box-Behnken Design.
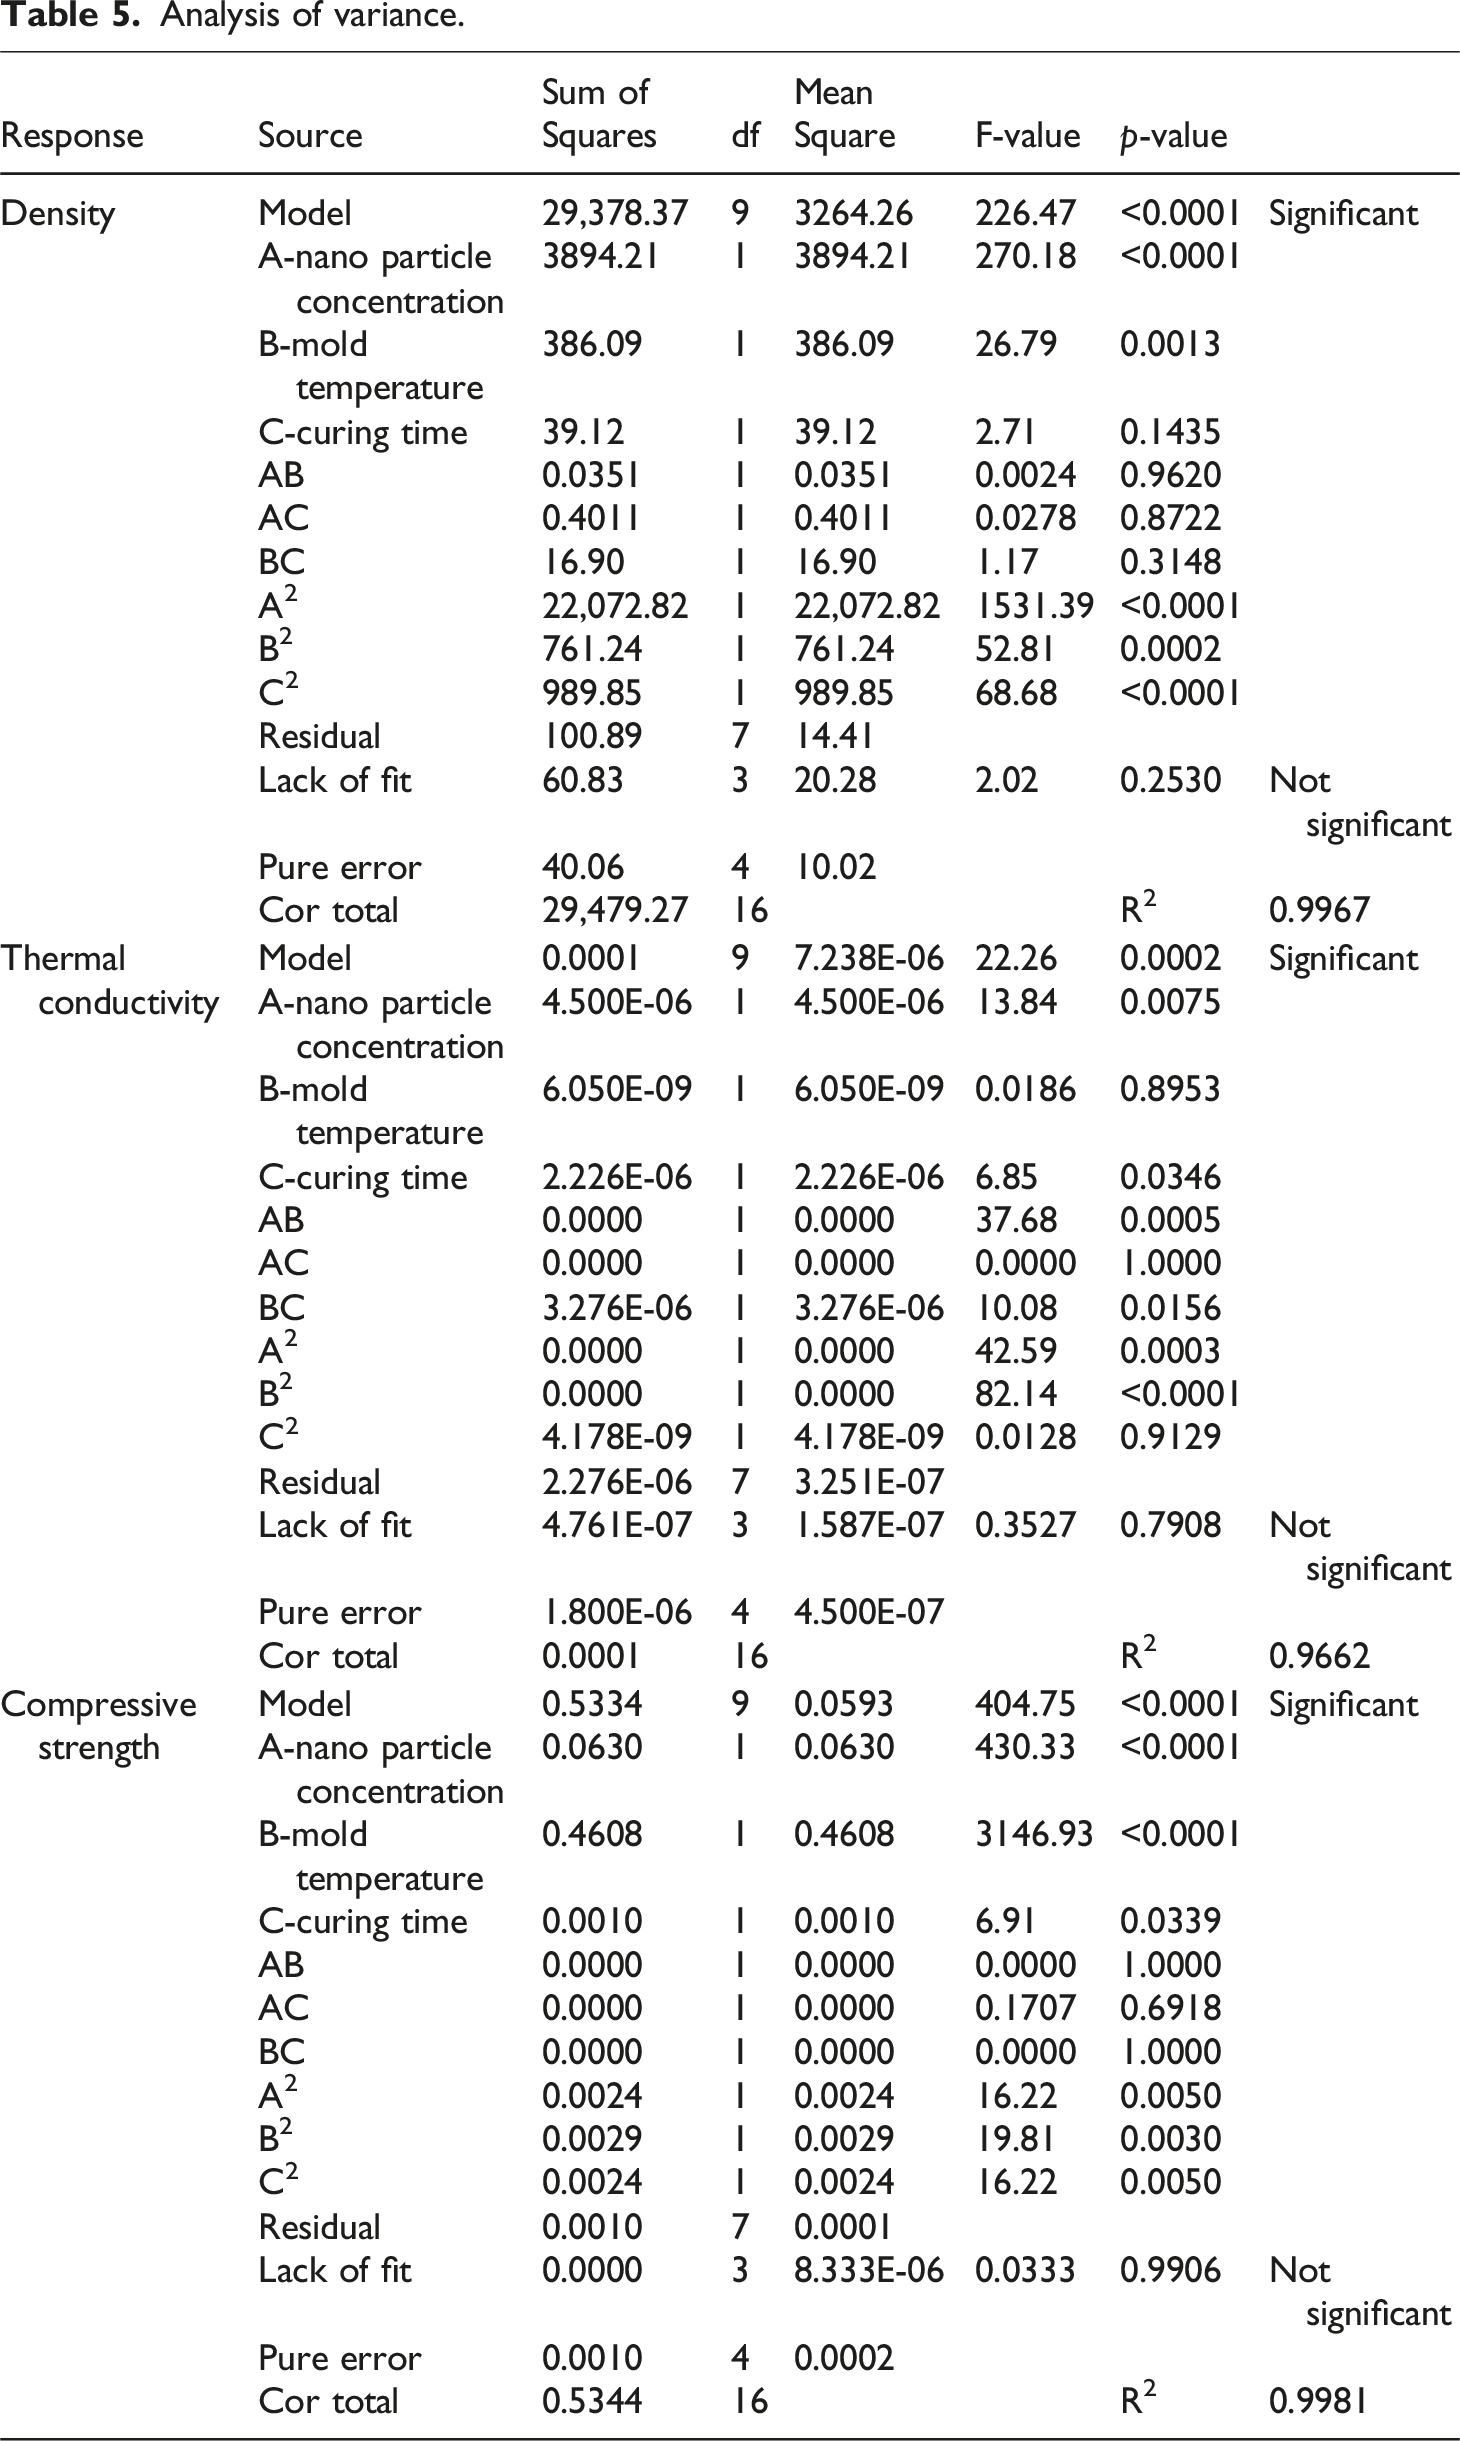
Analysis of variance.
Density
Density is an important property used to determine the supportiveness and durability of polyurethane foams. The higher the density, the better the foam performance; however, this may vary depending on the foam application.
14
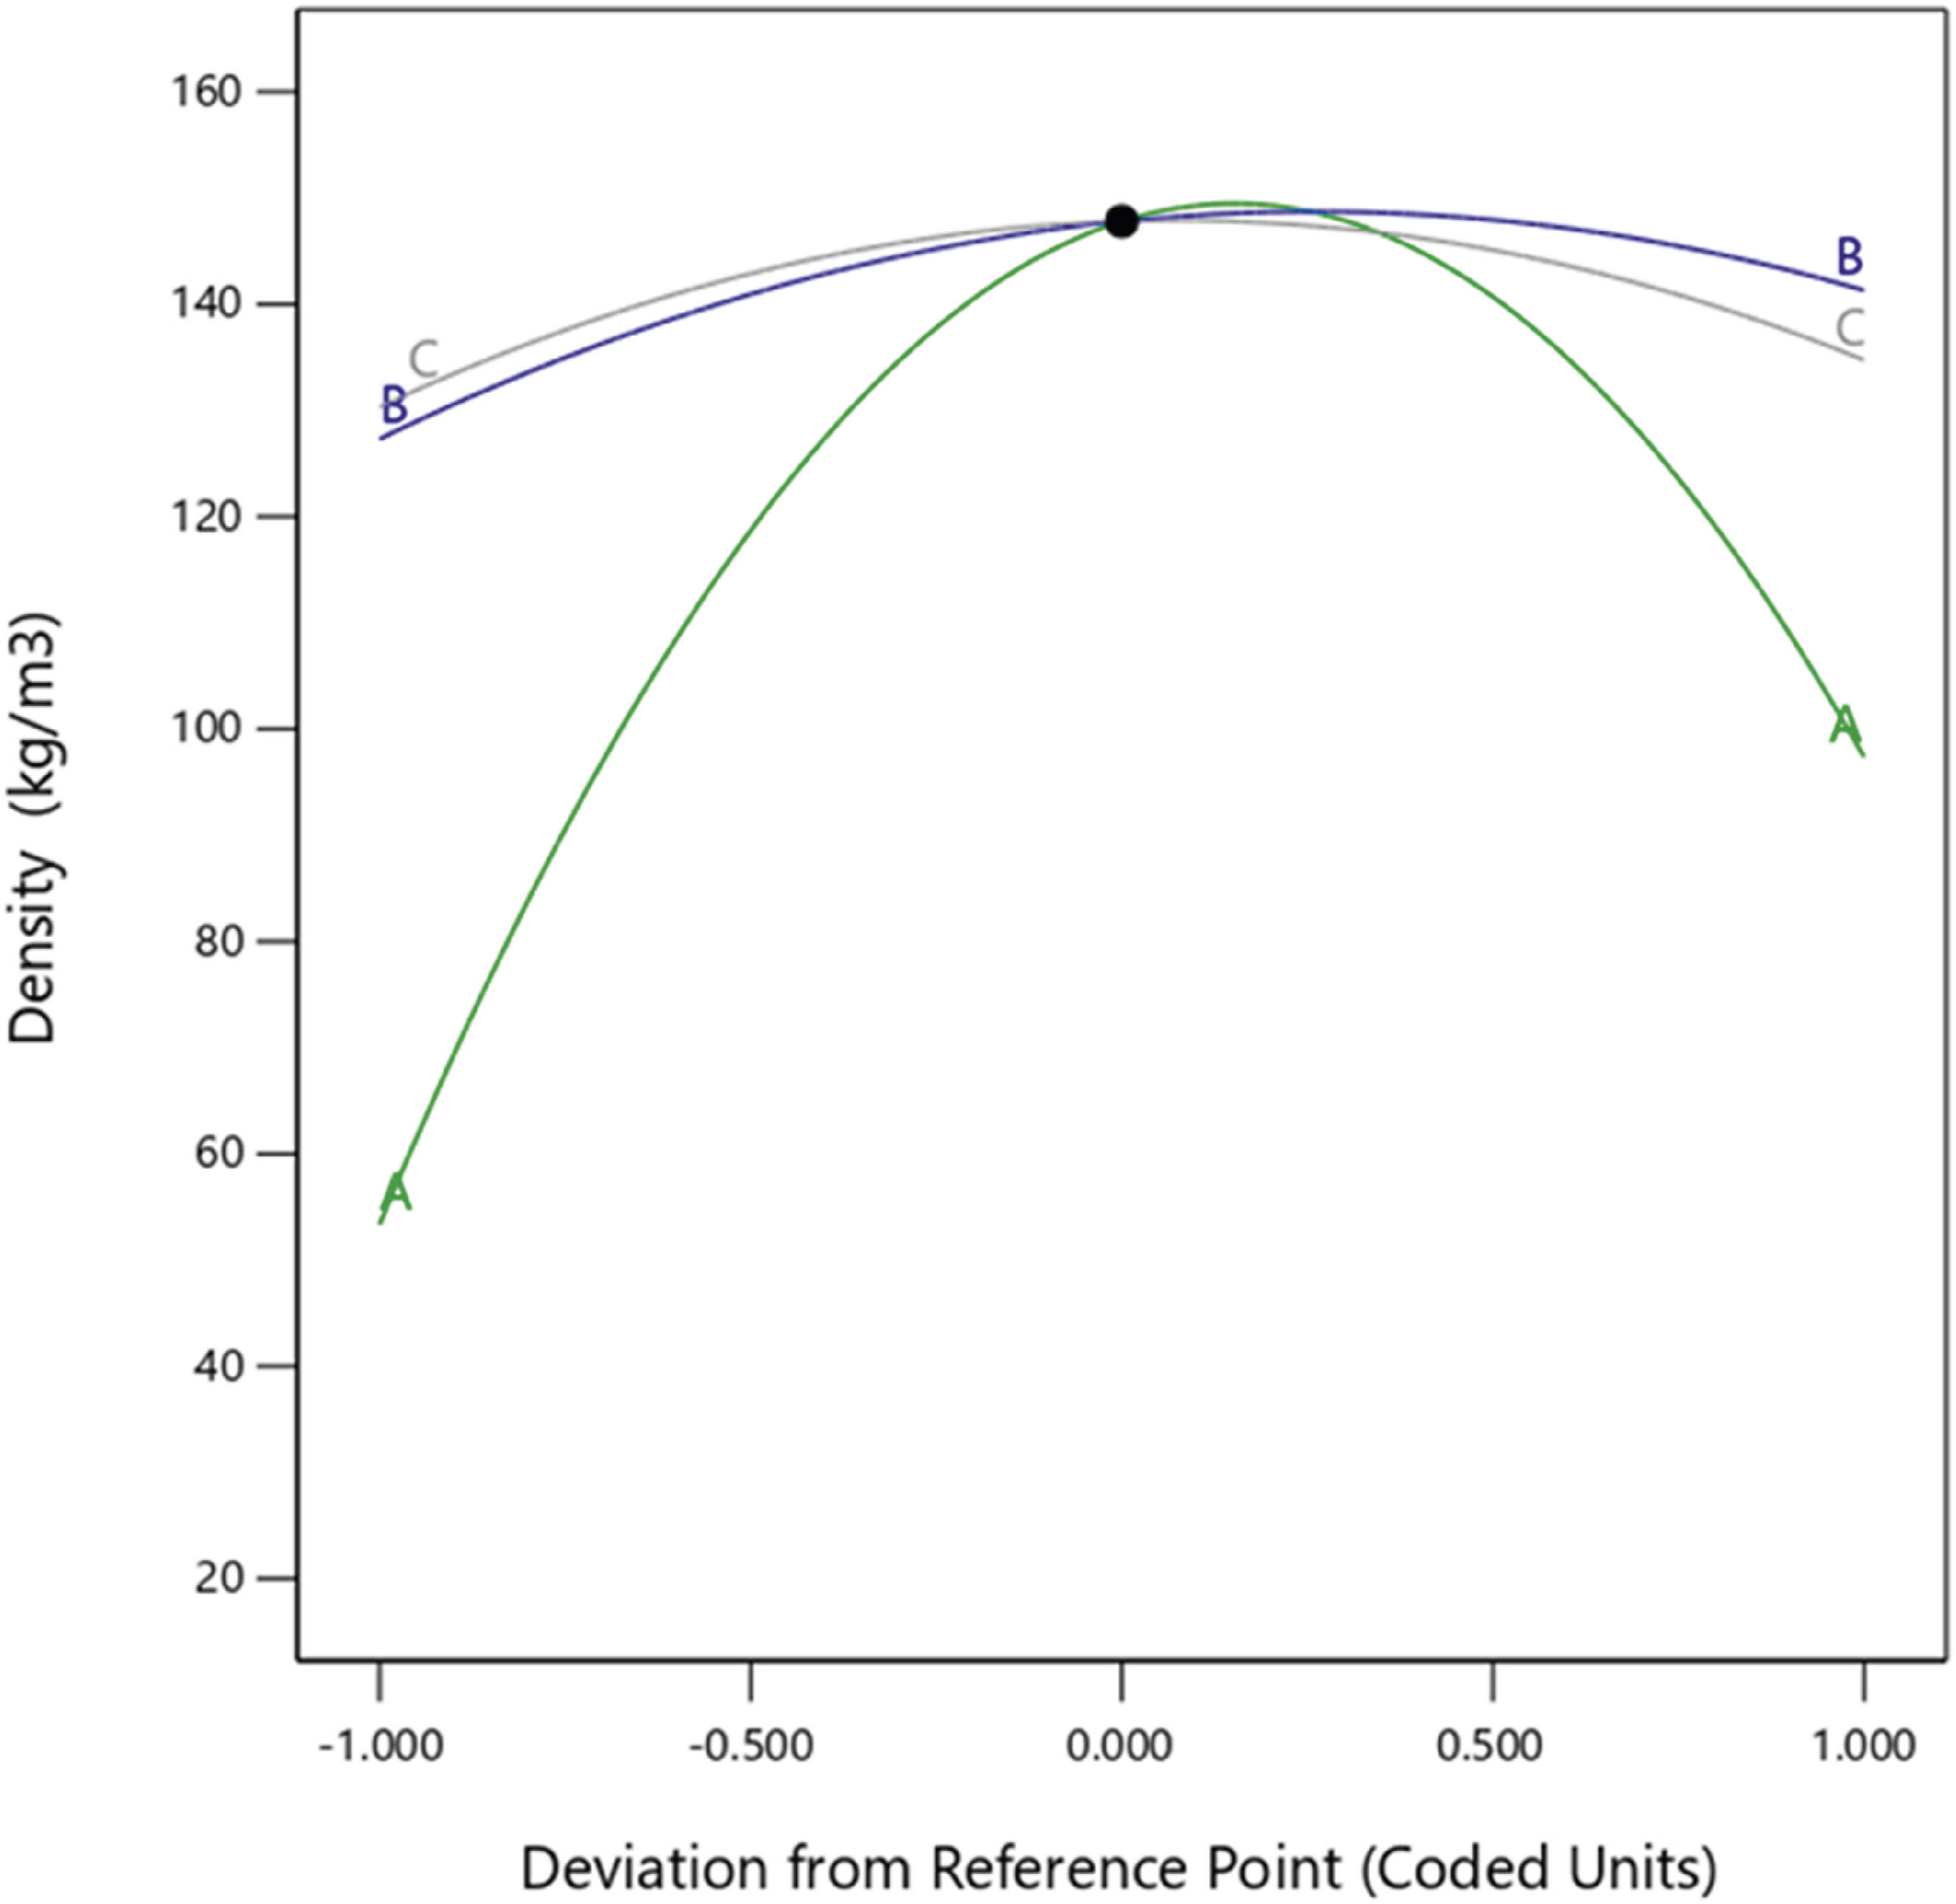
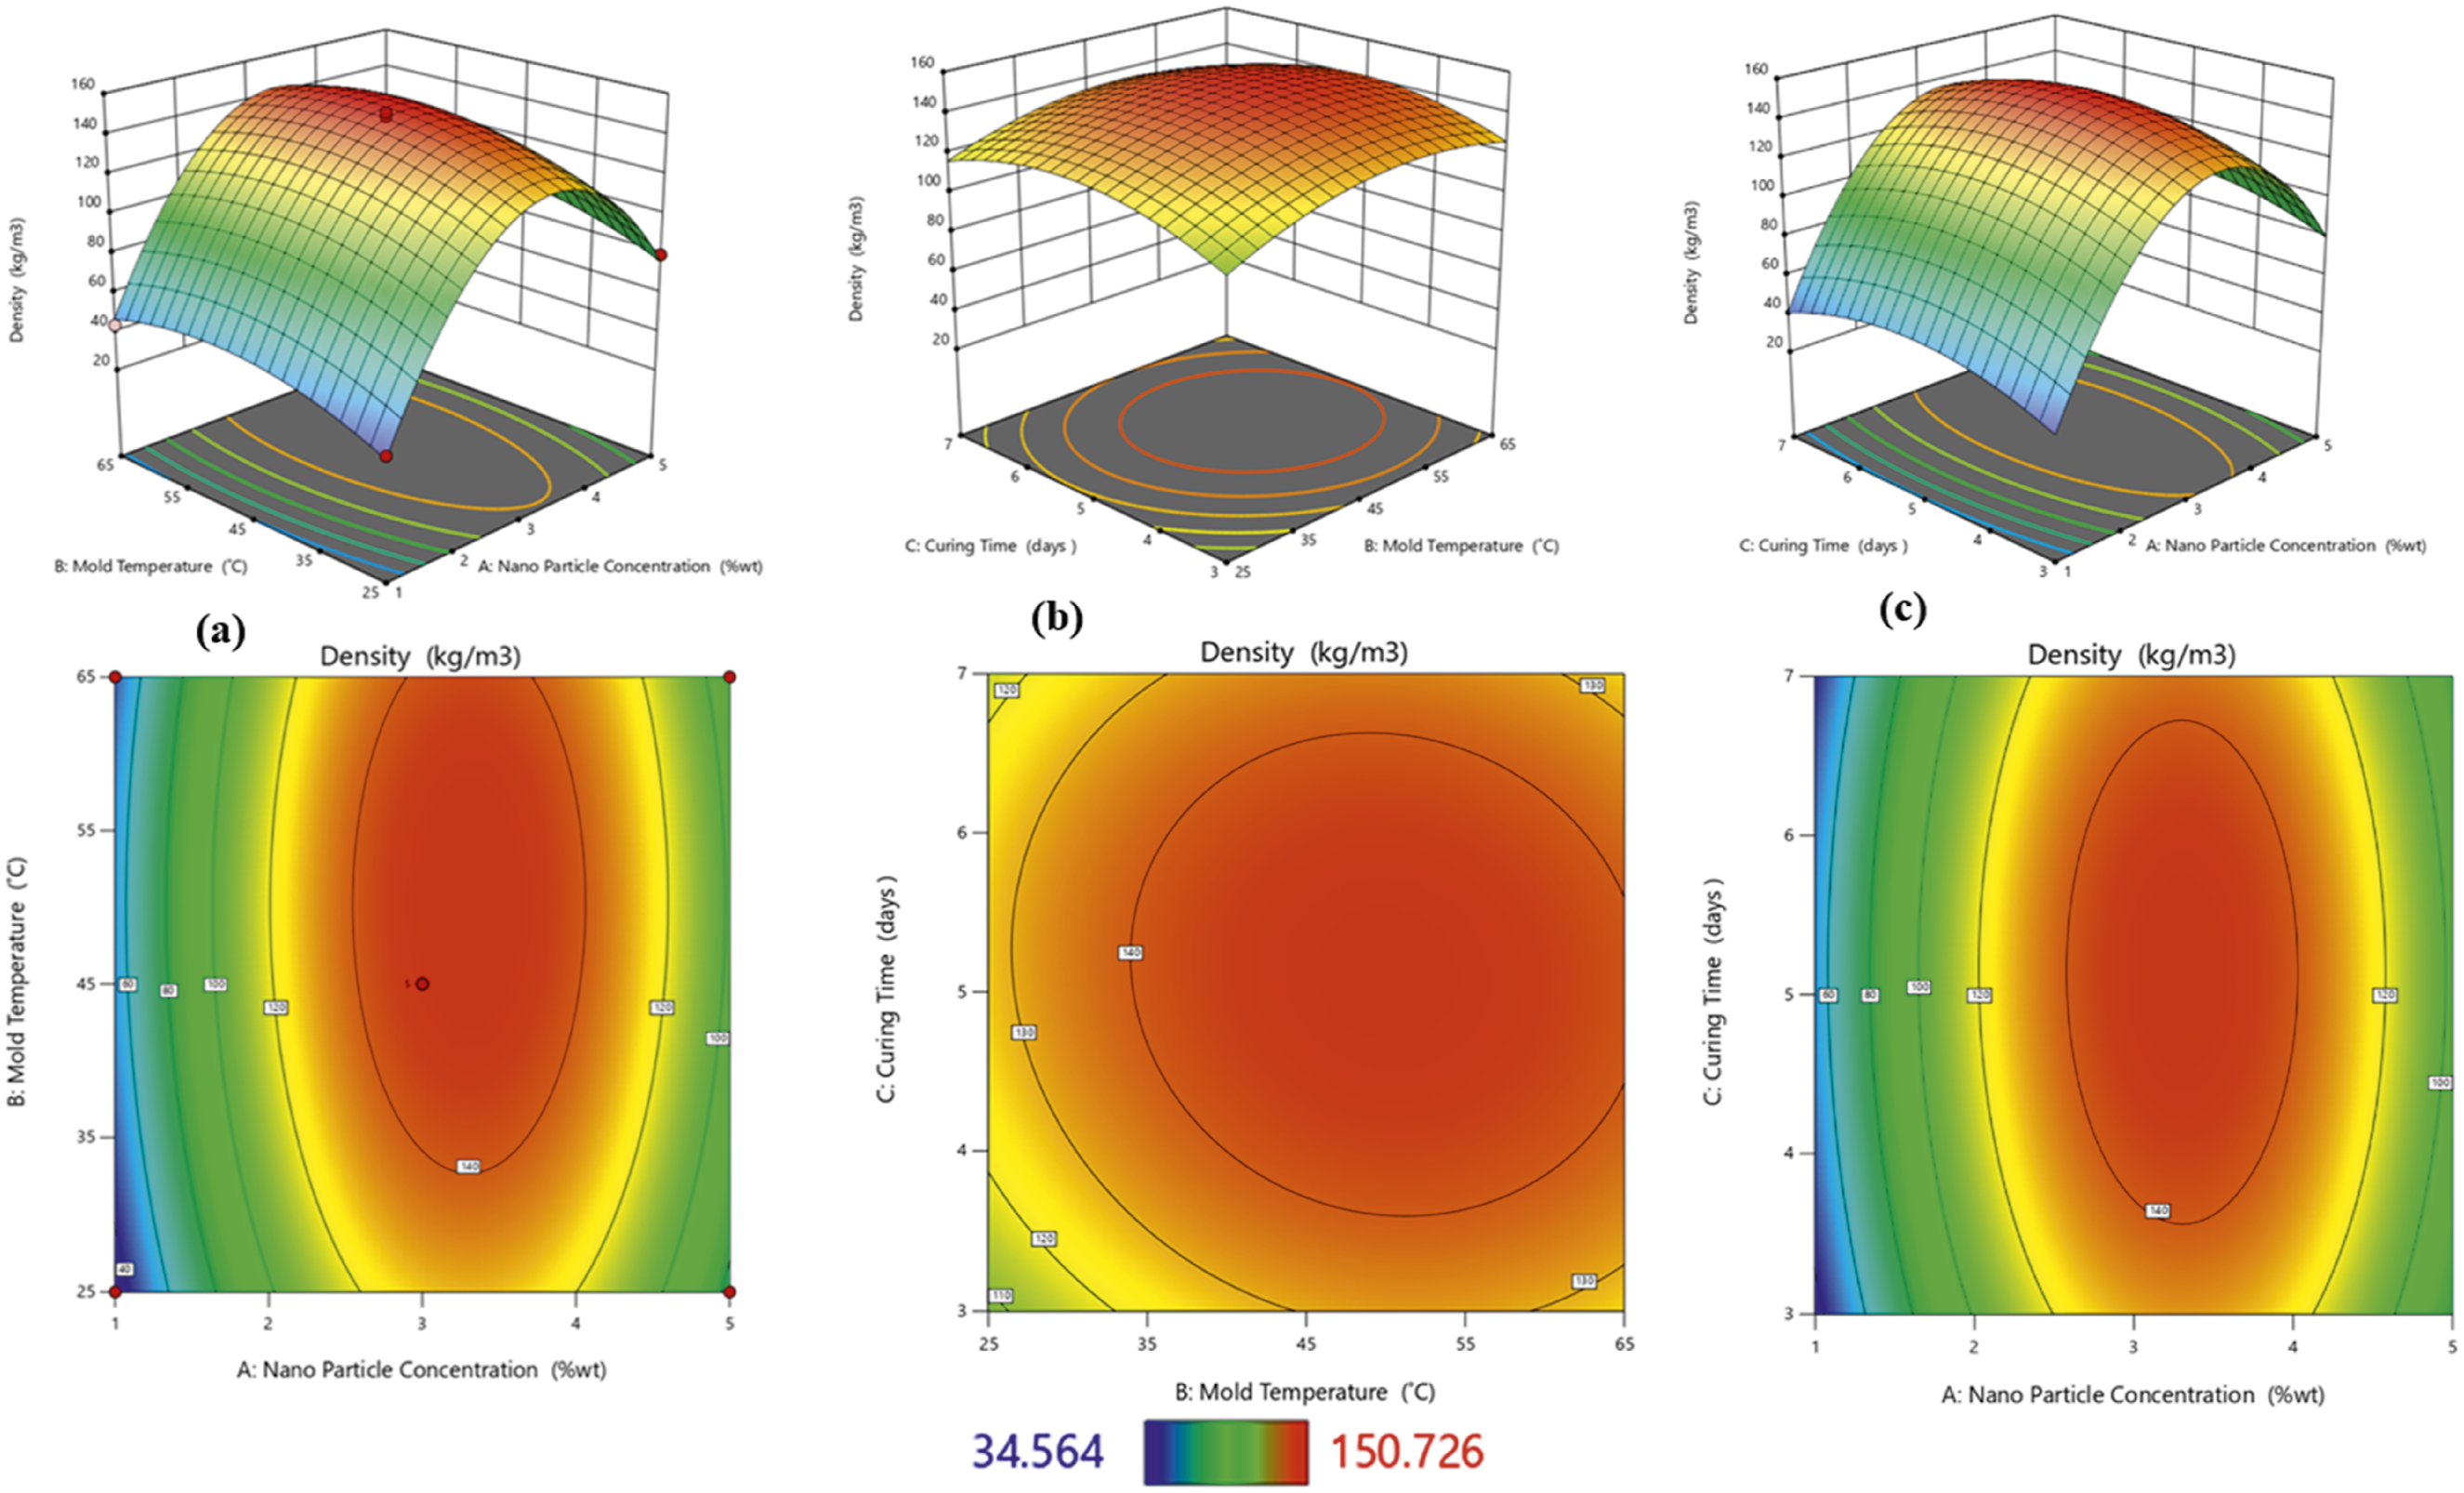
The density was mainly affected by two factors: a significant correlation was observed between the nanoparticle concentration (A) and mold temperature (B) from the p-values 0.0001, and 0.0013 respectively (see Table 5). The p-value (0.1435) also showed no significant correlation between density and curing time (C). This implies that the curing time factor does not significantly affect the density (see Figure 6). The density of the foam samples varied significantly with nanoparticle concentration. The highest density was observed in the 3% nanoparticle concentration samples (104.433-150.726 kg/m3), followed by the 5% nanoparticle concentration samples (80.306-89.546 kg/m3) and then the 1% nanoparticle concentration samples (34.564-43.429 kg/m3), which was comparable to the control sample density (36.3145-42.3245 kg/m3). The decrease in density for some of the 1% nanoparticle concentration samples was attributed to the nucleation effect of the nanoparticles,
10
which enhances bubble formation during foaming. This leads to an increase in foam volume, thereby lowering its density. Additionally, the presence of chemically compatible nanoparticles with silanol functional groups may have facilitated the formation of new polymer cells attached to the PU cellular structure. This increased foam expansivity, leading to high foam volumes and low density.
33
The observed decrease in density can also be attributed to free volume within the polyurethane foam composite. The nucleation effect and enhanced cell expansion caused by the biosilica nanoparticles created more void space within the composite, leading to an increase in the free volume and reduction in the density of the composite foam. These findings are in contrast to those of Soykan et al.
34
who reported a considerable decrease in free volume upon the addition of turkey feather fiber into polyurethane foam. In contrast, the higher density of the 3% nanoparticle concentration samples likely resulted from the increased viscosity of the polyurethane mixture, which restricted bubble expansion and limited foam growth.
35
This led to a low volume and high density of the foam. However, the samples with a nanoparticle concentration of 5% exhibited a lower density than those with a concentration of 3%. This was possibly due to an excessive increase in the viscosity of the polyurethane mixture, which inhibited the foam reaction and led to incomplete expansion compared to that achieved in the 3% nanoparticle concentration samples.
36
This nonlinear trend suggests an optimal nanoparticle concentration for balancing the nucleation and viscosity effects. The foam density varied significantly with the mold temperature, with the highest density measured at 45°C, followed by 65°C, and then 25°C. The decrease in density between 45°C and 65°C can be attributed to the enhanced release of carbon dioxide due to the complete reaction between water and isocyanate. Furthermore, the isocyanate-water reaction is highly exothermic and increases the foam temperature, leading to more carbon dioxide release during foaming.
14
Conversely, the increase in density between 25°C and 45°C may have resulted from a decrease in the amount of blowing agent (H2O) used in the foaming process. This might have reduced the amount of water available for the water-isocyanate reaction, leading to a decrease in the amount of carbon dioxide and hence the volume, increasing the foam’s density.
6
By applying multiple regression analysis within the Box-Behnken design to the experimental data, equation (6), a second-order polynomial equation was determined. Perturbation plot showing the effect of nanoparticle concentration (a), mold temperature (b), and curing time (c) on the density. Density 3D and 2D plot showing effects of (a) nanoparticle concentration and mold temperature, (b) mold temperature and curing time, and (c) nanoparticles concentration and curing time.
Thermal Conductivity
The thermal conductivity test determines a material’s ability to conduct heat. Good thermal insulators have thermal conductivity values below 0.1 W/m · K.
24
The thermal conductivity of the foam nanocomposites was significantly affected by the nanoparticle concentration (A) and curing time (C) compared to the mold temperature (B) (see Figure 8) The highest thermal conductivity values were measured in the 5% nanoparticle concentration samples (0.0507 W/mK), whereas the lowest thermal conductivity values were measured in the 3% nanoparticle concentration samples (0.0429 W/mK). The 1% nanoparticle concentration samples exhibited a modest median thermal conductivity of (0.0456 W/mK), consistent with the density measurements obtained in this study. These findings are consistent with those of previous studies on filler-reinforced polyurethane foams, which demonstrated an increase in thermal conductivity with increasing filler concentration.
37
In open-cell foams, the thermal conductivity is primarily affected by the cell structure and thermal properties of the foaming gases. Because carbon dioxide produced during the reaction between isocyanate and water has a low thermal conductivity, the more carbon dioxide is retained in the cells, the lower the thermal conductivity of the foam.
6
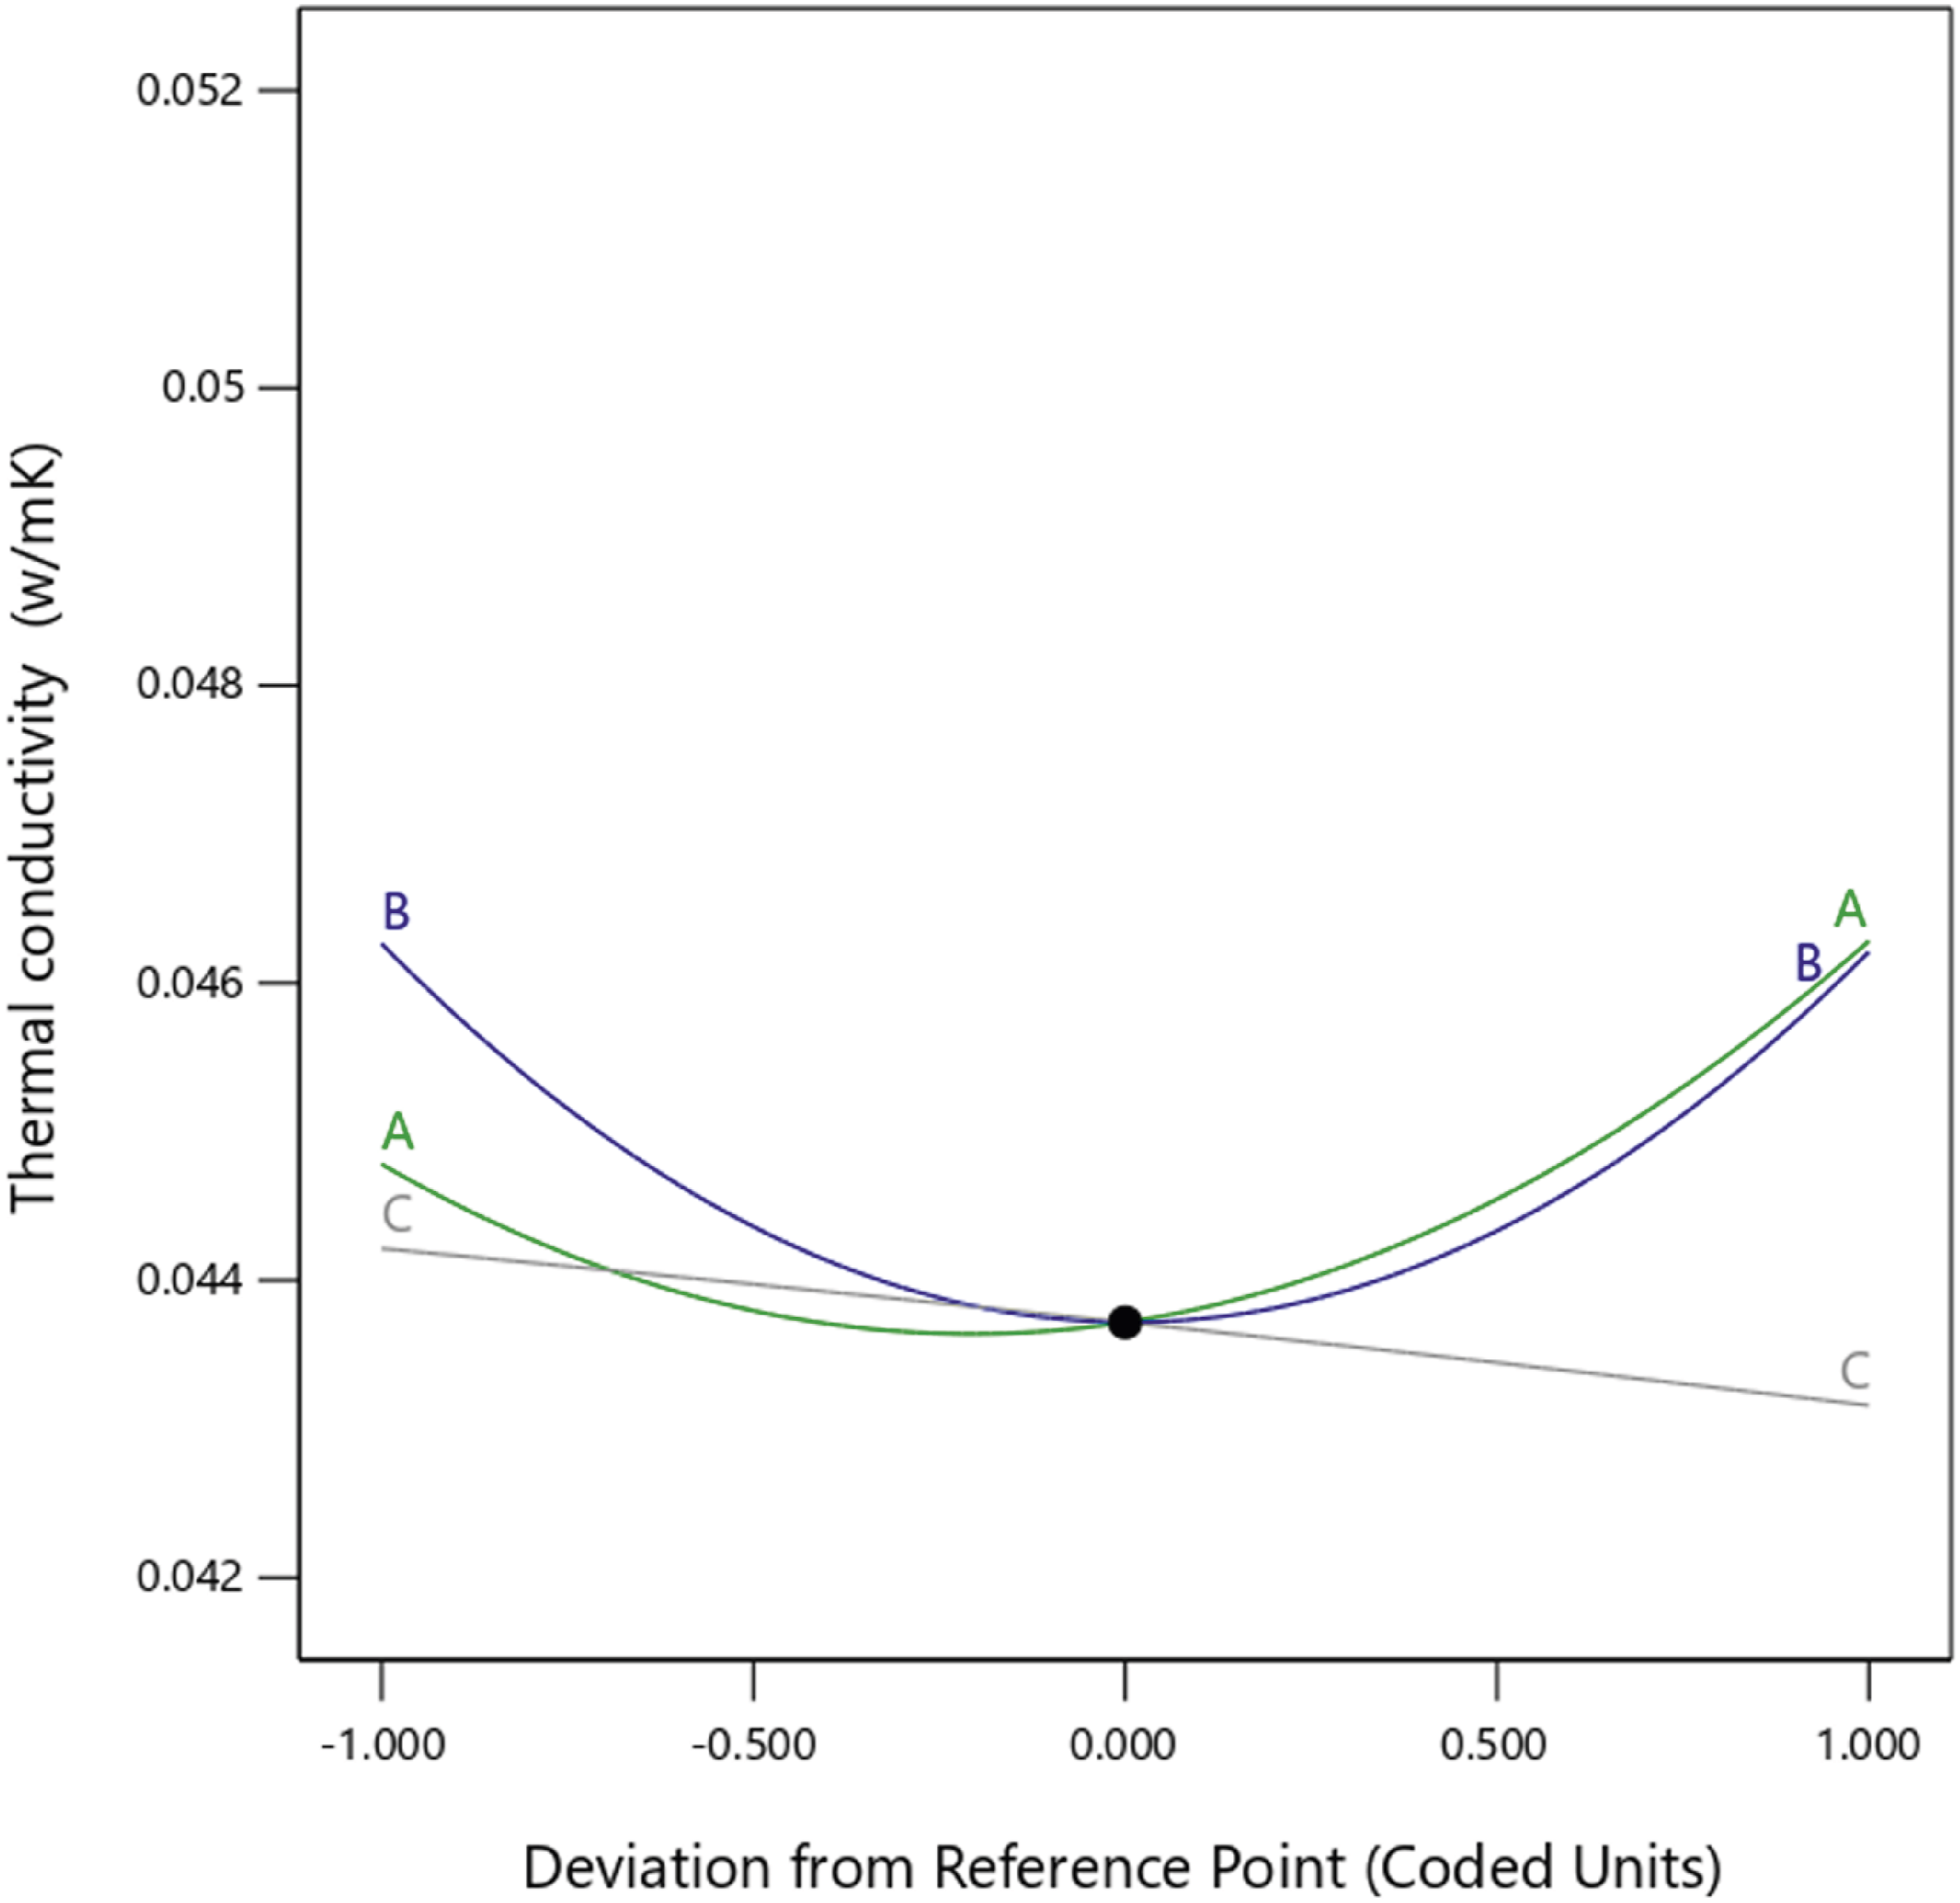
As shown in Figure 9(a) and (b), the thermal conductivity of the nanocomposite foams decreased with an increase in the nanoparticle concentration, and ANOVA supports this finding with a p-value of 0.0075 (see Table 5). Similar results have been reported in previous studies.38,39 The cell structure also affects the thermal conductivity, as a decrease in cell size decreases the thermal conductivity owing to the increase in the number of cells caused by the nucleation effect of the nanoparticles. The low thermal conductivity of the 3% nanoparticle samples can be attributed to their small cell size, which results from restricted bubble formation and reduced carbon dioxide release during foaming. This restriction likely reduces the cell size, as cells are not allowed to completely expand, thus improving the thermal conductivity of the nanocomposite foam. However, despite the improvement, the thermal conductivity values remained slightly higher than those of the control foam, indicating that the addition of nanoparticles introduced minor defects that may have elevated the thermal conductivity. However, the 1% nanoparticle samples exhibited higher thermal conductivity values owing to the enhanced bubble formation, which released more carbon dioxide and formed larger cells that may have enhanced heat transfer through the foam material. The high thermal conductivity of the 5% samples is likely due to the agglomeration of the nanoparticles and increased cell wall defects that disrupted insulation capacity by creating pathways for heat transfer. Despite the increase in the thermal conductivity of all samples, the nanocomposite foams remained suitable for thermal insulation applications because their thermal conductivity values were below the recommended 0.1 W/mK. Equation (7) shows a reduced second-order model relating the thermal conductivity to the experimental factors of nanoparticle concentration (A), mold temperature (B), and curing time (C). Perturbation plot showing the effect of nanoparticle concentration (a), mold temperature (b) and curing time (c) on thermal conductivity. Thermal conductivity 3D and 2D plots showing effects of (a) nanoparticle concentration and mold temperature, (b) nanoparticle concentration and curing time, (c) mold temperature and curing time.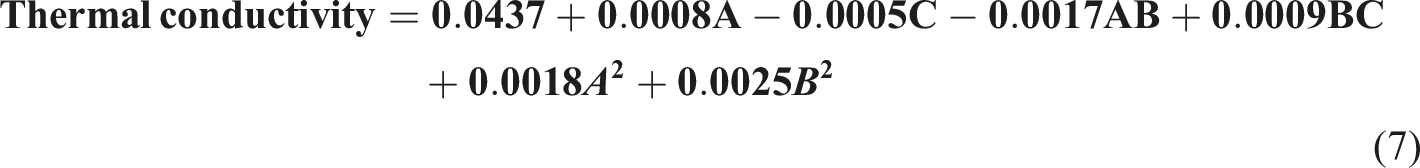
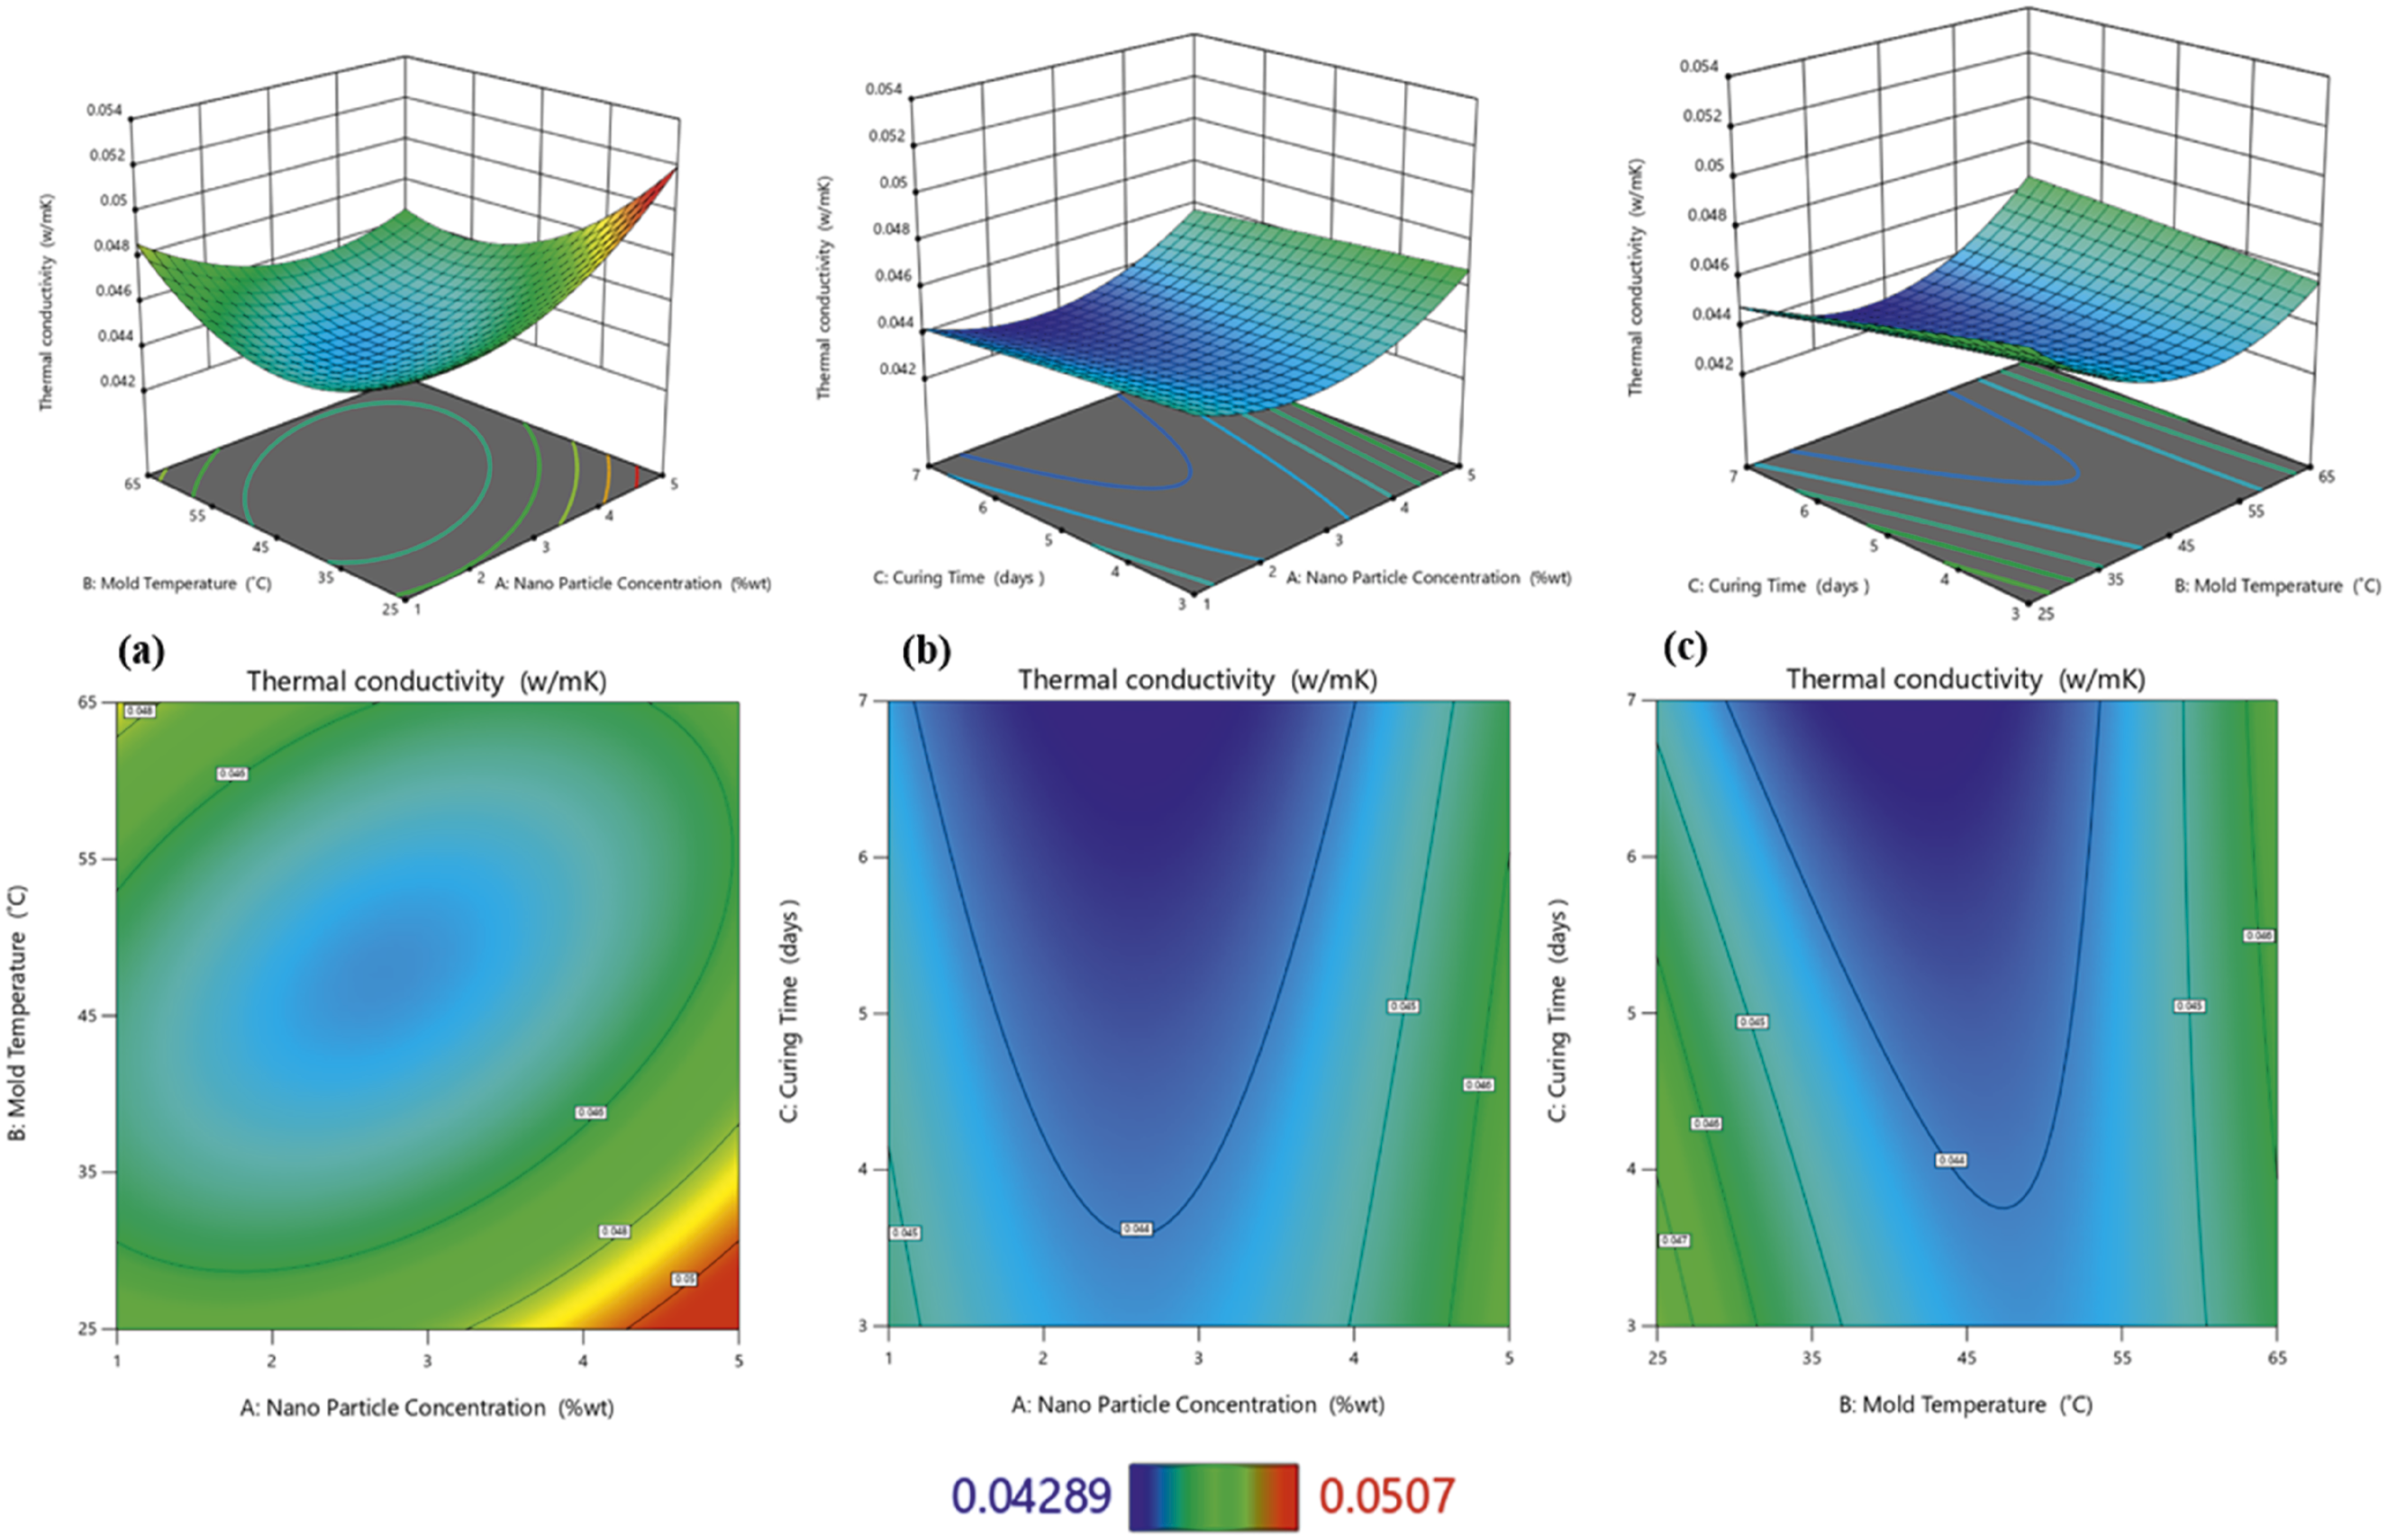
From Table 5, the model’s F-value of 22.26 and p-value of 0.0002 indicate that it was significant. The coefficient of determination, R2, was 0.9662, indicating that the model could explain 96.62% of the variability in the thermal conductivity. The predicted and experimental results showed excellent agreement and correlation. The 3D and 2D response surface plots of the predicted model are shown in Figure 9.
Compressive Strength
The most significant influences on the compressive strength were nanoparticle concentration (A) and mold temperature (B) (see Figure 10). The highest compressive strength of 2.65 MPa was recorded for the 5% nanoparticle concentration and 65°C mold temperature samples, followed by the 3% nanoparticle concentration and 45°C mold temperature samples. The lowest compressive strength was obtained at a nanoparticle concentration of 1% and a mold temperature of 25°C. The 1% nanoparticle concentration and 25°C mold temperature samples also recorded compressive strength lower than the control sample, which may be attributed to the thin pore walls in those foams. The presence of nanoparticles greater than 3% leads to thick and dense pore walls, thus improving the compressive strength of the nanocomposites.
36
The highest compressive strength at a 5% nanoparticle concentration can be attributed to the combined effects of increased solid content
32
and enhanced crosslinking density in the polyurethane composite foam.
40
As the concentration of biosilica nanoparticles increases, the composite foam’s solid content also increases, resulting in stronger cell walls. The hydroxyl groups present on the surface of the biosilica nanoparticles polymerize with the isocyanate groups of the polyurethane foam, leading to the formation of additional urethane linkages, which constitute the hard segment of the polyurethane foam composite. The hard segments impart rigidity and mechanical strength to the foam. This leads to the highest compressive strength at the 5% nanoparticle concentration.
36
The equation (8) shows a reduced second-order model relating compressive strength to the experimental factors of nanoparticle concentration (A), mold temperature (B), and curing time (C). Perturbation plot showing the effect of nanoparticle concentration (a), mold temperature (b), and curing time (c) on compressive strength.
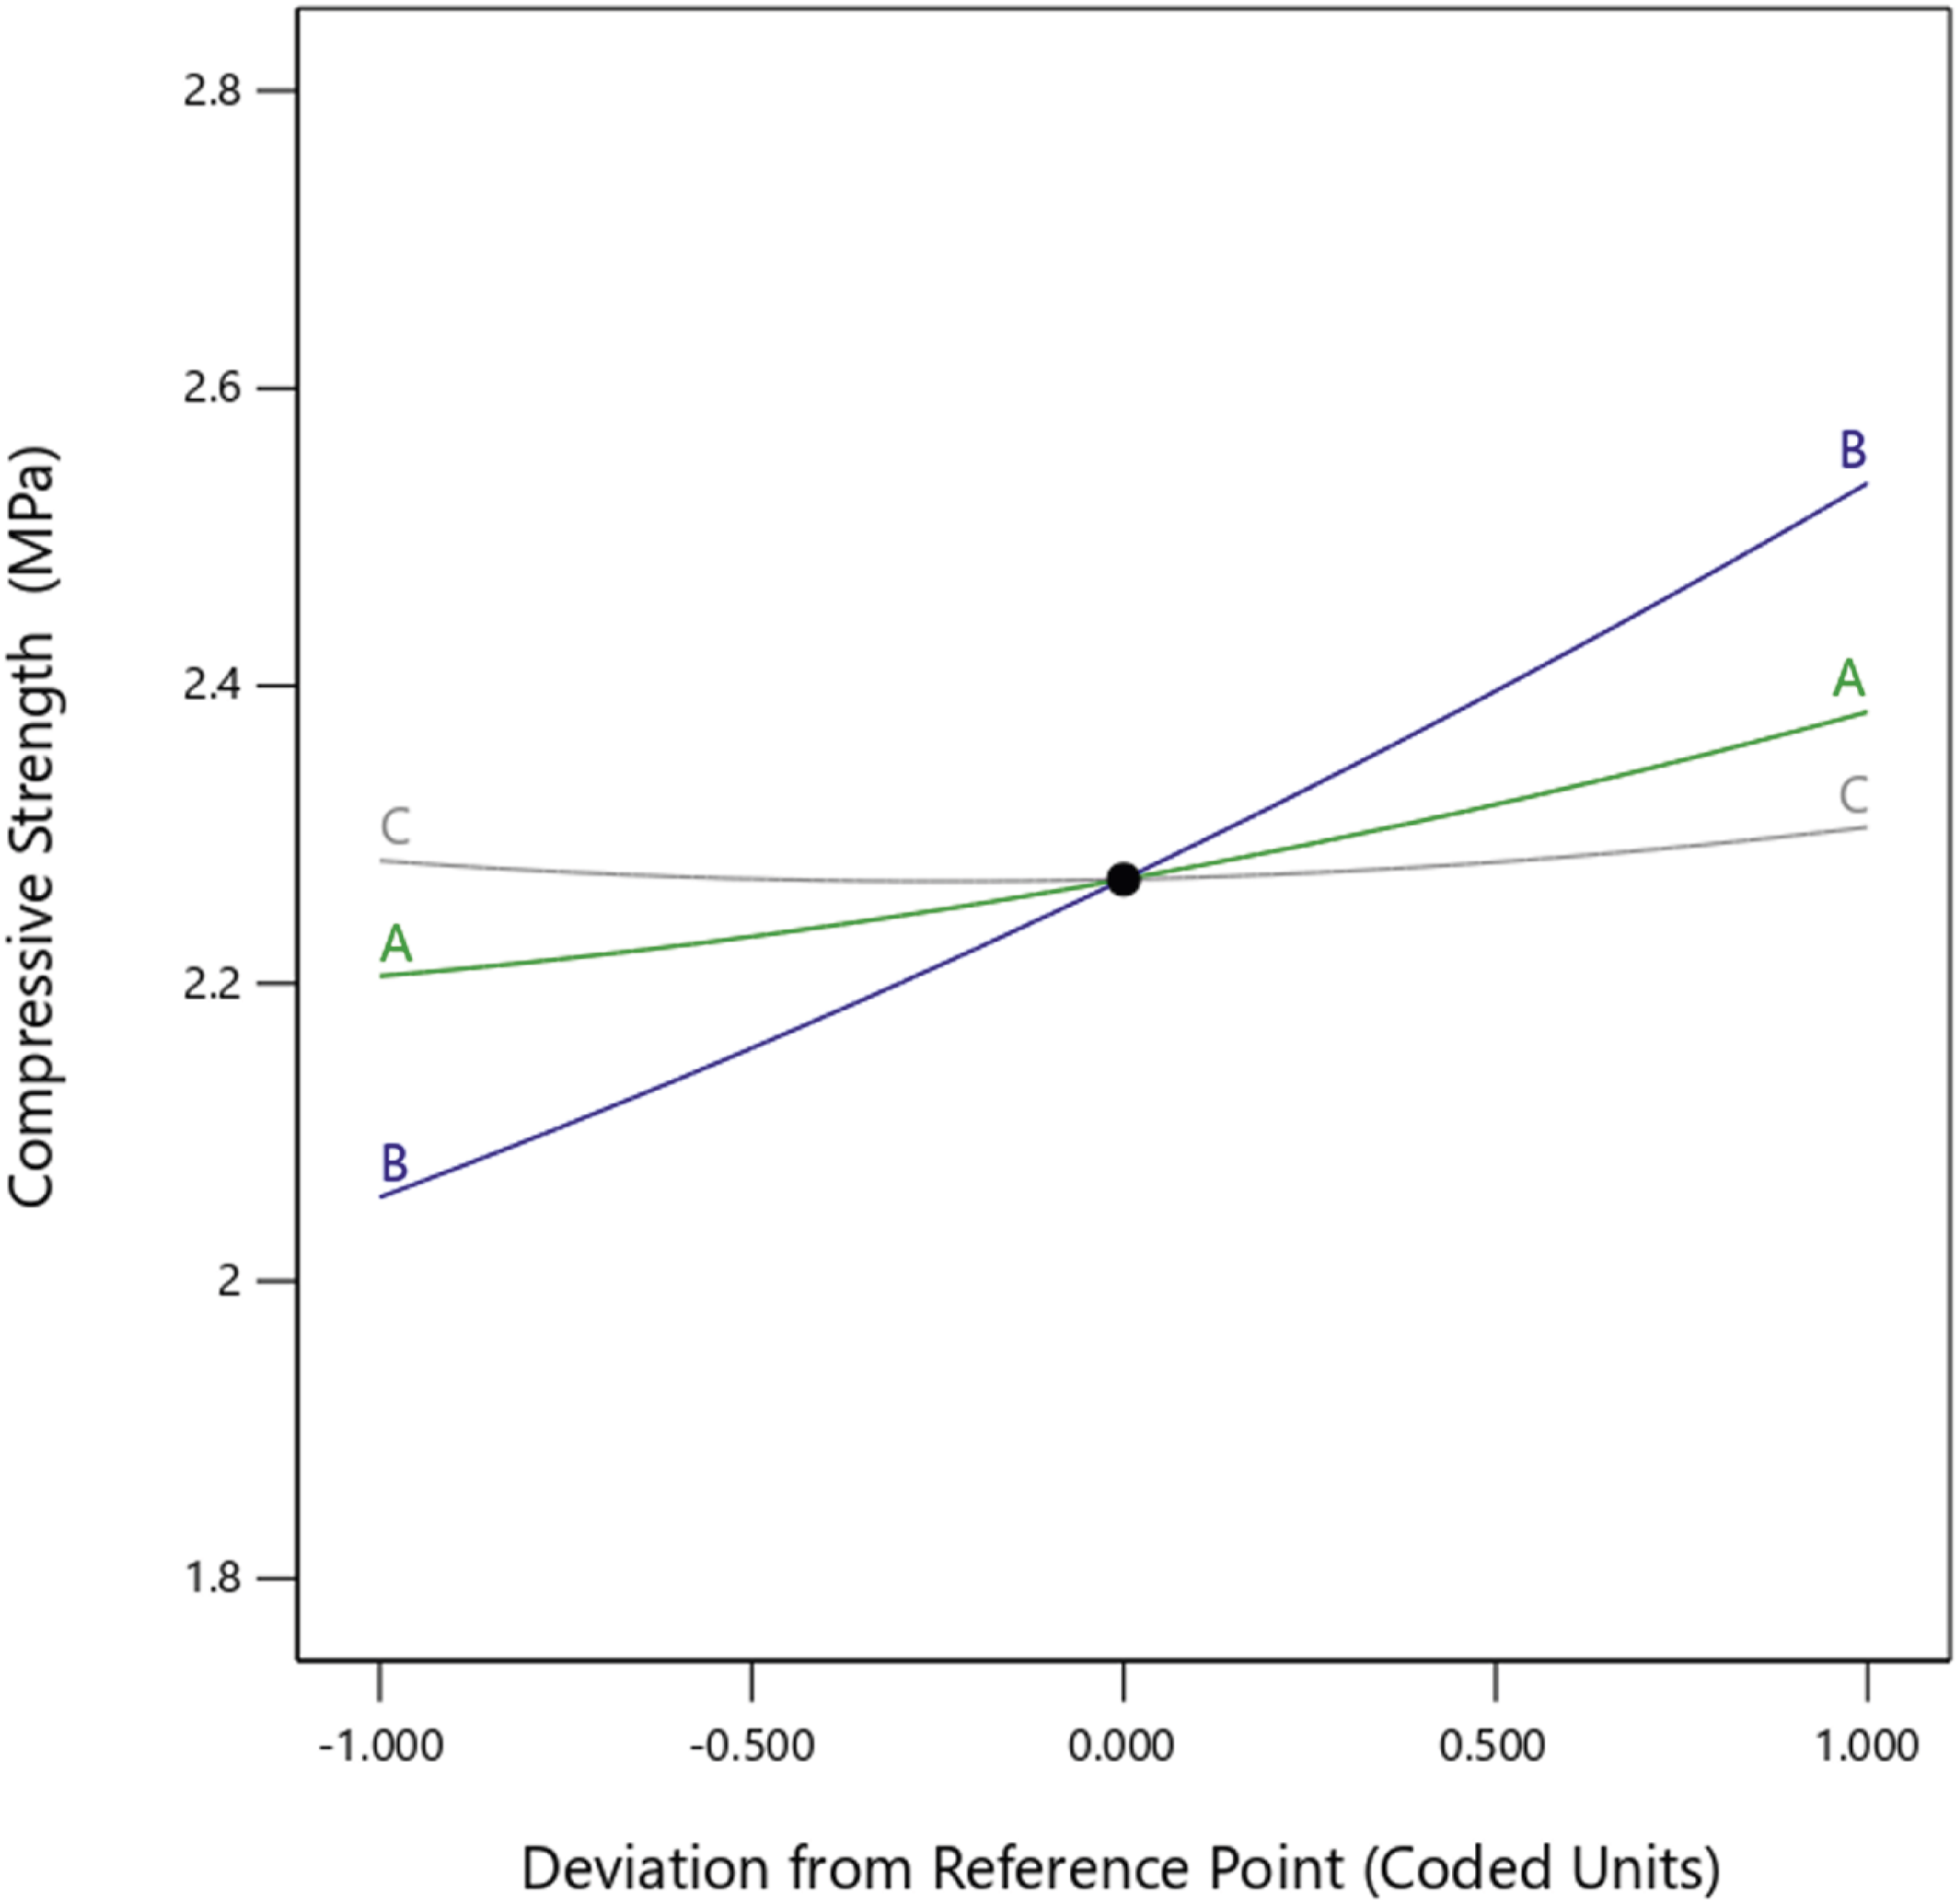
From Table 5 Analysis of variance, the model’s F-value of 404.75 and p-value of 0.0001 indicate that it was significant. The coefficient of determination, R2, was 0.9981, indicating that the model could explain 99.81% of the variability in compressive strength. The predicted and experimental results showed excellent agreement and correlation. The 3D and 2D response surface plots of the predicted results are shown in Figure 11. Compressive strength 3D and 2D plots showing effects of (a) nanoparticle concentration and mold temperature, (b) mold temperature and curing time and (c) nanoparticle concentration and curing time.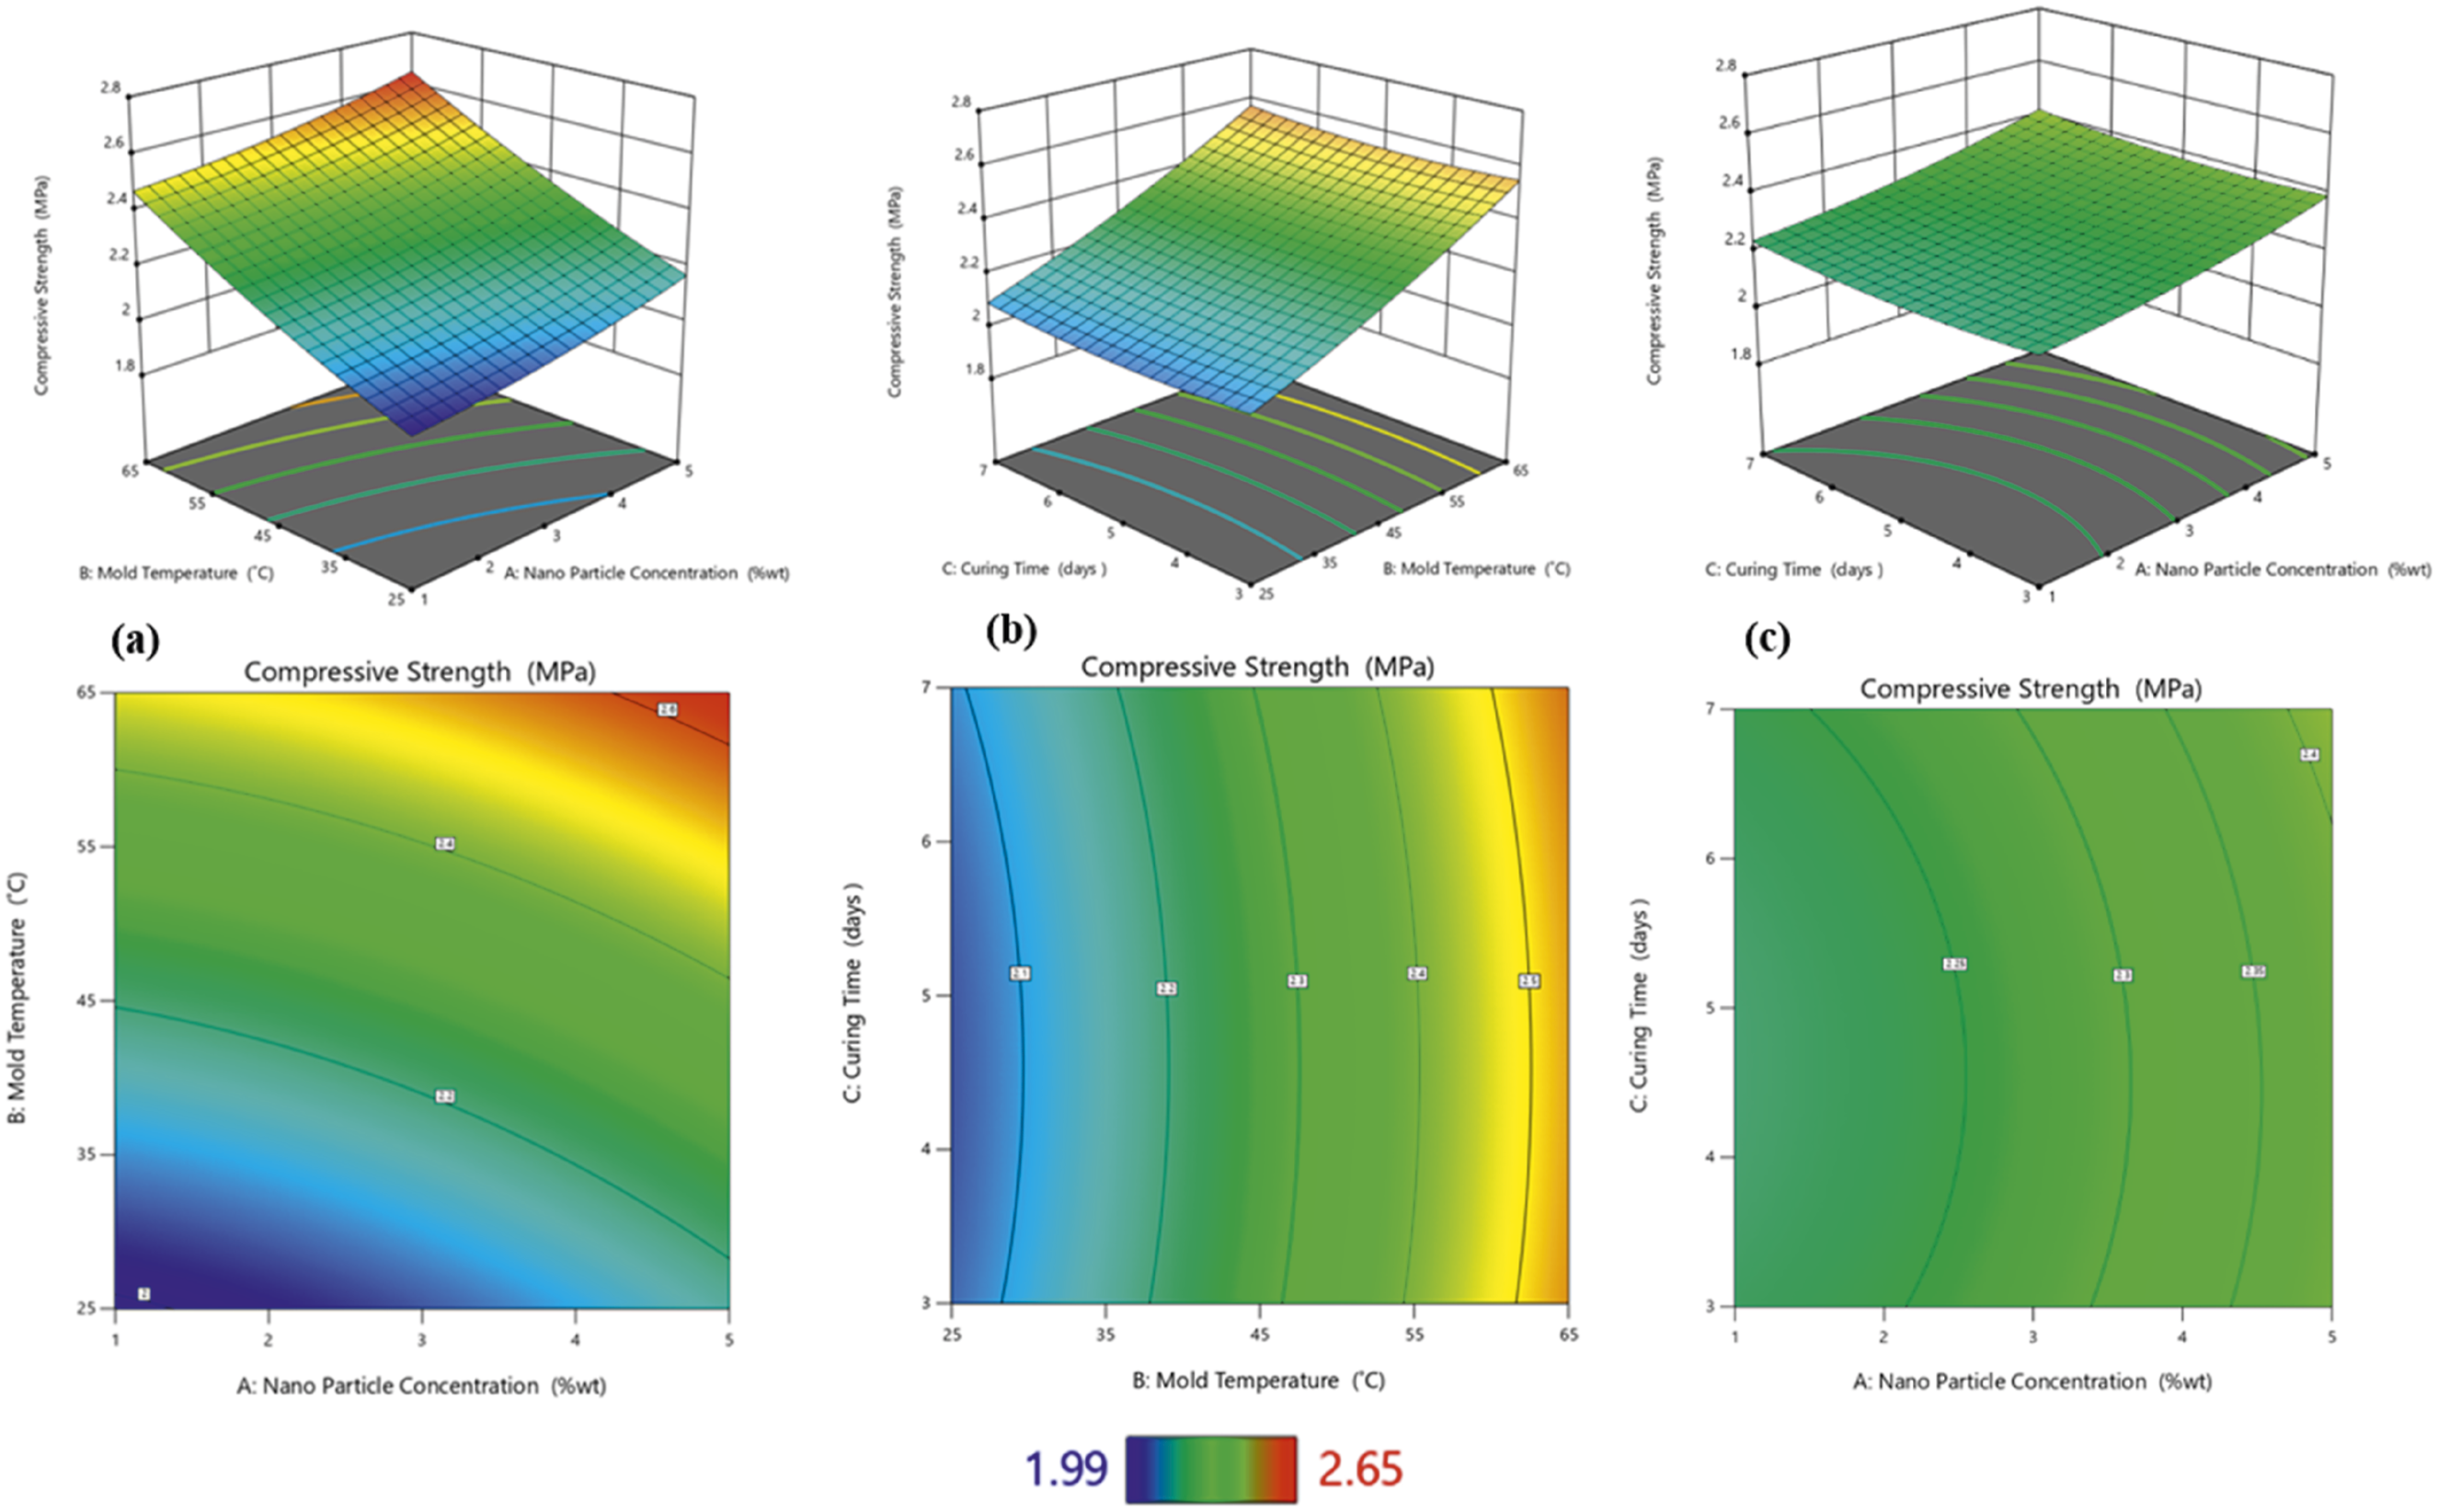
Surface morphology of nanocomposite foams
The cell structure and surface morphology of the nanocomposite foams were examined using a Zeiss Stemi 508 stereomicroscope. Two runs from the 17 runs were analyzed to determine the effect of the process parameters on the cell structure of the nanocomposite foam. Run 17, that was manufactured with 3% nanoparticles concentration, 45°C mold temperature and curing time of 3 days, showed small spherical cells that were uniformly distributed (see Figure 12 (A and B)). This validated the lower thermal conductivity obtained by the sample, as well as the high density and compressive strength. The lower thermal conductivity can be attributed to the small spherical cells, which inhibited the heat transfer through the material. A decrease in the cell size of polyurethane foam has been shown to decrease its thermal conductivity.
6
However, run 5, which was manufactured with a 1% nanoparticle concentration, 65°C, and a curing time of 5 days, showed large spherical cells with a more non-uniform cell distribution (see Figure 12(C) and (D)). This validates the high thermal conductivity and low density obtained by the sample. The high thermal conductivity is attributed to the defects and imperfections caused by the high mold temperature, which may have distorted the cell distribution and caused the material to conduct more heat, thus leading to a high thermal conductivity. An increase in the mold temperature has been shown to decrease the density of polyurethane foams.
14
Zeiss Stemi 508 stereomicroscope images of Run 17 10 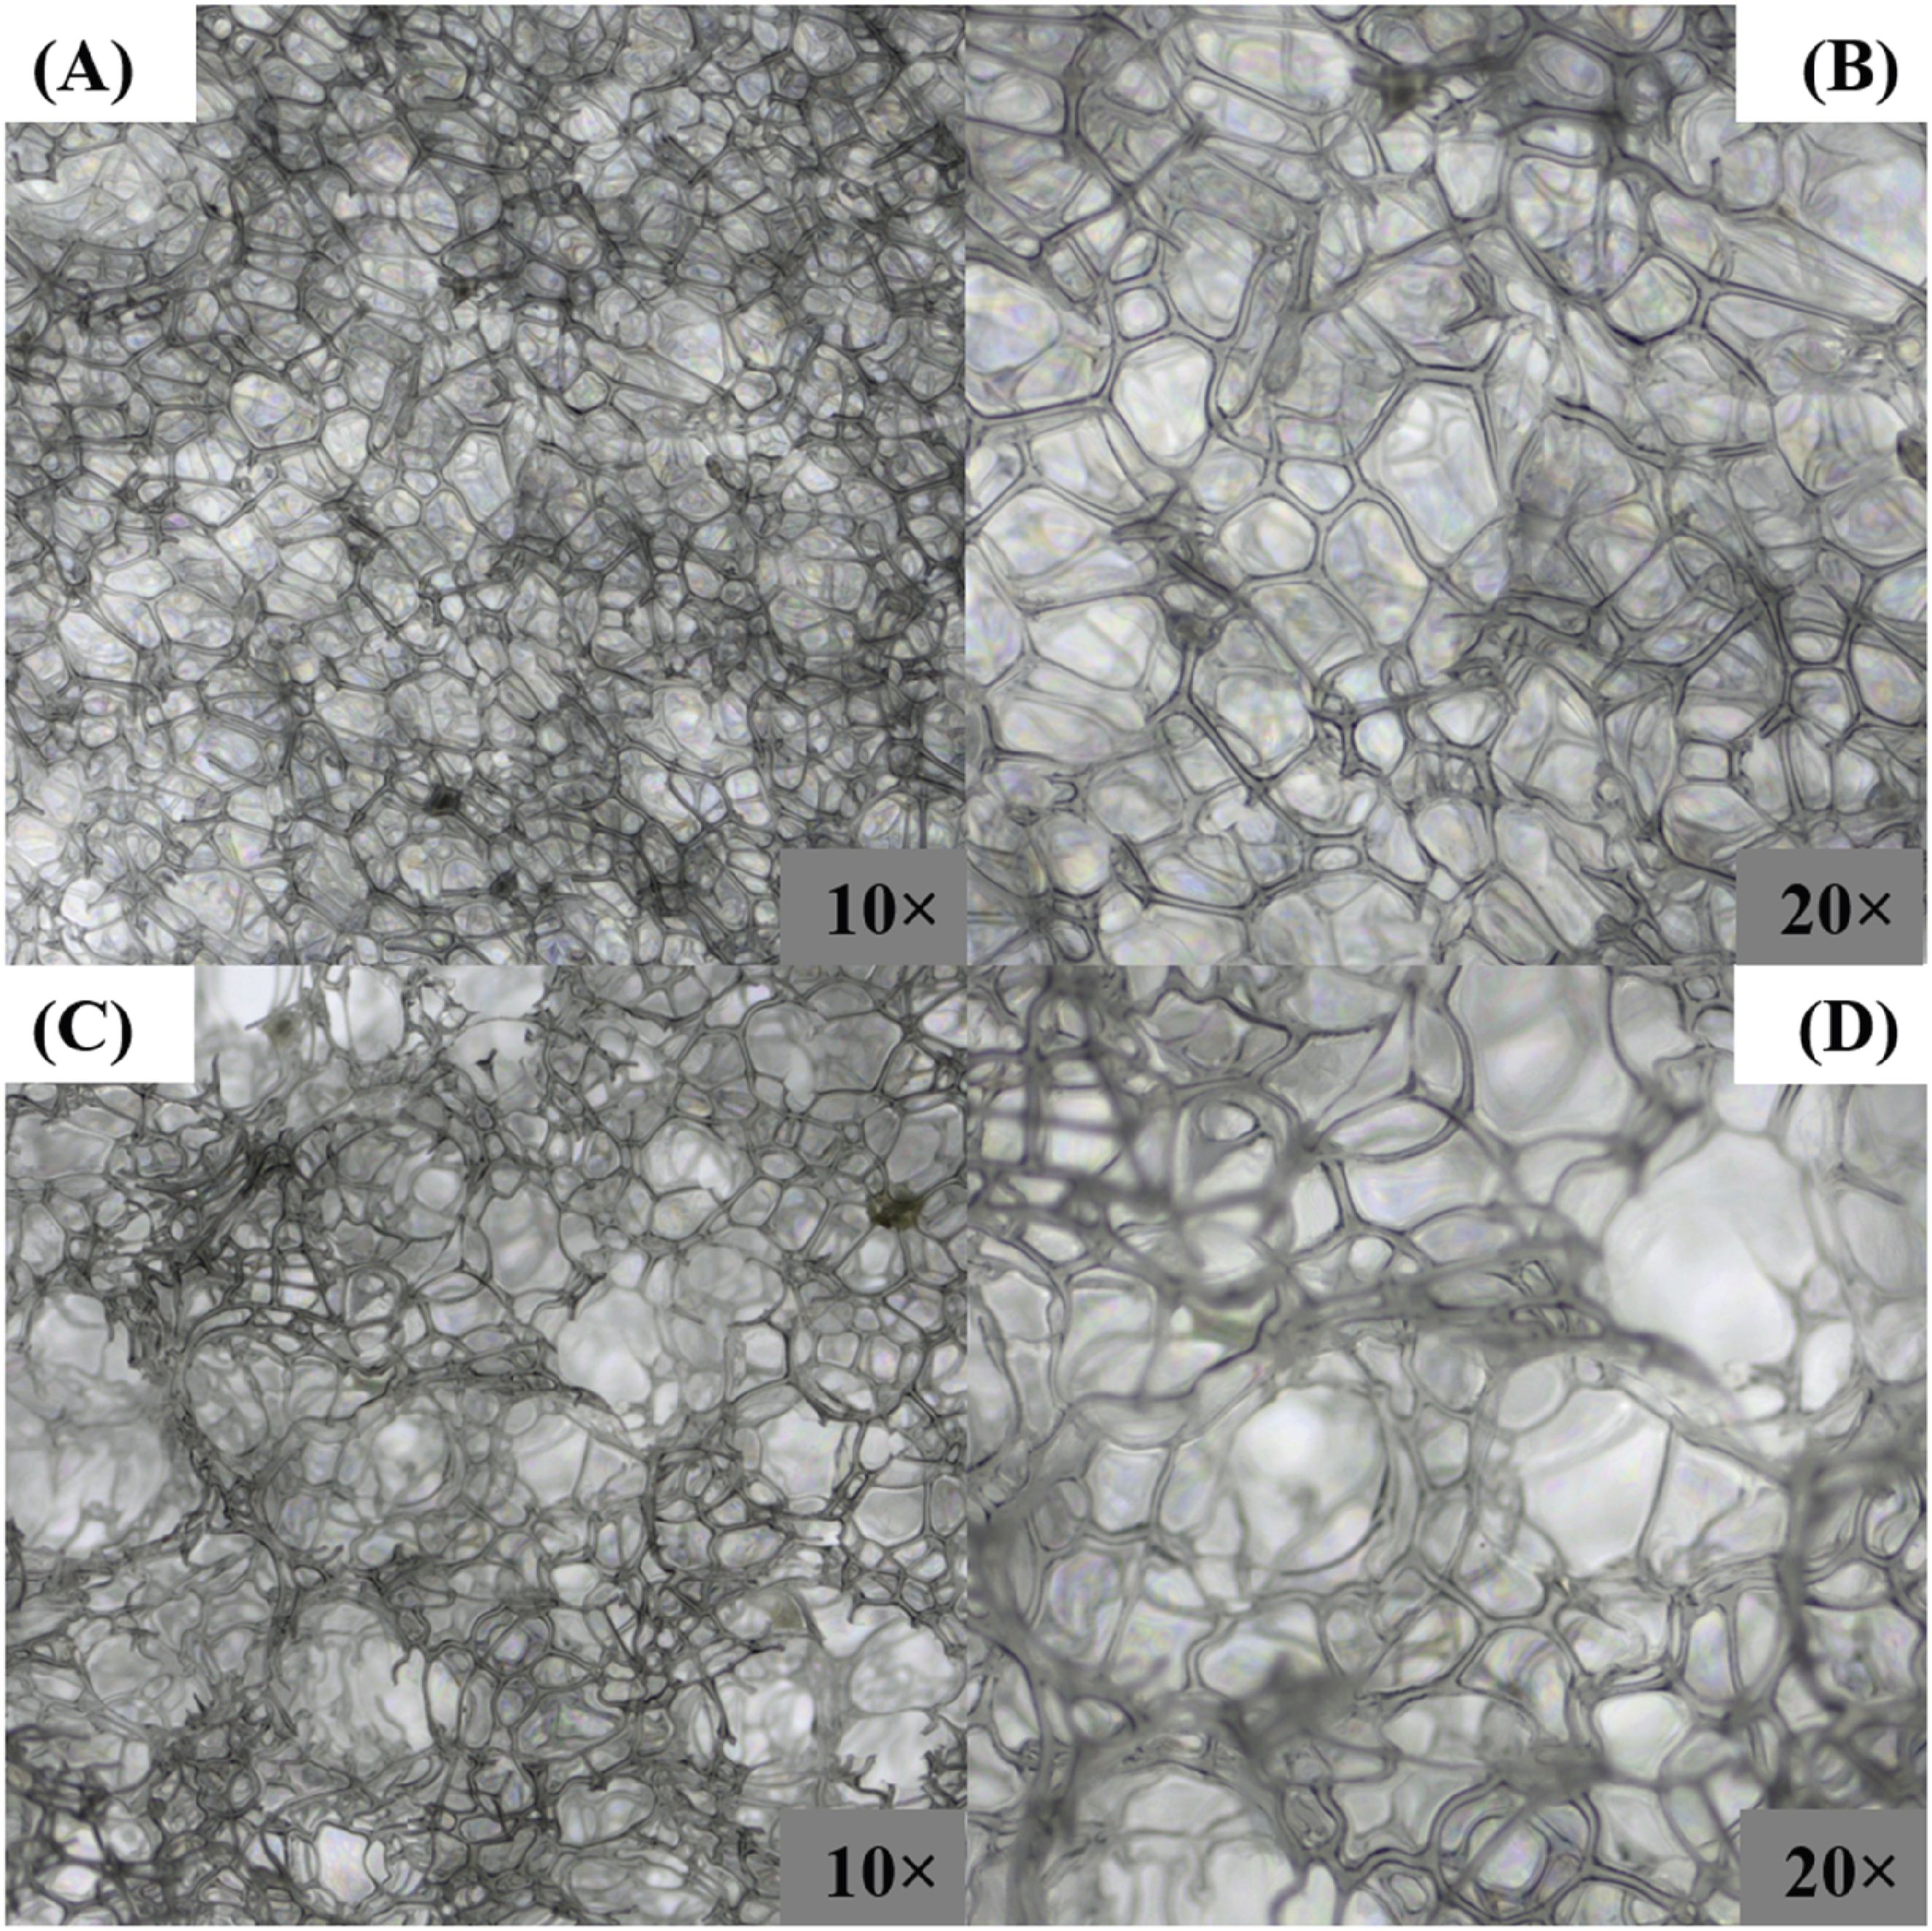
Polyurethane foam nanocomposite optimization studies
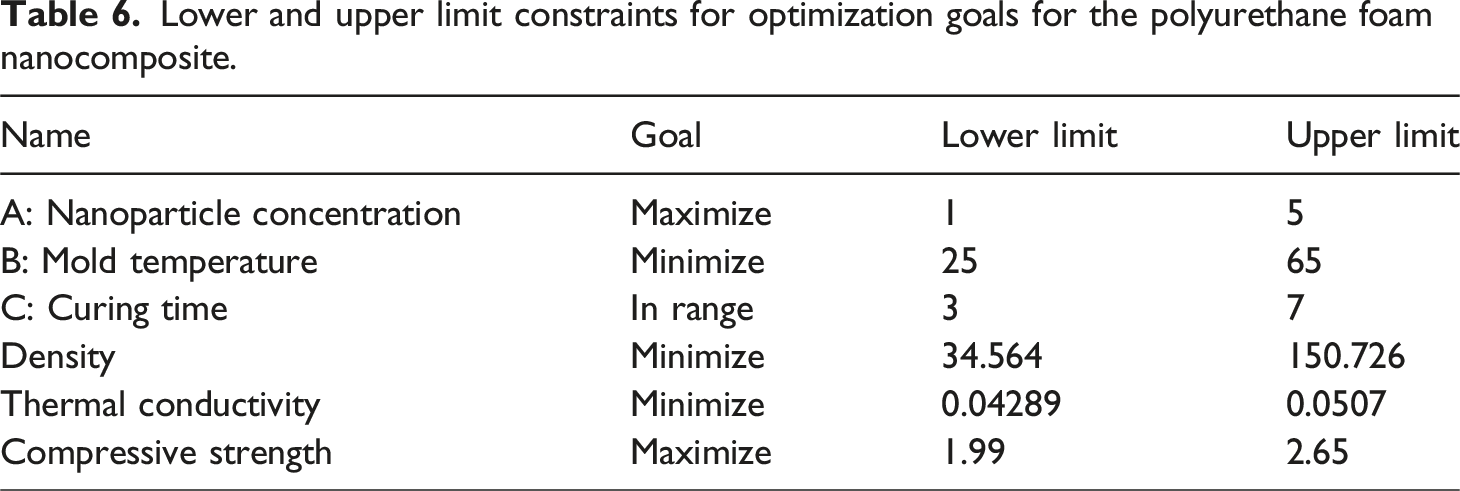
To achieve optimal performance, the most desirable treatment for the developed polyurethane foam composite must carefully balance all key process parameters, namely, the nanoparticle concentration, mold temperature, and curing time. A low nanoparticle concentration in the polyurethane matrix (1%) enhanced the bubble formation, resulting in low-density composite foams with moderate thermal conductivity. However, a moderate nanoparticle concentration (3%) inhibited foam expansion, leading to high-density foams with low thermal conductivity.
Lower and upper limit constraints for optimization goals for the polyurethane foam nanocomposite.
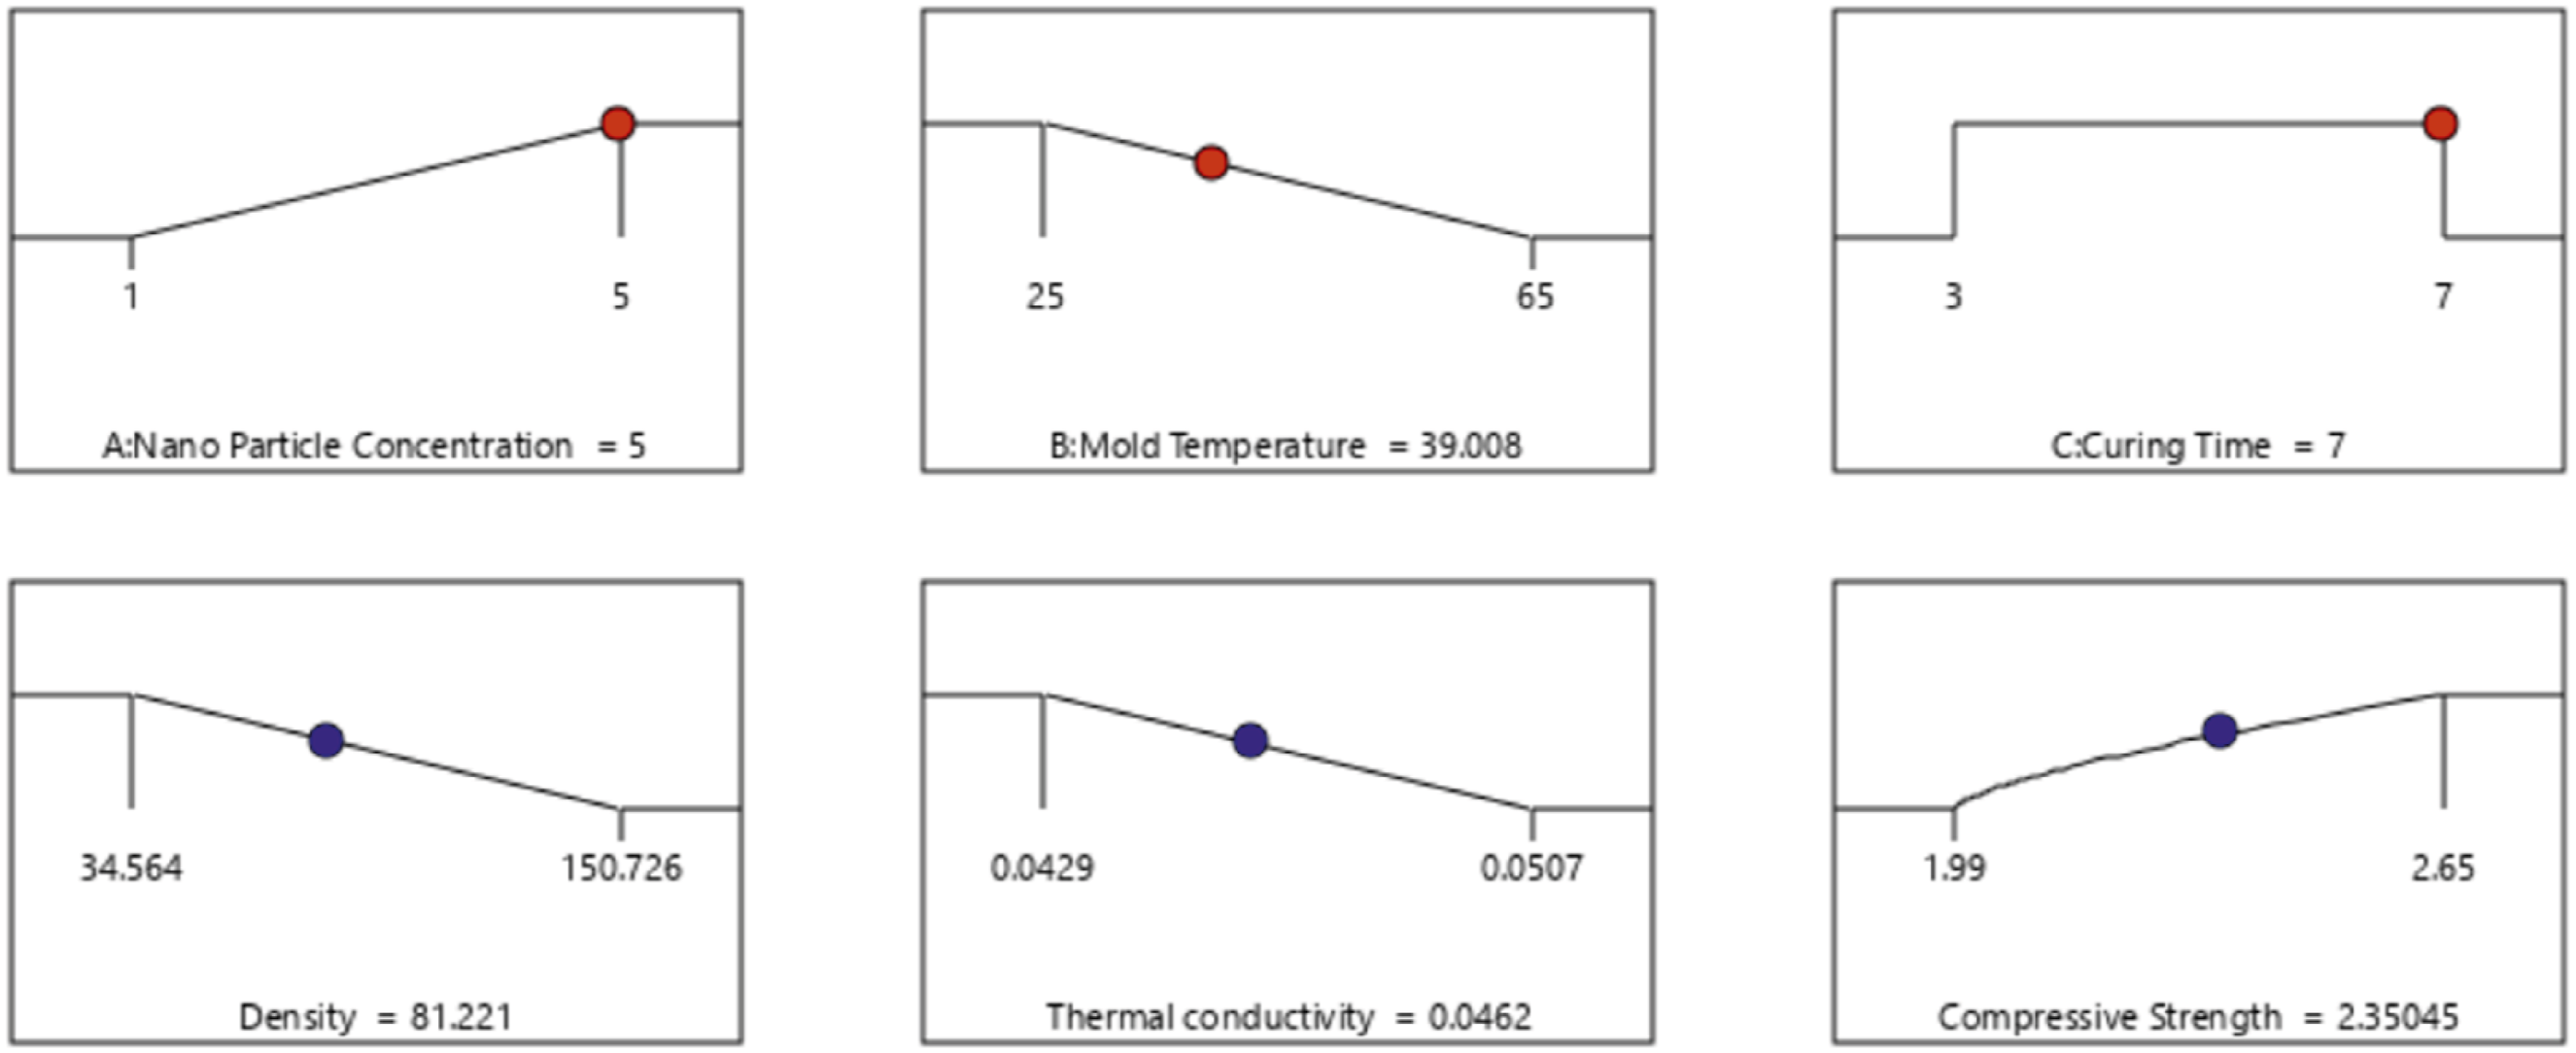
Selected solution after optimization with a desirability of 0.713.
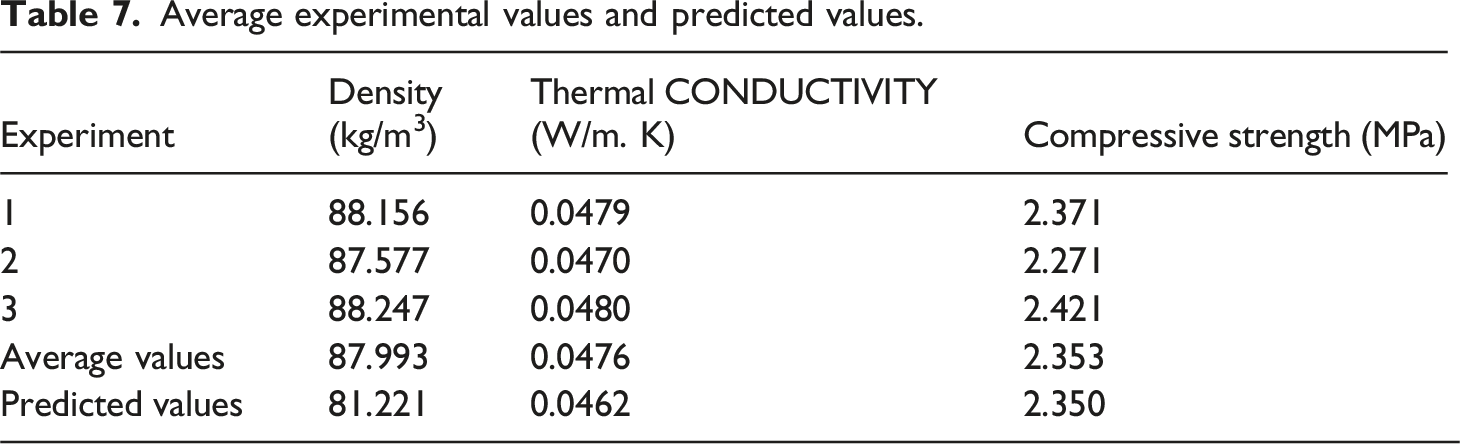
Confirmation Experiments
Average experimental values and predicted values.
Characterization of the control and optimized sample
Surface morphology
The introduction of biosilica nanoparticles affected the foaming process, which was further confirmed by comparing the morphologies of the optimized and control foams. In the control foam, the cells were more open than those in the optimized foam. The alterations in the cell morphologies of the optimized foam are shown in Figure 14(b). From the Zeiss Stemi 508 stereomicroscope images, it was observed that the addition of 1.5% biosilica nanoparticles to the control foam (see Figure 14(a)) had a significant effect on the cell structure and morphology. The cell structure of the optimized foam was more uniform than that of the control foam, which validated the improvement in the physical and mechanical properties of the optimized foam. These observations are comparable to those of other studies, in which the introduction of nanoparticles into the polyurethane foam matrix led to an improvement in the foam properties, particularly the uniformity of the foam cells.
25
The cell morphology is also maintained at lower nanoparticle concentrations this is in agreement with Akdogan & Soykan,
41
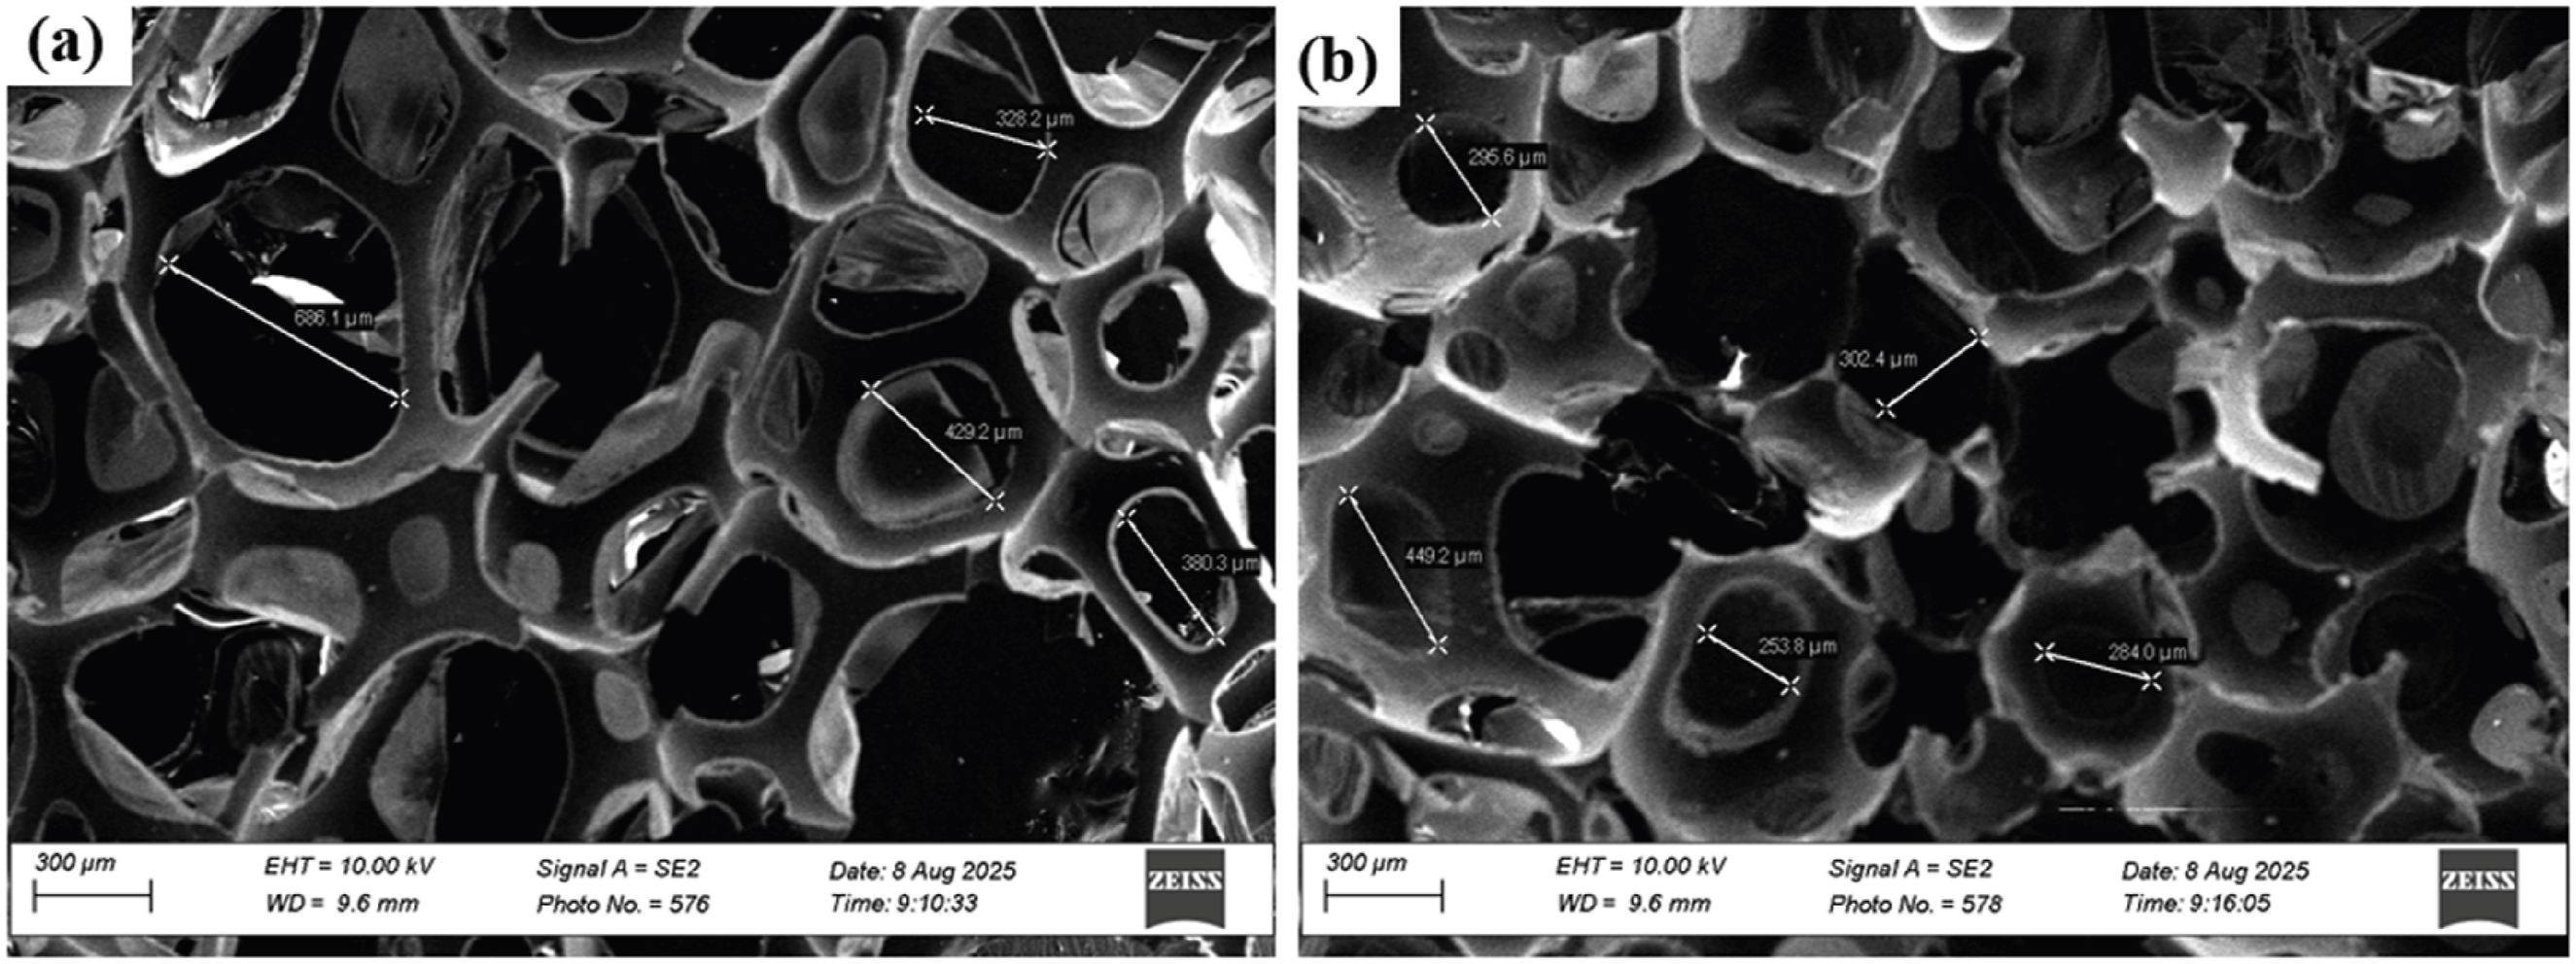
that observed a uniform cell morphology at lower turkey feather fiber concentrations. From the SEM images (see Figure 15), it was observed that the cell size of the optimized foam (see Figure 15(b)) decreased by 38% compared to that of the control foam. This is attributed to the nucleation effect that leads to the formation of many cells, and the viscosity of the polyol mixture that hinders foam expansion, leading to a reduction in the cell size. Zeiss Stemi 508 stereomicroscope images of control sample (a) and, optimized sample (b). SEM images of control sample (a) and, optimized sample (b).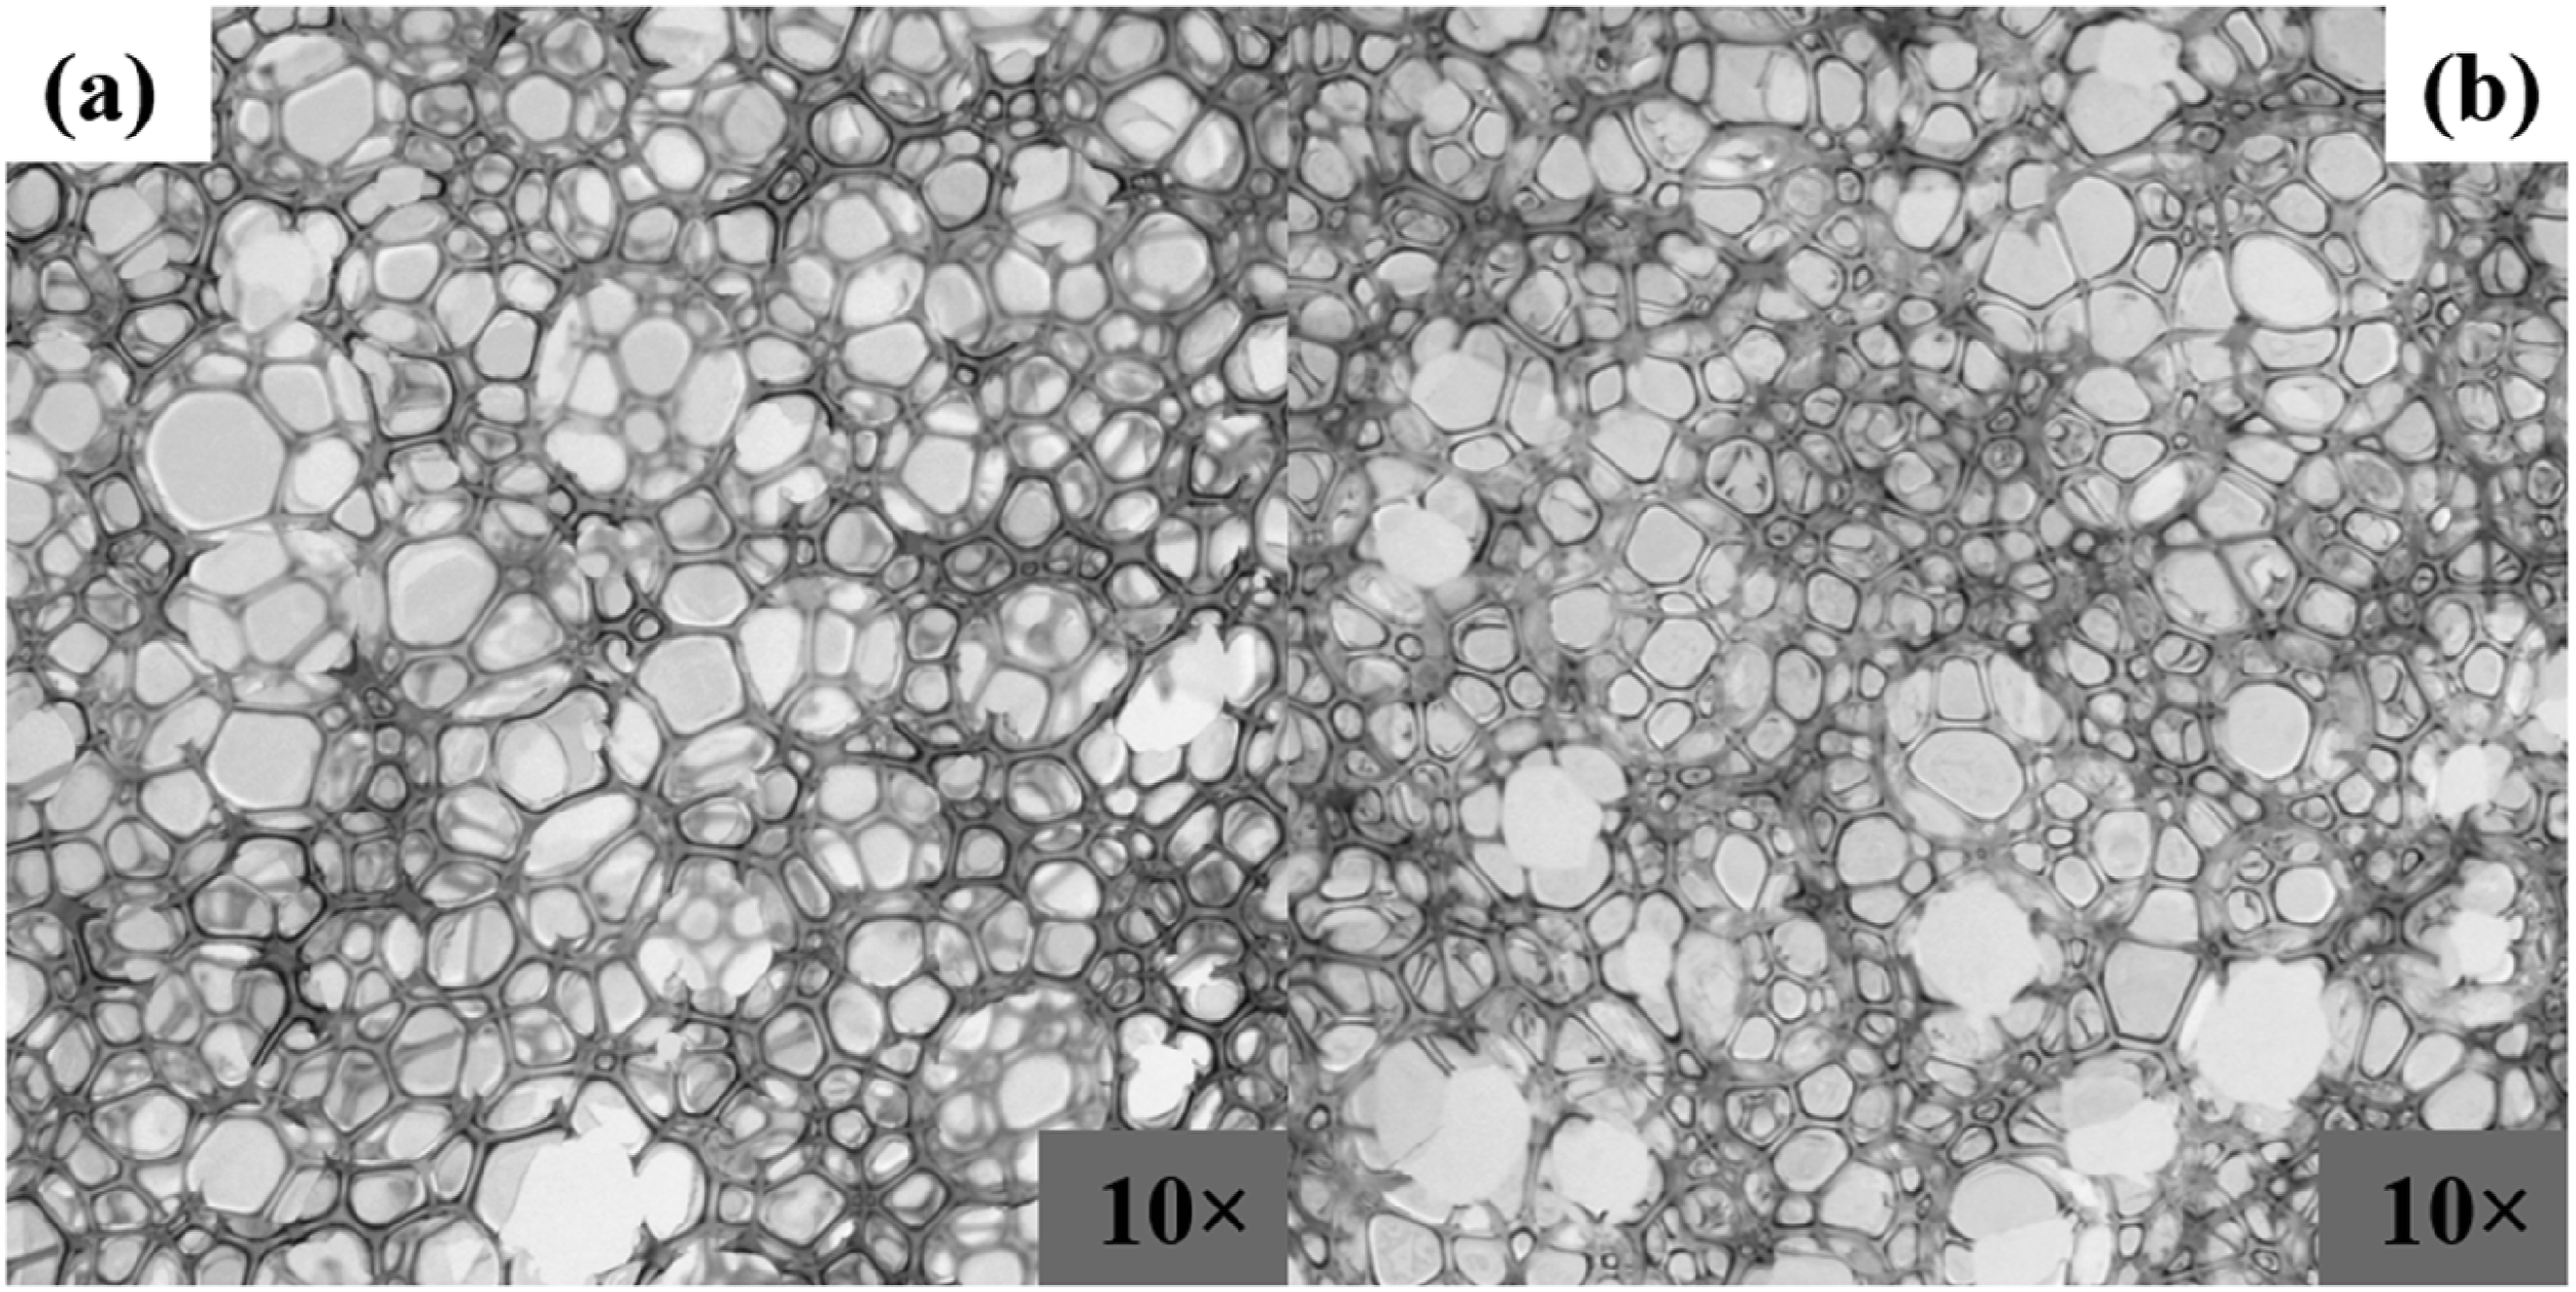
Fourier Transform Infrared Spectrum analysis
The Fourier transform infrared spectrum (FTIR) spectra (see Figure 16), shows characteristic absorption bands that confirm the hydrogen bonding state of the optimized nanocomposite. All the prepared foams exhibited similar spectra, and there was no stretching vibration peak at 2275 cm−1 for the isocyanate (N = C = O) group, indicating that the isocyanate groups had reacted completely with the polyol and water during polymerization.
36
FTIR Spectrum for the control sample and optimized sample.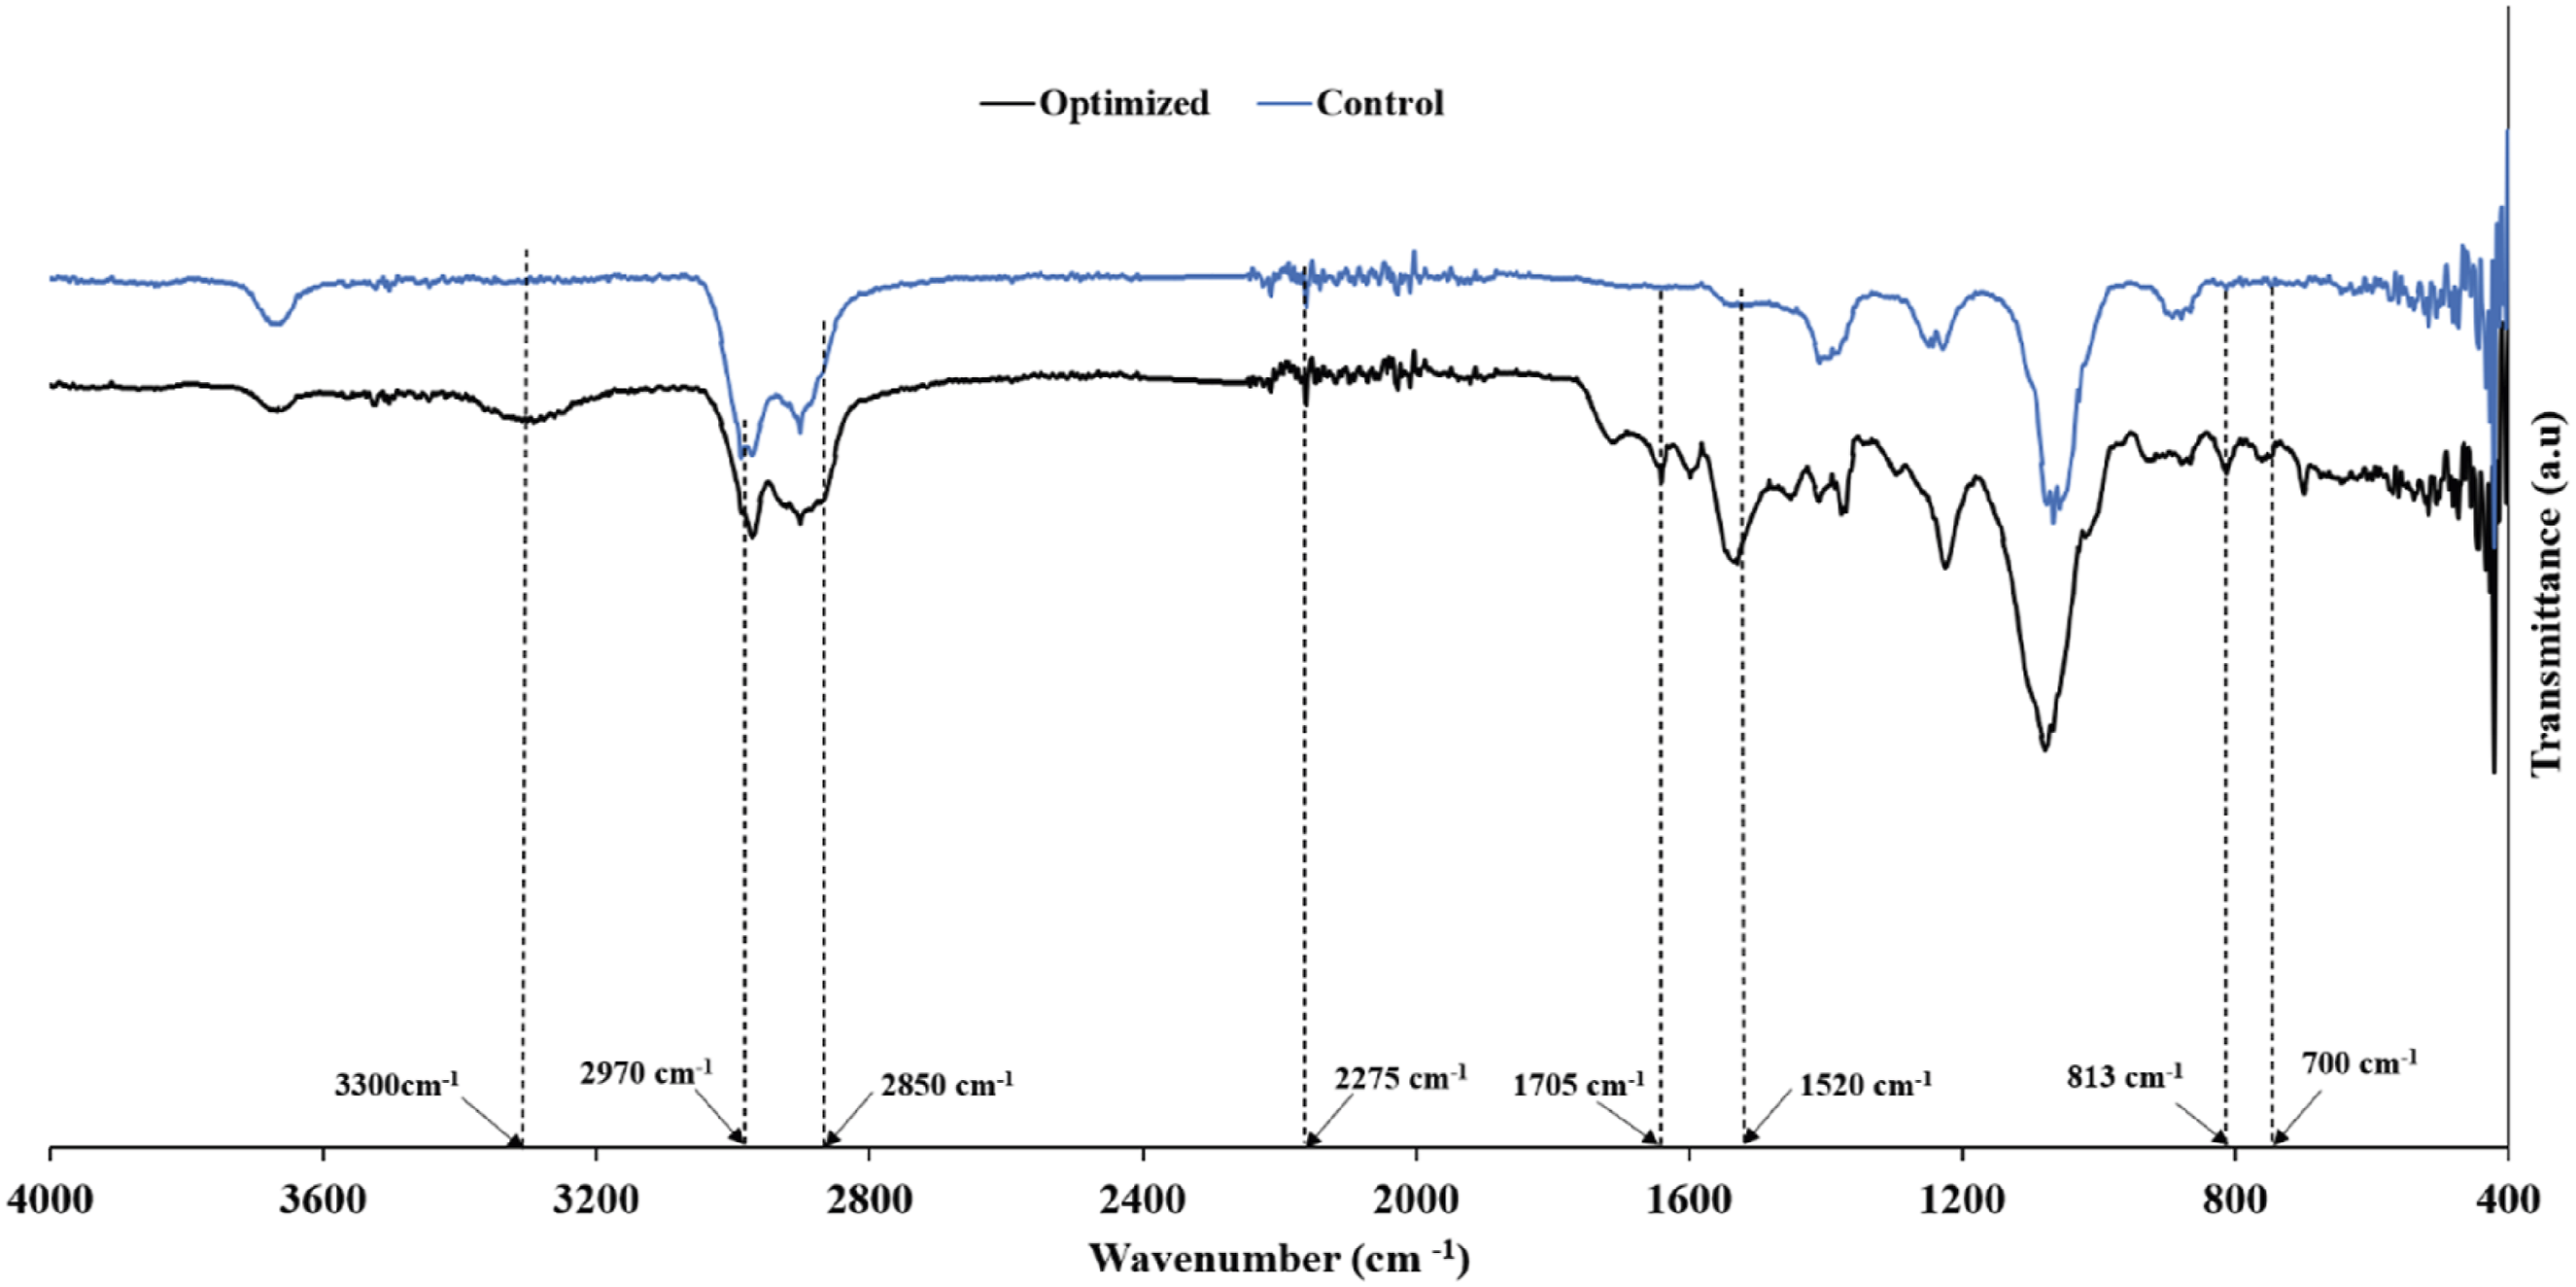
Prominent peaks between 900 and 1200 cm−1 were also observed, confirming the presence of C-O-C groups from the polyol and C-N urethane linkages. Furthermore, a region for the N-H stretching with free (non-H-bonding), ordered (strongly H-bonding), and disordered amorphous states was observed at approximately 3300 cm−1. Another region for the characteristic absorbance peaks of the H-bonding C = O groups was observed at lower wavenumbers. The stretching peaks observed at approximately 1705 cm−1 can be ascribed to ordered, free, and disordered hydrogen bonding states in the C = O groups. The observed bands between 2850 and 2970 cm−1 can be attributed to CH2 and CH3, which were observed for both the control and optimized samples. 23 The medium-intensity peaks at 813 cm−1 and 700 cm−1 validate the presence of biosilica nanoparticles. These results imply that the biosilica nanoparticles participate in hydrogen bonding with the polyurethane matrix, which enables the nanoparticles to be dispersed throughout the matrix.
Density
The optimized sample exhibited a higher density (87.993 kg/m3) compared to the control sample (39.390 kg/m3) (see Figure 17), which was similar to the results reported in other studies, where the addition of fillers to the polyurethane matrix increased the foam density. The increase in density was mainly attributed to two factors: the formation of new polymer cells Kerche et al.
33
and the increase in the viscosity of the polyol mixture.
35
Density of optimized and control samples.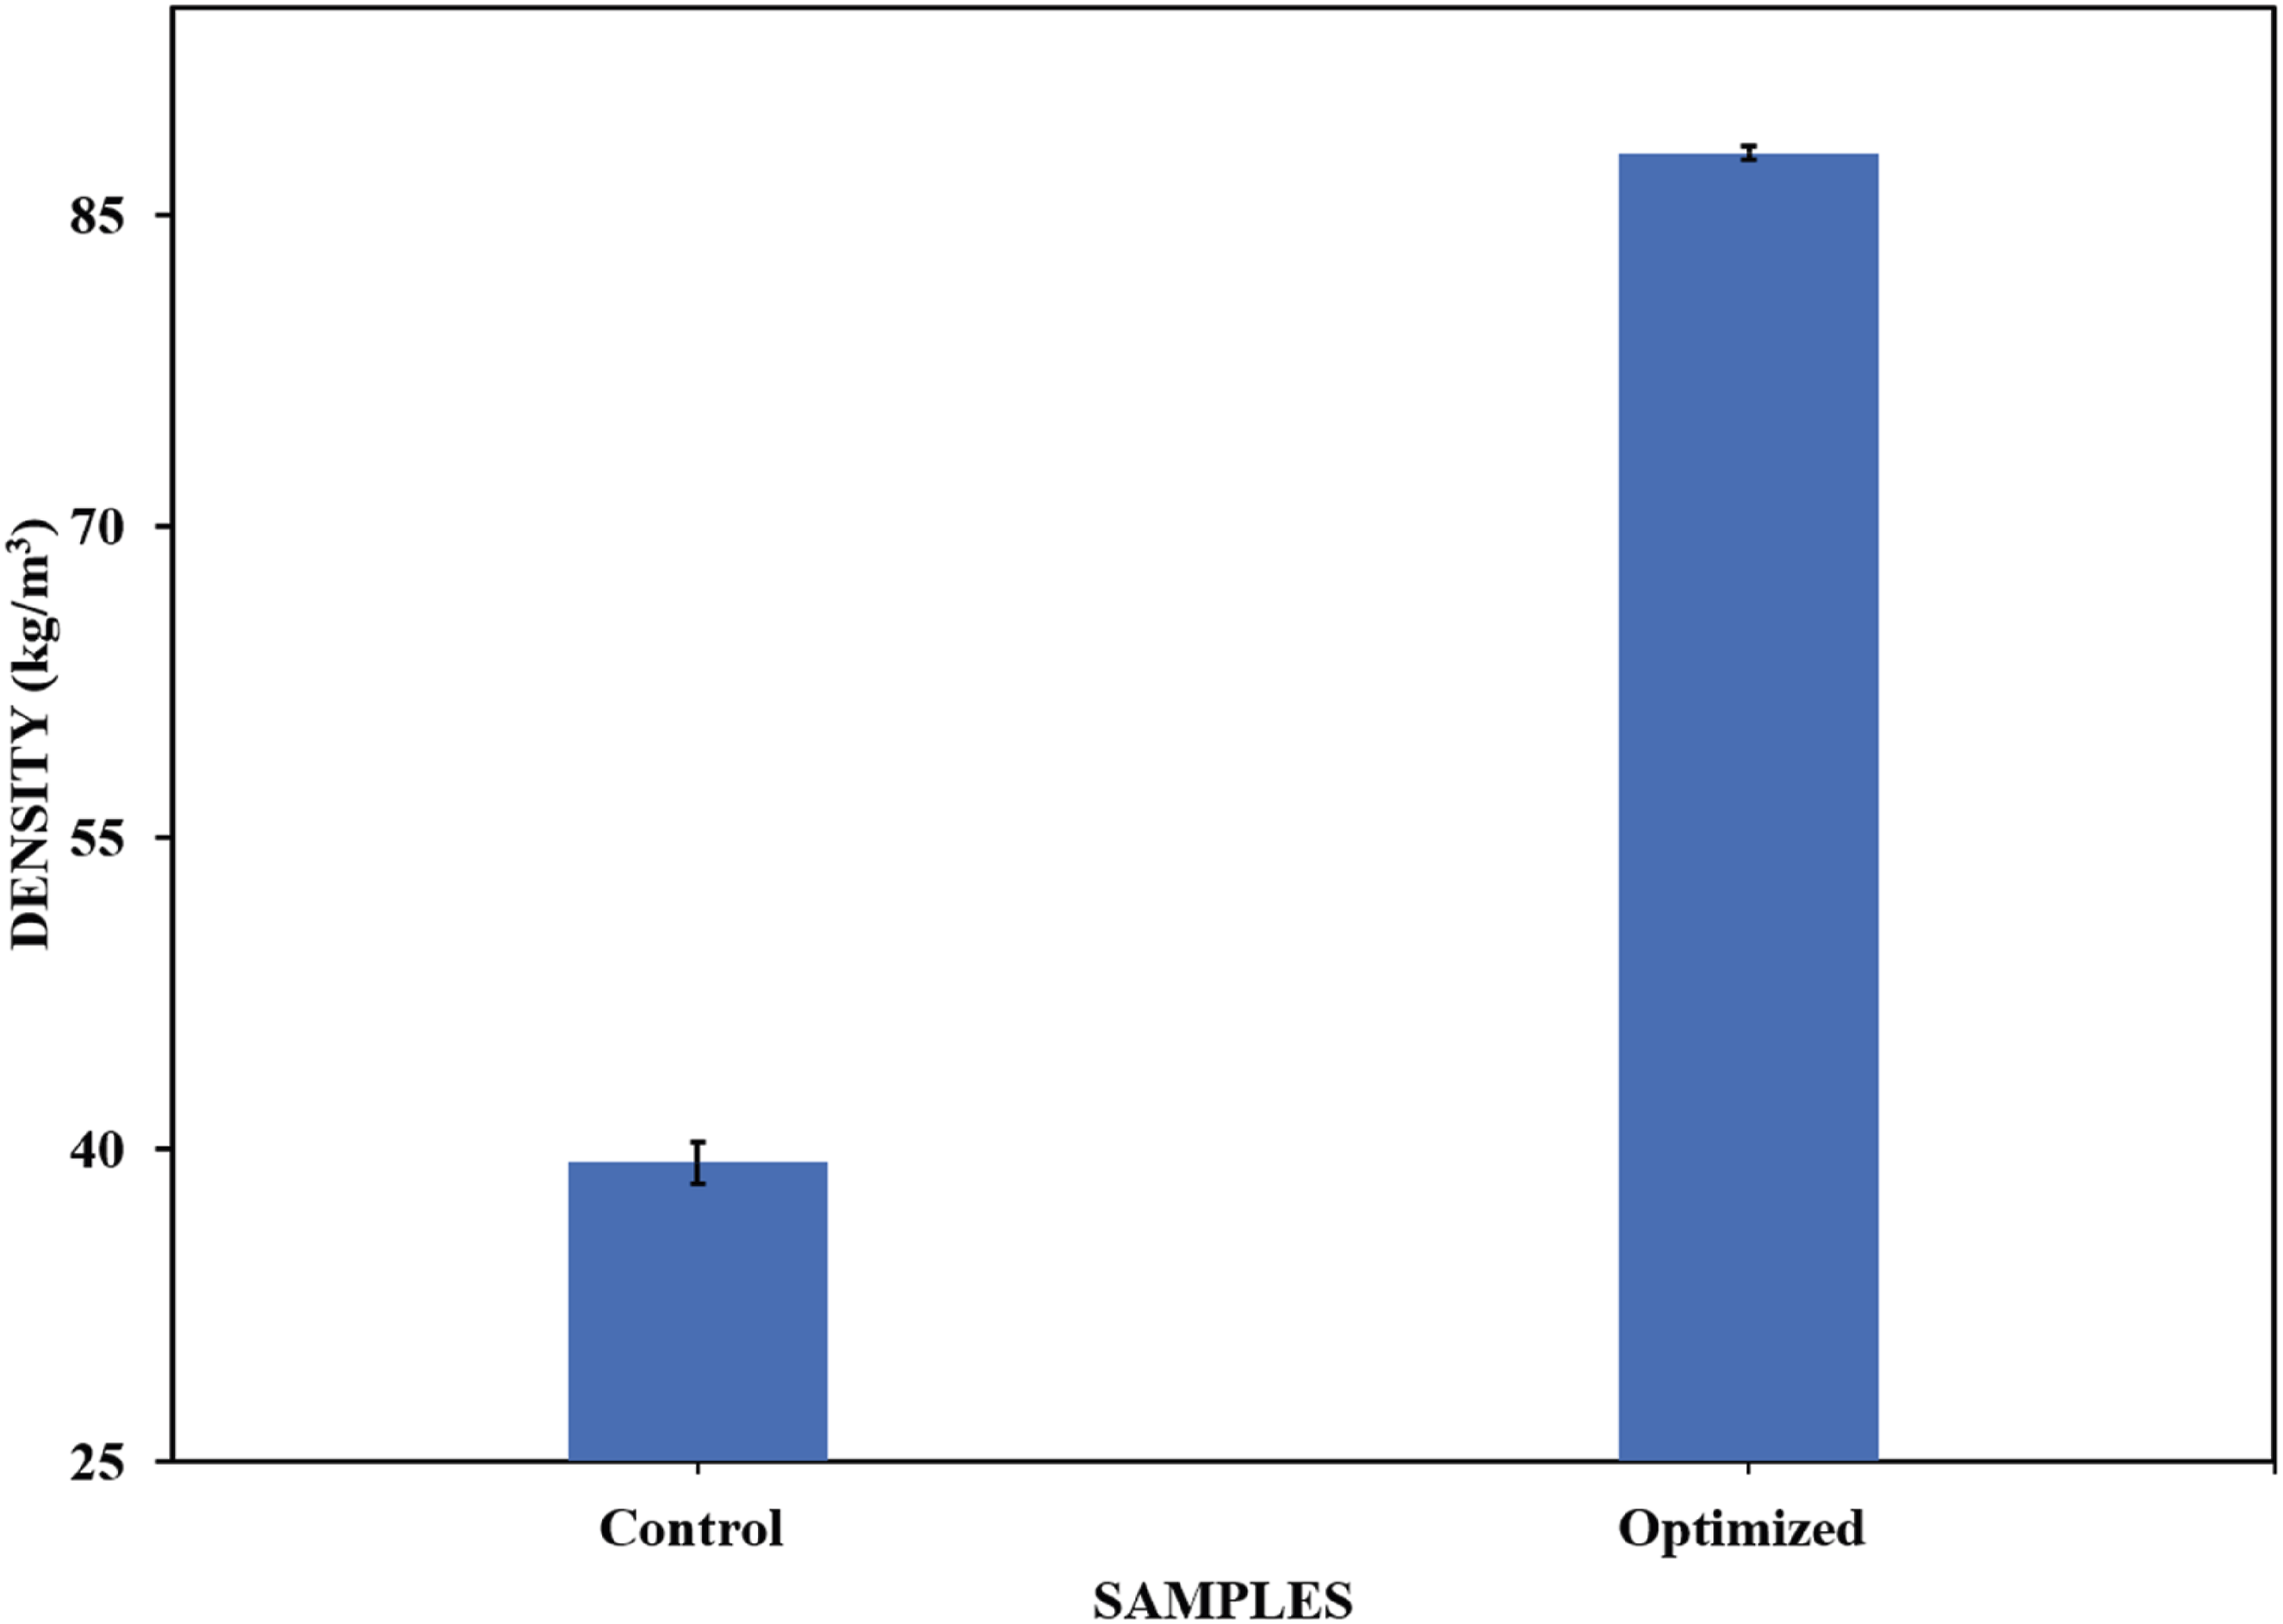
Thermal conductivity
The open cell content and cell size of polyurethane foams are crucial for heat transfer through the material via either convection or radiation. An increase in cell size enhances the transfer of heat by radiation; therefore, thermal insulation materials should be characterized by small cells. The thermal conductivity of the optimized sample increased by approximately 8% compared to that of the control sample (see Figure 18). This is in agreement with other studies in which the addition of fillers into the polyurethane matrix led to an increase in the thermal conductivity of the foam composites by 7% for coffee husks, 5% for saw dust 31% for lavender and 8% for untreated eucalyptus.16,38,42 This was mainly attributed to the differences in the polarity of the fillers and polymer matrix, which resulted in poor compatibility and weak ability of the cell structure to enclose the blowing gases. However, some studies have reported a reduction in thermal conductivity with filler modification. For example, Członka et al.
38
reported that chemically treated eucalyptus fibers reduced the thermal conductivity by 8%, while Lee et al.
39
reported that modified silica nanoparticles decreased the thermal conductivity by 25%. Despite the increase in the thermal conductivity of the optimized sample, it still outperformed some conventional thermal insulators, such as mineral wool, which has a thermal conductivity of 0.055 W/mK.
15
Thermal conductivities of optimized and control samples.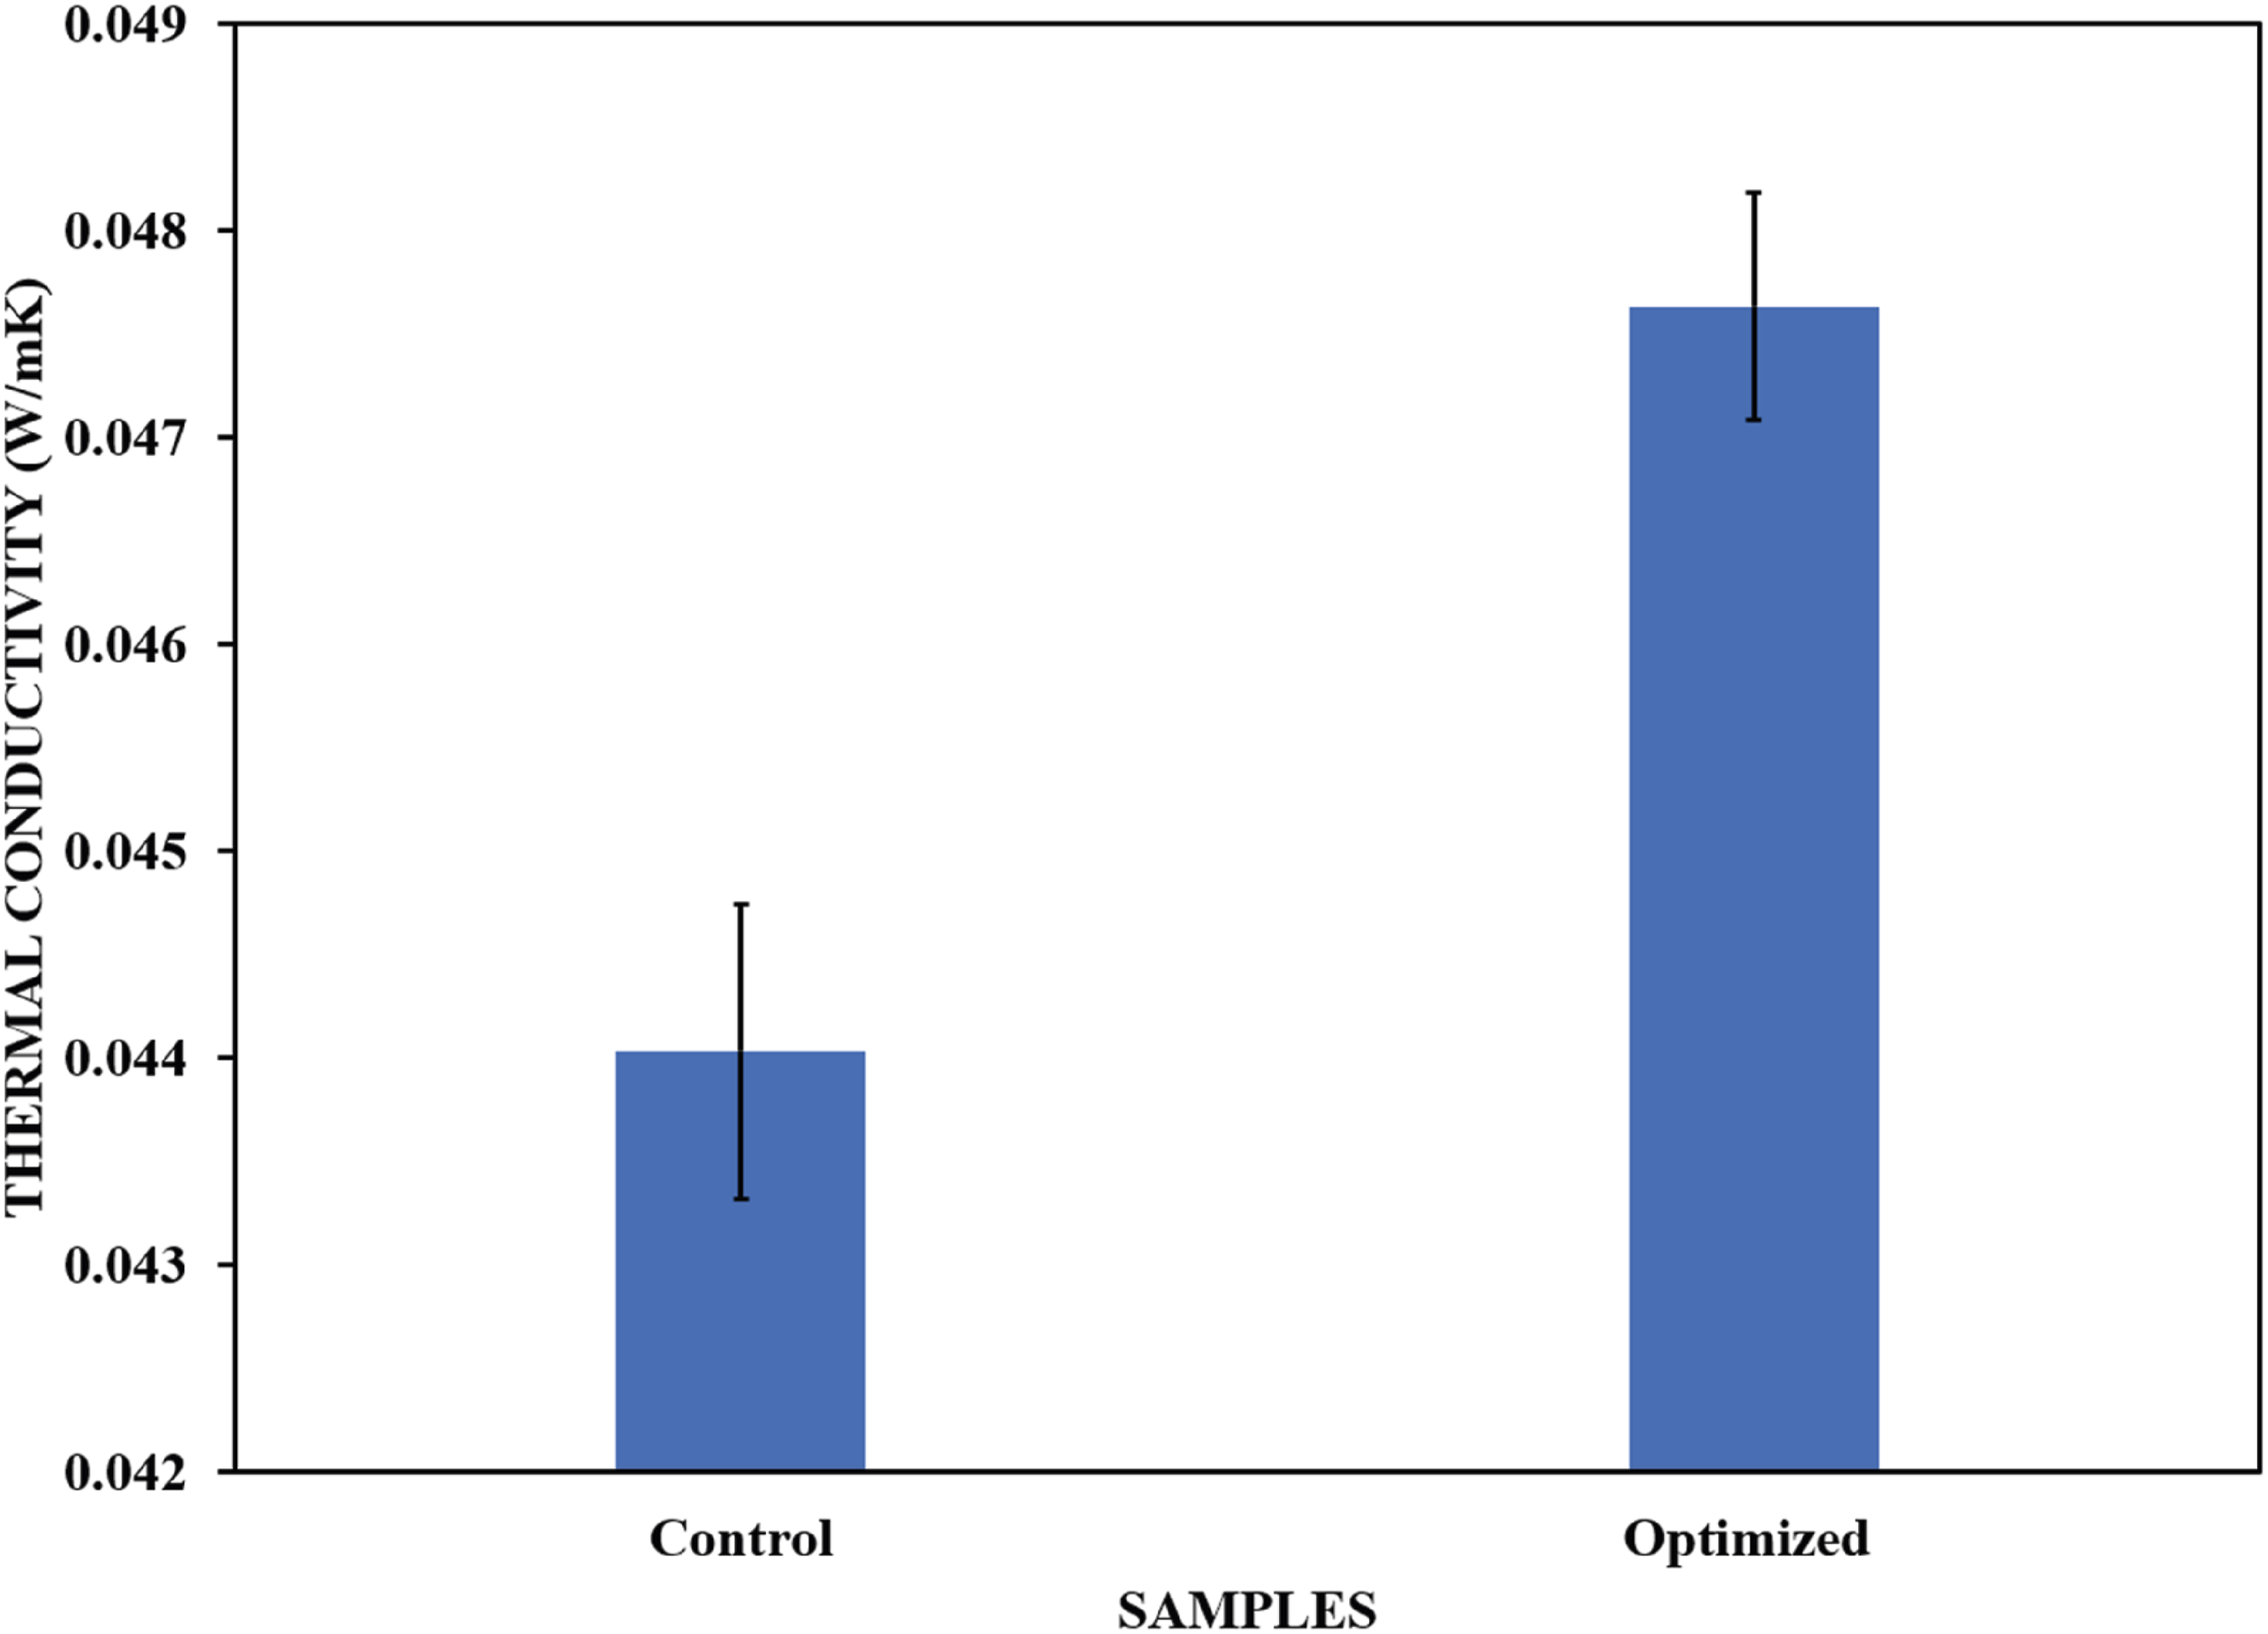
Compressive strength
The compressive strength of the optimized sample increased by 35% (1.74 MPa to 2.35 MPa) compared with that of the control sample (Figure 19). This is in agreement with the density results for the optimized sample. The mechanical performance of cellular materials depends on their density.
37
The increase in the compressive strength of the optimized foam was mainly attributed to the increase in the solid content of the nanocomposite, which enhanced the strength of the cell walls.36,40 Compressive stress-strain curve of the optimized and control sample.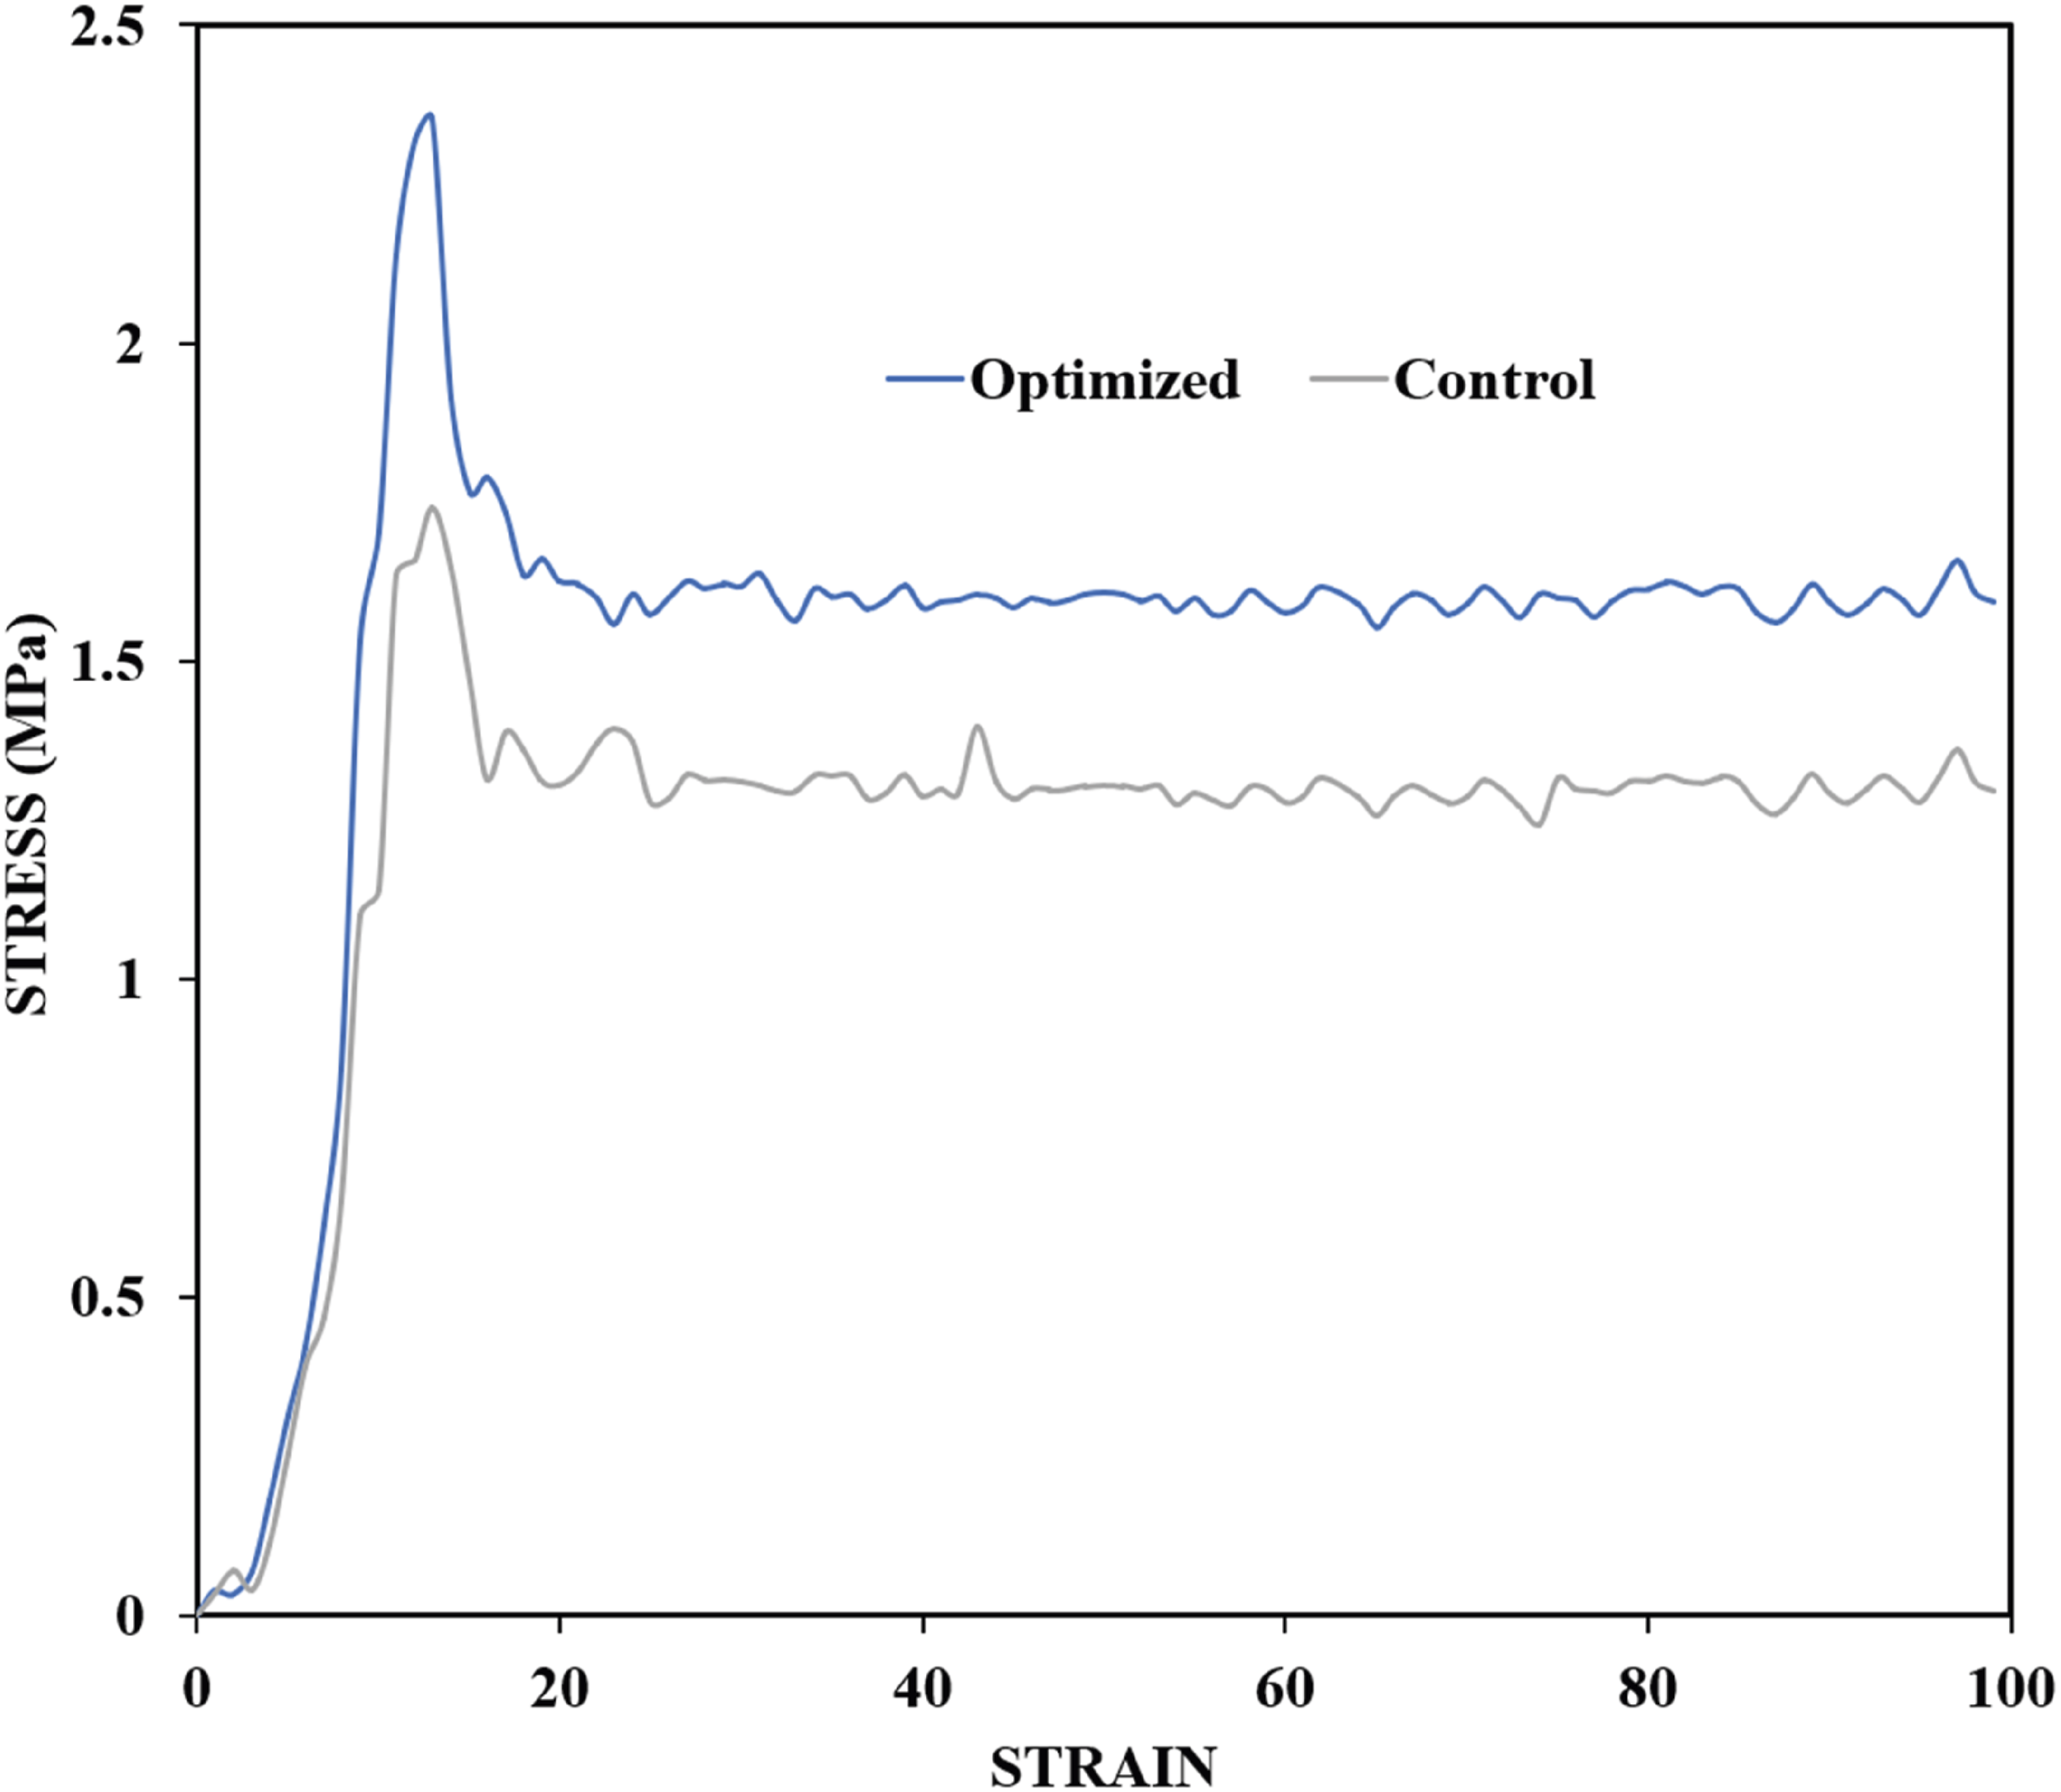
Water absorption
Water absorption is one of the most important properties of polyurethane foams. Commercially used polyurethane foams cannot absorb water because their tendency to absorb water significantly affects their mechanical and thermal properties.
16
The results of the water absorption test for the optimized and control samples are shown in Figure 20. Water absorption depends on the foam morphology and hydrophobic nature of the filler. The water absorption of the optimized samples decreased compared with that of the control sample. This is in agreement with previous studies that reported a decrease in water absorption due to the addition of biosilica as a filler in the polyurethane foam matrix43,44. The decrease in water absorption was mainly attributed to the chemical compatibility of the biosilica nanoparticles, which gave rise to new polymer bubbles during the nucleation mechanism, negatively impacting water filling and leading to lower water absorption.
4
Water absorption of optimized and control samples.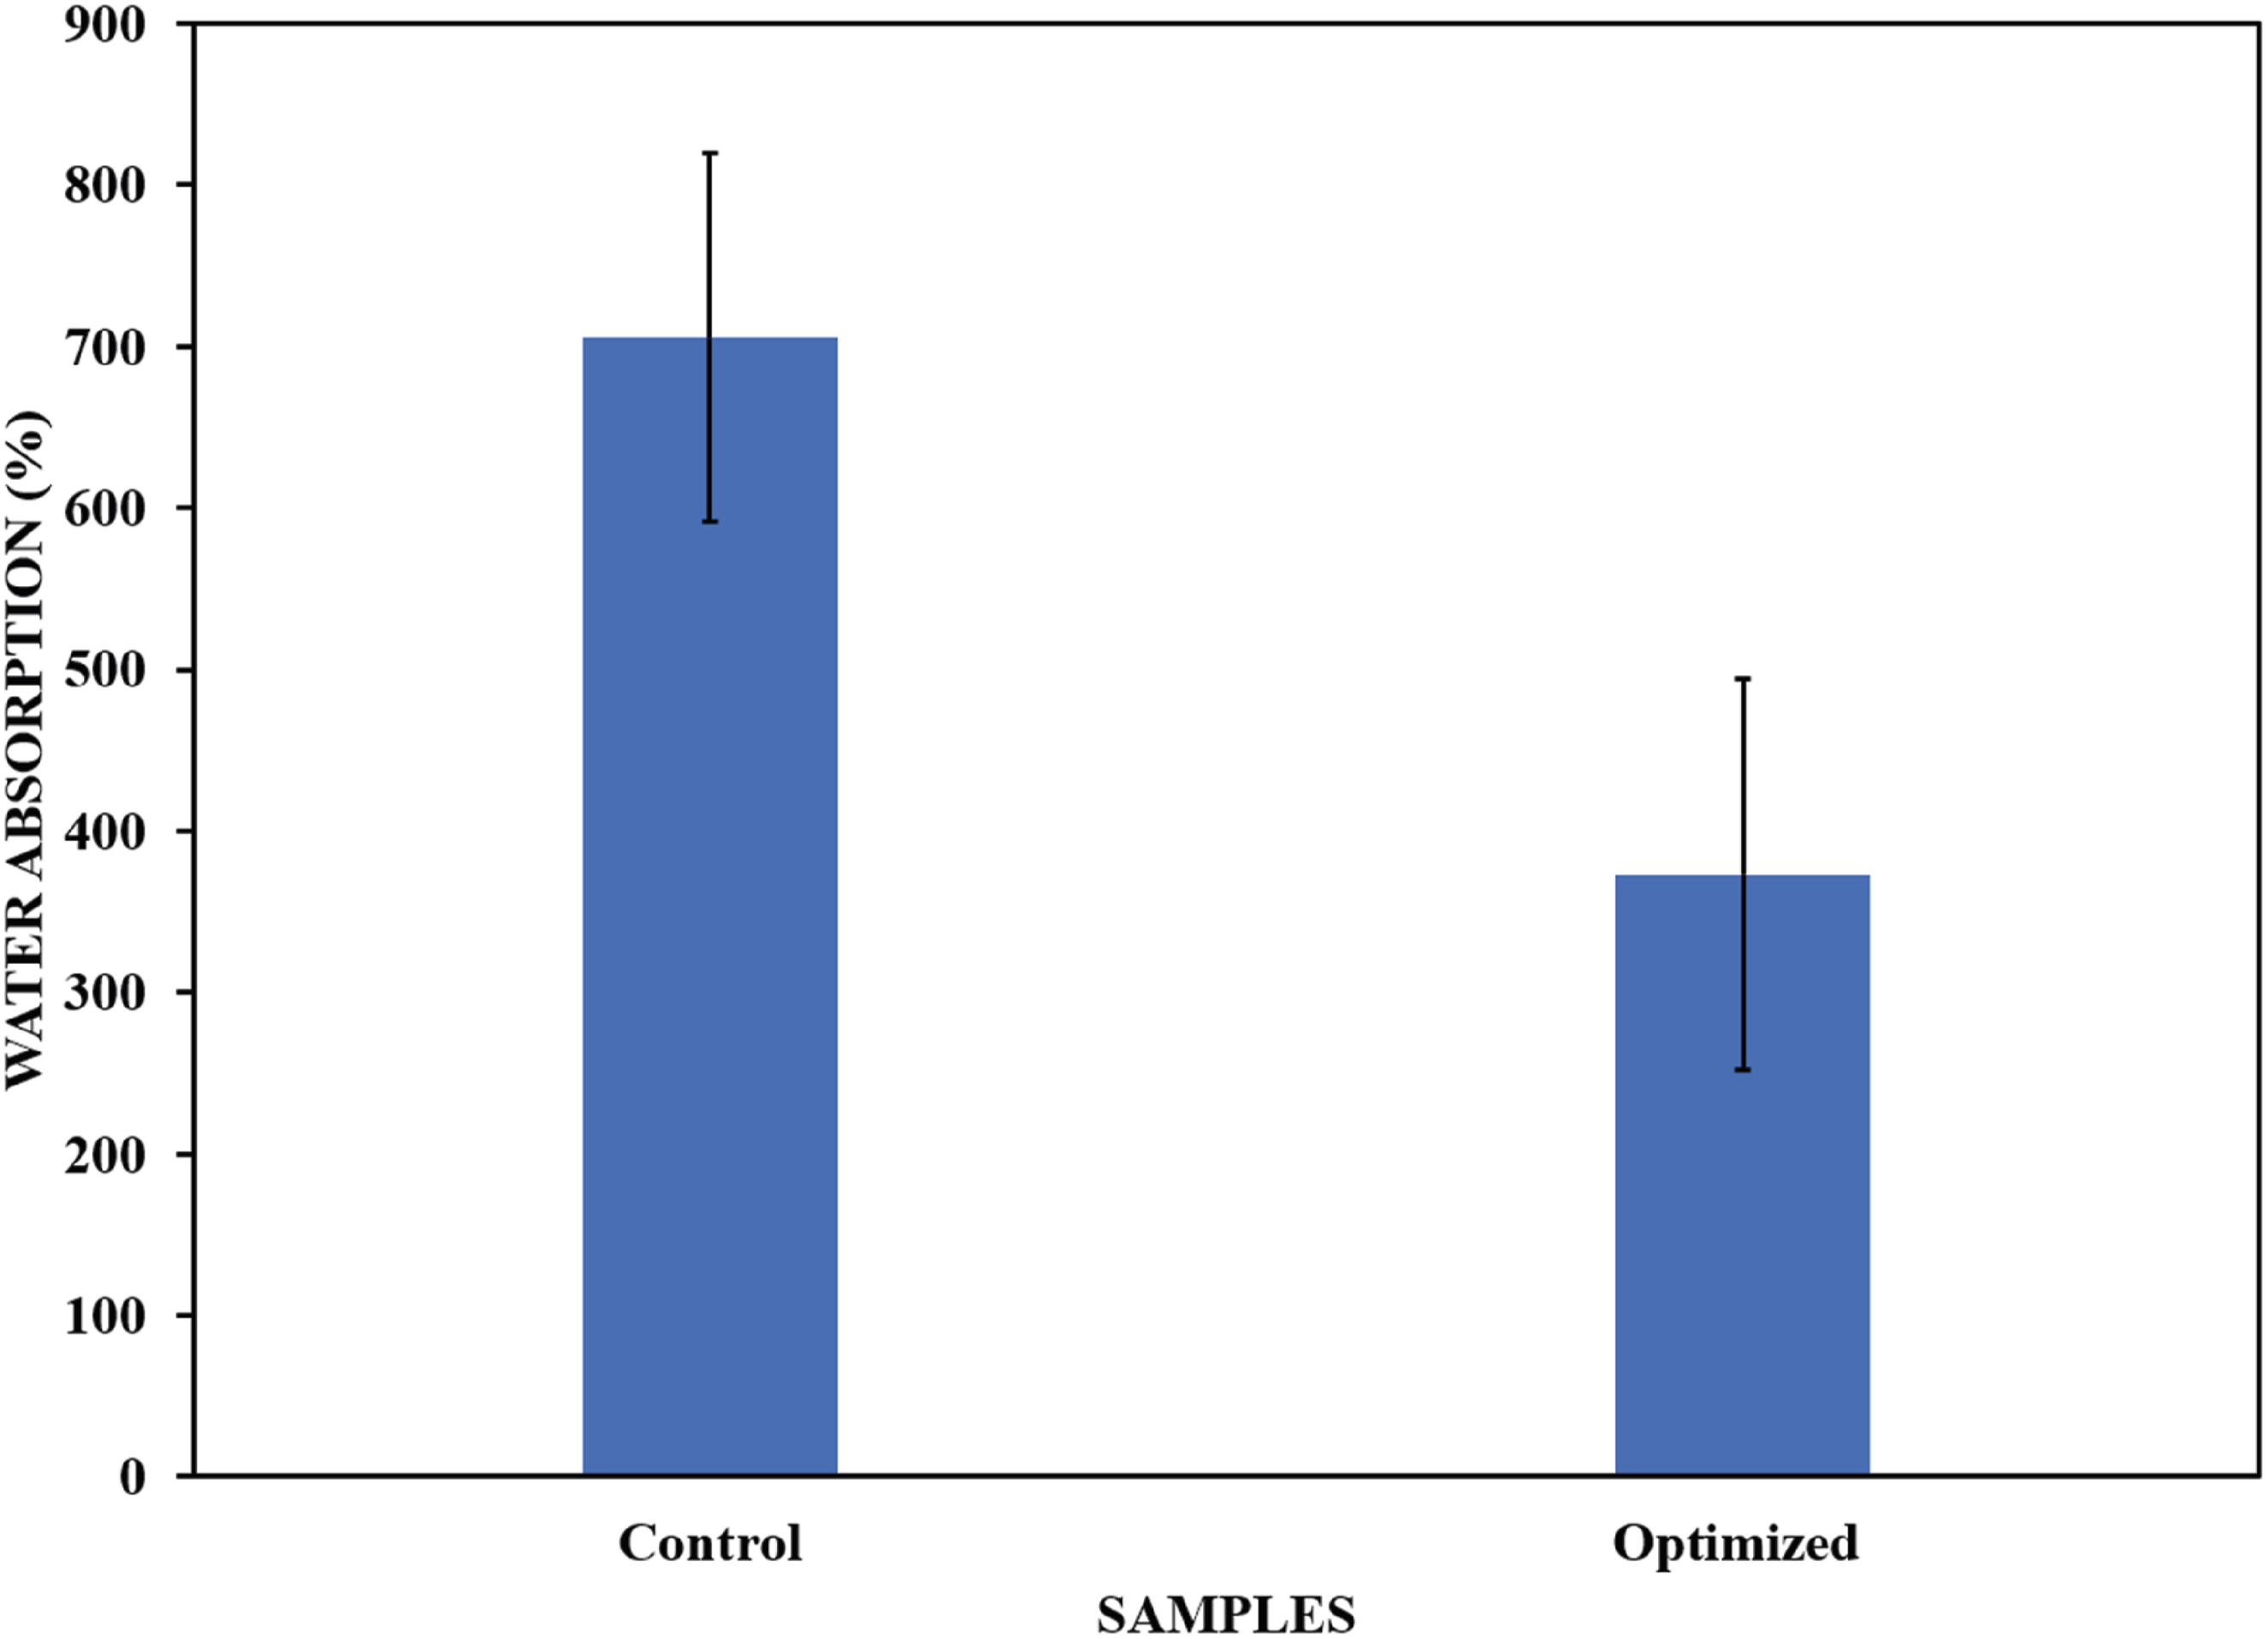
Solvent resistance
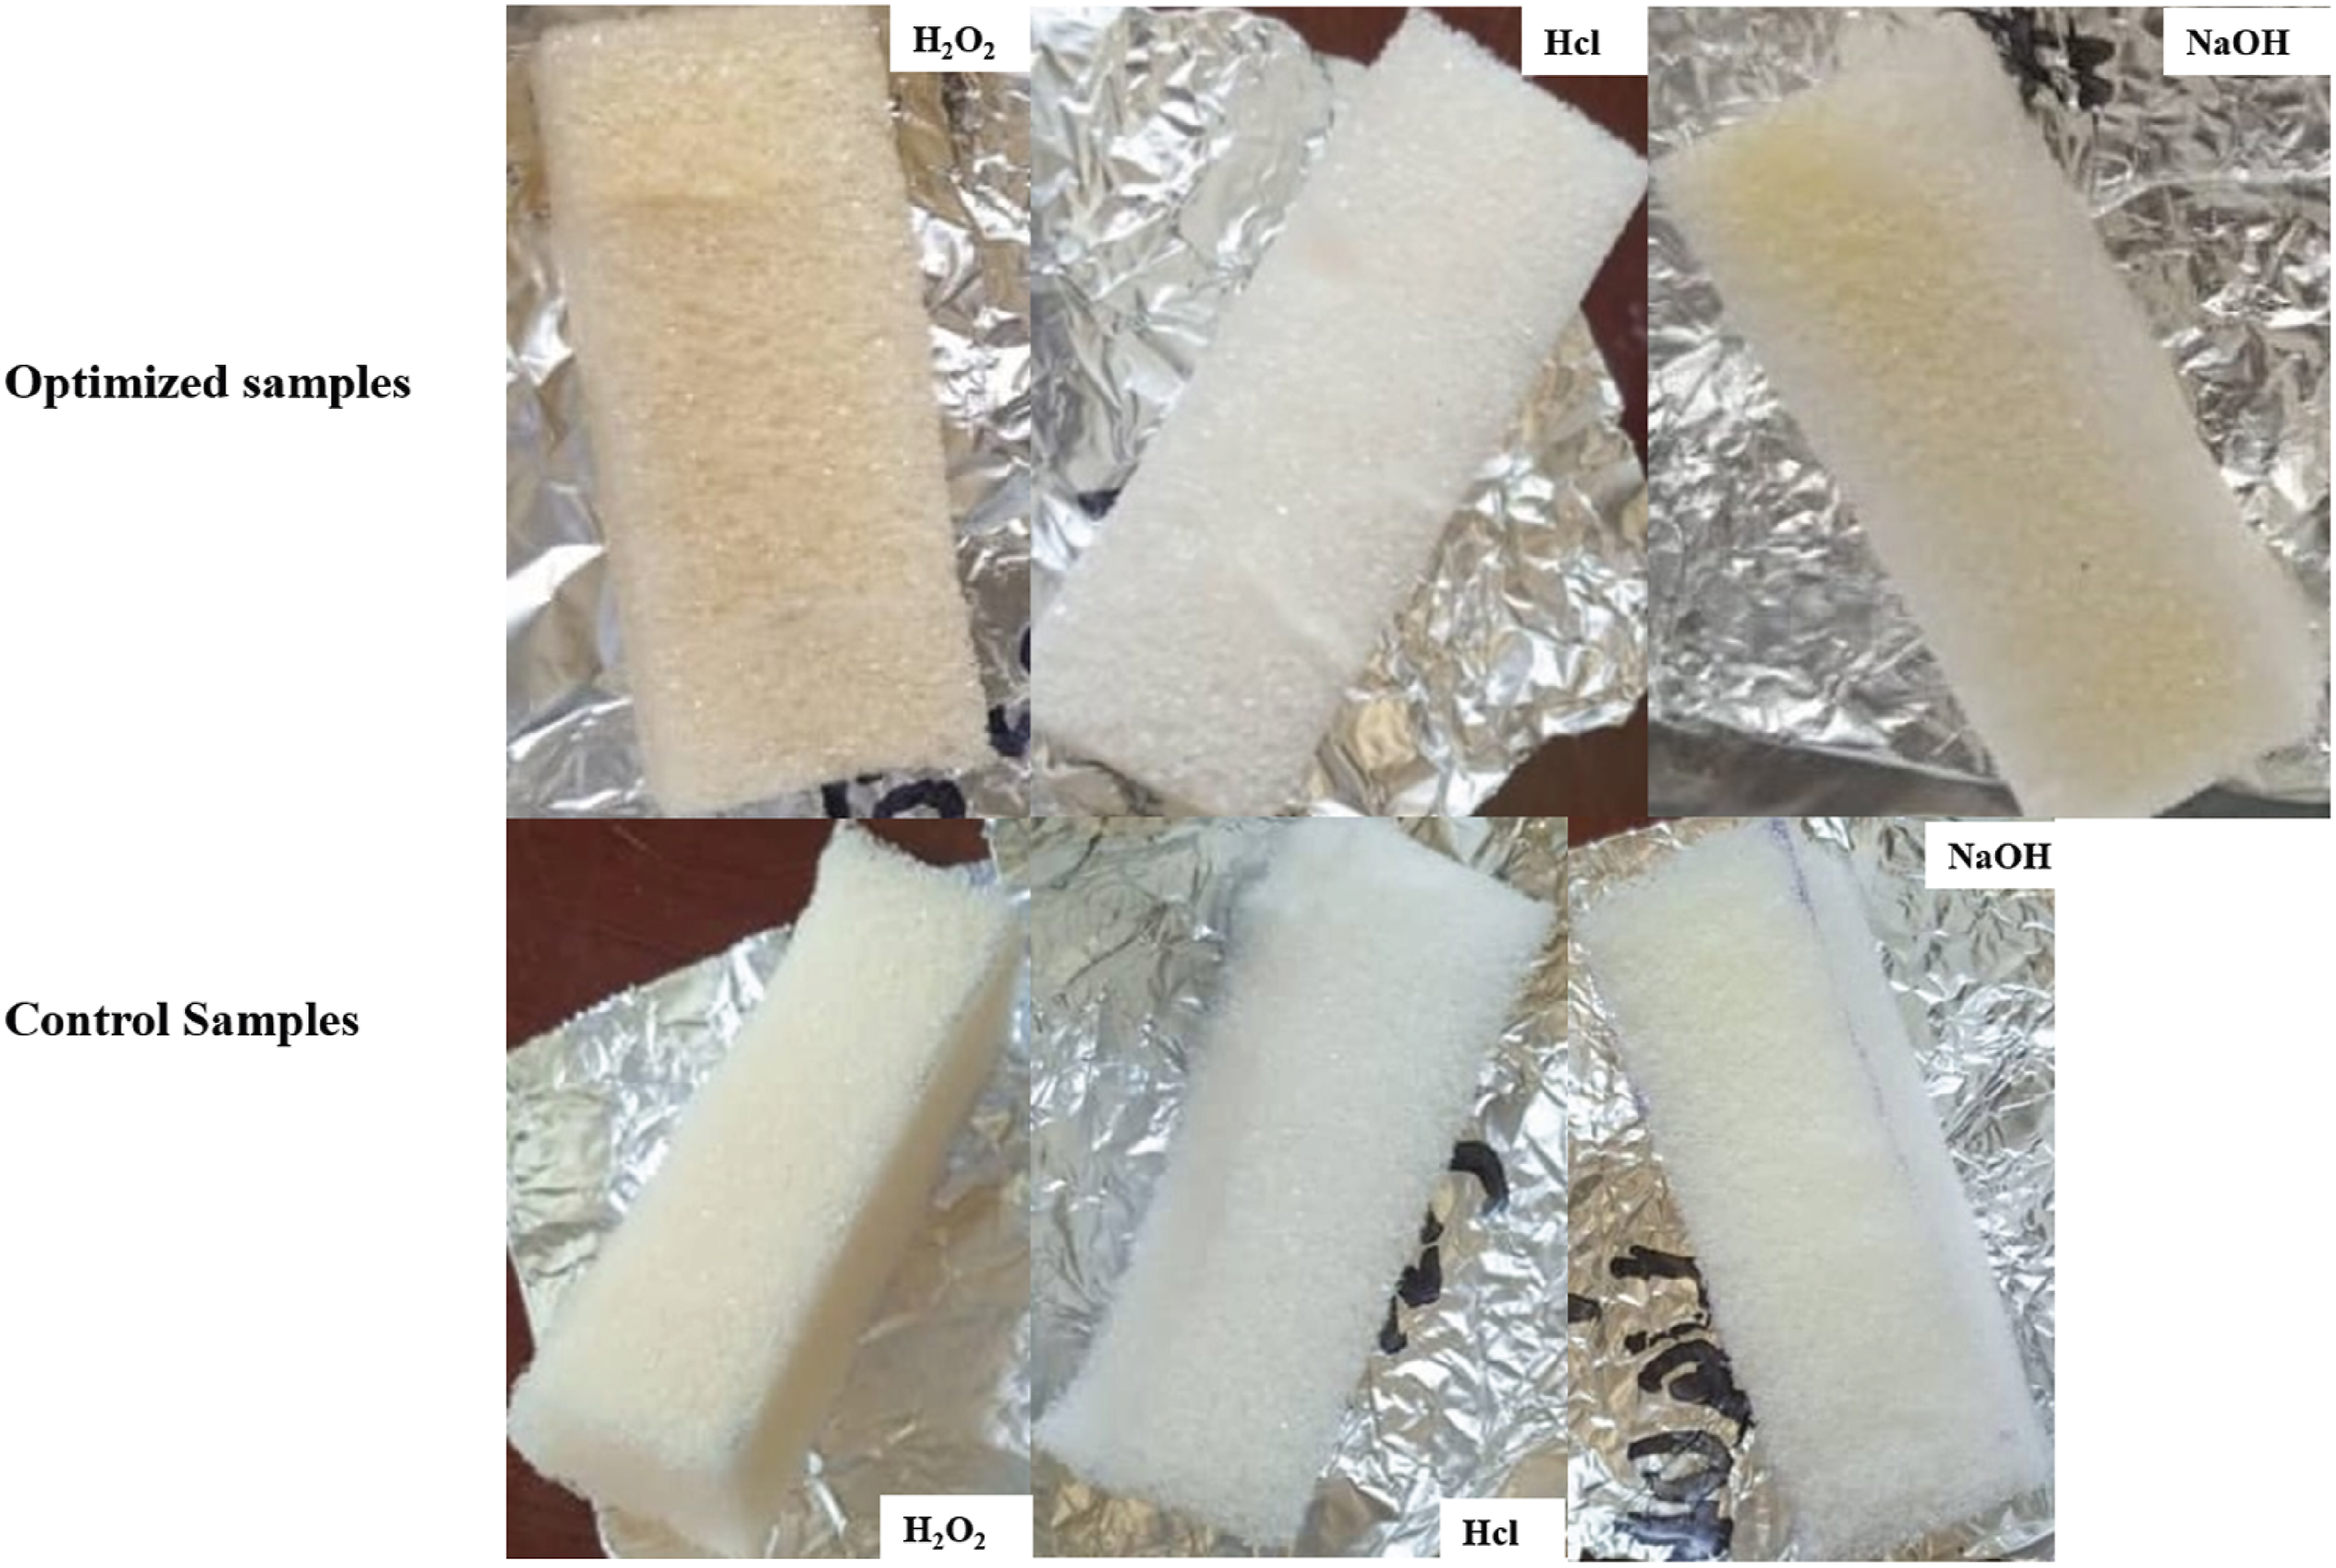
The solvent resistance experiments revealed that the control and optimized samples both underwent the highest mass loss in hydrogen peroxide (H2O2), followed by sodium hydroxide (NaOH), and then hydrochloric acid (see Figure 21). The optimized foam sample exposed to hydrogen peroxide revealed low mass loss than the control sample. The introduction of biosilica nanoparticles significantly improved the foam resistance to hydrogen peroxide. The polyurethane foam samples exposed to hydrogen peroxide also showed severe yellowing compared to those exposed to sodium hydroxide and hydrochloric acid (see Figure 22). This suggests that oxidative degradation is more aggressive towards polyurethane foam than alkaline or acidic hydrolysis. These results align with studies showing that oxidizing agents, such as hydrogen peroxide, cause more severe polyurethane degradation than hydrolysis.
25
These findings suggest that the optimized foam is less suitable for acidic and alkaline environments than for neutral environments. Percentage mass loss of optimized and control samples in sodium hydroxide, hydrochloric acid and, hydrogen peroxide. Appearance of the optimized sample after treatment with different solvents.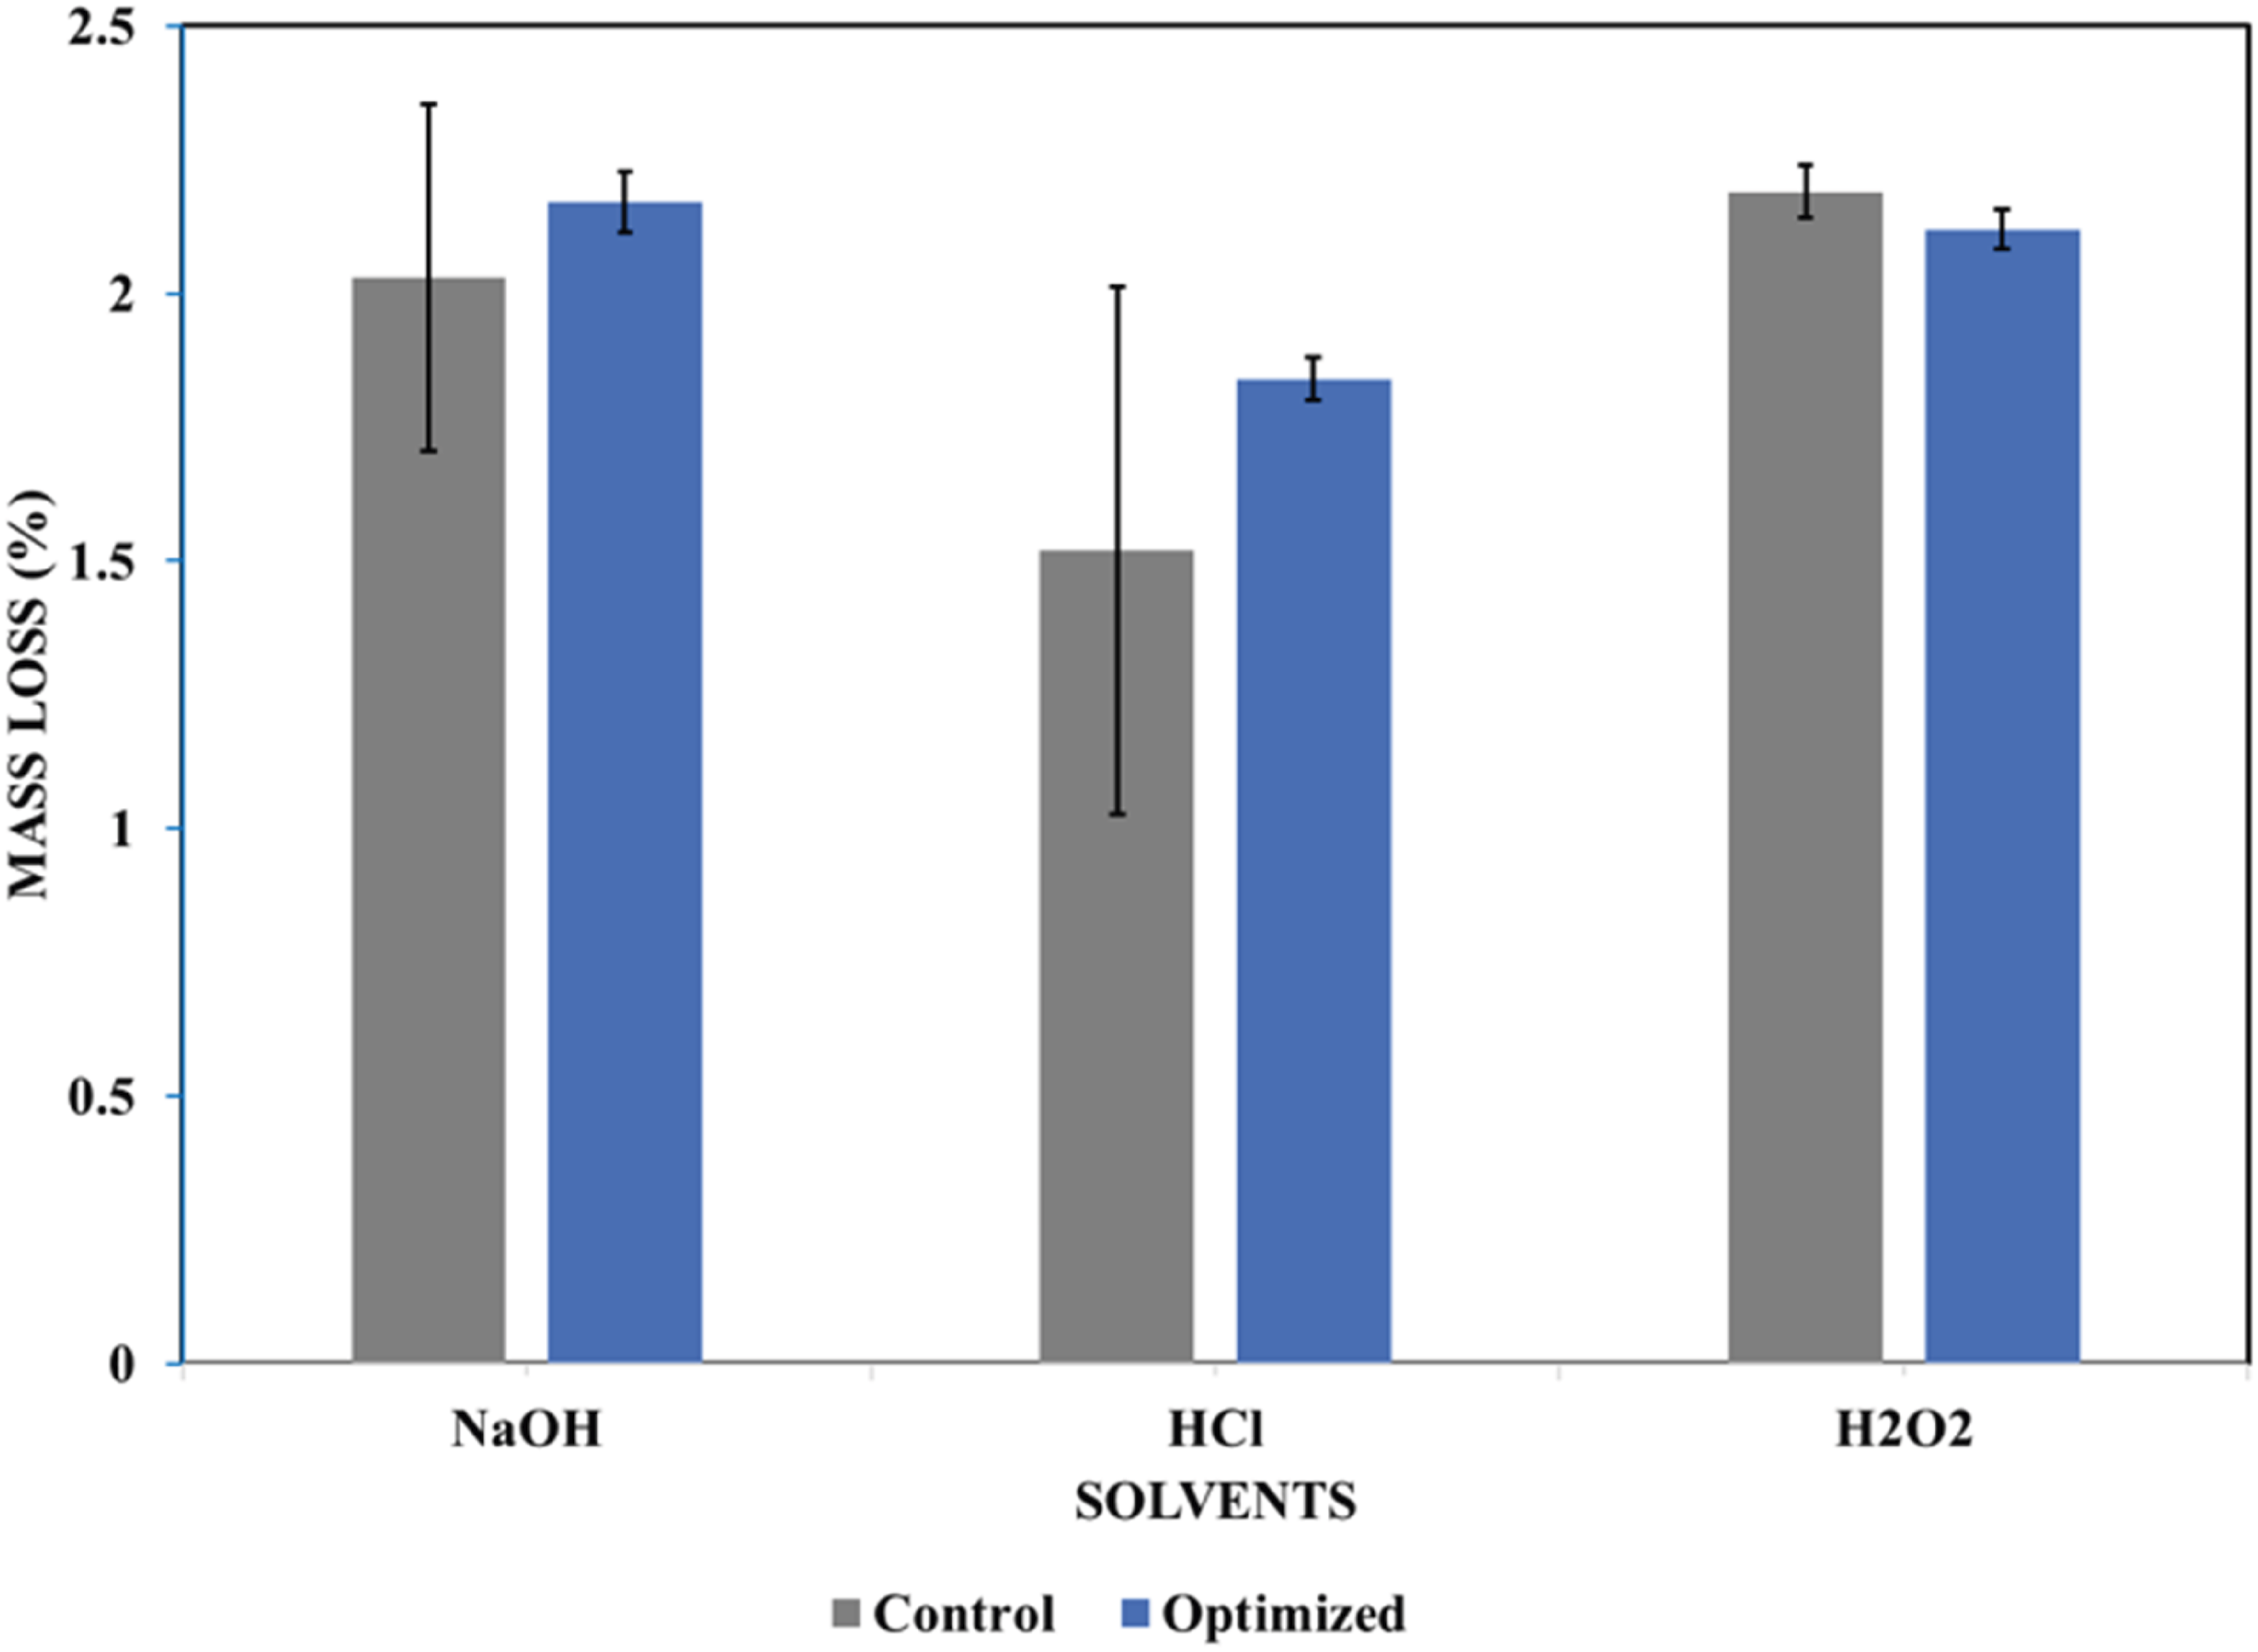
Conclusions
The significant difference in moisture variability between waste-dump-sourced rice husks (SD = ±1.71%) and freshly de-husked rice husks (SD = ±0.6) demonstrated that post-harvest exposure is a critical factor affecting the consistency of rice husks. These findings highlight that collection and storage methods fundamentally alter the material properties of rice husks for industrial applications requiring precise feedstock quality. Industries opting to use rice husks from waste dumps should ensure proper collection of this waste to ensure that the husks are of high quality. The high ash content confirms the potential of the super rice husk variety as a sustainable source of biosilica. This rice variety can be used as a source of biosilica nanoparticles for industrial applications. Biosilica nanoparticles derived from rice husks were successfully synthesized with high purity (86%) and crystallite size (7.33 nm). The presence of silanol functional groups on the surface of the biosilica nanoparticles confirmed that no further modification was required to apply the nanoparticles as fillers in polyurethane. However, the modification of these nanoparticles may be required to improve the thermal properties of the nanocomposite. Novel polyurethane foam nanocomposite materials were successfully developed in this study, and three process factors were optimized using response surface methodology. The effects of nanoparticle concentration, mold temperature, and curing time on the density, thermal conductivity, and compressive strength were evaluated using the Box-Behnken design. The nanoparticle concentration significantly influenced the investigated properties. The mold temperature influenced the density and compressive strength. Curing time significantly influenced the compressive strength. Three quadratic models emerged as the best fit to explain the variations in density, thermal conductivity, and compressive strength.
Upon process optimization, the predicted and experimental values of the density, thermal conductivity, and compressive strength closely matched each other, with a desirability score of 0.713. The polyurethane foam industry could adopt this method to produce cost-effective, low-weight, and insulating foams. However, future studies should investigate the performance of nanocomposites under real-world conditions and the scalability of nanoparticles from rice husks to help them compete with the available fillers in the market.
Footnotes
Acknowledgements
This study was made possible with support provided by African Center of Excellence in Materials, Product Development and Nanotechnology, Makerere University, Kampala, Uganda.
Declaration of conflicting interests
The authors declared no potential conflicts of interest with respect to the research, authorship, and/or publication of this article.
Funding
The authors disclosed receipt of the following financial support for the research, authorship, and/or publication of this article: This work was supported by the African Center of Excellence in Materials, Product Development and Nanotechnology, Makerere University, Kampala, Uganda.
Ethical considerations
This article does not contain any studies with human or animal participants.
Data Availability Statement
The datasets generated during and/or analyzed during the current study are available from the corresponding author on request.