
Abstract
An in situ process monitoring approach for overmoulding of short glass fibre reinforced thermoplastics onto continuous fibre laminates is presented. The approach is based on novel tool-mounted sensors that combine infrared (IR)-based temperature with piezoelectric pressure measurement. Applying the sensors, parameter studies are performed with the target to investigate influences on the interfacial bond strength of short-glass fibre reinforced polypropylene (PP-GF) on corresponding laminates. In a first step, a full-factorial parametric study with rib-on-plate specimens was performed to identify process parameters significantly affecting interfacial bond strength, which was measured by rib-pull-off tests. These were found to be the melt temperature, the laminate surface temperature, the cavity pressure and the local filling velocity. A second study focused on these parameters, and applied a V-shaped demonstrator geometry with a rib connecting both flanges. Mechanical performance was determined, by pulling on the flanges of the V-structure thereby causing joint failure. For both geometries the in situ sensor data proved highly repeatable and enabled direct correlation of the investigated parameters with the mechanical joint performance. The results show that both higher thermal input and faster filling improve the bond strength. In a further study the V-structures were manufactured with short carbon fibre reinforced polyphenylene sulfide (PPS-CF), thereby showing functionality of the sensors also for these higher temperatures. Overall, the study demonstrates that the novel integrated IR/pressure sensor systems enable reliable cavity-level process monitoring and provide a robust foundation for data-driven quality assessment in thermoplastic composite overmoulding.
Keywords
Introduction
Overmoulding is the process of injection moulding short-fibre-reinforced thermoplastics onto continuous fibre-reinforced laminates. It is a promising method for manufacturing highly integrated lightweight structures, as it allows combination of the high specific mechanical properties of laminates with the tremendous geometric flexibility of injection moulding. Another main advantage of overmoulding is the high level of integration and automation, making it suitable for large volume production. 1
In recent years, overmoulding has attracted increasing scientific attention due to the growing demand for multifunctional composite structures and efficient manufacturing concepts for fibre-reinforced thermoplastics. Several review studies emphasise that overmoulding enables the integration of reinforcement concepts across different lengths, thus allowing for load-adapted designs that cannot be achieved with conventional processing methods alone. At the same time, these studies indicate that the interactions between material systems, process conditions and interface development remain complex and are not yet fully understood, especially in high-performance applications.2,3
For these reasons, overmoulding is already established in the automotive sector, where mainly technical plastics are used for non-safety-related components.4–6 At the same time, there are still deficits in terms of part and process design, control and quality assurance, particularly regarding the interface between the laminate and the overmoulding material. Numerous studies have investigated the impact of machine settings on bond strength.7–9 Nevertheless, there is still insufficient understanding of how process-internal variables such as melt and surface temperature or cavity pressure influence the resulting adhesive strength. These process variables have hardly been systematically recorded or evaluated to date. In industrial practice, quality assurance is usually performed by monitoring the easily accessible machine parameters10,11 and monitoring the produced material properties. However, advances in sensor integration enable process parameters to be recorded in situ directly in the mould cavity.12,13 This allows for new approaches for component-specific process monitoring and the development of digital quality databases. Such developments could strengthen the reliability and understanding of the technology, paving the way to exploit the potential of overmoulding also for aviation.
In their review paper, Ageyeva et al. show that tool-integrated measurement of process parameters in injection moulding is a central element of modern, data-driven manufacturing concepts. In particular, cavity pressure measurement using piezoelectric sensors is described as an established standard for process monitoring, while temperature measurement is classified as equally relevant but technologically more demanding. Non-contact in-mould temperature measurements based on infrared radiation are suitable for mapping the rapid filling and holding pressure phases due to their high temporal resolution. There is a trend towards combined sensor systems in which pressure and temperature information is recorded simultaneously in order to characterise the different phases of the injection moulding process comprehensively. 14 This approach is considered an essential requirement for improved process understanding and robust process monitoring. In this context, the use of mould-integrated, fibre-optic in-mould sensors for IR-based temperature measurement and IR-based temperature and pressure sensors directly meets the requirements identified in the literature for high-resolution, fast and combined measurement concepts and closes a gap that previously existed between established pressure sensors and advanced, non-contact temperature measurement in the mould.
There the requirements for weight reduction, reproducibility and structural integrity are significantly higher compared to automotive. For this reason, high-performance rather than technical thermoplastics are used, which also offer potential for load-bearing, safety-relevant components.15,16 Such components could be manufactured via overmoulding, provided that the technology is fully mastered. In this context, another obstacle is the lack of a uniform sample geometry for verifying strength of overmoulded structures. It has been shown that the design of the overmoulded component itself has a decisive impact on the quality and performance of thermoplastic overmoulded composites. In particular, systematic investigations of rib-reinforced laminate structures have shown that variations in rib geometry and flow length have a significant influence on microstructural features such as fibre orientation, void distribution and local deformation of the laminate due to injection pressure. It was observed that these design-related effects have a significant influence on the bonding strength and failure behaviour at the interface between the laminate and the overmoulding. In addition, position-dependent differences along the melt flow path were observed, indicating locally varying process conditions and interface qualities within a single component. 17 The ‘rib-on-plate’ specimen introduced by Gaitzsch et al. (2018) offers a suitable basis in this regard, as it reflects different load scenarios and allows for variation in process parameters. 7
Despite the considerable progress described in the literature, current review articles consistently point to unresolved issues regarding the systematic correlation of process conditions, cavity variables measured on site, and the resulting interfacial strength for different material systems and geometries. This underscores the need for integrated experimental and data-driven approaches that combine advanced sensor technology with mechanical characterisation in order to establish reliable quality-relevant process indicators. 2
The aim of this work is to experimentally investigate the relationships between process parameters, cavity variables and the resulting bond strength. To this end, a comprehensive parameter study based on a full factorial experimental design is first conducted to identify significant influencing factors. Subsequently, a second, reduced parameter study is performed with the most relevant parameters. Based on this, a near-application geometry with different material systems (PP-GF and PPS-CF) is manufactured, monitored by sensors and mechanically characterised. In the long term, the data obtained will be used to develop an approach for automated quality assurance and digital documentation of process and component parameters.
Experimental
Test coupon design
The rib-on-plate specimen geometry is displayed in Figure 1. It is extracted from larger parts (Figure 2) where the dimensions of the laminate are 300 × 40 × 2 mm. The injection moulded rib to be pulled off measures 280 × 3.5 × 30 mm. To prevent the laminate from bending during tensile testing, a second rib was injection moulded on the other side. It is thicker and therefore has a greater contact area to the laminate (see Figure 1), to force failure on the side with the thinner rib. Sections of 40 mm were cut from the coupons, which results in a testing bonding area of 87.5 mm2. Front, side and isometric view of the double rib test specimen for rib pull-off tests. Model of sensor placement inside the overmoulding cavity (laminate in grey and injection mould compound in blue), the support rib for clamping the test specimens is shown in green.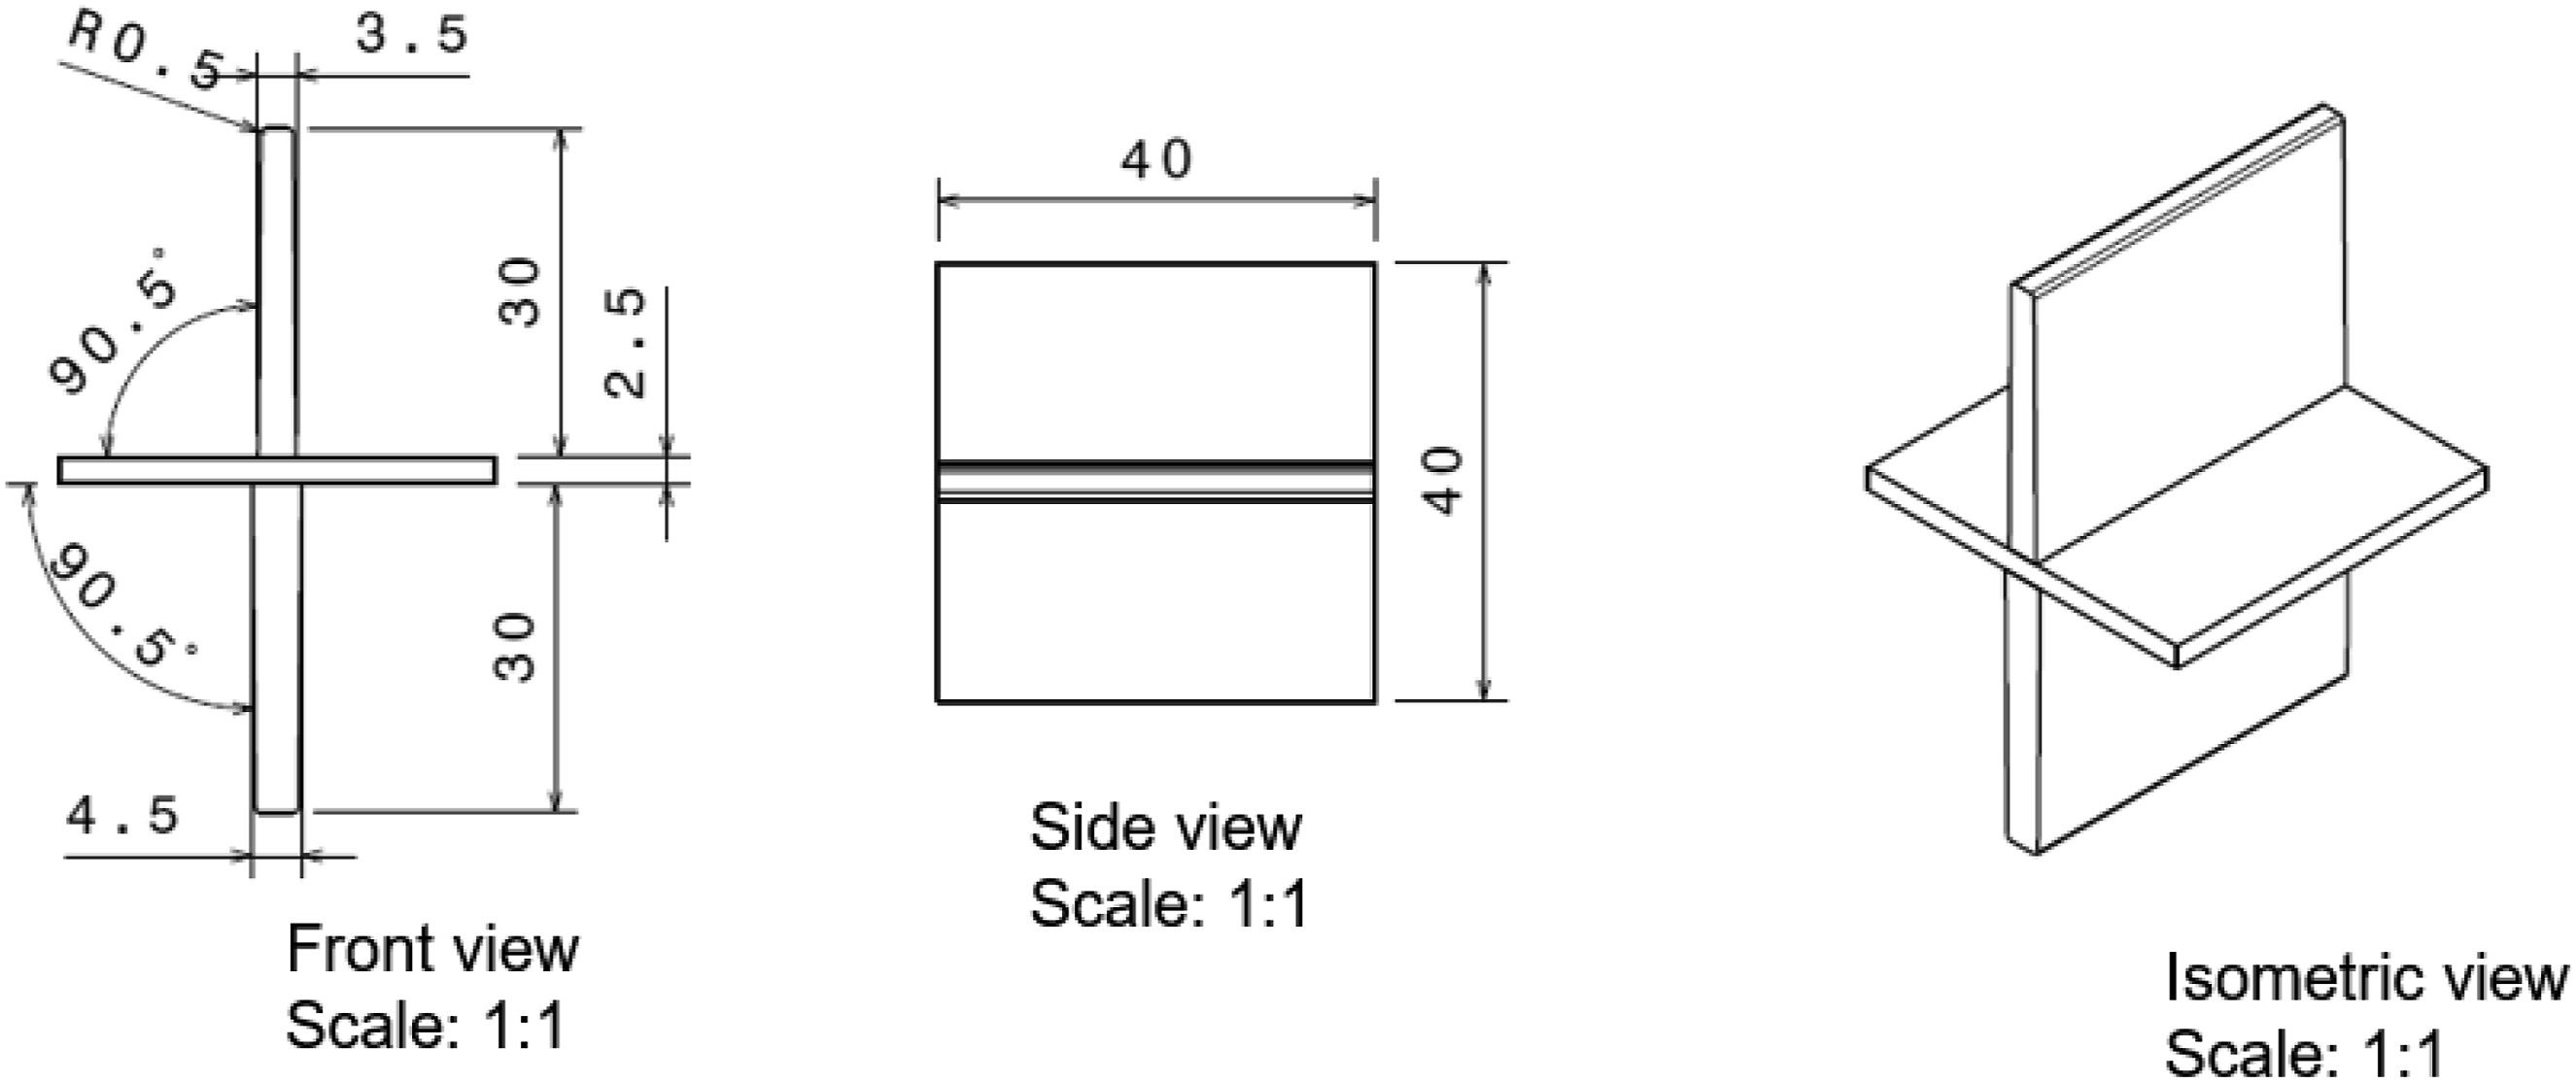
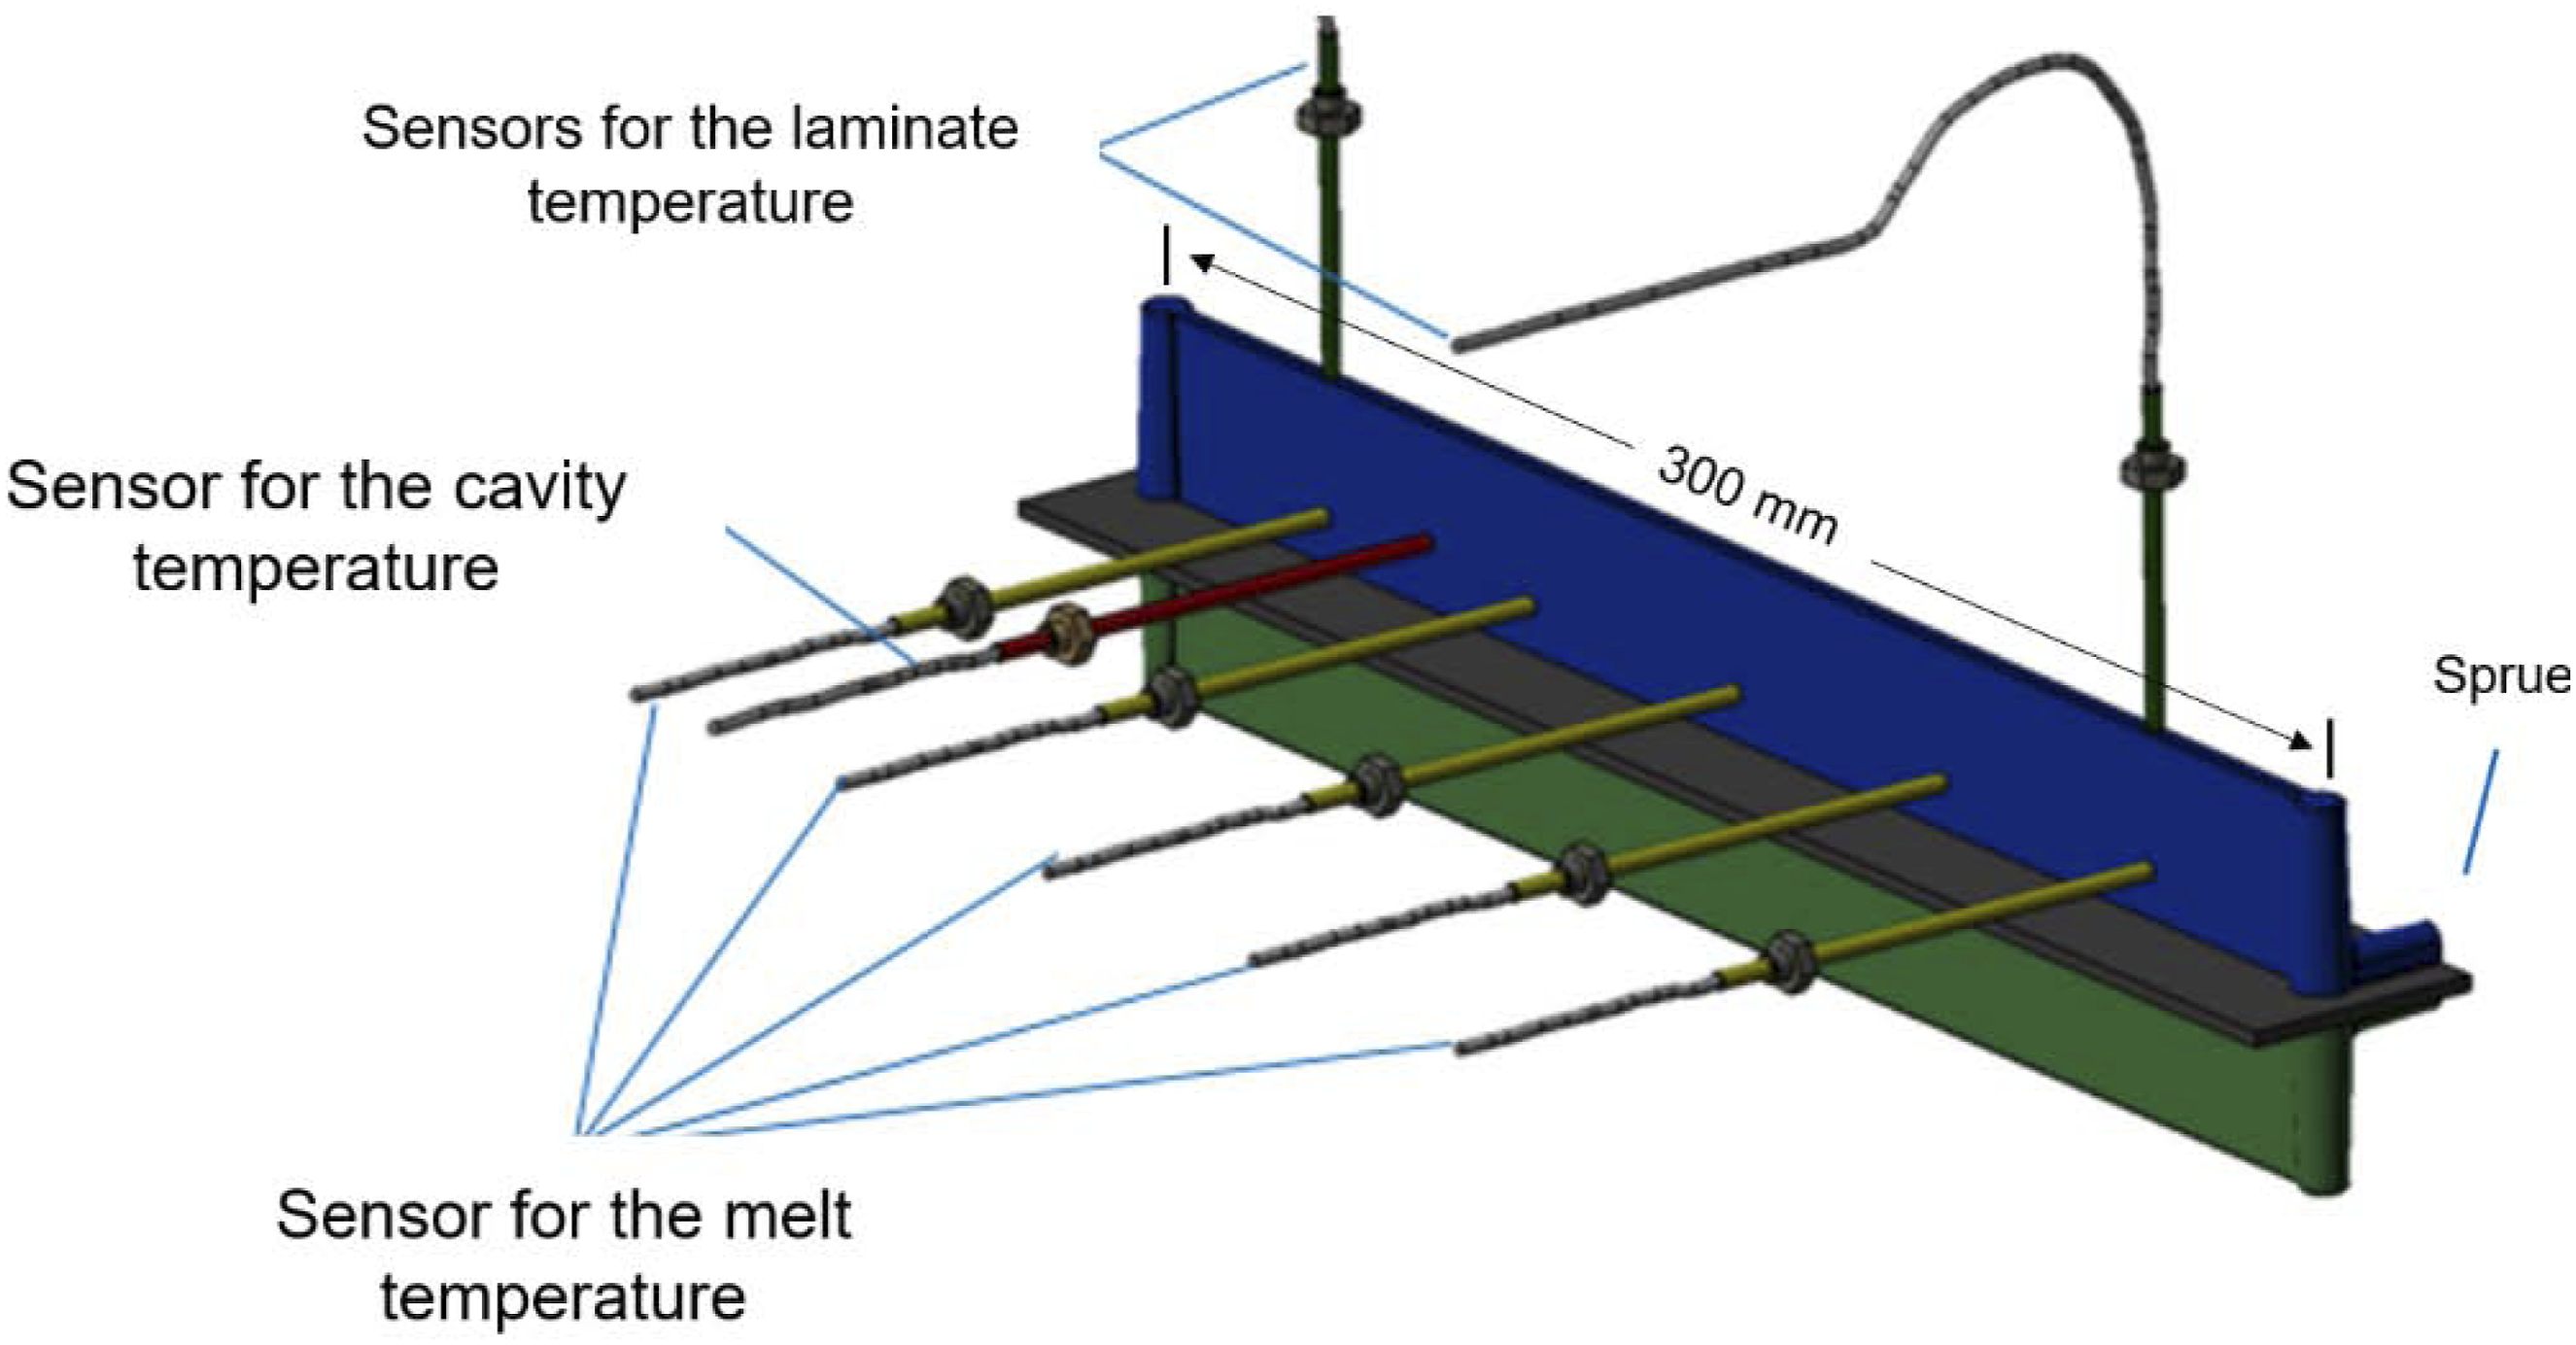
A single-sprue configuration was chosen for overmoulding the rib. The mould itself can be heated by a total of eight heating cartridges and cooled actively via water connections, as well as passively by convective and radiant heat exchange on the outer surfaces of the tool and the parting line when opened. The cavity on the nozzle side has a pocket for the laminate with a depth of 2 mm. Both the tool and the laminate are heated before overmoulding, which in turn results in the expansion of both materials. Since the transverse expansion of the laminate is significantly higher than that of steel, the mould halves first touch the laminate, the laminate is then compressed by the clamping force and the mould halves make contact at the parting plane afterwards. Within the mould, the system features eight sensors: Five sensors to measure the temperature of the melt at various positions, two sensors to measure the temperature of the laminate until the melt is injected, and one sensor to continuously monitor the temperature of the cavity (see Figure 2). This provides information about the temperature gradient of the melt, the injection speeds, and the impact of temperature on the mould.
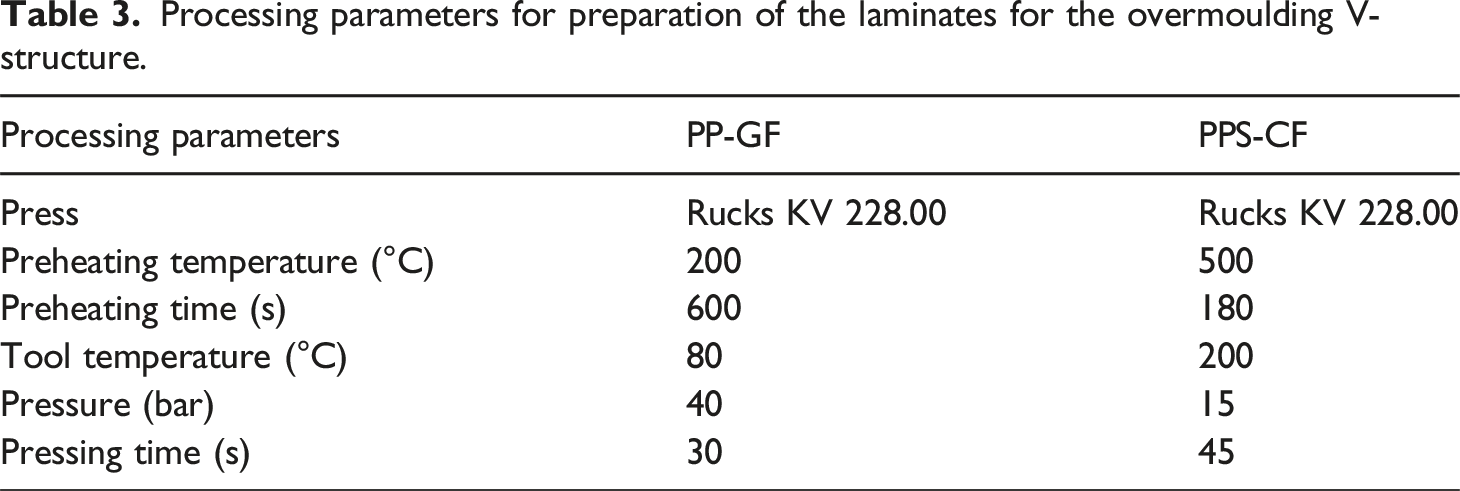
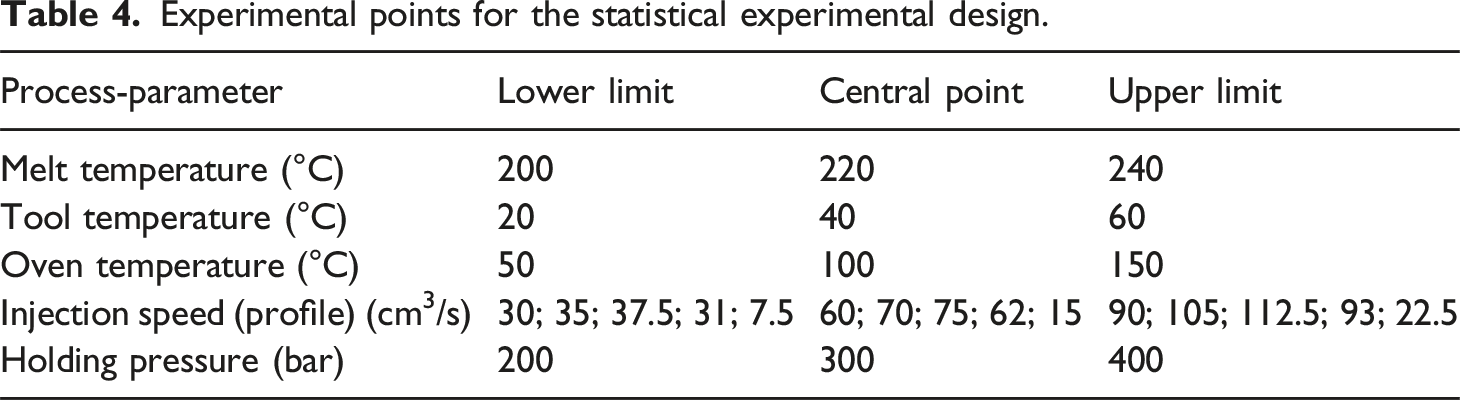
For the second study, a part-like geometry that is considered a typical structure in aerospace engineering was manufactured (Figure 3). The rib has a thickness of 4 mm and a draft angle of 2° for easy demoulding. V-structure made from the material combinations PP-GF (left) and PPS-CF (right) manufactured at the Kurz Kunststoffe GmbH.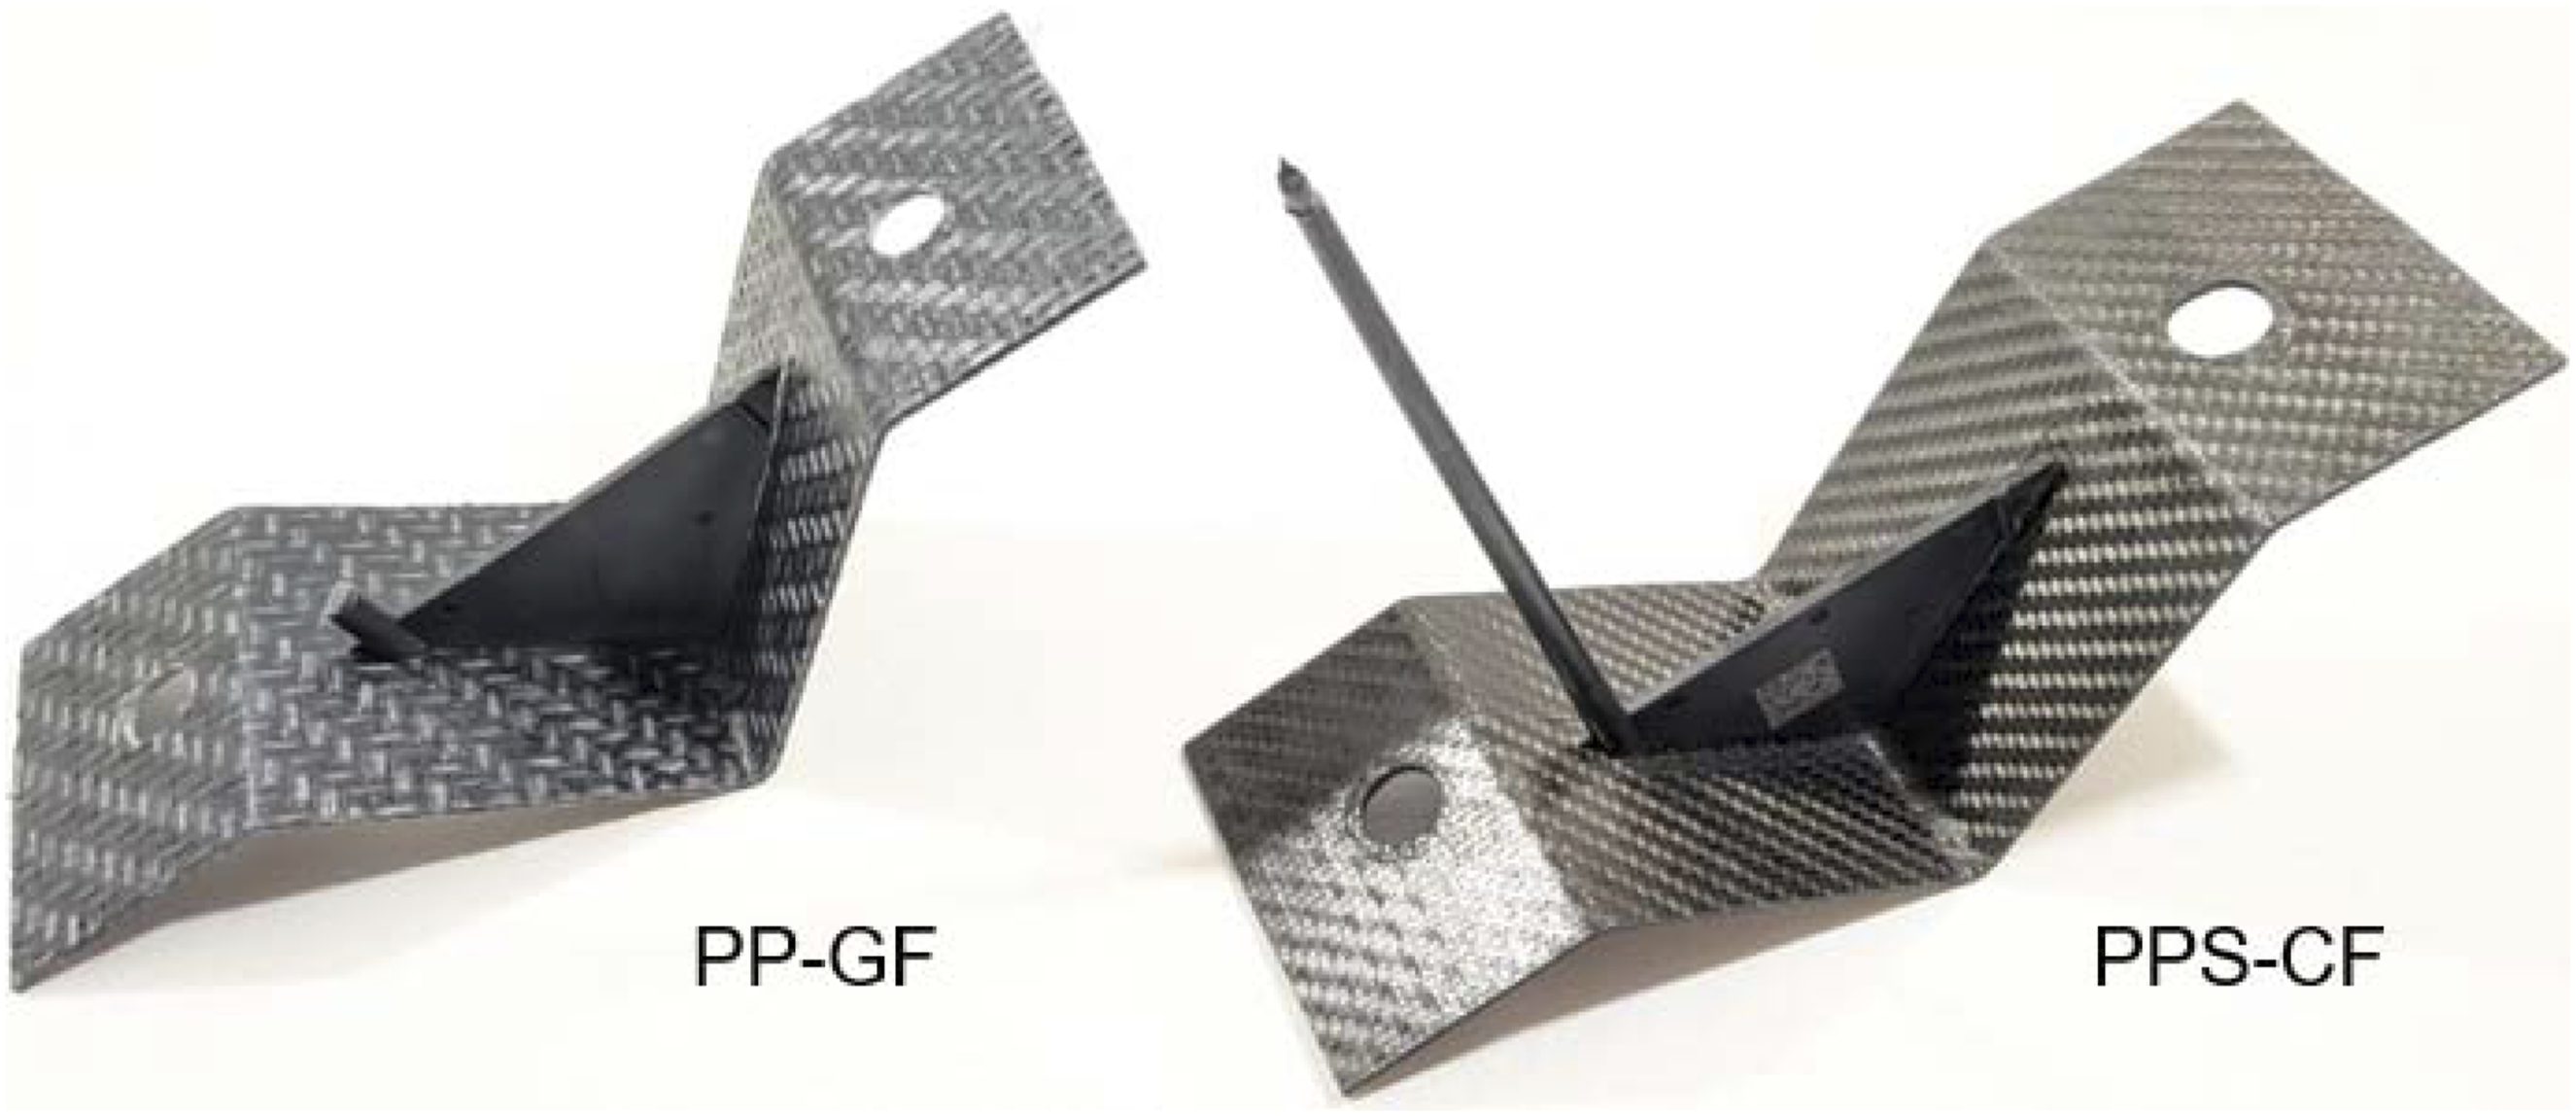
The injection moulding tool was designed and manufactured in close cooperation with Kurz Kunststoffe GmbH. Laminates are positioned on the ejector side and secured with two locking pins. The heating and cooling concept of the mould has been designed to enable the processing of various material systems, including high-temperature thermoplastics such as Polyetheretherketone (PEEK).
The tool is equipped with several sensors. Four of the sensors measure the temperature of the melt inside the cavity. Two additional sensors can measure all three parameters: the mould temperature, the temperature of the melt and the internal mould pressure. The flow velocity within the cavity is calculated from the time of measurement between the sensors located at the far end and near end of the sprue. An additional sensor monitors the surface temperature of the laminate until the injection moulding compound has reached it.
Sensor technology
The sensor technology was developed and provided by FOS Messtechnik GmbH. For the rib-on-plate specimen a type of fibre-optic infrared (IR) temperature sensor developed by FOS for overmoulding applications was utilized (see Figure 4). The sensor comprises a quartz optical fibre coupled to a probe sealed by a pressure-tight sapphire window. IR radiation emitted from the molten polymer is conveyed via the fibre to an IR-detector amplifier. These fibre-optic sensors can be manufactured in very compact dimensions—down to about 3 mm diameter. A notable limitation is that the quartz fibre ceases to transmit IR wavelengths beyond approximately 2.5 µm, which results in a detection threshold of about 100°C (lower temperatures cannot be reliably measured) Due to the limited infrared transmission window of fused silica, which is largely confined to wavelengths below about 2–3 µm, the usable radiative signal transmitted through the quartz fibre becomes very small at low object temperatures.
18
Additionally, the restricted bending radius of the quartz fibre imposes practical challenges when integrating the probe into mould tooling. The mould temperature was measured using a gradient thermometer consisting of three thermocouples (TC). IR-temperature sensor for the rib-on-plate mould provides by FOS-Messtechnik.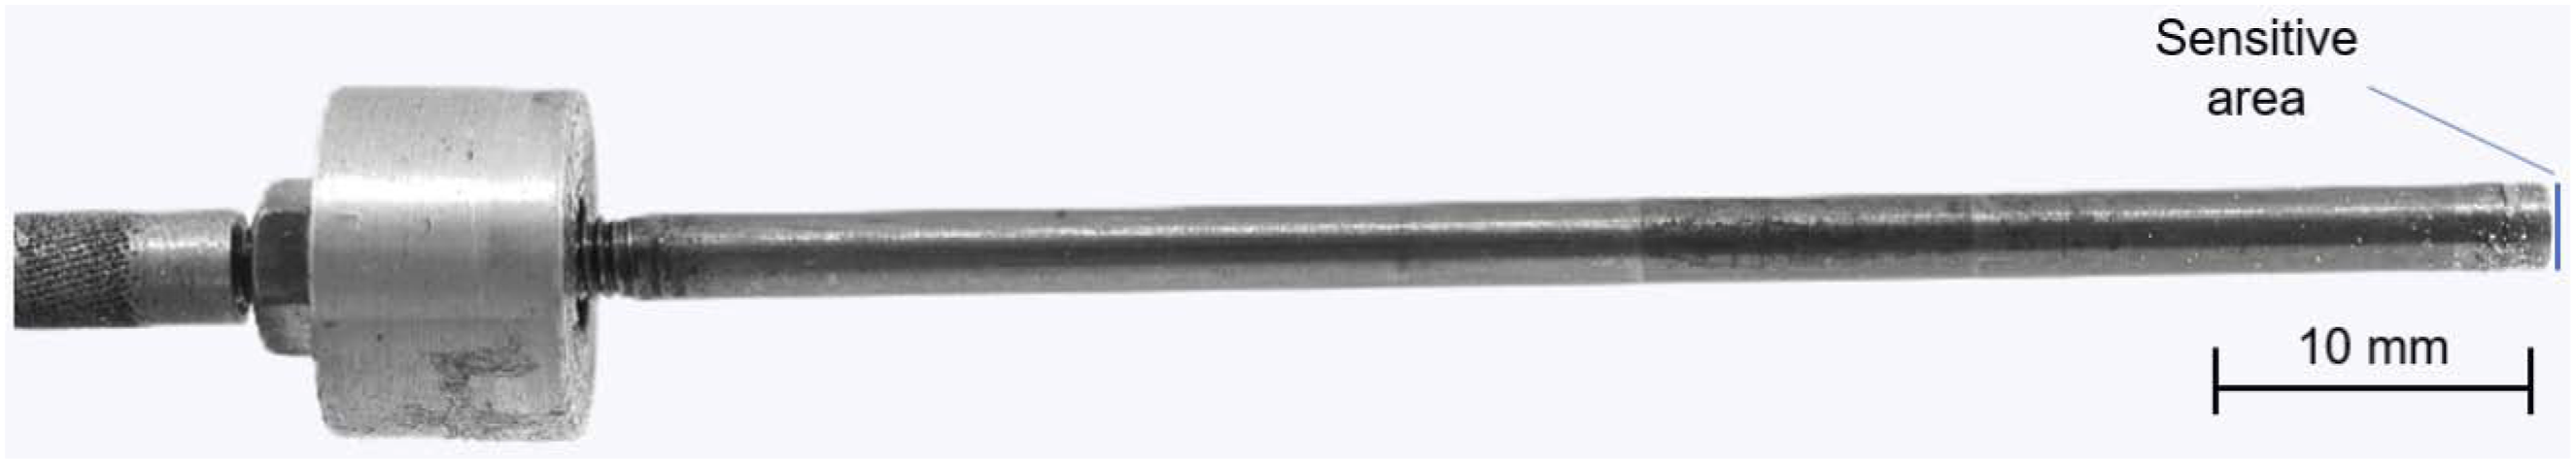
Various sensors from FOS Messtechnik GmbH are installed in the V-structure tool as well (Figure 5). Sensor positioning for the production of the PP-GF and PPS-CF V-structures.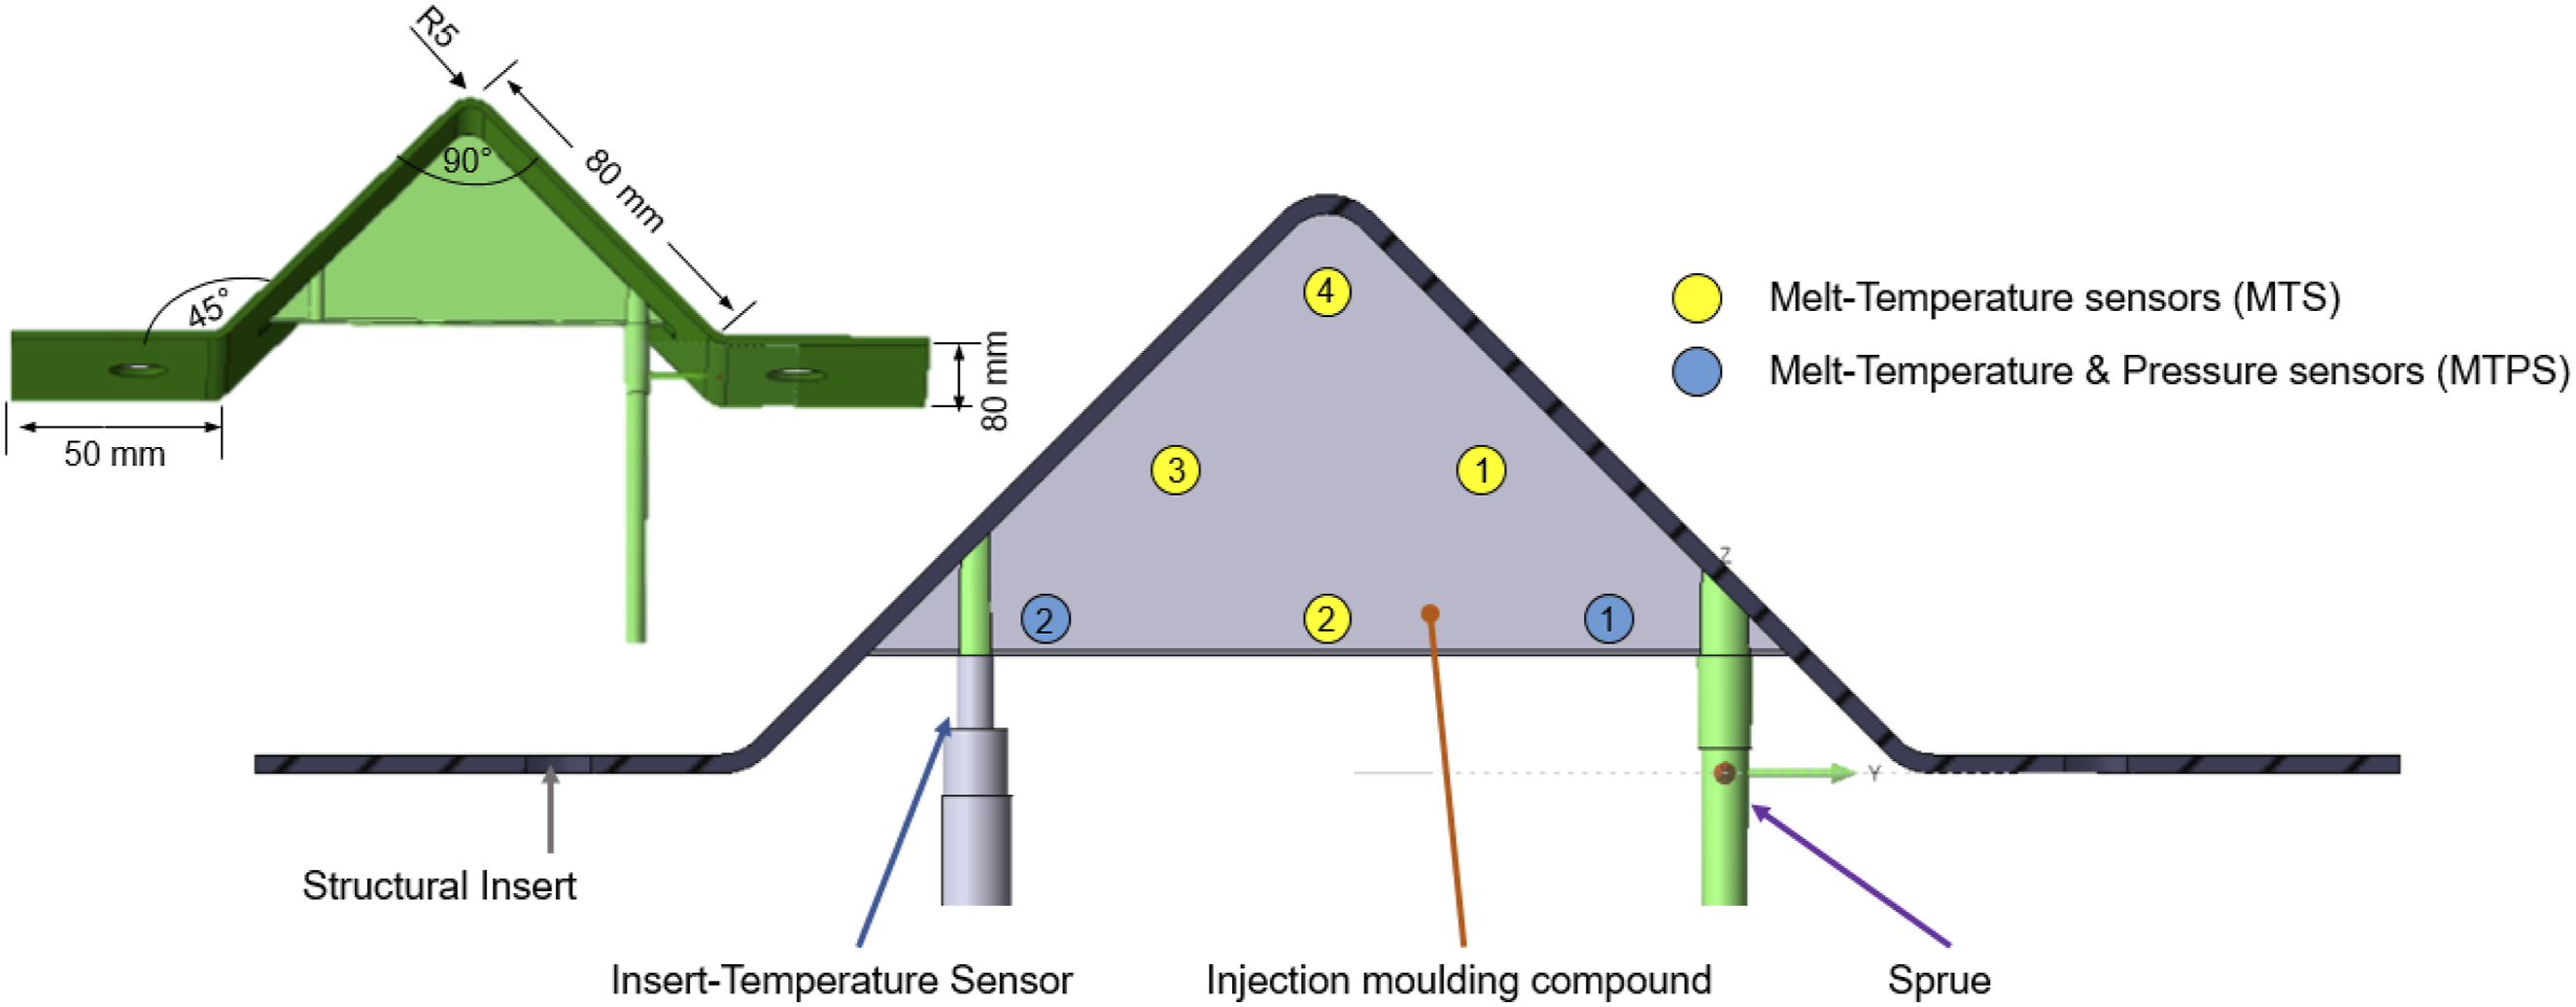
The mould temperature and surface temperature sensors (MTS-IR-STS) use an infrared (IR) thermocouple that converts the radiant energy into electrical signals via the Seebeck effect. These can measure both the temperature of the tool and the surface temperature of the laminate. The combined mould temperature and pressure sensors (MTPS-IR, Figure 6) measure the temperature of the polymer melt via an IR thermocouple. The dimensions correspond to those of standard mould pressure sensors with a diameter of 4 mm. Therefore, the MTPS can replace these cavity pressure sensors without having to change the mounting hole. Figure 6 demonstrates the principal design of the MTPS sensor mounted in a mould. It can measure the IR temperature of the surface of the organo sheet, the melt temperature when the melt reaches the sensor surface, the mould surface temperature and the melt pressure at the same point.
19
The sensor measures the actual temperature of the part and its cooling temperature. Thus, the sensor can be used to open the mould at a specific temperature to prevent deformation. The IR radiation from the polymer melt is transmitted to the sensor through a sapphire window. The pressure is measured by these sensors via an integrated piezoelectric pressure sensor, whose quartz crystals generate a charge when pressure is applied to them. All sensors have a response time of 10 ms, which allows for precise evaluation of the different temperatures and pressures throughout processing. Left image: MTPS sensor with a diameter of 4 mm; Right image: Schematic illustration of the MTPS sensor.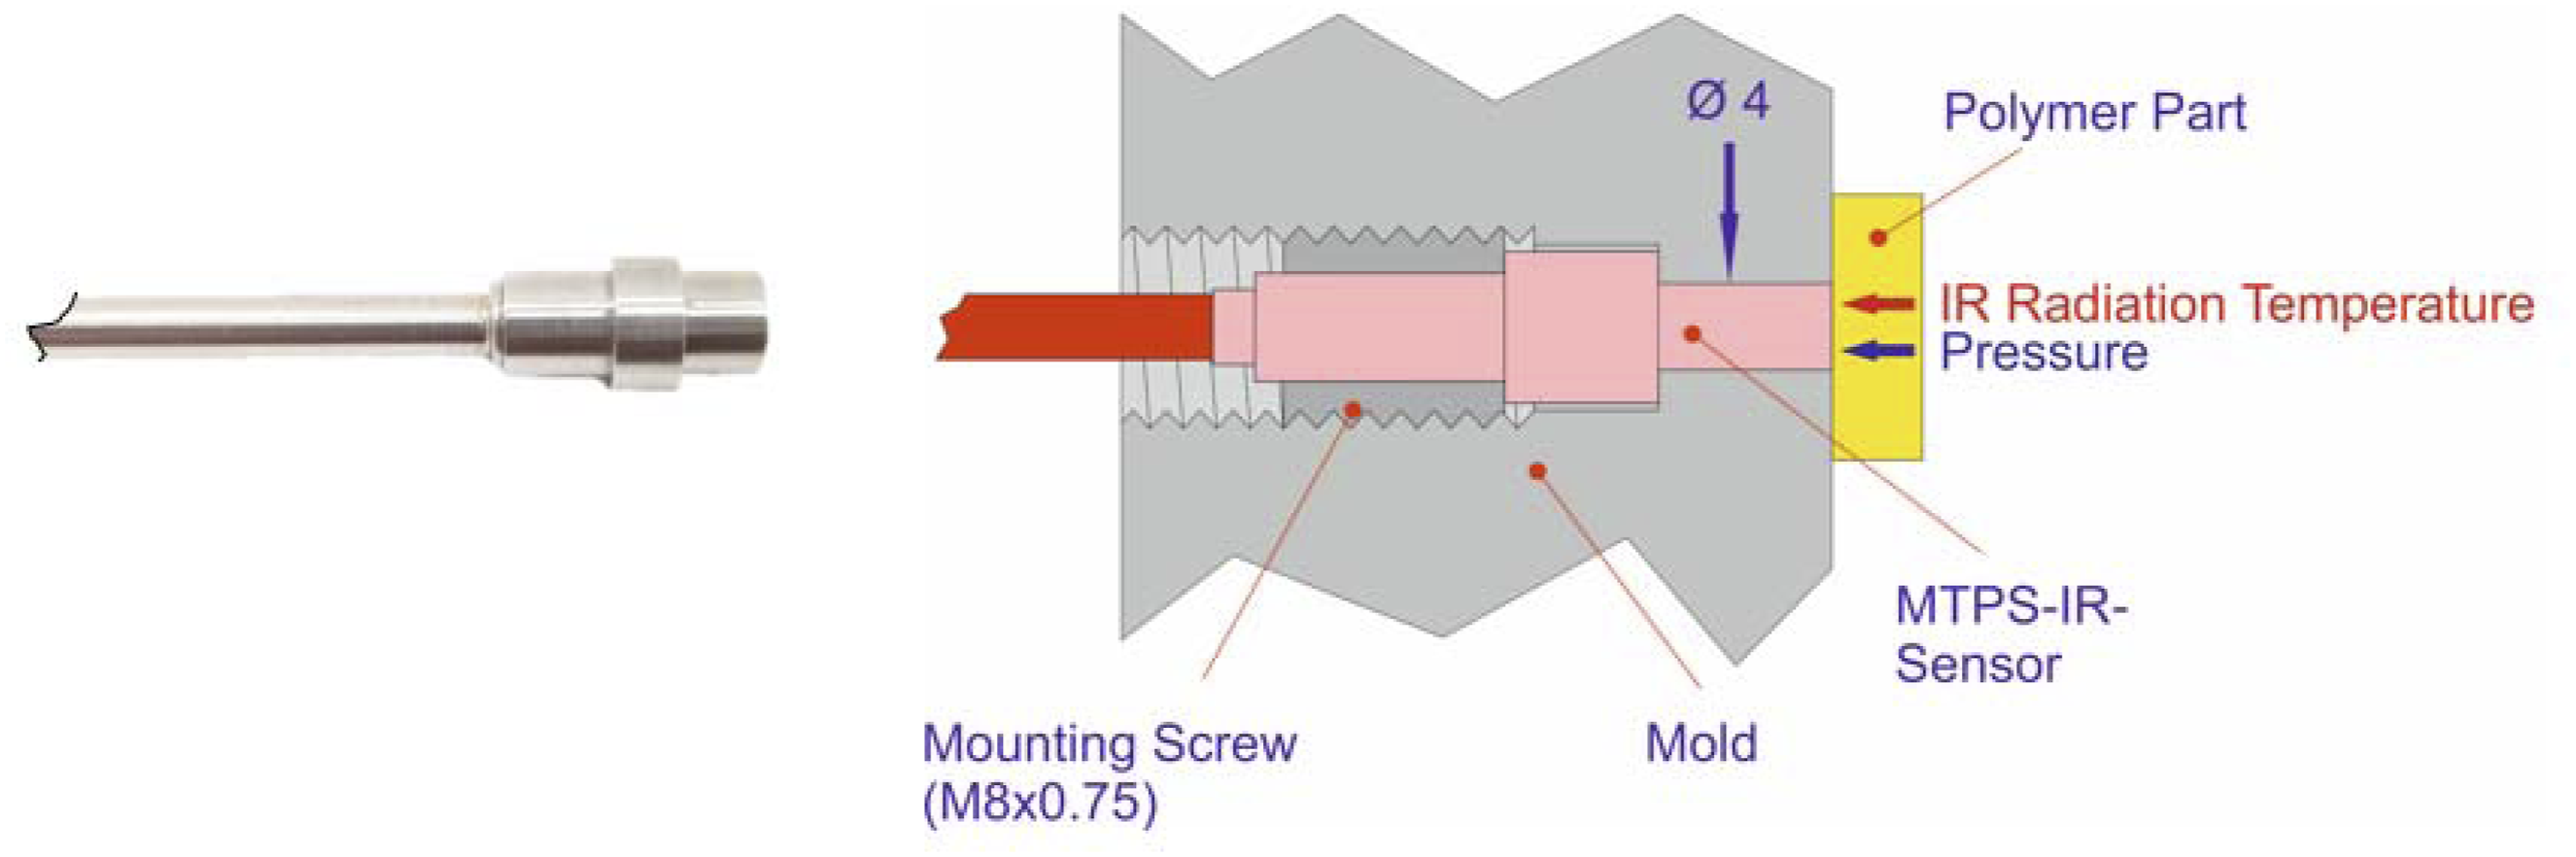
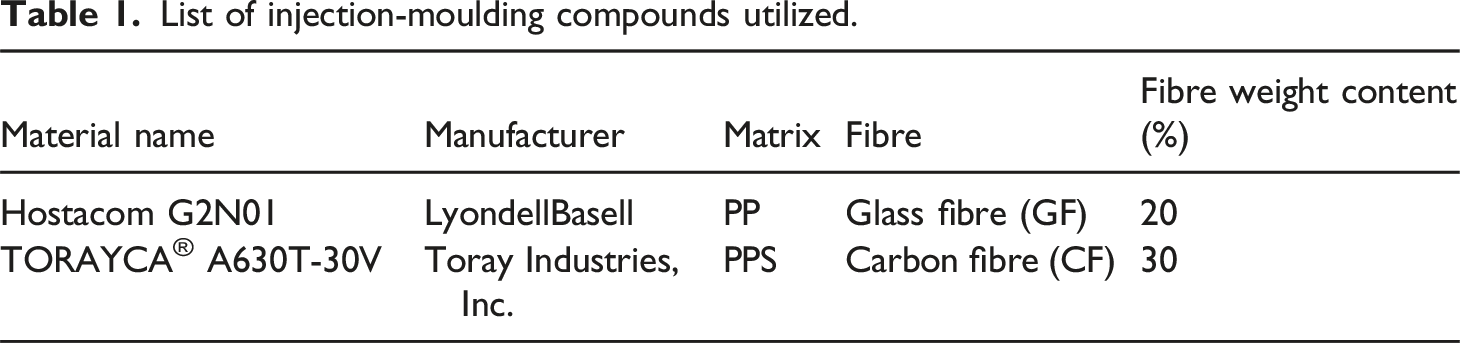
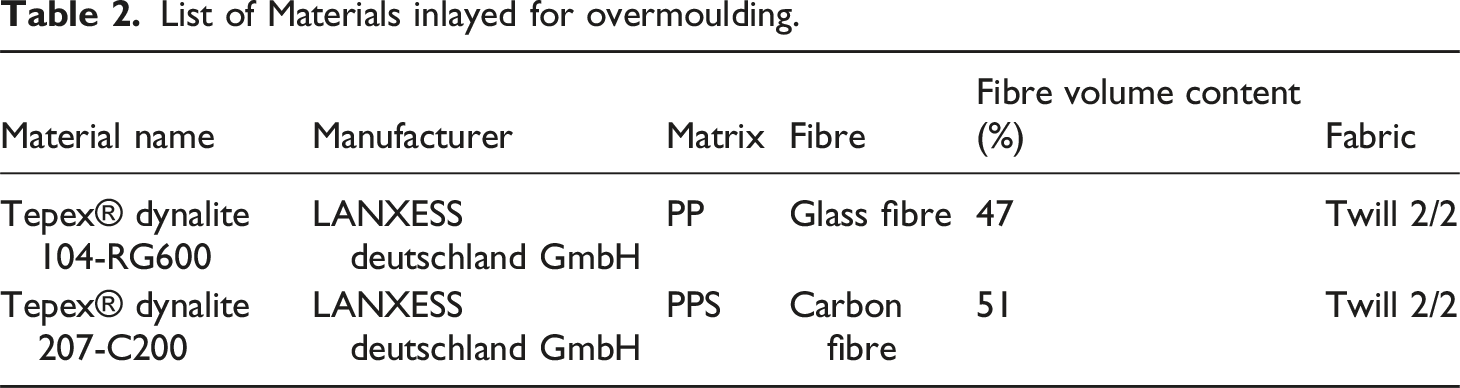
Materials
List of injection-moulding compounds utilized.
List of Materials inlayed for overmoulding.
Preparation of laminates
The laminate material for the rib test specimens was cut to the required size from ordered organo sheets using a test specimen saw. These laminates do not require any further processing prior to the overmoulding process.
A simple shaping die was designed and manufactured to produce the laminates for the V-structure from organo sheet cut-outs (Figure 7). The cut-outs are preheated in an oven (PP) or in an IR radiator field (PPS) and then transferred to the press using transfer frames. Following the forming process, the finished laminate elements were trimmed to their final contour and holes were drilled into the laminates, to be placed into alignment pins inside the injection moulding cavity. The corresponding pins in the forming tool ensure their positioning at the correct angle. All relevant production parameters are listed in Table 3. Shaping process for the laminates used for the V-structure: (a) shaping tool in the press; (b) laminate on the transfer frame; (c) shaped laminate in the open tool. Processing parameters for preparation of the laminates for the overmoulding V-structure.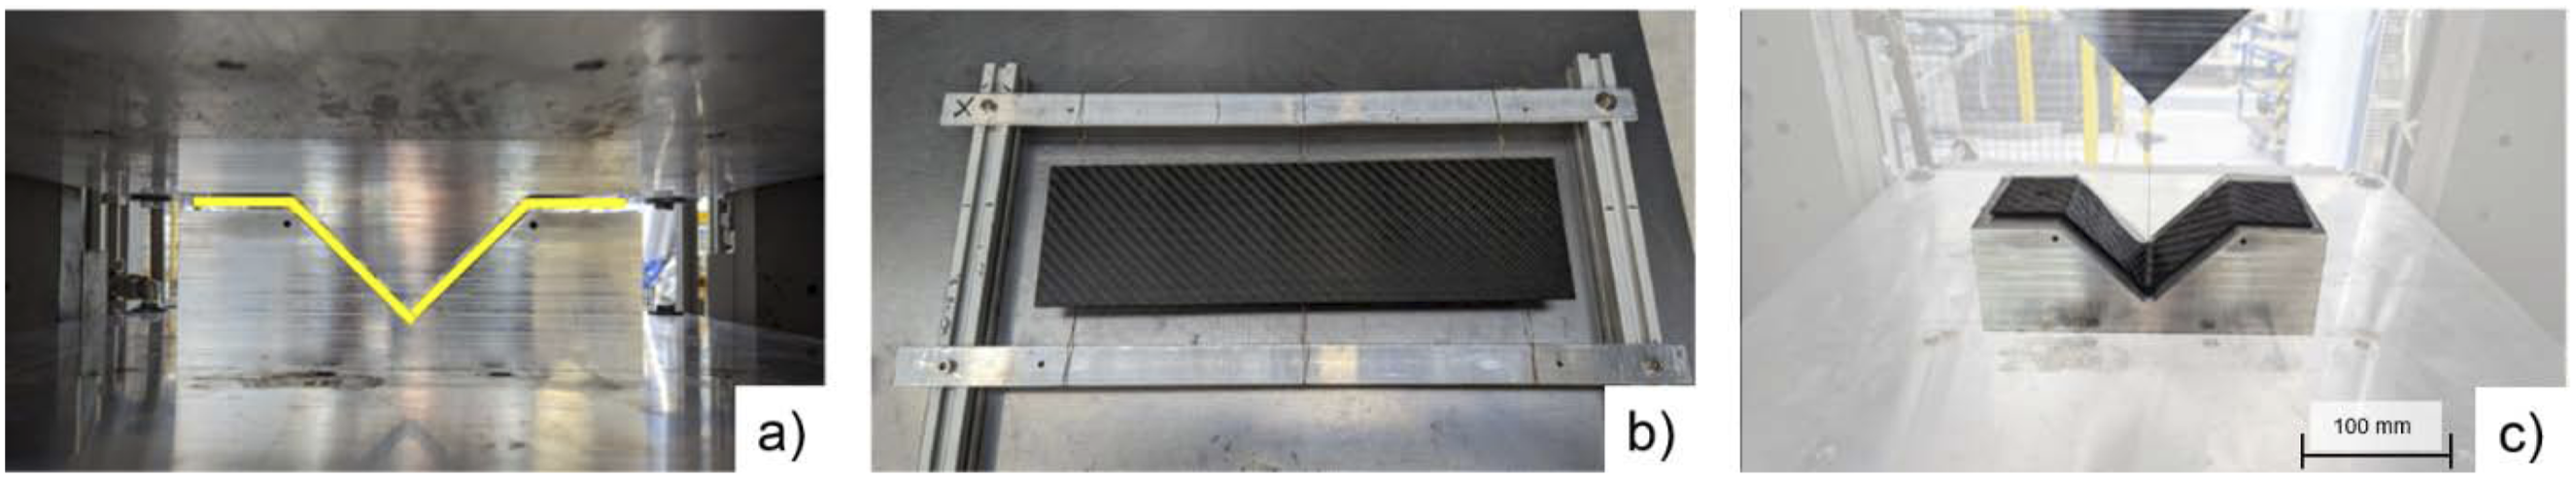
Rib-on-plate and V-structure manufacturing
The rib-on-plate test specimens were produced on an ENGEL VC 260/860 injection moulding machine (at Faserinstitut Bremen e.V.), while the V-structures were manufactured on an Arburg 320 U-Version (at Kurz Kunststoffe).
Experimental points for the statistical experimental design.
Experimental parameter for the statistical experimental design for the follow-up experiments.
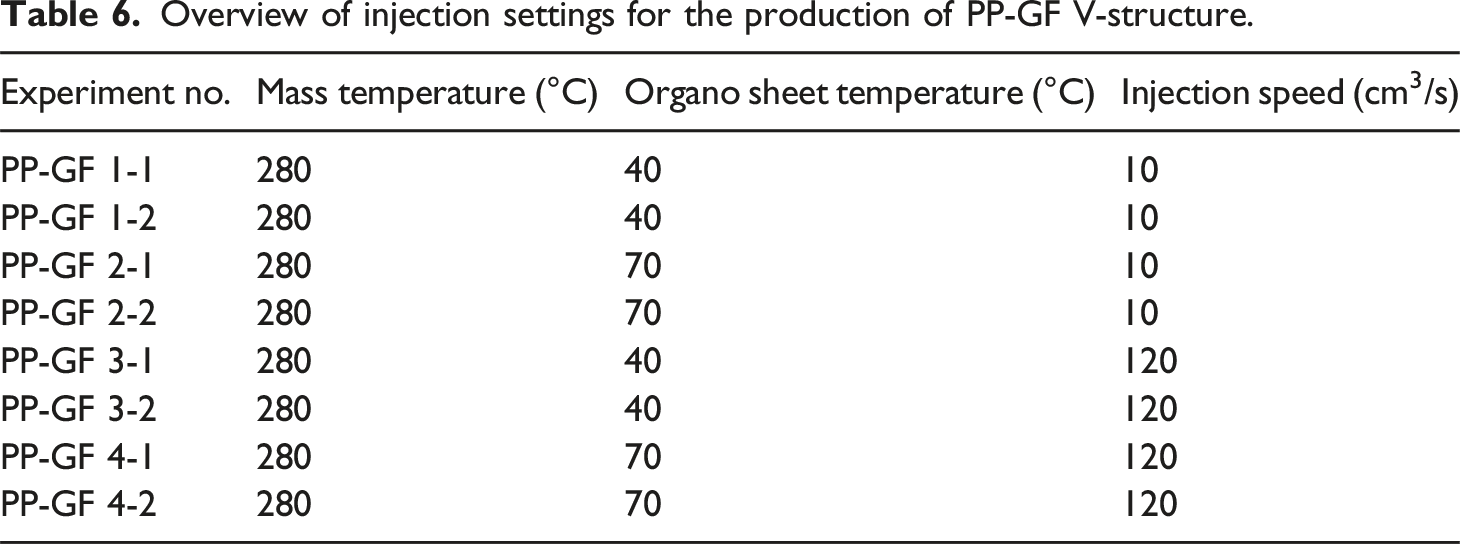
Overview of injection settings for the production of PP-GF V-structure.
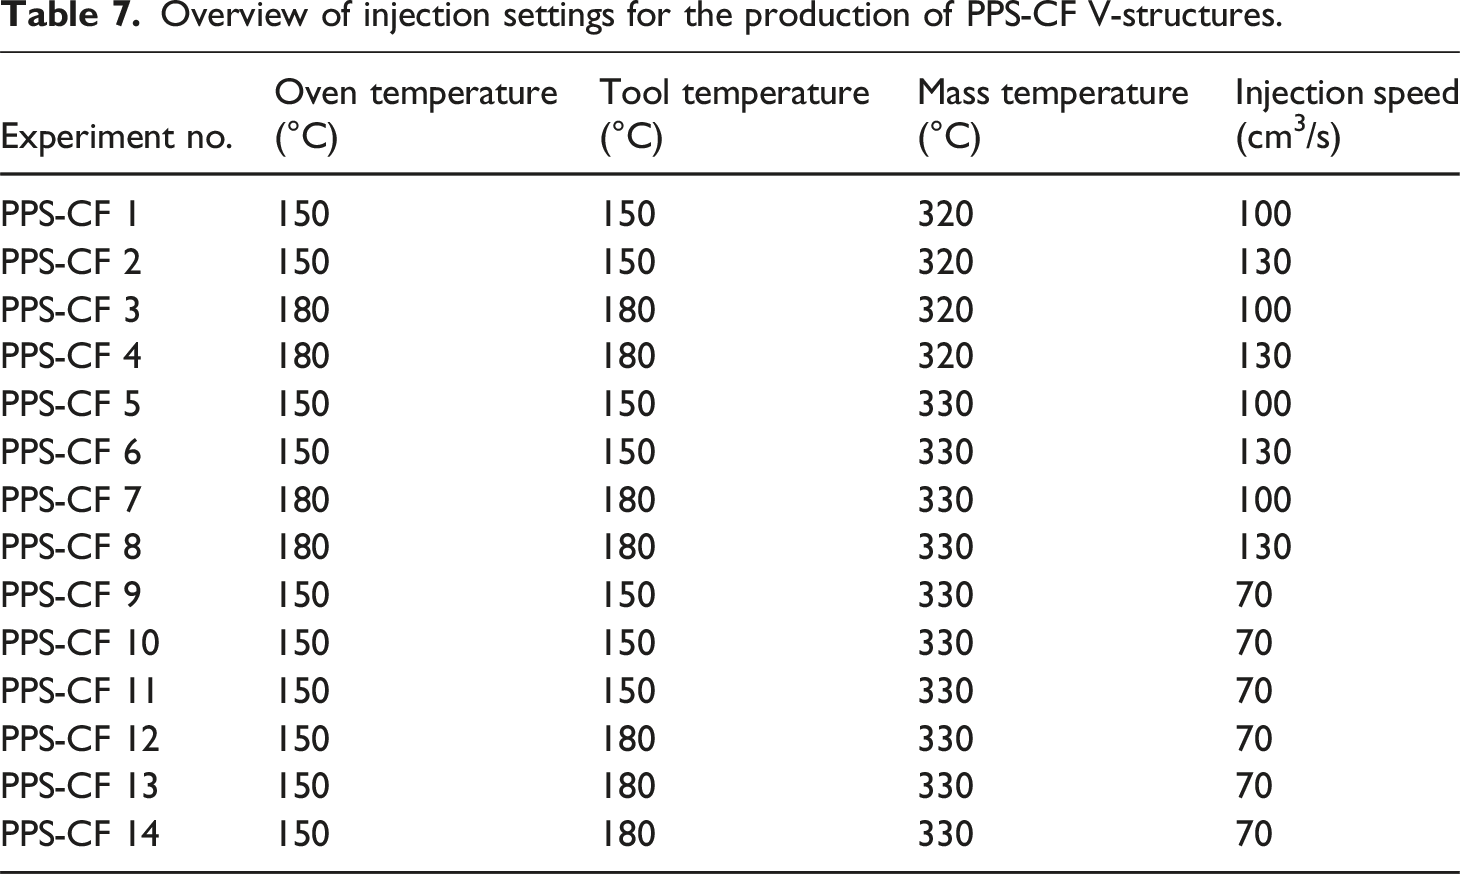
Overview of injection settings for the production of PPS-CF V-structures.
Mechanical testing
Both the rib test specimens and the V-structures were tested in a Zwick Z250 at Faserinstitut Bremen e.V. The rib test specimens, were clamped vertically, with the rib to be tested on the movable upper side and the thicker ribs on the lower fixed side, see Figure 8. All test specimens were conditioned for 24 hours at 23 ± 2°C at 50% RH test climate (according to EN ISO 527-1:2019
20
) and then tested at a test speed of 1 mm/min. On the left, the clamping situation of the double rib test specimen, and on the right, the clamping situation of a V-structure.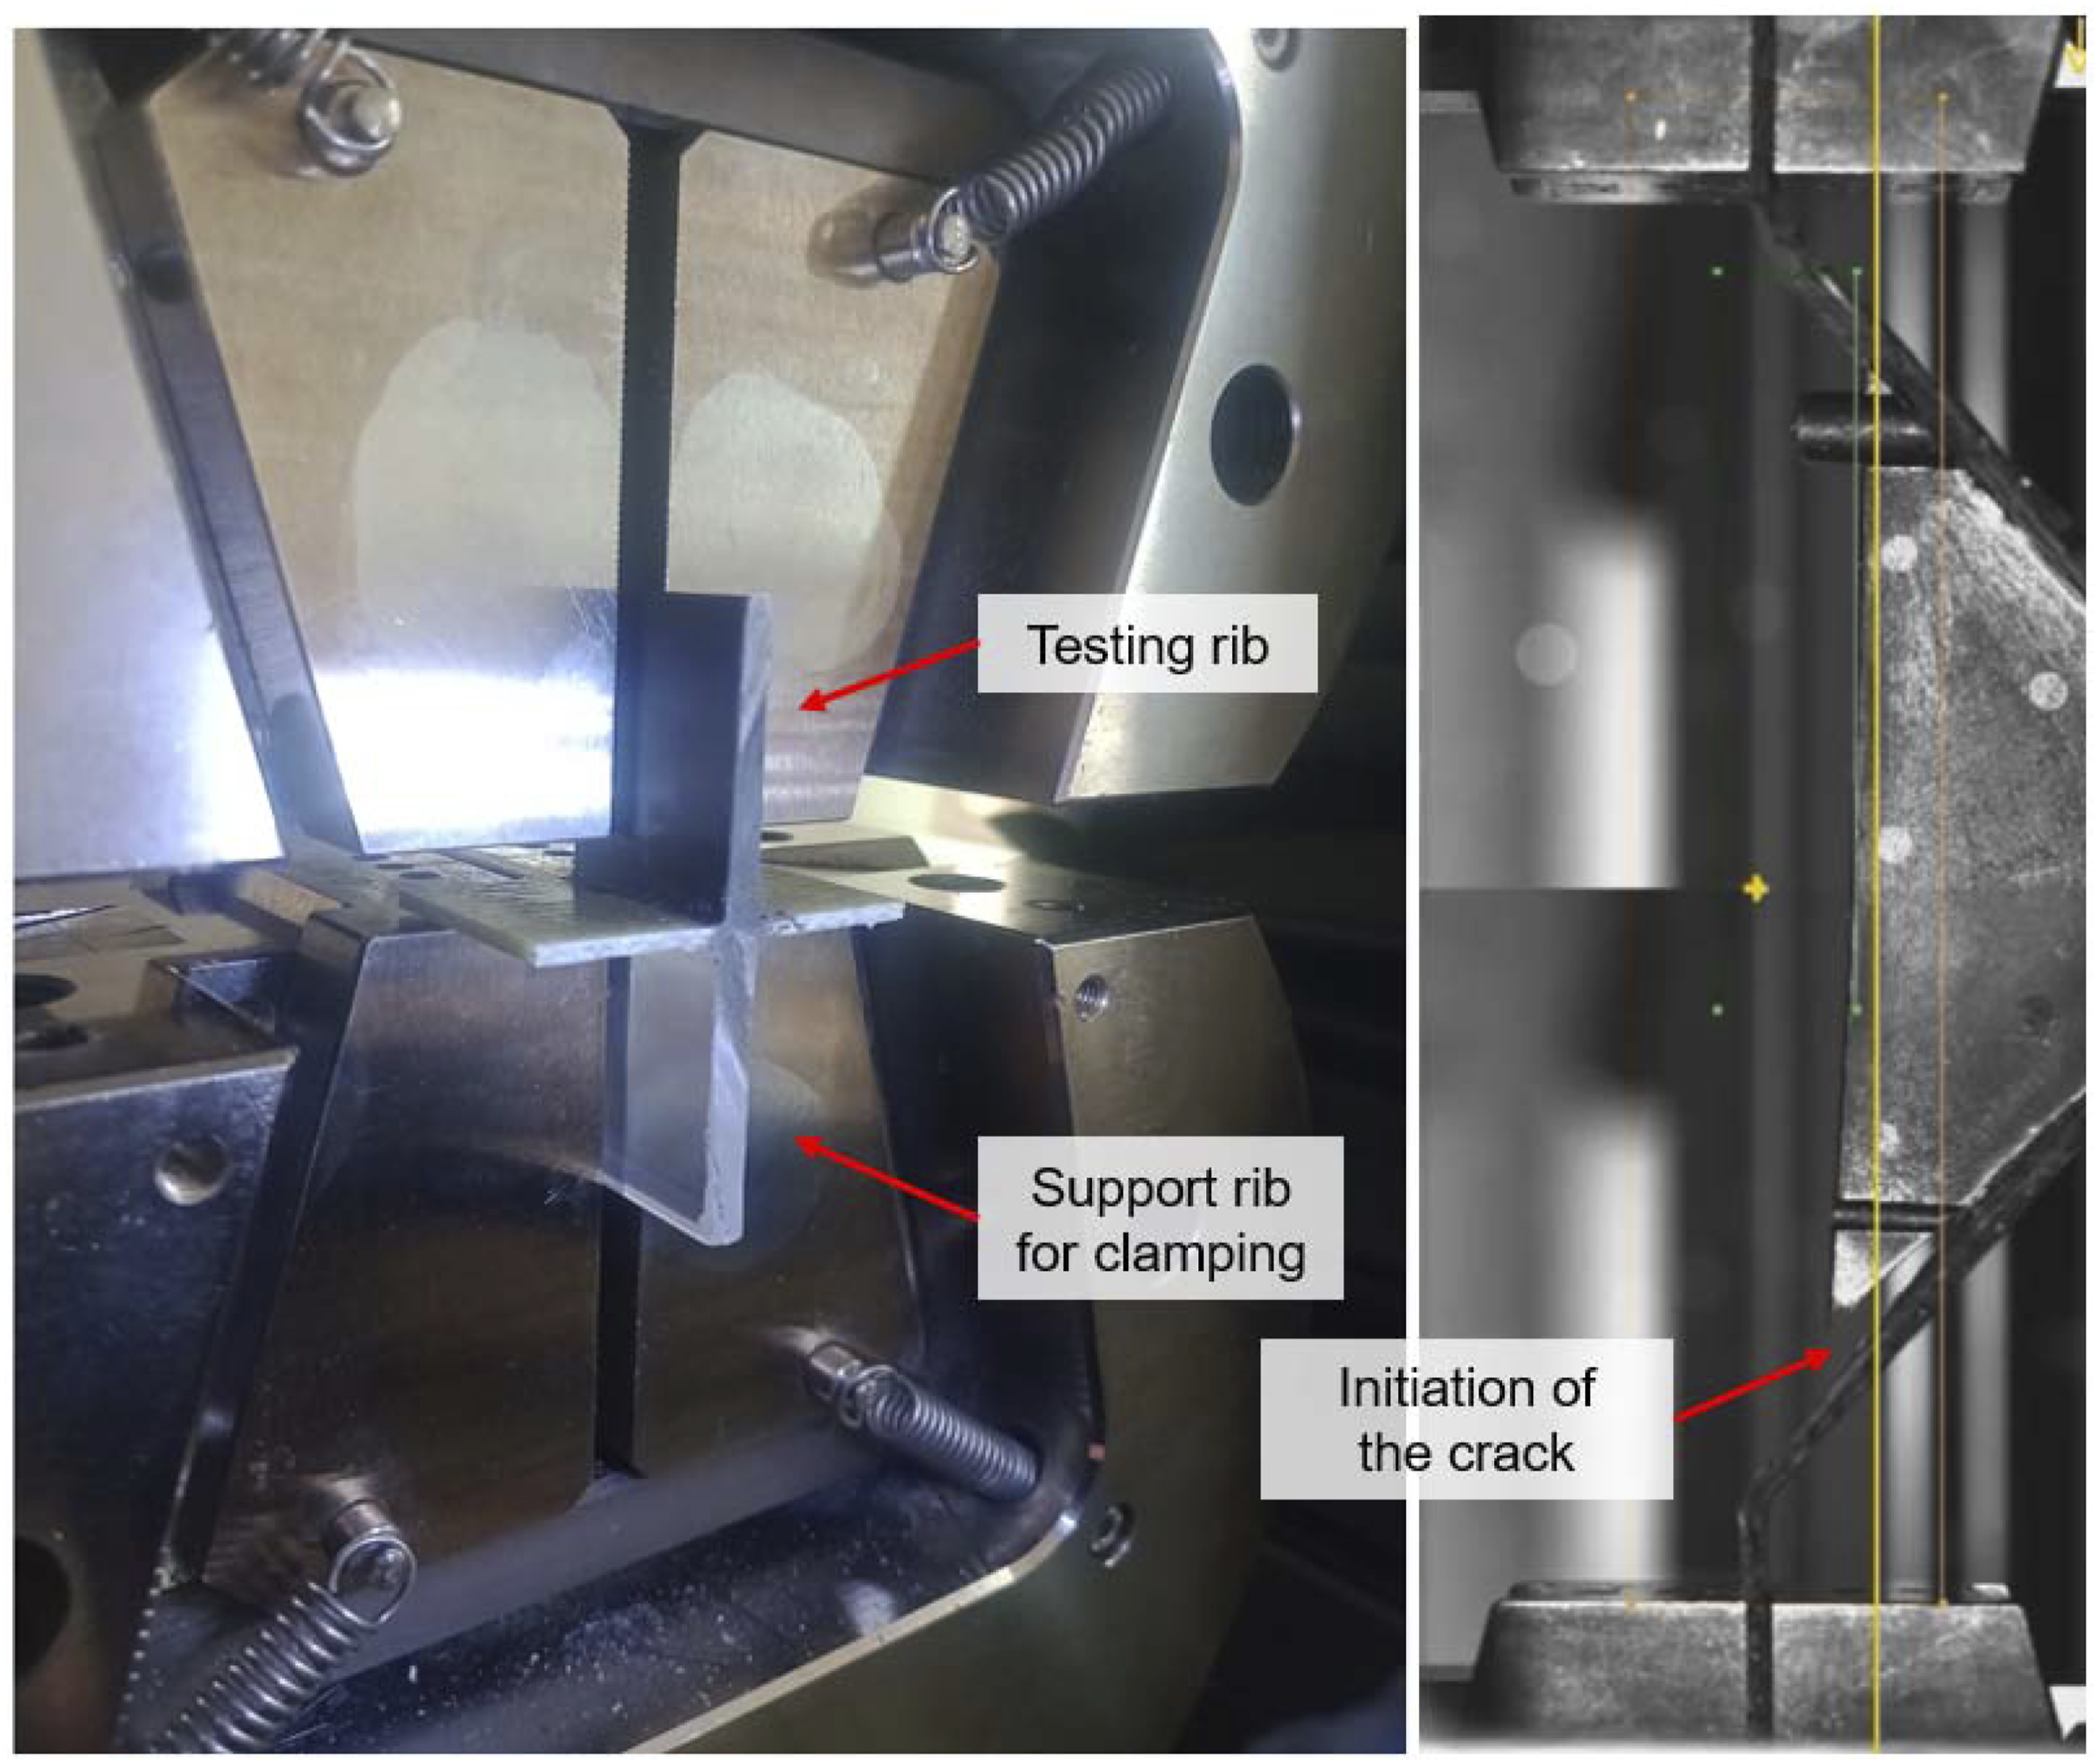
The V-structures conditioned for 24 hours at the same test climate, then clamped vertically at the clamping surfaces, and finally tested at a test speed of 2 mm/min (see Figure 8). Some of the V-structures could be loaded beyond an initial maximum in the standard force.
However, just elongation and standard force at the first force maximum were evaluated, as a crack was already initiated then. The strain was determined with a video extensometer.
Results & discussion
Pre-evaluation of temperature sensor data
Figure 9 exemplarily displays the temperature over time of the sensors for measuring the melt and mould temperature from the preliminary tests with PP-GF. The melt temperature was measured using IR sensors, and the mould temperature was measured using a gradient thermometer consisting of three thermocouples. The steep temperature rise and the peaks clearly show the filling process and the flow of the melt past the individual sensors. The entire filling process takes approx. 0.5 s and maximum temperatures of approx. 290°C are measured. The shearing effect inside the melt during plasticisation heats it above the pre-set mass temperature. Subsequently, it cools down to mould temperature. Temperature-time curves for IR sensors and gradient thermometers; time period: 50 s, Material: PP-GF.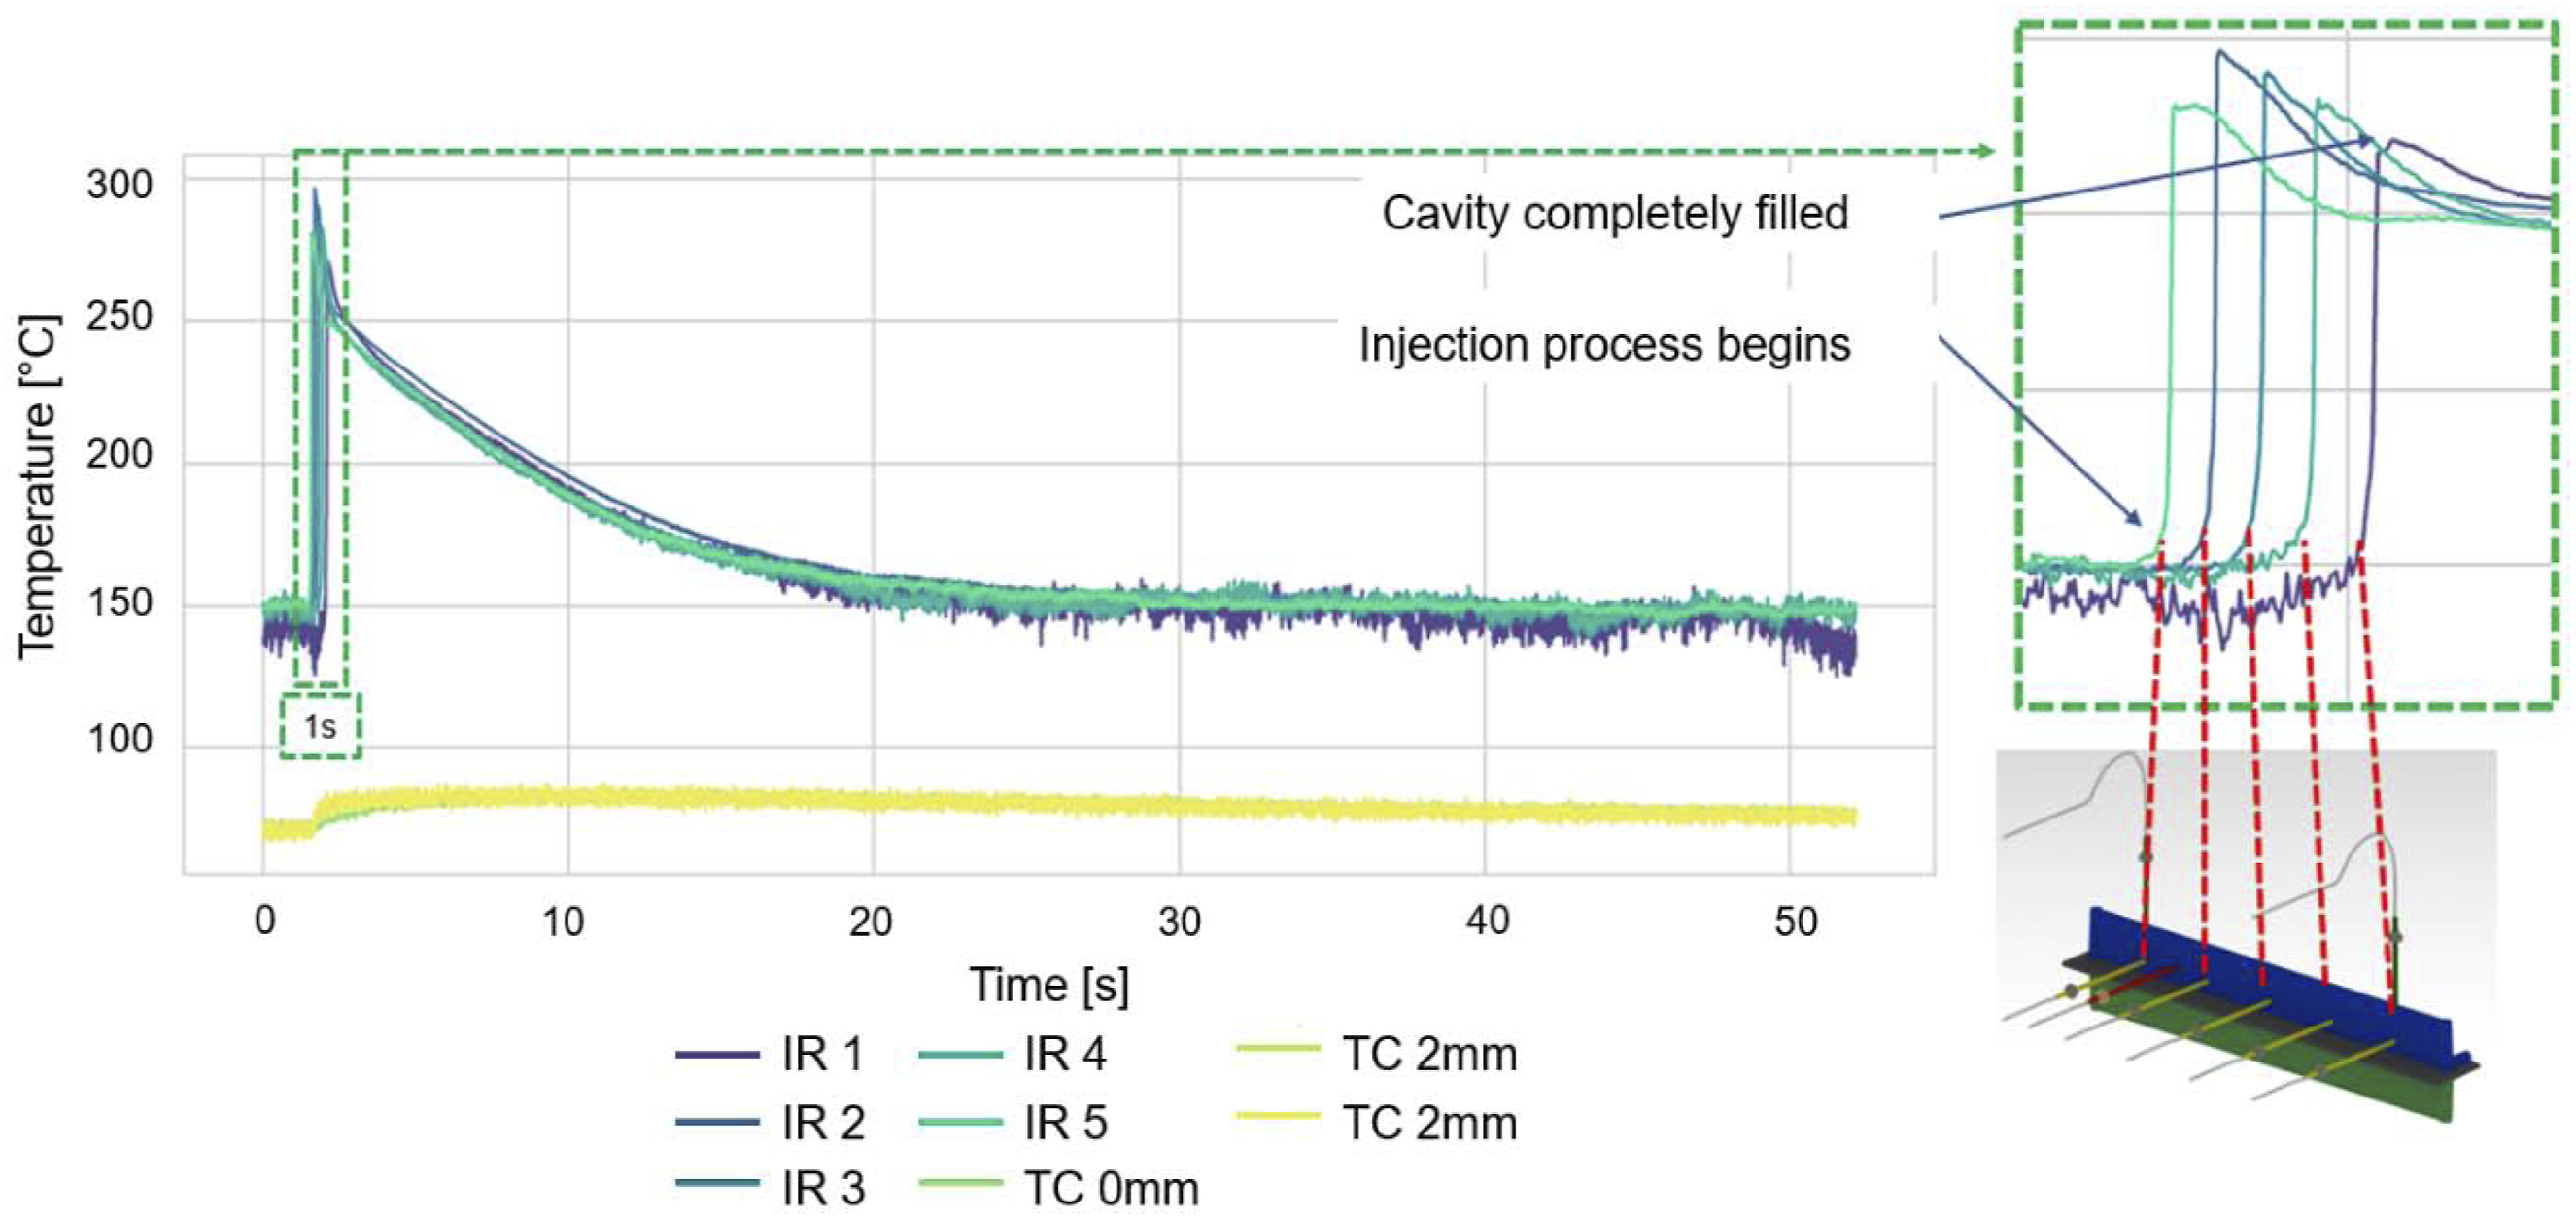
The measurements show that the mould temperature is kept constant. After injection, the mould temperature increases about 10°C, but decreases nearly to the starting temperature by the end of the cooling phase. This is important to ensure that the tool doesn’t heat up form shot to shot so that samples are produced under the same temperature conditions. In addition, the graph shows that the differences in melt temperature between the various sensors are minimal. Therefore, it can be assumed that an even heat distribution is given during the filling process. However, in general heat distribution generally gets less uniform with reduced injection speed. During test series with a low injection speed, a heat map showed that only a few data points between the individual sensors matched, as shown in the left illustration in Figure 10. The sensors are labelled IR 1 to IR 5 in this figure, and comparing the same sensors naturally results in a 100% match. Low and negative values indicate only a few similarities. In the right-hand graphic, we see a series of tests with a high injection speed, where the correlation between the individual sensors is significantly higher. It indicates a more even temperature distribution within the cavity. Correlation matrix for an attempt with low injection speed (left image) and high injection speed (right image).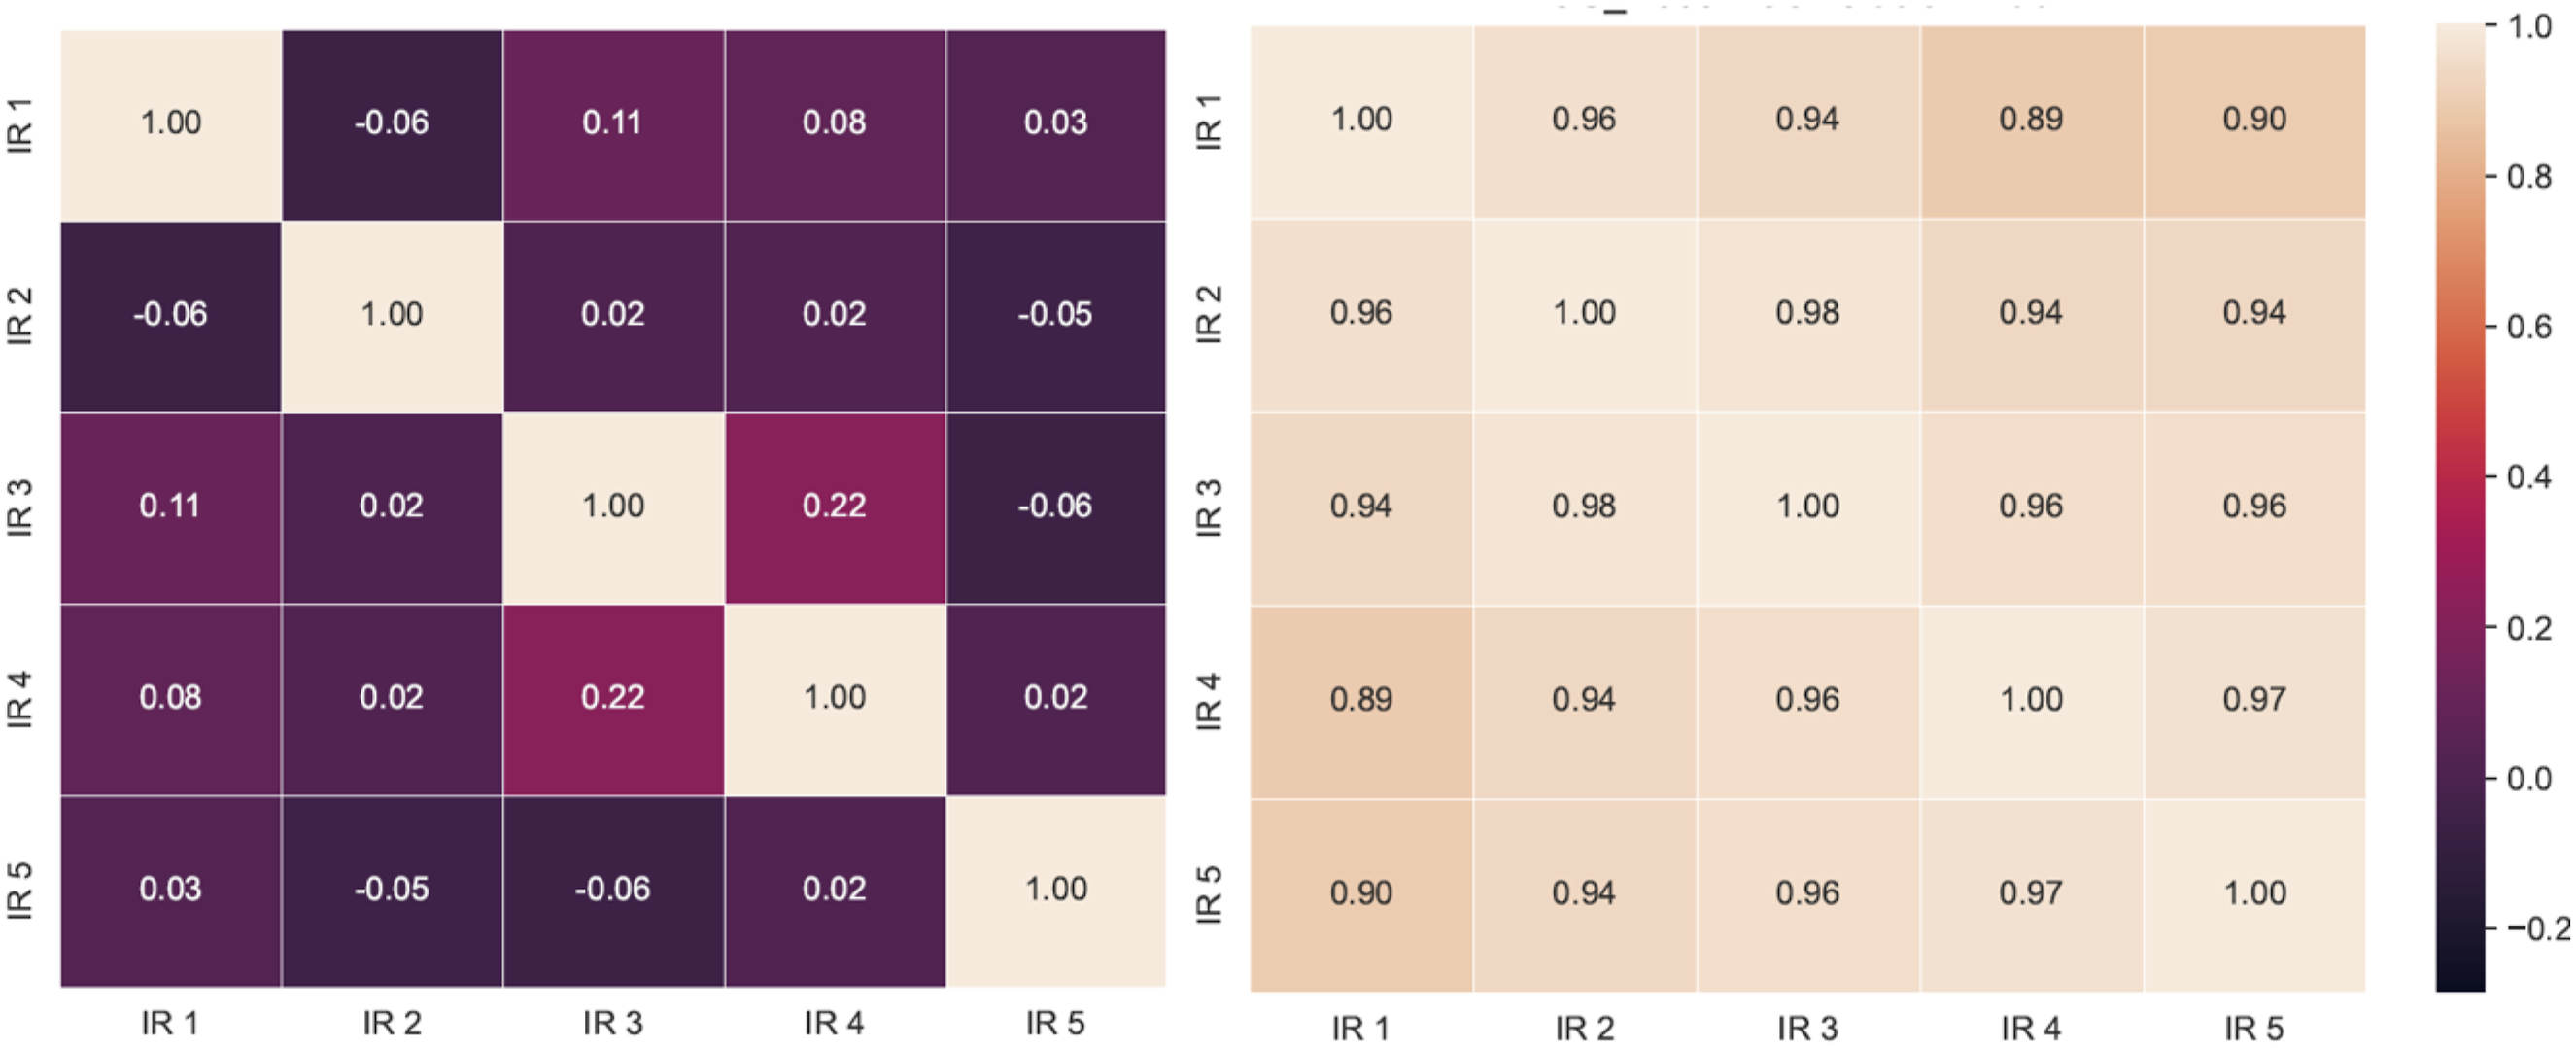
First study: Rib-on-plate with PP-GF
At first the results for the tests described in Table 4 are reported. To illustrate the general influence of the sample position, at first Figure 11 show mean values over all tests. Specifically, the mean values and standard deviations of the breaking force for test specimen positions 1 (close to the sprue) to 5 (far from the sprue) are given. Although it cannot be determined with certainty due to the variance, there is a slight tendency for the average strength to decrease with increasing distance from the sprue. This can be explained by decrease of melt temperature along the way. In addition, the standard deviation increases continuously from the third sample onwards. Yang et al. showed that healing in semi-crystalline thermoplastics can only be achieved above Tm, and Akkerman et al. demonstrated that when overmoulding semi-crystalline thermoplastics, molecular healing of the interface is determined by the local melting and recrystallisation of the crystallites. When overmoulding continuous laminates with short fibre-reinforced thermoplastics, the solidification process is locally non-isothermal and the surface of the laminate cools rapidly during injection.21–23 The decreasing temperatures with increasing distance from the sprue can result in different degrees of healing and thus different bond strengths. Additionally, simulations demonstrate that the pressure at positions closer to the cutting edge (i.e. near the sprue) exerts a longer duration, which correlates with the decreasing strength.
24
The results indicate that the strength at position 2 is stronger compared to position 1. Yan et al. observed a similar behaviour in overmoulding experiments with unfilled PP. They observed a difference between a fibre-like chain orientation (SKL) and columnar crystals (TCL) acting perpendicular to the interface. SKL occurs under high shear stress, and a dominant SKL weakens the bond at the interface. They observed that SKL dominates near the gate due to high shear stress, reducing the bond strength. This could also explain the lower bond values at position 1 in this case.
25
Results of the first tensile tests along the rib (1 close to the sprue, 5 far from the sprue) with PP-GF for initial parameter determination.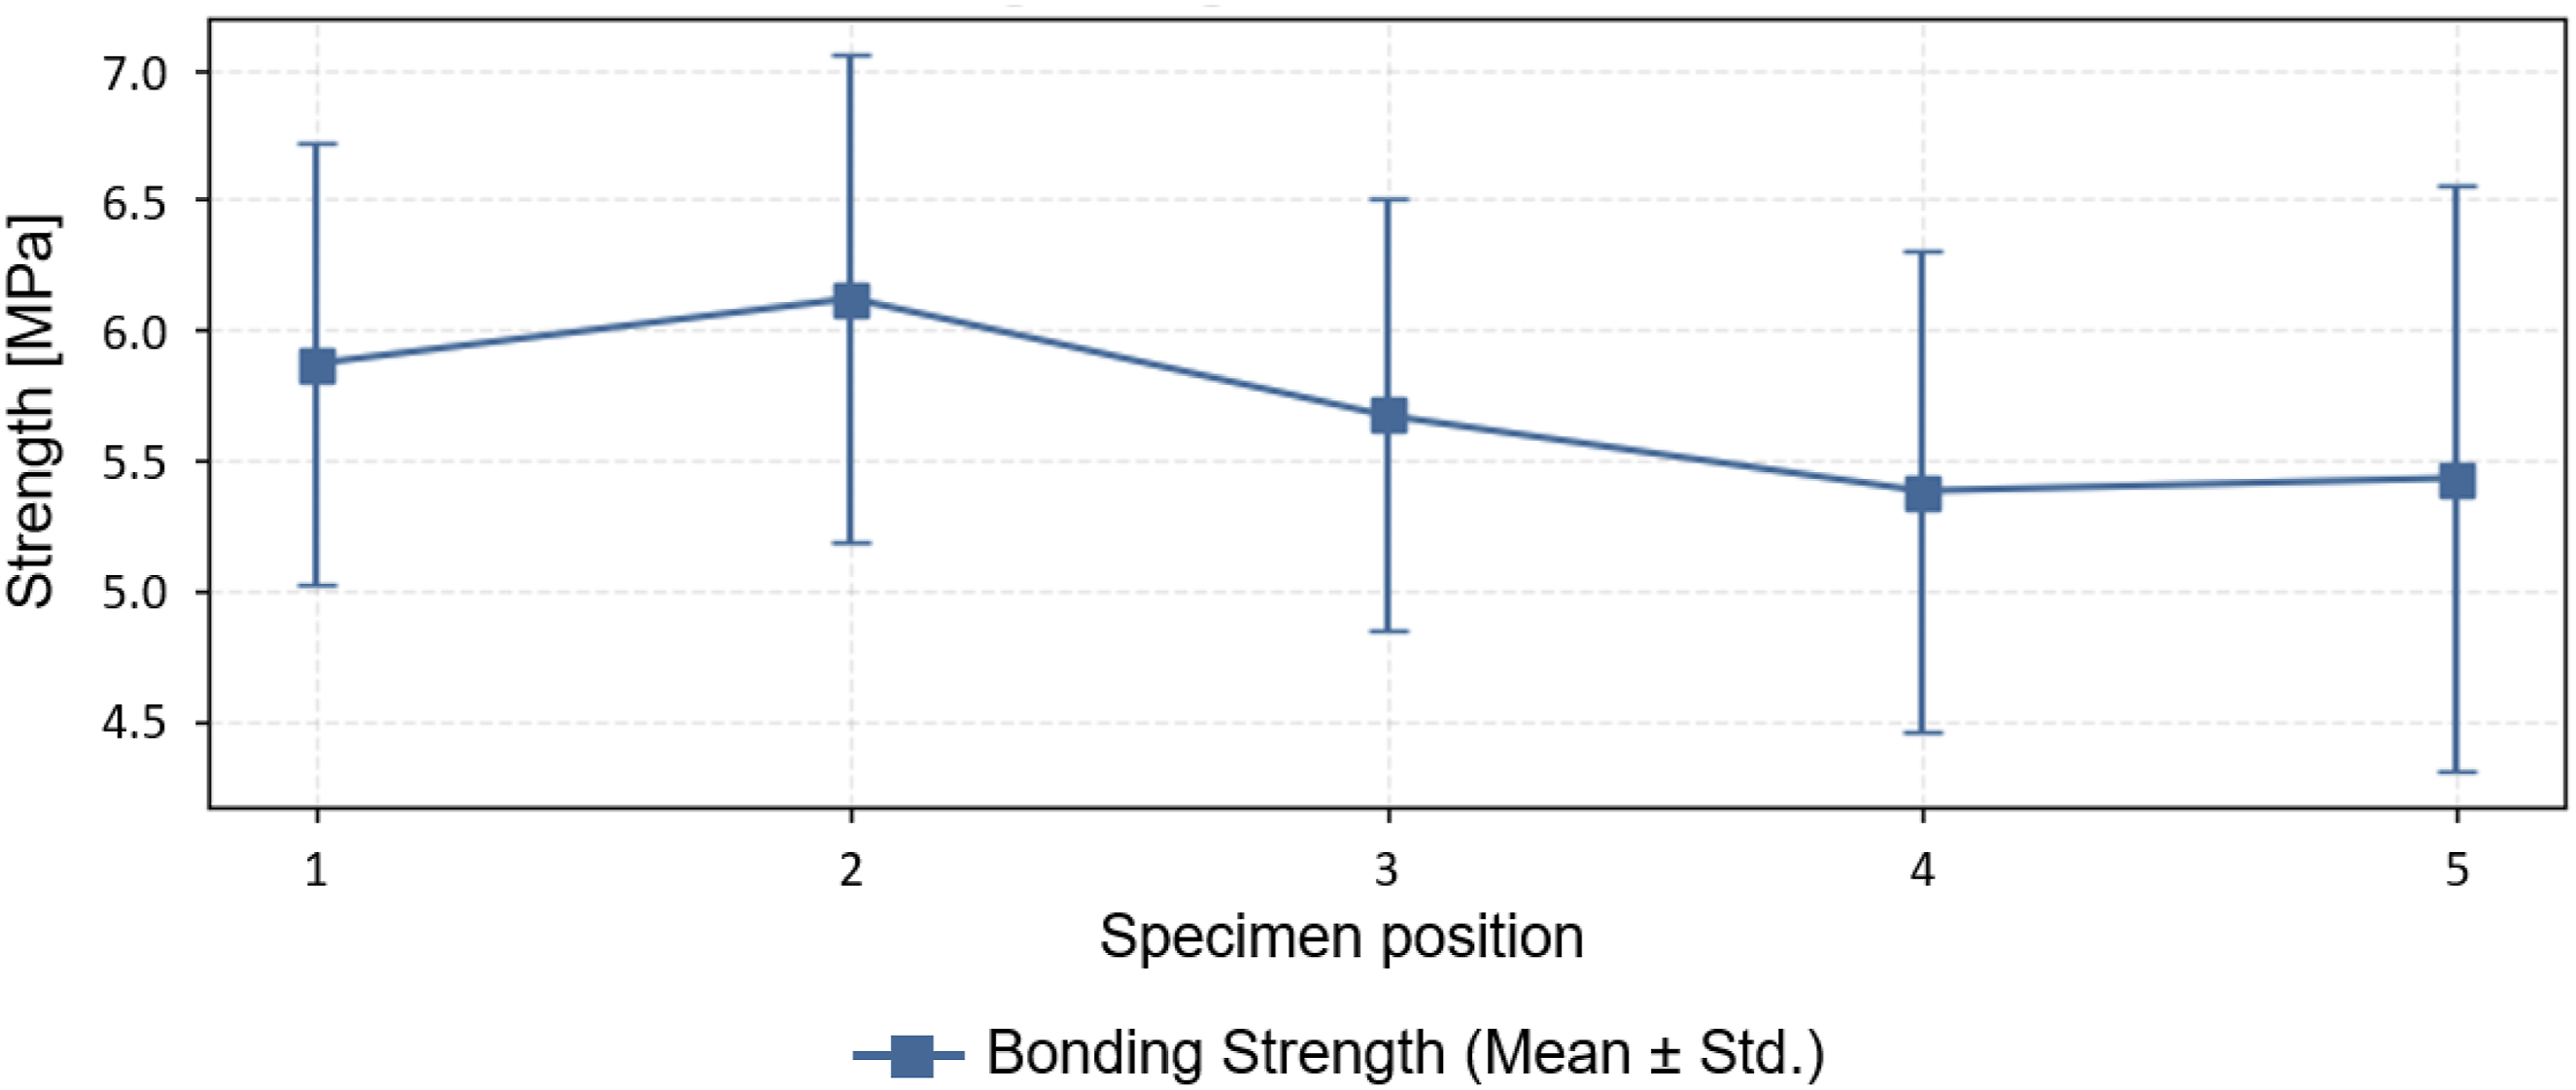
Looking at the absolute bonding strength, compared to literature data, values between 5 and 6 MPa are comparatively low. Giusti & Lucchetta achieved experimental strengths between 14 and 23 MPa with their test specimens. The reason for this could be the higher melting temperature (260°C instead of 240°C), even though the holding pressure is lower (200 bar instead of 300 bar). In addition, an unfilled PP was selected for overmoulding and a different test specimen geometry (T-joint) was used. 26 Microstructural simulations showed that fibres in the substrate alter heat conduction locally, thereby causing uneven melting. In addition, fibres at the interface inhibit local molecular diffusion when they are located directly on the surface. This in turn leads to a reduced degree of healing in these zones. 27 This may be another reason for the low bond strength and the variation in results. Given this, the melt temperature for the PP-GF material is increased to up to 300°C for the following studies, which also allows higher bond strengths to be achieved.
In the following, further influences on the bonding strength are evaluated. For this, the results of the experiments conducted according to the statistical test plan were evaluated using ANOVA with a significance level of alpha = 0.05, and the F-values determined were subsequently compared with each other. For better overview, the results are presented in Pareto charts. In addition, main effect diagrams were created with the corner points of the statistical test plan and the central point to illustrate the impact of the independent variables on the dependent variable. Several factors have a significant effect on the bond strength between the laminate and the injection moulding compound as displayed in Figure 12. The oven temperature for preheating the laminates has the most significant effect, followed by the melt temperature, the injection speed, the interaction between the melt temperature and the oven temperature, and the tool temperature. The only independent variable that has no significant influence is the holding pressure. For the sake of clarity, triple interactions were omitted from the evaluation. Double interaction occurs when the effect of an independent variable on the dependent variable depends on the value of a second independent variable. The fact that the oven temperature, which reflects the surface temperature of the laminate, has the greatest effect on the bonding quality is confirmed by the findings of Akkerman et al.
22
Intimate contact, which describes the area where both surfaces effectively make contact, is not a limiting factor, as the process is so rapid due to high injection pressures and after-pressures that intimate contact is achieved almost immediately. The degree of healing, which describes the extent of polymer chain diffusion, is the main determining factor for bonding strength. According to the simulation model by Akkerman et al., healing increases with increasing surface temperature of the laminate. Experiments have also confirmed the simulation results.
22
Zhao et al. were also able to show that the increased melting temperature of the injection material improves diffusion at the interface, which can be demonstrated in this case as well. Diffusion coefficients and binding energies increase with temperature.
28
Pareto-Chart of the ANOVA for the factors and interactions affecting the bond strength for initials experiments with PP-GF.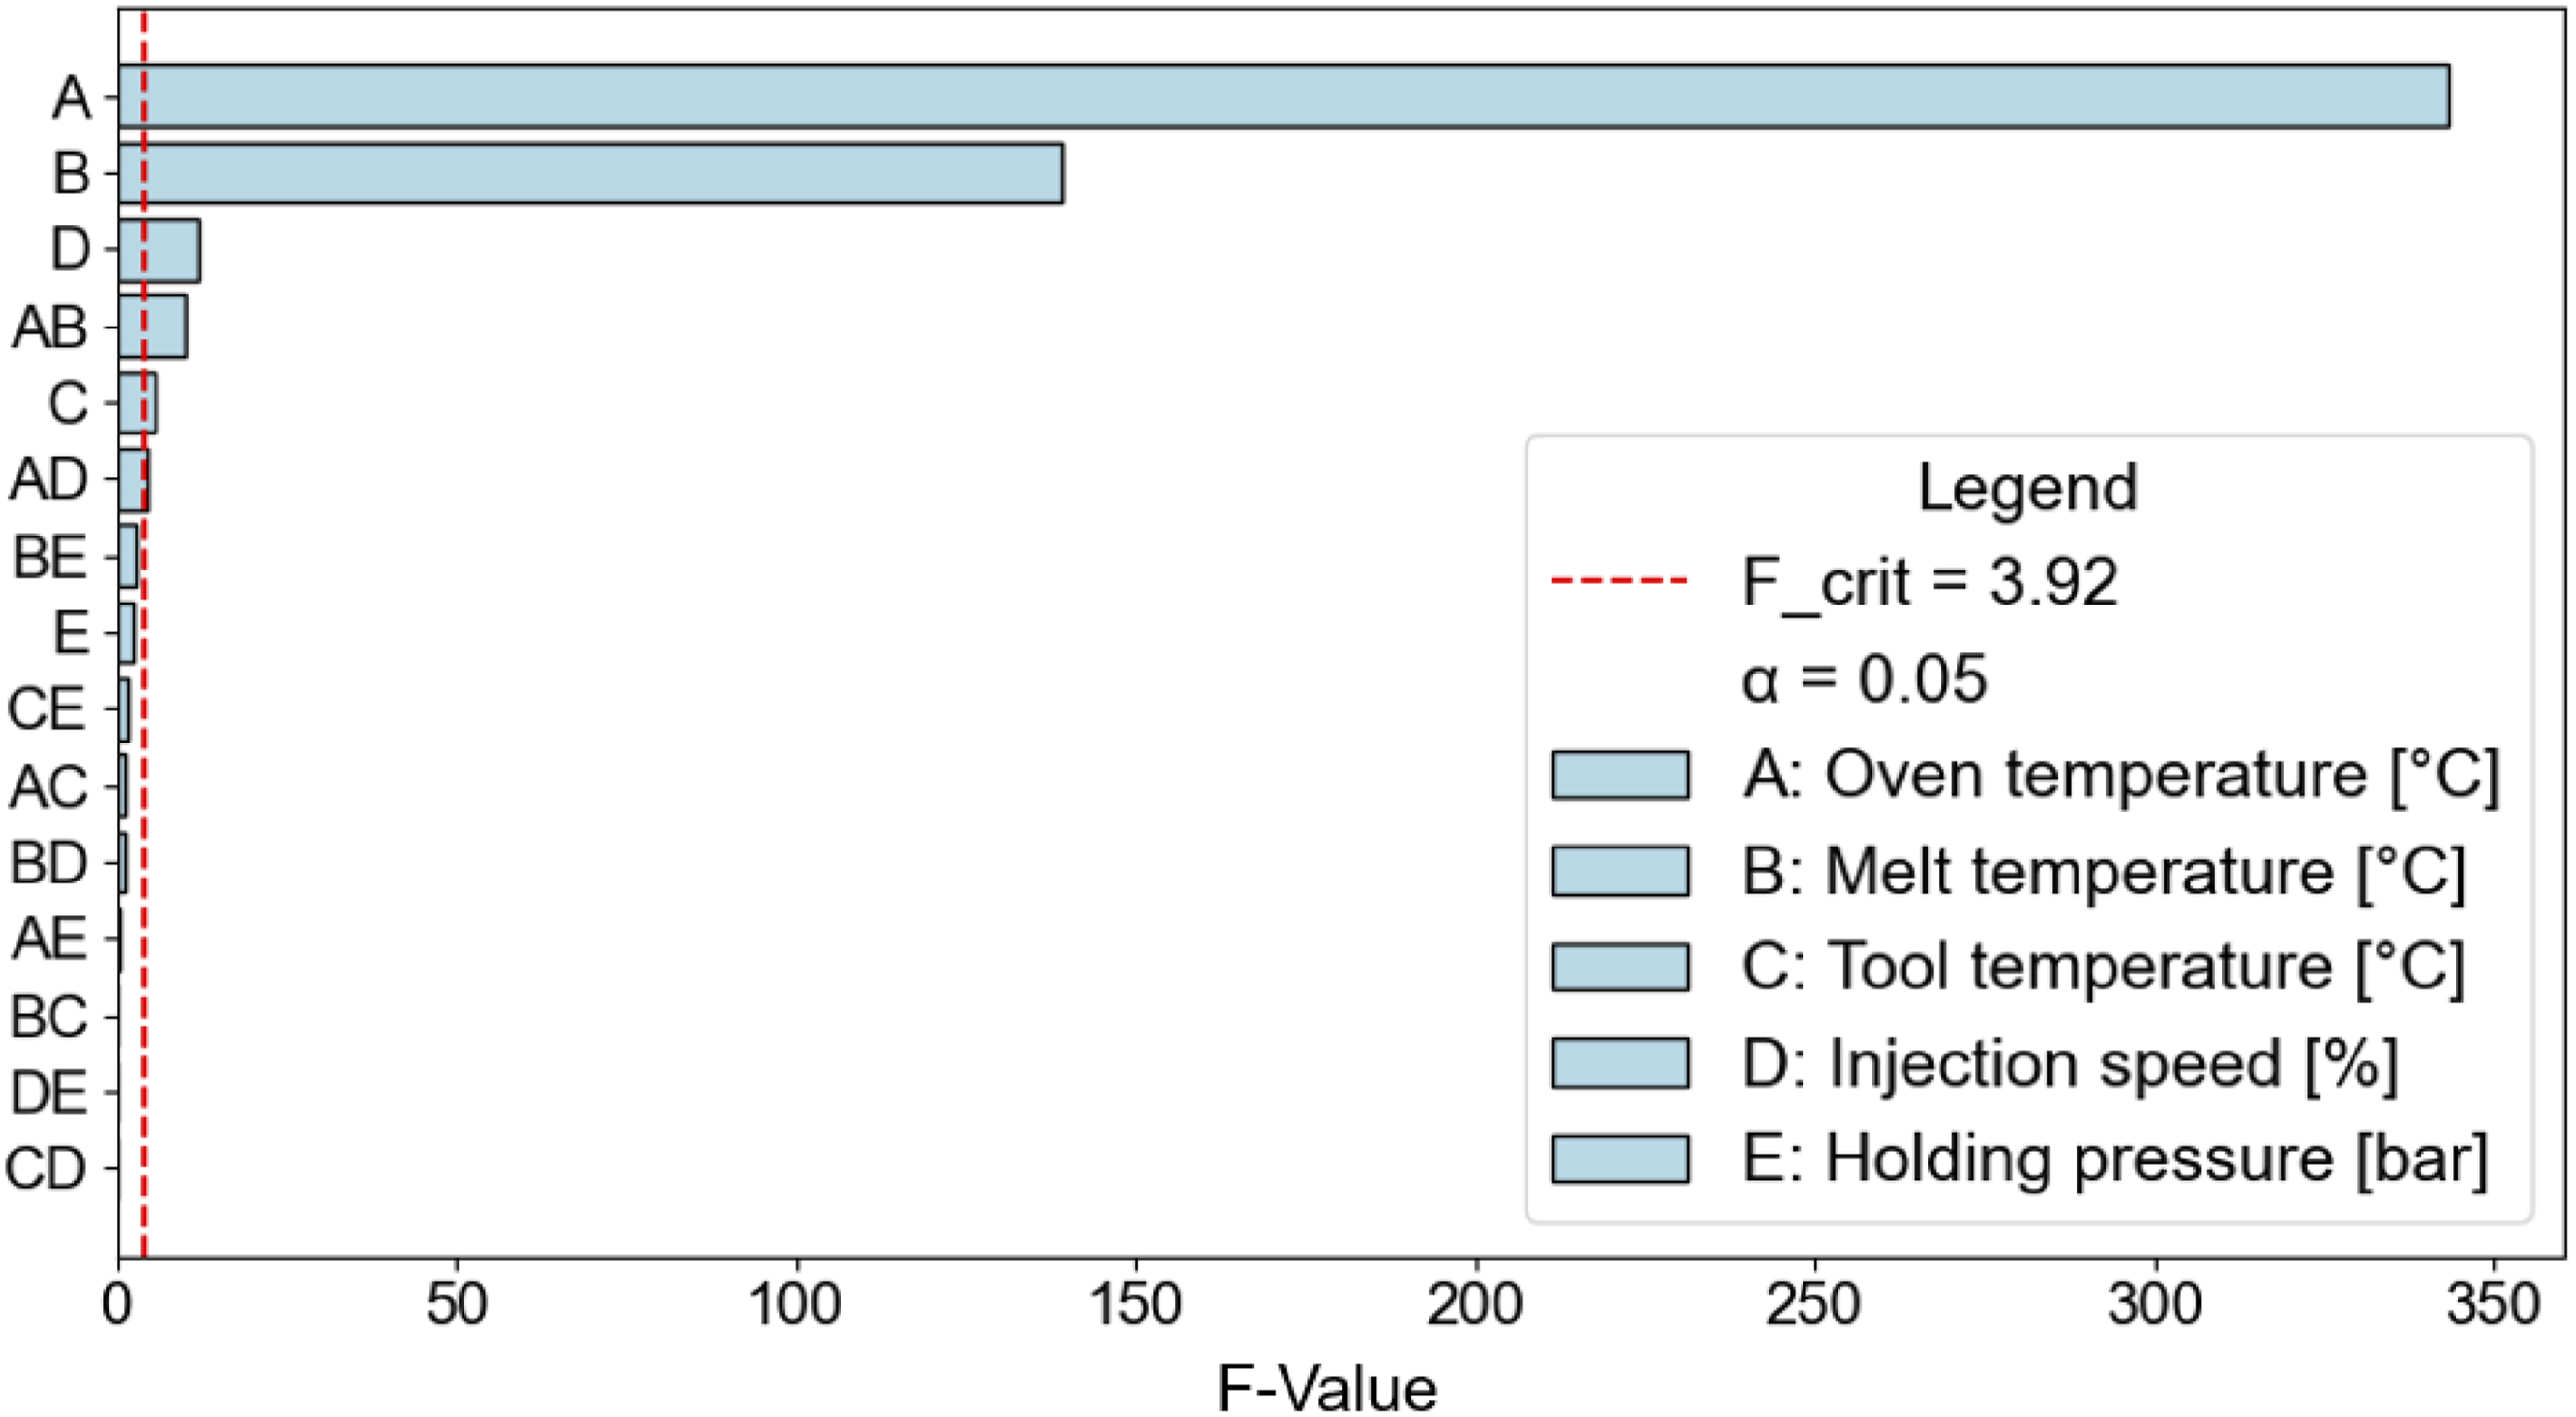
The diagram of the main effects (see Figure 13) illustrates the effect of the individual independent variables on the bonding strength. While an increase in melt temperature and oven temperature results in a significant increase in bond strength, this effect is comparatively small for the other independent variables, although injection speed and tool temperature still show a considerable effect on the quality of the bond according to ANOVA analysis. Zhao et al. also demonstrated that the mould temperature has a significant influence. They found that increasing the mould temperature led to improved shear strength in the samples.
28
The global mean (dotted line) is the arithmetic mean of all measured values across all test conditions. The centre point (red dots) is the measured value or mean value of the tests performed in the centre of the test area. This is specified in order to detect non-linearity in the system and to check the dispersion. The fact that the centre point is below the global mean indicates that the relationship between the factor and the target variable is non-linear.
29
Physically, this indicates that optimal interface adhesion was not achieved at medium parameters. Extreme conditions within the specified parameter range (especially high surface temperature of the organo sheet and melting temperature) result in better adhesion. Main effect diagram for the target parameter bond strength of the PP-GF rib test specimen in the first parametric study.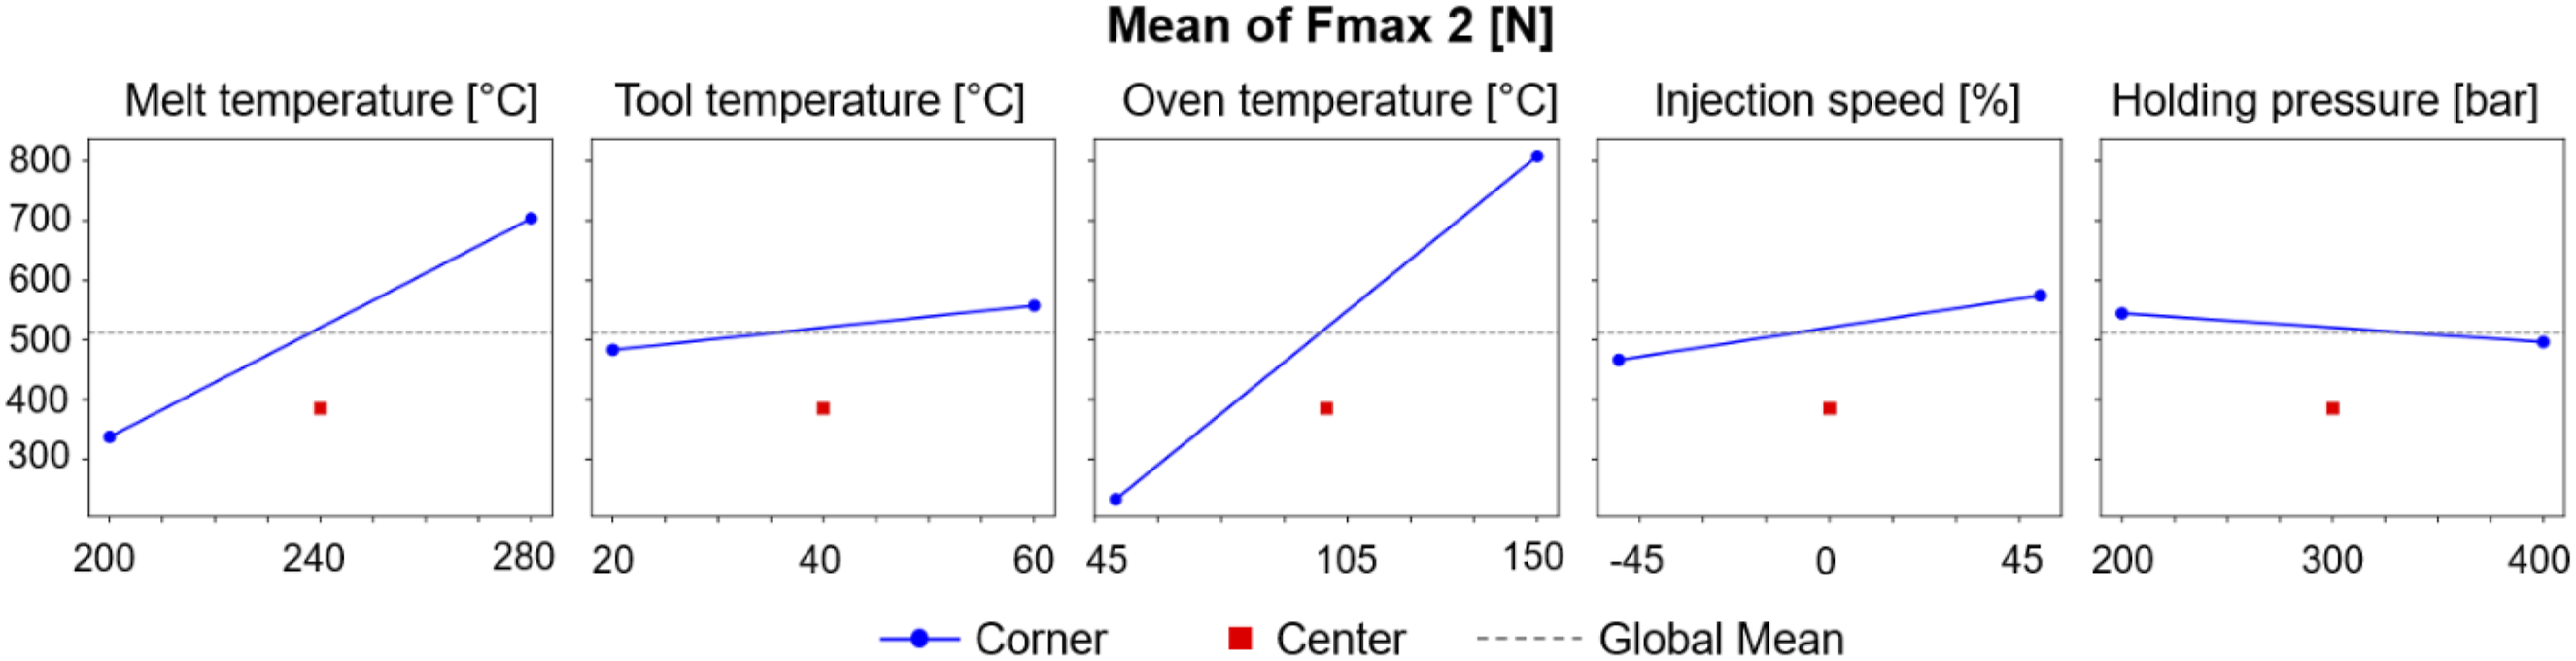
Figure 14 shows to exemplary force-displacement diagrams for sets of “good” (top) and “poor” (bottom) parameters. The diagrams illustrate the effect of the test specimen position and thus the distance to the sprue. For a component manufactured with good parameters, the bond strengths and curves are similar at all positions. If a poor set of parameters is used, the position has a strong impact on the bond strength. This decreases steadily from the position close to the sprue to the position far from the sprue (order of positions 1–5: orange, cyan, brown, green, purple). Comparison of the force-displacement curves for the bond strength tested in the tensile test for a component with good parameters (top) and poor parameters (bottom).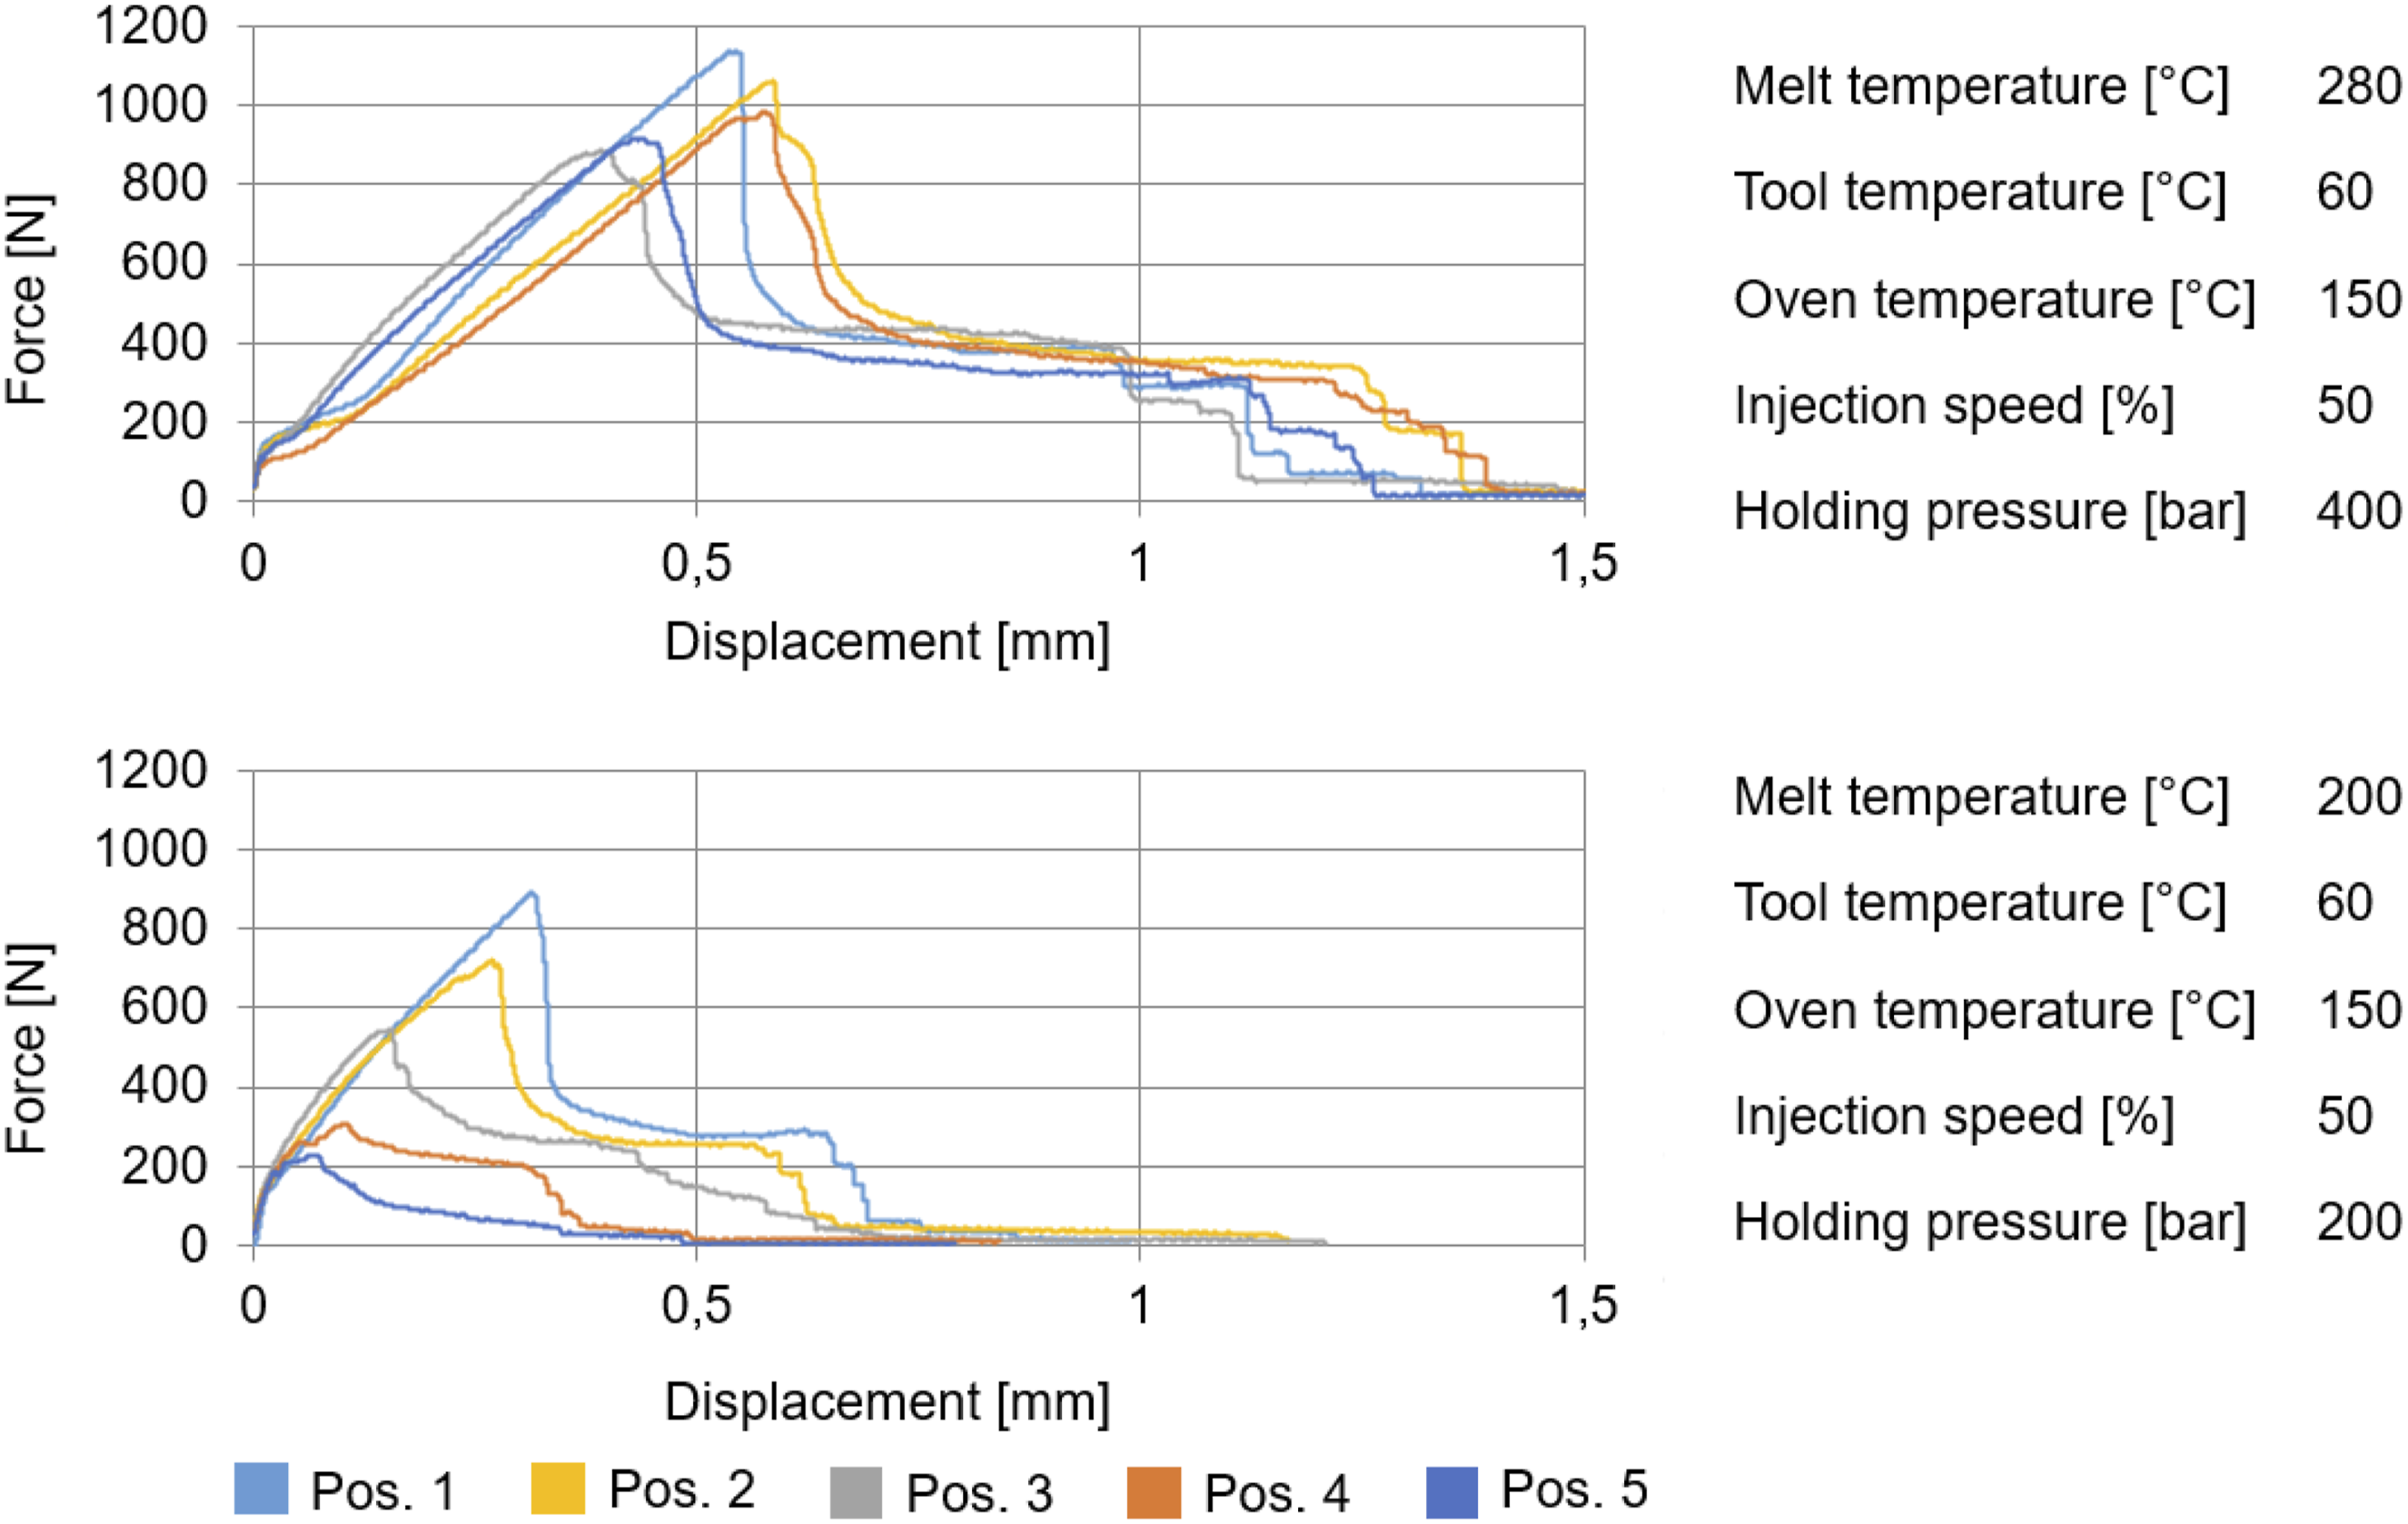
As it became obvious, that the best results were achieved with the highest values within the tested range, esp. The surface temperature of the organo sheet and melt temperature. The melt temperature defined in the test plan in Table 4 corresponds to the temperature in the machine cylinder and can obviously differ from the process-relevant melt temperature in the mould. The same applies to the temperature of the organo sheets; here, the temperature at which the organo sheet is transferred to the tool is specified. To further investigate these double interactions with melt temperature in the cavity were investigated. Unsurprisingly, the results show that the melt temperature in the cavity primarily on the selected melt temperature in the machine cylinder, as illustrated by the main effect diagrams in Figure 15. Within this first study the highest difference between the melt temperature in the cylinder and the cavity was 44.72°C, seconding the value of in situ monitoring technologies. The fact that the temperature of the melt in the cavity is higher than the preset temperature in the cylinder is due to the additional heat input caused by shear action and the high injection pressures. The temperature differences were higher at measuring position 1 than at the last measuring position, which indicates a temperature gradient. The maximum temperature variation measured at sensor position 5 was 35.32°C. In addition, the mould temperature is also a small, but statistically significant influence, even if contact times are fairly short. Main effect diagram for the target parameter melt temperature inside the mould of the PP-GF rib test specimen in the first parametric study.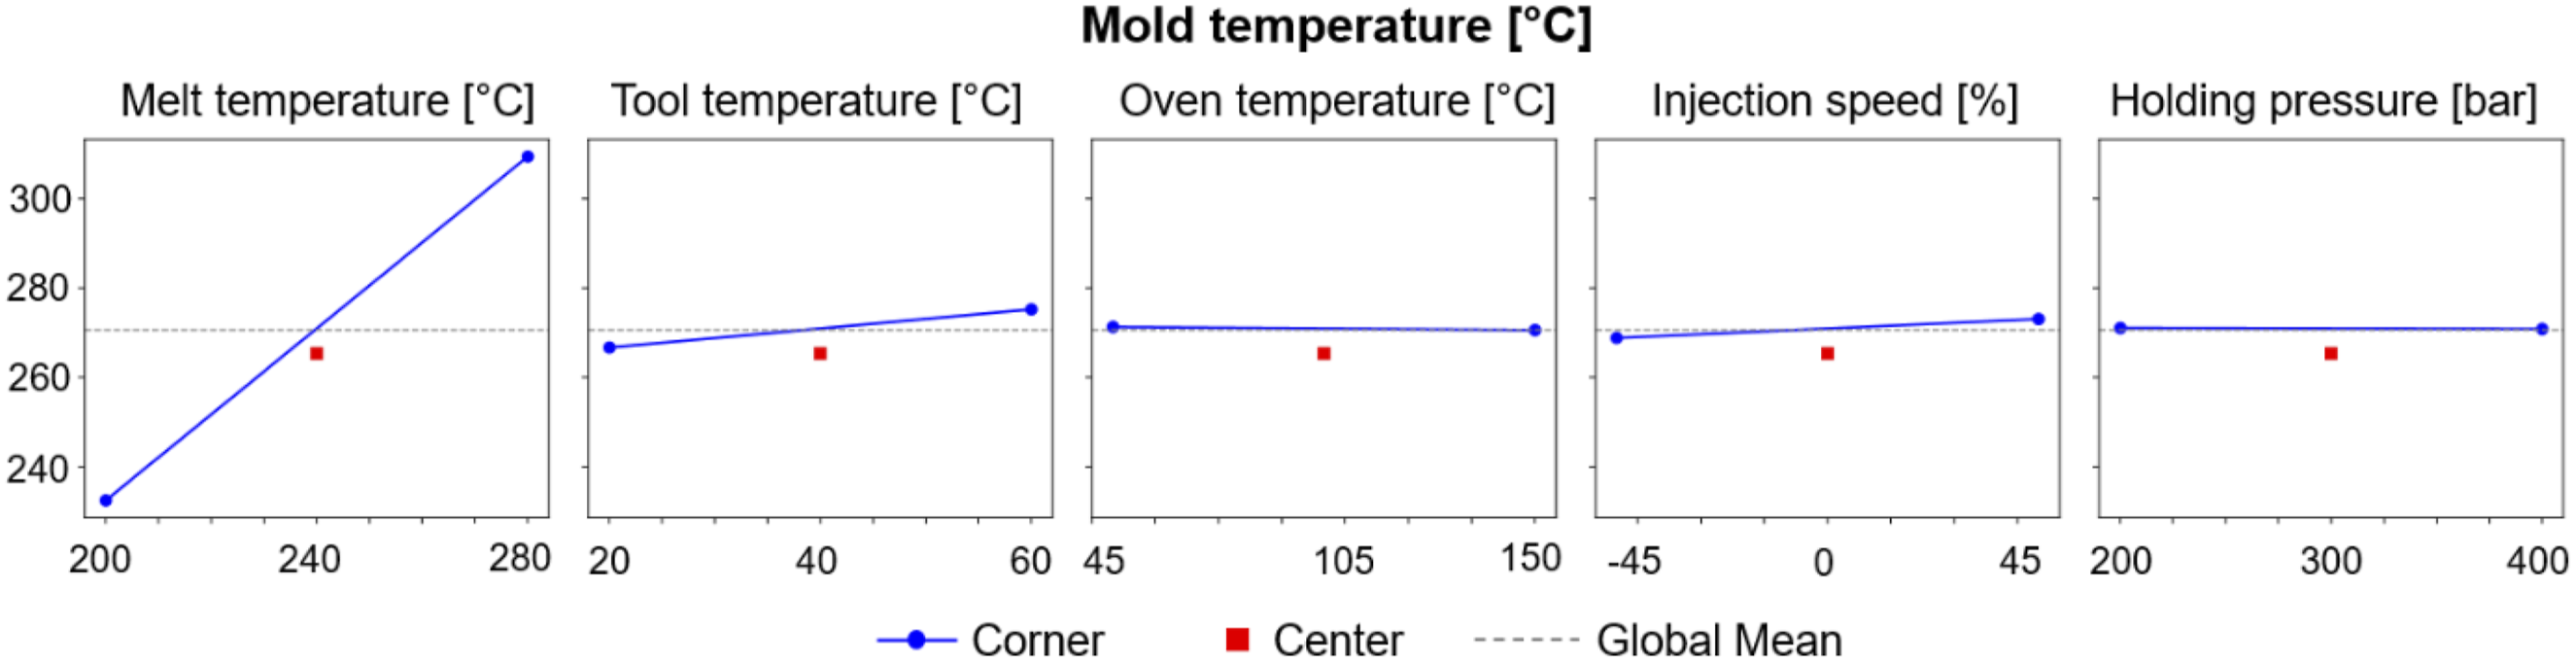
A further double interaction analysis concerned the flow velocity of the polymer melt within the cavity (Figure 16). How fast the melt spreads inside the cavity significantly affects the bonding quality, as it promotes an even degree of healing and can also reduce internal stresses. It is most significantly affected by the injection speed and the melt temperature. The injection speed is adjusted directly on the injection moulding machine and the flow velocity is calculated from the time difference between the sensors. The velocity at which the melt spreads within the cavity is important for even heat distribution and thus also for reproducible bonding quality across the entire organo sheet. Although the mould temperature is also significantly influential, its effect is comparatively minor compared. Main effect diagram for the target parameter flow velocity of the PP-GF rib test specimen in the first parametric study.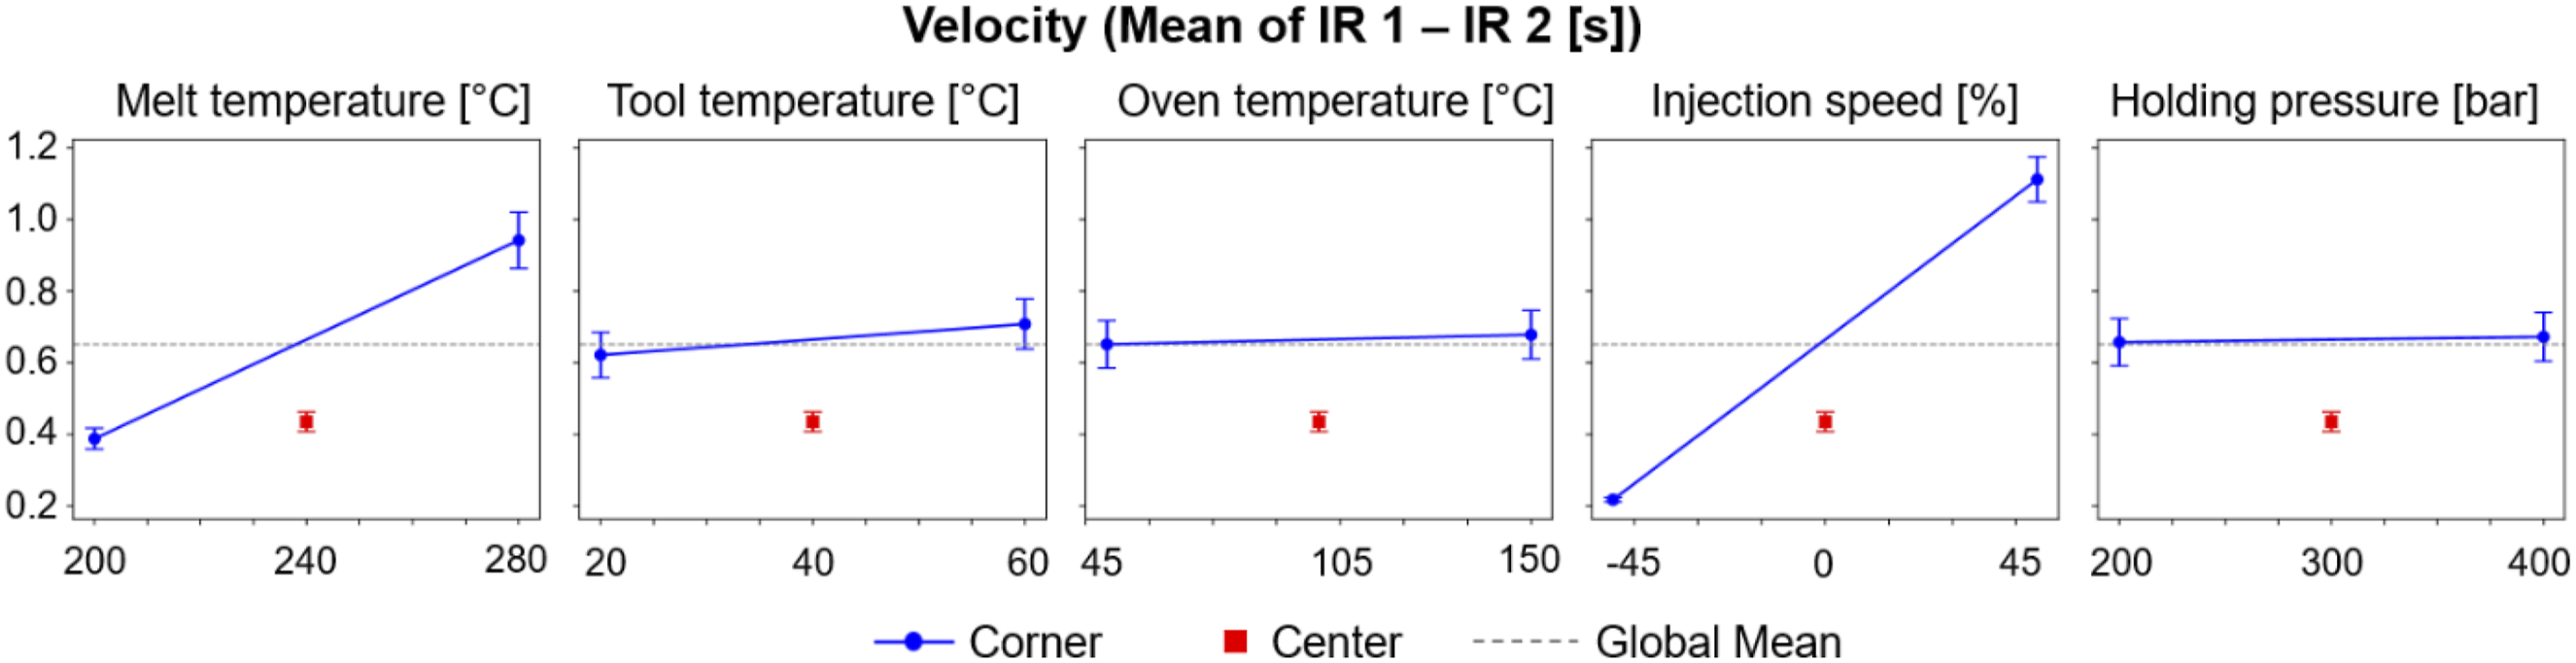
All in all, using the best performing parameter set of this test batch, an overall bond strength of 6.65 MPa was achieved at the first position in the rib, with a standard deviation of 0.99 MPa. Compared to literature values, this is still fairly low. As the best values were achieved with the highest melt temperature it is obvious that a further increase could potentially improve the results. Therefore, the parameter study was extended by the tests described in Table 5, focusing on melt temperature, mould temperature and newly including preheating of the laminate. As can be seen in Figure 17, the ANOVA shows that the irradiation time (A) and its interactions with the melt temperature (B) and tool temperature (C) are the only factors that have a significant impact on the measured interfacial strength. The melt temperature (B) does not have a direct main effect, only in combination with thermal activation (AC, ABC). This indicates that the decisive mechanisms for bonding quality are only effective when both the surface temperature (through irradiation) and the temperature of the melt are sufficiently high. Pareto-Chart of the ANOVA for the factors and interactions affecting the bond strength for PP-GF rib test specimen.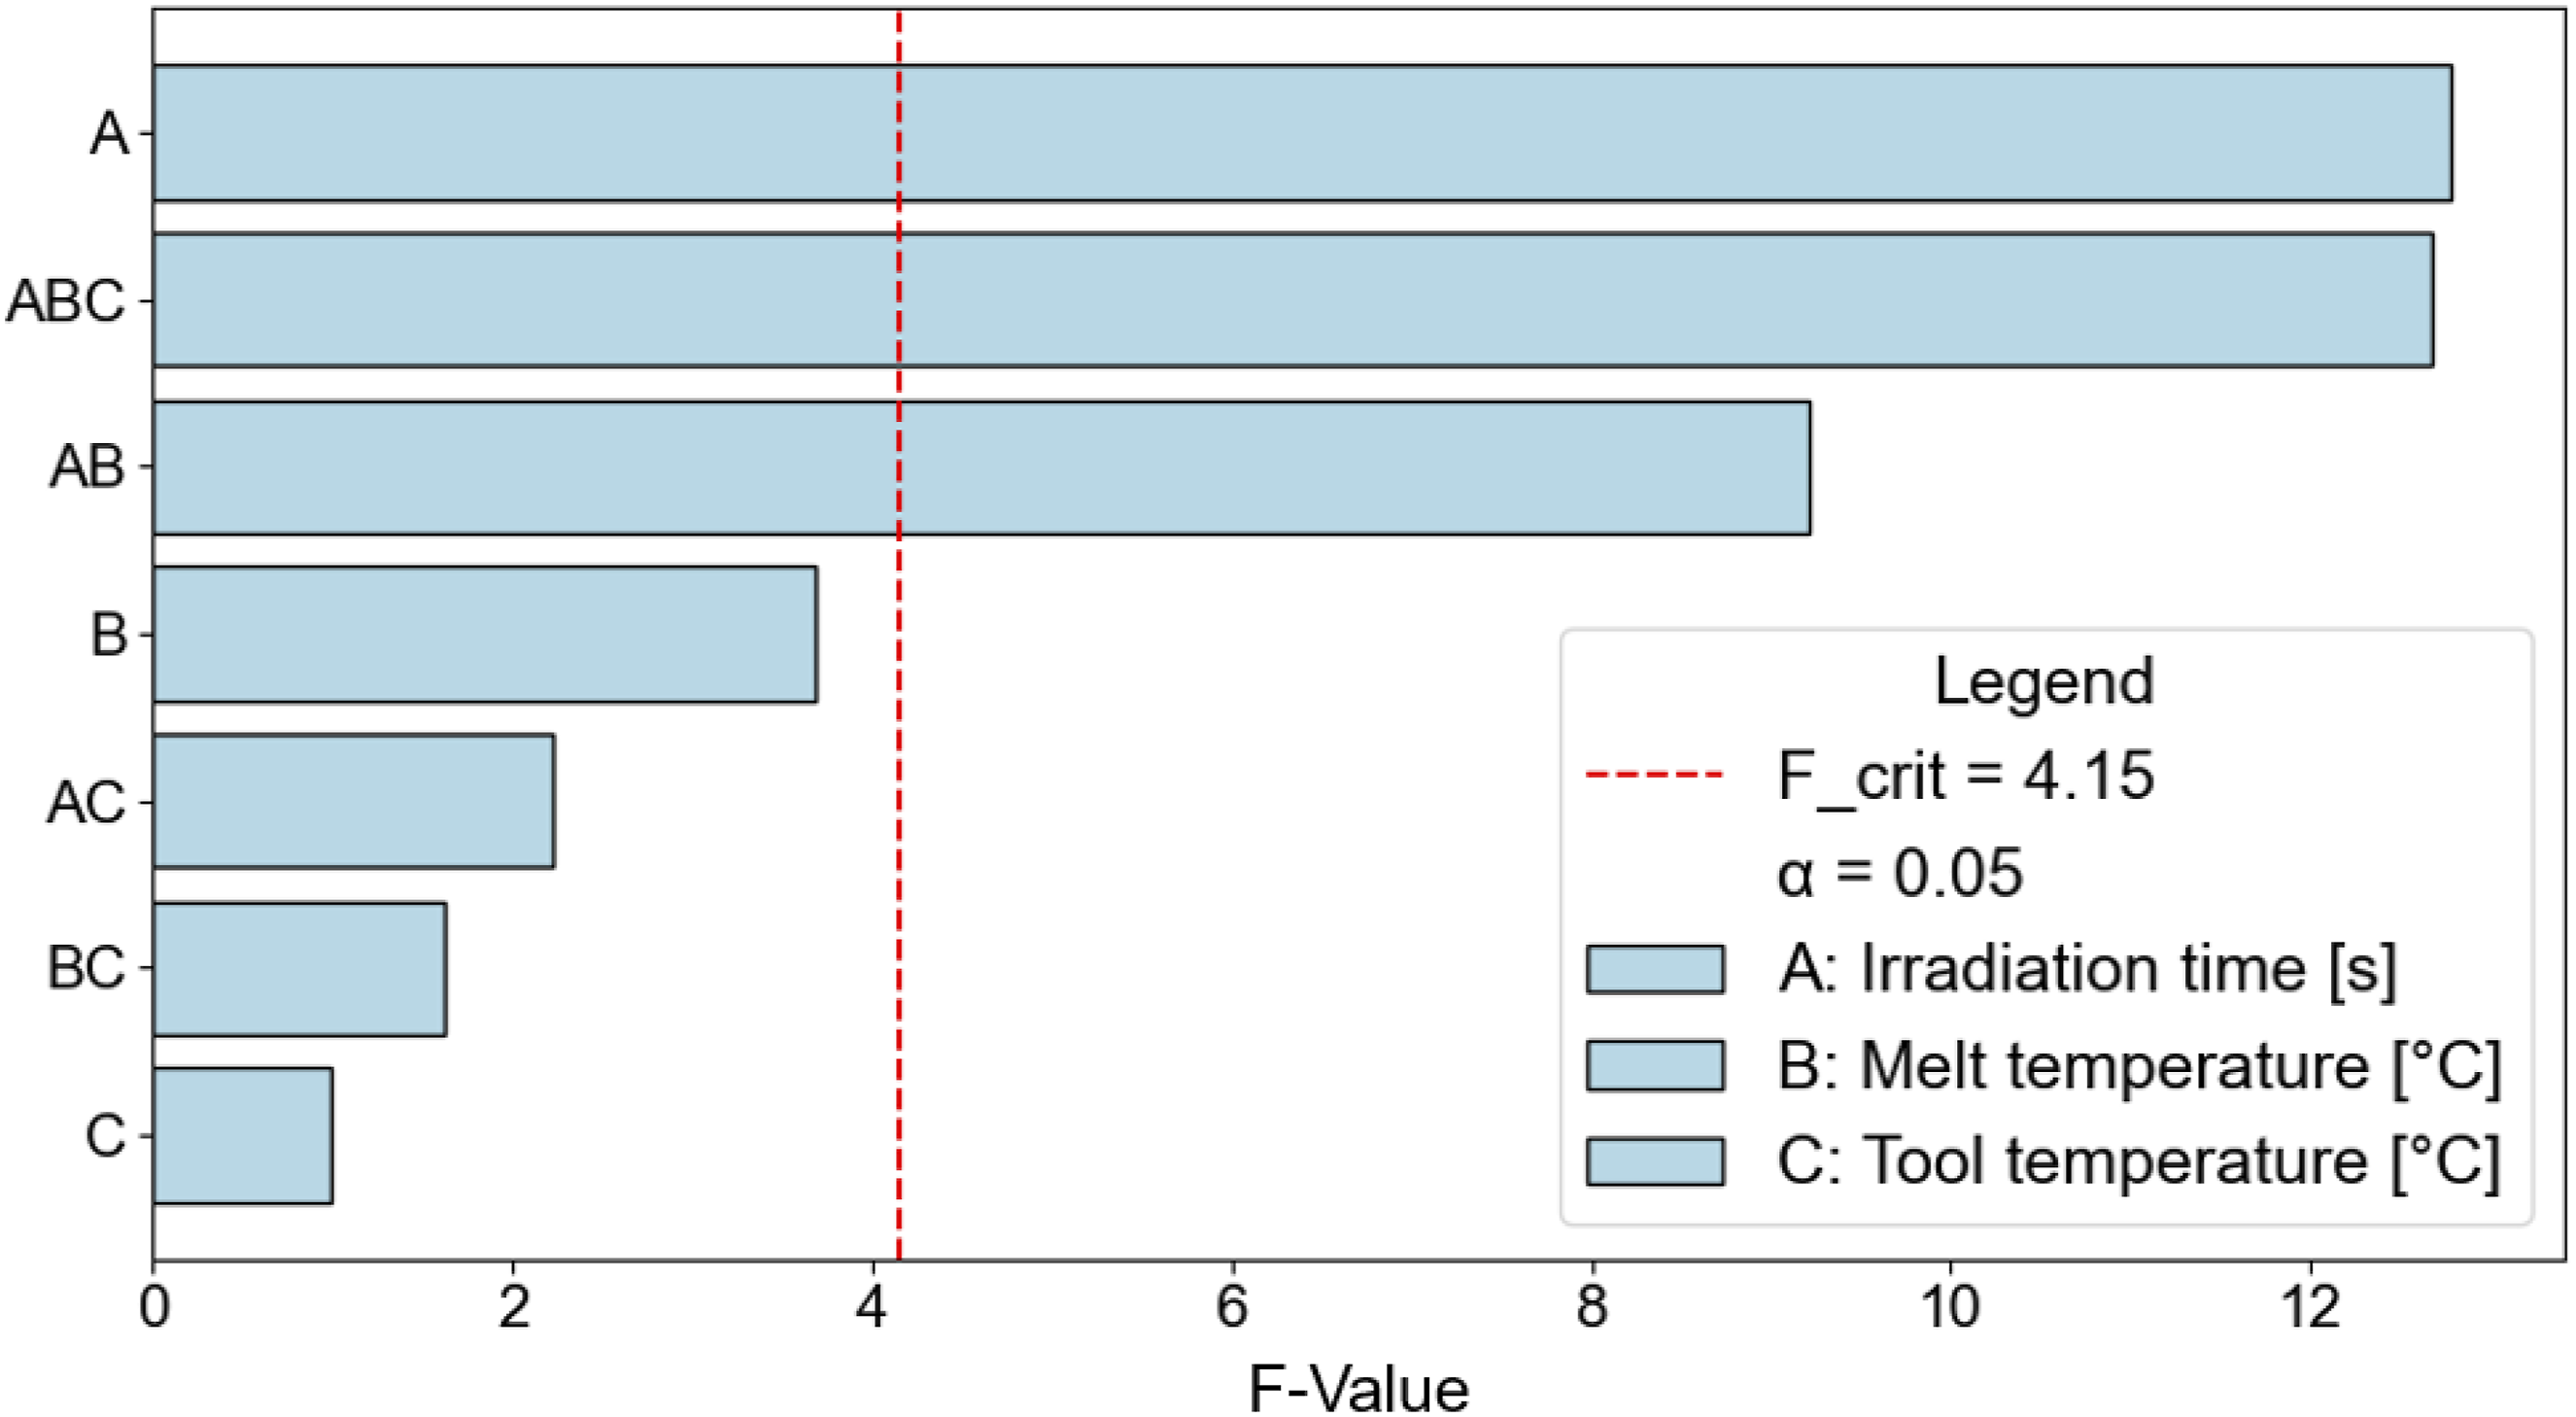
The main effect analysis (Figure 18) clearly demonstrates that the factors of melting temperature and irradiation time have the greatest effect on the measured bond strength F1, while the effect of the mould temperature is comparatively small. As the melt temperature increases from 220°C to 300°C, the average strength increases significantly, which is due to the reduced viscosity of the melt and improved laminate contact. Similarly, a longer irradiation time of the laminate results in a higher surface temperature and thus improved molecular diffusion (degree of healing) at the interface. The mould temperature, on the other hand, leads to a moderate increase in strength, as it primarily affects the cooling rate. In all cases, the centre points are below the global mean value, which indicates a non-linear system response: complete thermal activation of the interface can only occur above certain thresholds of temperature and time. These results confirm the significant main effects and interactions of the irradiation time identified in the variance analysis (see Figure 17) as the dominant influencing factor in interface formation. Main effect diagram for the target parameter pulling force of the PP-GF rib test specimen in the advanced parameter study.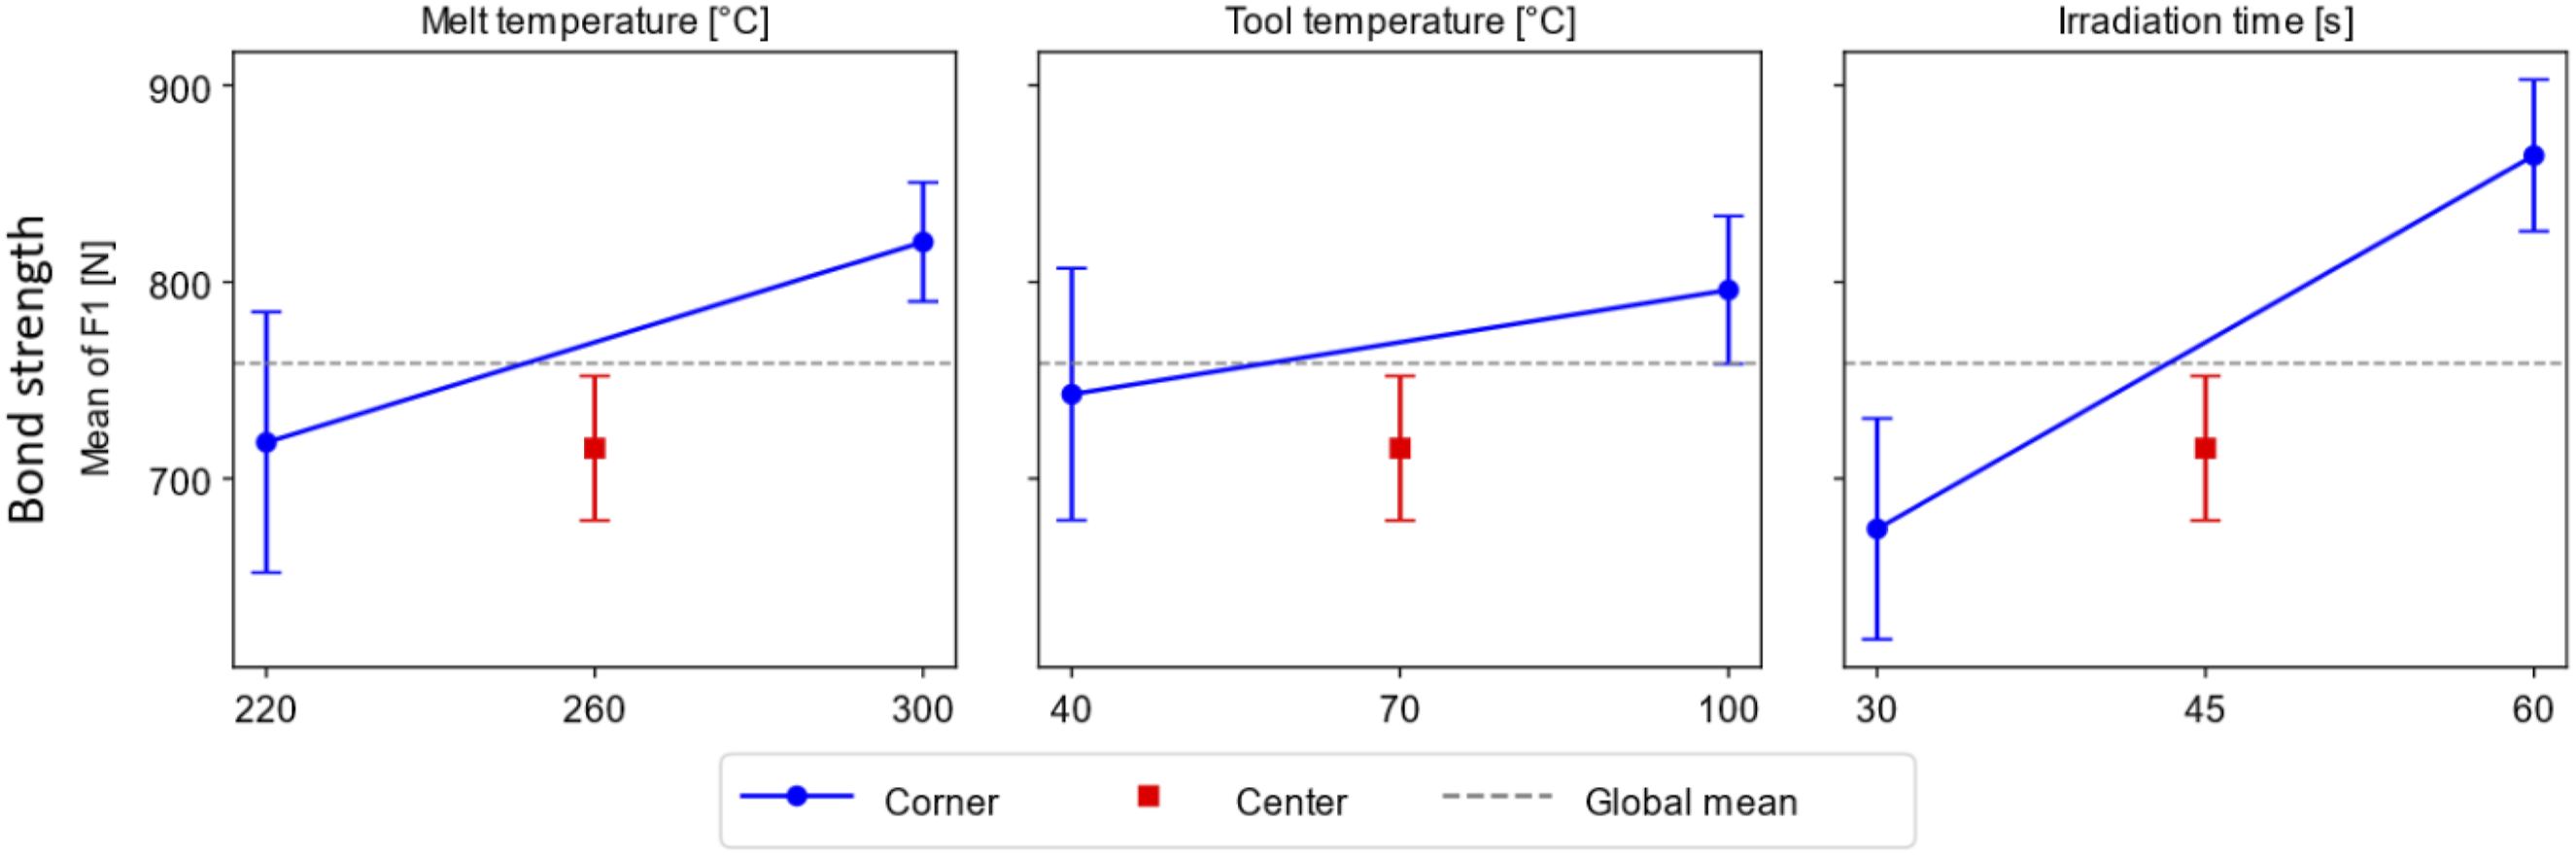
The evaluation of the maximum force revealed a similar pattern compared to the first series of tests. For the tests with the lowest settings for all parameters, the maximum rib pull-off force was lowest. The highest bonding strength of more than 7.14 MPa was achieved for samples with all parameters set to the highest level. Comparing the bulk strength of a CF-reinforced PEEK (90HMF40) with the PP-GF material used in this study, the tensile strength (ISO 527) of the PP-GF is only 40% that of its PEEK counterpart. Enderle et al. achieved strengths of approx. 15–20 MPa with PEEK-CF in rib-on-plate samples without an additional matrix layer. Therefore, these results are within the expected strength range for PP-GF. Nonetheless the parameter range can most likely be further optimised to achieve higher strength and reproducibility. In all test series, there was a noticeable trend that the samples taken from the end of the rib test specimen achieved lower values in the tensile test. However, this trend was less pronounced when the higher level was selected for at least one of the parameters, and the effect decreased when the higher level was also selected for the other parameters. Figure 19 displays the results of the test series in which the melt temperature and mould temperature were set to the higher level. We can see that the pull-off forces for the samples at position 1 (F1) and position 2 (F2) are slightly higher than at the other positions. This indicates a temperature gradient inside the cavity. However, the difference is small overall and significantly lower than for the samples where only one parameter was set to the higher level. In addition, the data from the sensors for the melt temperature and for the melt velocity inside the cavity were evaluated and showed, as previously, that the melt temperature programmed to the machine cylinder has the greatest impact on the melt temperature. The effect that the bonding strength at the second sample position is slightly higher compared to the first one is also apparent in this case. The influence of the mould temperature and the interaction between the mould temperature and the melt temperature were also found to exert a significant effect on the melt temperature within the cavity. The surface temperature and other interactions had no significant effect on the temperature of the melt. Since the bonding strength depends on all parameters, it is important to find the correct temperature control for the melt during the injection moulding process within the cavity. In addition, the melting temperature and mould temperature had a significant influence on the flow rate, as already demonstrated in the first series of tests. Overview of the breaking force of a sample with good parameters from the position near the sprue (F1) to the position far from the sprue (F5).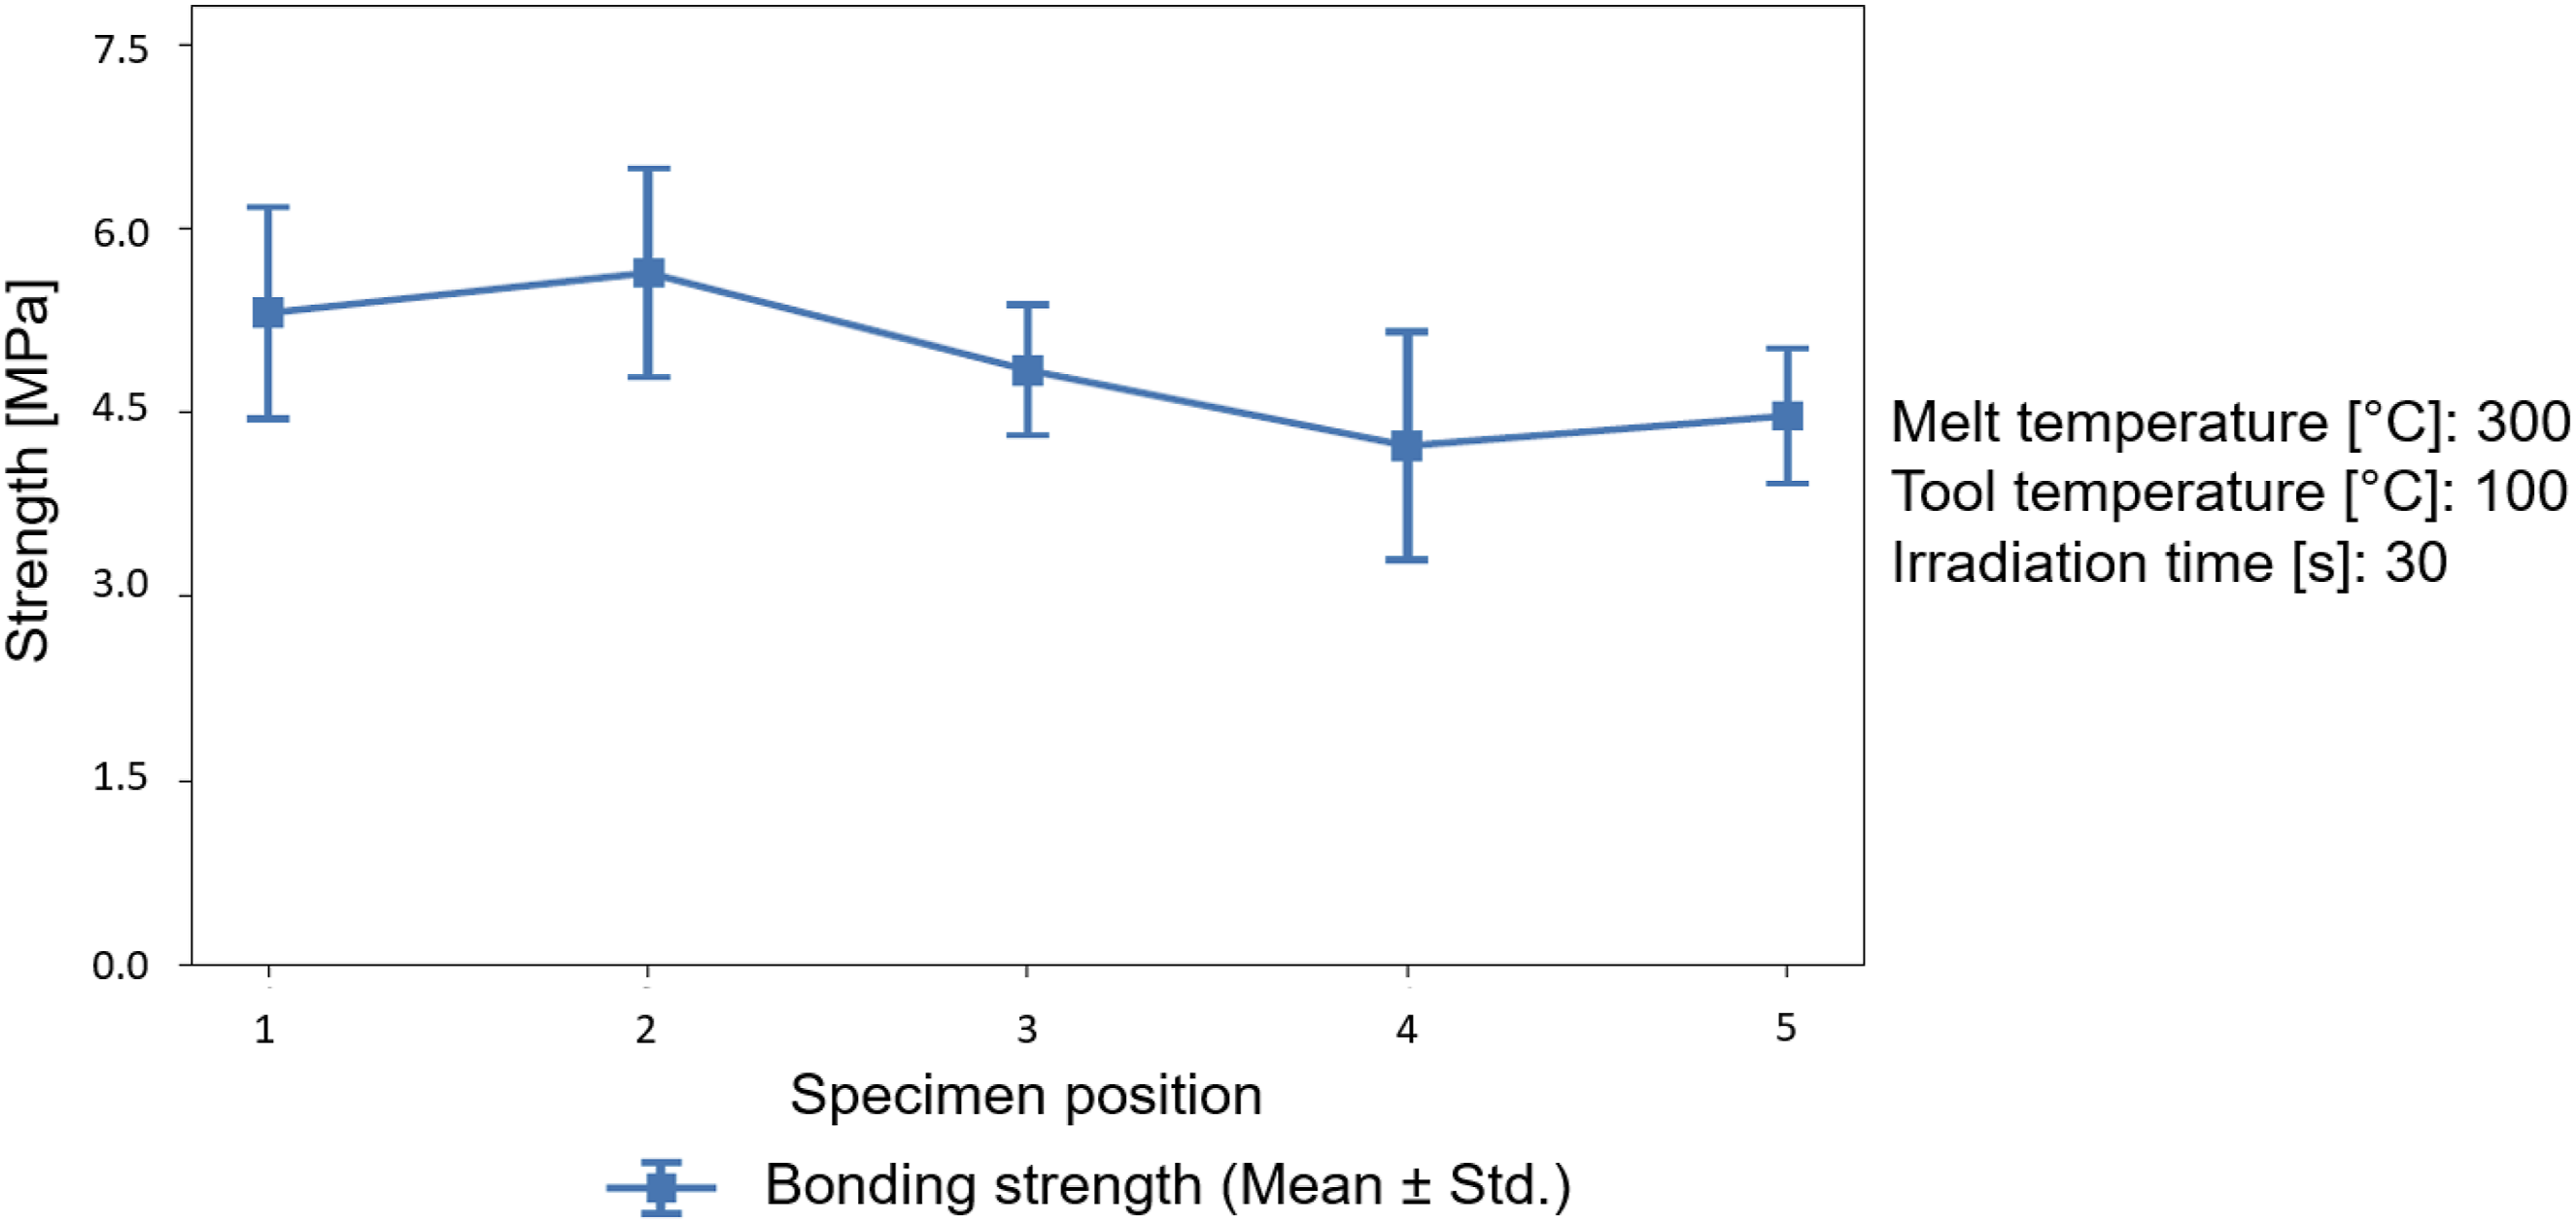
Second study: V-structure with PP-GF
The results for the tests listed in Table 6 are reported. The stress-strain curves are shown in Figure 20. A total of eight V-structures were tested, with two of each types manufactured using the same parameters. All V-structure components exhibited failure behaviour that is initially characterised by an approximately linear rise up to crack initiation. Subsequently, a sudden drop in force occurs before it rises again relatively steady. This rise is accompanied by the peeling of the rib from the test specimen up to the tip of the angle. The angle is then pulled open without the stiffening effect of the rib. Both the force at crack initiation (first local maximum) and the force at the tip of the angle, before the injection-moulded rib can no longer provide a stiffening effect, were measured and analysed. However, as the load is not a ‘normal stress’ but a crack at the corner, which ultimately results in a peel load, no direct comparison to the previous studies is possible. Array of curves from tensile tests on V-structure components made of PP-GF material.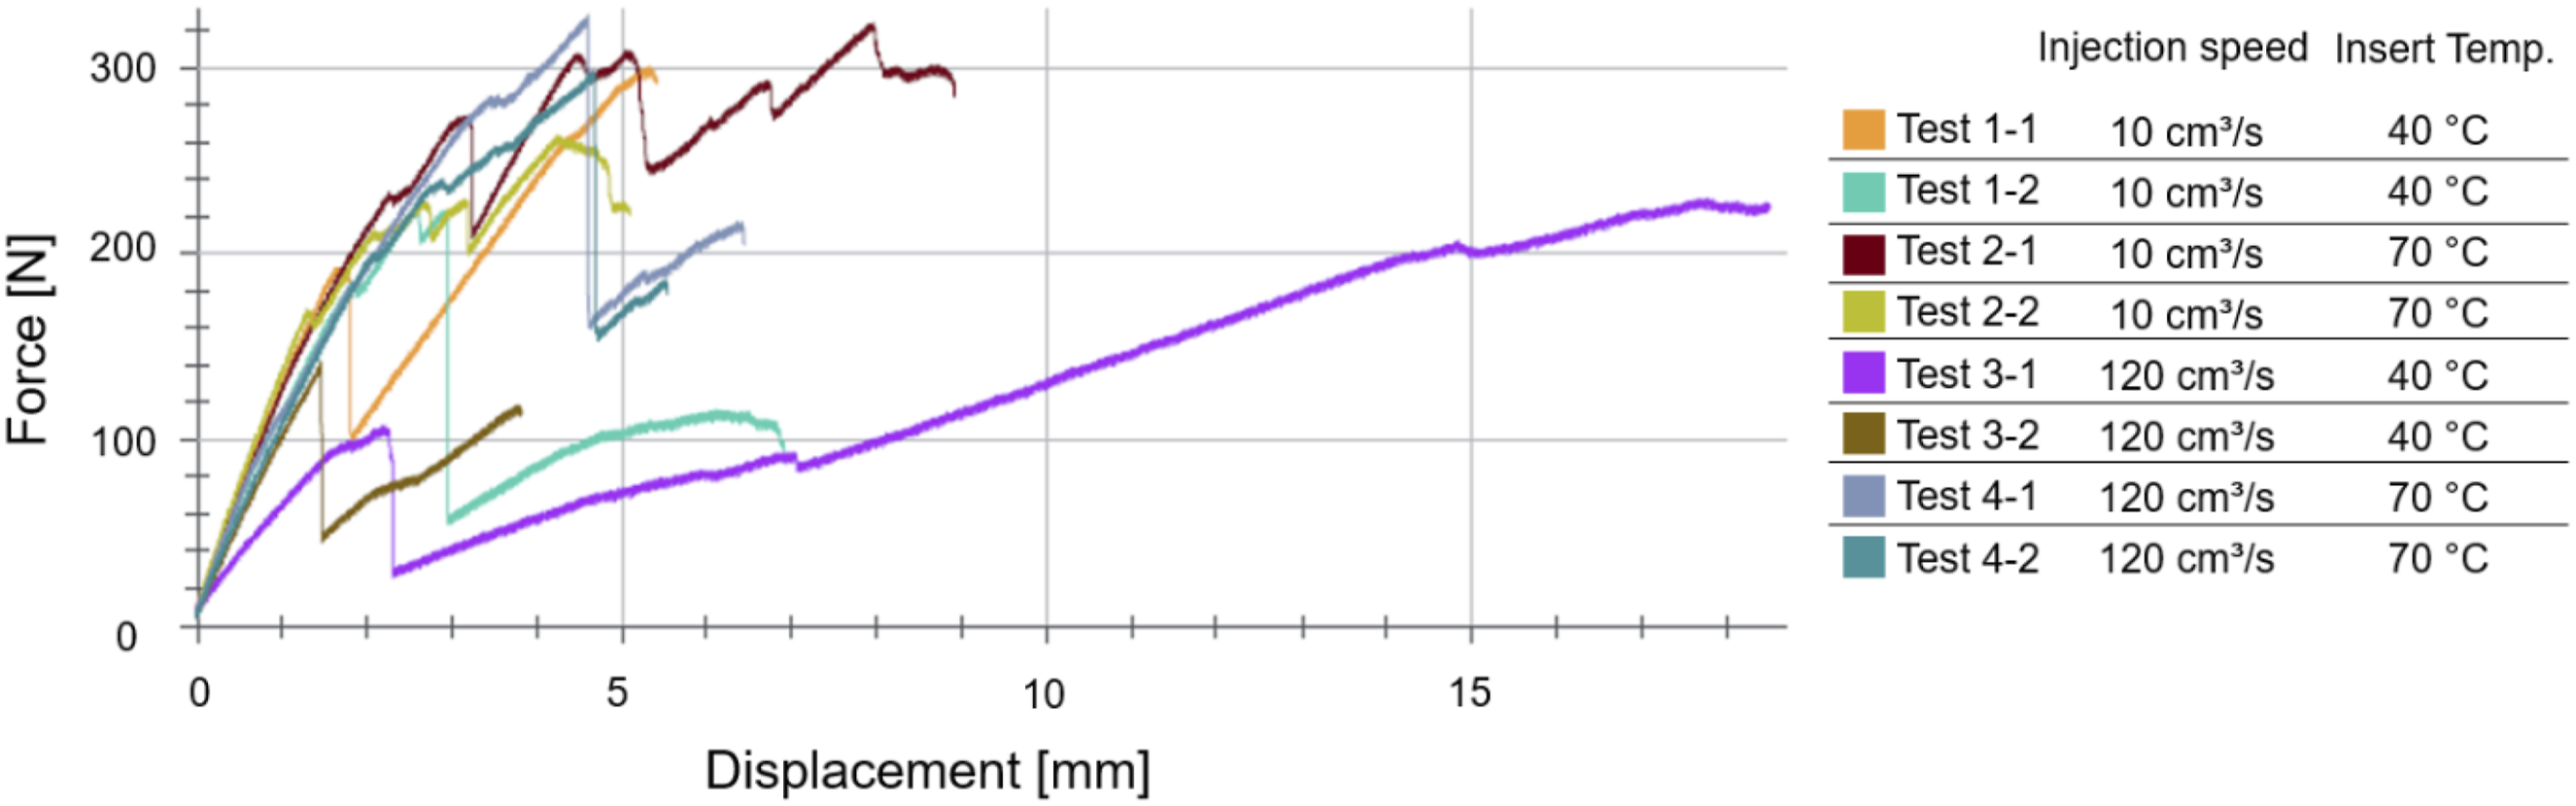
The mean values for the breaking forces of the tensile tests are shown in Figure 21 together with the varied manufacturing parameters and the relative standard deviation, which expresses the percentage deviation of the measured values from the mean value. Although, this is a small series with only two measurement repetitions, a certain trend is still observable, confirming the results from the previous parameter studies. The first series selected the low level for both parameters and achieved a maximum force up to crack initiation of approximately 208 N on average. In the second series of tests, the laminate temperature was increased by 30°C, which increased the force to approx. 251 N. In the last series of tests, both the laminate temperature and the injection speed were set to the highest level. This resulted in the highest force in the tensile test, approx. 312 N, and the lowest relative standard deviation. As mentioned, this value is not comparable to most literature values typically referring to normal stresses. Only other peel stress studies can serve as reference, e.g.,
30
where values of 400 N for an area of 312.5 mm2 were measured. One reason is that effective load transfer occurs locally at the crack front, not across the entire projected area. All six samples showed crack initiation far from the sprue, which can be explained by the temperature gradient from the start of the flow path to the end. In both the low and high injection-speed experiments, a temperature gradient between the two cavity-integrated sensors was observed. However, this gradient was substantially larger in the low-speed trials, averaging approximately 25°C, whereas the high-speed trials exhibited an average gradient of only about 11°C. The difference in filling time also varied considerably: with reduced injection speed, the melt required roughly one second to travel between the sensors, resulting in a comparatively long residence time within the cavity. In contrast, the high-speed series showed a residence time of only 0.05 s. Nevertheless, despite this very short filling time, the pronounced overall temperature gradient in the high-speed trials still exerted a measurable influence on the bond quality. Only the third series of tests does not match the results, for various reasons, such as process fluctuations or measurement errors in the tensile test. This is illustrated by a relative standard deviation, which is significantly higher than in the other test series. In addition, these two samples were the only ones to show crack initiation near the sprue. Results of the tensile tests on the PP-GF V-structure, including the modified variables.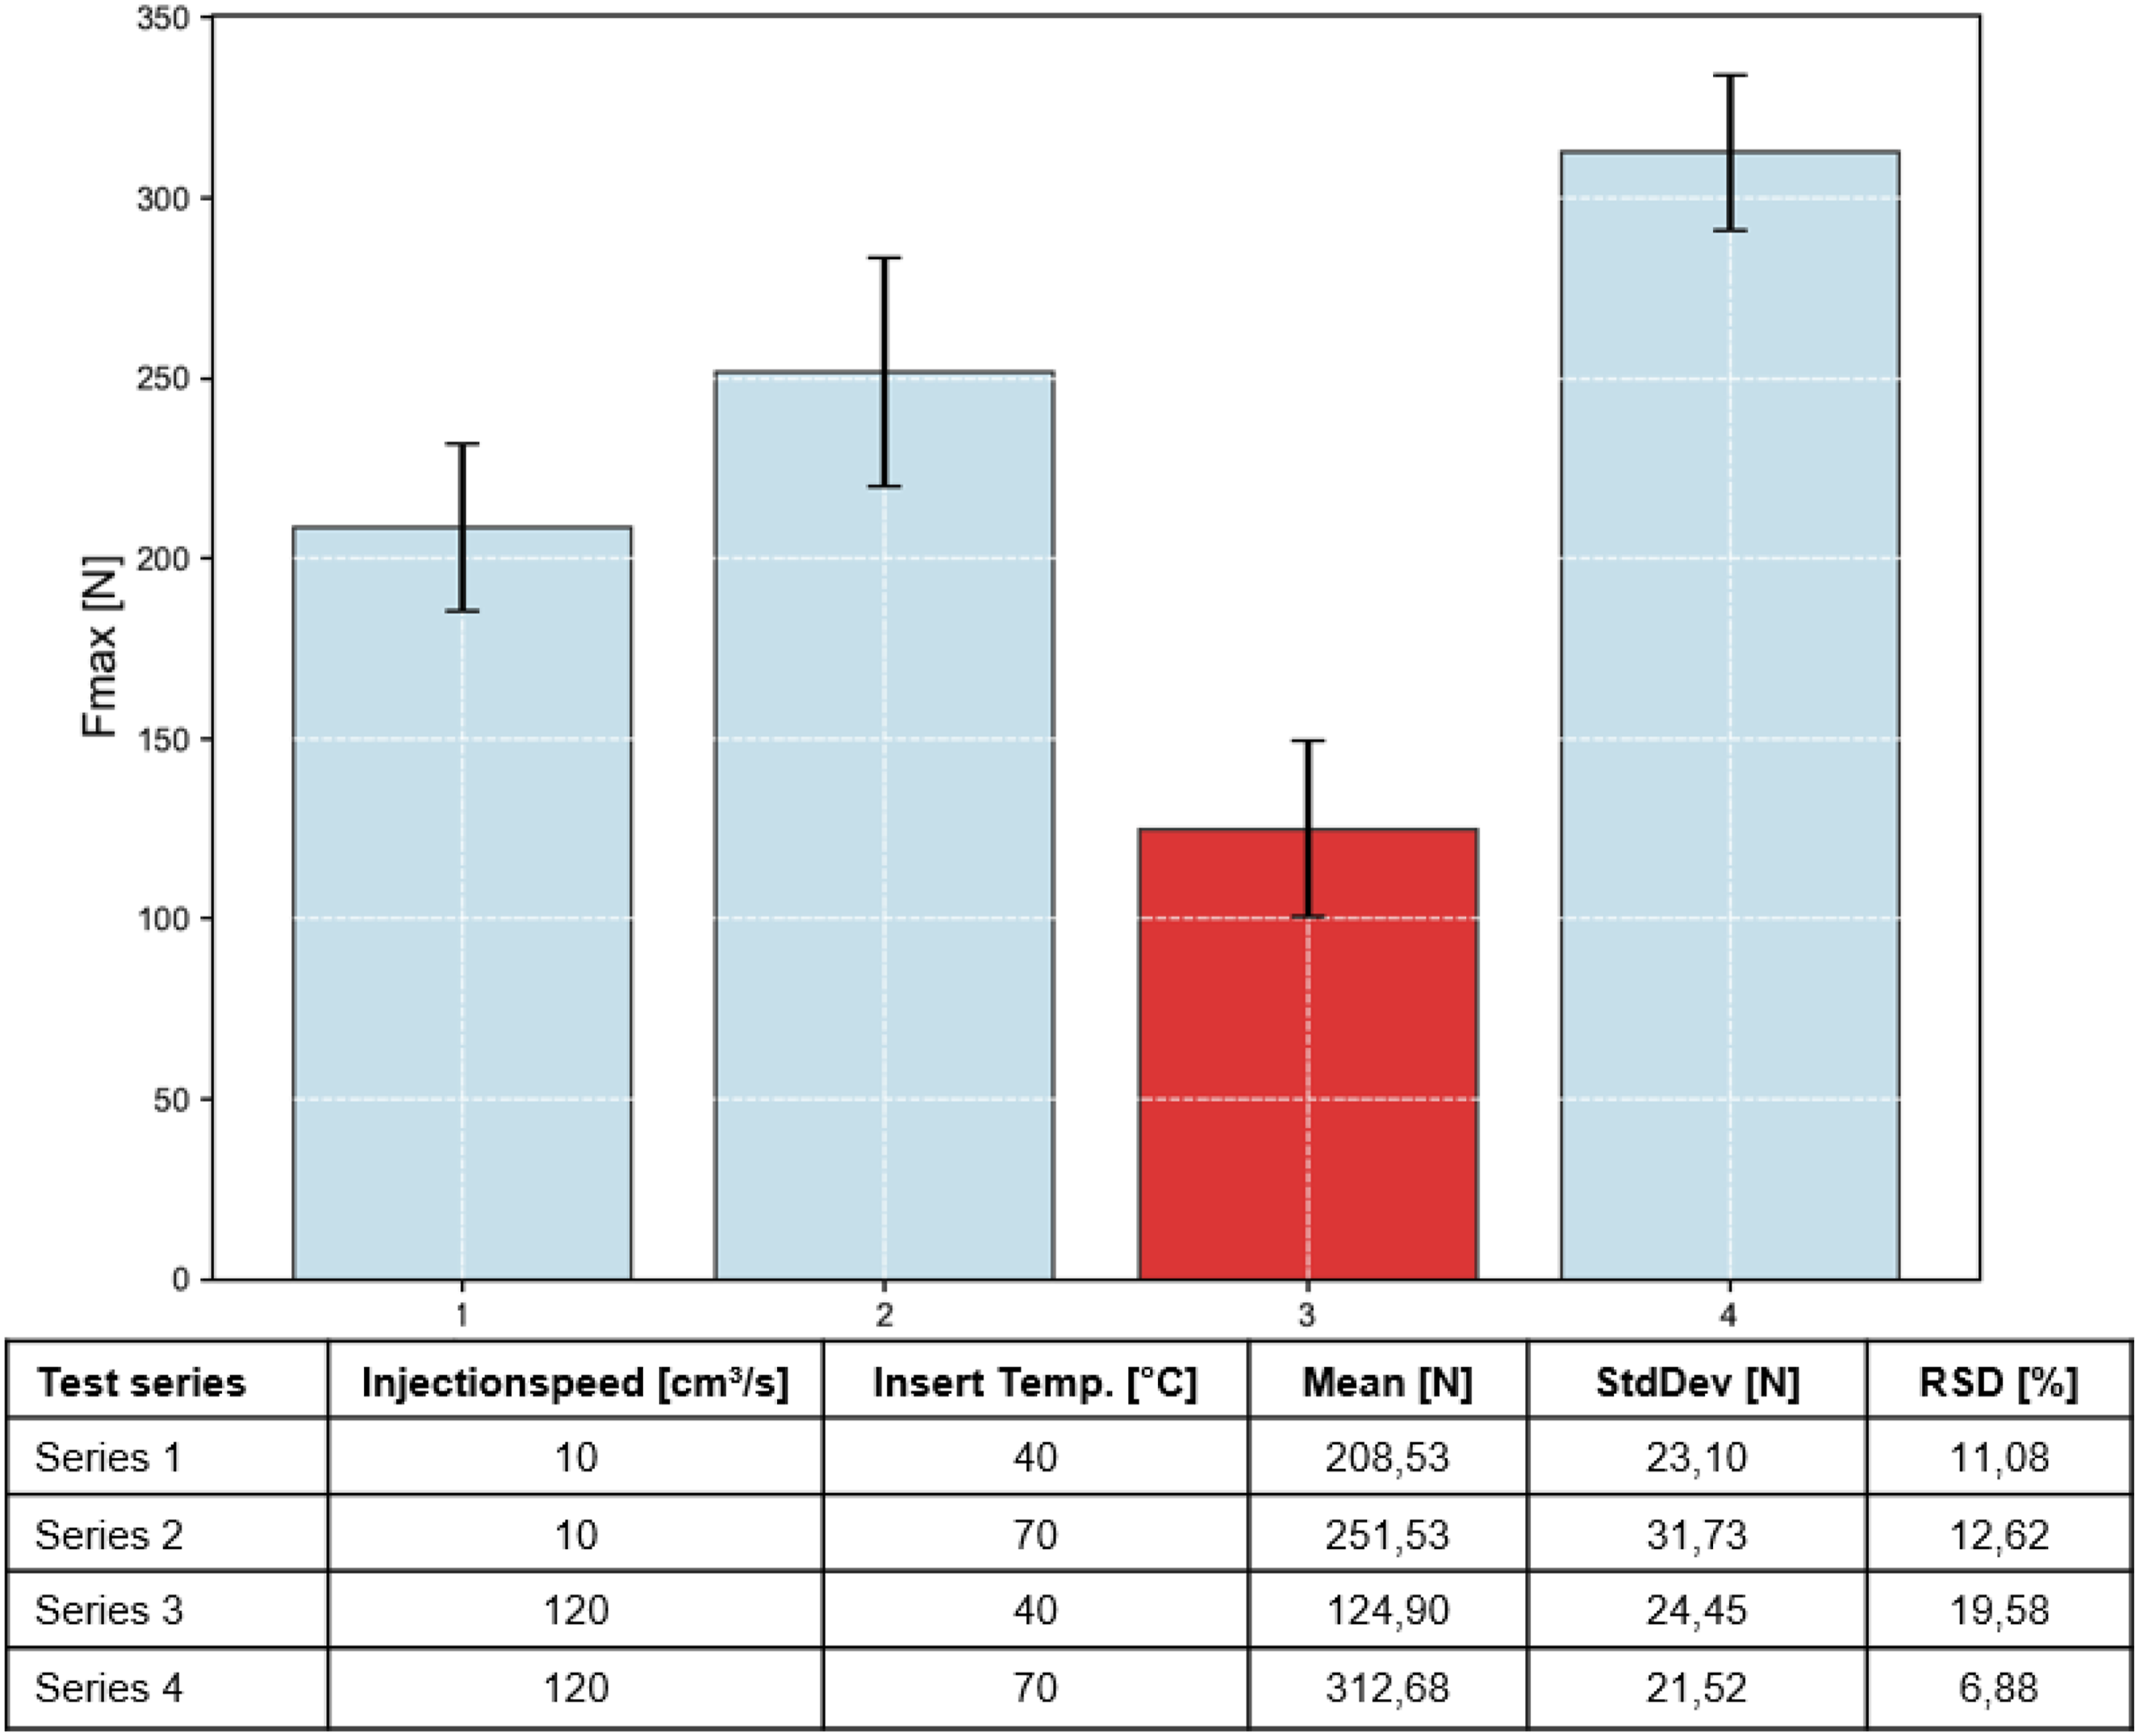
The evaluation of the interactions in this series of experiments showed that the laminate temperature and the interaction between the laminate temperature and injection speed had a significant effect on the crack initiation force. The impact of the laminate temperature is also evident in the main effect diagram (see Figure 22). Main effect diagram for crack initiation force, Tmax of melt and velocity of melt for V-structures made of PP-GF.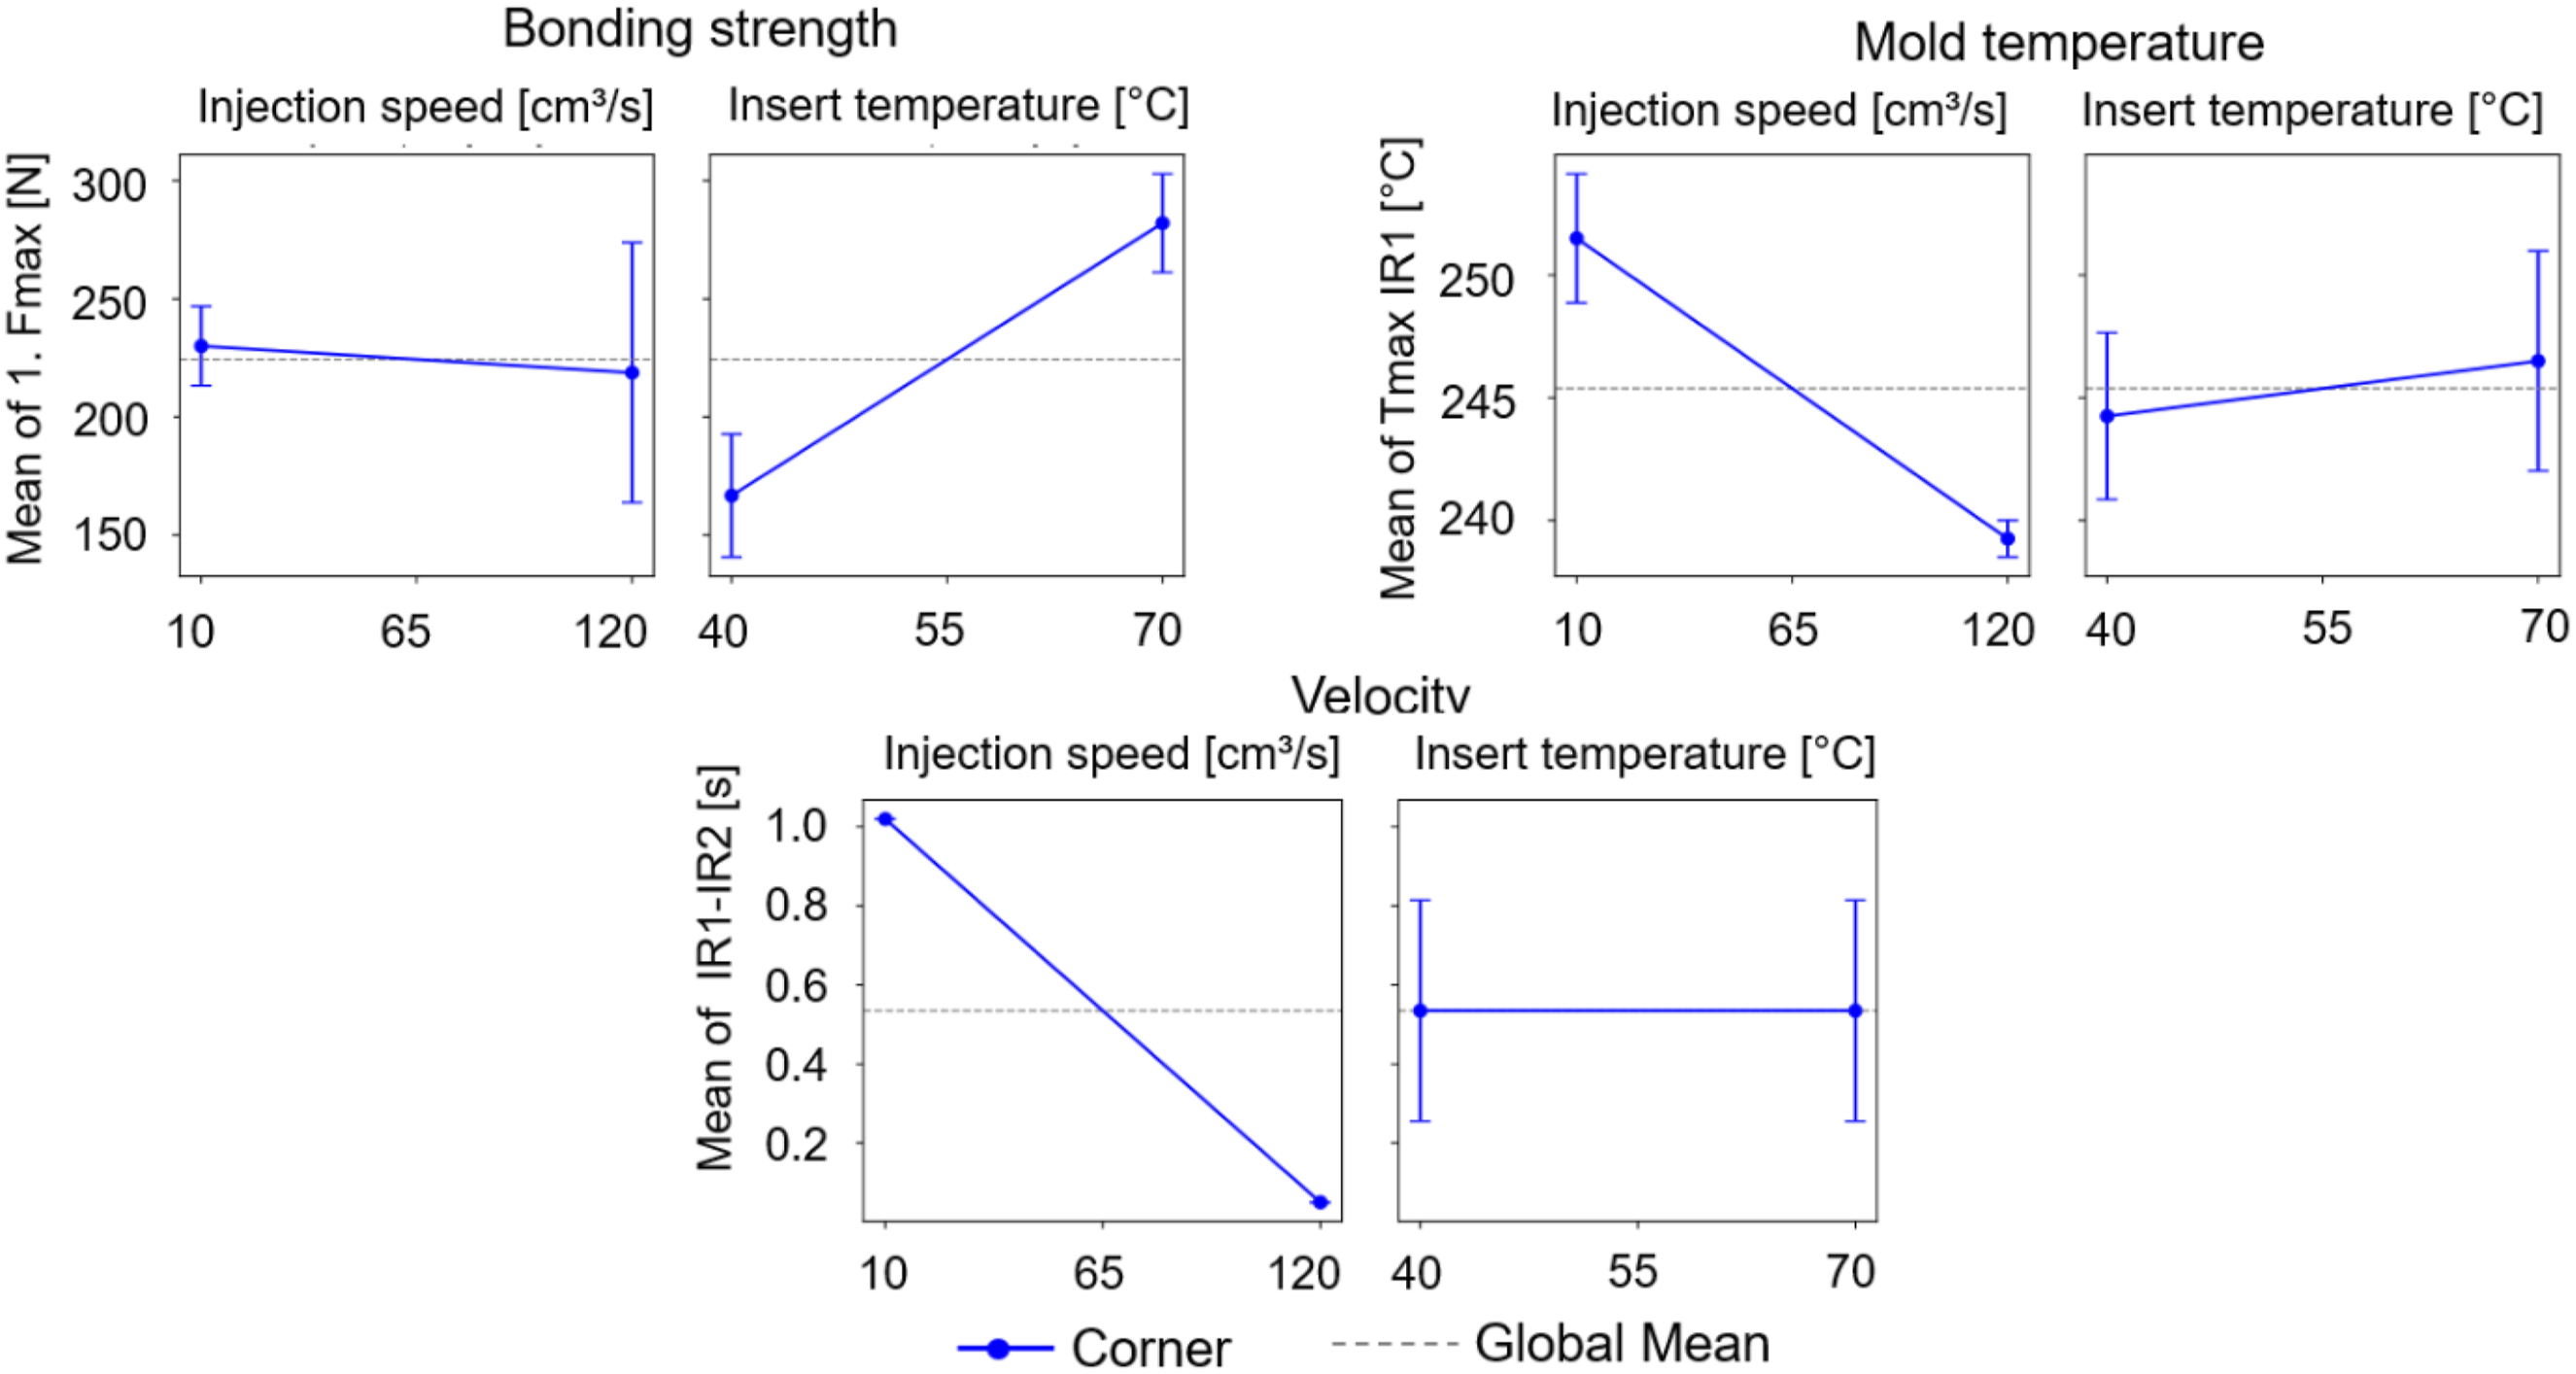
When evaluating the impact of the process parameters injection speed and laminate temperature on the target variables melt temperature, measured at sensor positions 1 and 2, mould cavity pressure and melt flow velocity in the cavity (as the time interval Δt between sensor positions 1 and 2), the following statistically significant effects were also observed. ⁃ On the melt temperature at sensor position 1: injection speed ⁃ On the melt temperature at sensor position 2: none ⁃ On the flow velocity: injection speed ⁃ On the mould internal pressure: injection speed
Third study: V-structure with PPS-CF
In situ quality monitoring with the sensors inside the cavity worked reliable and accurate for every production test of the V-structures made of PPS-CF. The temperatures during the first production test were similar at MTPS1 & MTPS2, almost 100°C lower at sensor position 3 and approx. 25°C higher at position 4 (see Figure 23). In all measurements, the temperature at position 3 was lower compared to MTPS1, MTPS2 and position 4. This may be due to the fact that this sensor was farthest away from the sprue and therefore had the longest flow path. An assumption supported by the fact that the maximum temperature is reached approximately 0.5 seconds later, as can be seen in Figure 23. Temperature curve of the melt at different sensor positions during the production of the first PPS-CF V-structure over the entire process, as well as 1 second before and after the maximum.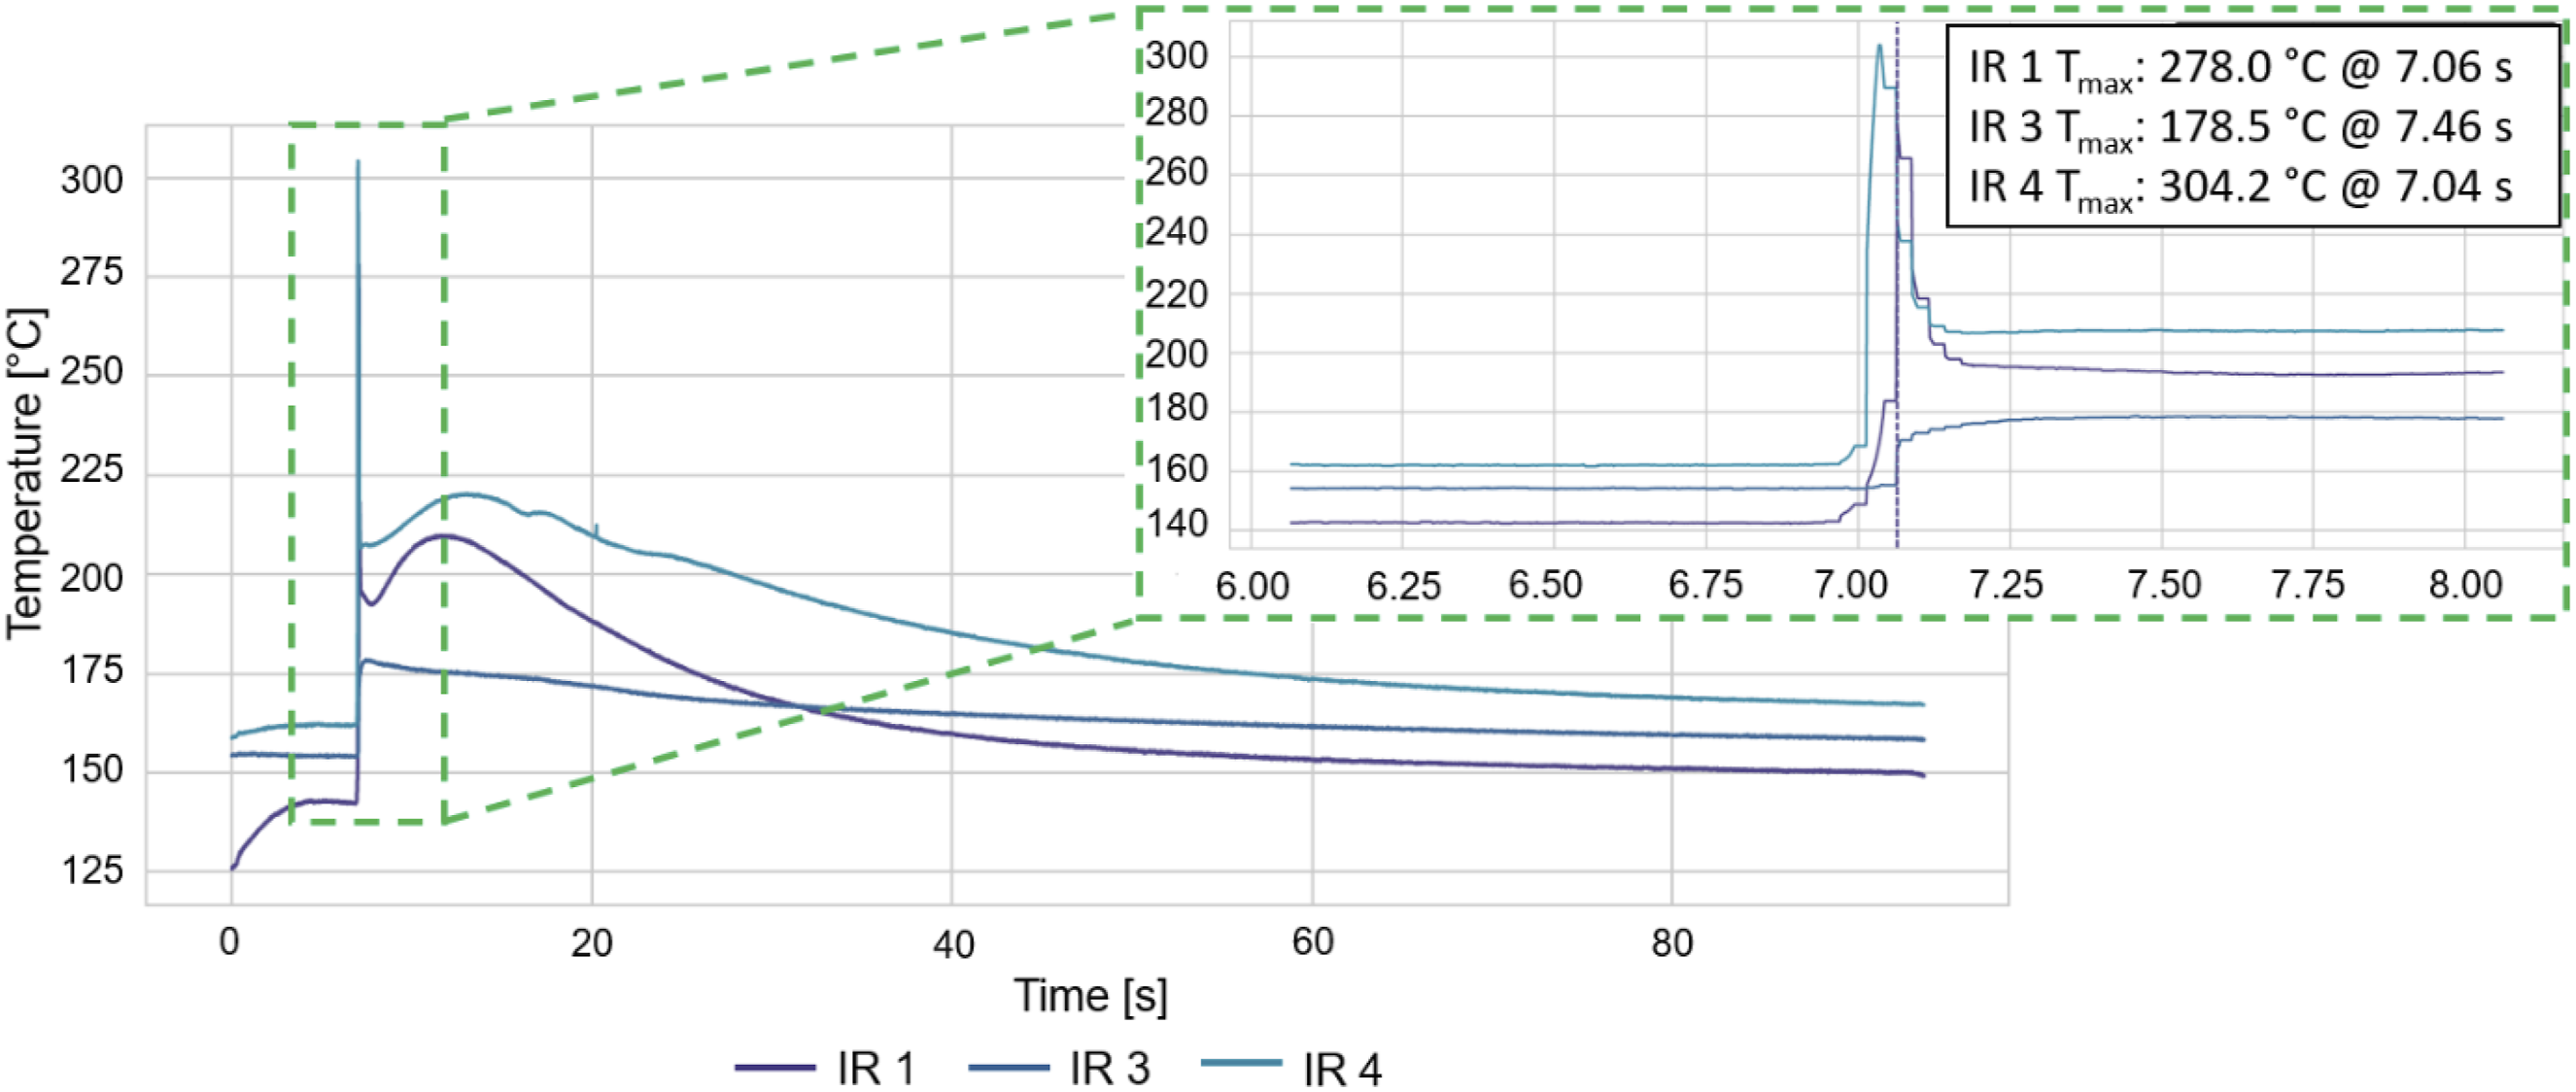
For the experiments with injection speeds of 100 cm3/s and 130 cm3/s, the temperature at position 4 was similar to that at MTPS1 and MTPS2, sometimes higher and sometimes lower. This depended on the oven temperature, mould temperature and melt temperature. When maximum temperatures were set to higher oven and mould temperatures, the temperature at positions MTPS1 & MTPS2 was always higher compared to position 4.
When lower oven and mould temperatures were selected, the temperature at position 4 was higher. The reason for this may be that additional shear forces affect the filled melt due to the narrow area in the curvature of the organo sheet. Elevated cavity pressures during injection moulding generally leads to increased shear rates in the near-wall regions of the polymer melt, because viscous dissipation is governed by the product of shear stress and shear rate. Higher pressures, with constant processing conditions, produce intensified shear and consequently greater shear-induced heating. 31 Consequently, the observation that temperature maxima at sensor position 4, which is placed within a geometric curvature that further amplifies local velocity gradients, exceed those at position 1 is consistent with a locally elevated pressure–shear environment. Flow redirection and local cross-sectional changes in the curved region increase shear stress and promote the formation of thermal “hot spots,” a phenomenon well documented for both filled and unfilled polymer melts. 32 The pressure-driven temperature rise is not equally pronounced at higher melt, oven or organo sheet temperatures. At elevated thermal conditions, the viscosity of the melt decreases significantly due to the strong temperature dependence of polymer rheology, which reduces the shear stress for a given shear rate and therefore diminishes the amount of energy converted into heat via viscous dissipation. 33 As a result, even though the pressure profile and the geometric curvature remain unchanged, the reduced viscous resistance of the melt mitigates shear‐induced heating. This explains why the temperature differences between positions 1 and 4 decrease at higher processing temperatures. The melt flows better, experiences lower shear stresses, and therefore generates less additional heat from viscous dissipation. The fact that higher temperatures were achieved overall with higher input parameters is physically plausible, as higher surface temperatures on the mould and organo sheet means that the polymer retains additional heat during injection. This also delays the solidification process. As the melt temperature increases, the peak values of the temperature measurements rise, which is plausible.
The ANOVA conducted for the PPS-CF V-structures shows, unlike the other experimental series no significant effect of the independent variables on the target parameter bond strength. Several factors may explain why all main effects and interactions fall below the critical F-value. The system may be dominated by uncontrolled variables, the sample size may be insufficient, or the within-group variance may exceed the effect size of the factors.29,34 It is unlikely that the system is dominated by other uncontrolled variables, as the varied factors were demonstrated to be significant in the previous experimental series. The high within-group variance is likely attributable to substantial scatter in the measurement data. Because this experimental series was primarily intended to validate the in situ quality monitoring system, only a limited number of specimens were produced for each parameter combination. As a consequence, the resulting sample size was inadequate, and the increased within-group variance prevented the detection of statistically significant effects.
Another explanation is that the selected parameter set did not provide sufficient interfacial adhesion within the V-structure, resulting in inadequate tensile test performance. In this experimental series, organo sheet temperatures of 150°C and 180°C were used, along with melt temperatures of 320°C and 330°C. Akkerman et al. point out that intimate contact between the melt and the laminate surface is established very rapidly during overmoulding due to the high injection and holding pressures. Therefore, healing is considered the rate-limiting mechanism. 22 Grouve et al. demonstrate, however, that for PPS the development of intimate contact and the subsequent diffusion of polymer chains are strongly dependent on the thermal state of the laminate surface. Healing itself proceeds extremely quickly (≈1 ms) provided that both surfaces are fully molten. In this case, local thermal melting of the laminate surface becomes the decisive step for establishing bonding between the melt and the organo sheet. 35 According to the datasheet, the organo sheets have a melting temperature of approximately 280°C, and the PPS granulate melts at around 278°C. Despite the high pressures, which ensure rapid macroscopic contact, microscopic contact formation remains limited due to insufficient thermal softening of the PPS-CF surface, as the organo sheet surface temperature likely remains below Tm. The tested variations in oven, melt, and tool temperature as well as injection speed did not elevate the decisive parameter - local surface plasticisation above approximately 280°C - to a sufficient degree. Consequently, the differences in the actual “healing-relevant” interfacial temperature remain small, and the factor effects are overshadowed by experimental scatter.
The highest fracture forces in this test series were again observed for the parameter combinations with the highest thermal and processing settings (oven temperature 180°C, tool temperature 180°C, melt temperature 330°C, and injection speed 130 cm3/s), reaching approximately 170 N. As previously discussed, the insufficient surface temperature likely prevented the formation of a strong interfacial bond, and the specimens exhibited peel-type failure during tensile loading, which further reduces the measurable fracture force.
Conclusion
This work demonstrated the applicability and value of in situ infrared temperature sensing and piezoelectric pressure measurement for analysing the overmoulding of fibre-reinforced thermoplastic laminates. The rib-on-plate experiments with PP-GF verified that the sensor system provides highly repeatable in-mould data and enables direct correlation between thermal and flow-related process variables and the resulting interfacial bond strength. Organo sheet temperature, melt temperature and injection speed were identified as the dominant parameters effecting the adhesion performance, with higher thermal input and increased filling velocity promoting improved bonding. The subsequent experiments on V-structure demonstrators confirmed these trends, although the bond strengths remained below literature values, indicating that further process optimisation, particularly regarding thermal conditioning of the organo sheet, is required. For PPS-CF laminates, none of the investigated parameters exhibited a statistically significant effect on the mechanical joint strength. This outcome is attributed to insufficient organo sheet temperatures, which stayed below the melting point of PPS and therefore inhibited interfacial melting, intimate contact and molecular interdiffusion. The comparison between PP-GF and PPS-CF thus highlights the decisive role of the interfacial thermal state for the formation of a strong joint in semi-crystalline thermoplastic composite overmoulding. Overall, the study confirms that mould-integrated IR and pressure sensors provide a robust foundation for data-driven process analysis and quality assessment in overmoulding. The findings underline the necessity of achieving adequate interfacial temperatures to enable intimate contact and healing, and they point towards targeted thermal management strategies, such as elevated organo sheet temperatures or localised surface heating, as promising access for enhancing overmoulded joint performance in future work.
Footnotes
Author contributions
FIBRE conducted the majority of the research work, while Kurz Kunststoffe GmbH was responsible for project management and held the overall technical responsibility. In addition, Kurz Kunststoffe conducted sensor integration, tool development and the manufacturing of the V-structures. FOS Messtechnik GmbH developed the sensor technology used for the in situ process monitoring and provided the necessary equipment for data acquisition and evaluation.
Declaration of conflicting interests
The authors declared no potential conflicts of interest with respect to the research, authorship, and/ or publication of this article.
Funding
The authors disclosed receipt of the following financial support for the research, authorship, and/or publication of this article: The project is funded by the German Federal Ministry for Economic Affairs and Energy (BMWE) [funding number 20Q1915C] and by the Federal Aviation Research Programme (LuFo) on the basis of a resolution passed by the German Bundestag.
Data Availability Statement
The datasets generated during and/or analysed during the current study are available from the corresponding author on reasonable request.