
Abstract
Growing concerns over resource depletion and rampant material pollution have sparked enormous interest in the use of natural, renewable fillers for the formulation of polymer composites. In this paper, Pistachio Shell Powder (PSP), an easily available agro-processing waste product, is comprehensively investigated as a biorenewable natural filler for the development of green and sustainable PLA biocomposites. Experimental design and analysis were performed using a statistical approach, Response Surface Methodology - Box-Behnken Design (RSM-BBD). This methodology was then applied for the optimization of the material properties by systematically altering the main input parameters, which are represented by the filler loading, melting temperature, pressure, and speed. The material characterization data obtained were optimized by using RSM for multifactor analysis, and the validity of the statistical design was carefully checked by the use of ANOVA. The key results obtained from this work clearly pinpoint PSP as a promising, high-potential, and eco-friendly reinforcement for biodegradable PLA biocomposites.
Keywords
Introduction
With the increasing environmental awareness and pressure in today’s world, the quest for eco-friendly solutions to reduce waste and low-impact living has become more essential than ever. 1 With the exponentially increasing population of the world coupled with the fast progress of industry, the problem of domestic and industrial waste management has been greatly accelerated. But this increasing issue provides a highly promising challenge: the conversion of agro-waste into valuable, environmentally friendly composite materials. 2 This change is in line with growing focus on circular economy values and demand for sustainable material development. 3 Composite materials are well known for their high mechanical and physical properties, but traditionally they have heavily depended upon synthetic reinforcement. 4 The ecological impact of synthetic fibers has initiated a strategic evolution towards the utilization of natural fibers and fillers. Fibers like flax, jute, hemp, kenaf, and sisal have received significant interest from researchers and manufacturers because they are biodegradable, cheap, and possess beneficial mechanical properties. 5 They are considered to be more of an application in lightweight structures, especially throughout the automotive industry, where it has replaced glass fiber composites in interior panels, door linings, and other non-structural parts. Depending on the type of application, natural fiber composites can be made with thermoplastic matrices or thermosetting polymers, or with hybrids thereof. Thermoplastics, for example, polypropylene, polyethylene, polylactic acid (PLA), and polyester, offer unique advantages, such as recyclability and, in some cases, biodegradability. 6 Thermoplastics are flexible and allow tailored material properties to be designed to meet specific performance needs such as heat resistance, mechanical strength, and chemical stability. New research has focused on first the addition of natural fibers into polymer matrices and the examination of many factors that impact the mechanical and thermal properties of the resulting composites, including the orientation of fibers, stacking sequence, and loading percent.7,8 Natural fibers are mostly used as reinforcement agents, which add to composites’ strength and stiffness, whereas natural fillers tend to act as modifying agents to alter the matrix phase. Fillers are generally added to minimize the cost of materials, improve certain properties, or processability.9,10
Several studies have illustrated the positive impact of using agro-waste-based fillers in polymer composites. For instance, the reinforcement of sisal/hemp/epoxy composites with silica nanoparticles in different percentages of weight (0–9 wt%) reduced void content and significantly enhanced mechanical and wear properties. 11 Likewise, the addition of mango shell particles into jute/flax/epoxy composites resulted in improvements in strength as well as wear resistance, emphasizing the reinforcing capabilities of natural fillers. 12 Groundnut husk fillers, on incorporation at higher weight fractions, have also been reported to enhance tensile and flexural strength substantially up to an optimal limit (approximately 40 wt%), in addition to overall cost-effectiveness of material and the environment. 13 In this context, a study investigated the valorization of Tunisian almond shells as micrometric reinforcements of biocomposites based on LLDPE. The impact of filler content on the resultant properties of the biocomposites was also investigated. Here, the benefits of using low amounts of ASP and their production on a low-cost scale were emphasized. 14 Some of the other residues such as eggshells, coconut shells, rice husks, sawdust of wood, fish bones, fish scales, and powders of Samanea saman have also been extensively researched as fillers in polymer composites. In addition to improving the mechanical properties, strength, rigidity, and hardness, the materials also serve a purpose in making the composite manufacturing more environmentally friendly by recycling agro-waste, thereby making composite manufacturing less ecologically stressful.15,16
Processing of Polylactic Acid (PLA) bio-composites using natural fillers remains a critical and evolving subject, specifically with reference to the optimization of the processing conditions, and achieving a crucial balance in the process. Recent publications and emerging findings reported insights into the intricate characteristics of bio-composites. For instance, the potential of natural filler, namely walnut shell powder as a biodegradable filler in PLA concluded that particulate shell fillers introduce a rigid interphase that significantly alters the glass transition characteristic. 17 Another study 18 established that the large filler loading significantly alters the thermal transition temperatures of the PLA matrix, a phenomenon needing a careful study of the crystallization behavior. The results suggest that the loading of fillers is a stiff constraint on polymer chains, which influences the glass transition temperature as well as dimensional stability of the molded part. In addition, application of statistical optimization methods, such as the Design of Experiments (DOE), has proved to be fundamental to establishing a defined processing window for PLA composites. The need for statistical process control is established, where it was demonstrated that the narrow processing window of PLA needs to be subject to multi-variable optimization. 19 Bringing together these established methodologies, this study now extends this optimization framework to the injection molding process by isolating the thermal evolution and density variation of the composite.
While the research on agro waste valorization is ongoing, some agro-wastes such as pistachio shell powder (PSP) are still underutilized. Pistachio shells contain lignocellulosic fibers with high contents possessing better thermal stability. They possess the ideal properties for being excellent reagents for reinforcement in nanocomposites, providing structural stability at the expense of reducing thermal stress. 20 Other studies have explored the PSP behavior in thermosetting matrices such as epoxy,21,22 there has been rather little research on bringing PSP into bio-based thermoplastic systems. Addressing this sector might reveal a whole new realm of potential when it comes to the design of fully sustainable, biodegradable composite materials. 23 This work aims at bridging this gap by investigating the feasibility of pistachio shell powder as a biosourced filler in thermoplastic composites. The originality of the present investigation relies on the valorization of waste PSP, which is not widely used, while simultaneously optimizing the most significant input parameters: filler loading and injection molding conditions. In addition, the research explores the interaction effects of these parameters on the physical and thermal properties of the composite, providing worthwhile insight into process-performance and material behavior relationships. Even though the same material system and general processing methodology have been used as in the previous study, 24 the research theme differs in its essential features. The previous work was primarily focused on elaborated analysis of the mechanical strength properties’ optimization of pistachio shell–filled PLA composite materials. In contrast, this study is towards a systematic investigation of how the filler and variation in processing conditions influences a broader range of composite properties which include bulk density, glass transition behavior, cold crystallization phenomena, and melting characteristics. These properties are essential in describing composite processing reliability in addition to providing an understanding beyond just composite strength properties. With an emphasis on these parameters, the present work provides a complementary view to the previous study and contributes to a better understanding of the thermal performance of composite. Lastly, by converting agricultural residues into high-strength green composites, the research facilitates the twin goals of waste reduction and material design innovation. It is a reflection of how sustainability and technology unite to establish the means of clean and green production and assist the world towards a circular economy. This study advances the research on green composites and illustrates the extensive range of applications agro-waste offers in developing sustainable materials for various industrial needs.
Materials and Methodology
The experimental study materials and various test procedures have been succinctly summarized in this section. Figure 1 shows the research methodology for the current study. Flow chart of the present experimental study.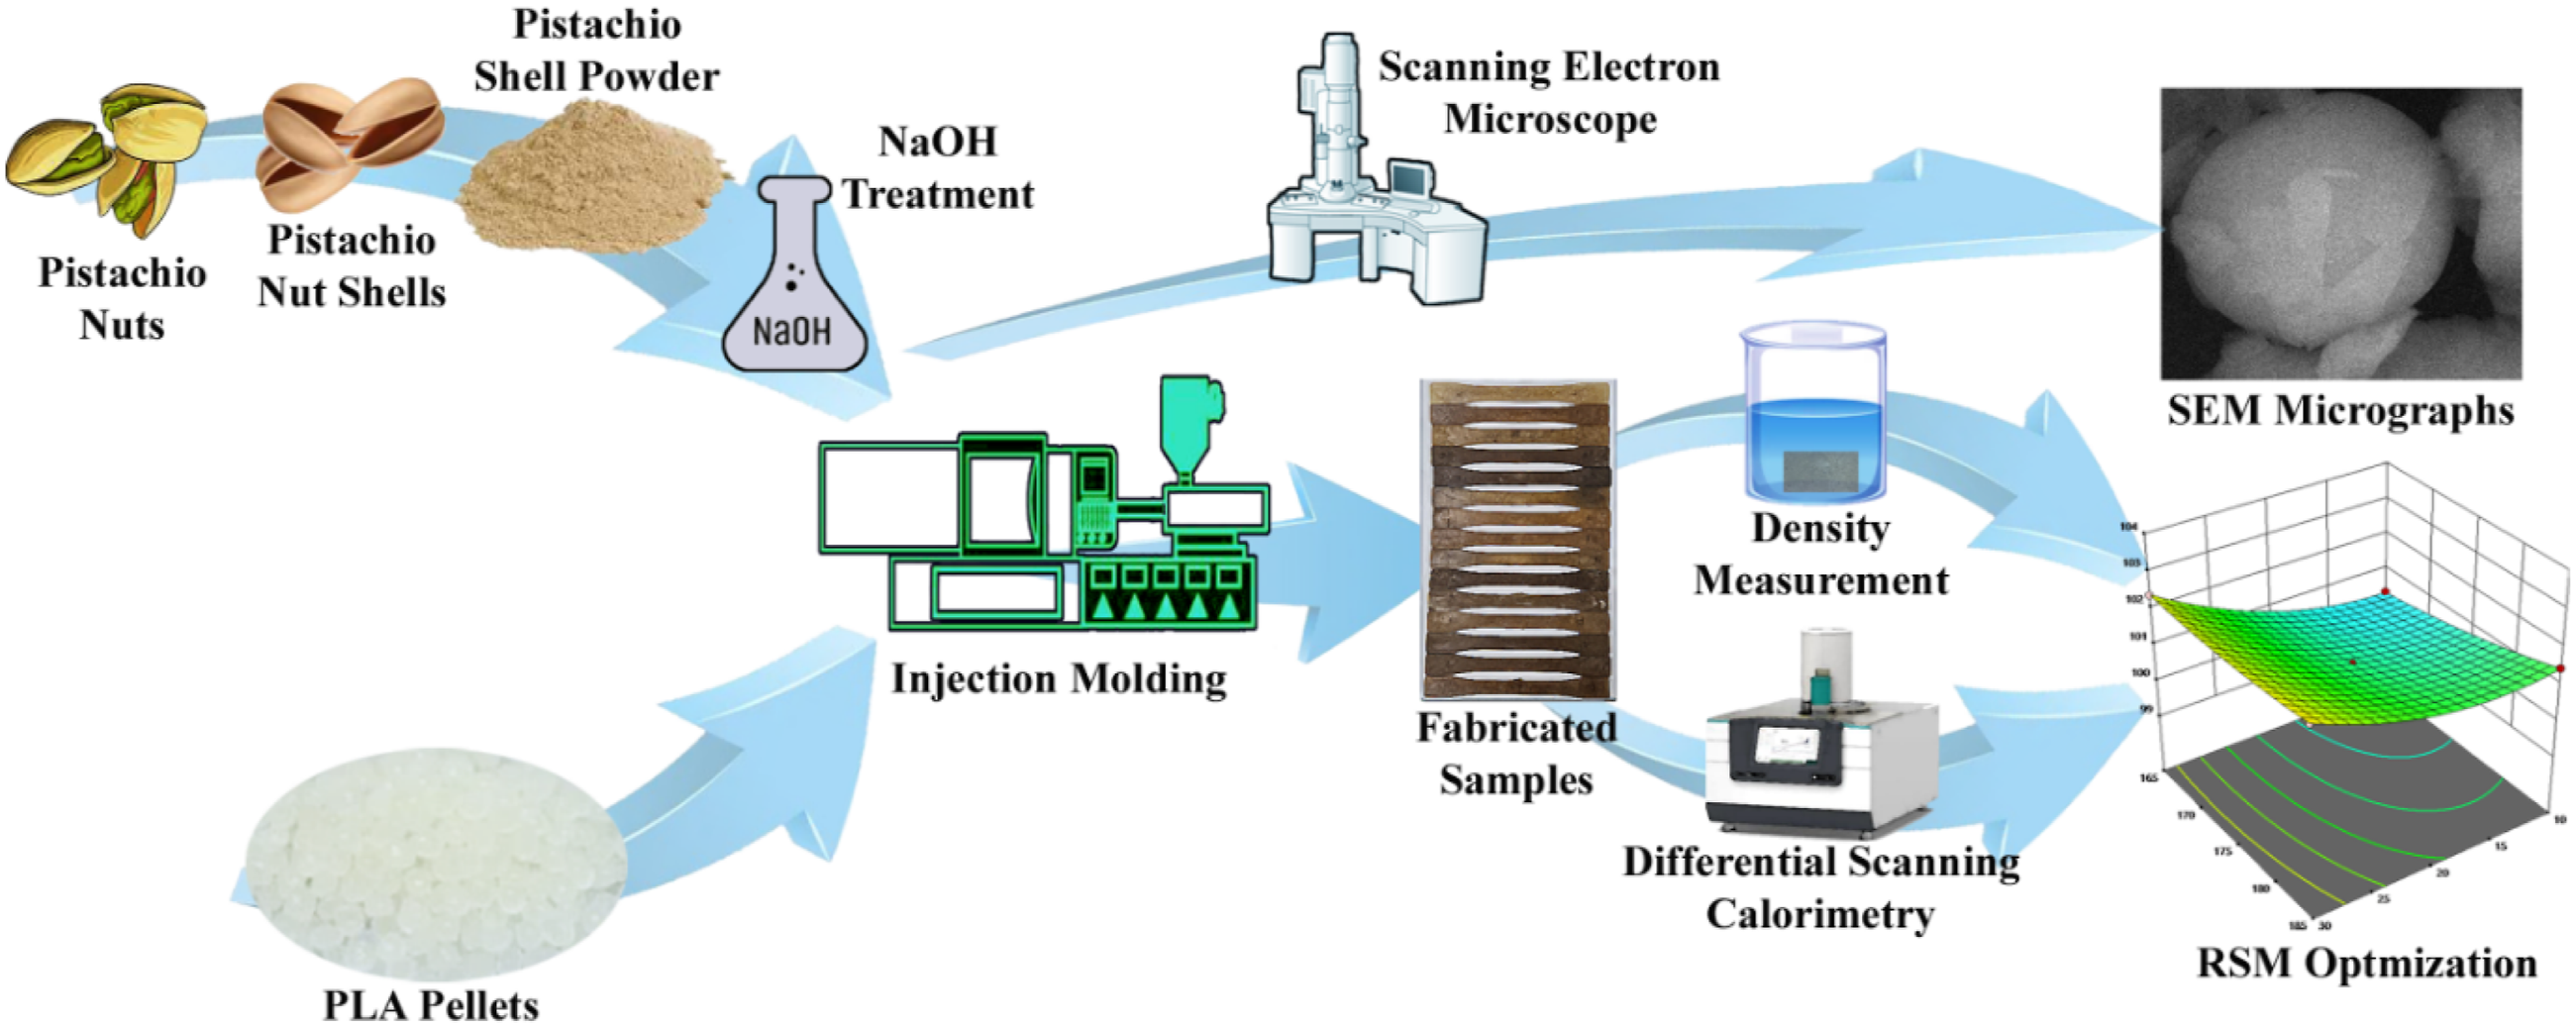
Resin and Filler
In the present investigation, polylactic acid (PLA) was utilized as the matrix material. PLA is a biodegradable thermoplastic polymer obtained from renewable resources and was purchased from Natur Tec India Pvt. Ltd. It is found to be extremely sustainable and has good processing traits. The polymer has a glass transition temperature ranging from 50°C to 60°C and a melting temperature ranging from 145°C to 180°C, and hence it can be used for fabricating thermoplastic composites.
Pistachio shells, employed as the bio-filler in the composite material, were taken from a nearby marketplace. For purity and to eliminate any contaminant, the shells were subjected to a multi-step cleaning procedure. The shells were first soaked in distilled water for 3 hours followed by careful washing to remove surface dirt. Thereafter, the shells were subjected to a 5% w/v NaOH solution for 1 hour for removal of waxy material and residual surface impurities. The shells, after chemical treatment, were sun-dried for 10 days for complete moisture evaporation. The shells were ground and milled into fine powder after drying to obtain pistachio shell powder (PSP). To ensure a consistent particle size distribution, the ground lignocellulosic material was sieved through mesh sizes ranging from 20 to 100 μm mesh to offer uniformity for all the experimental samples.
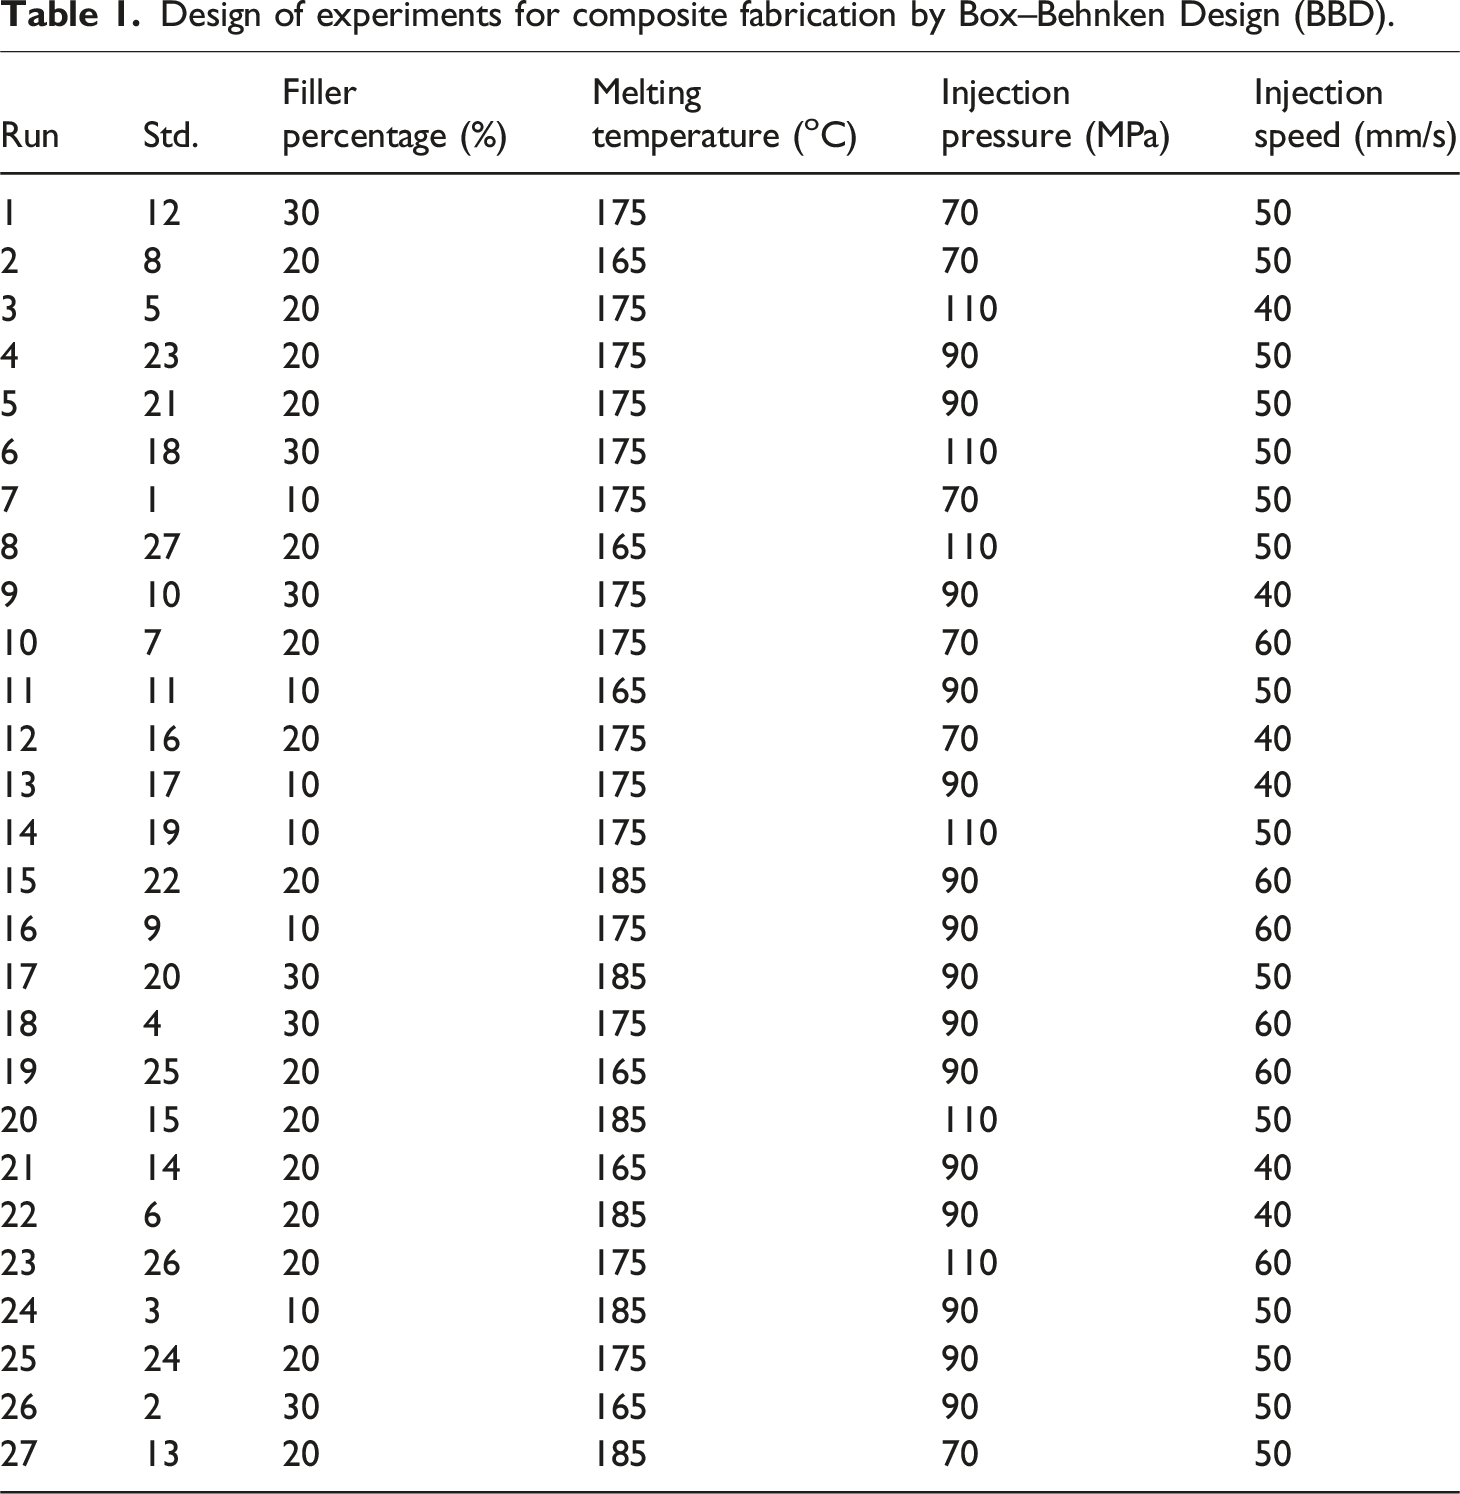
Design of Experiments with RSM
RSM was used in an attempt to design and methodically evaluate the manner in which different input parameters influenced the composite properties. It is an efficient instrument for modeling, analyzing, and optimizing processes in complex systems in mathematics and statistics. Although it requires resources, it investigates the interactions of multiple variables with minimal experimental trials. This method helps develop an empirical model describing the interaction among input variables and response results of interest so as to optimize best process conditions. The method allows for the graphical representation of interaction effects of process parameters and predicts the system’s behavior on the alteration of operating conditions.
Design of experiments for composite fabrication by Box–Behnken Design (BBD).
Fabrication of Composites
The PLA/PSP (pistachio shell powder) composites were fabricated with a 50-ton servo-controlled hydraulic injection molding machine. The processing conditions, especially the barrel temperature, were precisely controlled in accordance with the experimental design to provide the best possible processing conditions for each trial. While molding, PLA pellets and PSP filler were introduced directly in the injection molding machine hopper.
The molding process was performed with a 20-g shot weight and around 2 seconds of a cycle time. These conditions were chosen for the purpose of maintaining even dispersion of the filler in the polymer matrix and to avoid degradation of the PLA resin during processing. In order to identify the best formulation and processing conditions, a set of experimental runs were carried out. Such trials entailed systematic variation of the filler weight percentage (w/w), along with the most important injection molding parameters, according to the experimental matrix set by the Response Surface Methodology. The composite samples produced were then characterized to assess the impact of process variables on material performance.
Physical Properties
Density is one of the most important properties of materials, which refers to mass per unit volume. In injection-molded composites, density testing is essential to evaluate quality, strength, and performance. Density determines mechanical properties including strength, stiffness, and durability. Testing thus ensures that the composite is up to specified standards and performs its best in the intended application.
The composite sample is weighed on a precision balance, usually to 0.001 g. Then, the sample is submerged in water in order to measure the volume in terms of displaced fluid. The displaced water volume is equal to the sample’s volume, and it is determined by using a graduated cylinder.
After both mass and volume are established, density is determined by using the formula:
Where, ρ is for Density (in g/cm3), m is for mass (in g), and V is for Volume (in cm3)
Thermal Characteristics
The composite specimens that were fabricated were tested using Differential Scanning Calorimetry (DSC) with the aim of assessing the influence of input parameters on the glass transition temperature (Tg) and melting temperature (Tm) of the composite materials. The technique allows for the detection of thermal transitions with high accuracy and provides useful information regarding the stability and thermal behavior of the produced composites. DSC analysis focuses on the influence of fillers and machining parameters on the overall thermal characteristics of the materials by analyzing certain thermal events, e.g., glass transition and melting temperatures. The experiments were carried out on SHIMAZDU DCG-60.
Results and Discussion
Surface Morphology
SEM was employed in the study of the surface morphology of the natural filler at resolutions between 5,000X and 20,000X to identify the geometry of its particles and their microstructural features. From the SEM images shown in Figure 2(a)–(c), it is seen that, in essence, the particles of this filler are spherical to sub-spherical in nature, possessing surfaces which are relatively smooth and continuous. Some isolated platelet or flake-like entities are also found on the surfaces of the particles, probably arising from the inherent crystalline growth habits or morphological diversities of the source material in nature. Correspondingly, the size of these particles lies within the range of approximately 3-10 µm, featuring the micron-scale dimensionality required for applications as functional additives or reinforcing elements in composite materials. The tendency toward particle agglomeration can also be evidenced, mainly in lower magnifications. Such a phenomenon may be explained by van der Waals forces or surface-retained moisture, quite common in natural particulate matter. The filler exhibits a highly wrinkled, folded sheet-like structure with thin lamellae and significant overlap at higher magnification, indicating both layered structure and high specific surface area. The mixture of spherical and irregular fillers is most likely to affect the surface area, packing density, and interfacial adhesion upon blending into polymeric or ceramic matrices. SEM Micrographs of Pista shell filler.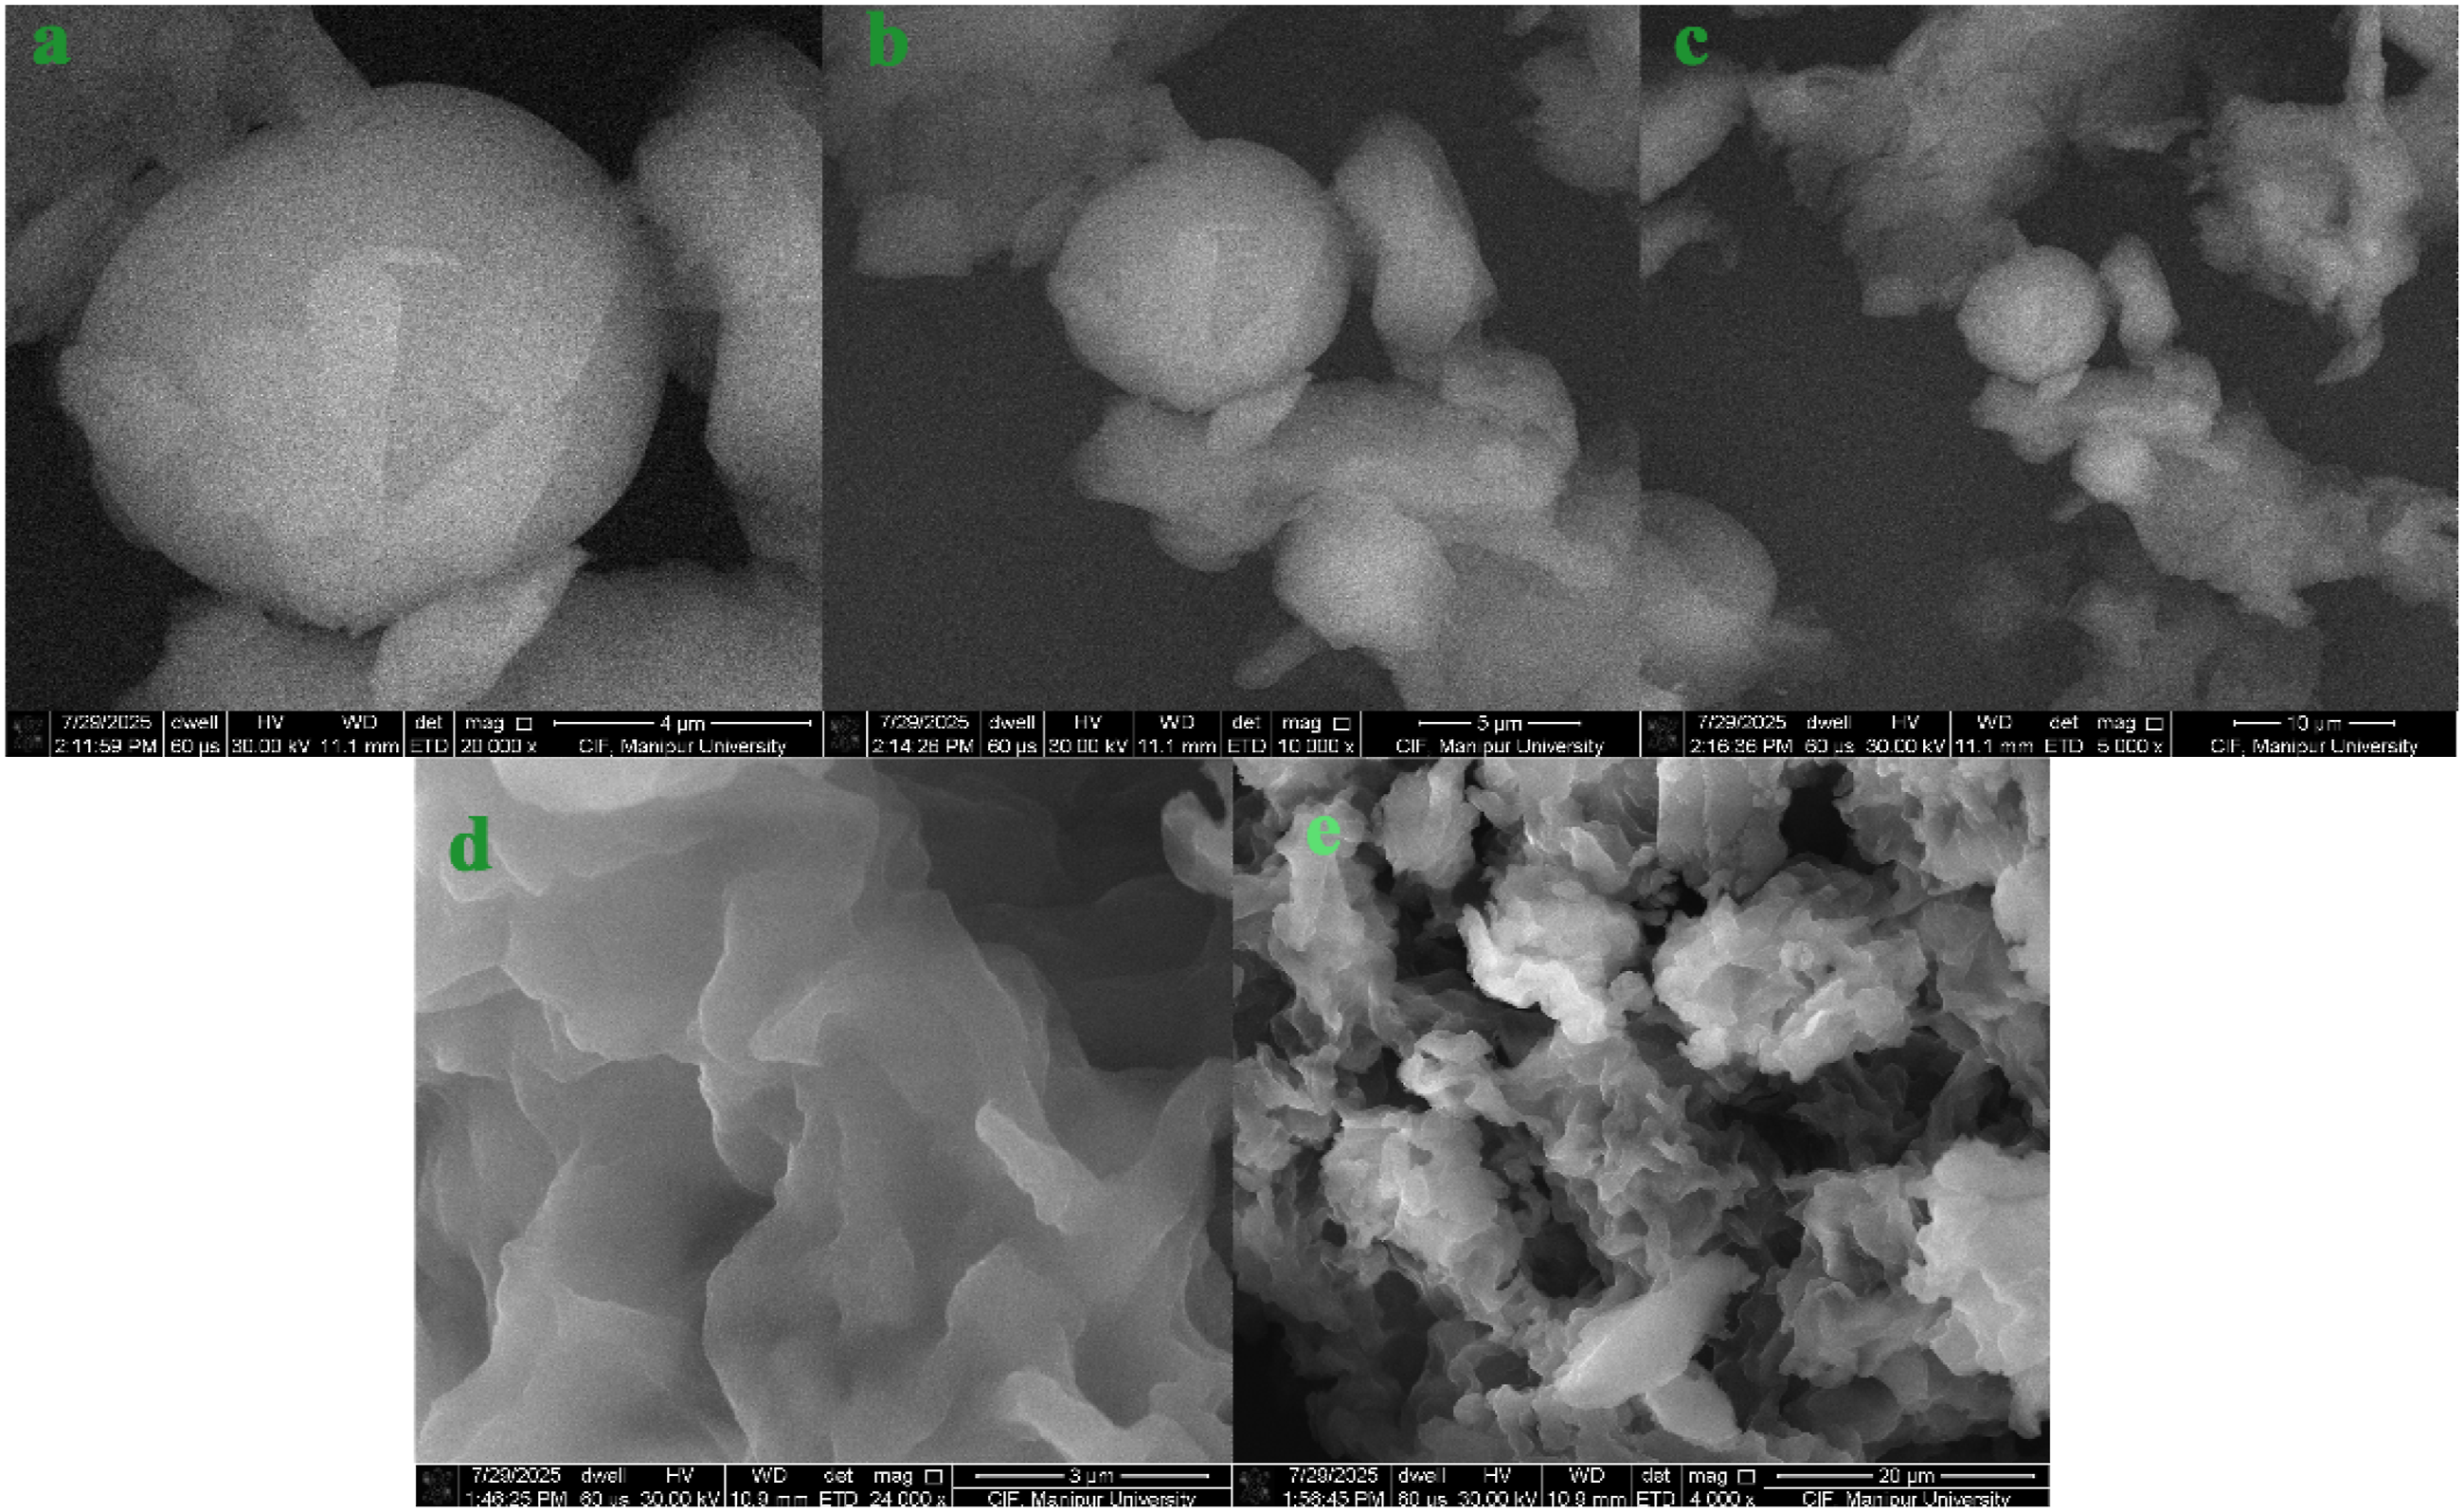
The SEM micrographs in Figure 2(d)-(e) are at 24,000x and 4,000x magnifications, respectively. The surfaces look smooth but are actually corrugated and wrinkled with a clear elasticity that may delaminate on preparation. At lower magnifications, the filler particles look as irregular aggregates consisting of piled-up, crumpled sheets that form a very open porous structure with huge voids in between clusters. A hierarchical surface architecture is caused by this multi-scale texture, which is characteristic of natural fillers and consists of coarse aggregates and fine lamellar sheets. These morphological characteristics are beneficial for composite reinforcement since the rough and porous surfaces promote mechanical interlocking and interfacial adhesion to polymer matrices. Thus, the glass transition temperature is strengthened with rising filler and pressure, but the intermediate phase is a bridge where materials move from hard to softer in character. On the whole, the SEM examination attests that the natural filler has a well-characterized and morphologically different microstructure, and has a highly complex, layered structure with strong surface roughness and porosity, altogether which would play an important role in the improvement of mechanical, thermal, and physicochemical performance in composite formulations.
Determination of Input Parameter Effects on Density of Composites
ANOVA Table for Density of composites.
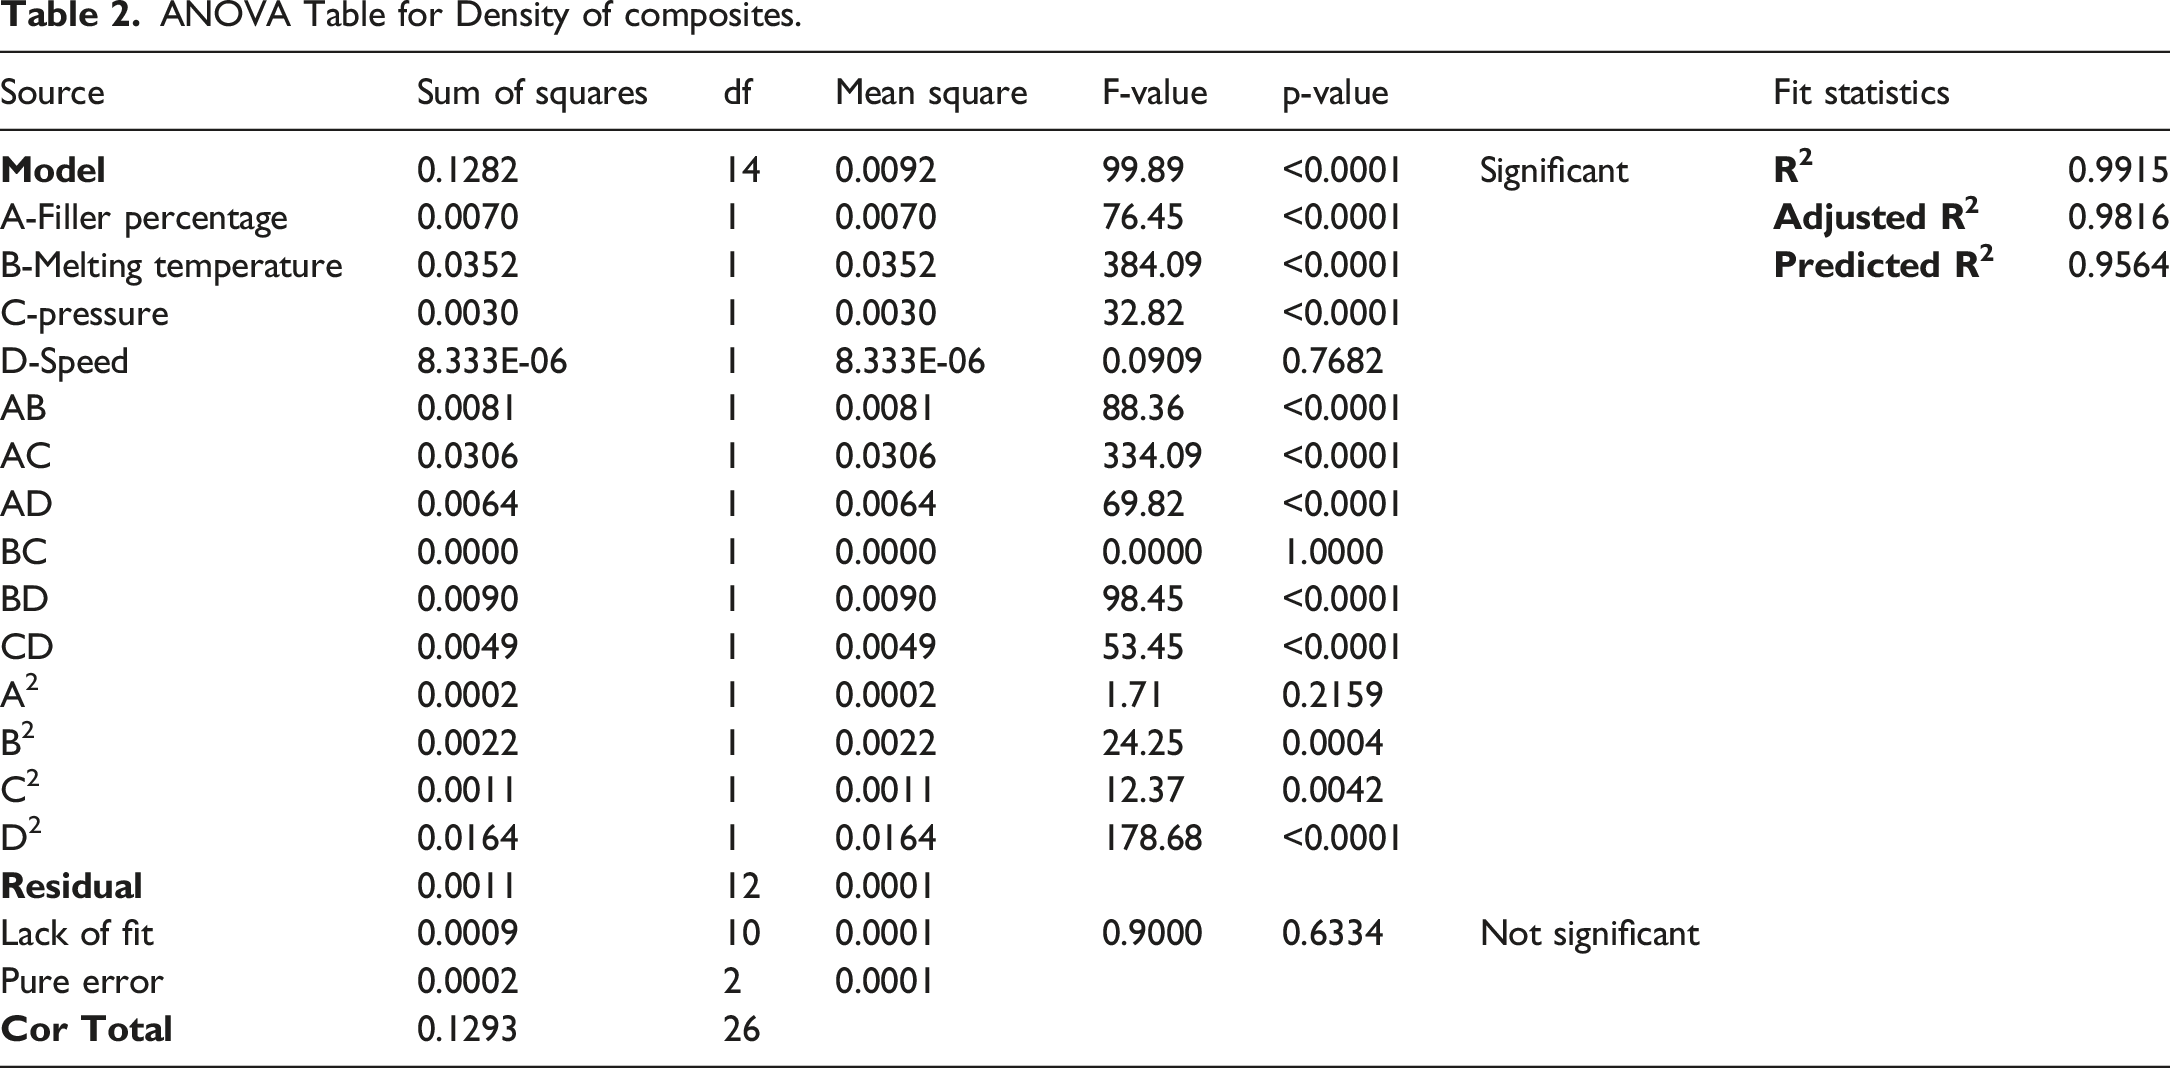
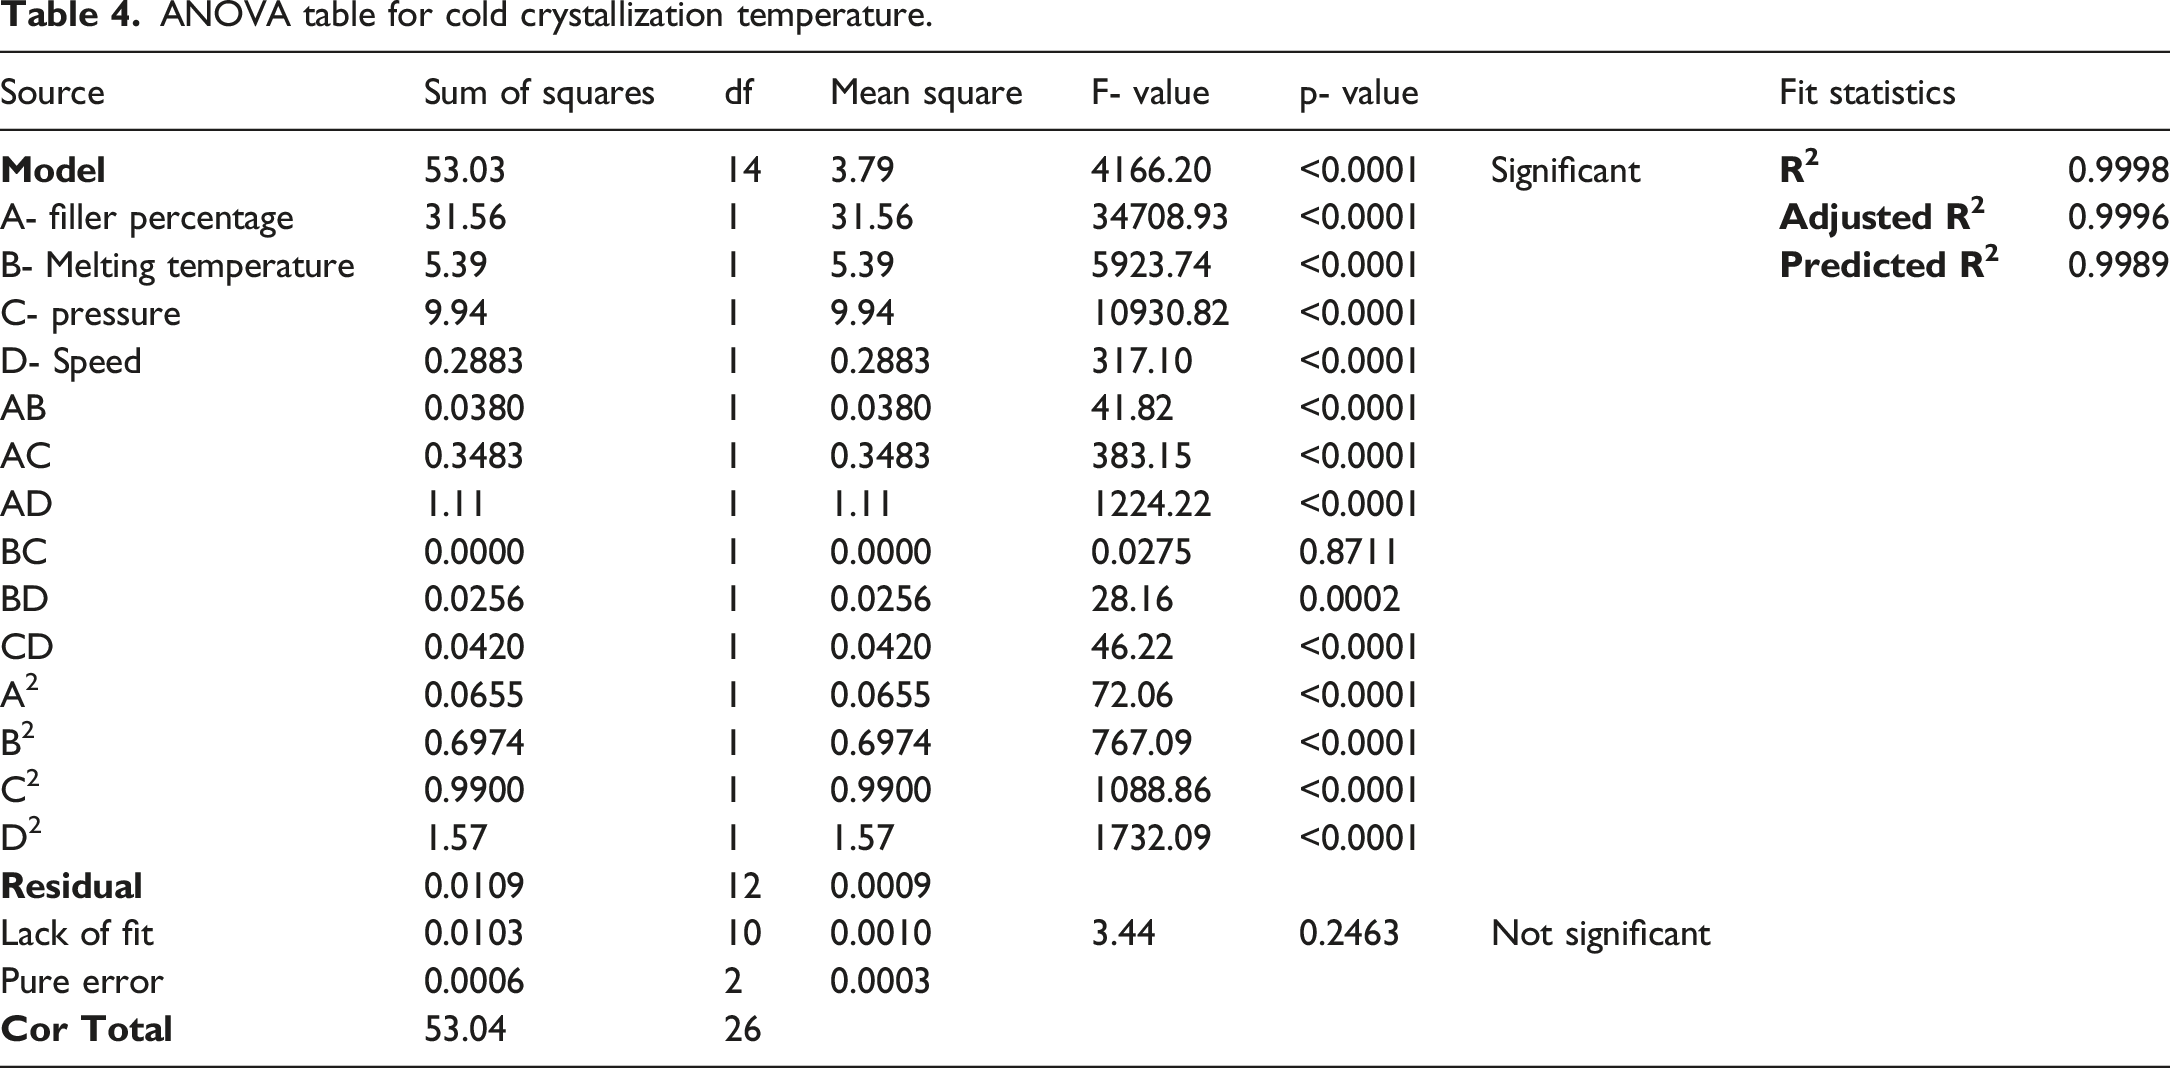
The coloured 3D surface (Figure 3) are representations of various density values, employing a gradient in which the colours change from cooler (like blue and green) to warmer (like yellow). Cooler colours usually represent lower density values, while the warmer hues represent higher density. The surface slopes and curves visibly, showing how the variations in the input variables influence the density. Regions of higher density are indicated by yellow and light green colours, implying that these regions relate to the best conditions for achieving maximum density. Underneath the 3D surface, on the grey base plane of the plot, there is a two-dimensional contour plot. This section of the visualization plots the 3D surface down so the density response is displayed top-down. The contour lines join points on the surface with identical density value, similar to elevation lines on a topographic map. Each line indicates a constant density, and the spacing between these lines gives further information on how rapidly density varies with changing percentages of filler and melting temperatures. When the lines are far apart, it means that the slope is steep, or that even slight variations in input values cause large variations in density. When the lines are close together, the variation in density is gradual. 3D interaction graph between Filler percentage and melting temperature for density.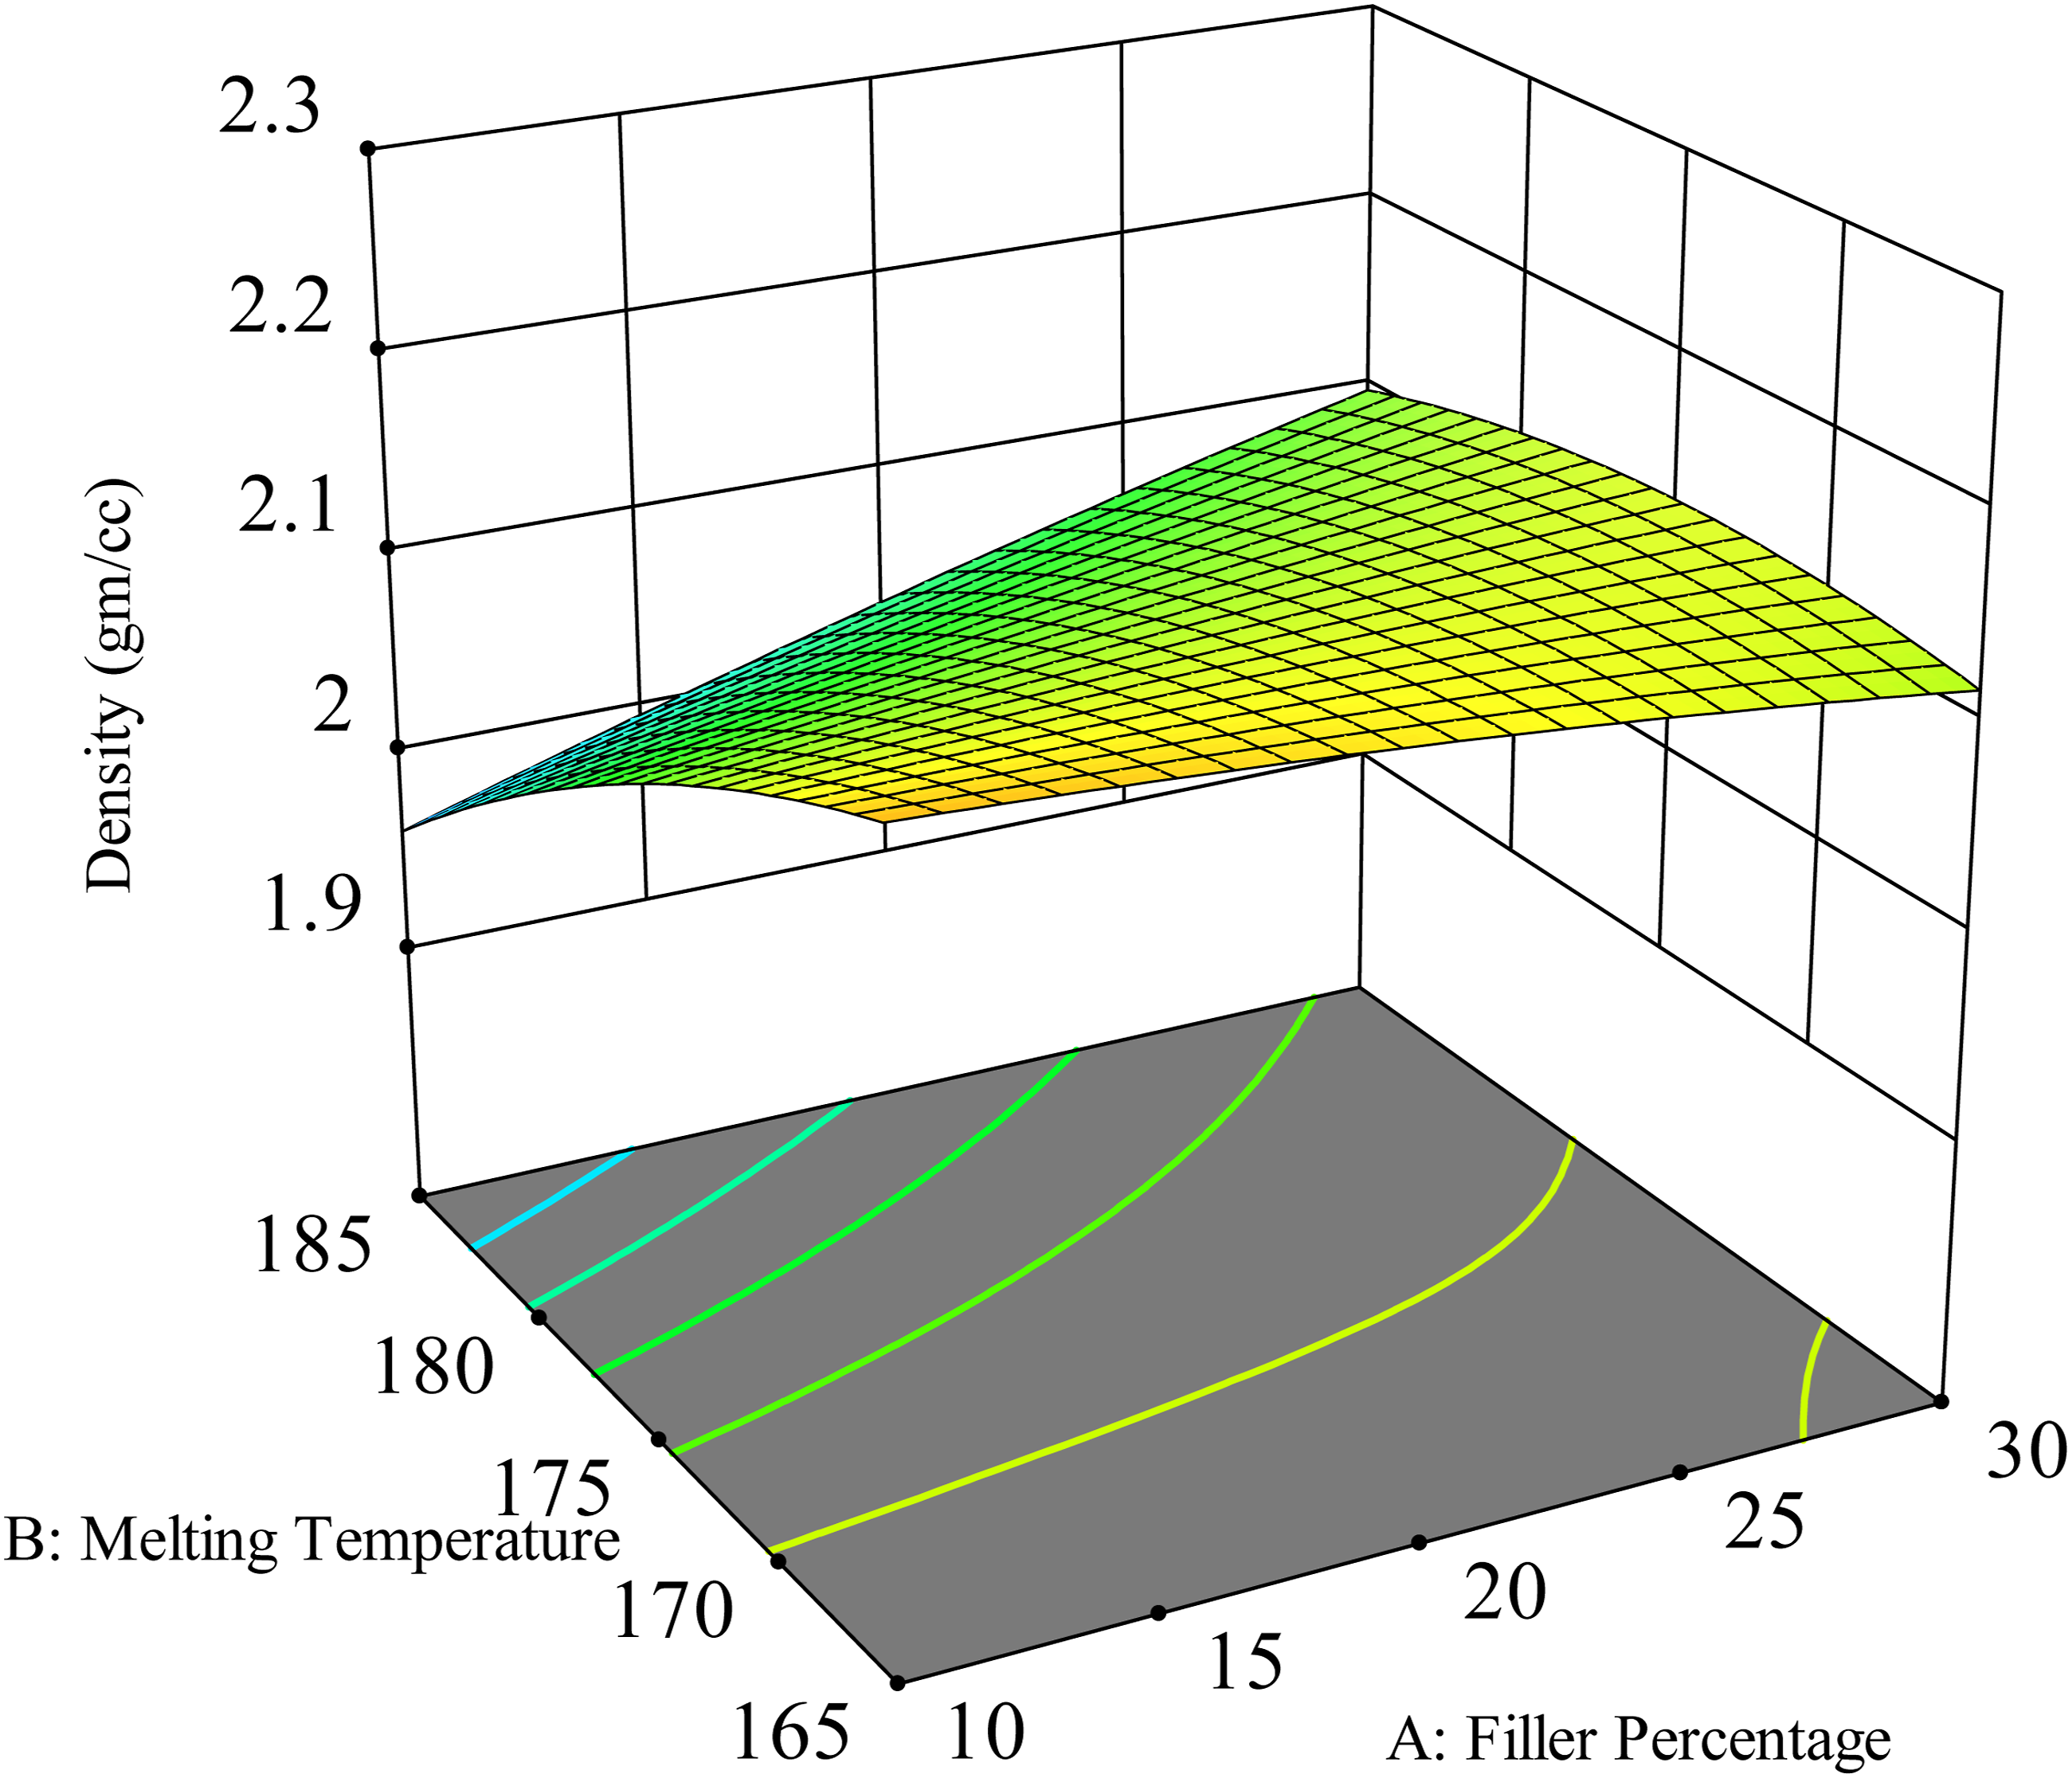
The shape of the surface and the organization of the contour lines tell us about the character of the relationships between the variables. Raising the Filler Percentage from 10% to 30% produces an unmistakable rise in density, which suggests that filler loading has a positive impact on density. In contrast, raising the Melting Temperature from 165°C to 185°C seems to decrease the density or maintain it at a constant rate at lower levels of filler. This implies that, although increased filler content increases the density, increased processing temperatures might negate that advantage, possibly as a result of matrix degradation or alteration in compaction. Surface curvature and the irregular spacing of contour lines also suggest the interaction between the two factors, which means they do not act independently but interact. This interaction effect reveals that the effect of the percentage of filler on density is a function of the melting temperature and vice versa. For example, added content of filler could result in a higher percentage increase of the density at low melting temperature, while such an increase could be less effective or even negative at high temperature. These complex interactions are important to develop when trying to optimize material properties. The composite density was seen to increase with the addition of fillers by different researchers. 12
In short, this response surface plot simply displays the way the density of a material system varies based on filler percentage levels and melting temperature levels. It reveals that, whereas increased filler content tends to increase density, rising melting temperature can result in decreasing returns or even decreases in density. The surface also indicates that these two variables are dependent, and the best combination for attaining the highest density seems to exist at increased filler percentages and decreased melting temperatures.
Determination of Input Parameter Effects on Thermal Characteristic
The thermal behavior of semi-crystalline polymer systems can be considered as a major source of information about their molecular organization, processing history, and structure property relationships. Glass transition temperature ( DSC curve of pista shell filler – PLA composite.
The cold crystallization temperature (
In semicrystalline PLA systems, two characteristic endothermic peaks have been commonly detected and defined as
When α′ and α domains coexist in the same crystalline system, overlapping melting events occur, which are frequently seen in the 140-150°C range. The distribution of lamellar thickness, the degree of structural ordering brought about by processing conditions, and the ratio and separation of
Determination of Input Parameter Effects on
T
g
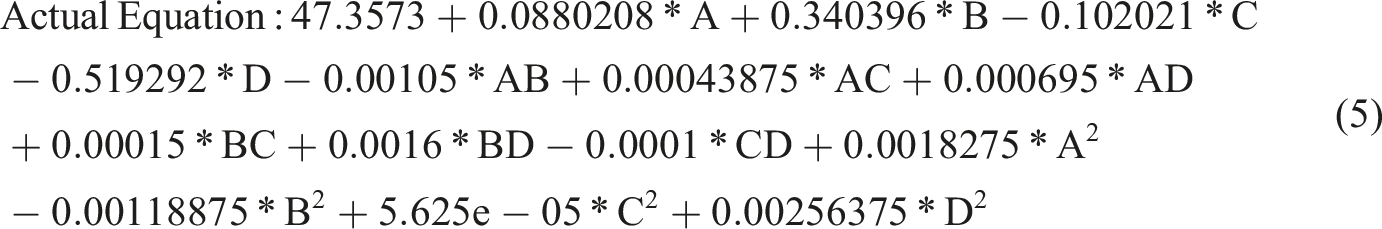
ANOVA table for glass transition temperature.
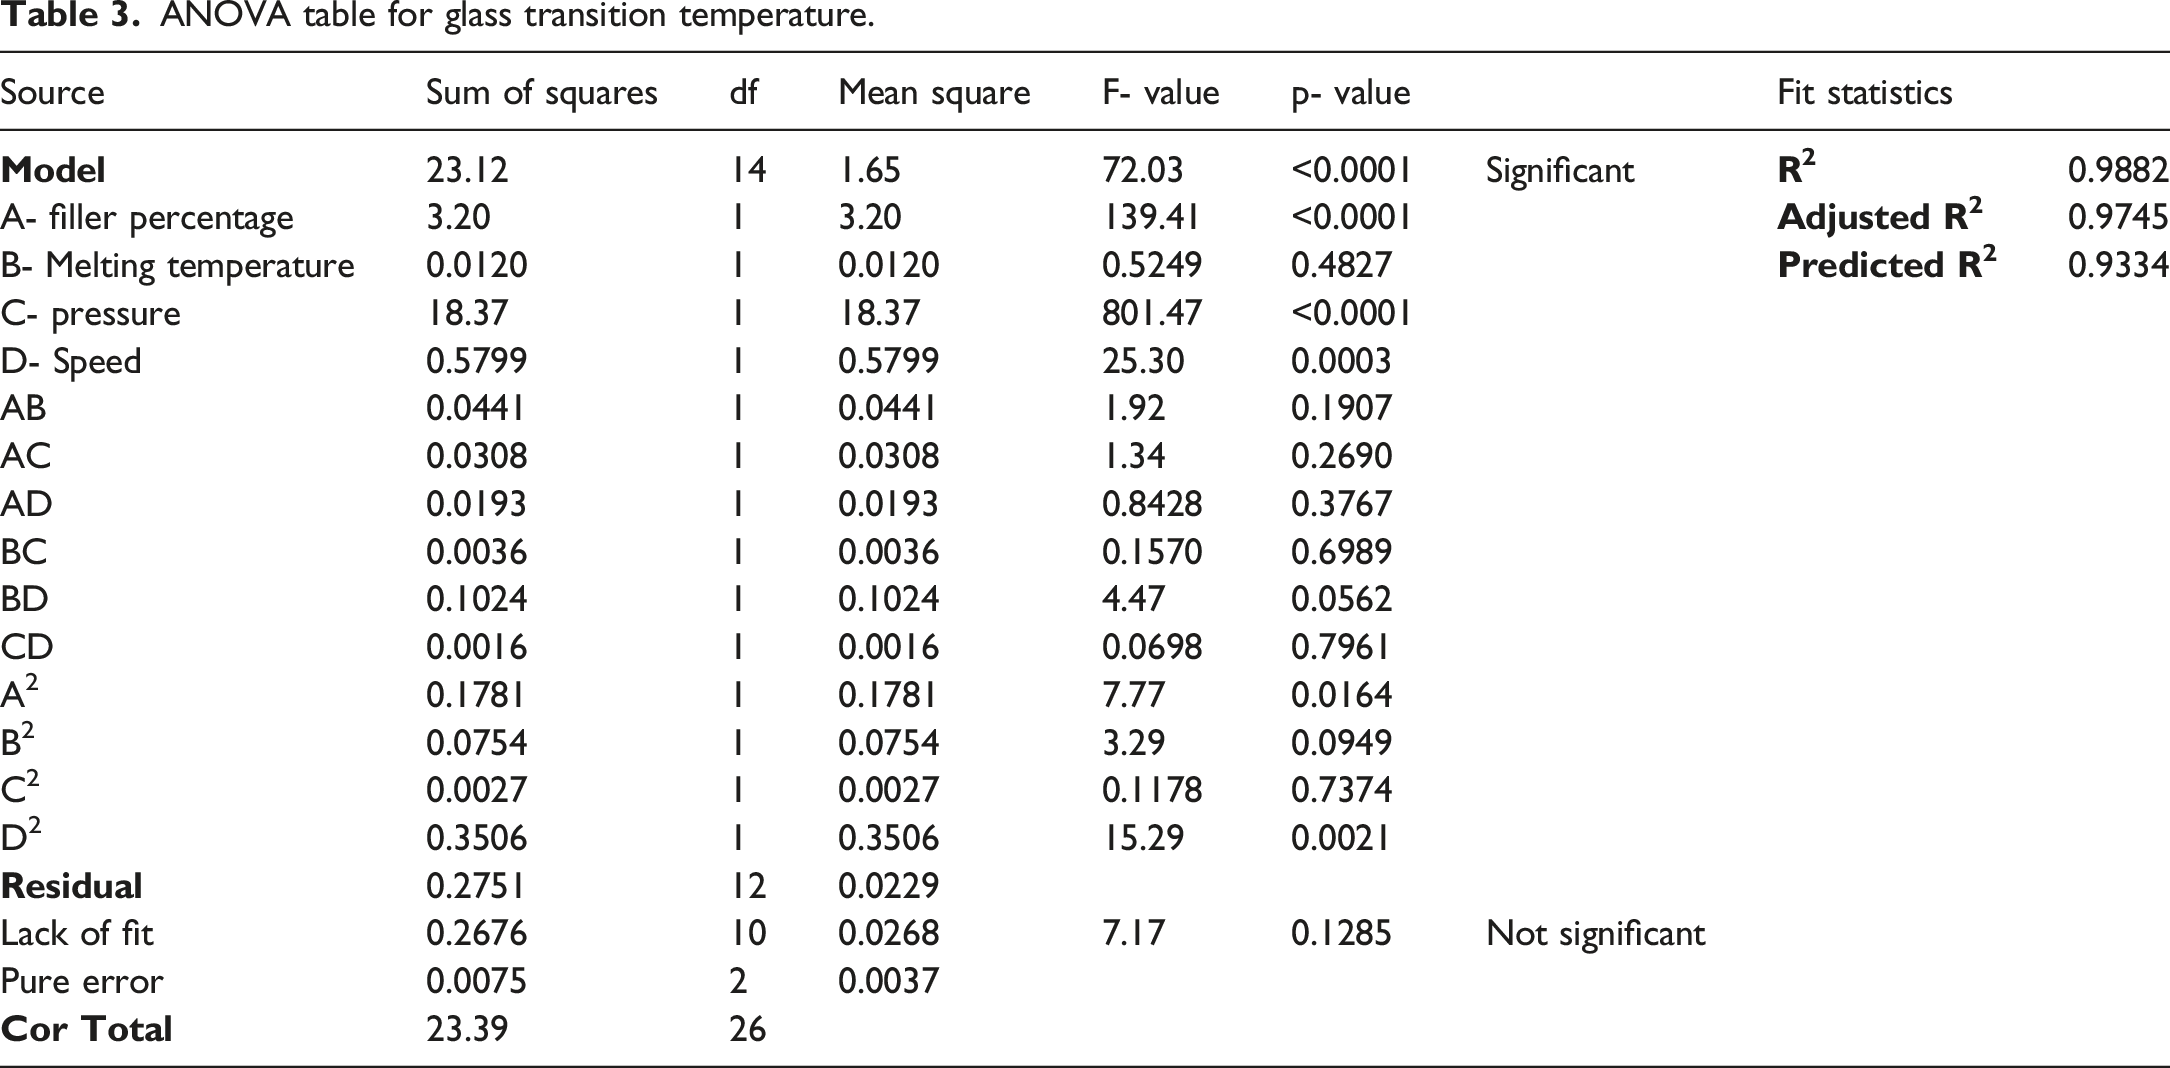
A three-dimensional illustration demonstrating the way the two primary influencing factors-pressure and filler percentage, interact with the glass transition temperature is shown in Figure 5. This picture goes beyond the elements of the interaction and provides insight into how these parameters affect the composite’s overall thermal behaviour. The impact of filler percentage on the X-axis and pressure on the Y-axis on the glass transition temperature on the Z-axis is shown in this three-dimensional surface plot. The gradient transitioning from blue (low Tg) to orange (high Tg) indicates that the glass transition temperature has increased, at least slightly, as a result of the simultaneous increases in filler percentage, at lowest value of pressure. The impact of filler percentage on the composite glass transition temperature could be seen from the 3D surface plot. At the three stages, the glass transition temperature increases by 1°, which is comparatively very slight. This pattern suggests that fillers contribute to improving the composite’s thermal stability. A further decrease in molecular mobility within the matrix is indicated by this temperature increase with the addition of filler, which ultimately leads to improved thermal performance. These results are still very important for maximising the amount of filler used to create composite materials with certain thermal characteristics. Depending on the filler material, different researchers have reported slight variations in the glass transition temperature of composites, either increasing or decreasing. These consist of their compatibility with the matrix, size, shape, and chemical makeup. While some have the capacity to reduce Tg because they enhance the molecular motion of the fillers, others with a higher degree of thermal stability will contribute to higher Tg because they are likely to decrease polymer molecular motion.28–32 3D interaction graph between Filler percentage and pressure for glass transition temperature.
Determination of Input Parameter Effects on
T
cc
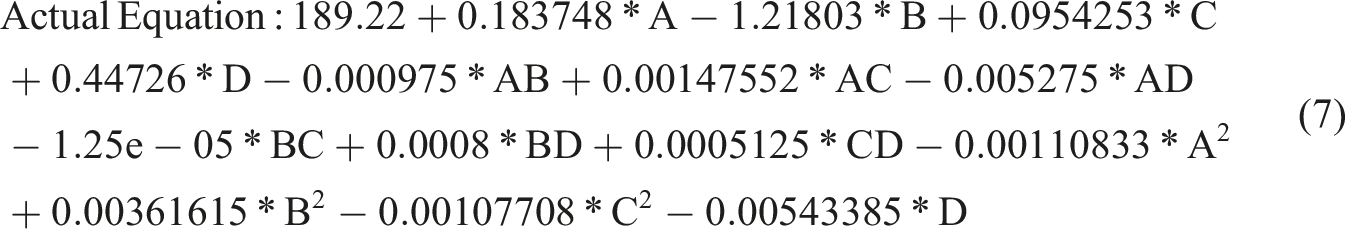
ANOVA table for cold crystallization temperature.
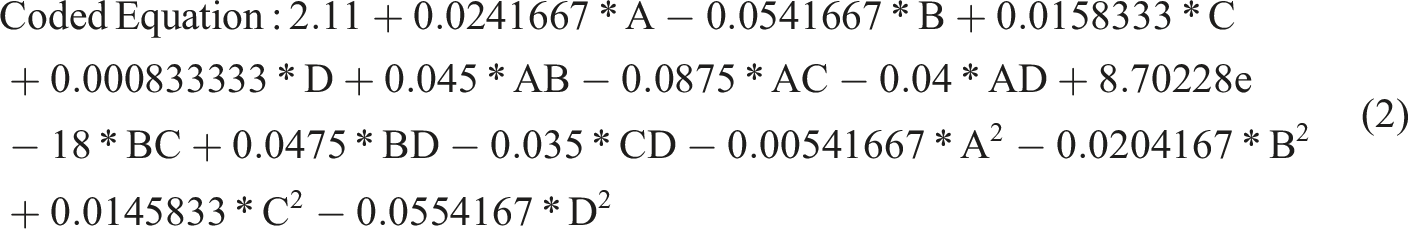
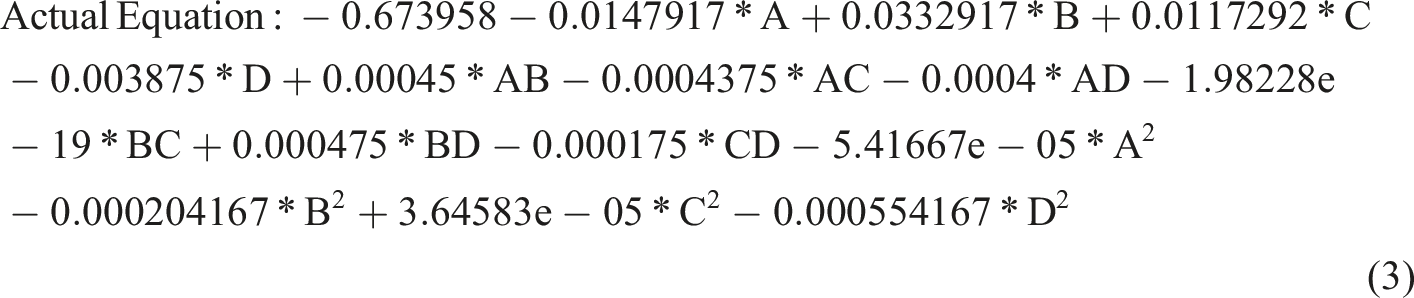
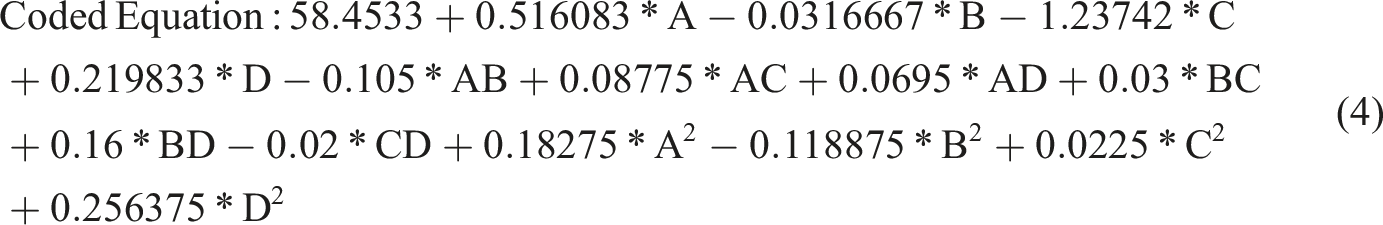
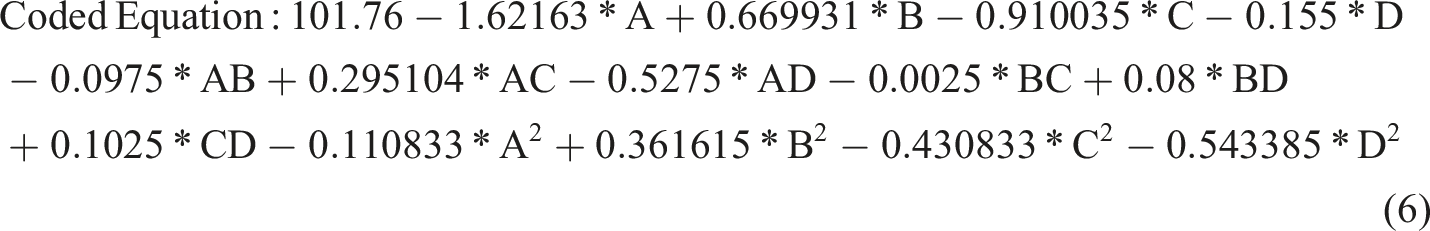
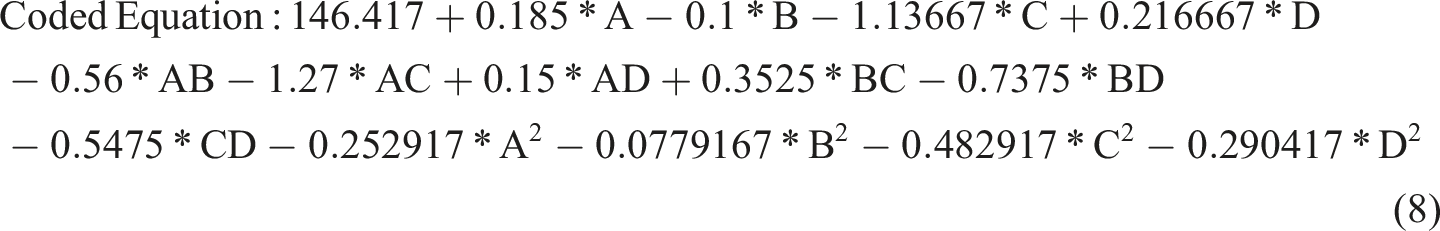
The model terms A, B, C, D, AB, AC, AD, BD, CD, A2, B2, C2, D2 are found to be significant model terms (values lesser than 0.1000), while filler percentage and pressure can be seen to be the most influencing input parameters. Equations (6) and (7) represents the coded equation and actual equation for the model. It can be noted from the coded equation that most of the terms, namely A, C, D, AB, AD, BC, A2, C2and D2 are showing a negative or reducing trend on the output parameter.
The three-dimensional response surface plot (Figure 6) provides a clear visual representation of how the independent variables jointly influence the response variable. In this plot, the curved surface represents the predicted response across different combinations of factor levels, allowing the identification of optimal conditions within the experimental range. The gradient and curvature of the surface imply a quadratic trend for the relationship of the factors and response, which is other than a linear relationship. Such curvature in the surface means that both main effects and their interactions are significant. Maximum or minimum points on the surface correspond to regions where the response reaches a maximum or minimum value, respectively, reflecting possible optimal conditions of the process. 3D interaction graph between filler percentage and pressure for cold crystallization temperature.
The contour plot, which is projected underneath the 3D surface, provides a two-dimensional view that supplements the surface visualization. Contours connect points of equal response; elliptical shapes indicate important interactions between the factors studied, meaning that for one variable changing, the response changes based on the level of the other. Smooth and well-spaced contours represent a region of stability in response, while packed contours indicate steep change and thus sensitivity of the response to variation in the factor. These plots together not only confirm the adequacy of the model in capturing the factor interactions but also serve as a powerful tool for visual optimization and interpretation of process behaviour. Statistically, the model exhibits a very high degree of reliability and reproducibility. The F-value of the model was found to be 4166.20 with a p-value less than 0.0001, and hence the regression model is highly significant. This confirmed that the variation in response was well explained by the fitted model rather than random error. The respective significant terms are A, B, C, D, AB, AC, BC, BD, CD, A2, B2, C2, and D2, showing both linear and quadratic components make significant contributions to the determination of the response.
The addition of natural fillers to PLA composites significantly affects the cold crystallization process of the polymer, which mainly changes the cold crystallization temperature, Tcc. Such influence is, in fact, related to the balance between two competing influences: one that favors heterogeneous nucleation and one that restricts chain mobility. The influence of the former, heterogeneous nucleation, almost usually predominates due to the introduction of a great number of solid interfaces with high surface area into the PLA matrix. These surfaces act as energetically favorable sites for crystal initiation, enabling the formation of ordered structures at a lower thermal driving force than required for homogeneous nucleation in neat PLA. As a result, the cold crystallization peak observed in Differential Scanning Calorimetry (DSC) analyses shifts toward a lower temperature, indicating that the presence of the filler effectively accelerates the crystallization kinetics. However, this nucleation-driven decrease in
Determination of Input Parameter Effects on
T
m1
ANOVA table for lower melting temperature.
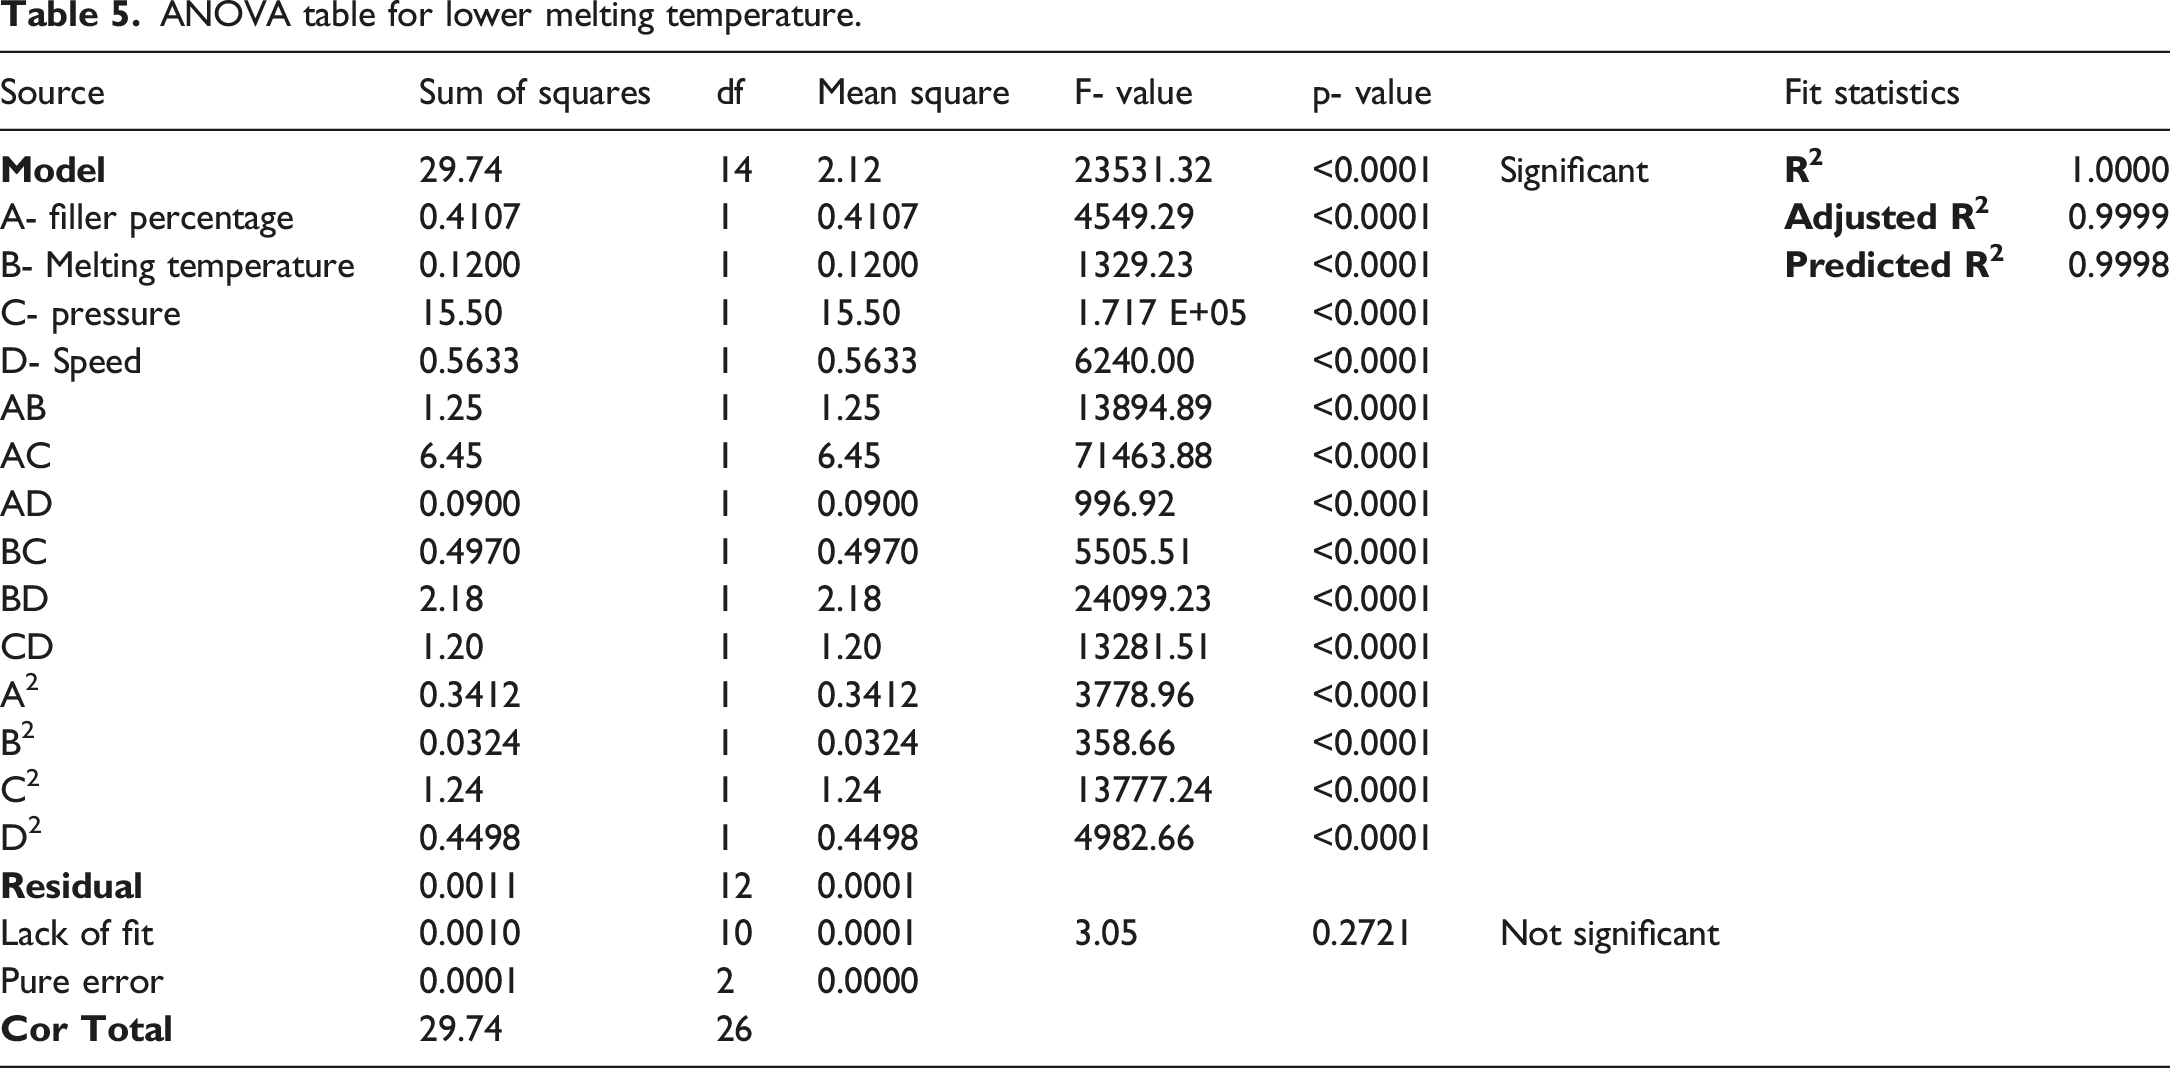
The Lack of Fit F-value of 3.05 and a p-value of 0.2721 indicate that the lack of fit is not significant relative to the pure error, confirming that the quadratic model provides an excellent fit to the experimental data. Such a non-significant lack of fit is desirable, as it implies that the residual variation is primarily due to random experimental error rather than systematic model inadequacy. The model also exhibits strong statistical performance, with a high Predicted R2 value greater than 0.9, all in close agreement.
The three-dimensional response surface plot (Figure 7) illustrates the combined influence of the most influential parameters on 3D interaction graph between pressure and speed for lower melting temperature.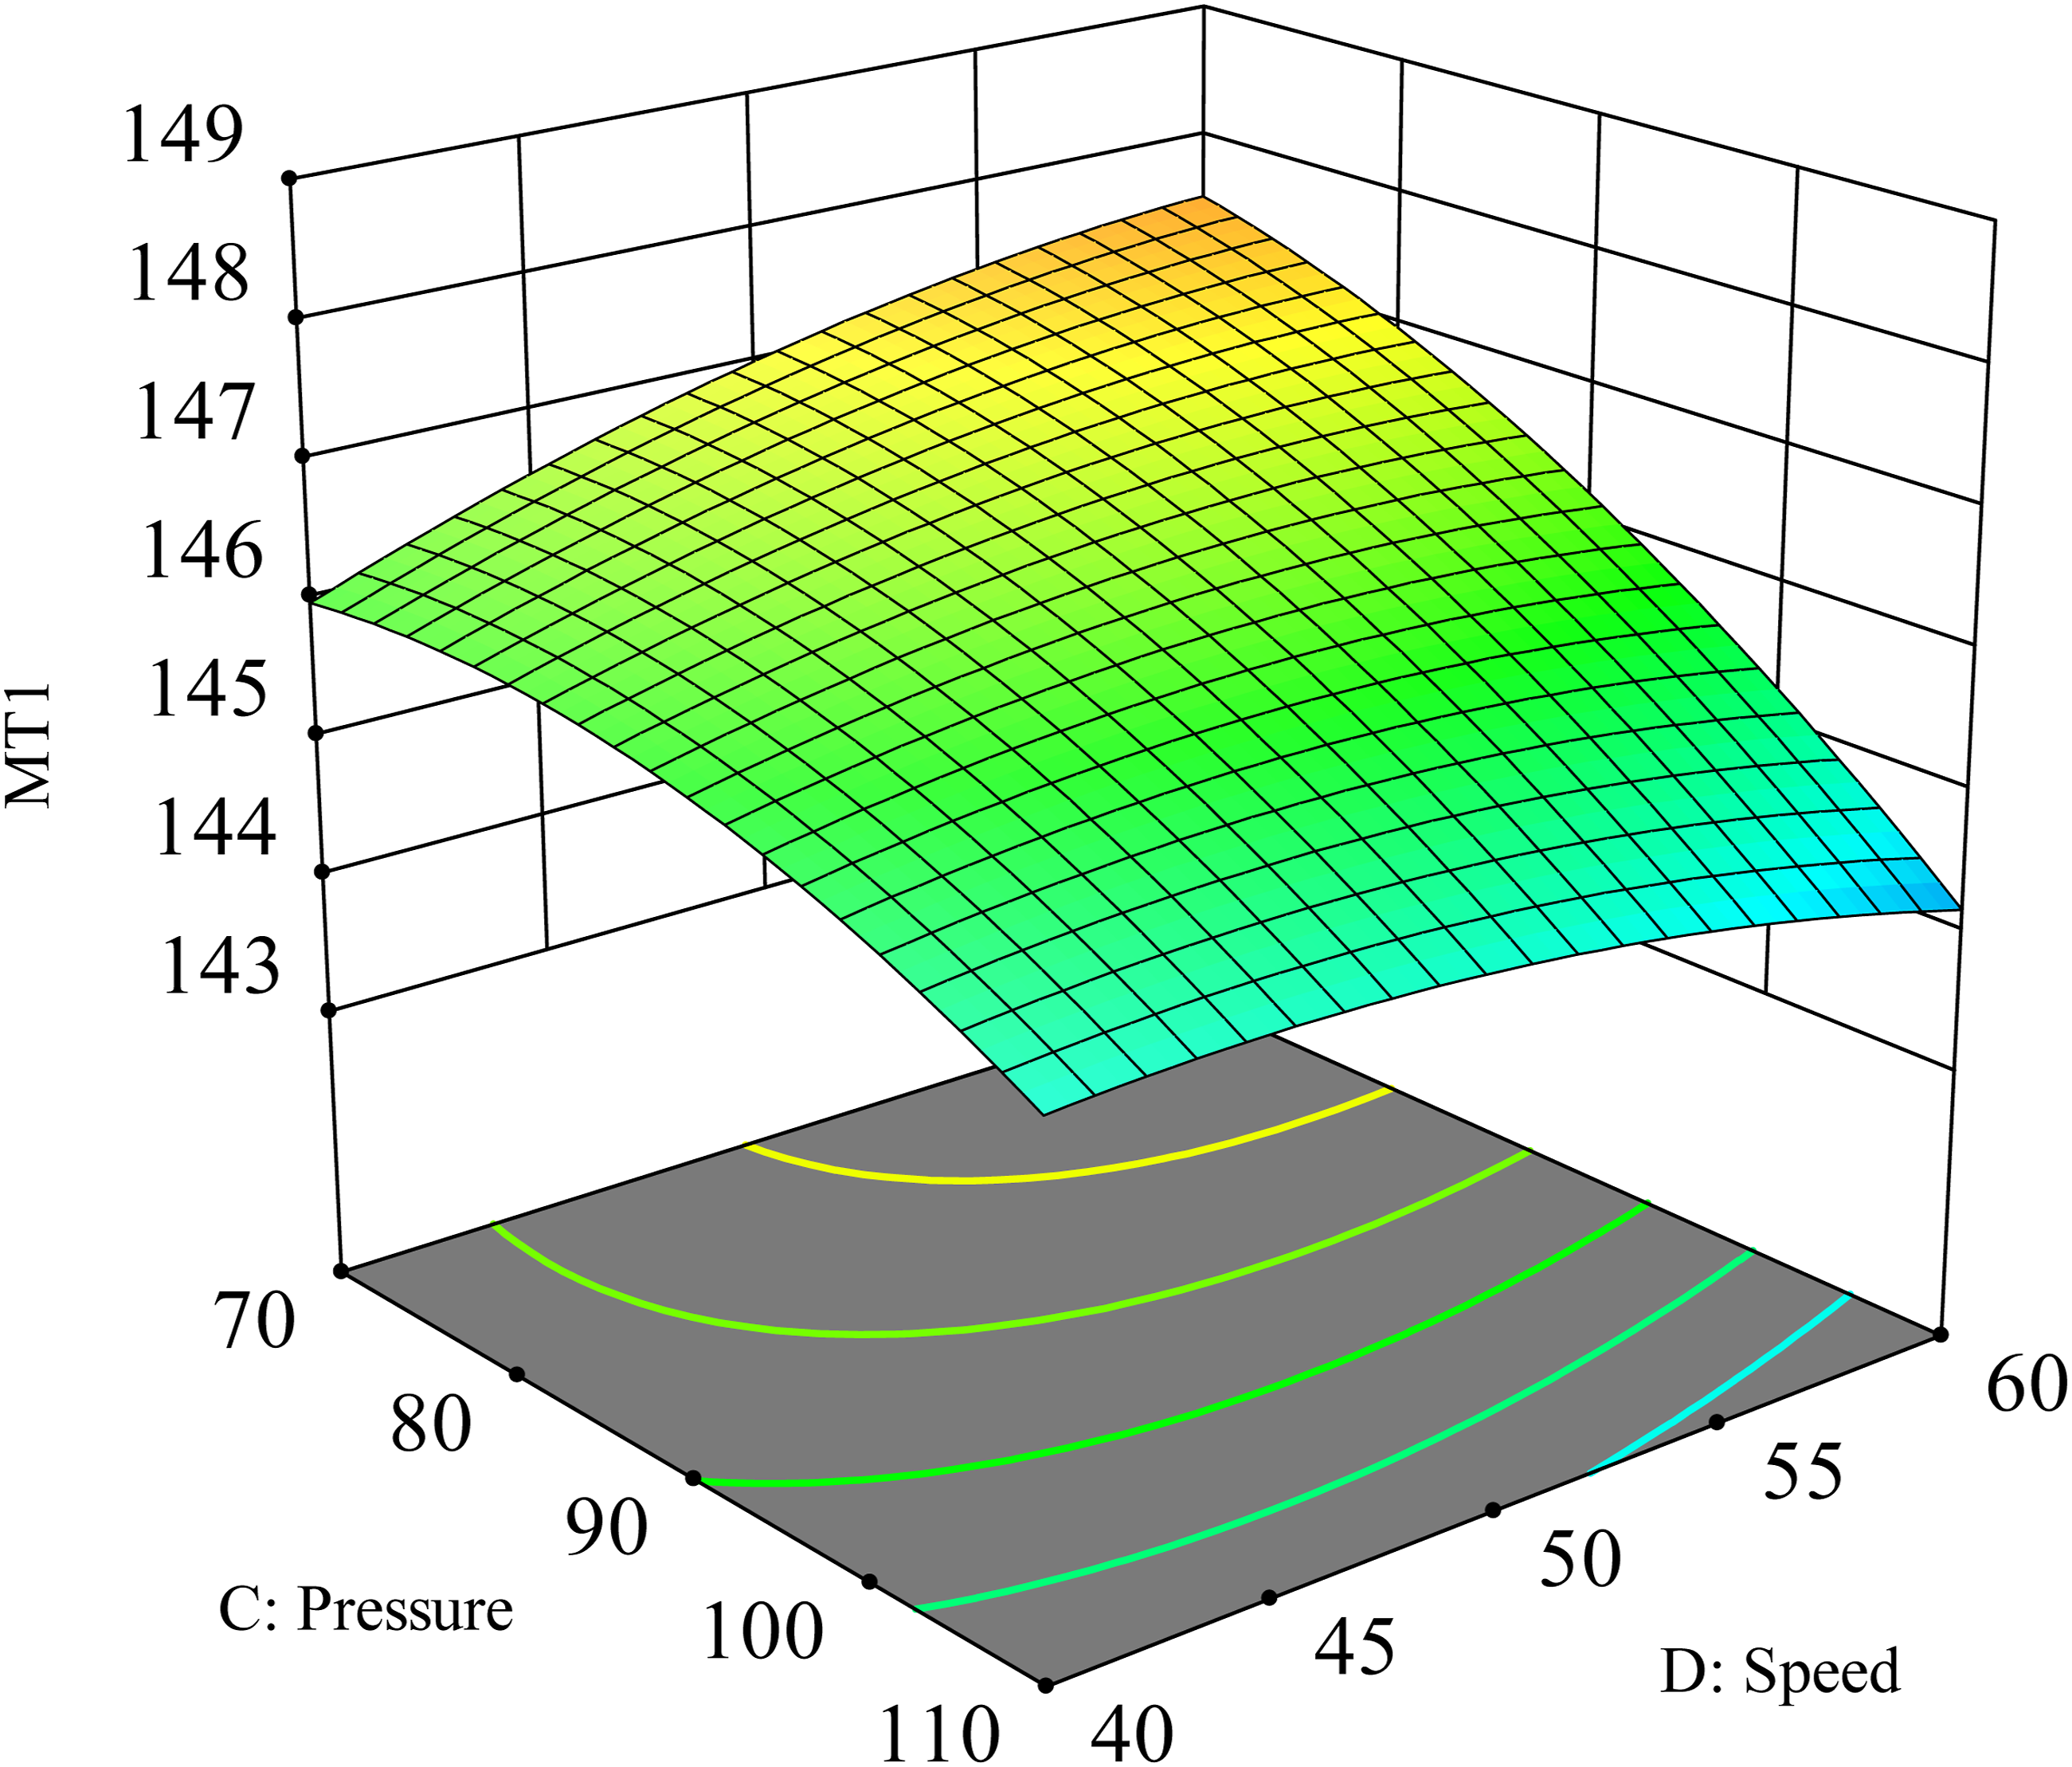
While filler percentage also have a significant effect on the lower melting curve of the PLA Composites, the effect can be viewed in Figure 8. The addition of natural fillers to poly lactic acid (PLA) composites has a profound influence on the intensity of the lower melting peak Effect of filler percentage on percentage of lower melting temperature.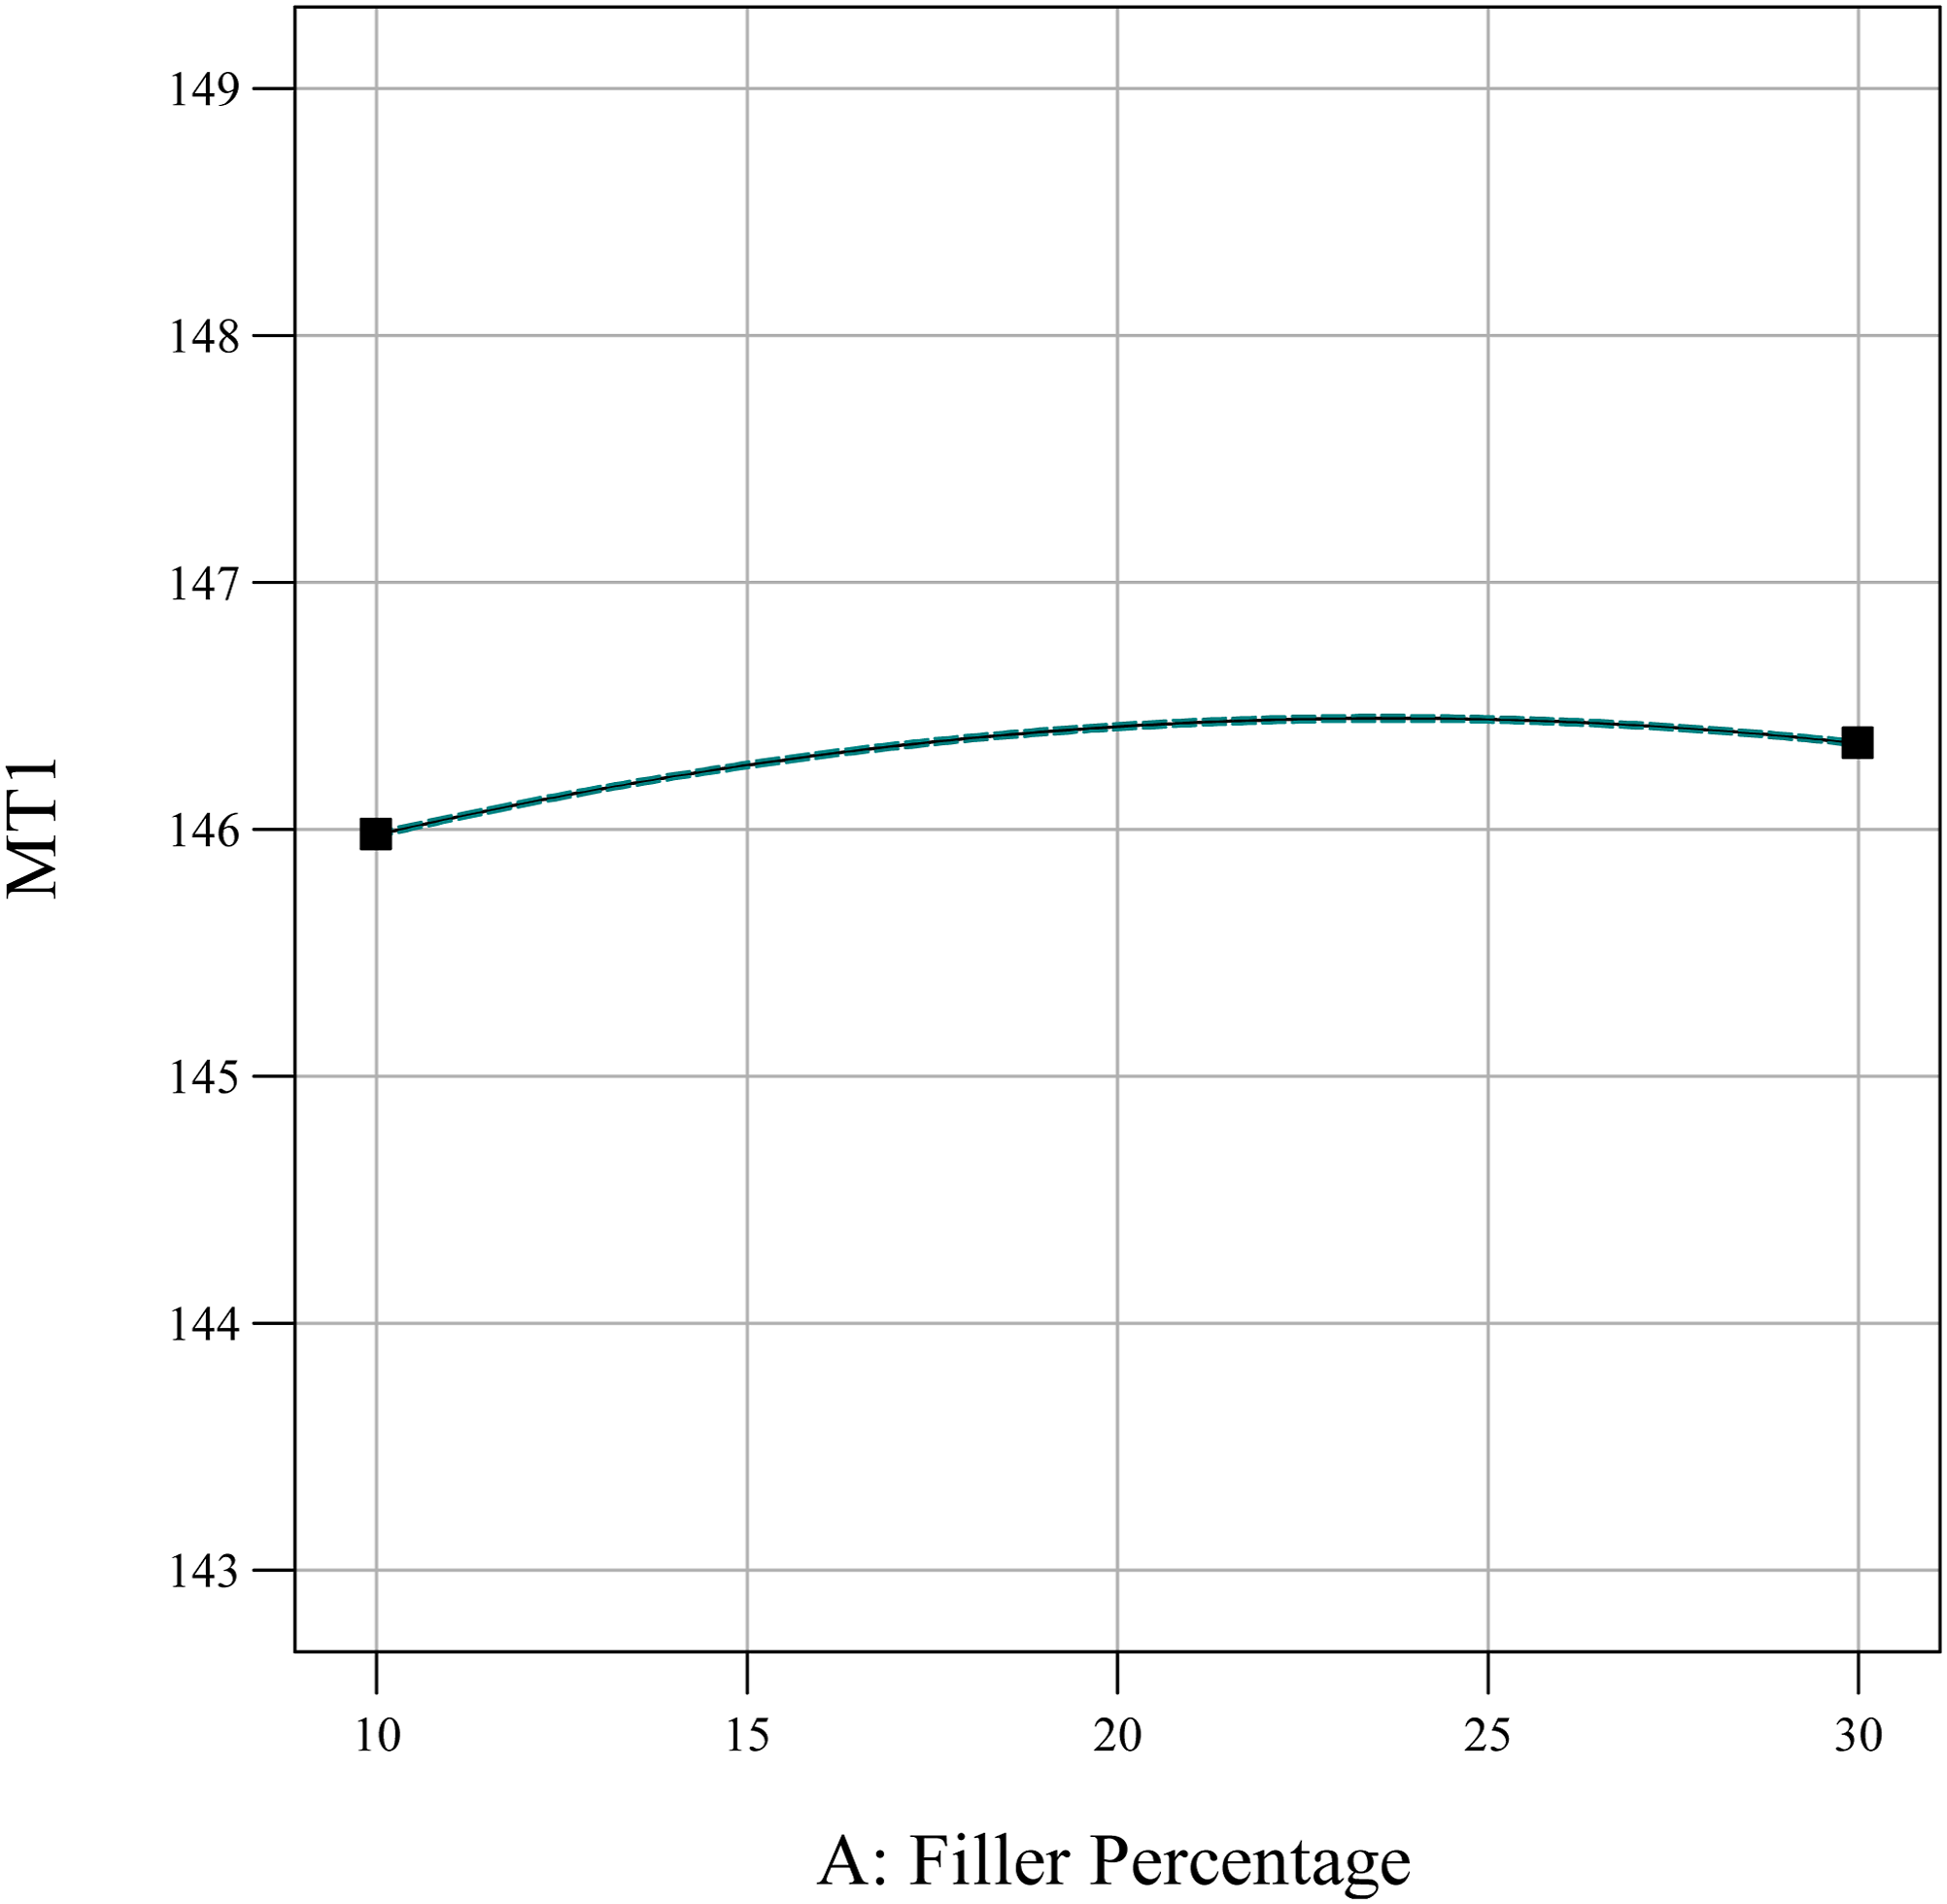
Determination of Input Parameter Effects on
T
m2
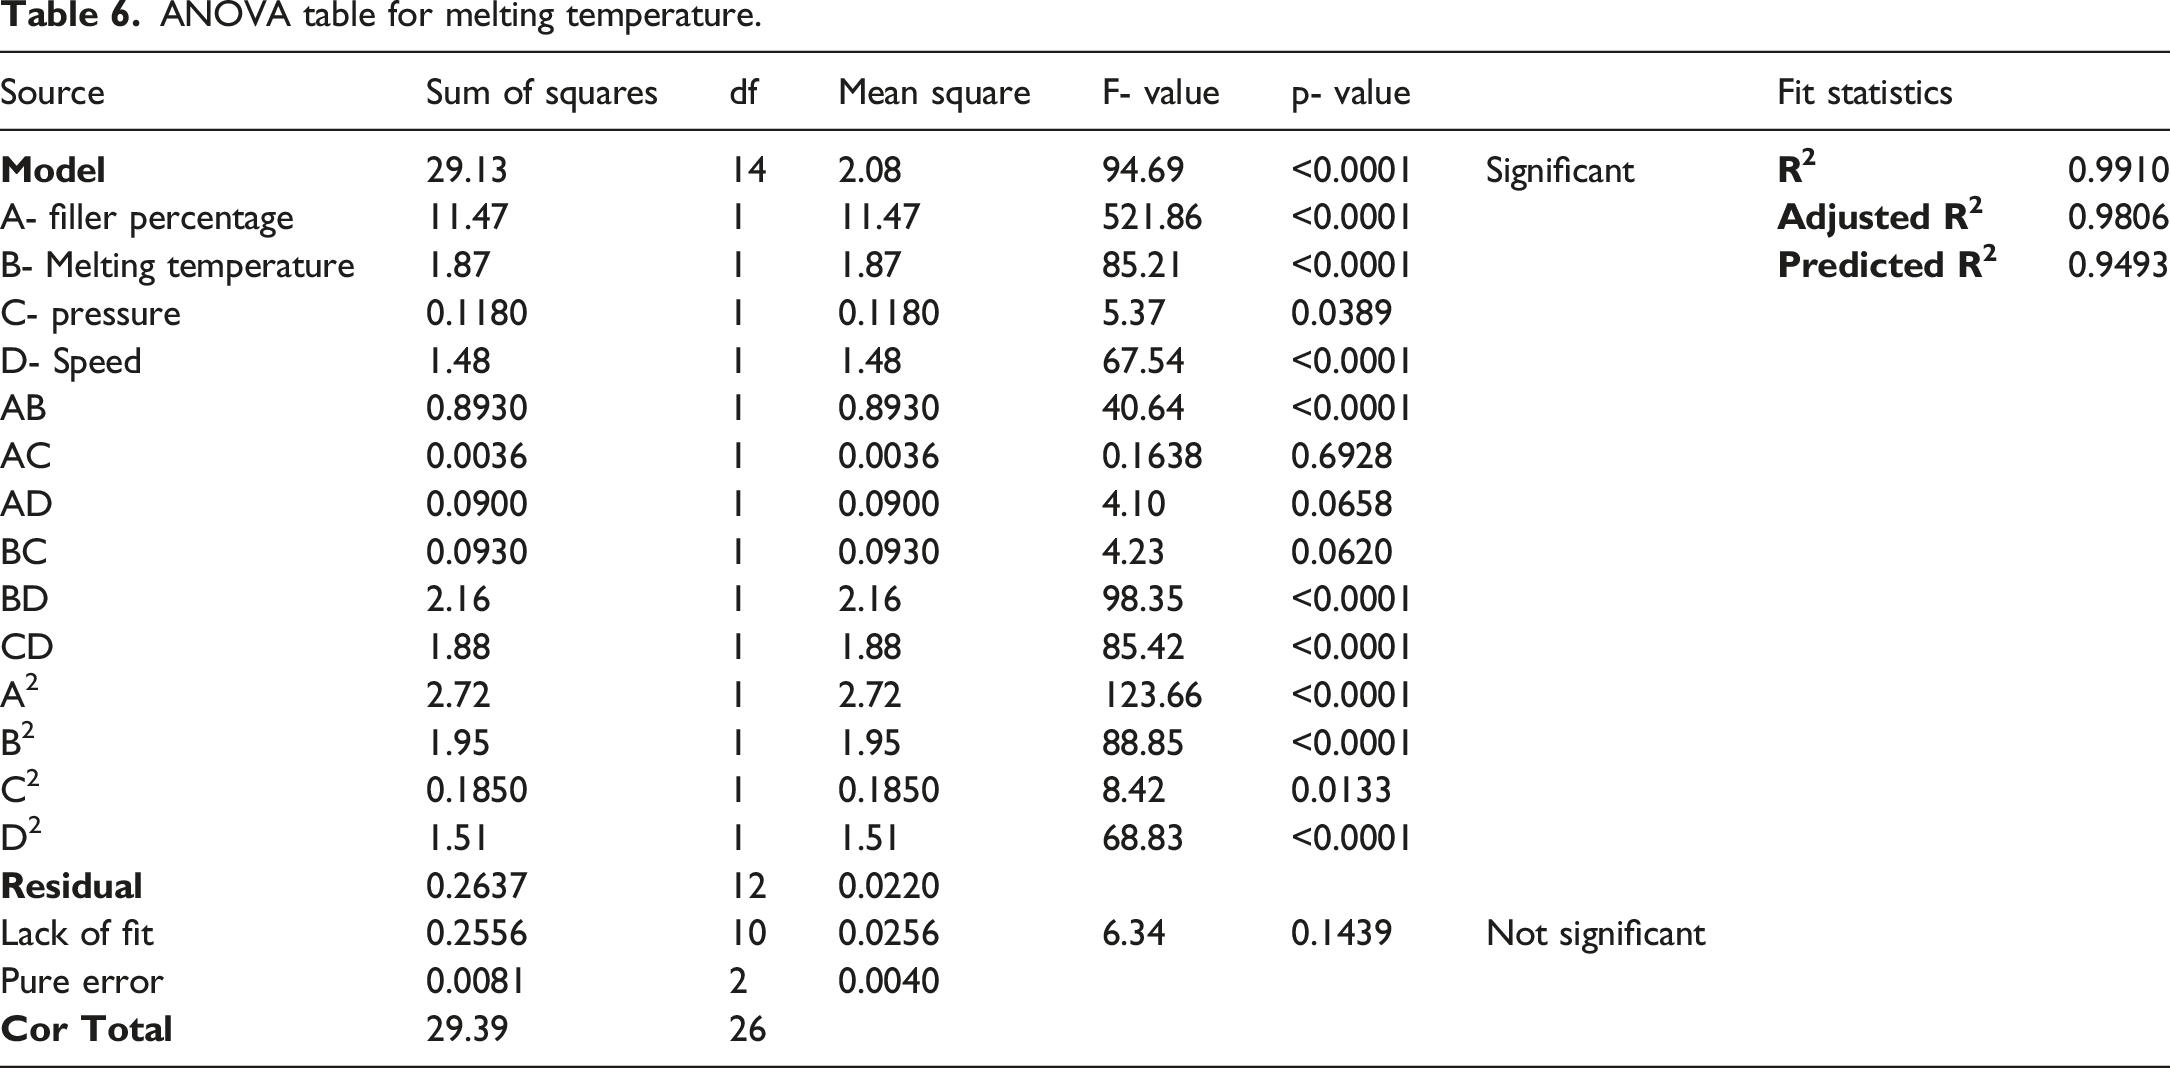
ANOVA table for melting temperature.
From Figure 9, the 3D plot showcases the interaction between two major influential parameters, melting temperature and filler percentage, on the melting point temperature ( 3D interaction graph between Filler percentage and pressure for melting temperature.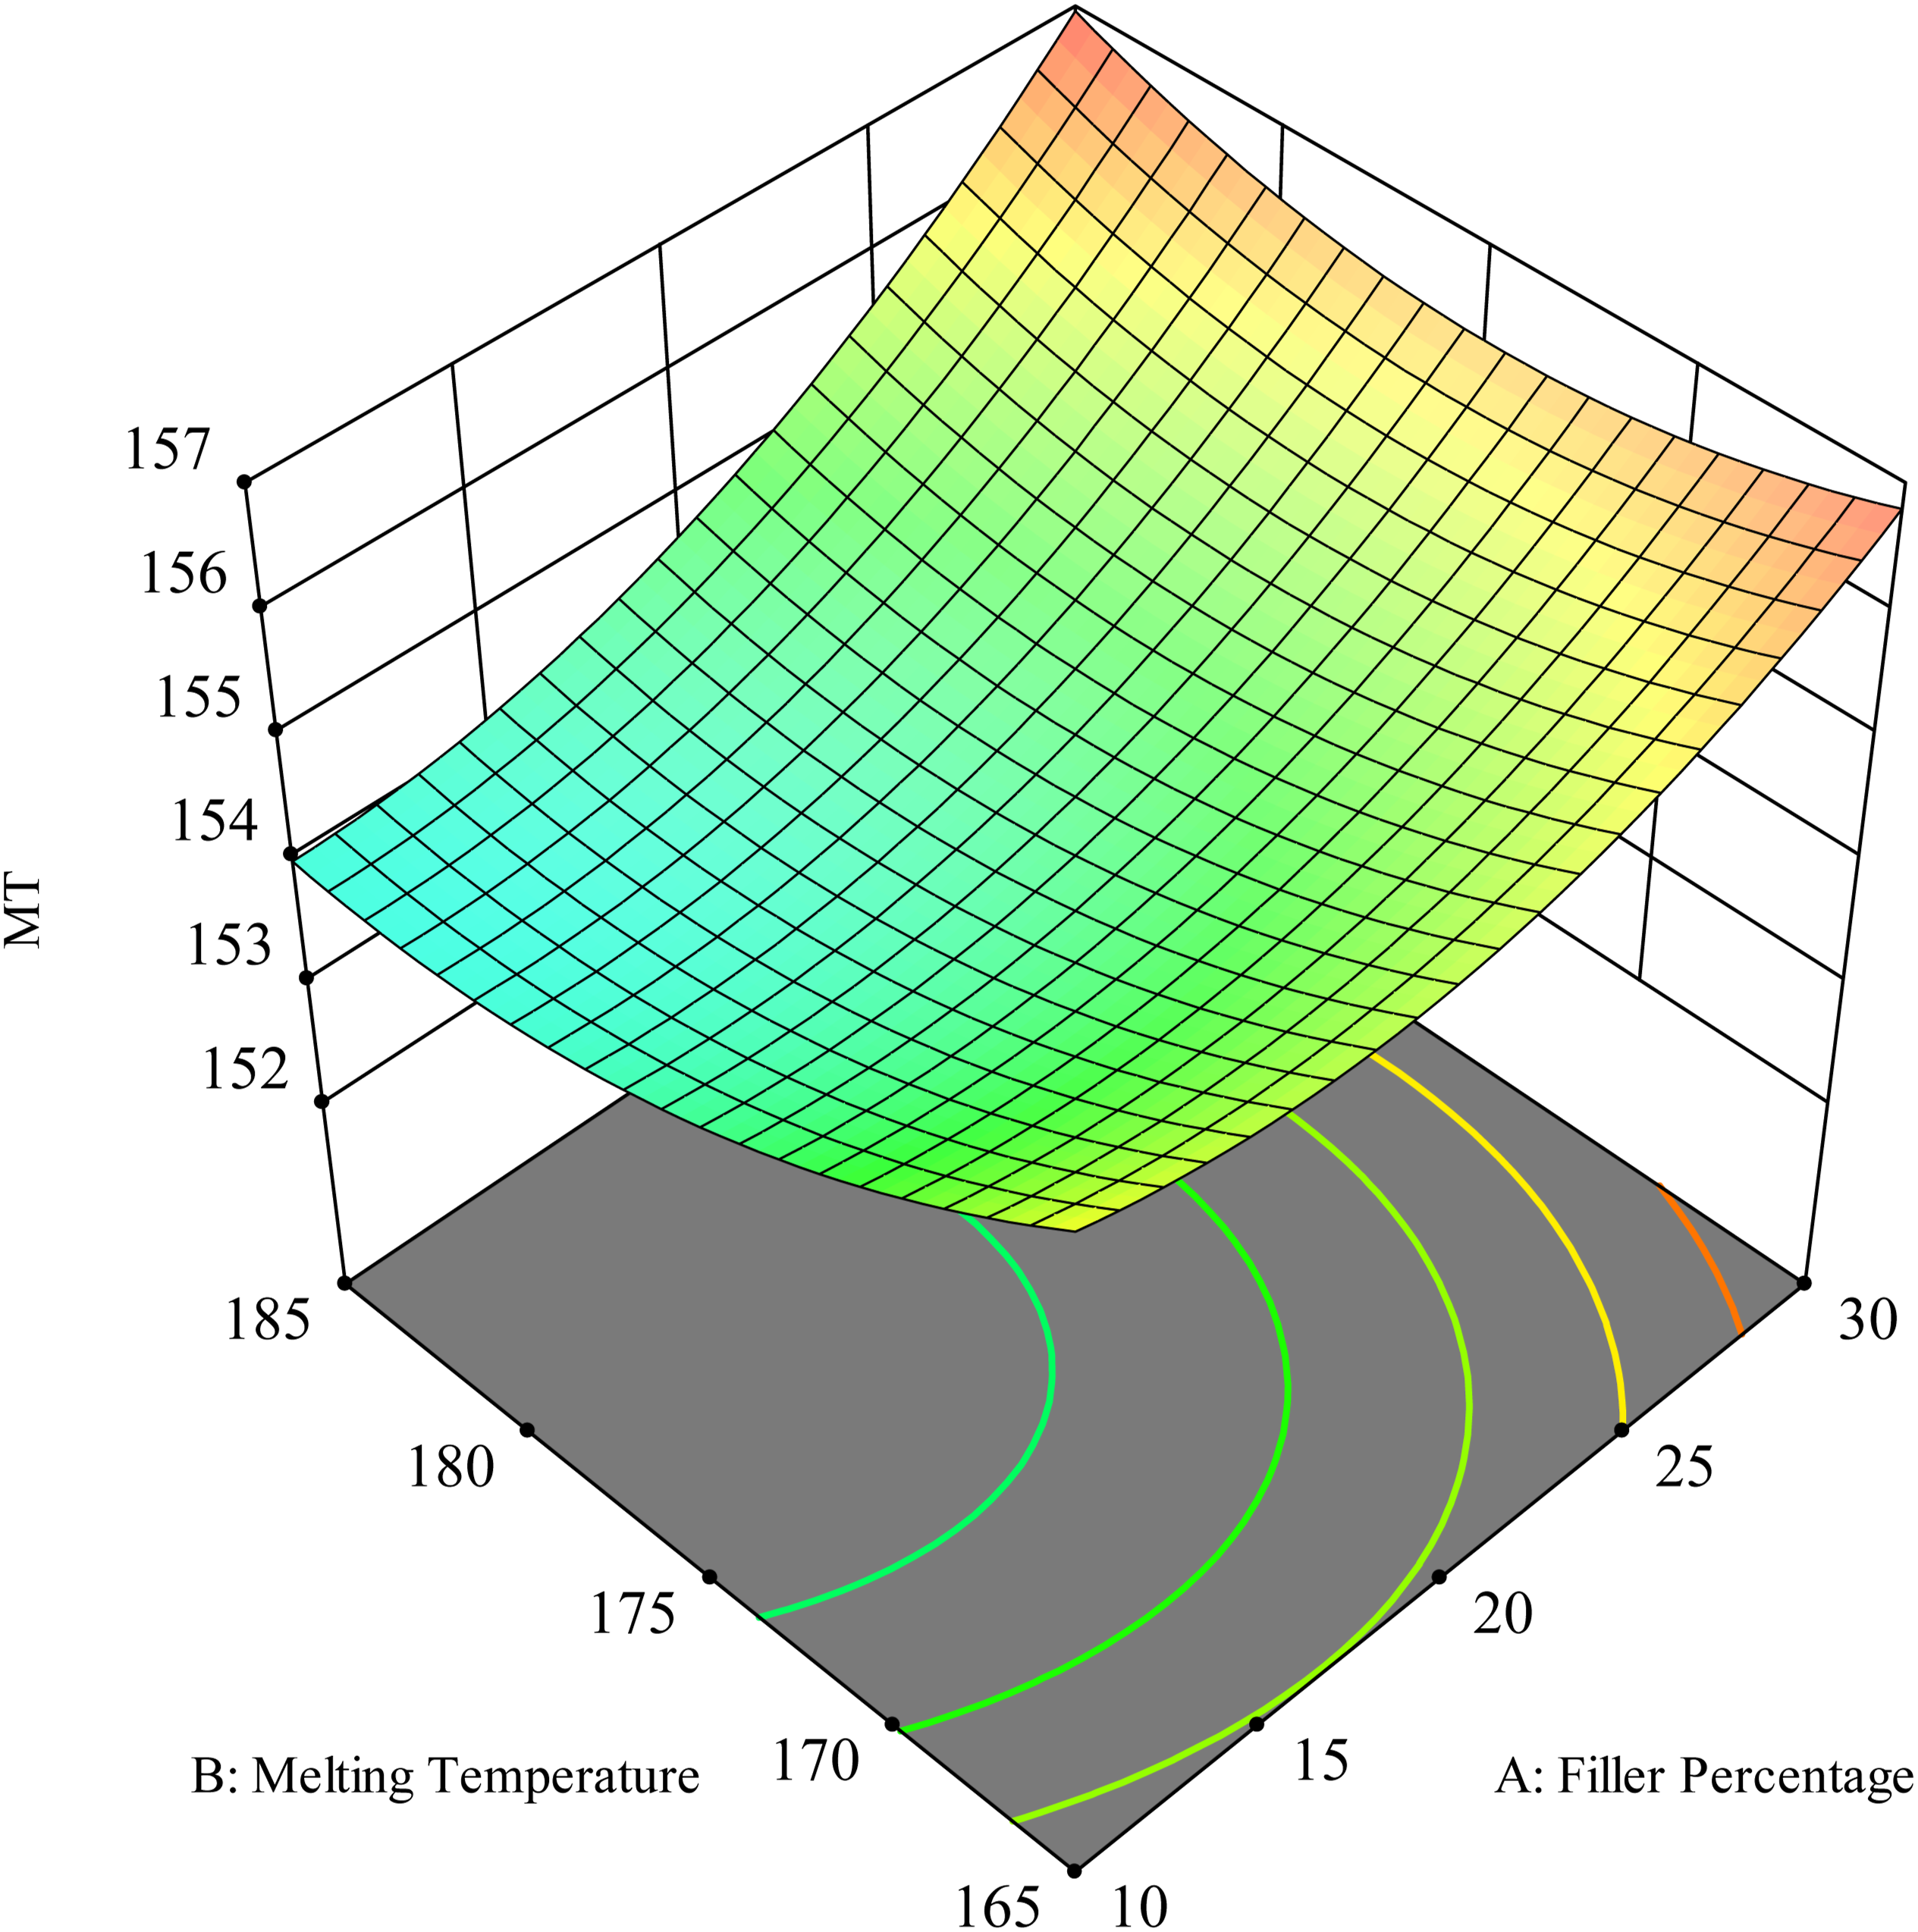
The figure provides a visual overview of the interaction between filler content and melting temperature and its effect on composite higher melting temperature (
Conclusion
The present study demonstrates the valorization of high-crystallinity agro-waste, pistachio shell powder, hitherto rendered unusable, into a functional bio-filler for polylactic acid composites through injection molding. The Response Surface Methodology with the Box-Behnken Design provided us not only with an efficient mapping of the processing space but also helped in accomplishing a multi-factor optimization of the properties of the ensuing composite. The experimental results establish the efficiency of PSP filler in two ways: as an efficient physical reinforcement and as an active modifier of the polymer’s thermal properties. Some key findings support this claim, as it is shown that with increasing filler content, the composite performance increases, providing higher density, a higher glass transition temperature
It was also established through detailed ANOVA analysis that the interaction of filler loading, temperature, pressure, and speed, with the PSP inclusion, imposed synergistic effects on composite properties, indicating complex quadratic and interactive relationships, which required careful control of the process parameters. The validity of RSM models, shown in this research, therefore confirms that the statistical approach can be used to determine the best manufacturing conditions toward maximum property enhancement. In summary, this work presents not only a feasible, green, and economic route for the valorization of agro-waste but also secures a place for PSP as a promising and functional candidate for sustainable bio-composites, hence supporting the transition toward a circular material economy.
Footnotes
Declaration of conflicting interests
The authors declared no potential conflicts of interest with respect to the research, authorship, and/or publication of this article.
Funding
The authors received no financial support for the research, authorship, and/or publication of this article.
Data Availability Statement
Data sharing not applicable to this article as no datasets were generated or analyzed during the current study.