
Abstract
Multiphase polymer nanomaterials with reinforcements of different structural features have immense commercial applications. Characterization of the morphological features in these nanocomposites like filler dispersion, effect of filler and compatibilizer on polymer phase morphology, interaction of filler and compatibilizer, and so on is of significant importance as these shape the composite behavior and properties. To study these aspects, polyethylene (PE) nanocomposites generated with and without compatibilizer using two different types of fillers were comprehensively characterized by atomic force microscopy (AFM) and transmission electron microscopy (TEM) including analytical TEM (e.g. energy-dispersive x-ray spectroscopy (EDXS) and electron energy loss spectroscopy (EELS)). Differential scanning calorimetric analysis was performed in order to quantify thermotropical properties of the nanocomposites. The filler dispersion was poor in the absence of compatibilizer, whereas its addition enhanced the filler delamination owing to the positive interactions between the polar filler surface and polar component of the compatibilizer. The compatibilizer addition also decreased the melt enthalpy due to reduced crystallinity along with change in polymer phase morphology. The filler pullout was also observed even in the compatibilized samples leading to higher AFM height variation in these composites. The EELS and EDXS analysis was further useful in analyzing the type of filler phase as well as interactions between the filler and compatibilizer phases. The compatibilizer was also observed to concentrate near the interface with the filler as signal of oxygen atoms associated with compatibilizer chains did not enhance in matrix, but increased at organic–inorganic interface.
Introduction
A nanocomposite is a multiphase solid material where one of the phases has one, two, or three dimensions of <100 nm, or structures having nanoscale repeat distances between the different phases that make up the material. They offer an opportunity to explore new behaviors and functionalities beyond those of conventional macrocomposites. Due to the small interparticle distances in these materials and the conversion of a large fraction of the polymer matrix near their surfaces into an interphase of superior properties, the desired properties are usually reached at low filler volume fraction. 1 It, thus, allows the nanocomposites to retain the macroscopic homogeneity and low density of the polymer. Moreover, the geometrical shape of the filler particles plays an important role in determining the composite morphology and properties of these materials. The nanocomposites can contain inorganic fillers falling into three different categories by the virtue of their primary particle dimensions. 2 When all the three dimensions of the particles are in the nanometer scale (zero-dimensional filler), the inorganic fillers have the form of spherical particles like silica (Si) particles. 3,4 Fillers with two dimensions in the nanometer scale (one-dimensional filler), whereas the third one is in the range of micrometers include carbon nanotubes or whiskers. 5,6 When the filler has two finite dimensions in the range of micrometers (two-dimensional filler), the third dimension is in nanometer scale, the fillers include layered silicate (or aluminosilicate) materials. 7
Out of different routes for the synthesis of nanocomposites like template synthesis, intercalation of polymer or prepolymer from solution, in situ intercalative polymerization, and melt intercalation, 2,8 the melt intercalation method has developed into one of the most attractive routes for the commercial generation of polymer nanocomposites. In this approach, the polymer is first melted and the filler is then blended with the polymer melt at high temperature under shear. This technique has an advantage that no solvent is required for the nanocomposite synthesis. The use of high temperature required to achieve a homogenous mix can however lead to occasional degradation of the filler surface modification and polymer thus requiring care during the compounding process. As this method is environmentally friendly and does not require the usage of solvents, and also owing to its simplicity and economic viability, the melt intercalation method has been widely used for the synthesis of polymer nanocomposites with a large number of polymer materials. 3,4,9 –12 To improve interactions between the apolar polyolefins like polyethylene (PE) and polypropylene and polar filler surfaces, partial polarization of the polymer is also achieved by the use of compatibilizers like ethylene vinyl acetate-graft-maleic anhydride (EVA-g-MA), PE-graft-maleic anhydride, and so on. In fact, majority of the reported polyolefin nanocomposites incorporating Si or silicate fillers prepared by melt compounding approach use low-molecular-weight compatibilizer or nonionic surfactant to achieve better compatibility between the polar filler surface and apolar polymer matrix. 13 –17
Characterization of nanocomposite morphology like filler dispersion, component interactions, changes in crystalline phase, and so on can be achieved by a variety of techniques. 18 X-Ray diffraction, differential scanning calorimetry, and nuclear magnetic resonance generate information on the changes in the crystalline structure of the polymer on incorporation of filler and compatibilizer or information on filler exfoliation. The visual methods including various atomic force and electron microscopy techniques provide information on the distribution of the filler as well as change in the phase morphology on incorporation of compatibilizer and filler to the matrix polymer. The advanced techniques associated with microscopy methods like energy-dispersive x-ray spectroscopy (EDXS) and electron energy loss spectroscopy (EELS) also generate information on the presence or absence of certain elements in the various parts of the samples. This can thus lead to information on the distribution of the compatibilizer (if a different element as compared to pure matrix is present in its structure) in polymer, interactions of the compatibilizer as well as filler phases, and so on. The morphology is also occasionally indirectly deduced from the changes observed in material performance like mechanical, gas barrier, thermal properties, and so on. Efficient characterization of the material morphology is, however, of immense importance as it provides relationships between the structure and properties of the generated materials, which can further be used to optimize the amount of components or processing conditions to attain required set of composite properties. The above mentioned techniques are of common use in evaluation of filler dispersion, crystallinity variation, and so on, 19 –21 but the use of advanced tools like EDXS, EELS, as well as atomic force microscopy (AFM) needs to be further explored for the elucidation of advanced morphological features like component interactions, compatibilizer distribution, phase variation in the polymer, and so on.
The goal of the current study was the characterization of various morphological aspects of PE nanocomposites using transmission electron as well as AFM. The findings were also supplemented with EDXS and EELS analysis of the composite samples. Apart from that the visual characterization was also quantified using differential scanning calorimetric analysis of these materials. Fillers of two different geometrical dimensions were used and the composites were generated with and without the use of compatibilizer EVA-g-MA.
Experimental
Materials
High-density-PE (specific gravity 0.958) grade BB2581 was procured from Abu Dhabi Polymers Company Limited (Borouge, UAE). Synthetic silicon dioxide powder (ZEOFREE 5161 S) was supplied by J. M. Huber Private Limited (New Delhi, India), whereas layered silicate modified with dioctadecyldimethyl ammonium (commercial name Cloisite 20A) was provided by Rockwood Additives (Louisville, KY, USA). Compatibilizer EVA-g-MA with a trade name of Fusabond MC250D was supplied by DuPont (Wilmington, DE, USA).
Generation of nanocomposites
PE was melt mixed with fillers and compatibilizer in mini twin conical screw extruder (Rheomex CTW5, MiniLab HAAKE, Karlsruhe, Germany) at a mixing temperature of 190°C for three minutes at 60 r/min (batch size of 5 g). The content of filler and compatibilizer was fixed at 5 wt%. The composites were generated both with and without the compatibilizer. Pure polymer was also similarly melt processed at 190°C.
Characterization methods
For the microscopy analysis, the composite samples were mounted in special holders, which at the same time fit in the microtome and were suitable for the examination of the block face by AFM. Ultrathin sections (30–90 nm) as well as block faces of the composite samples were obtained using a Leica Ultracut E microtome (Leica, Vienna, Austria) equipped with a diamond knife (Diatome, Biel, Switzerland) at −120°C. Sections for transmission electron microscopy (TEM) analysis were collected on holy carbon coated 400 mesh electron microscopy grids and were examined in a Philips CM 20 (Philips/FEI, Frankfurt, Germany) electron microscope at 200 kV at room temperature without staining. TEM image processing was performed using DigitalMicrograph software (Gatan, Pleasanton, CA, USA). All EDXS experiments were performed in scanning transmission electron microscopic mode with a probe current of 20 nA and a beam diameter of 100 nm, whereas EELS were performed in the TEM mode. EDXS spectra were collected using a high-purity germanium detector (solid angle 0.13 sr). For the calculation of elemental distribution images, jump ratio method was used. 22 The block faces of specimens after cryo ultramicrotomy were investigated at ambient conditions using Dimension 3100 AFM/scanning probe microscopy (SPM) (Veeco, Plainview, NY, USA) atomic force microscope. AFM images were collected in tapping mode using silicon nitride cantilevers with natural frequencies in the 300-kHz range (force constant 20 N/m, tip radius 10 nm (NT-MDT, Zelenograd, Moscow, Russia)). AFM image processing was performed using Nanoscope v720 software (Veeco).
Calorimetric analysis of pure polymer as well as nanocomposites was recorded on a Pyris-1 differential scanning calorimeter (Perkin-Elmer, Waltham, Massachusetts) under nitrogen atmosphere. The scans were obtained from 50 to 190°C at a heating rate of 20°C/min. The crystallization analysis was performed by cooling the samples from 190°C till 50°C using a cooling rate of 10°C/min. The heat enthalpies were measured with an error of ±0.1% and were confirmed by repeating the runs.
Results and discussion
In the current study, the morphology of the PE nanocomposites generated with and without compatibilizer and two different types of reinforcement materials was analyzed using electron and atomic microscopy as well as differential scanning calorimetry analysis. Various aspects of the nanocomposite systems like filler dispersion, impact of filler and compatibilizer on polymer phase morphology, interaction of compatibilizer with the filler surface, and so on were studied.
Figure 1 shows the TEM micrographs of Si containing nanocomposites without (Figure 1(a) and (b)) and with (Figure 1(c) and (d)) EVA-g-MA compatibilizer. In the case of composites without compatibilizer, the dispersion of Si was nonuniform as large aggregates of undispersed Si particles were observed. The dispersion was significantly improved as the compatibilizer was added in similar amount as filler to the polymer matrix. Aggregates of Si particles were still present, but their mean size was reduced as compared to the composite without EVA-g-MA. It indicated that the polar component of the compatibilizer may have interacted positively with the polar Si surface thus further enhancing its dispersion in the PE matrix. The phase of the polymer also showed a specific homogeneous morphology with pronounced structural patterns in the form of strongly contrasted curls, which indicated the presence of crystalline order. Though the morphology seemed similar in both compatibilized and uncompatibilized systems, further quantification using atomic force microcopy and calorimetry was necessary. Figure 2 shows the TEM analysis for the layered silicate containing nanocomposites without (Figure 2(a) and (b)) and with (Figure 2(c) and (d)) EVA-g-MA. The higher aspect ratio of the layered silicate platelets was detected, though the orientation of these platelets was random. The delamination of the filler in the case of noncompatibilized composites was also poor with thick stacks of layered silicate platelets present in the matrix. The dispersion of these stacks in the polymer matrix, however, was satisfactory. Moreover, a few primary layered silicate platelets were still observed in the PE matrix even without the addition of compatibilizer indicating that the shear forces used to generate the composite did lead to partial kinetic delamination of the filler stacks. The thickness of the stacks was significantly reduced in the compatibilized nanocomposites thus confirming the findings from the Si composites about the positive interactions between the filler and compatibilizer resulting in better filler delamination. Polymer phase in these composites was also observed to be more affected by the addition of compatibilizer as compared to Si-containing composites.
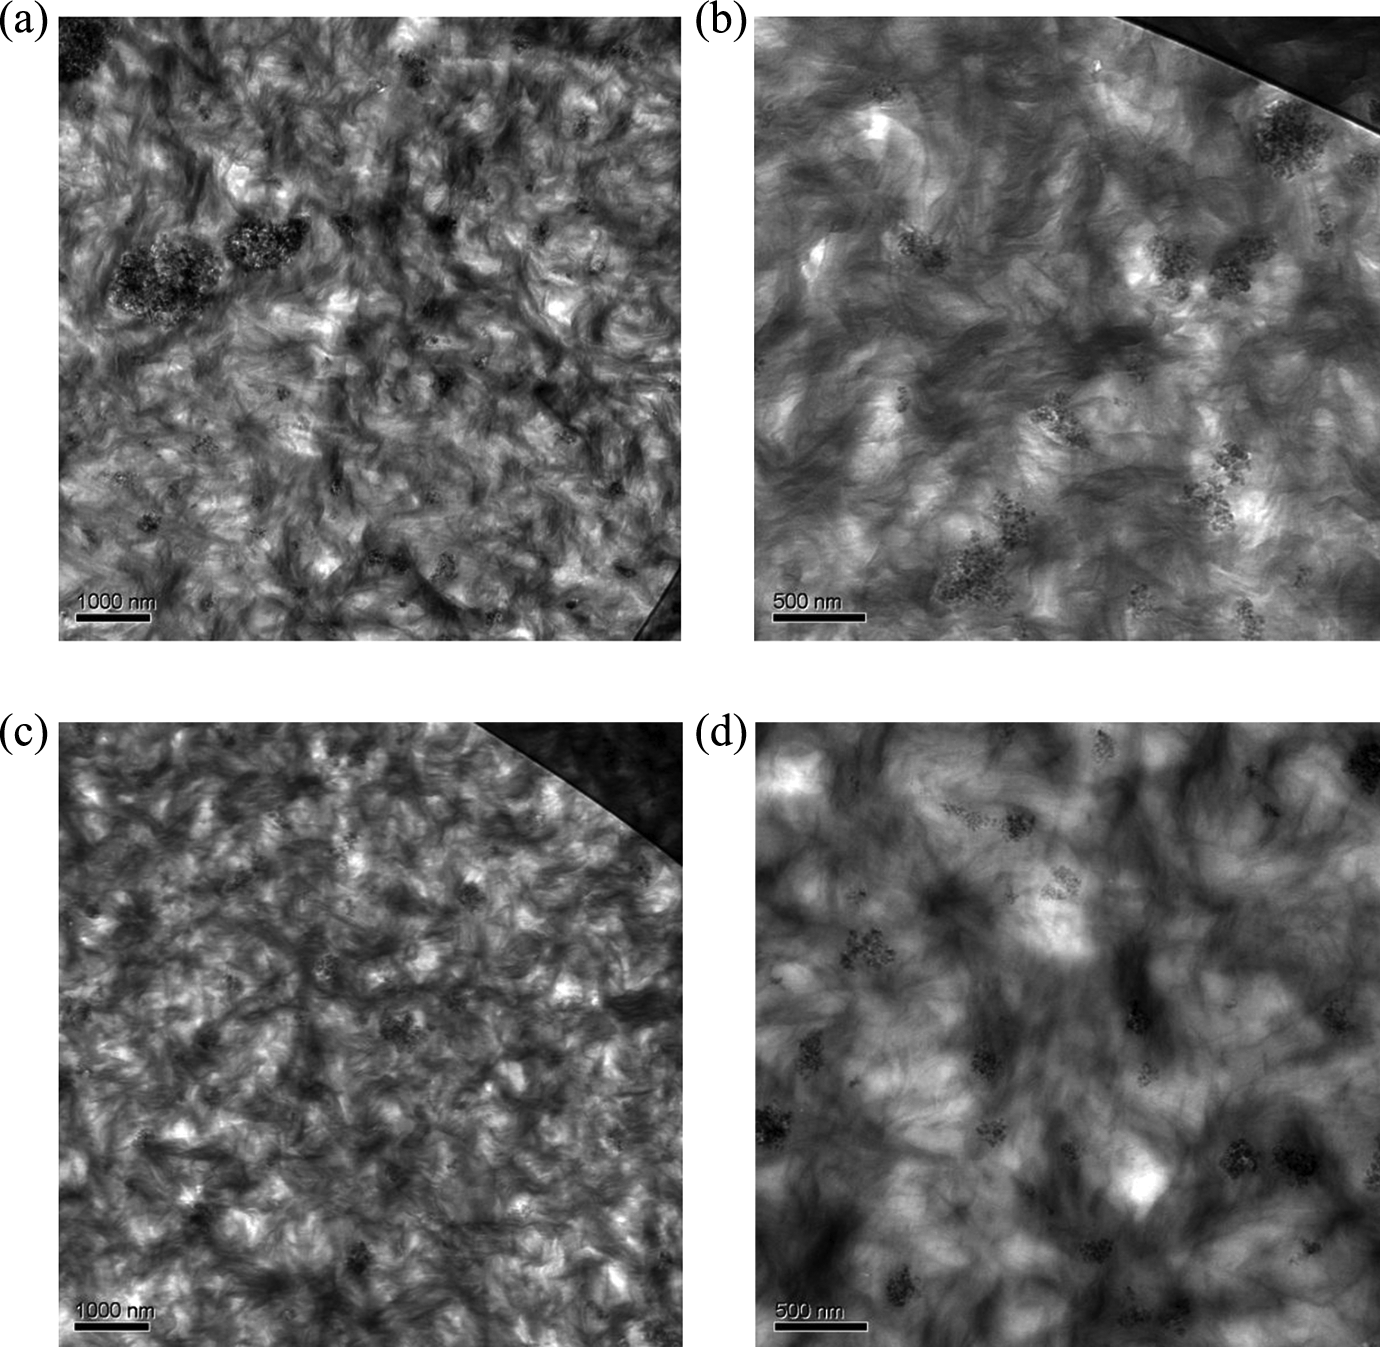
TEM micrographs of silica-containing nanocomposites: (a) and (b) represent the low and high magnification images of composite without EVA-g-MA compatibilizer, whereas (c) and (d) depict the images of composite with EVA-g-MA. EVA-g-MA: ethylene vinyl acetate-graft-maleic anhydride; TEM: transmission electron microscopy.
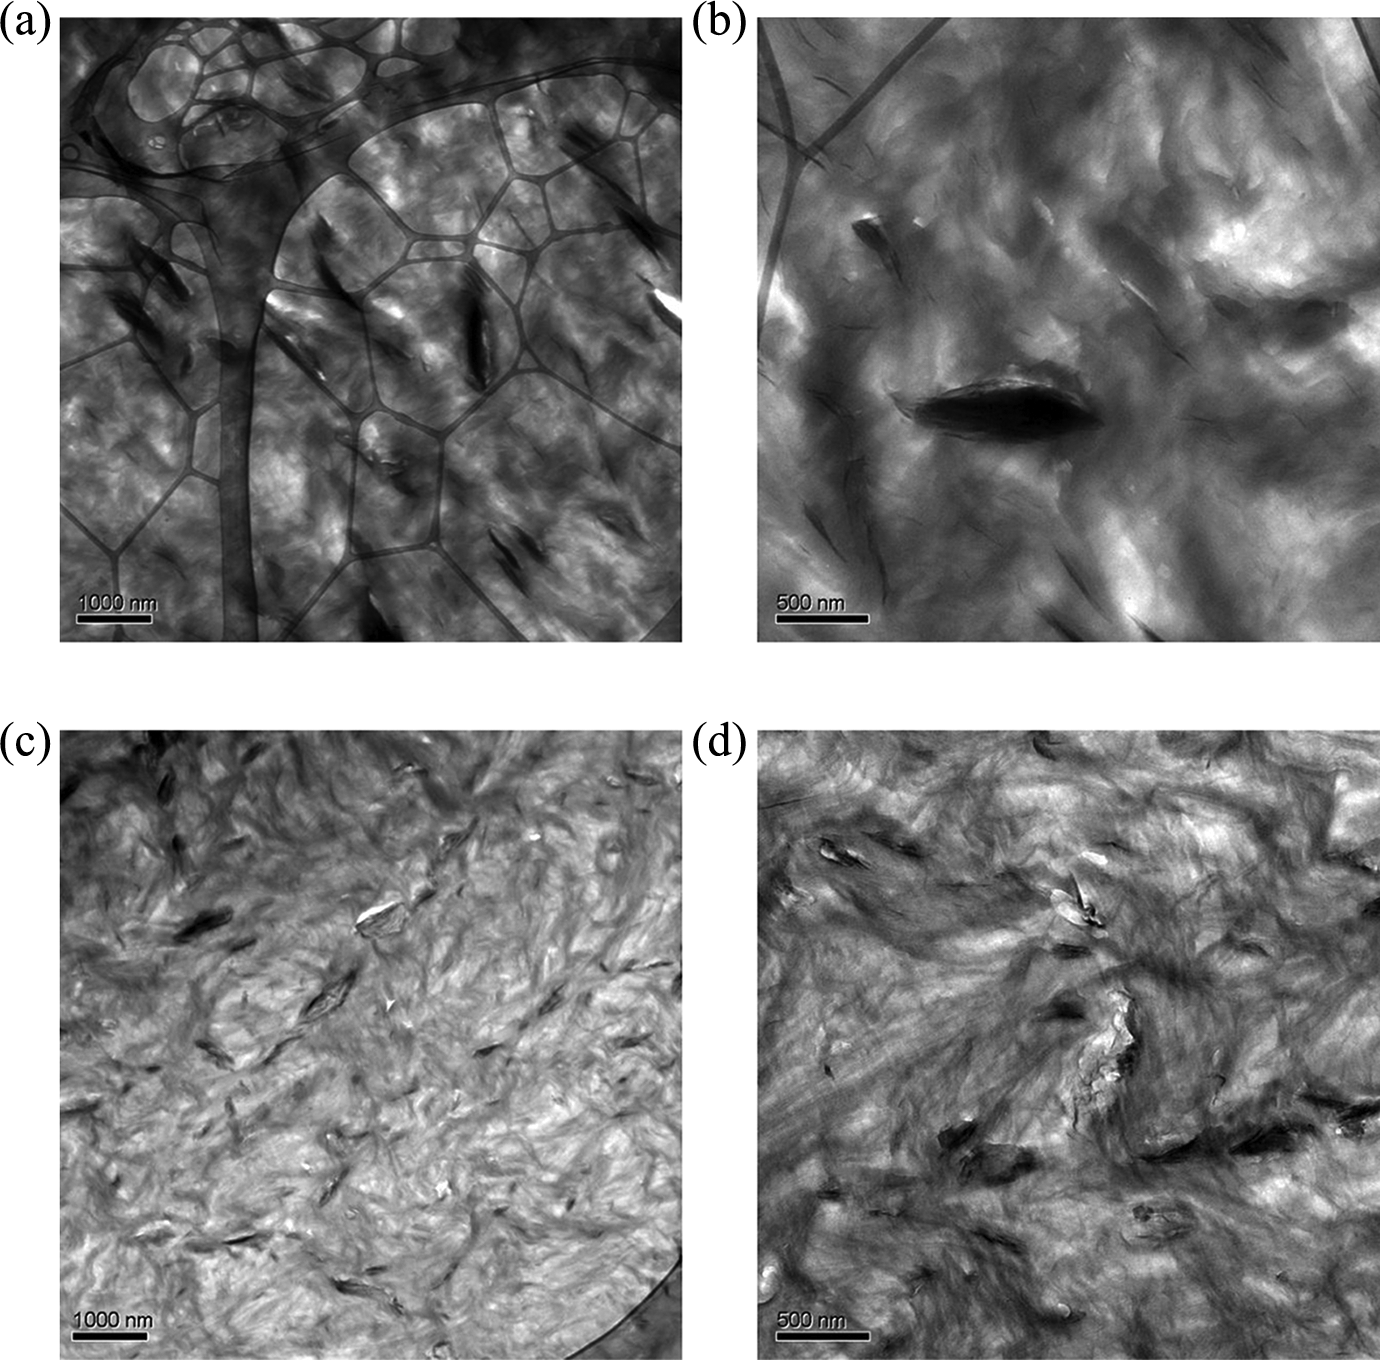
TEM micrographs of layered silicate containing nanocomposites: (a) and (b) represent the low and high magnification images of composite without EVA-g-MA compatibilizer, whereas (c) and (d) depict the images of composite with EVA-g-MA. EVA-g-MA: ethylene vinyl acetate-graft-maleic anhydride; TEM: transmission electron microscopy.
Table 1 and Figures 3 and 4 demonstrate the thermal behavior of the nanocomposites. The addition of Si and silicate to PE did not change the overall crystalline melt enthalpy of polymer indicating similar behavior of both the filler types. The peak melting point was also insignificantly reduced by 1°C in both the composite systems. The melting transitions (Figure 3) of the composites were also similar in width as pure polymer, which further confirmed that the filler did not affect the crystalline phase morphology of the pure polymer. Similarly, the crystallization transitions of the pure polymer and polymer–filler composites overlapped and the peak crystallization temperatures were also unaffected (Figure 4). Thus, the filler did not have any nucleation effect at the processing conditions used to synthesize the nanocomposites. Addition of compatibilizer to the system decreased the melt enthalpy of polymer due to the hindrance posed by compatibilizer chains to the crystallization of the PE chains. The decrease in melt enthalpy was more significant in the case of Si nanocomposites; thus, the effect of compatibilizer was dependent on the type of filler. Such a behavior may also result from the better filler dispersion in the presence of compatibilizer, which in turn would restrict the motion of polymer chains further. Though the melt enthalpy was less affected in the case of compatibilized PE–silicate nanocomposites, the melting point was reduced more as compared to corresponding Si nanocomposites, which indicates that the crystal phase (size, orientation, number, etc.) of the polymer was affected in both the composite systems. The onset and peak crystallization transitions of compatibilized nanocomposites were observed to overlap with the composites without compatibilizer and pure polymer.
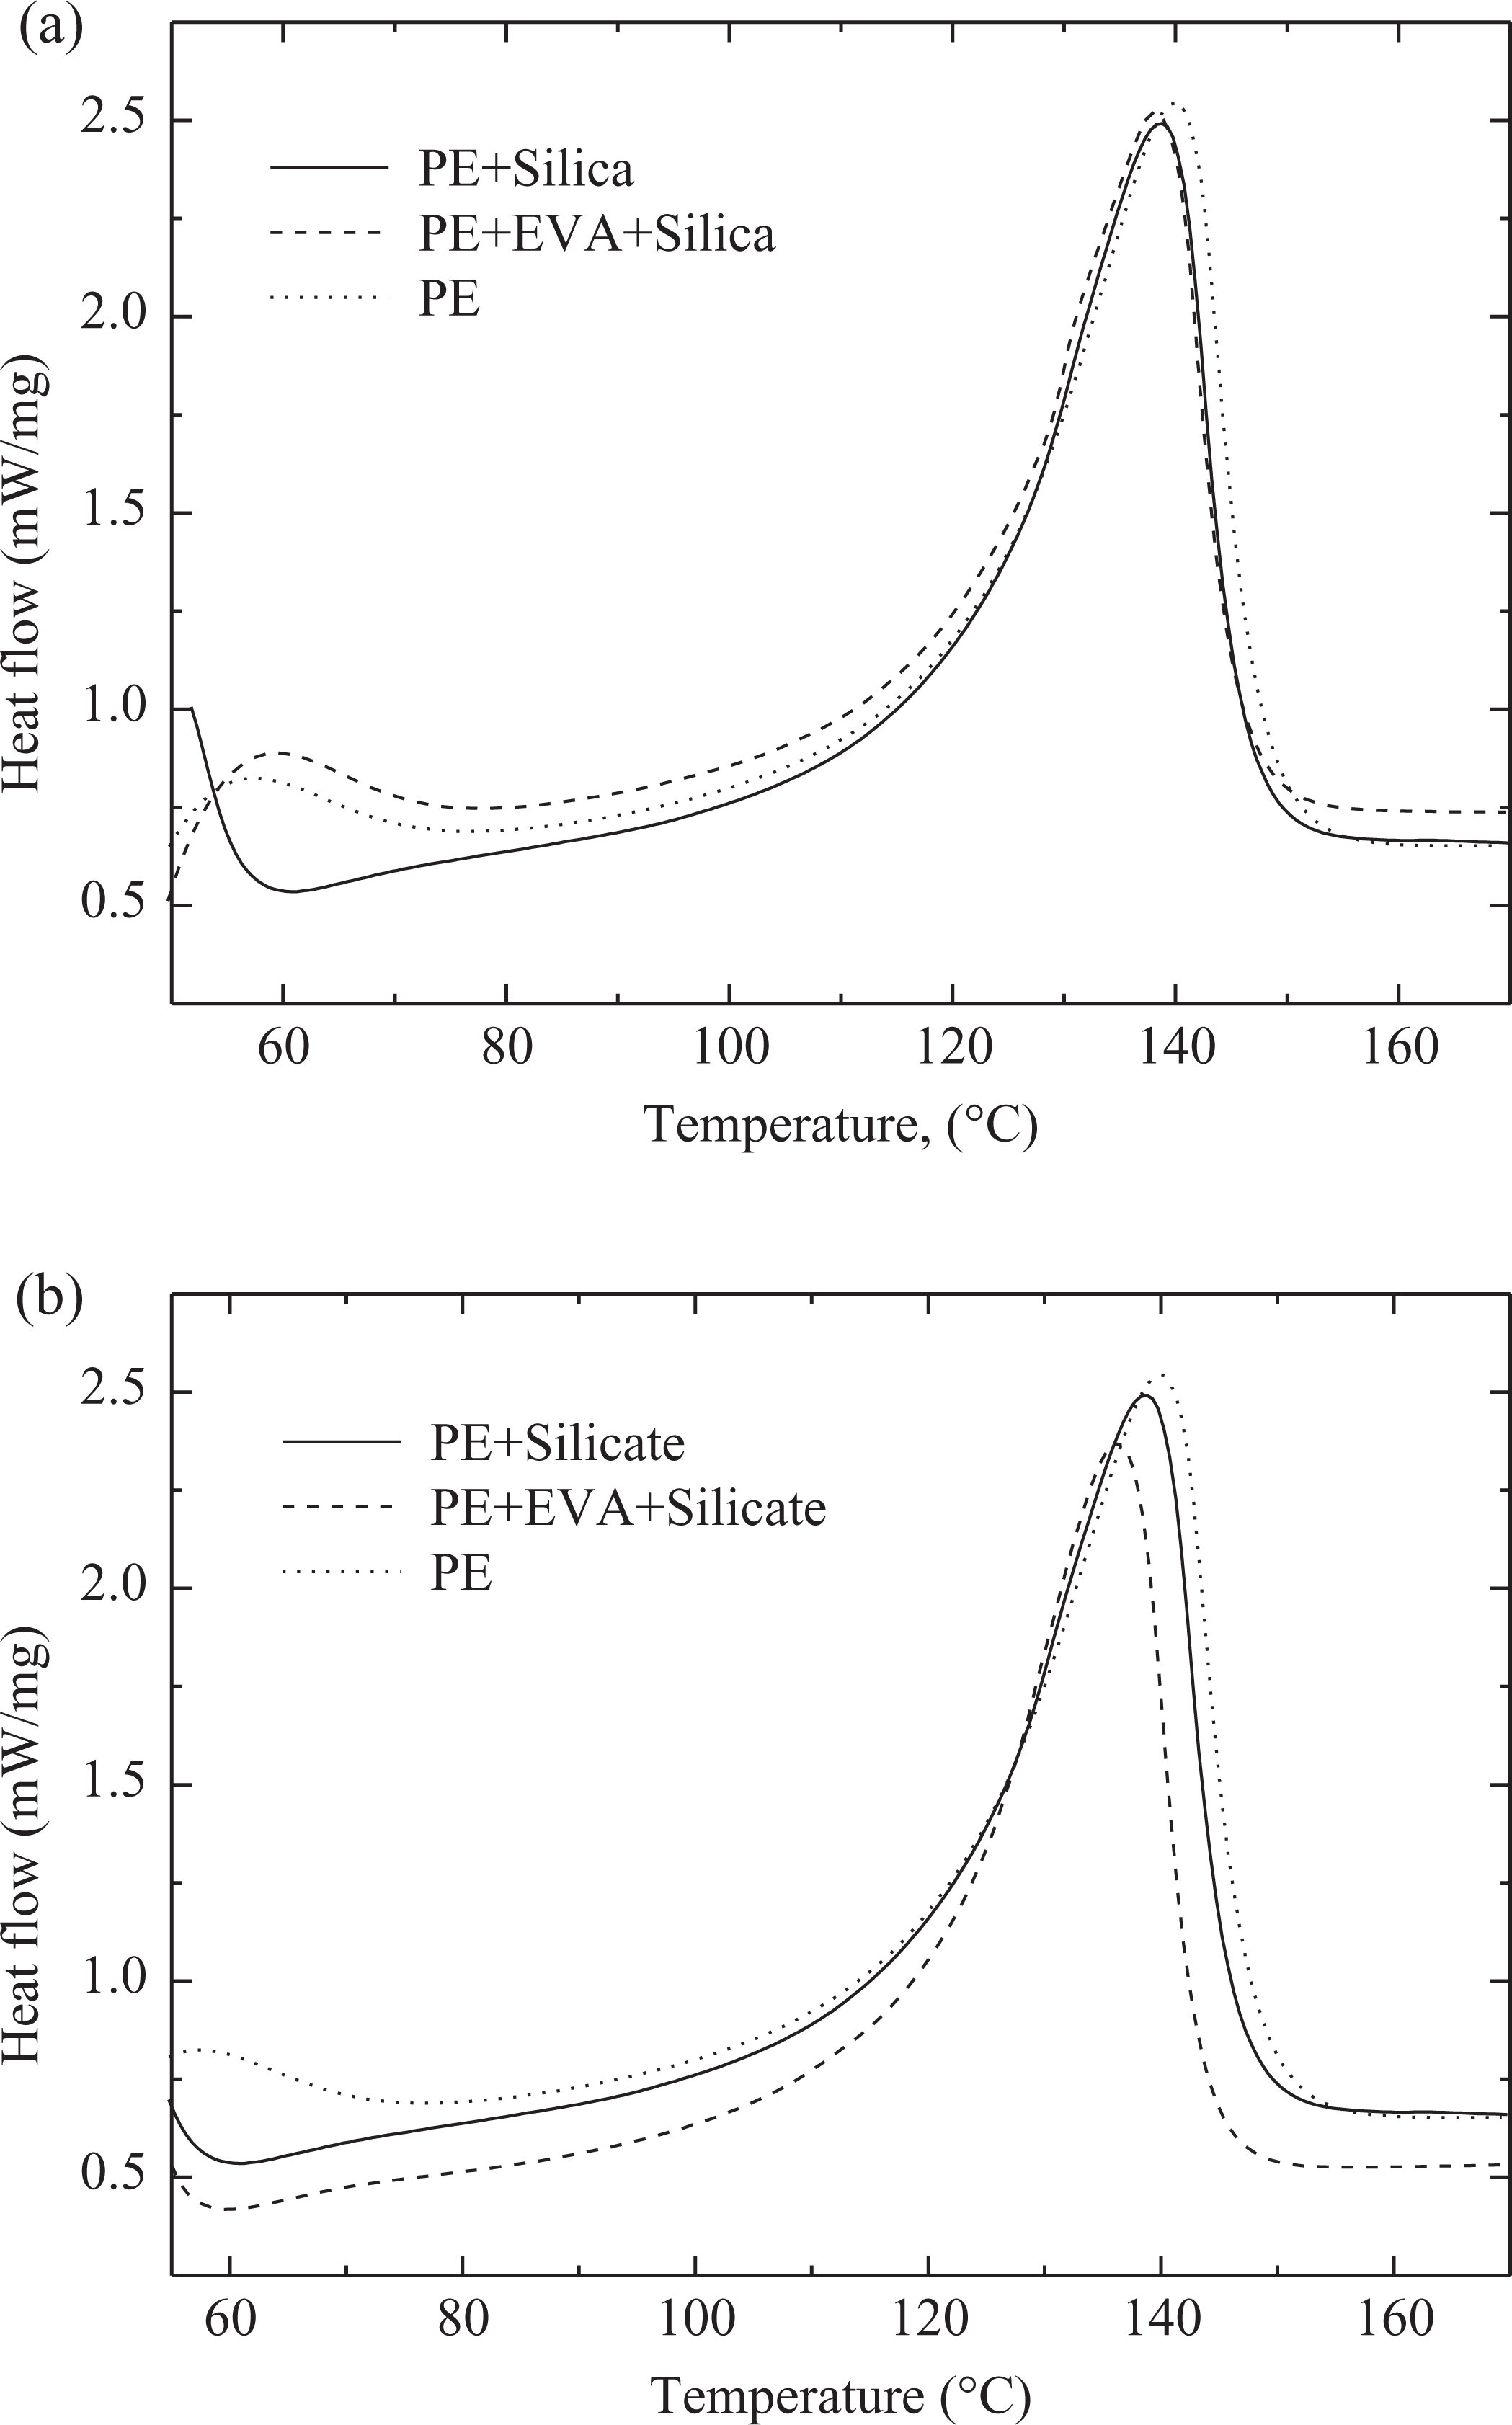
Differential scanning calorimetric thermograms for the melting transitions in the pure polymer and composites with (a) silica and (b) silicate (with and without compatibilizer) fillers.
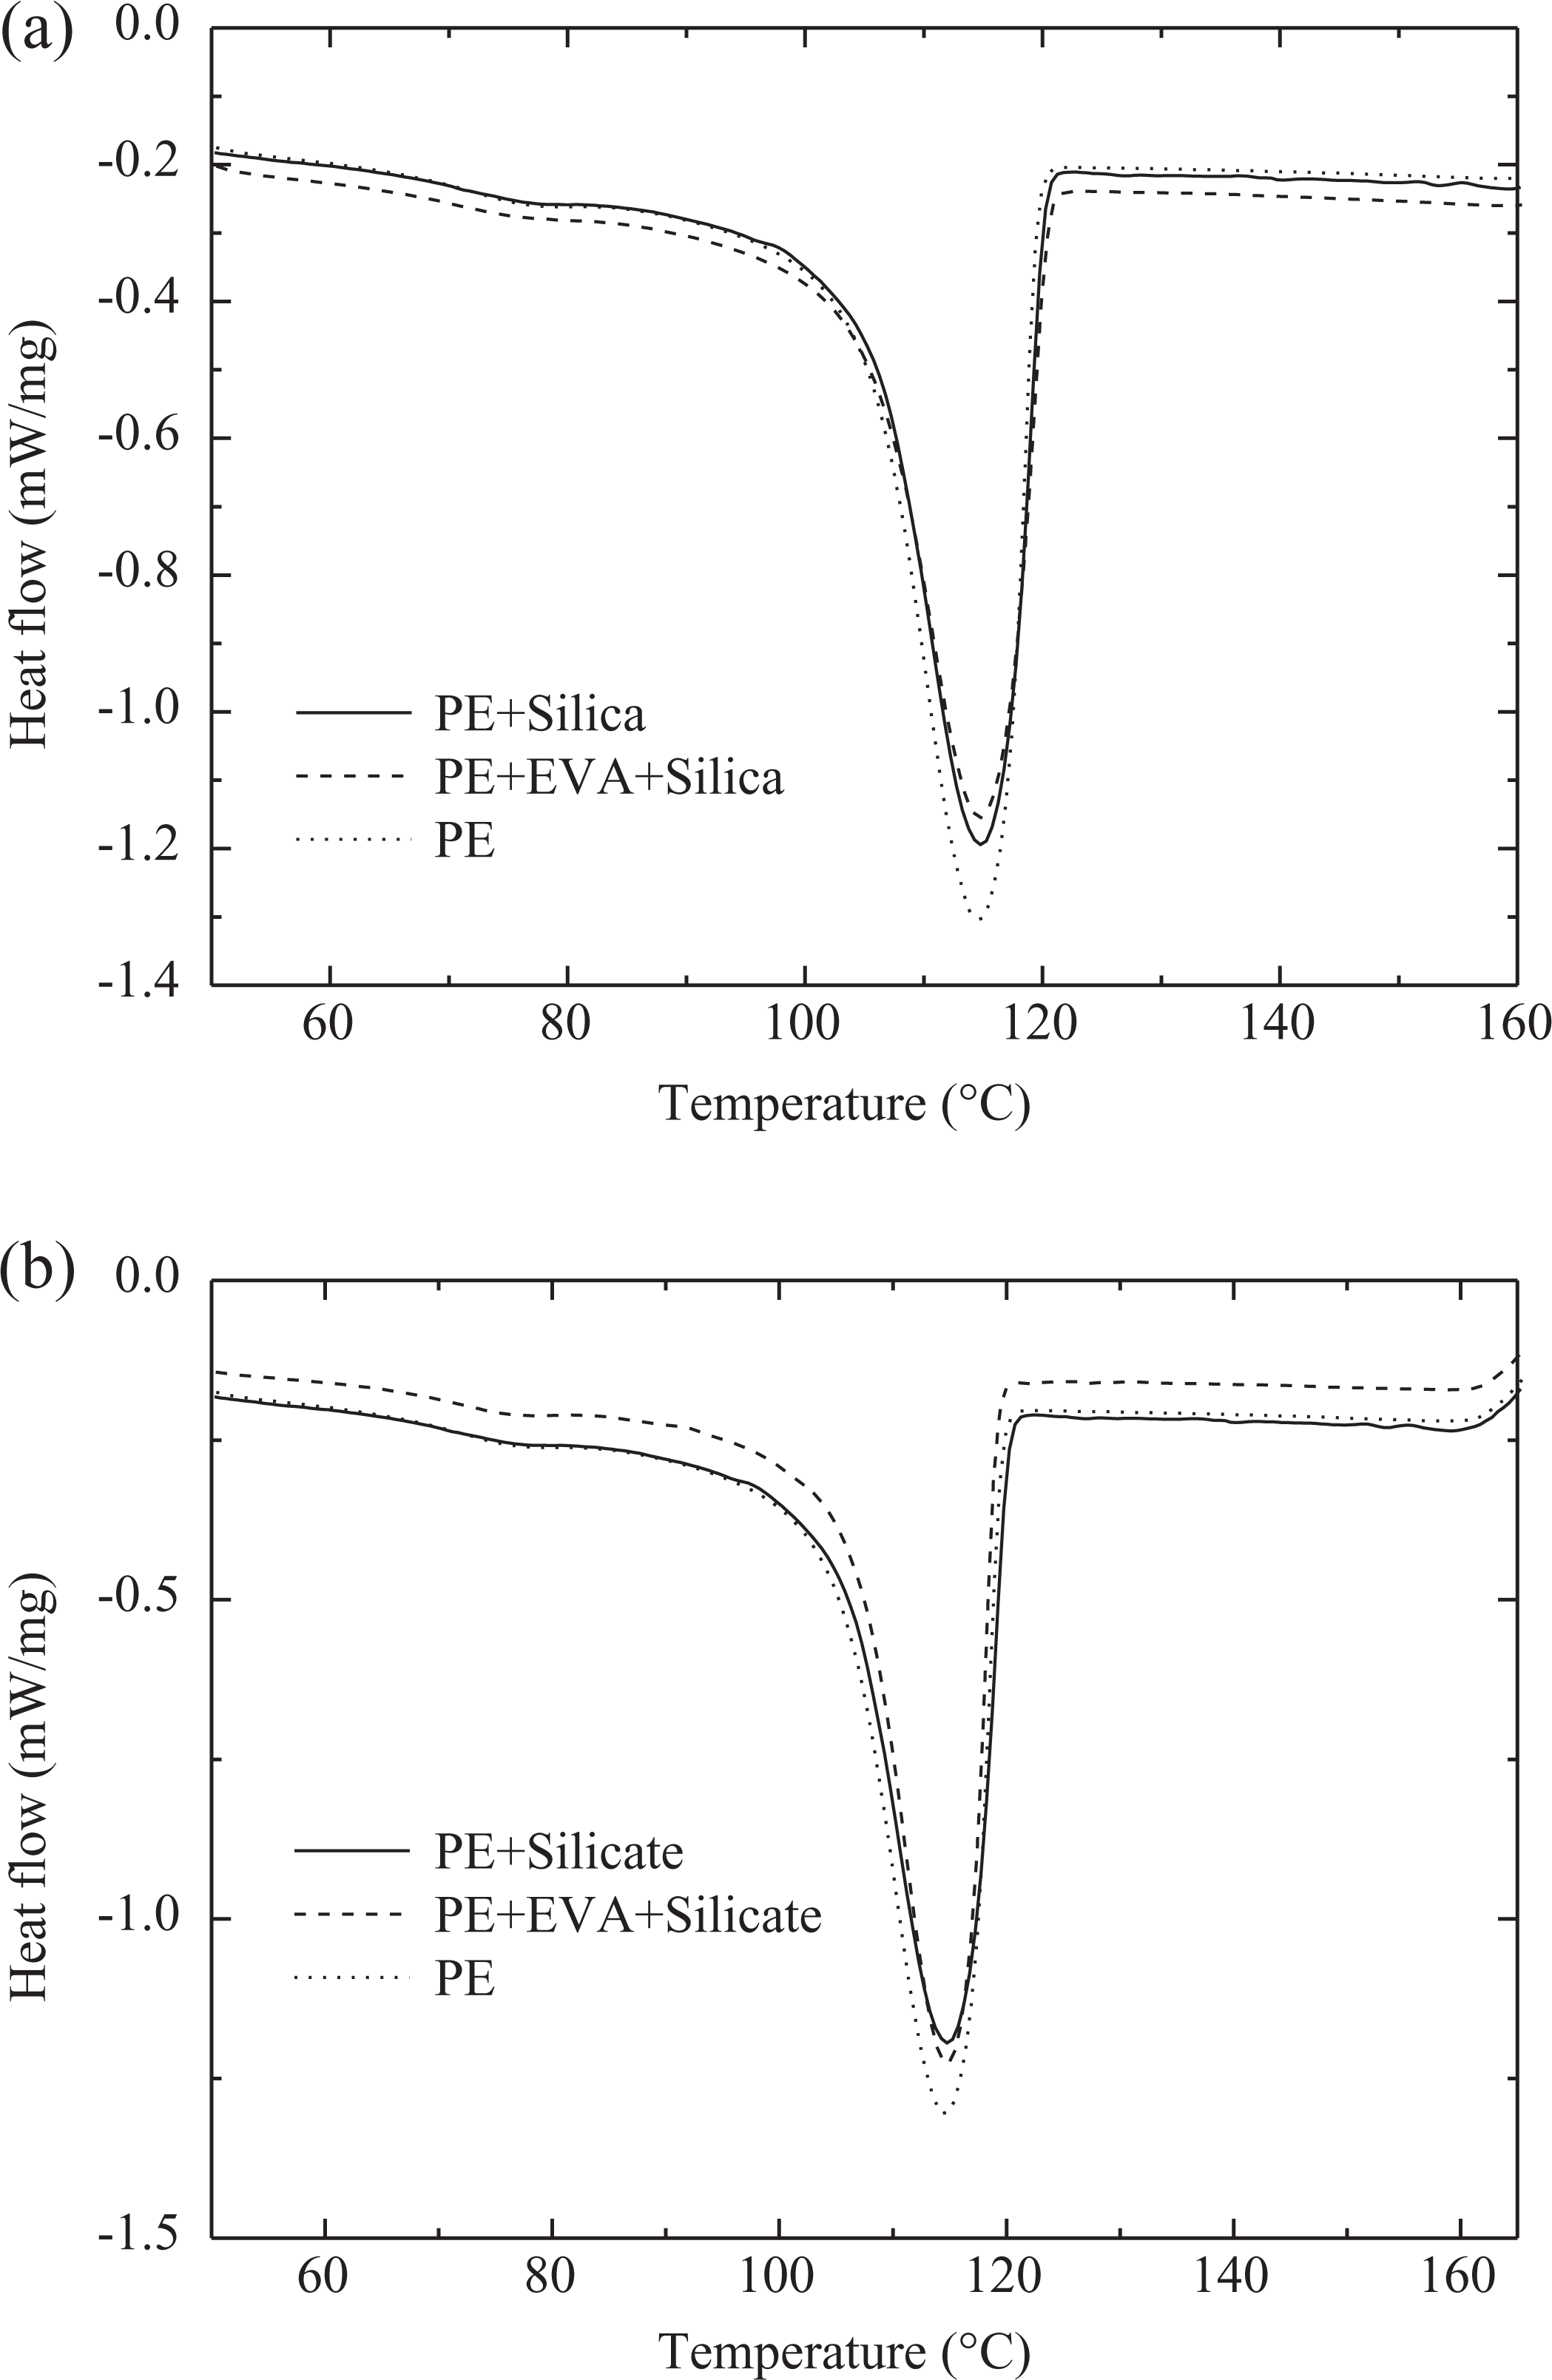
Differential scanning calorimetric thermograms for the crystallization transitions in the pure polymer and composites with (a) silica and (b) silicate (with and without compatibilizer) fillers.
Calorimetric analysis of the pure polymer and composites.
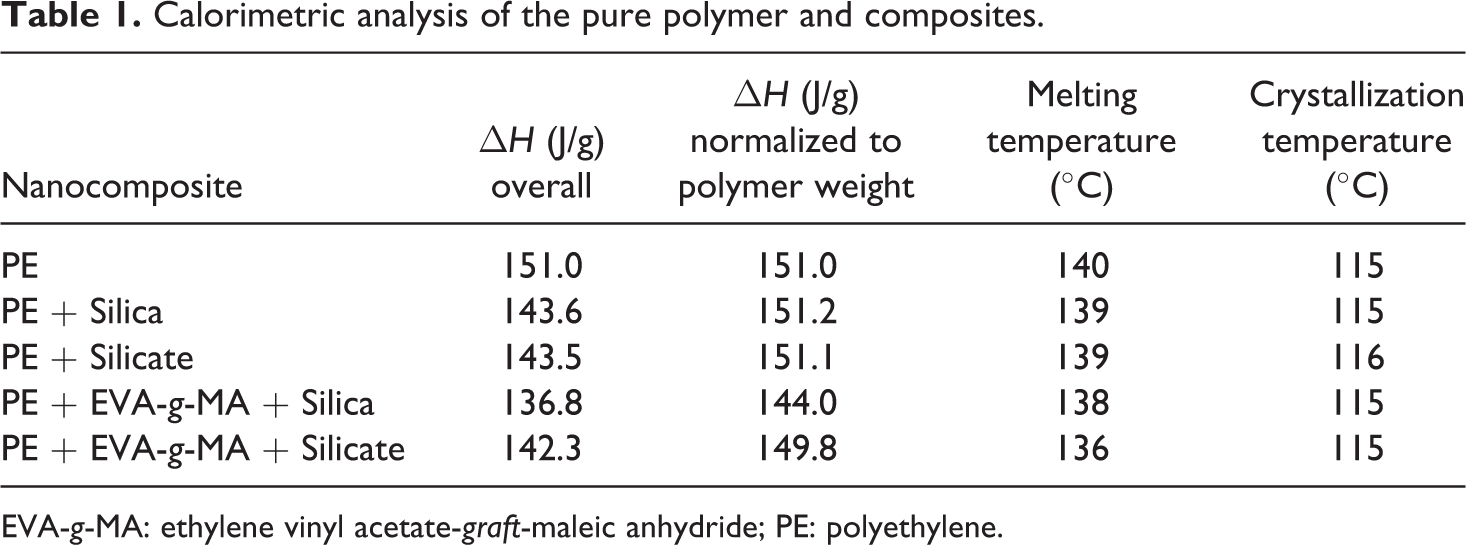
EVA-g-MA: ethylene vinyl acetate-graft-maleic anhydride; PE: polyethylene.
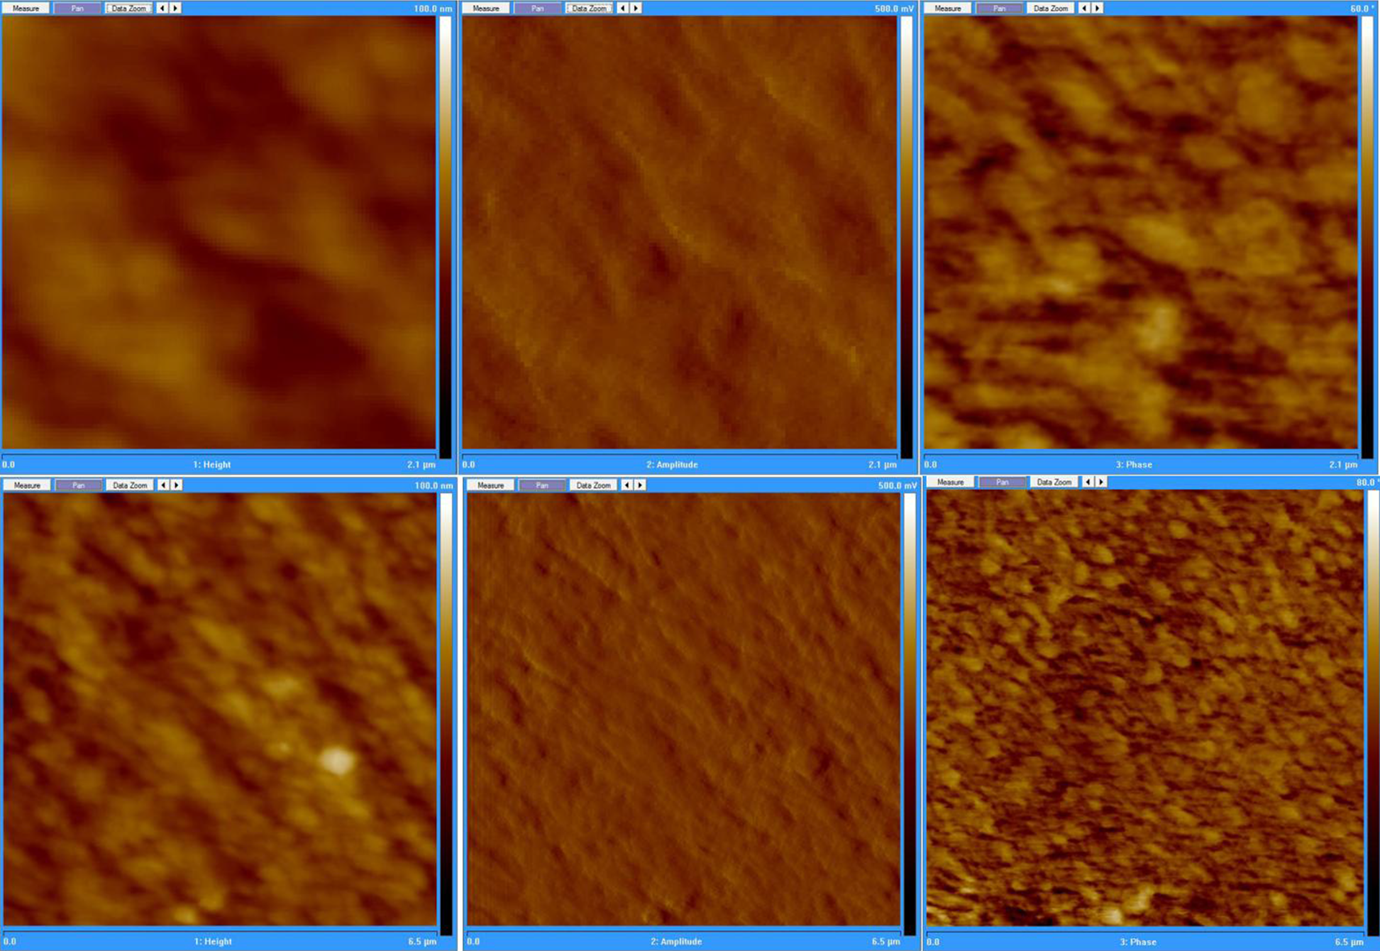
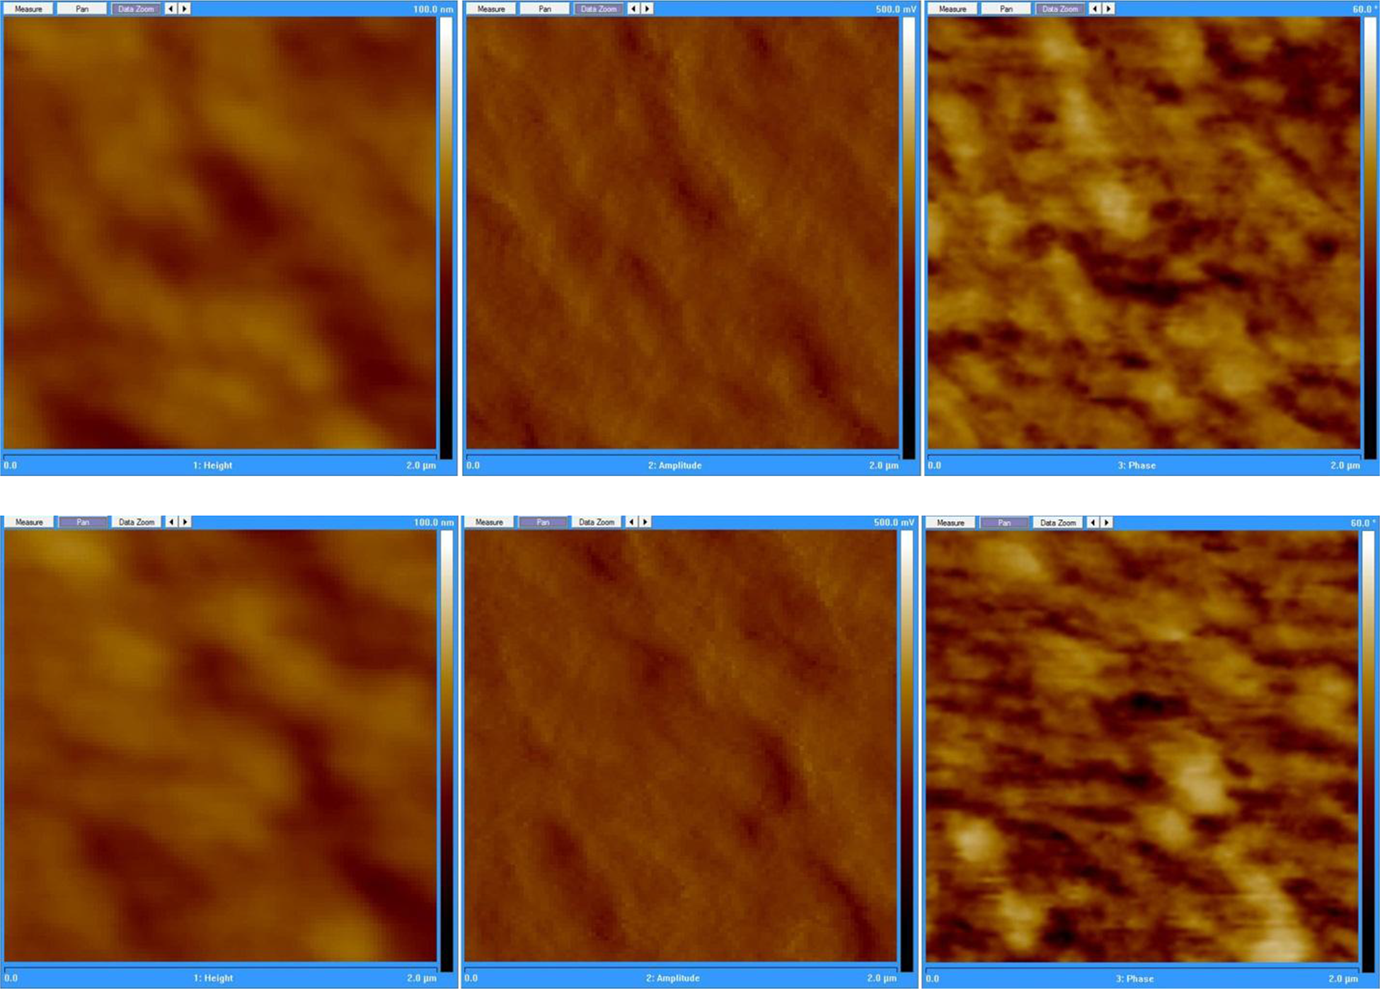
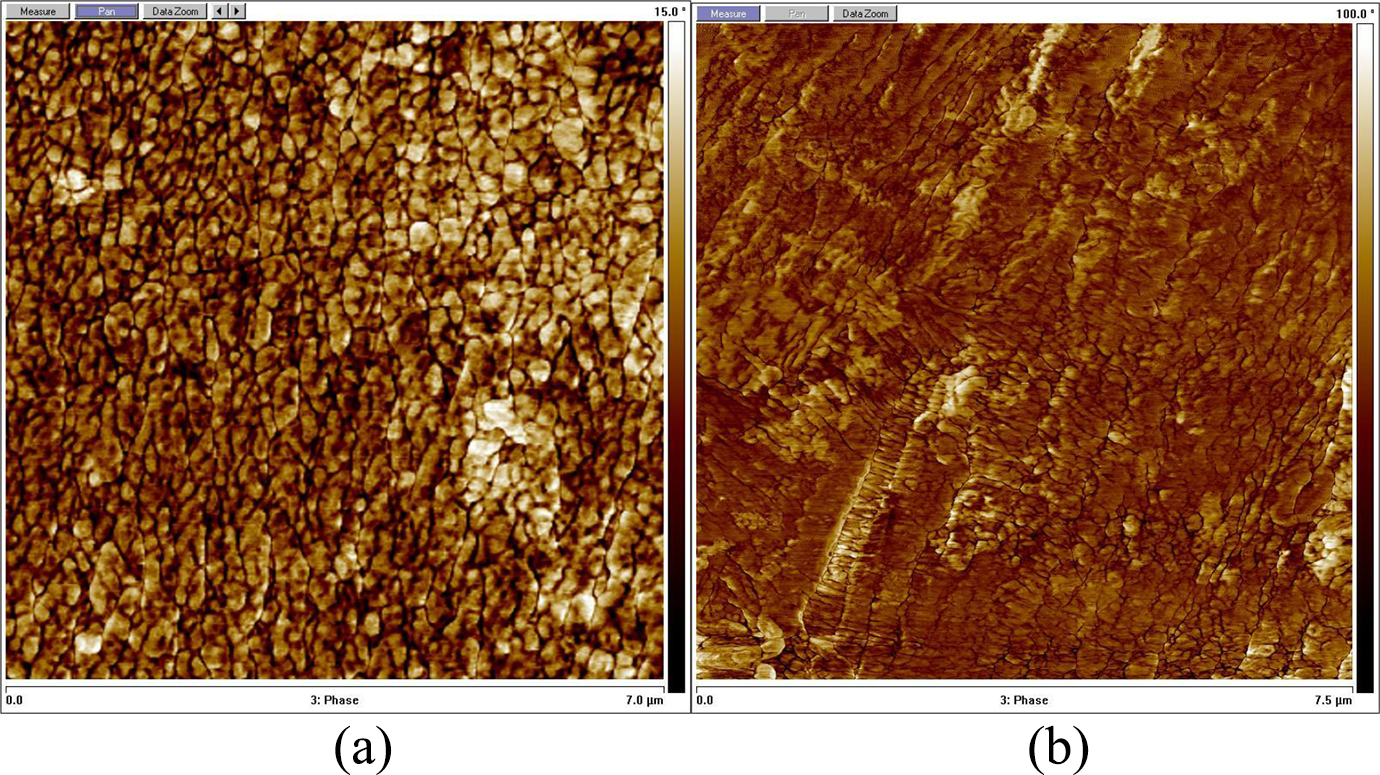
To further characterize the phase morphology of the polymer in the composites, AFM analysis was performed. Figure 5 shows the height, amplitude, and phase images of pure PE at two different magnifications; top row represents higher magnification, whereas the lower row presents the images taken at lower magnification. The pure polymer was observed to have a homogenous ultrastructure as demonstrated in height and amplitude images. The mechanical properties (e.g. hardness and viscoelasticity) were also relatively uniform as indicated in the phase images. As observed in the higher magnification phase image, the crystalline domains in the polymer were narrow in size distribution and were dispersed uniformly. Figure 6 similarly shows the height, amplitude, and phase images of polymer phase in PE– Si (upper row) and PE–silicate (lower row) composites (without compatibilizer). The magnification was kept constant in order to achieve accurate evaluation. The phase images demonstrated similar domains as pure polymer. It confirmed the earlier findings from the calorimetric analysis that the addition of filler did not lead to changes in the phase morphology of the polymer. It should also be noted that such a finding is also dependent on the processing conditions used during the manufacturing of composites, especially the cooling protocols. However, a number of studies on different polyolefin nanocomposites without the use of compatibilizers have also reported similar results for fillers with different surface modifications, 19,21 indicating that it is fairly accurate to conclude that the incorporation of the Si and surface-modified layered silicate do not lead to changes in the crystallinity and phase of the pure polyolefin. However, addition of amorphous compatibilizers as well as degree of filler dispersion may also affect the final polymer morphology in the composites as reported in different studies. 23 –27 The amorphous compatibilizer phase as well as improved filler dispersion may hinder the movement of the polymer chains thus not allowing them to crystallize freely. As observed in the TEM micrographs, the filler dispersion was improved on adding compatibilizer to the system, thus, indicating that this may also have affected the phase morphology of the polymer. Calorimetric studies had also indicated similarly the changes in the polymer phase in the presence of compatibilizer and filler. Figure 7 shows the height, amplitude, and phase images of the polymer phase in the compatibilized PE– Si (upper row) and PE-layered silicate (lower row) nanocomposites. As compared to the pure polymer and polymer phase in the uncompatibilized composites, the phase of the polymer was significantly changed. The morphology was characterized by well-defined curls with higher extent of height variation. However, the color in the phase images was still uniform (no segregation of white (hard) and dark (soft) phases)), which indicated that the polymer was still crystalline and no extensive loss of crystallinity occurred. This was also observed in the calorimetric analysis where the melt enthalpy did not decrease significantly on the addition of compatibilizer. As observed earlier, the polymer morphology was also different in the Si and silicate containing nanocomposites due to different structural morphology of filler particles. In the silicate containing nanocomposites, the wobbly structure of the polymer phase was more pronounced and the concentration of such features was also relatively higher. It should also be noted that different compatibilizers may also modify the polymer morphology differently due to their different structural features and resulting interactions with matrix and filler phases. For comparison, Figure 8 shows the phase images of PE blended with 5 wt% of chlorinated PE. Two different chlorinated PE samples with chlorination levels of 25 and 35% were used. 23 The resulting phase morphology was very different from the PE containing EVA-g-MA compatibilizer. Also, the variations in chlorination level led to different phase morphology. With 25% chlorinated PE, uniform distribution of bright phase inside the dark areas was observed indicating that semicrystalline nature of the polymer was retained. However, its morphology was quite different from pure PE, as in this case, the chains seemed to be shorter in length. With 35% chlorinated PE, the crystalline phases were still present but the order or periodicity was disturbed. Also, the crystalline phases were randomly distributed due to the hindrance of compatibilizer to polymer crystallization. The properties of the polymer were also observed to be affected accordingly due to these phase changes. The polymer with 25% chlorinated PE became brittle at −140°C, whereas the polymer with 35% chlorinated PE was still flexible at −195°C. In comparison, the PE- Si and silicate composites were least elastic and had a brittle failure near −140°C.
Atomic force microscopic height, amplitude, and phase images of pure polyethylene at higher (upper row) and lower (lower row) magnifications.
AFM height, amplitude, and phase images of polymer phase in the PE + Silica (upper row) and PE + Silicate (lower row) composites. AFM: atomic force microscopic; PE: polyethylene.
AFM height, amplitude, and phase images of polymer phase in the PE + EVA-g-MA + Silica (upper row) and PE + EVA-g-MA + Silicate (lower row) composites. EVA-g-MA: ethylene vinyl acetate-graft-maleic anhydride; AFM: atomic force microscopic; PE: polyethylene.
Phase morphology of the polymer mixed with 5 wt% of chlorinated polyethylene with (a) 25% chlorination and (b) 35% chlorination levels.
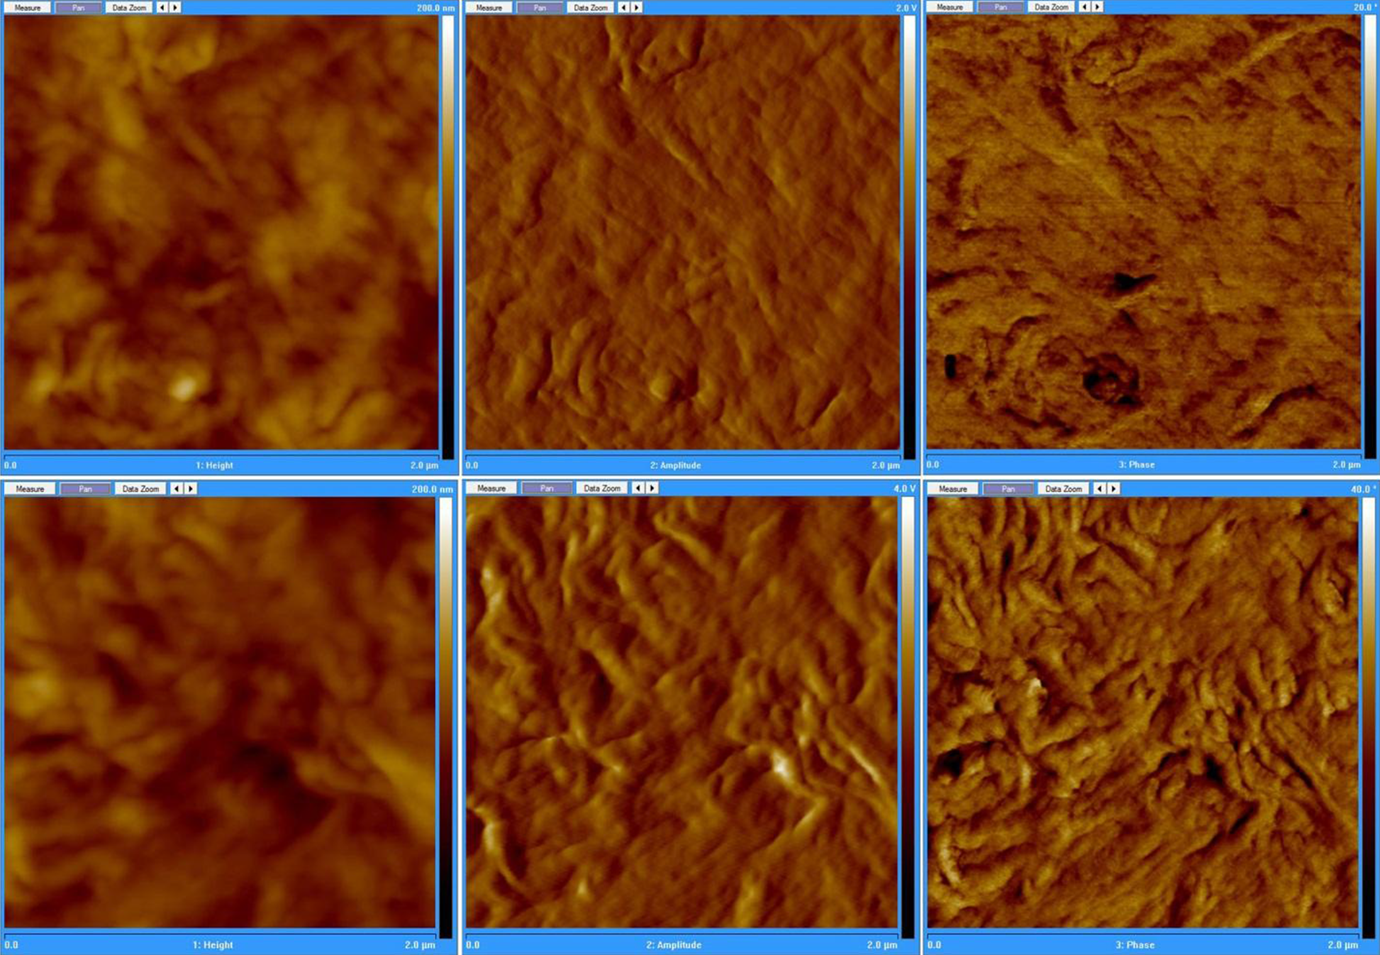
Figures 9 and 10 show the height, amplitude, and phase images of the compatibilized nanocomposites at two different magnifications. In the phase images, the filler particles were white in color signifying harder regions, whereas the polymer phase was dark. The phase of the polymer near the interface with the filler surface as well as in the bulk was similar indicating that the filler did not have any specific effect on the crystallization process, thus also signifying that the observed changes in the phase morphology stem primarily from the compatibilizer addition. Also, as observed in TEM, some aggregates of filler particles were still observed in the micrographs. The filler–polymer interface in the micrographs also indicated less intermixing of the components, thus, the compatibility between the phases may still not be optimum even on adding 5 wt% of compatibilizer; however, it was significantly improved as compared to the uncompatibilized composites. The filler particles were also observed to be partially pulled out during sectioning, owing to lower interfacial interactions between the organic and inorganic phases, which also resulted in much higher height variation in the height images of these nanocomposites.
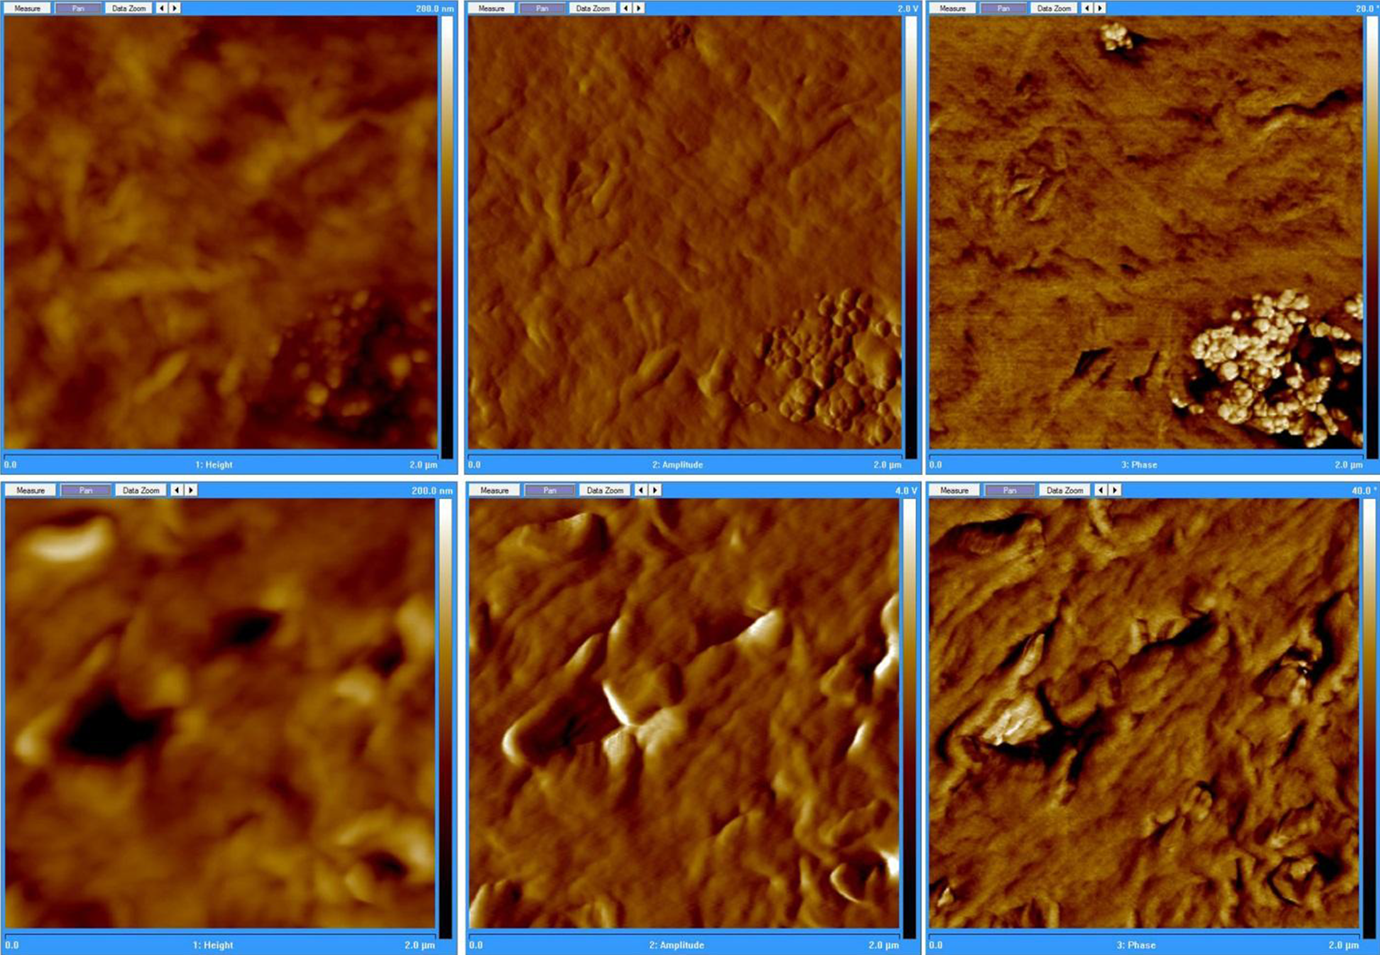
AFM height, amplitude, and phase images of PE + EVA-g-MA + Silica (upper row) and PE + EVA-g-MA + Silicate (lower row) composites at higher magnification. EVA-g-MA: ethylene vinyl acetate-graft-maleic anhydride; AFM: atomic force microscopic; PE: polyethylene.
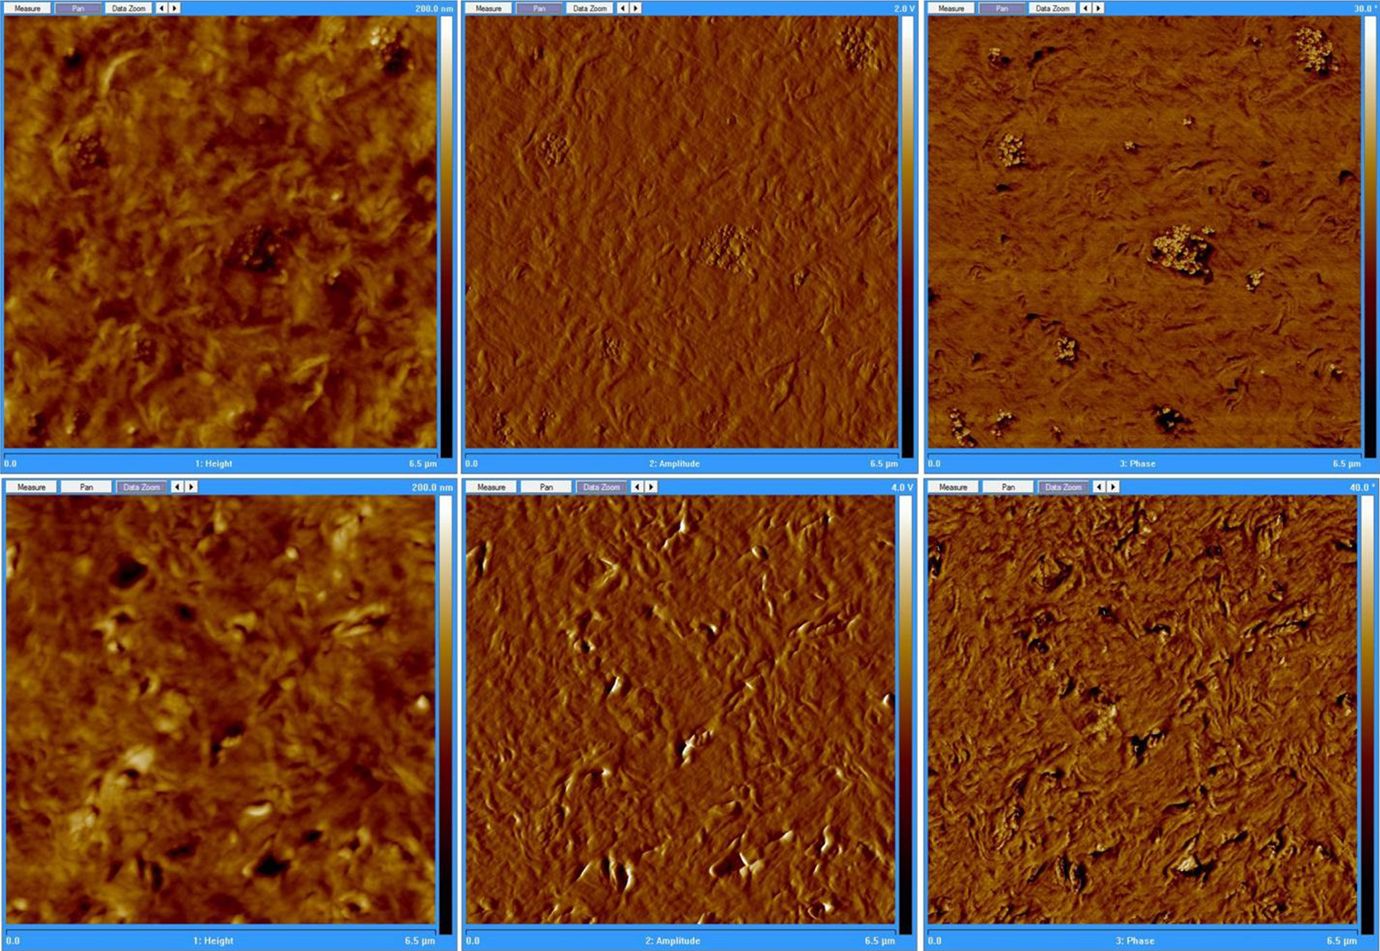
AFM height, amplitude, and phase images of PE + EVA-g-MA + Silica (upper row) and PE + EVA-g-MA + Silicate (lower row) composites at lower magnification. EVA-g-MA: ethylene vinyl acetate-graft-maleic anhydride; AFM: atomic force microscopic; PE: polyethylene.
Figure 11 shows a representation of the use of EELS for gaining further insights into the interfacial interactions between the composite components. In most cases, EELS is expected to offer accurate spatial resolution because the effect of beam broadening and aberrations of the probe-forming lens can be controlled by means of an angle-limiting collection aperture. The technique of EELS is usually applied for the detection of light elements such as carbon (C), nitrogen (N), or oxygen (O). Comparison of the EELS spectra for Si aggregate and polymer matrix phase in the compatibilized PE-Si composite is shown in Figure 11. The presence of Si and O signals confirmed the presence of silicon dioxide, whereas no O signal was detected from the polymer phase. As the compatibilizer chains also contained O atoms, therefore, their absence in the matrix phase may indicate their concentration at the surface of the filler owing to better interfacial interactions between the two. However, it should also be noted that the polymer phase was significantly affected by the addition of compatibilizer; therefore, some compatibilizer was expected to be uniformly present in the matrix. It is thus probable that the concentration of the compatibilizer was low in the matrix phase to be detected by the EELS.
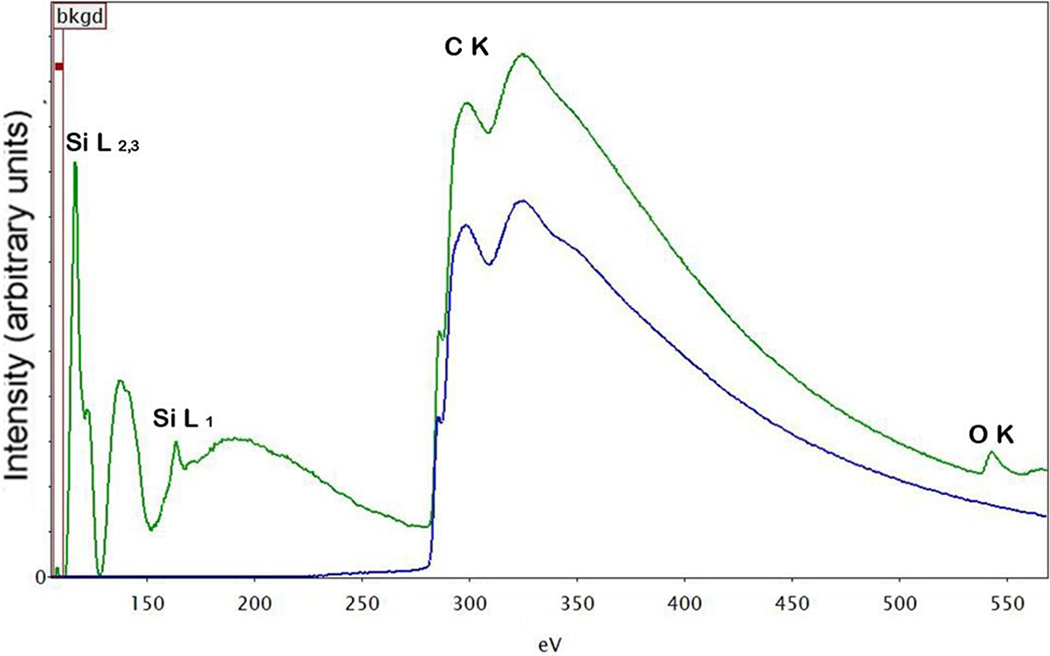
EELS analysis of the silica aggregate (green line) as well as polymer matrix (blue line) for compatibilized PE + Silica composite. PE: polyethylene; EELS: electron energy loss spectroscopy.
Figure 12 demonstrates the EDXS analysis of PE-Si nanocomposite at three different locations: filler surface, polymer matrix, and filler–matrix interface. The Si surface generated strong signals (EDXS (a)) for Si and O elements. It however also contained C and copper signals due to the carbon coating on the copper grid; thus, it is not possible to quantitatively compare the signal intensities; however, a qualitative comparison is still possible. The signal for filler–matrix interface (EDXS (c)) showed reduced Si and O signals due to the contribution from polymer, which also enhanced the C signal. The matrix (EDXS (b)) had insignificant signals of Si and O atoms. Similar analysis was also performed for compatibilized PE-Si composite and the EDXS spectra are shown in Figure 13. The signal for matrix was interestingly similar to uncompatibilized PE-Si composites. It indicated that the content of O (due to compatibilizer chains) did not increase in the matrix phase. It coincided with the observations from the EELS studies, which confirmed that most of the compatibilizer may be present near to the interface with filler owing to better interactions between the two, thus depleting its concentration from the polymer phase. The extent of oxygen in the filler–matrix interface spectrum was also observed to increase as compared to the PE-Si composite. This enhanced signal would have been contributed both by Si particles as well as compatibilizer chains. Similar observations have also been made for PE–graphene nanocomposites compatibilized with chlorinated PE as compatibilizer. 23
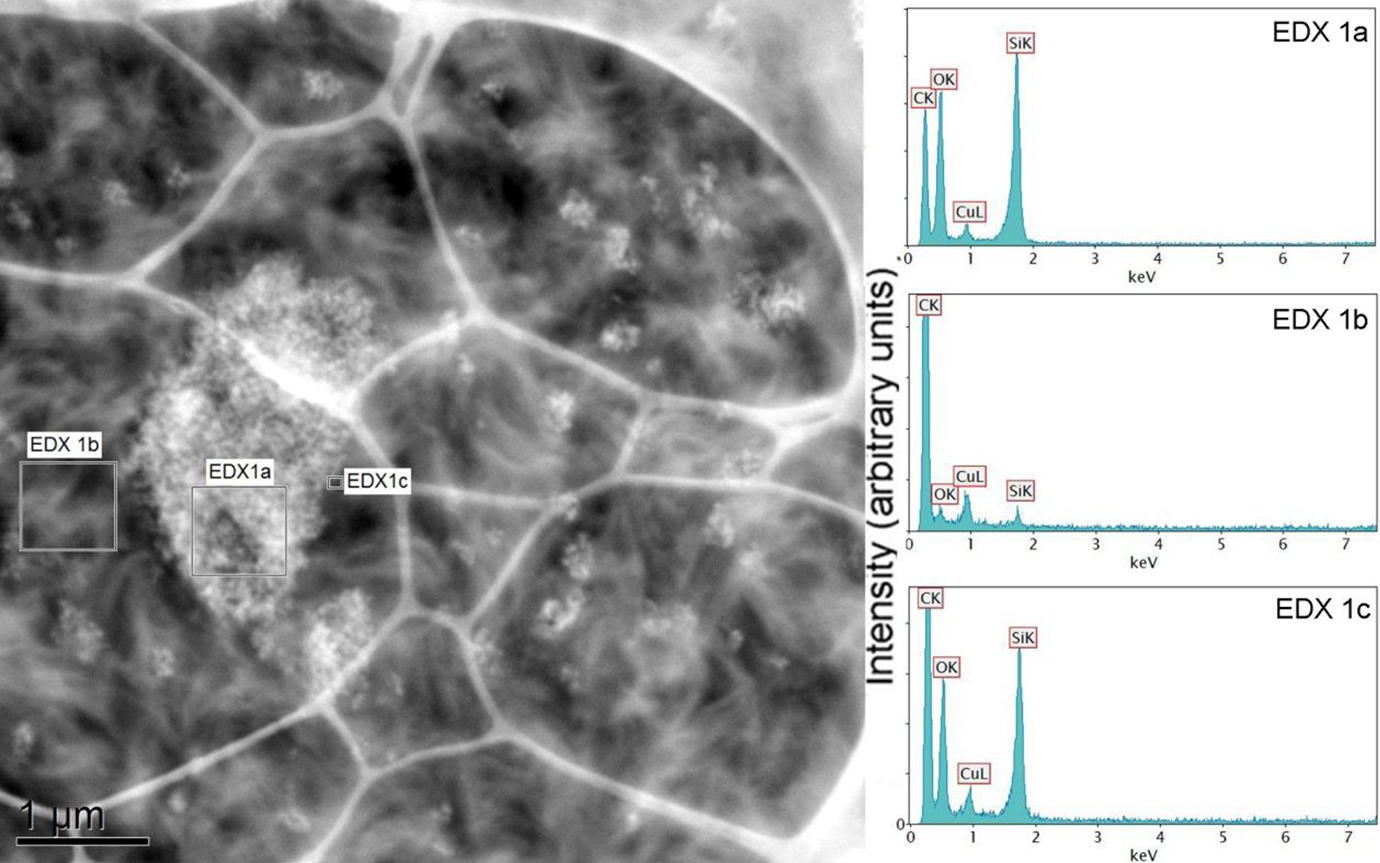
EDXS analysis of PE + Silica sample: ‘EDXS (a)’ corresponds to silica aggregate; ‘EDXS (b)’ is the matrix phase, whereas ‘EDXS (c)’ demonstrates the silica-polymer interface. PE: polyethylene; EDXS: energy-dispersive x-ray spectroscopy.
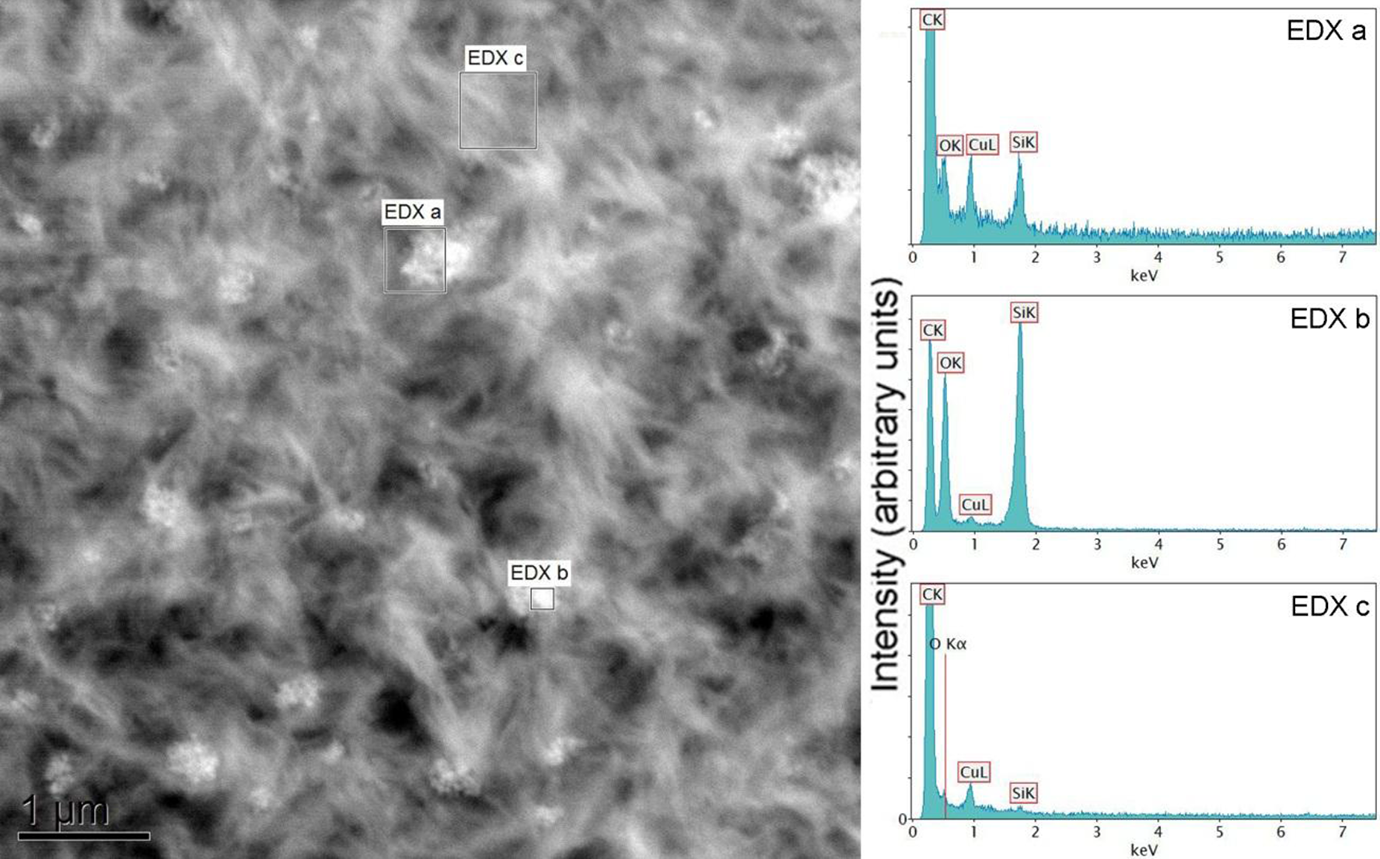
EDXS analysis of PE + EVA-g-MA + Silica sample: ‘EDXS (a)’ corresponds to polymer–silica interface; ‘EDXS (b)’ is the filler phase, whereas ‘EDXS (c)’ demonstrates the polymer matrix. EVA-g-MA: ethylene vinyl acetate-graft-maleic anhydride; PE: polyethylene; EDXS: energy-dispersive x-ray spectroscopy.
Figures 14 and 15 show the EDXS analysis of the uncompatibilized and compatibilized PE-layered silicate nanocomposites, respectively. The spectrum of filler surface in PE–silicate composite (Figure 14, EDXS (b)) indicated the presence of Si, aluminum (Al), and O atoms, which confirmed that the filler was aluminosilicate. Thus, due to elemental distribution detection, EDXS analysis could be used to identify the filler phase in the nanocomposites. The interface (EDXS (a)) showed a reduced intensity of Si, Al, and O signals due to contribution by polymer. The polymer phase showed negligent signals for O and Si due to some dispersed platelets. The compatibilized sample spectra as shown in Figure 15 indicated that the signal of oxygen slightly improved in the matrix phase; however, the corresponding signal of Al and Si also enhanced indicating that the increase in concentration of oxygen in matrix phase may have resulted from delaminated filler platelets. In the spectrum for filler–polymer interface, the relative signal of O was higher than the Si intensity as compared to the uncompatibilized composite. It further confirmed that the compatibilizer would have interacted positively with the surface of the silicate platelets, thus, accumulating near their surface. It, thus, resulted in better filler dispersion in the presence of compatibilizer as observed earlier in TEM.
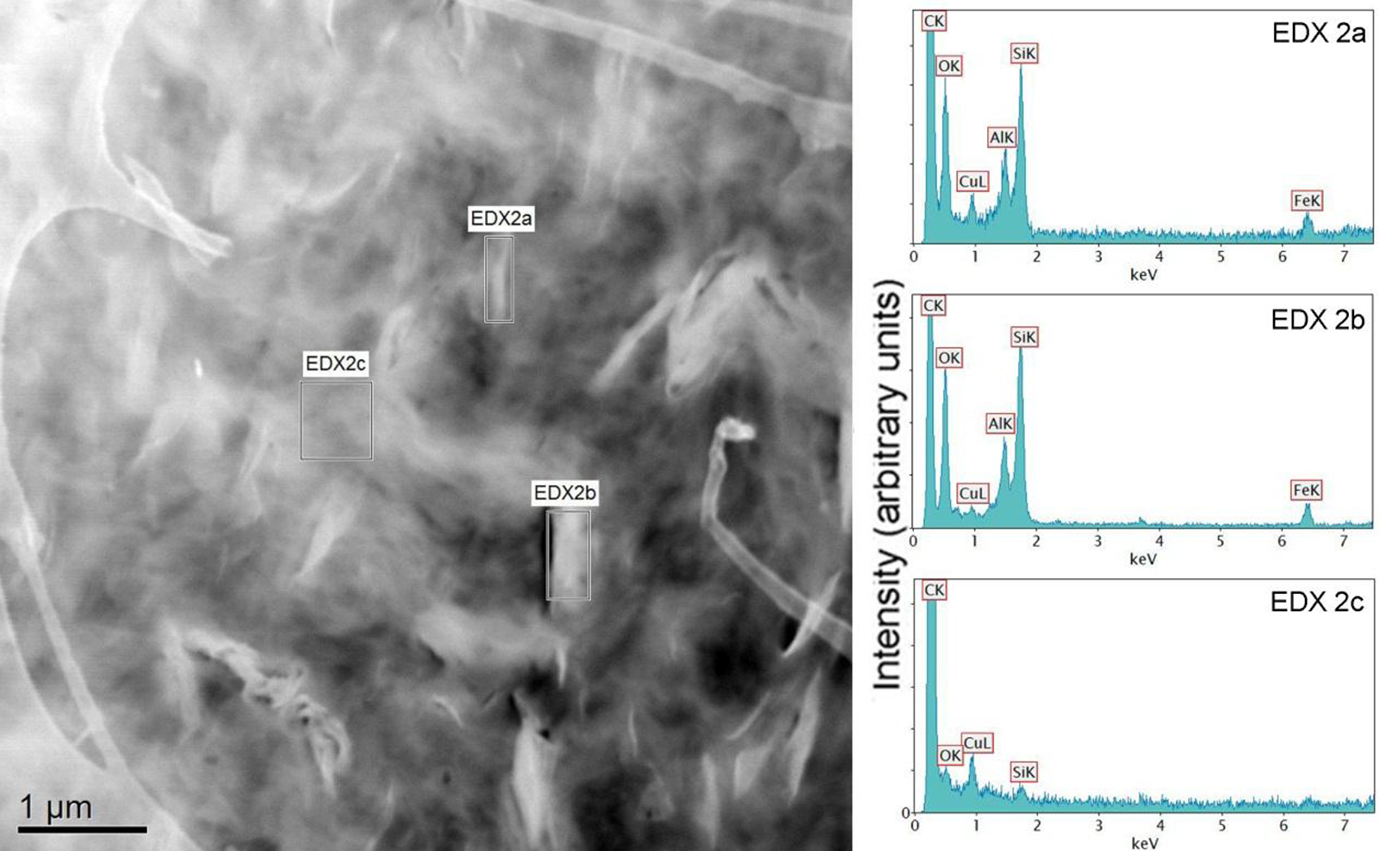
EDXS analysis of PE + Silicate sample: ‘EDXS (a)’ indicates the polymer–silicate interface; ‘EDXS (b)’ corresponds to the filler phase, whereas ‘EDXS (c)’ represents the polymer matrix. PE: polyethylene; EDXS: energy-dispersive x-ray spectroscopy.
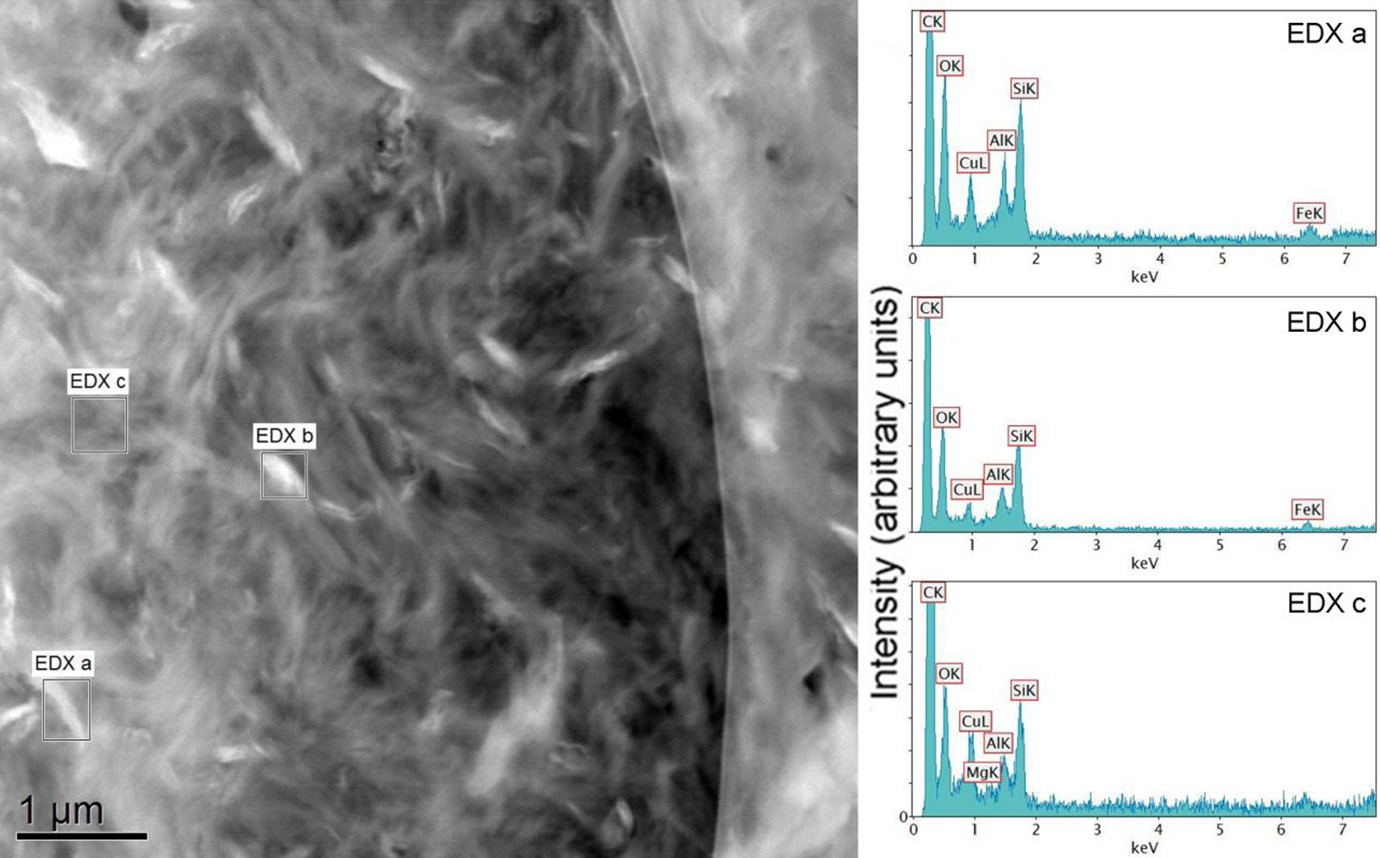
EDXS analysis of PE + EVA-g-MA + Silicate sample: ‘EDXS (a)’ represents the polymer–silicate interface; ‘EDXS (b)’ corresponds to the filler phase, whereas ‘EDXS (c)’ represents the polymer matrix. EVA-g-MA: ethylene vinyl acetate-graft-maleic anhydride; PE: polyethylene; EDXS: energy-dispersive x-ray spectroscopy.
Conclusions
Various aspects of composite morphology were analyzed in the current study using microscopy and calorimetry methods. The addition of compatibilizer resulted in better filler dispersion in the polymer matrix as the mean size of the filler particle stacks/aggregates reduced in its presence. The positive interactions between the polar filler surface and polar component of the compatibilizer chains were concluded to result in enhanced filler delamination. The crystalline phase of the polymer was also affected on compatibilizer addition and the effect was also dependent on type of filler. The melt enthalpy in the case of compatibilized composites decreased indicating restrictions posed by the compatibilizer chains as well as dispersed filler particles on the crystallization of polymer chains. AFM analysis also confirmed the findings from the calorimetry analysis. The phase of the polymer was same as pure polymer in the case of uncompatibilized composites, whereas it was significantly modified in the case of compatibilized composites. Moreover, the pullout of the filler particles from the matrix phase was also observed in AFM analysis, which indicated that the compatibility between the phases can still be improved. The EELS and EDXS analysis further confirmed that the presence of O atoms corresponding to compatibilizer chains was negligible in the matrix and the compatibilizer phase was concentrated near the interface with the filler. This was also confirmed by the enhanced O atom concentration near the interface on adding compatibilizer to the system. These techniques could also detect the presence of particles of different filler types; thus, they are useful tools in detecting filler structural composition in unknown materials.
Footnotes
Acknowledgement
The authors thank F. Patwary at The Petroleum Institute, Abu Dhabi, United Arab Emirates, for the composite preparation.
Funding
This research received no specific grant from any funding agency in the public, commercial, or not-for-profit sectors.