
Abstract
PVA/CNT nanocomposite films with 10, 20, and 30 wt% CNT were prepared by casting evaporation. X-ray diffraction (XRD) confirmed the formation of monoclinic crystal structure with ≈4 nm. The unit cell volume as well as interchain distances decreased from 67.31 to 64.55 m3 and from 5.81 × 10⁻¹⁰ to 5.64 × 10⁻¹⁰ m, respectively, with the increase in CNT concentrations. Due to sensitivity of PVA/CNT films to trace elements, ion beam techniques RBS, PIXE, and ERDA provide information about the light elements’ content and distribution. SEM showed textured, complex surfaces, with layered structure morphology for PVA/CNT films. TGA exhibits three stages for thermal degradation with a remarkable stage at 230 °C–280°C with major weight losses (67%, 55%, and 60%) for the 10, 20, and 30%CNT films. Fourier Transform Infrared spectroscopy (FTIR) obtained the information on spectroscopic functional groups of the films. (PVA)90(CNT)10 sample shows a higher brittleness value (2.12 × 10⁻³ (MPa)−2) due to the tensile modulus and the tensile elongation values. Most significantly, optical properties exhibited tunable indirect band gaps: 4.7 eV (10 wt%), 3.75 eV (20 wt%), and 2.9 eV (30 wt%), demonstrating excellent potential for optoelectronic device applications.
Keywords
Introduction
Because of their distinct physical and chemical characteristics, as well as their low cost, ease of production, stability at intermediate temperatures, transparency at visible and infrared wavelengths, and other unique properties, polymers have attracted much interest from researchers.1,2,3 Some polymers, such as polyvinyl alcohol (PVA) and polyvinyl chloride (PVC), are beneficial in various applications because of their high transparency, allowing them to transmit a broad spectrum of wavelengths. PVA polymers have unique optical, physical, and chemical properties in addition to being readily fabricated highly hydrophilic, non-toxic, readily available and having a high dielectric strength.4,5 Because of the these unique characteristics, PVA polymer shows promise for various applications, for instance, optoelectronic devices, food packaging, drug delivery, wound dressing, tissue regeneration, containers, and antimicrobial products.6,7 Moreover, doping these polymers with appropriate nanoparticles or nanofillers, to form polymer nanocomposites, can further improve their characteristics. 8 Dopants’ specific shape, large surface area, and compact size are the essential characteristics that support the polymer’s qualities. 4 Polymer nanocomposite have unique properties as they combine the beneficial characteristics of both polymer and the nano-dopants. In addition, polymer nanocomposite films have advantageous features such as lightweight and high flexibility, many studies have shown the usage of polymer nanocomposites in several applications.9,10,11,12
Polymer nanocomposites have been the subject of numerous investigations; nonetheless, more research needs to be done on the optical characteristics of PVA polymers. PVA’s optical and structural characteristics were examined when graphene oxide (GO) was added in small amounts—up to one wt percent. The PVA films’ direct and indirect optical band gaps were lowered by adding GO. 4 The effect of GO on the characteristics of PVA polymer has been the subject of several investigations.13,14 Farrag et al. prepared pleathered-MWCNTs/PVA nanocomposites films via casting method. They studied the electrical and optical properties of the films. Their achieved results revealed a percolation threshold for the ohmic conductivity was about 0.8% with achieving homogeneous PT-MWACNTs distribution throughout the PVA films with a decreasing in the optical gap (4.40-2.96 eV). 15 On the other hand, Xie et al. used multiwall carbon nanotubes with SiO2 nanohybrids that were functionalized with poly (sodium-p-styrenesulfonate) (PSS). Then, they studied their effect on PVA and polyurethane (PU). They concluded their work into two points: the first one, SiO2 coated the CNT (core/shell), secondly the thermal degradation was evaluated for PVA and PU due the existence of SiO2/CNT nanoparticles. 16 Alruwaili et al. studied the optical and electronic properties of PVA polymeric films and showed how the nanoparticles affected their structure-optical characteristics and relationships with a full explanation of PVA-based advanced materials for optoelectronic applications. 17
Owing to their exceptional physical characteristics such as strength, to a degree that they are more strong than steel18,19, carbon nanotubes (CNTs) have emerged as a prominent subject of study in various fields, including electronics, chemistry, material science, and, most recently, photonics. CNTs are tubular structured materials that belongs to fullerene family, they are formed when a carbon honeycomb sheet rolls inward to form a cylinder. Because of their remarkable nonlinear optical properties—such as their ultrafast recovery time, high third-order optical nonlinearity, and broad bandwidth operation— CNTs are quickly establishing themselves as essential parts of a variety of photonic devices, including intensity-dependent passive mode-locked lasers and saturable absorbers used for noise suppression. 20
The physical presence of the nanoparticle dopant, its interaction with the polymer, and its state of dispersion; all contribute to the properties of the whole formed nanocomposite. One apparent benefit of nanoparticles additives to the polymer is their relatively reduced loading needed compared to other conventional additives. When they used as reinforcing agents, micro-sized particles scatter light, lowering optical clarity and light transmission. Highly transparent films, coatings, and membranes can be developed with the potential of eliminating scattering by combining effective nanoparticle dispersion and strong polymer–particle interfacial adhesion. 21 While the optical qualities are intended to achieve superior reflection, antireflection, interference, and polarization properties, electrical conduction in polymers has been explored to comprehend the nature of the charge transport prevalent in these materials. 22 The electrons would absorb most of the radiation coming in and would move from the valence band into the conduction band if the materials’ band gaps were narrow. However, it is anticipated that CNTs will increase light scattering within PVA films, extending photons' paths, especially in the UV–vis range.23,24
PVA/CNT nanocomposites, particularly, have drawn much interest due to their superior qualities, strong performance, and various uses.25,26,27 Many significant elements of the optical characteristics of PVA/CNT nanocomposites remain unresolved despite the extensive research on these materials. This work employed CNTs as a nanofiller in a PVA matrix to enhance the structural, thermal, mechanical, spectroscopic, and optical properties of PVA/CNT nanocomposite films. Due to the ability of CNTs to tune the PVA properties by aligning the polymer chains distances, and other structural characteristics PVA/CNT nanocomposites could be utilized as a functional material. So, XRD was used extensively to investigate the structural properties and the effect of CNTs on the PVA matrix. Ion beam analysis was employed for depth profile investigations for PVA/CNT systems. The role of CNT in influencing the thermal stability of the PVA matrix and the reflection of it on the mechanical characteristics of the materials will be reported. PVA/CNT are promising flexible optoelectronic materials, so the optical properties and the optical energy gap are studied in our work.
Experimental work
Preparation technique
The PVA/CNT nanocomposite films were prepared using commercially available materials including poly (vinyl alcohol) (PVA) with 98.0-98.8 mol% hydrolysis and molecular weight of 61,000 Da (Sigma-Aldrich, USA), multi-walled carbon nanotubes (CNTs) with 95% purity and length of 1-5 μm (Nanocyl SA, Belgium), distilled water (laboratory grade), ethanol with 99.9% purity (Merck KGaA, Germany), and an ultrasonic probe operating at 500W and 20 kHz (Hielscher Ultrasonics, Germany). All chemicals were used as received without further purification.
The preparation process began with the formation of individual polymer and filler solutions using the casting evaporation technique. For the PVA solution, 2 g of PVA powder were dissolved in 100 mL of distilled water at 85°C under continuous magnetic stirring at 400 r/min for 24 hours to ensure complete dissolution. The resulting solution was then cooled to room temperature and allowed to rest for 2 hours to eliminate trapped air bubbles. Simultaneously, the CNT dispersion was prepared by adding 0.02 g of CNT powder to 30 mL of distilled water, followed by magnetic stirring until a homogeneous solution was achieved after 72 hours of continuous mixing.
The nanocomposite film fabrication involved preparing three different PVA/CNT weight ratios designated as (PVA)100-x (CNT)x, where x represents 10, 20, and 30 wt%. For each composition, the appropriate volume of CNT dispersion was added to 5 mL of the prepared PVA solution. The mixture was then homogenized using a high-shear mixer operating at 8000 r/min for 24 hours to ensure uniform distribution of CNTs throughout the polymer matrix. Following homogenization, the mixture was degassed in a vacuum chamber for 20 minutes to remove any residual air bubbles.
The final film formation was achieved by casting the degassed solution onto clean glass plates measuring 20 cm × 20 cm. The cast films were dried in a controlled environment chamber maintained at 40°C and 50% relative humidity for 48 hours to allow complete solvent evaporation. After drying, the films were carefully peeled from the glass substrates to obtain free-standing nanocomposite films, as illustrated in Figure 1. Schematic diagram for three-step casting evaporation method with the full procedure and conditions for preparing (PVA)100-x (CNT)x nanocomposite films.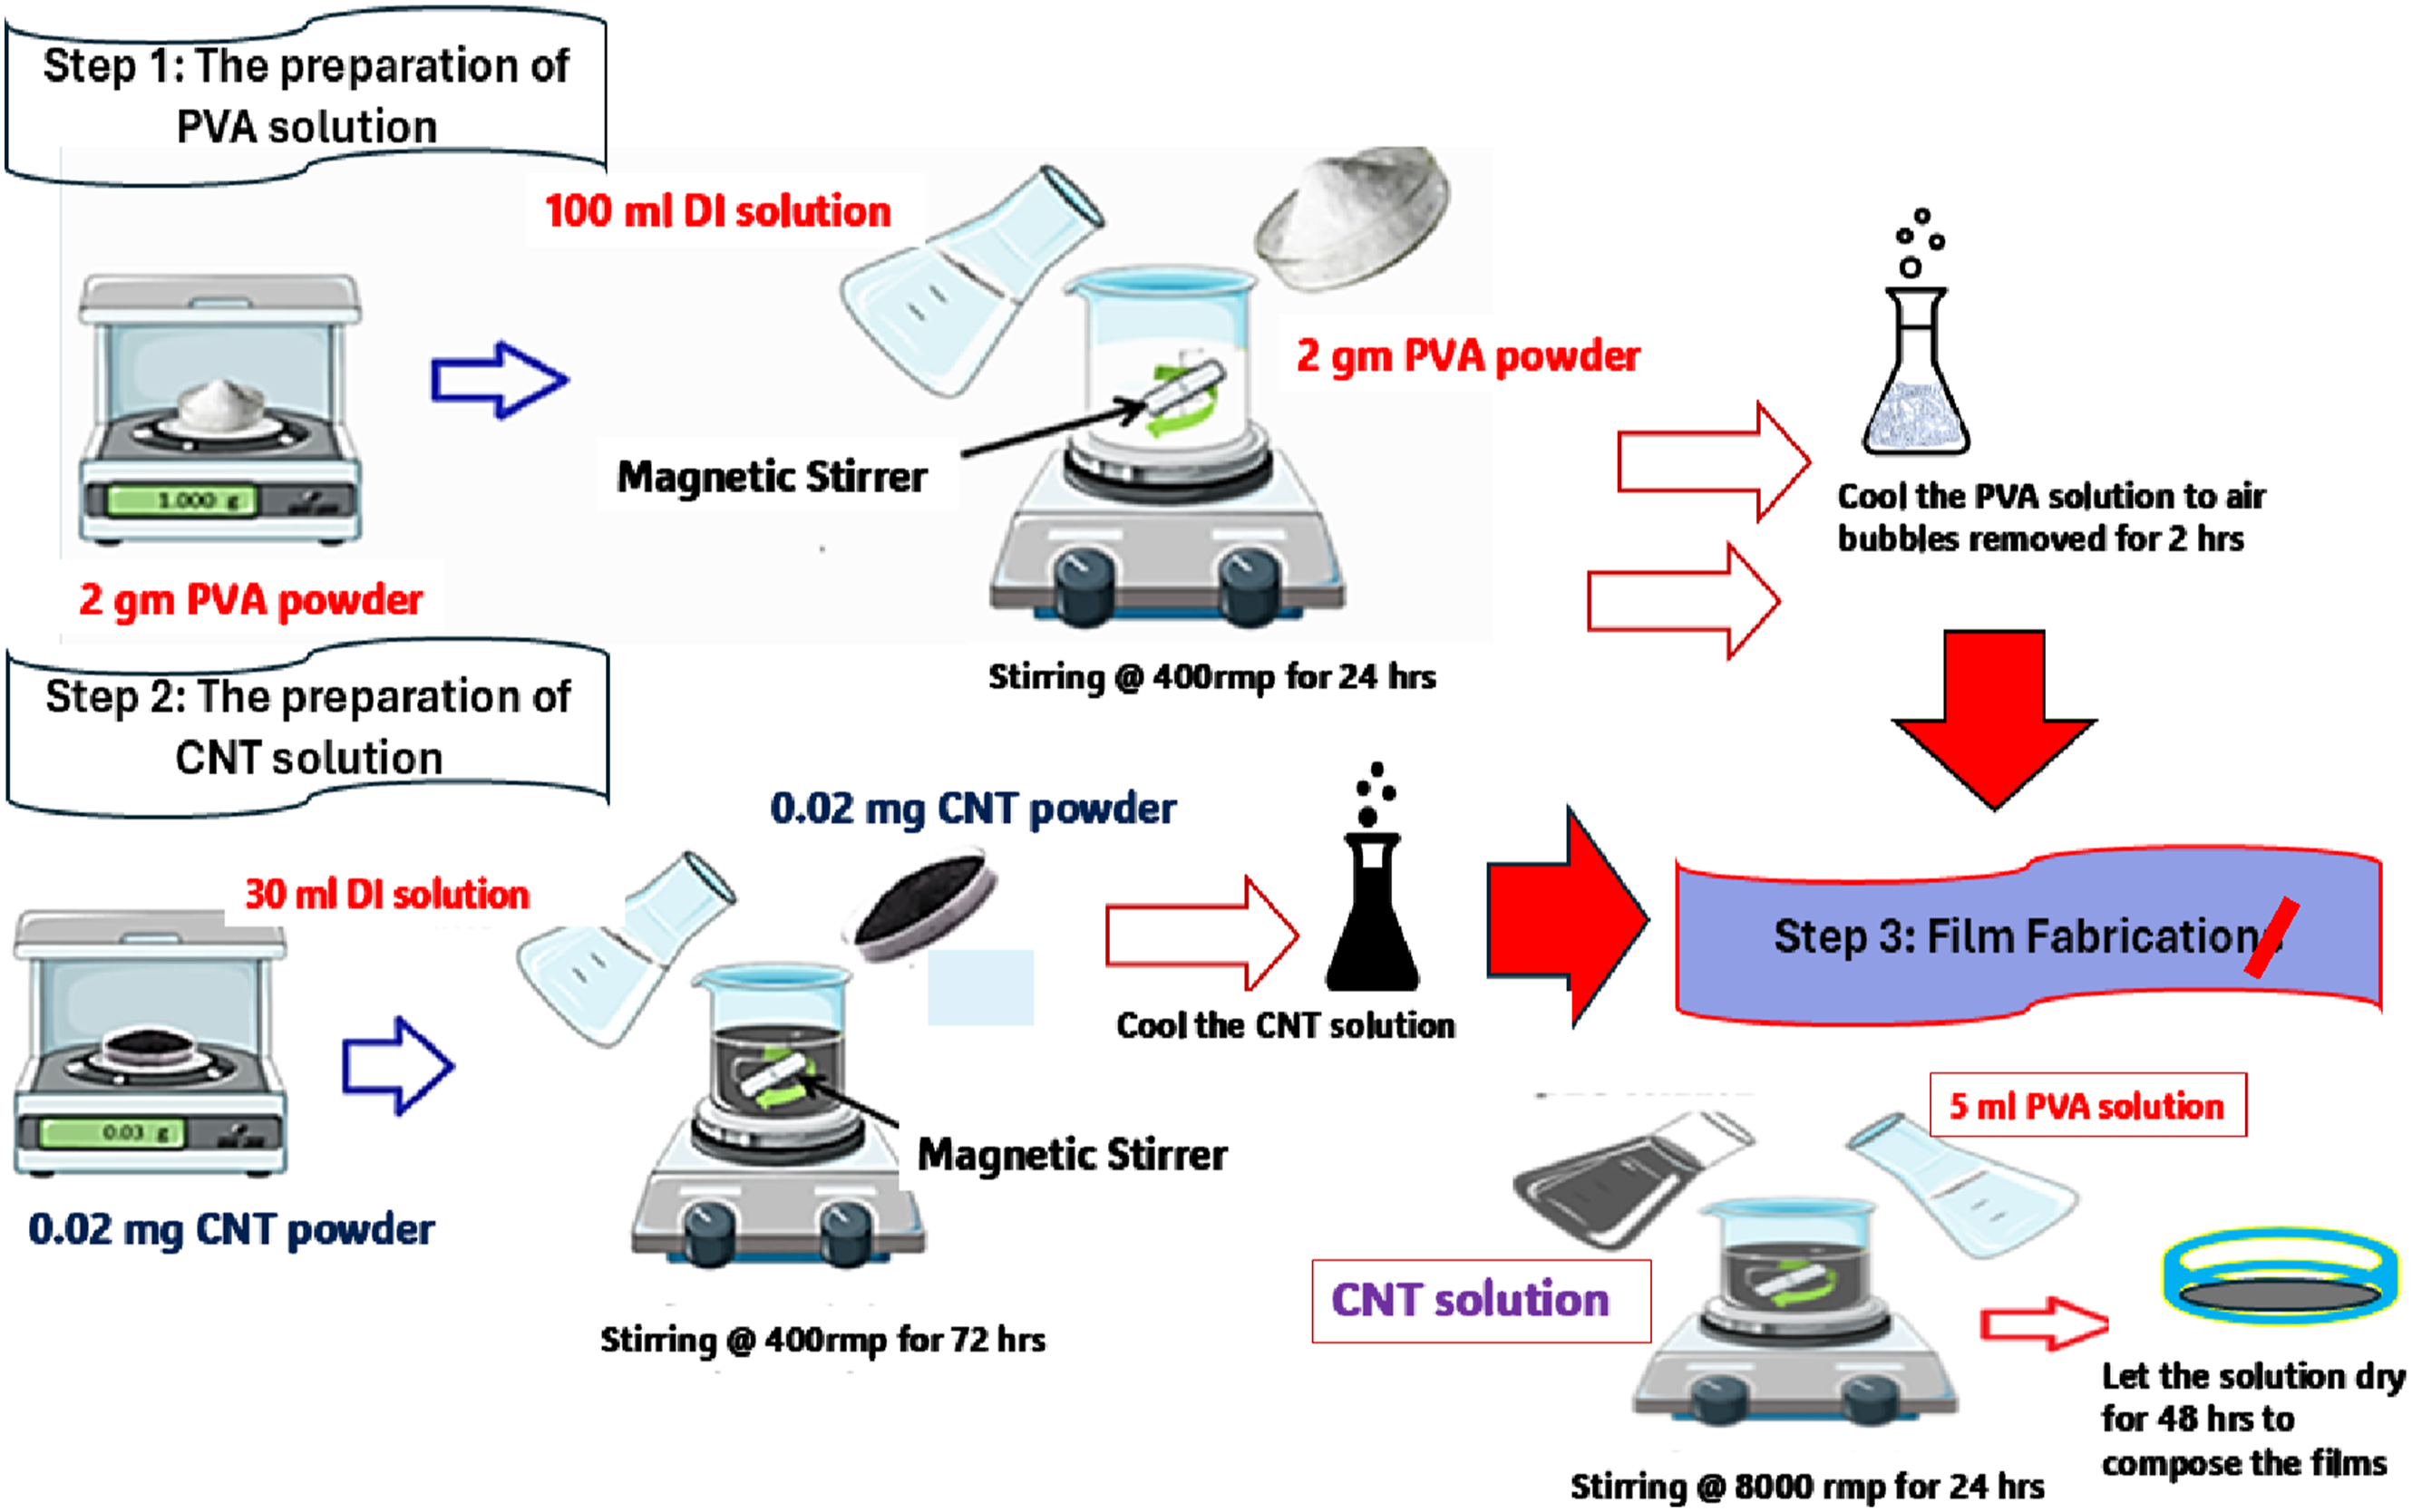
Characterization methods
To analyse the structural composition of the PVA/CNT nanocomposite films, a comprehensive suite of analytical techniques was employed. X-ray diffraction patterns were obtained using a state-of-the-art Shimadzu XD-3A system, with measurements taken across a 2θ range of 4° to 80° at 0.06° increments per second, utilizing a monochromatic Cu-Kα radiation source
In order to calculate the lattice parameters and unit cell volume, the Unitcell software was used, besides the using of the following relations to investigate the various structural parameters of PVA/CNT nanocomposite films as follows
28
:


Where, β is the full width at half maximum (FWHM).
Molecular interactions within the nanocomposites were probed via Fourier-transform infrared spectroscopy, employing a Bruker Vector 22 instrument to capture spectra spanning 400 to 4000 cm−1. Additionally, the morphological features of the nanocomposite films were examined using scanning electron microscopy, with images captured by a JOEL instrument. Thermal stability for the obtained samples was measured via Thermogravimetric-Analysis (TGA). A Shimadzu-60 instrument was used for measuring TGA with a heating rate of 10°C/min.
The samples have been analysed with ERDA (Elastic Recoil Detection Analysis) using a 43 MeV Cl7+ ion beam to obtain the chemical composition of the layers. The angle between the sample normal and the incoming beam is 74.2°; the scattering angle is 29.5°. The analysed area is about 2 × 2 mm2. The recoil atoms and scattered ions have been detected with a Bragg Ionisation Chamber, which enables energy measurement and Z identification of the particles. H recoils have been detected with a separate solid-state detector at a scattering angle of 40°. This detector is preceded by a 25 µm Kapton foil to stop scattered ions and heavy recoil ions. The depth resolution of this system is reduced because of energy loss straggling in the foil.
A heavy ion beam can cause severe elemental loss during the measurements, especially on polymers. Therefore, two short measurements on different spots have been made with very low ion beam current. The elemental loss was studied for H, C and O for all measurements by using the list mode file to determine the total counts for these elements as a function of the dose. The curves were fitted and extrapolated to zero dose using a linear or exponential function. A correction factor for the elemental loss is calculated from the extrapolated counts at zero dose and the total number of counts. A loss was found for O and H because these elements are volatile and a corresponding apparent increase was observed for C. It is expected that C remains constant, but the yield increases relative to the other elements. For the analysis both measurements are added together, and the correction factors have been calculated for the sum measurement and used to correct the total charge (Cl ions on the sample) for the spectrum of the corresponding element before the analysis, see supplemental material.
RBS (Rutherford Backscattering Spectrometry) measurements have also been performed because the separation in energy between heavy elements is better. A 1.7 MeV He+ ion beam has been used and the scattering angle is 170° and the angle between the sample normal and the incoming beam is 0°. The RBS spectra have only been used to check the traces of heavy elements. All ERDA spectra and the He-RBS spectra are fitted simultaneously using the program NDF v9.3 g. 29
To measure the mechanical properties, PVA/CNT films were cut into dumbbell shape and were examined using a tensile testing device (Qchida computerized testing instrument, Dongguan Haida Equipment Co., Ltd. China) a crosshead speed of 300 mm/min at 25 m/2°C. Three samples were used for each measurement to obtain the average value of the mechanical measurements.
Optical properties were assessed through transmittance and reflectance measurements, conducted at ambient temperature using a LAMBDA™ 750 UV/Vis/NIR double-beam spectrophotometer. This instrument provided data across the wavelength range of 190–2000 nm.
Results and discussions
X-ray diffraction
Figure 2 demonstrates the X-ray diffraction patterns (XRD) for PVA/CNT nanocomposite films. The diffractograms show a diffraction peak at 2θ = 19.5°, which is the characteristic diffraction peak of PVA with semicrystalline phase.30,31,32 It is observed that PVA has the dominant reflection in the diffractograms, covering the reflections from CNTs, these findings indicate the successful loading of CNTs into the PVA matrix. On the other hand, there are small changes in the peak intensities and a slight peak shift was observed, which may result from inserting more C atoms into the PVA matrix. The molecular chemical composition plays a vital role in the peak broadening and crystallinity of the dominant peak of PVA, which is reflected in both the crystal structures and the structural parameters. Other parameters can contribute to changes in crystallinity such as preparation conditions, hydration treatments, temperature used, and solvents that influence the cross-linking of the PVA (organic material) and CNTs.32,33 X-ray diffractograms for PVA/CNT systems.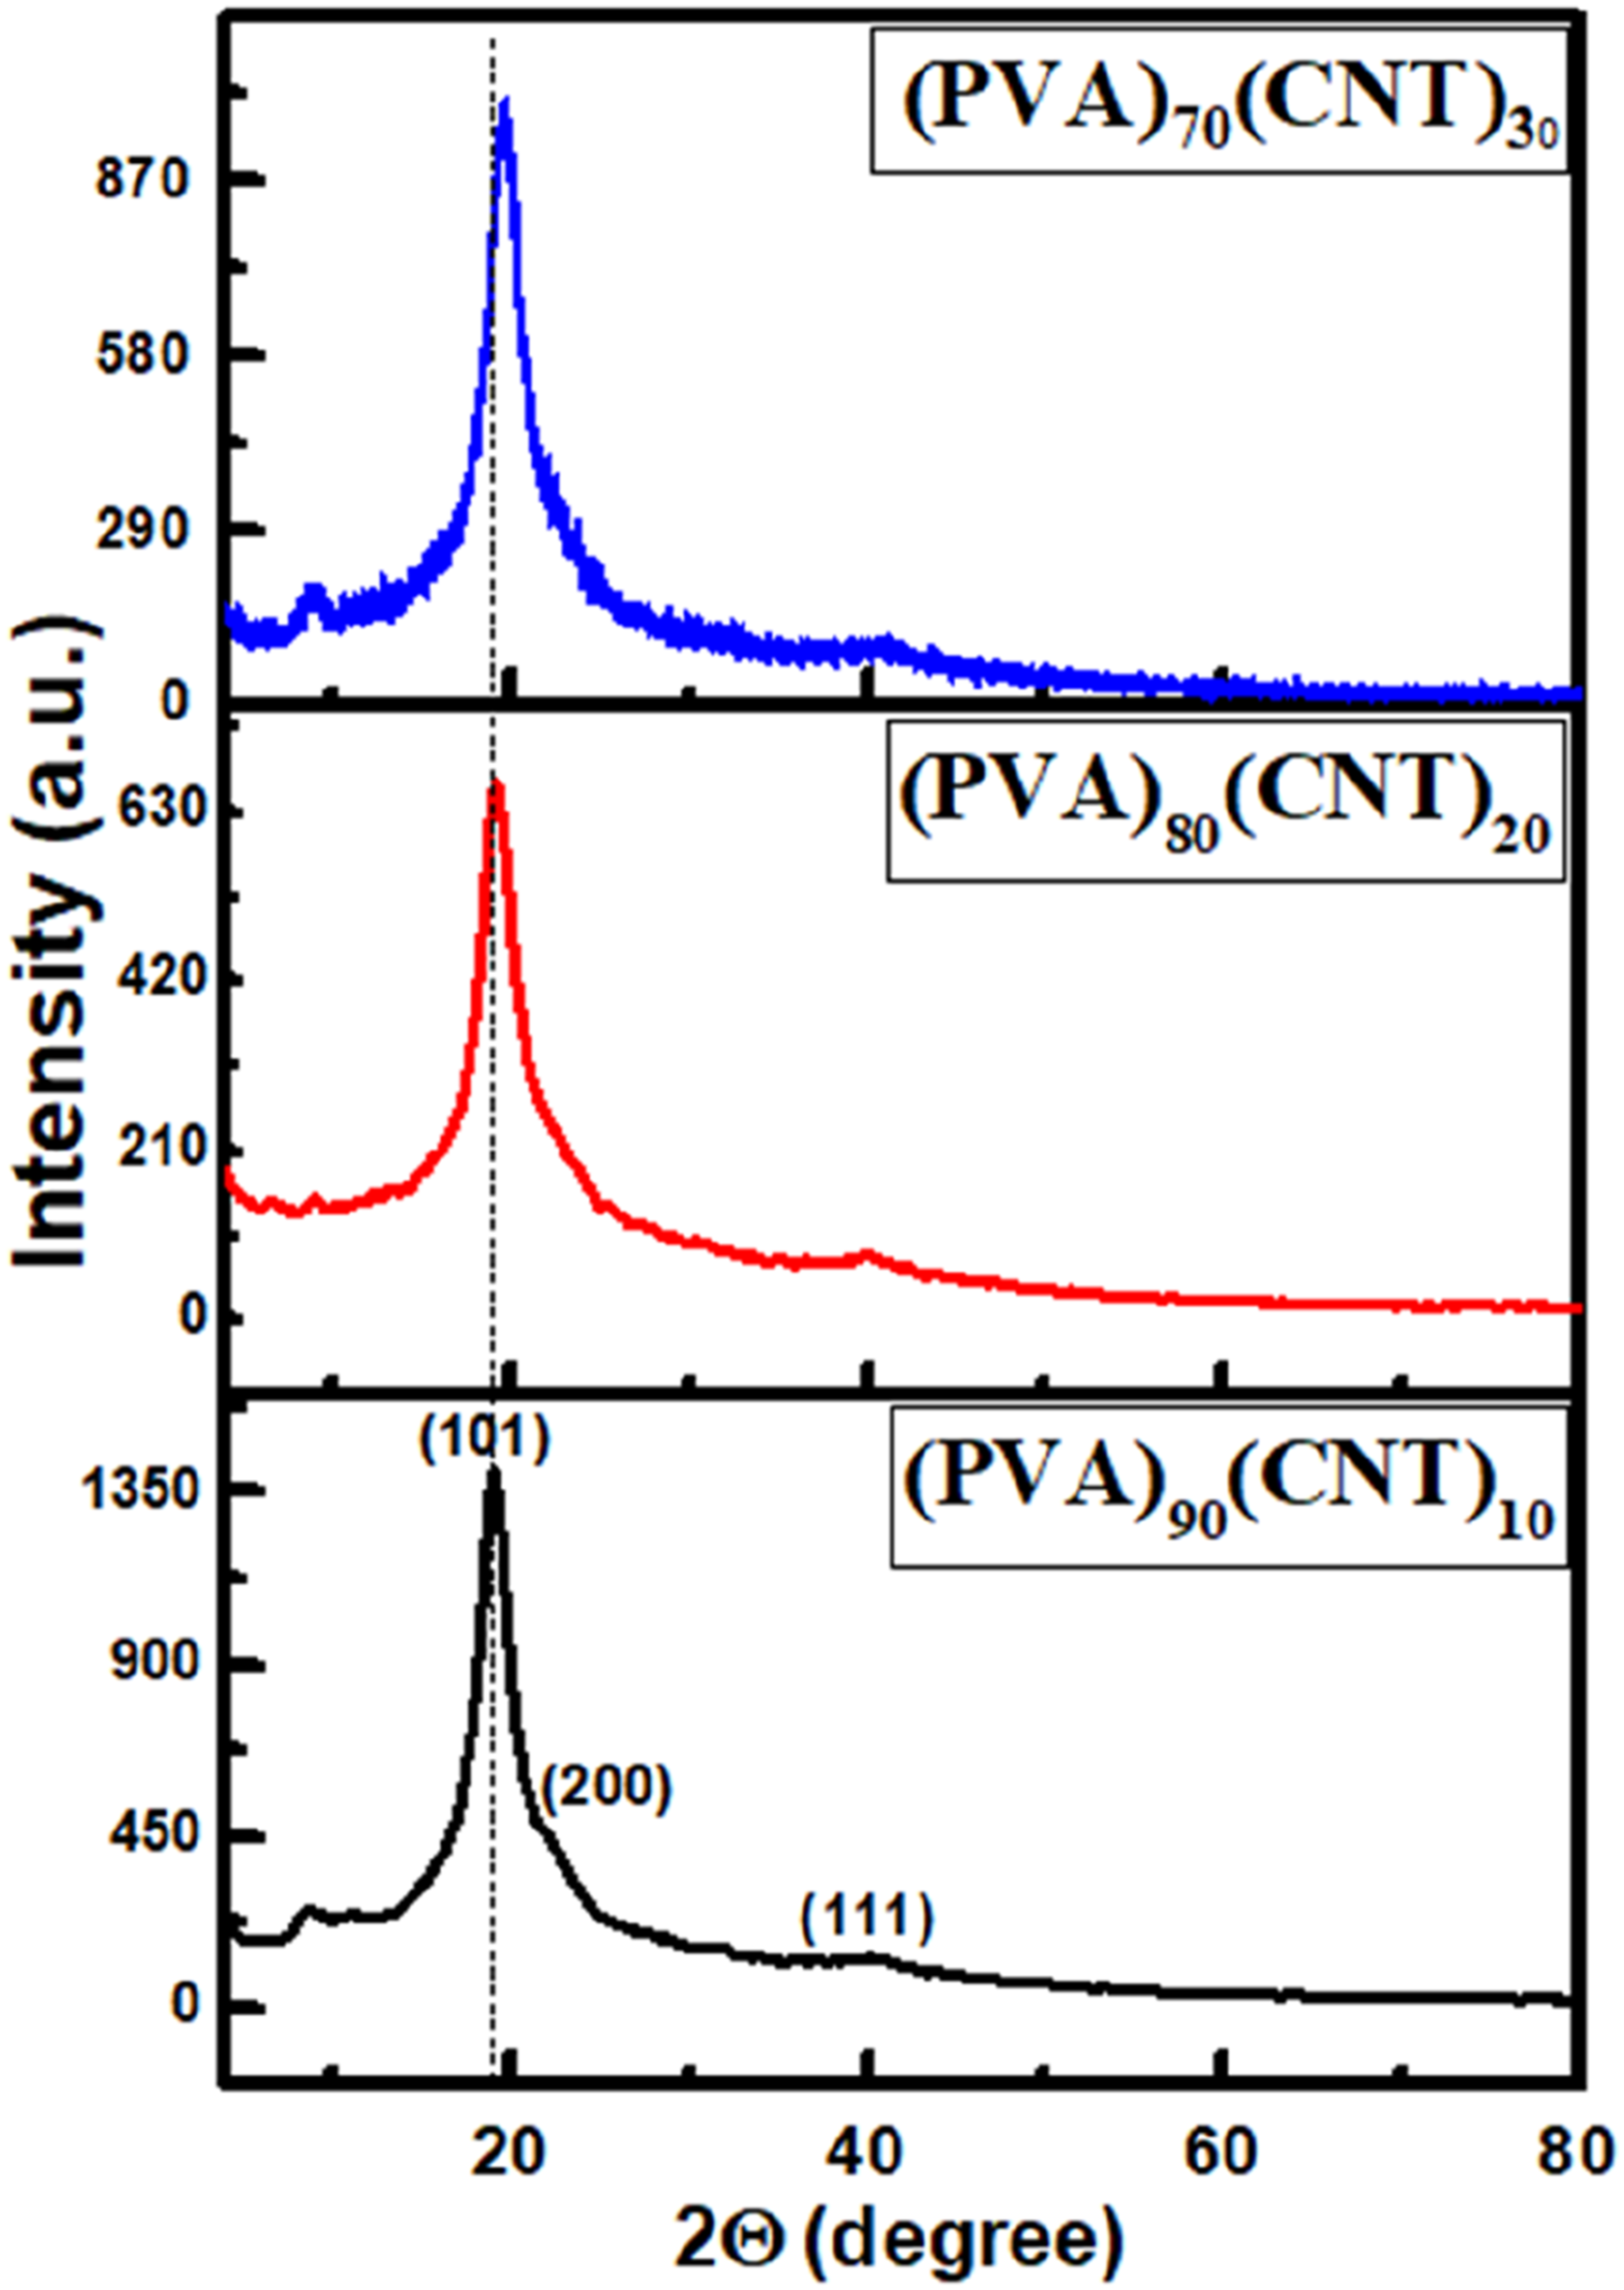
The peak intensity decreased slightly due to CNTs originating from incorporating CNTs into the PVA matrix or breaking the PVA chains’ H-bond or -OH group, making them accessible to rotate. Figure 2 shows a slight shift for the prominent peak of PVA. This shift may result from the nucleation of CNTs inside the polymer matrix, leading to stress transfer from polymer chains to the rigid CNTs, which introduces a strain into the PVA crystalline phase. Also, CNT may lead to distortion of the PVA matrix that affects the lattice parameters, producing an interaction between the CNT and the polymer chains to orient in a way that is favourable to crystalline packing, hence shifting the XRD peaks. The addition of CNTs could also promote the orientation of PVA chains along specific crystallographic directions influenced by the presence of CNTs. This preferential orientation can lead to a shift in the XRD peaks due to changes in the distribution of crystal orientations. This reflects the nature of the CNT interaction with the PVA host matrix, which affects the polymeric chains, and alters the PVA local structure. This behaviour confirms the formation of well-integrated PVA-CNT nanocomposite films where the CNT is fully distributed and dispersed into the polymer matrix.
Structural parameters for PVA/CNT systems.
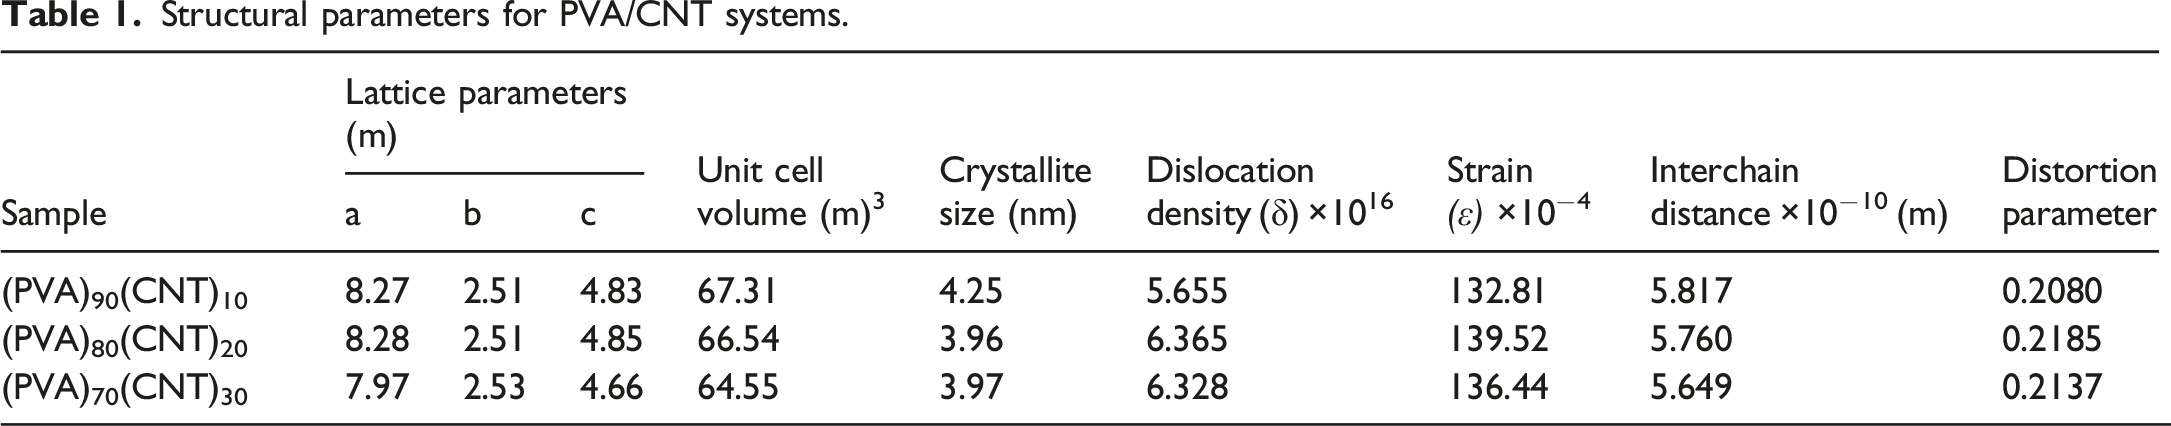
The obtained results showed the formation of nanocomposite films due to the semicrystalline phase for PVA/CNT films. Also, the reduction in unit cell volumes with the increase in CNT concentration may be an induction for the decrease in the mass transportation during the crystal growth. 28 According to the main peak shift, and FWHM results for PVA/CNT films, the strain values are slightly affected, see Table 1. Similarly, in case that multi-wall carbon nanotubes (MWCNT) were added to a PVA/Polyvinylpyrrolidone (PVP) blend, the interchain distance was also decreased as the obtained results for PVA/CNT nanocomposite films. Also, the values of interchain distances have values in the range of ⁓5.7 × 10⁻¹⁰ Å that suggested that the interchain distances of PVA may be affected by the H-bond distances, where these obtained results were matched with previous studies in ref. 37
FTIR spectroscopy
Figure 3 shows the FTIR spectra of PVA/CNT polymer nanocomposites measured from 4000 cm−1 to 400 cm−1. It is observed that PVA has broad bands at 3300 cm−1 and 1150 cm−1, corresponding to –OH group and C-O group, respectively. These two peaks are also observed in the spectra of PVA/CNT polymer nanocomposites, which is attributed to the interaction between PVA and CNT to form the PVA/CNT polymer nanocomposites.
38
The peaks at 2912 cm−1 and 2850 cm−1 are due to the asymmetric and symmetric stretching vibration of -CH2, respectively. The peak at 850 cm−1 is due to the stretching vibration of C-C of pure PVA. With the increasing weight percentage of CNT, the intensity of the peaks decreases due to the cross-linked of PVA and CNT. These results are in good agreement with the XRD results. The FTIR spectrum of (PVA)100-x (CNT)x with x = 0, 10, 20, and 30 wt%.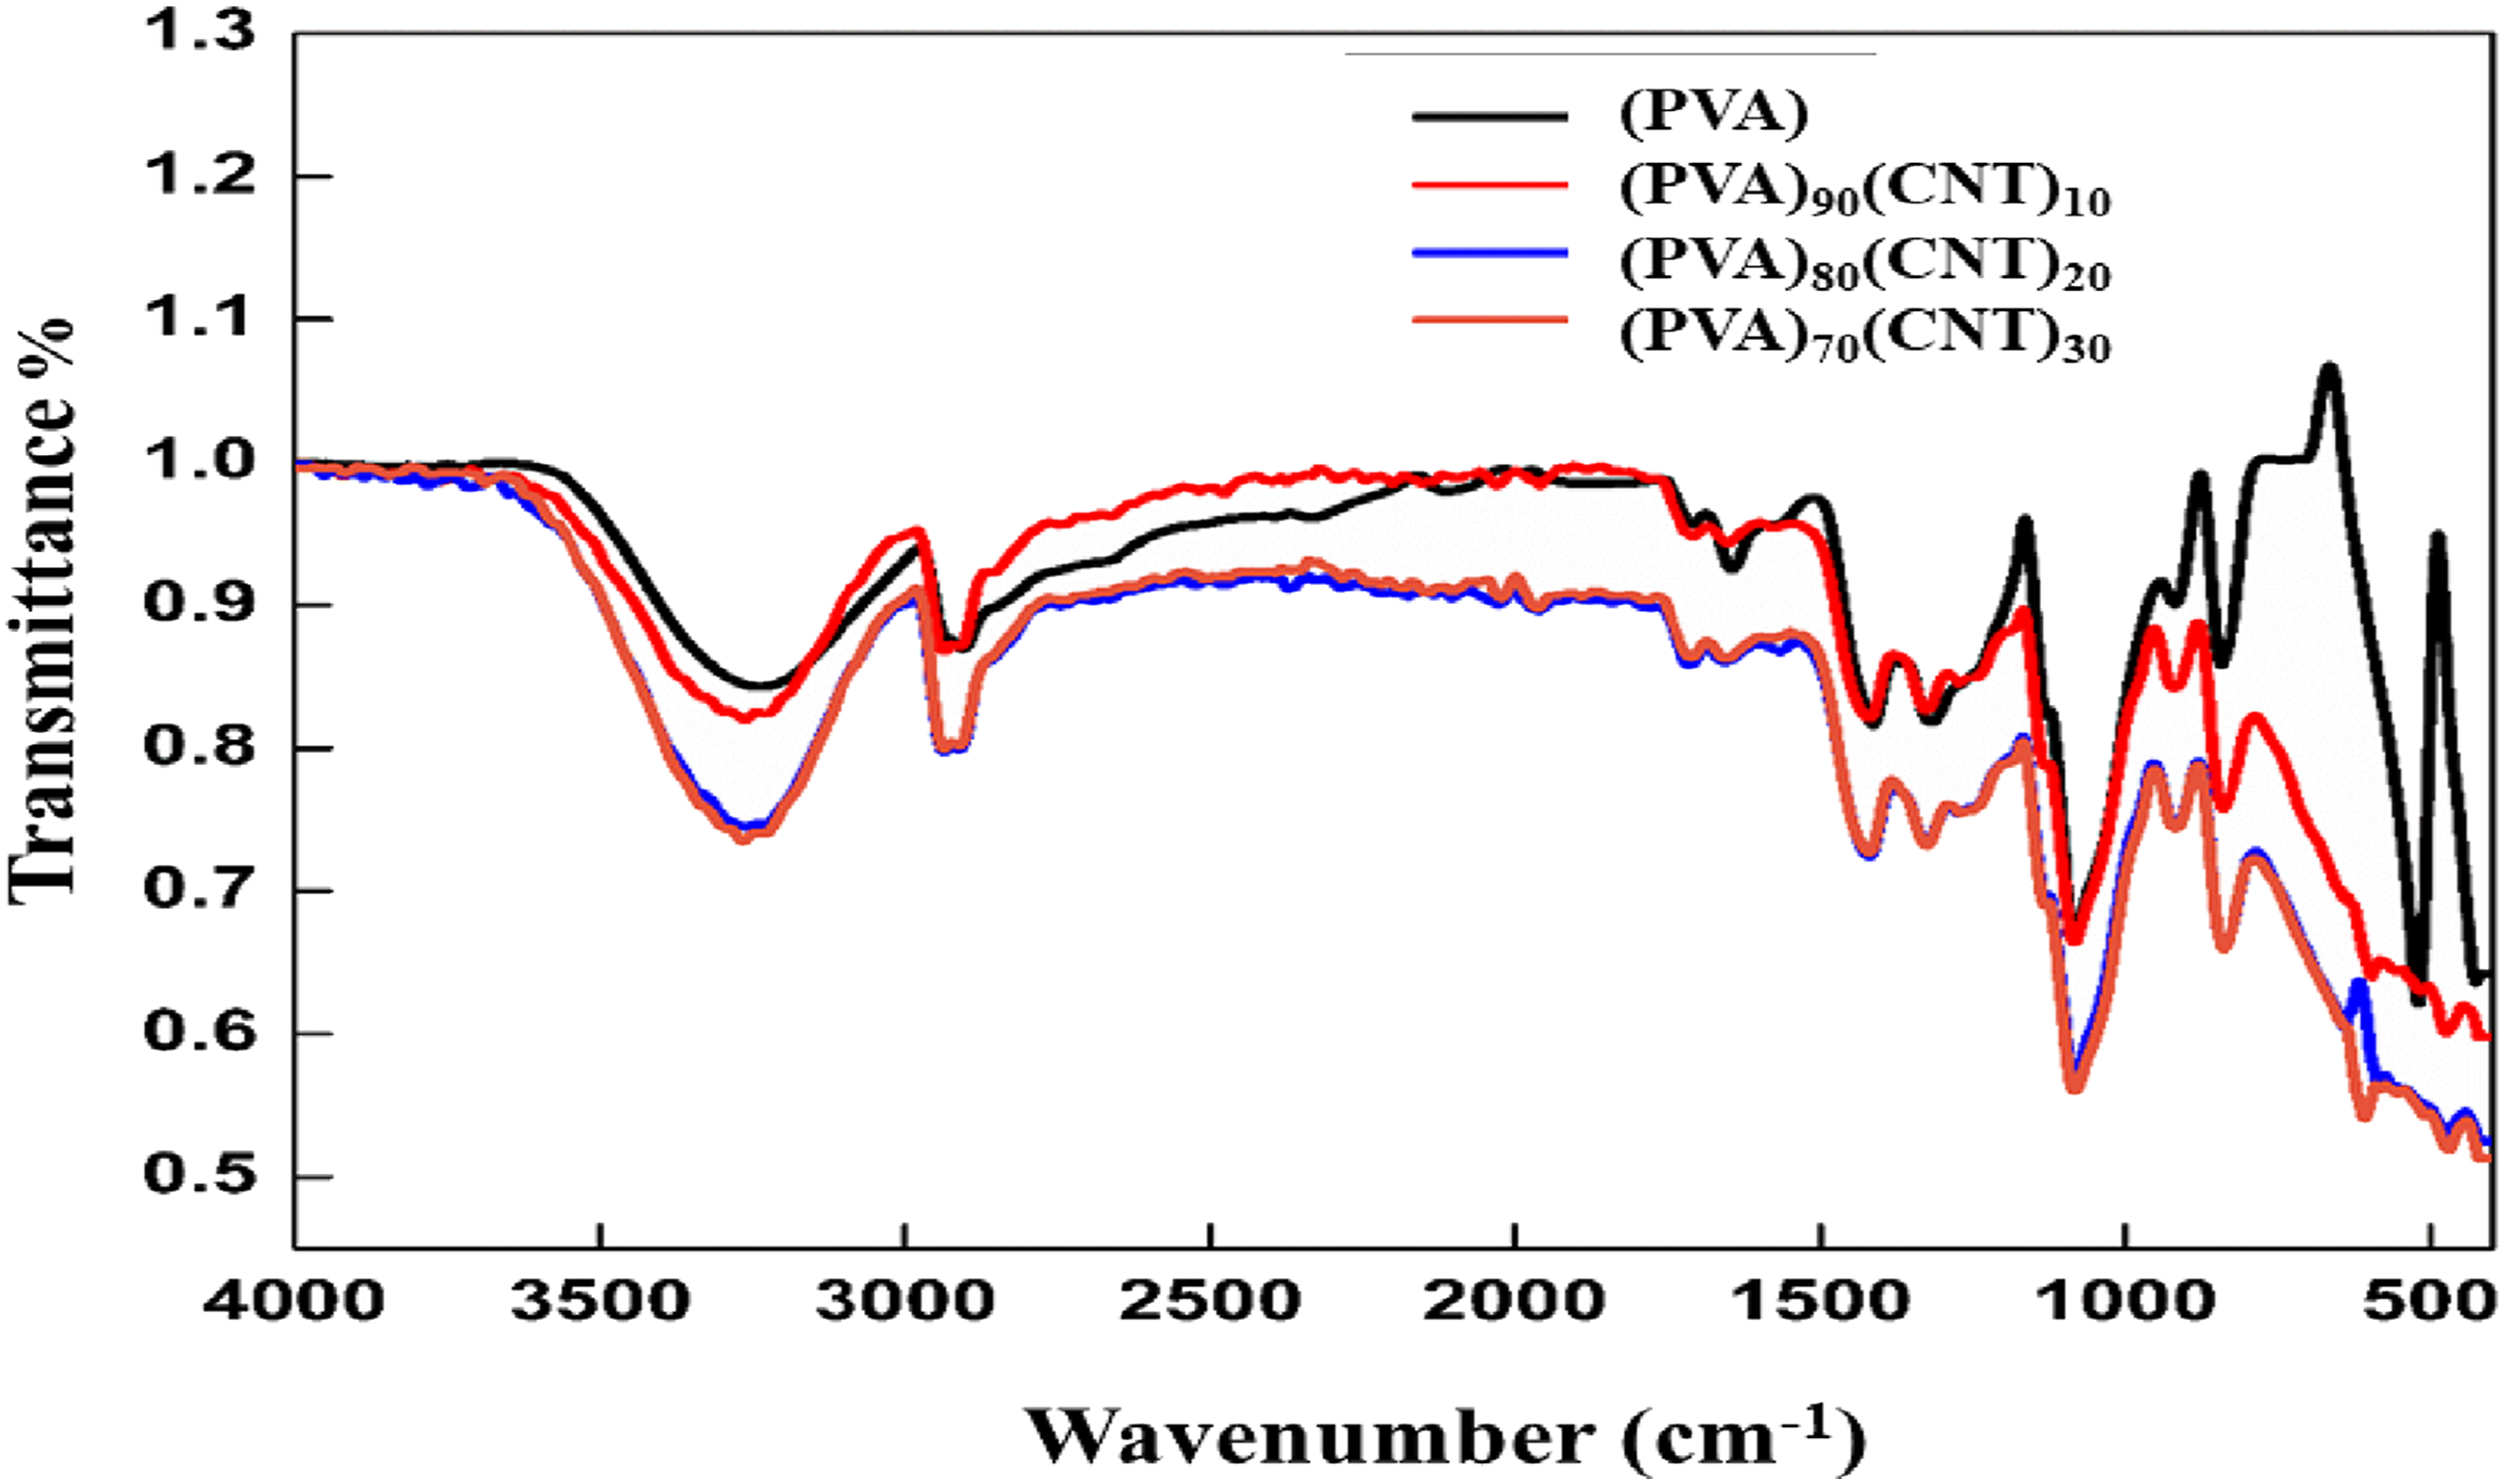
Morphological investigations
Figure 4 shows SEM surface images of (PVA)100-x (CNT)x nanocomposite films with x = 0,10,20, and 30 wt%. Figure 4(a) for pure PVA reveals a relatively smooth surface with long, parallel striations running diagonally across the field of view. The texture suggests a material that has undergone directional stress or processing, possibly through casting process. The estimated the width of the striations may be roughly 1-2 μm. Figure 4(b) for (PVA)90(CNT)10 micrographs exhibit a more complex, layered structure. The material appears to have fractured or delaminated, exposing multiple sheets or layers. These layers exhibit a feathered or frayed appearance at their edges, indicating a fibrous or flexible nature. The thickness of individual layers at approximately 1-3 μm. SEM micrographs for pure PVA (a) and (PVA)100-x (CNT)x with x = 0,10,20, and 30 wt% (b, c, and d respectively).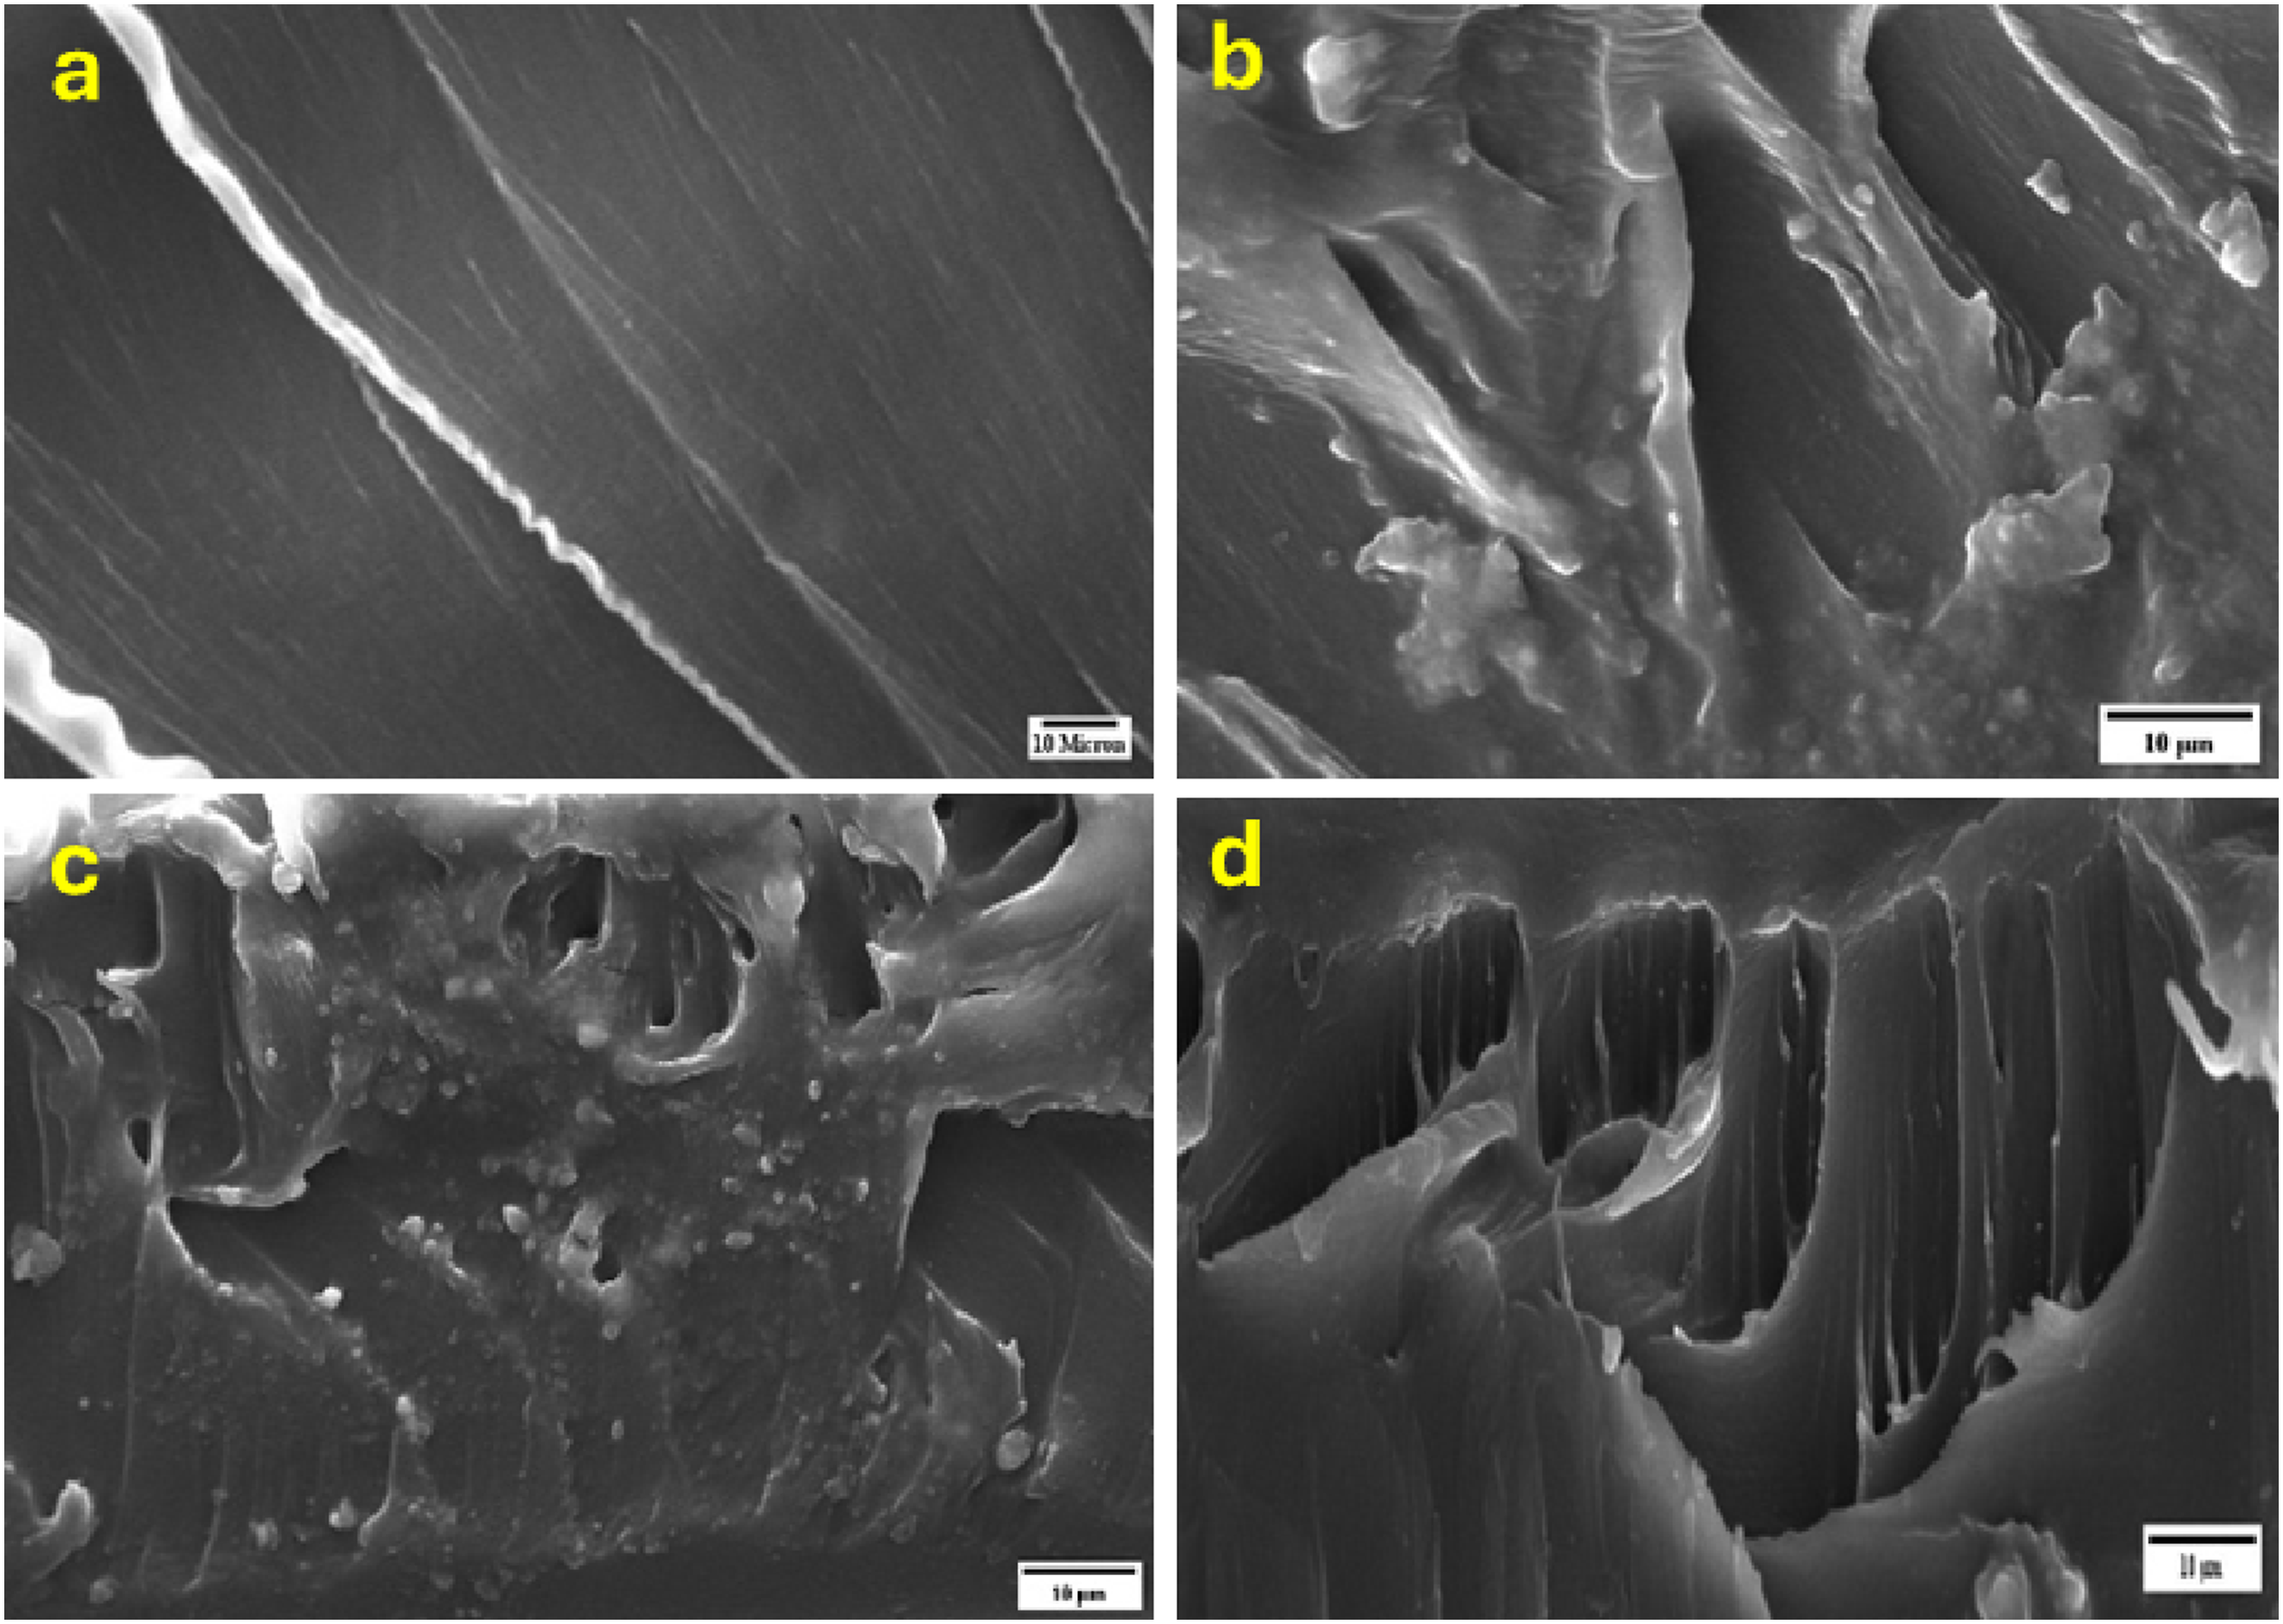
Figure 4(c) (PVA)80(CNT)20 micrograph shows a highly textured surface with numerous small, granular particles scattered across a rougher underlying structure. The particles range from about 0.5 to1 μm in diameter. The background material appears to have a porous or sponge-like quality, suggesting a composite structure or a material that has undergone some form of etching or degradation process.
Figure 4(d) presents a cross-sectional view of a layered material. Distinct columnar structures, reminiscent of a fractured crystal or a highly oriented polymer were investigated. These columns vary in width but average around 2-3 μm. The overall structure suggests a material with anisotropic properties, likely exhibiting different characteristics parallel and perpendicular to these columns. Also, (PVA)70(CNT)30 showed the agglomeration is decreased because the more interaction between the carbon nanotube and water molecules of the polymer and the dispersion of ultrasonic probe.39,40
The transition from smooth, aligned structures to more complex, multi-layered arrangements suggests that the PVA matrix was affected by the presence of CNTs, indicating that the structural and mechanical properties may have been influenced. The results obtained demonstrated a strong interaction through Van der Waals forces between the carbon nanotubes and PVA. 41 Consequently, the combined nanoparticles reduced the compactness of the polymer chains, increasing the potential for penetration through the polymer. These findings are consistent with the XRD results, which show that an increased concentration of carbon nanotubes enhances the amorphous regions of the polymer matrix. Additionally, the surface hydrophobicity of the polymer improves due to the presence of carbon nanotubes. 42
Ion beam analysis
The provided spectra (Figure 5) represent an RBS and ERDA analysis of a composite material composed of (PVA)100-x (CNT)x (with x = 10, 20, and 30) nanocomposite films. The x-axis shows the energy in units of channels, while the y-axis displays counts. The highest energies represents He ions scattered on the surface and lower energies comes from He scattered deeper in the sample and the energy of scattering on each element also depends on the mass (higher energy for larger mass). RBS spectra and fit (left side) and ERDA spectra and fit for H (right side) for (PVA)100-x (CNT)x with x = 10, 20, 30 wt% samples.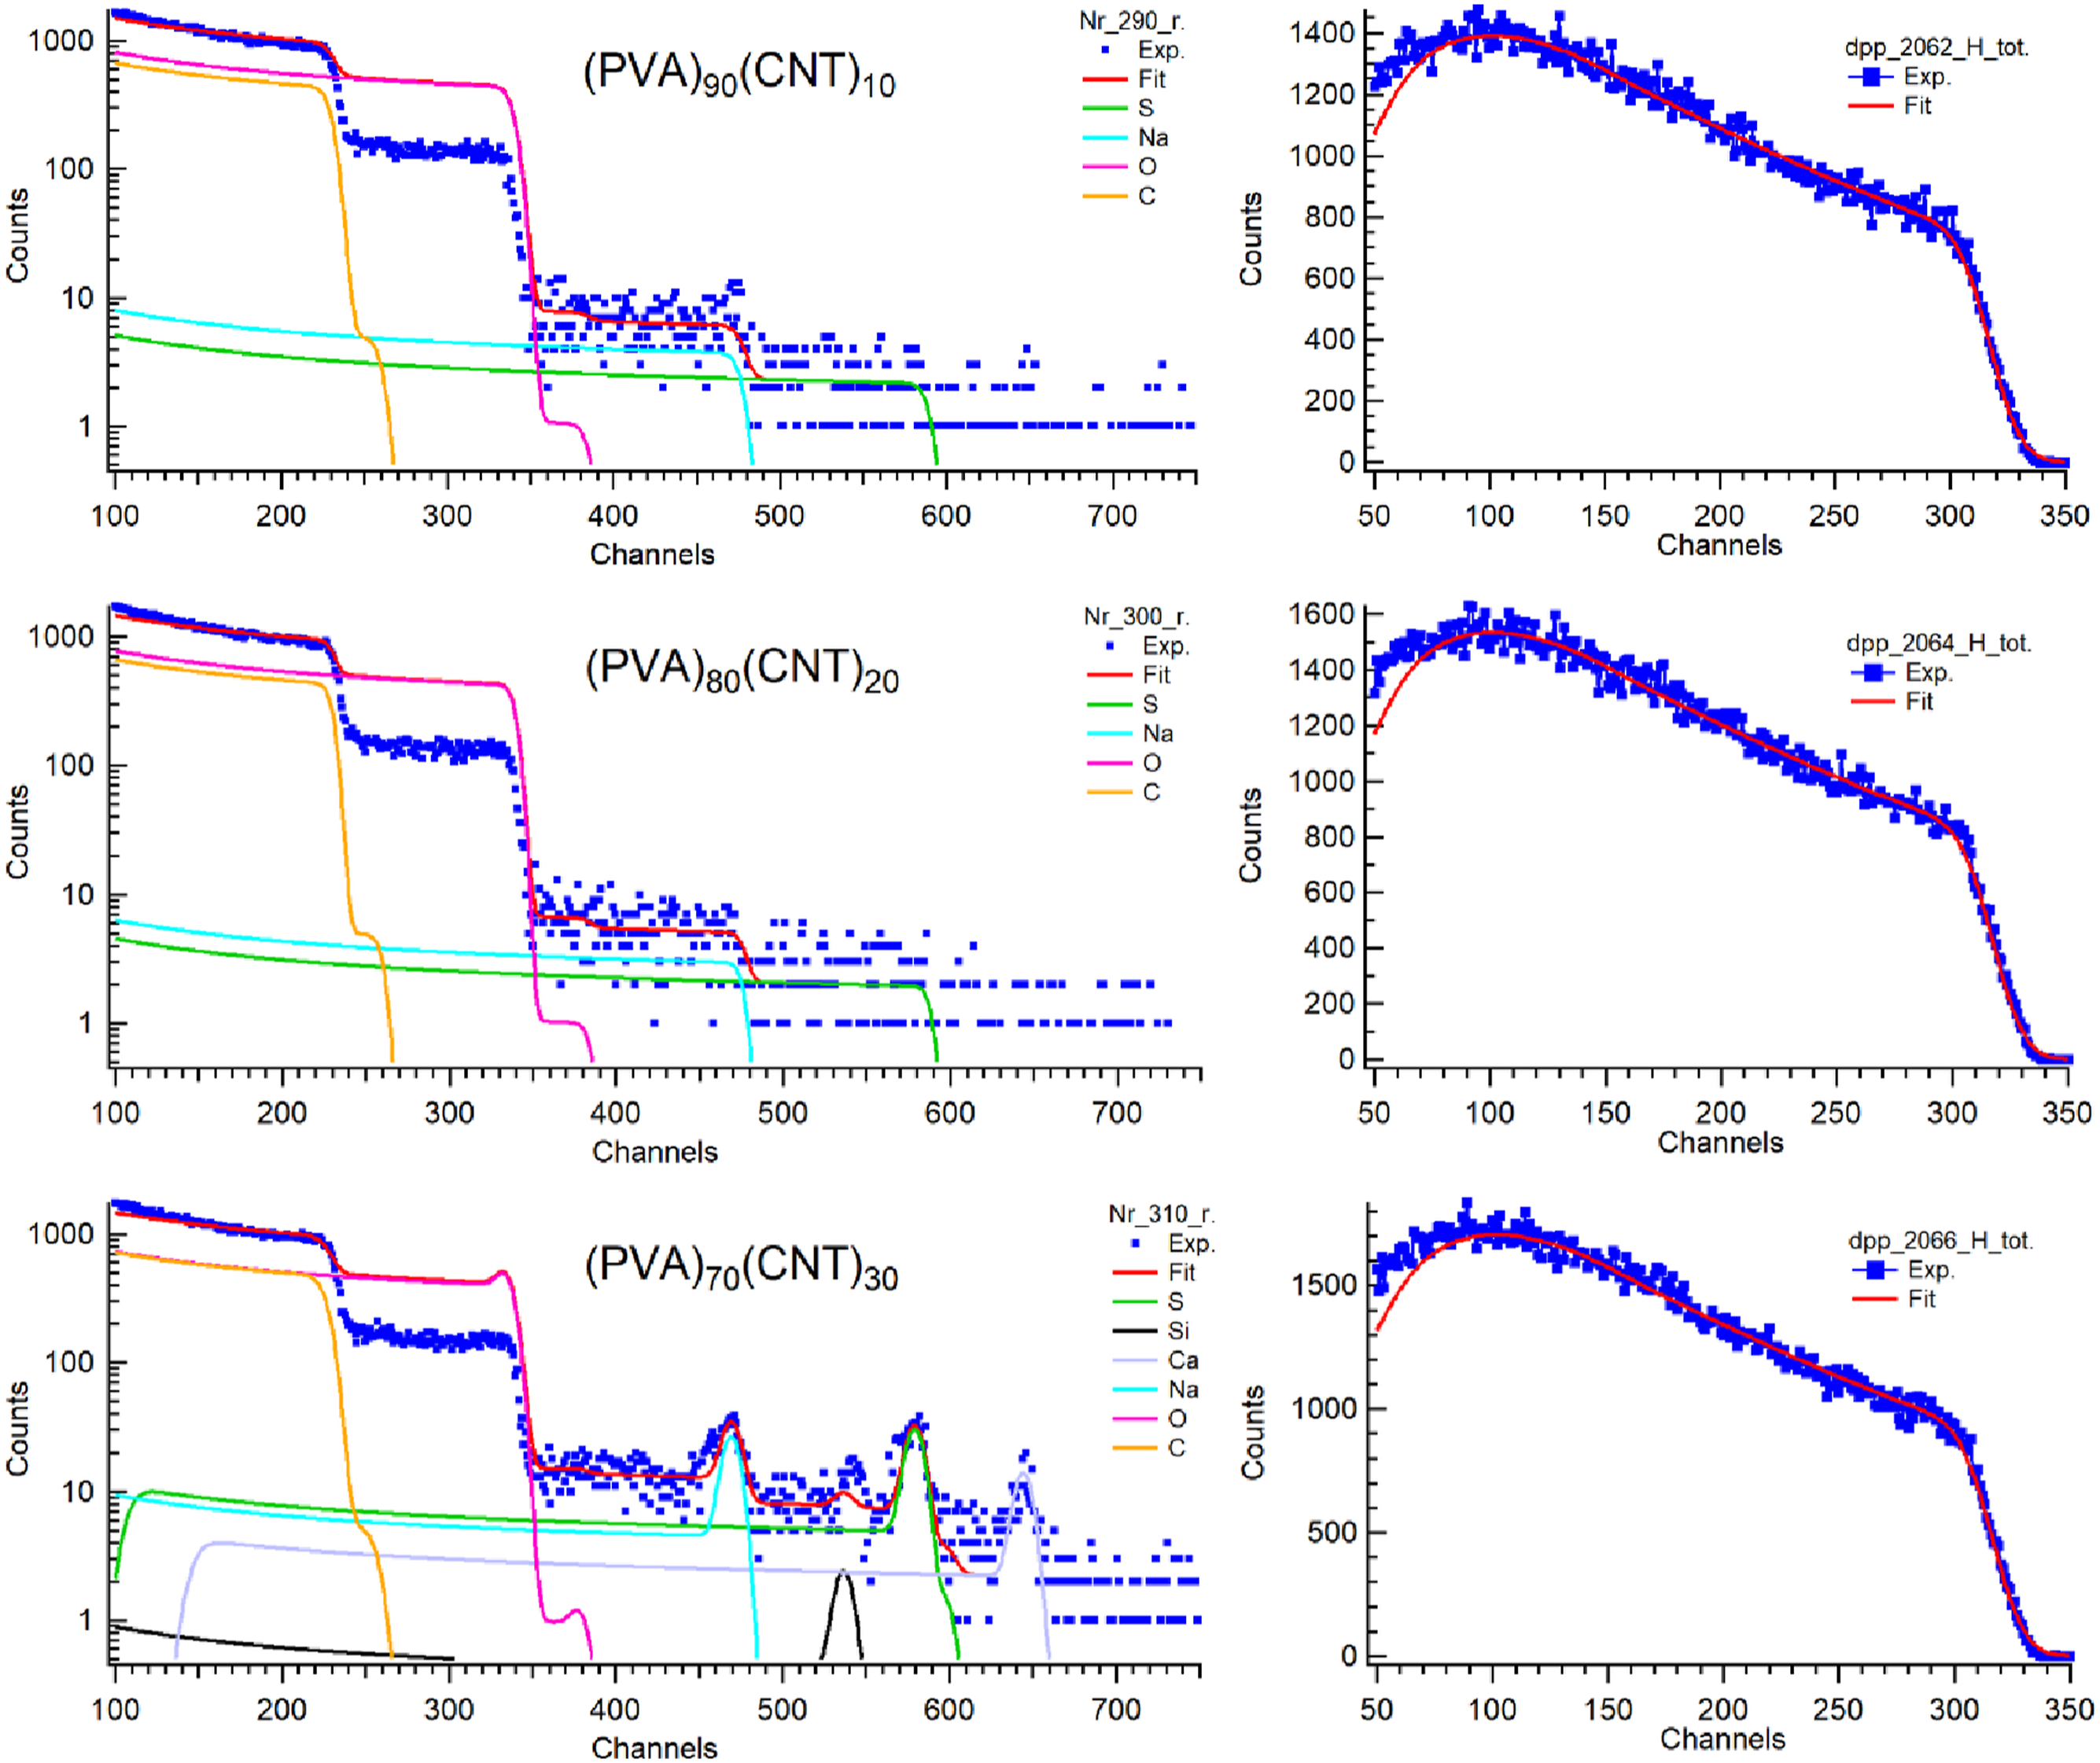
The obtained peak identification and Elements Analysis were detected and investigated as follows: (i) Carbon (C) has a dominant peak, extending from channels ∼100 to ∼250 with high intensity, indicating carbon as the primary constituent, and this result is logical because C is consistent for both PVA and CNT components. (ii) Oxygen (O) has a significant peak overlapping with carbon, extending to ∼channel 350. The presence is attributed mainly to PVA’s hydroxyl groups. Broad carbon and oxygen peaks suggest a thick, homogeneous layer. (iii) Sodium (Na) has a minor peak observed around channel 350-400, where it is possibly an impurity or a small residual due to the reactant used in the synthesis process. (iv) Silicon (Si) has a trace detection with a small peak channel 450-500 that could be a contaminant from processing or substrate material. (v) Sulphur (S) has a minor presence indicated by a small peak near channels 550-600. It may originate from the start chemical used in the preparation method or may result from the impurity from the substrate material. (vi) Calcium (Ca) showed a trace amount detected, with a small peak around channels 650-700. It is likely an impurity, possibly from the residuals or the contaminations from the starting reactants or the substrate material used in processing
Table with the concentrations for the (PVA)100-x (CNT)x nanocomposite films. The concentrations are for the main part of the film, excluding a small surface layer.
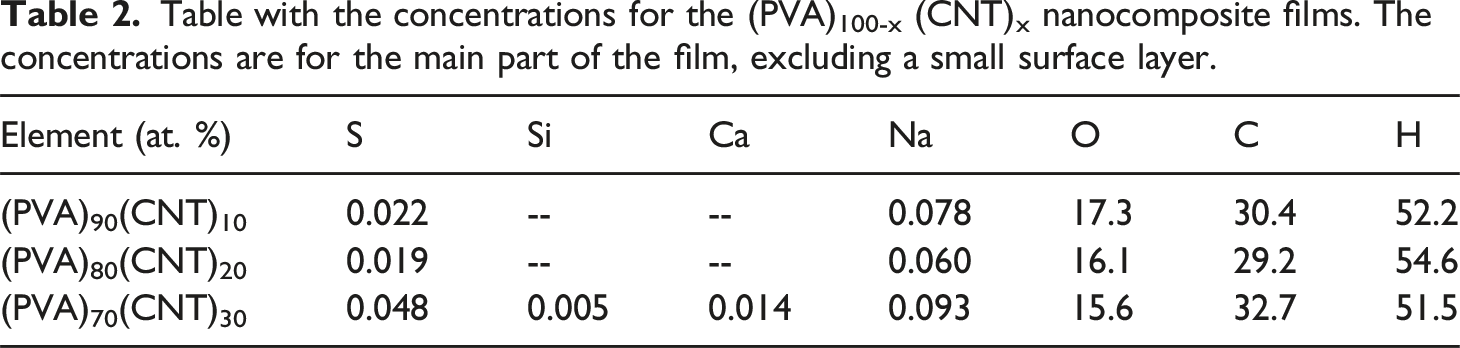
The overall uncertainty in the concentrations is difficult to ascertain because of the large loss of O and H and because it is not known how accurate the correction procedure reflects the real changes of the samples. It should be noted that no corrections for elemental loss could be done for the RBS spectra and therefore the fit of O in Figure 5 seems too high. However, the homogeneous distribution of elements suggests the successful integration of CNTs within the PVA matrix. In addition, minor impurities or additives are detected, which could influence the material’s properties. Further quantitative analysis and complementary techniques (e.g., XRD, SEM) confirmed the detailed compositional and structural information.
Thermal stability
TGA technique was used to investigate the thermal stability and the decomposition of PVA/CNT systems. TGA measures the weight loss as a function of temperature which helps in understanding the thermal degradation stability of the samples, the residual masses, the degradation rate, and the start point of the degradation. Figure 6 shows the thermographs of the obtained samples. It is seen that the thermal stability of the samples was increased with the increase in the CNT weight percentage owing to the strong interaction between the nanoparticles and the PVA matrix that affected the mobility chains of PVA.
32
Also, the existence of CNT always enhances the thermal stability of the polymer material chains due to their superior thermal properties.
43
(A) TGA thermographs & (B) DTGA curves for (PVA) 100-x (CNT)x with x = 10, 20, 30 wt% nanocomposite films.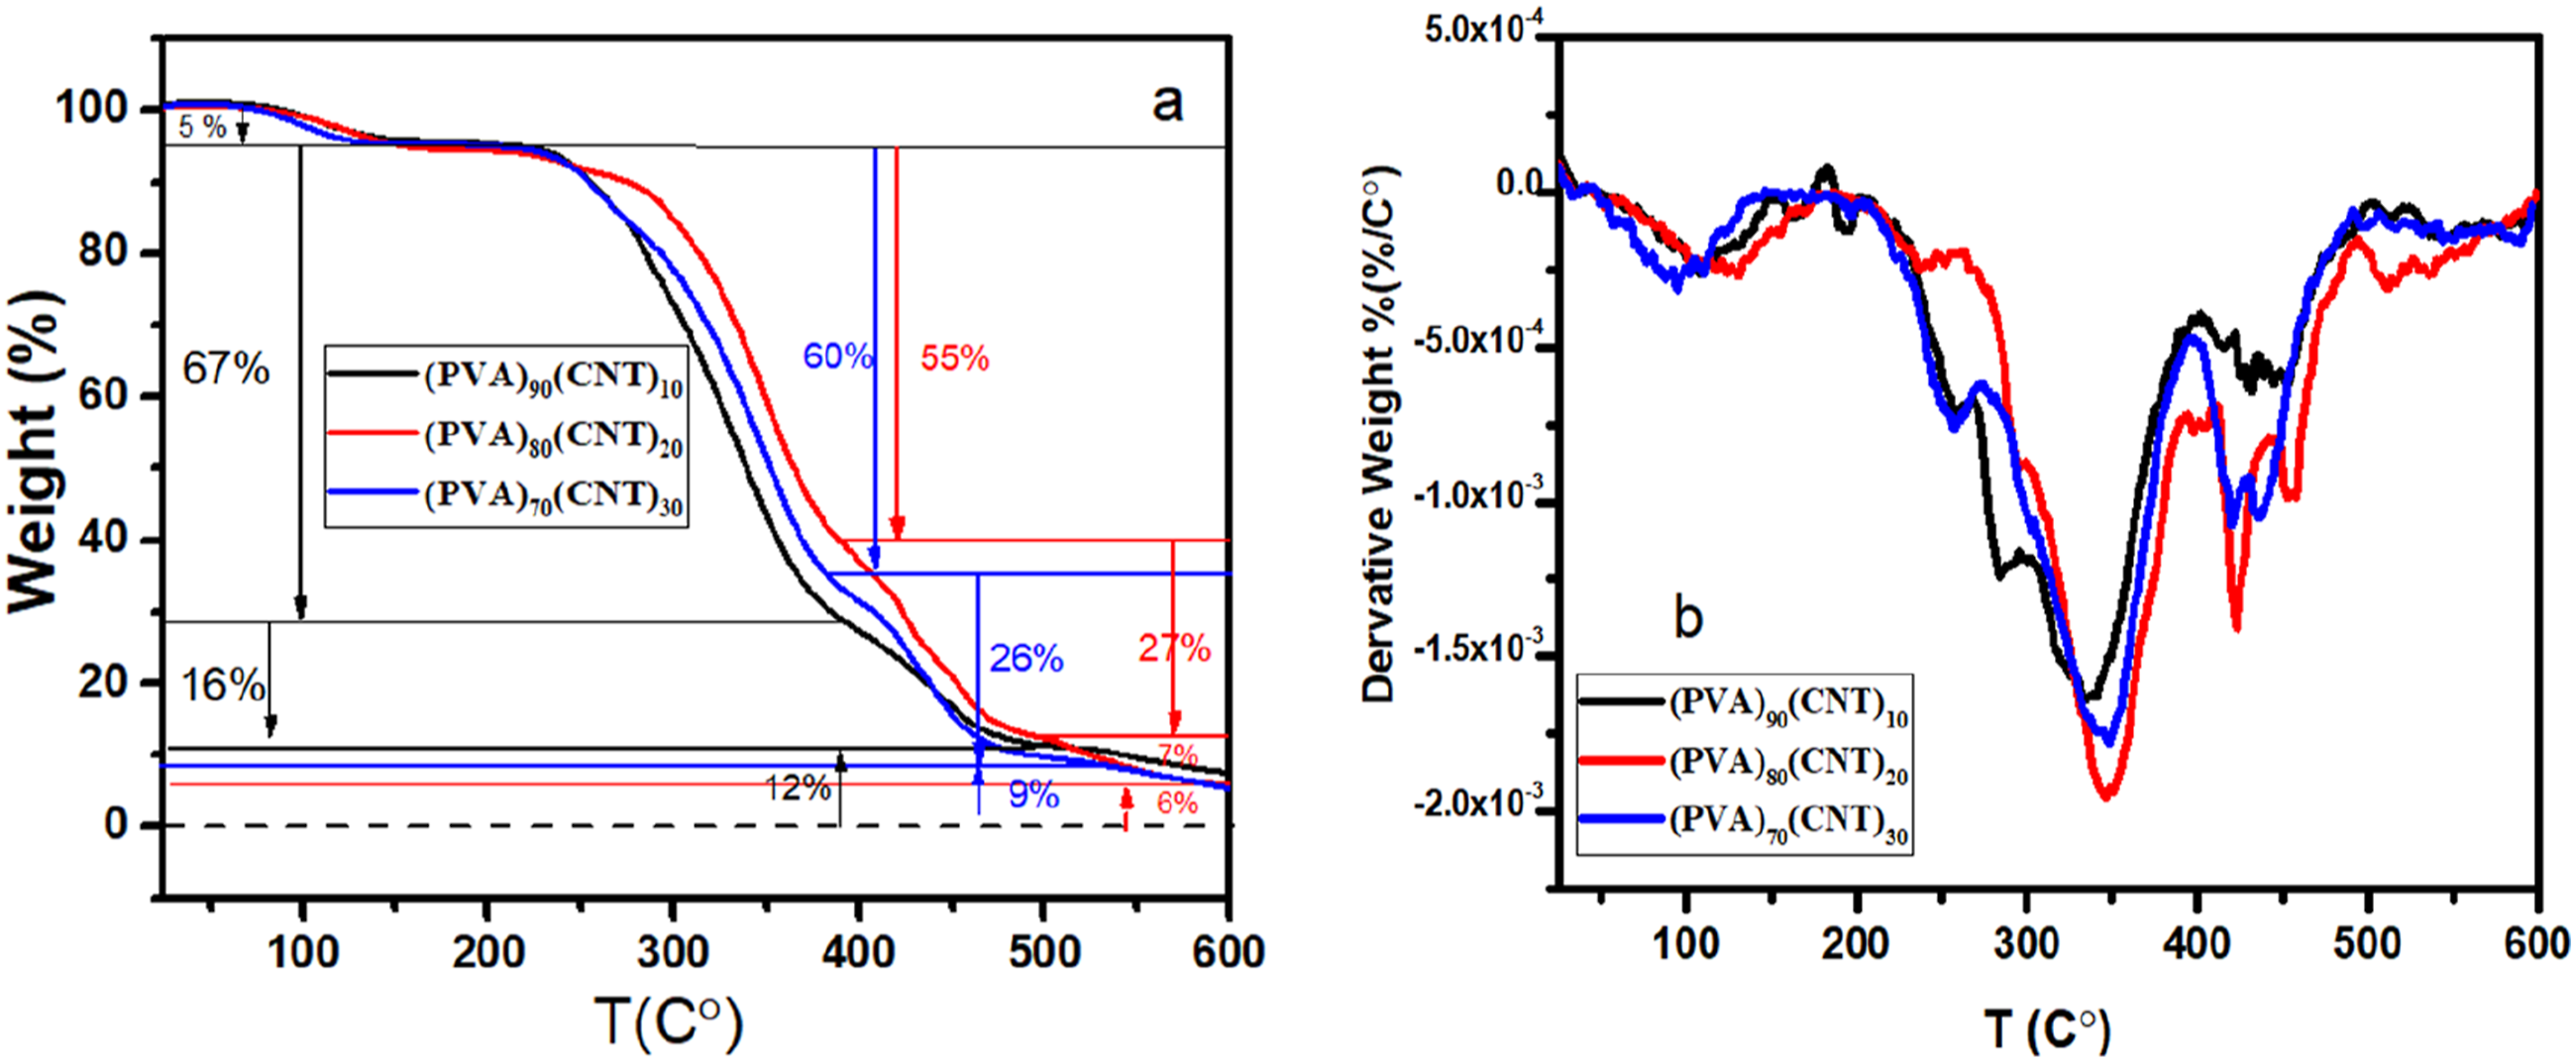
The first degradation for the three samples was 5% (from 50 °C–130°C) due to the water evaporations and other solvents or carbo dioxide on the polymer membrane. The multiple stages of the decomposition of the PVA/CNT samples were as follows: 1- the degradation region (230 °C–380°C) resulted from the degradation in the PVA backbone. This decomposition comes from the charred residuals including the vaporization of -OH groups.44,45 The ratios of the weight losses in this stage were 67%, 55%, 60% for the 10, 20, 30% CNT samples, respectively. 2- (380 °C–460°C) stage: the loss in this step was smaller than the previous stage and attributed to loss in the crosslinking PVA chains.32,46 The weight loss ratios related to this stage were 16, 27, and 26% for the samples, respectively. Three- the last step was at (460 °C–600°C), this step was a tail for the previous stage that maybe result from the samples absorbing lots of heat and being solidified, rugged, and broken at the end. 32
The differential thermogravimetric analysis (DTGA) of the samples are presented in Figure 6(b), it shows the thermal response of the obtained samples that exhibit the diffusion, and transportation properties of CNT nanomaterials through the PVA matrix. By looking at the derivative weight loss curves Figure 6(b), one can see that the lower concentration CNT sample has more weight loss than the samples with higher concentrations of CNT. These findings confirm that the presence CNT enhances the thermal stability and help us to investigate and optimize the materials for different applications.
Mechanical properties
Some of the crucial parameters for investigating the influences of CNT on the PVA matrix are the mechanical properties. Figure 7(a)–(c) exhibits the stress-strain curves of the PVA/CNT samples. The linear line in the beginning of the curves for the three samples represents the elastic stage, before reaching to the highest value to start the inelastic stage and reaching to the breaking point then finishing with the fracture strain. (PVA)90(CNT)10 shows the highest maximum value for stress at 75 MPa (strain at break) before this value decreases with increasing CNT for the other two samples. This reduction demonstrates how CNT weakened the elasticity of the PVA films by reducing the toughness and the strength of the films, and also decreasing the strain. (a)-(c) Stress-strain curves for the (PVA)100-x (CNT)x films, (d) Elastic modulus, Tensile strength, and Elongation at break (%) parameters for PVA/CNT samples.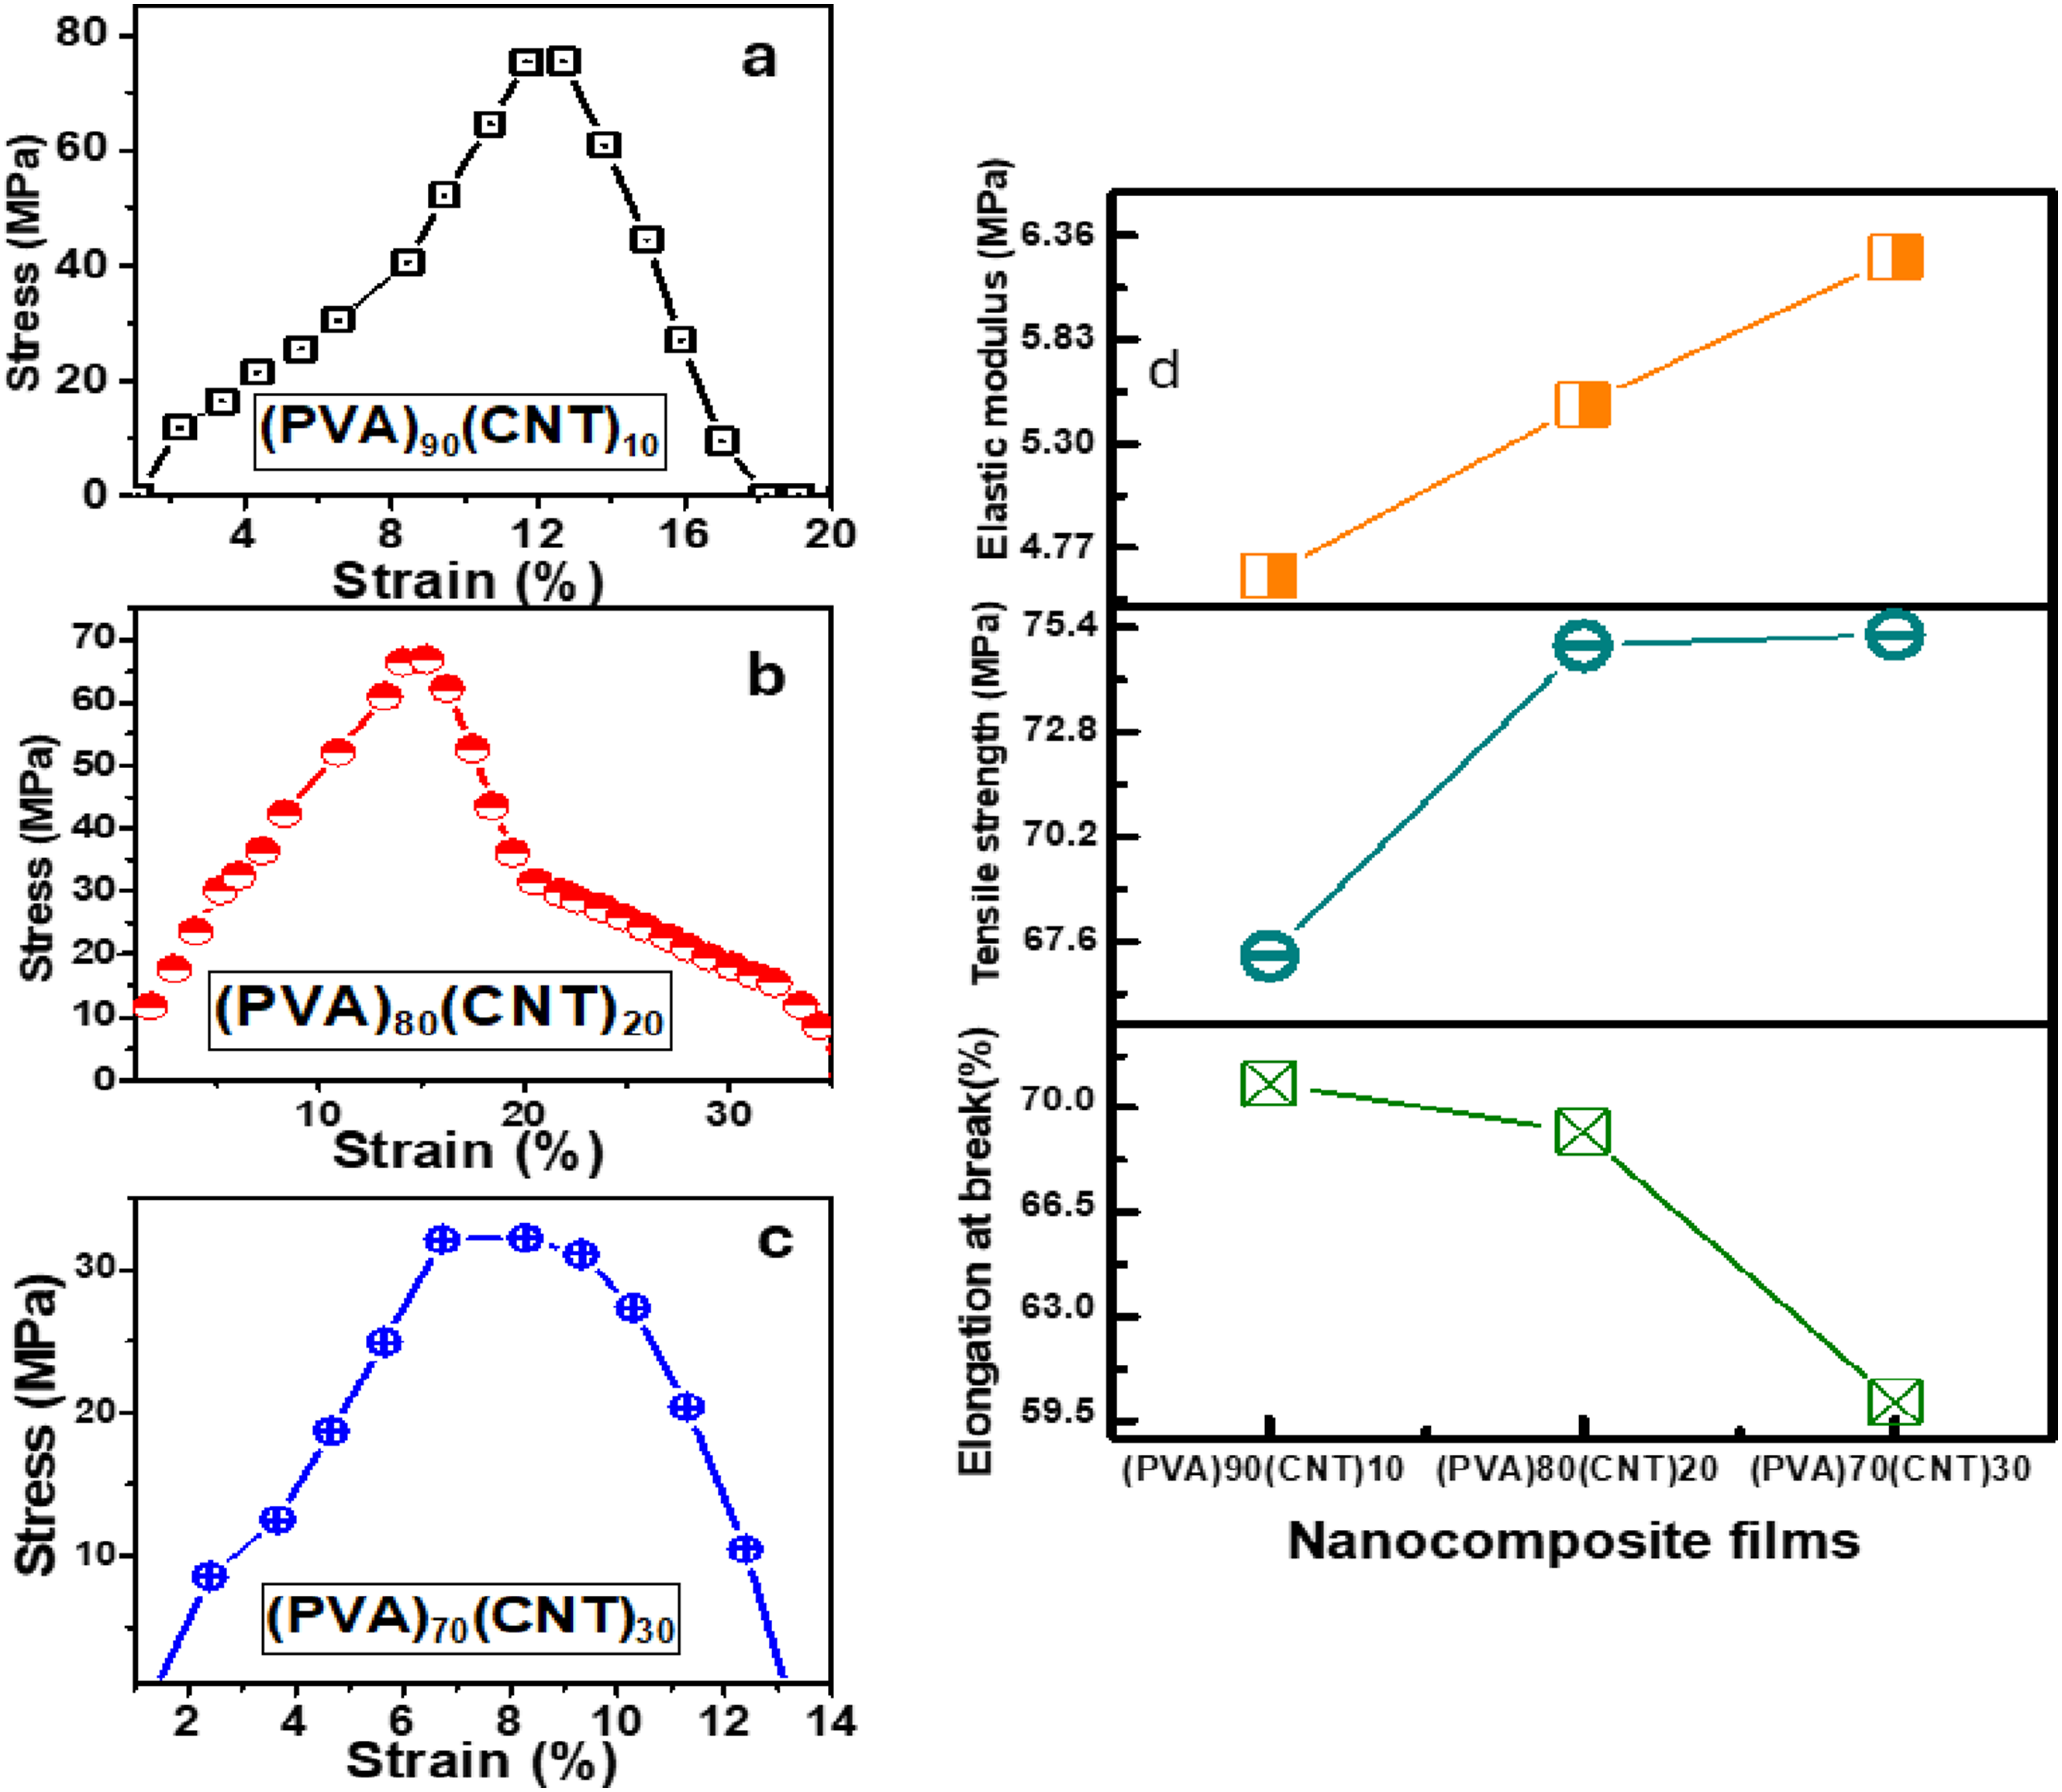
The (PVA)90(CNT)10 shows the lower tensile strength that resulted from the reduction in the molecular weight and a proof for weakened the bonds of the PVA-polymer chains. 32 The reclamation procedure subjects the molecular chains to high shear, causing them to break into shorter segments. This may result in the incorporation of nanoparticles into the low molecular weight fraction, leading to a decrease in tensile strength. 32 The linear behaviour of elastic modulus and the increase in the value of the tensile strength verify the previous explanation which produced from the increase in CNT concentrations (Figure 7(d)). Elongation at break curve decreases drastically with the increase in CNT concentrations which confirm the influences of CNT on the rigid crosslinking of the PVA. Furthermore, the results also show that as the concentration of CNT increases the ductility decreases, which is denoted by the percentage of elongation at the break or the percentage strain. This trend is consistent with the findings of Mahmood and Habubi, who reported that increasing MWCNT content in PVA/PVP blends led to higher stiffness and reduced elongation at break, mirroring the behavior observed in our system. 47
It could be suggested that the higher strength of the (PVA)90(CNT)10 sample is due to the inability of the inter-chain covalent bonding, which is supported by the DTGA data. This may result from the restriction of PVA chain mobility by crosslinking.
35
Brittleness is an important parameter of the mechanical properties of PVA compositions, referring to the tendency of PVA/nanoparticles to efficiently break or fracture under stress. The brittleness is influenced by the molecular structure of the PVA matrix, which lacks the flexibility and strength required to withstand external forces. When CNT is incorporated into the PVA matrix, it can act as reinforcements or hinder crack propagation. Brittleness can be calculated using the given relation in.38,39
This observation aligns with the work of Abdelrazek et al., who found that the addition of MWCNTs to PVA/PVP blends enhanced the elastic modulus and tensile strength up to an optimum concentration (∼1 wt%), beyond which mechanical performance declined due to CNT agglomeration. 48 Similarly, Alexander et al. demonstrated that functionalized CNTs significantly improved the tensile strength of PVA composites by over 200%, attributing the enhancement to improved interfacial bonding and reduced brittleness compared to unmodified CNTs. 49 Moreover, Coleman et al. reported that incorporating only 0.06 wt% CNTs into PVA films increased the tensile strength, Young’s modulus, and fracture toughness by 330%, 270%, and 70%, respectively, underscoring the reinforcing efficiency of CNTs at low concentrations. 50
Optical properties
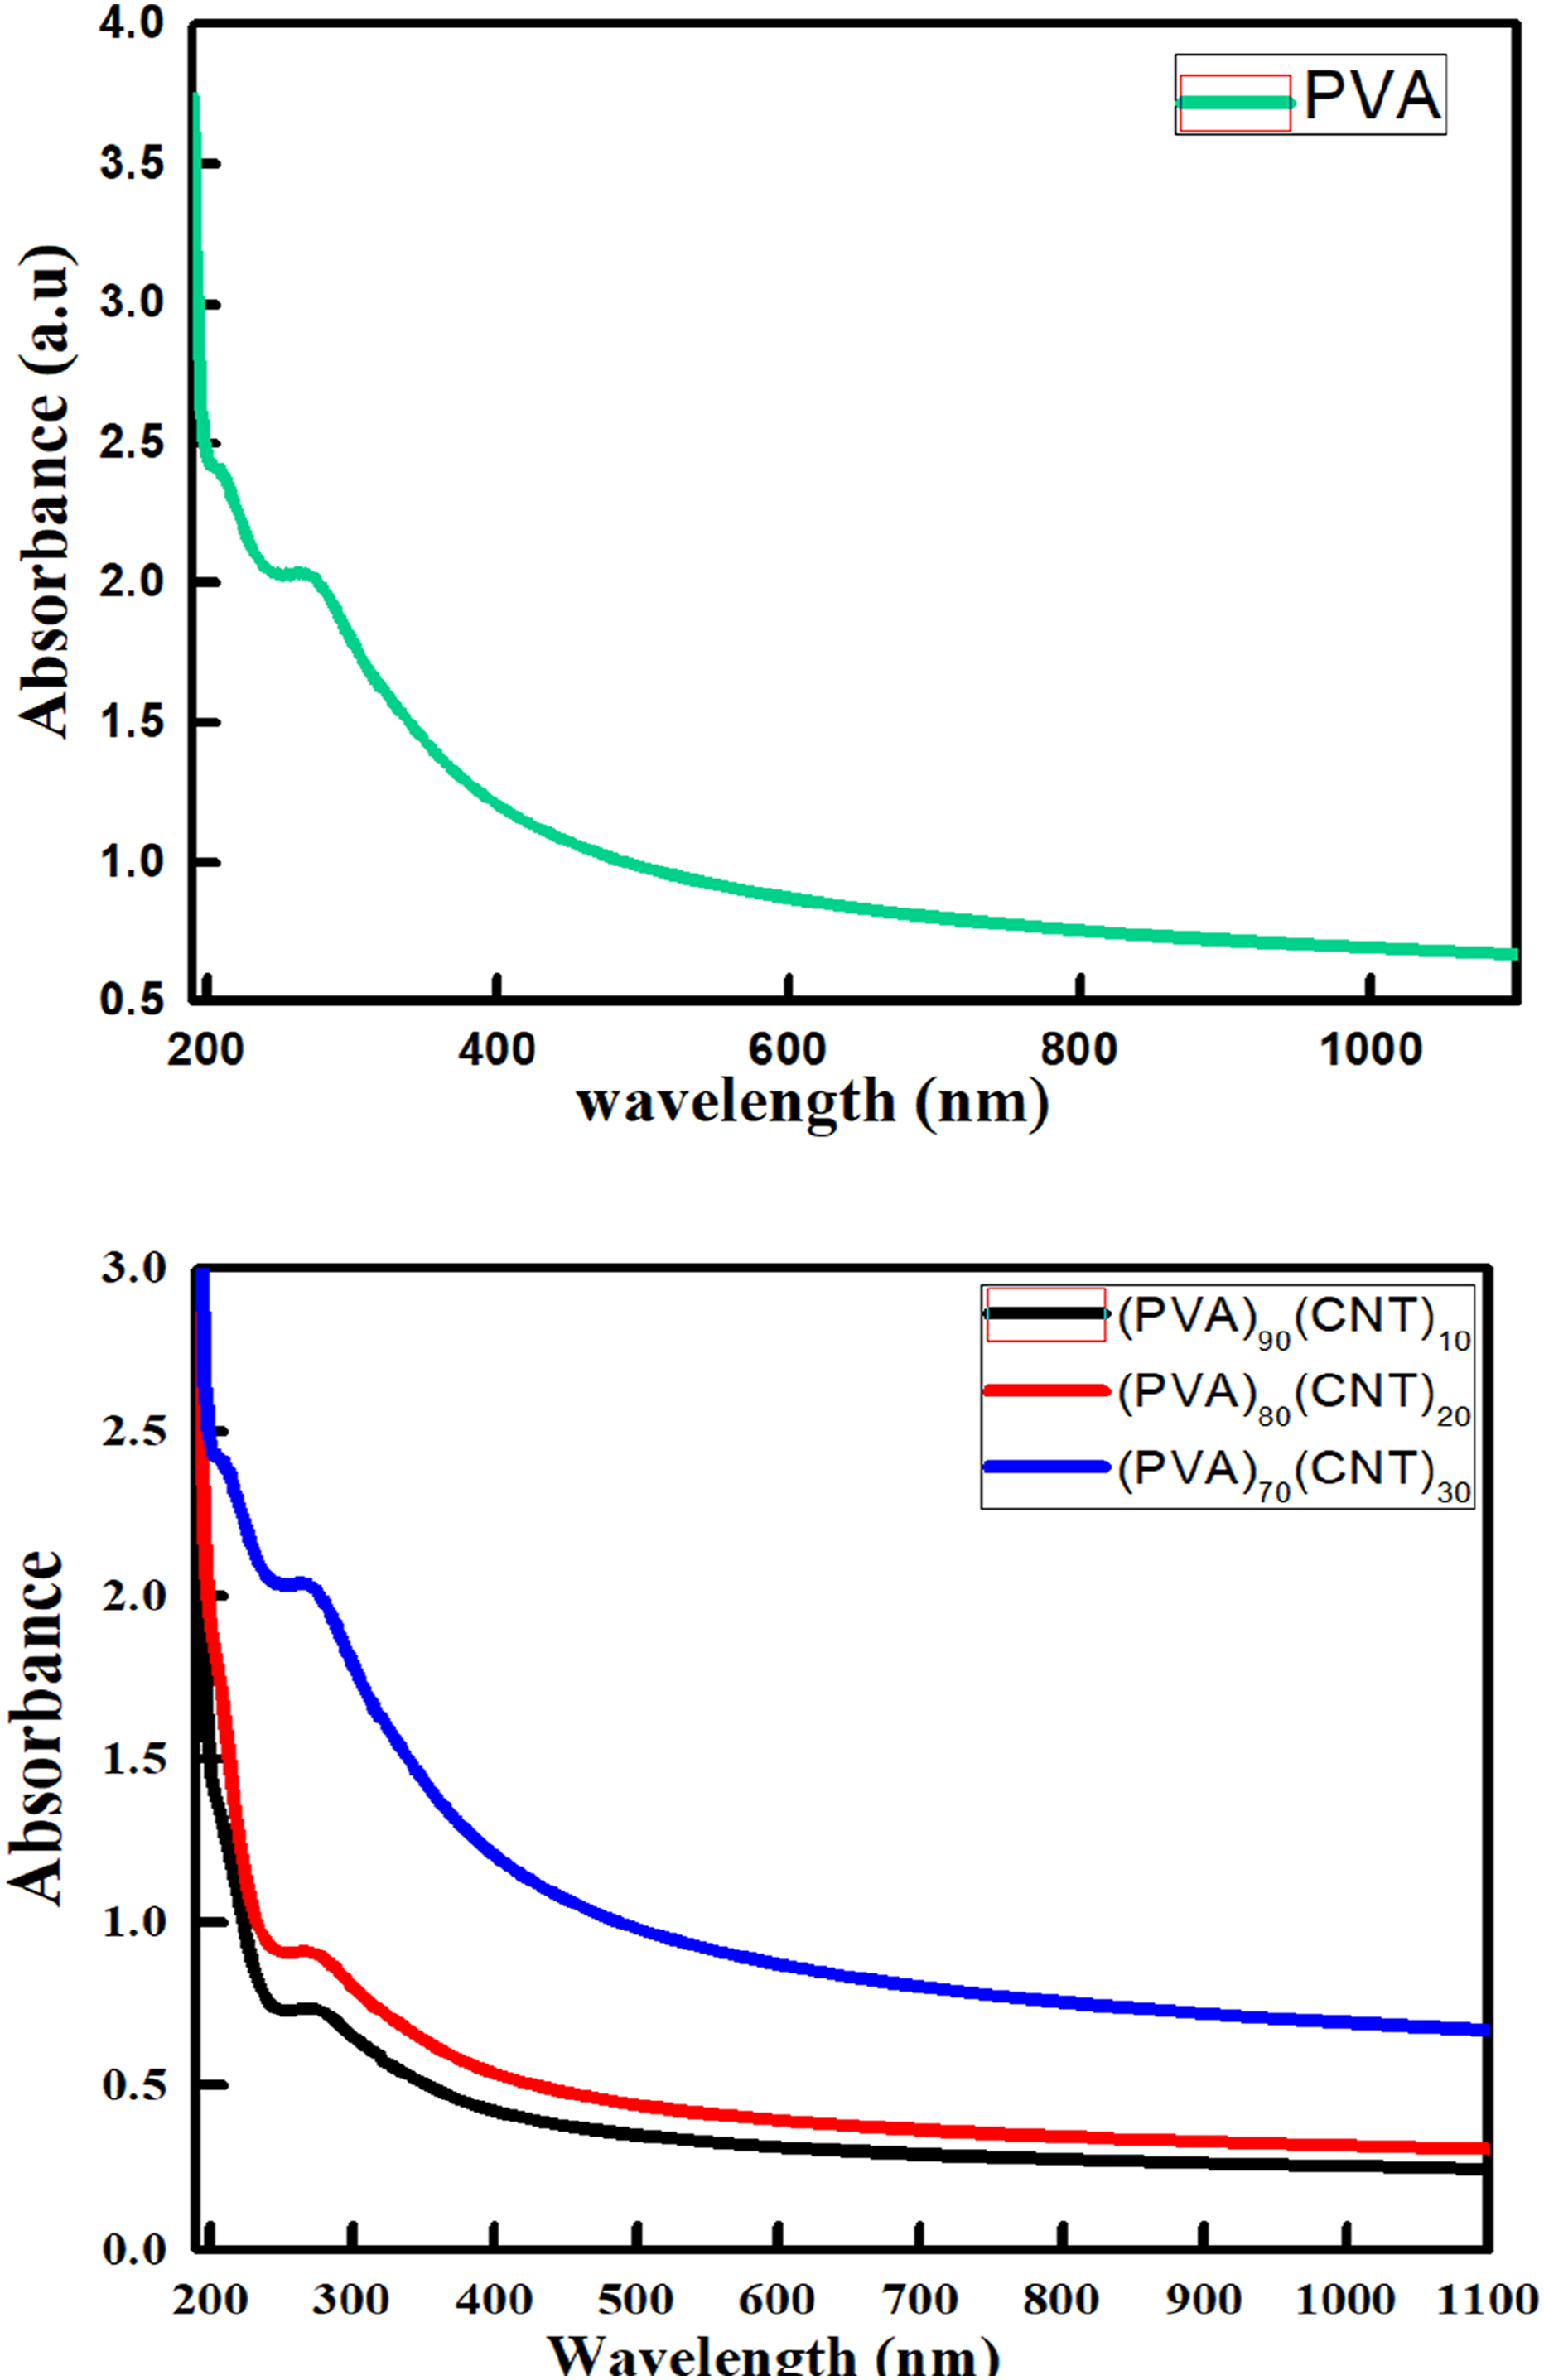
The optical properties of pure PVA and PVA doped with different concentration of CNTs were investigated. Figure 8 shows the results of UV-Visible spectra of PVA/CNTs with different concentrations. It indicates a strong absorption band at 279 nm of pure PVA due to π→π* electronic transitions.51,52 It can be noticed that with addition of CNTs with different concentration (10,20 &30 wt%) to PVA film, the absorption band is slightly shifted to lower wavelengths (blue shift) due to changes in the band gap. The value of the blue shift increases with high concentrations of CNTs, this increase in blue shift confirms the interaction of CNTs nanoparticles and the polymer PVA to form polymer nanocomposites. This make changes in the optical properties, due to absorption or emission of wavelength. The optical band gap (Eg) of the polymer nanocomposites is usually calculated by the Tauc’s relation53,54: UV-Visible absorption spectra of (a) pure PVA and (b) (PVA)100-x (CNT)x nanocomposite films with varying CNT concentrations.
Energy. The n value will be 1/2 in the case of direct allowed transitions and two in case of indirect allowed transitions. The direct and indirect band gap values can be estimated from the interception of the extended straight line of the curve to the zero-absorption axis shown in.
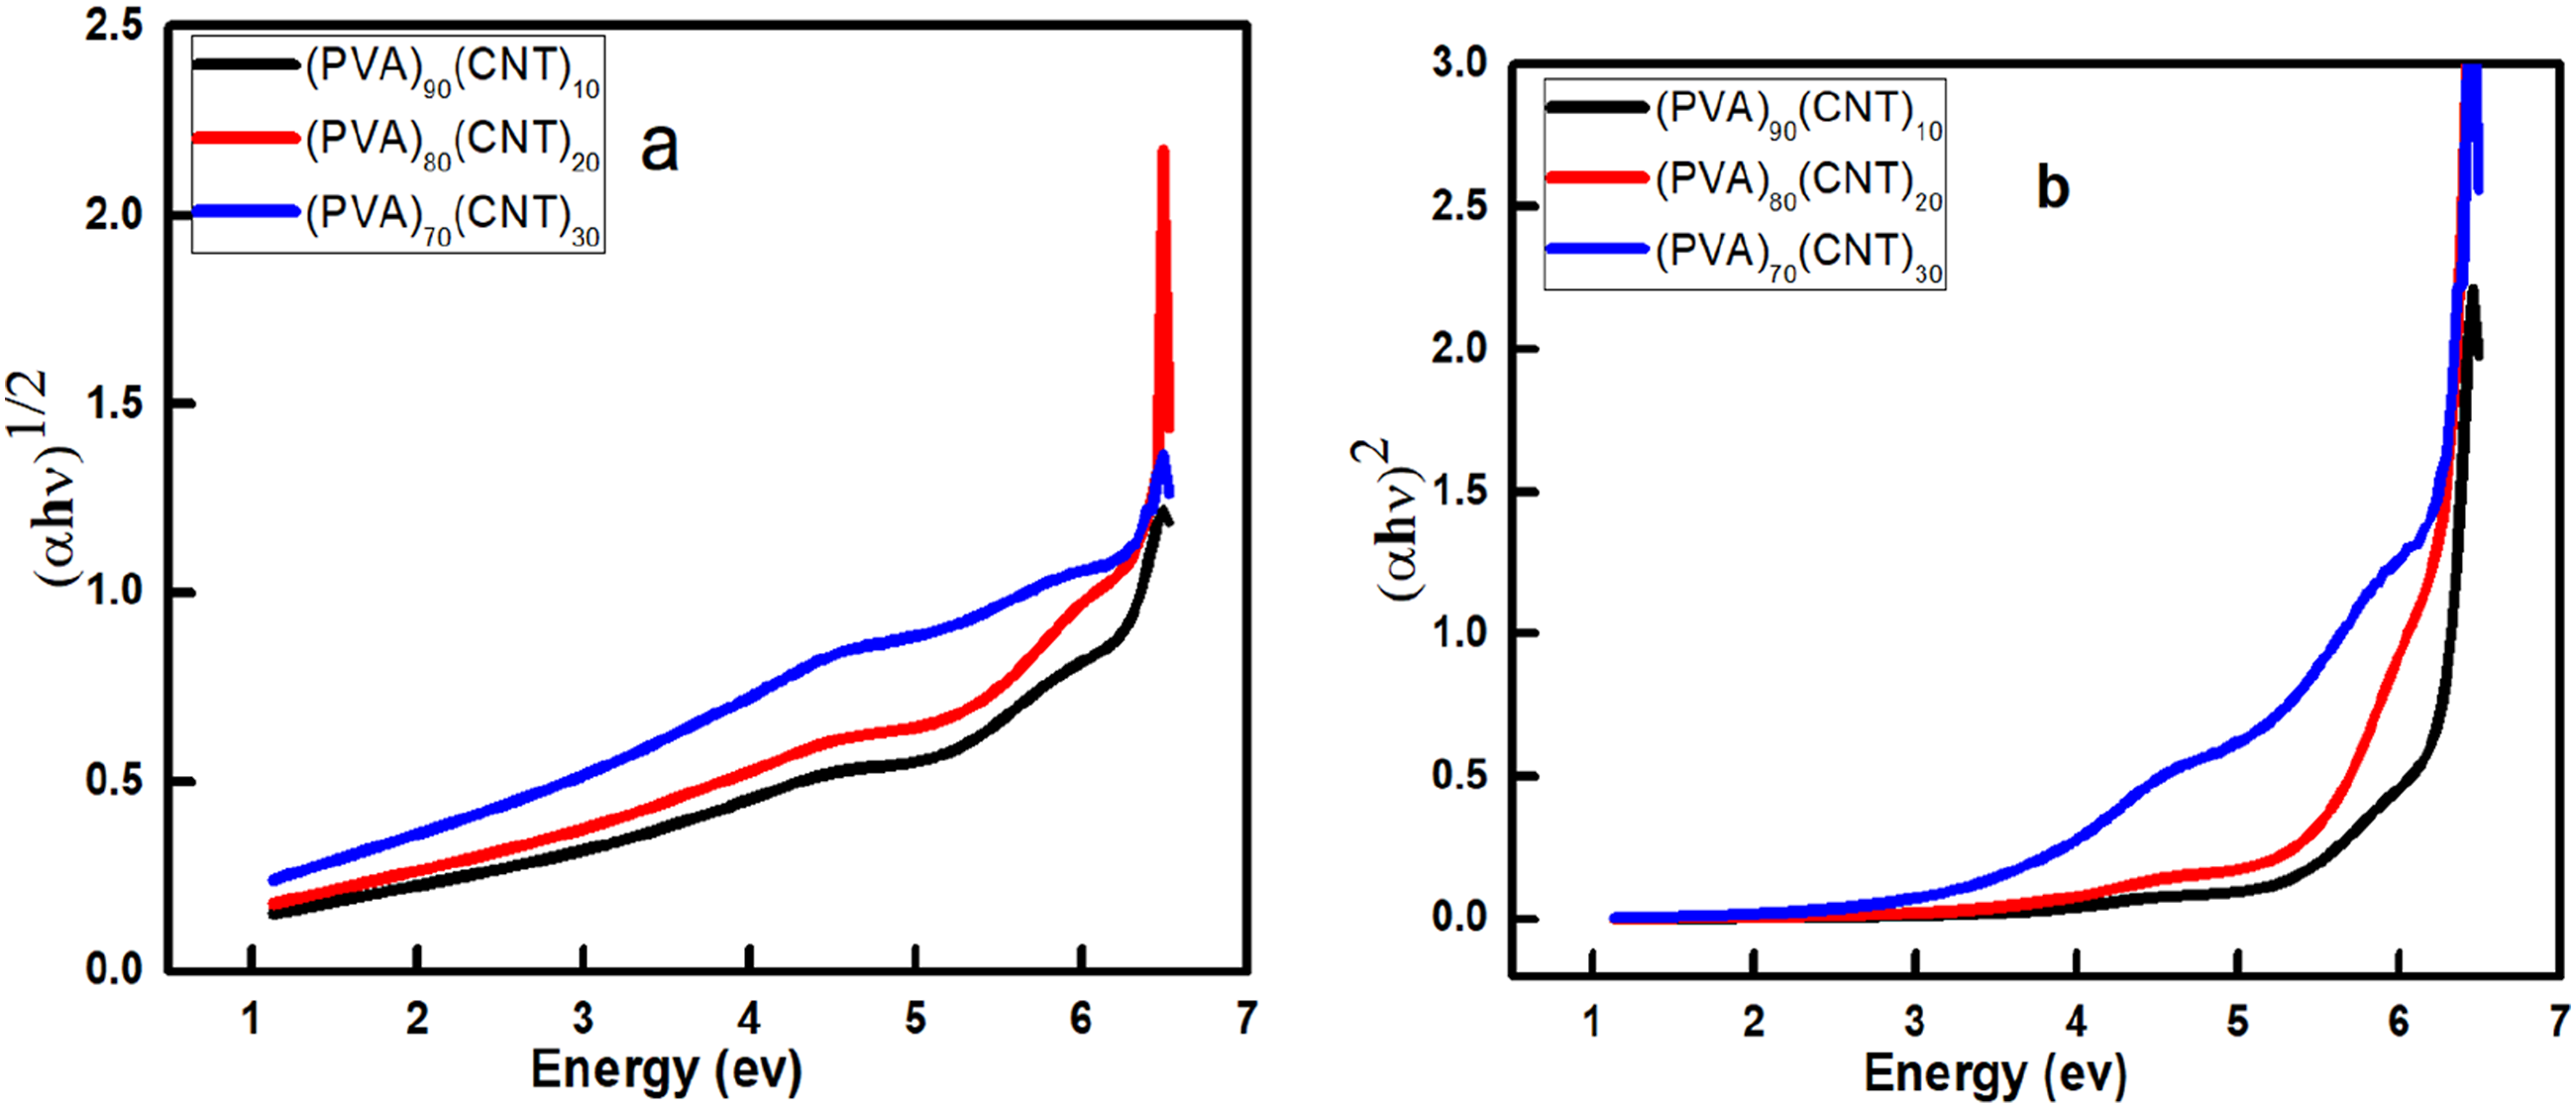
Figure 9 exhibits an increase in the optical response, particularly in the higher energy ranges. This suggests that increasing the CNT content enhances the material’s ability to absorb light or interact with photons. The direct band gap of PVA doped with (10,20&30) wt% CNTs gradually decreased from 4.6 eV for (PVA)90(CNT)10, 3.75 eV for (PVA)80(CNT)20 to 2.2 eV for (PVA)70(CNT)30 respectively, the different concentration changes the direct band gap, as shown in. On the other hand, exhibits the indirect band gap of the PVA/CNTs films that shows a decrease of values as follows: 4.7 eV for (PVA)90(CNT)10, 3.75 eV for (PVA)80(CNT)20 and 2.9 eV for (PVA)70(CNT)30. The shift in the optical band gap from 4.6 eV to 2.2 eV of CNTs do changes in the electronic structure of PVA films. Furthermore, the reduction in the optical band gap may be led to the change in the polymer structure. These alteration is attributed to localized states where the localized state is responsible for the decrease in band gap.55,56
Tauc plots for determining optical band gaps of PVA films with different CNT concentrations: (a) (∝hυ)
0.5
vs. hυ for energy for indirect allowed transitions and (b) (∝hυ)
2
vs. hυ for direct allowed transitions for the PVA/CNT polymer nanocomposites.
Although biodegradability was not directly measured in this study, it is important to recognize that polyvinyl alcohol (PVA) is widely regarded as an environmentally friendly polymer. Under suitable conditions—such as the presence of specific microbial enzymes and moisture—PVA can break down into non-toxic byproducts like water and carbon dioxide. This property makes it a more sustainable alternative to conventional petroleum-based polymers, particularly in applications where end-of-life disposal is a concern. While the addition of carbon nanotubes may influence the degradation rate, the use of a biodegradable matrix still contributes to reducing the environmental impact of the material system. These considerations are especially relevant as the demand for high-performance yet eco-conscious materials continue to grow.
Conclusion
The (PVA)100-x (CNT)x with x = 10,20, and 30 wt% nanocomposite films were produced via the casting evaporation technique. XRD showed alterations in structural parameters such as crystallite size, dislocation density, and interchain distance, and confirmed the monoclinic crystal structure of PVA which indicate successful integration of CNTs into the PVA matrix. Unit cell volume decreased from 67.31 Å3 (PVA)90(CNT)10 to 64.55 Å3 (PVA)70(CNT)30 ,indicating structural compaction with increasing CNT content. SEM micrographs exhibit progressive changes in surface morphology from smooth surface with parallel striations for pure PVA, and complex, layered structure with feathered edges for (PVA)90(CNT)10 and textured surface with granular particles and porous underlying structure for (PVA)80(CNT)20 to columnar structures with 2-3 μm size revealed by cross-sectional view, suggesting anisotropic material properties for (PVA)70(CNT)30 film. Ion Beam Analysis, namely the RBS and ERDA techniques, provided insights into elemental composition, for instance, oxygen content decreased from 17.3% (PVA)90(CNT)10 to 15.6% (PVA)70(CNT)30, while carbon content increased from 30.4% to 32.7%, reflecting the changing composition with CNT addition. FTIR spectra revealed characteristic PVA peaks (3300 cm−1 for -OH, 1150 cm−1for C-O). Also, a new peak at 1605 cm−1 was observed that is attributed to C = O, indicating PVA-CNT interaction. TGA exhibits a main degradation stage (230 °C–380 °C) that showed weight losses of 67%, 55%, and 60% for (PVA)90(CNT)10, (PVA)80(CNT)20, and (PVA)70(CNT)30 samples respectively, suggesting complex thermal stability changes. The improvement in thermal stability alighns with findings by Nasar et al., who reported improved decomposition resistance in CNT/PVA nanocomposites compared to pure PVA films due to strong interfacial bonding and reduced polymer chain mobility. 57
The maximum stress decreased from 75 MPa for (PVA)90(CNT)10 to lower values 65 and 35 MPa for (PVA)80(CNT)20, and (PVA)70(CNT)30, respectively, indicating a reduction in mechanical strength at higher CNT concentrations. Also, the calculated brittleness values show the (PVA)90(CNT)10 sample as the most brittle. These results suggest that CNT incorporation significantly impacts the mechanical behaviour of PVA films, with optimal properties potentially achieved at lower CNT concentrations. This trend aligns with Abdelrazek et al., who observed that mechanical strength and modulus improved in PVA/MWCNT composites up to an optimal loading, beyond which agglomeration reduced performance. 48 Optical Properties showed a blue shift in absorption band with increasing CNT concentration. Direct band gap decreased from 4.6 eV ((PVA)90(CNT)10) to 2.2 eV ((PVA)70(CNT)30), demonstrating significant alteration of electronic structure as well as enhanced optical response in higher energy ranges with increased CNT content. The band gap is narrow which aligns with the obtained results from14,58 which make these materials are suitable for optoelectronic applications which they used CNT as nanofiller into PVA.
For the limitations, future aspects, significance in this work, the incorporation of CNTs clearly enhances several functional properties of PVA, some limitations should be acknowledged. At higher CNT concentrations, issues such as nanoparticle agglomeration and uneven dispersion can lead to diminished mechanical performance and increased brittleness. That maybe insufficient interfacial bonding or restricted polymer chain mobility, which can compromise the structural integrity of the films.
Looking ahead, further studies could focus on improving CNT dispersion through chemical functionalization or surfactant-assisted processing. Additionally, exploring hybrid nanofillers or layered architectures may offer a route to balance mechanical strength with flexibility. Evaluating the long-term stability and performance of these composites in real-world optoelectronic devices would also be a valuable next step.
Overall, this work demonstrates that CNTs can serve as effective modifiers for tuning the structural, thermal, and optical behavior of biodegradable PVA films. The ability to engineer these properties through controlled nanofiller loading opens new possibilities for sustainable materials in flexible electronics, optoelectronics, and photonic systems.
Supplemental material
Supplemental material - Structural, thermal, optical, and ion beam analysis of PVA/CNT polymeric nanocomposite films
Supplemental material for Structural, thermal, optical, and ion beam analysis of PVA/CNT polymeric nanocomposite films by Amani Alruwaili, Soraya Abdelhaleem, Eman Tawfik, Frans Munnik, René Heller, M.S Shalaby in Journal of Thermoplastic Composite Materials
Footnotes
Acknowledgements
This work was partially supported by the RADIATE project (proposal No. 23003284-ST) under the Grant Agreement 824096 from the EU Research and Innovation programme HORIZON 2020. The authors gratefully acknowledge the Institute of Ion Beam Physics and Materials Research at Helmholtz-Zentrum Dresden-Rossendorf e.V. (HZDR), a member of the Helmholtz association, for their assistance with ion beam measurements. The authors extended thier appreciation to the Deanship of Scinetific Research at Northern Border University, Arar, KSA, for funding this research through the project number NBU-FFR-2025-885-05.
Author contributions
Amani Alruwaili: funding, Experimental work, Soraya Abdelhaleem: Theoretical and Experimental work, Data curation, writing the original draft, revision the writing, Writing - Review & Editing Eman Tawfik: Experimental, samples preparations, writing the original draft, Frans Munnik and René Heller: Ion beam analysis investigations, Data, Writing - Review & Editing M.S. Shalaby: Conceptualization, supervision, Data curation Writing - Original Draft, Writing - Review & Editing.
Declaration of conflicting interests
The authors declared no potential conflicts of interest with respect to the research, authorship, and/or publication of this article.
Funding
The authors received no financial support for the research, authorship, and/or publication of this article.
Correction (August 2025):
The SI unit for interchain distance in the Abstract and Figure 1 was updated from Angstrom (Å) to meters (m) since the original publication of the article.
Supplemental Material
Supplemental material for this article is available online.
References
Supplementary Material
Please find the following supplemental material available below.
For Open Access articles published under a Creative Commons License, all supplemental material carries the same license as the article it is associated with.
For non-Open Access articles published, all supplemental material carries a non-exclusive license, and permission requests for re-use of supplemental material or any part of supplemental material shall be sent directly to the copyright owner as specified in the copyright notice associated with the article.