
Abstract
This study proposes an acid-etching surface treatment technology for treating the surface of carbon fiber/epoxy composites (CF/EP) to improve their physical and chemical properties, thereby achieving good adhesion with thermoplastic resins and high-quality resistance welding of CF/EP. The research shows that treating the CF/EP surface with concentrated sulfuric acid at 50°C for 45 minutes can significantly improve the single lap shear strength (LSS) of the CF/EP welding joint to 21.47 ± 1.2 MPa, which is 163.11% ± 14% higher than the LSS of the untreated sample. The acid etching surface treatment technology proposed in this paper is low-cost, simple to operate, and easy to replicate, combining innovation, feasibility, and economy. By analyzing the surface morphology, wettability, and chemical groups of the surface-treated samples, it can be seen that acid-etching treatment at an appropriate temperature and for a reasonable time can increase the surface roughness of CF/EP and introduce oxygen-containing chemical groups to the CF/EP surface, enhancing the wettability of the CF/EP surface and thereby improving the physical embedding and chemical bonding capabilities of the CF/EP surface.
Introduction
Carbon fiber/epoxy composites (hereinafter referred to as CF/EP) has become an indispensable key material in modern industry due to its excellent mechanical properties such as lightweight, high strength and high modulus. This material is used in a wide range of applications in many fields such as aerospace, high-performance automotive and military industries. For example, the proportion of CF/EP in the fuselage material of Airbus A380 aircraft reaches 22%, 1 the proportion of CF/EP in the material of Boeing 787-8 aircraft is as high as 50%, 2 and the amount of CF/EP in the Boeing 777 and A350XWB airplanes is 12% 3 and 53%, 4 and the amount of CF/EP on the F-22, a fifth generation fighter produced by Lockheed Martin, is 23%. 5 This speaks volumes about the centrality of CF/EP in the cutting edge of modern industry. With the increasing demand for lightweight and high-performance materials in modern industry, it is expected that the application scale and proportion of CF/EP will be further expanded in the future, becoming an important driving force for technological progress in the industry.
However, despite the outstanding performance of CF/EP, the development of high-quality connection technology has remained a key bottleneck limiting its large-scale application. Currently, the main connection methods for CF/EP include mechanical connections and adhesive bonding, but both methods have obvious drawbacks. 6 Mechanical connections (such as bolts or rivets) are simple to operate but can introduce stress concentration, reduce local material strength, and even cause fatigue cracks; adhesive bonding does not require additional connectors or drilling but cannot be disassembled once bonded, has a long curing time, and fails to meet the efficiency requirements of large-scale industrial production. Therefore, developing an efficient, reliable, and scalable CF/EP connection technology has become an urgent and critical issue. In recent years, the development of composite welding technology has opened up new possibilities for addressing this issue. Composite material welding technology offers high efficiency, does not compromise the inherent strength of the material, and is removable. Among various composite material welding technologies, resistance welding has garnered significant attention due to its reusability, high efficiency, and controllability. 7 Early researchers began exploring resistance welding processes for thermoplastic composites.
For example, J. Gillespie Jr et al. 8 conducted experimental research on the resistance welding of graphite-reinforced PEEK composite materials, and the results showed that there was a significant correlation between parameters such as welding power, energy, and melting time and the quality of the welded surface. Subsequently, Howie et al. 9 used statistical experimental design methods to study the resistance welding process of graphite/polyarylsulfone composites , while Holmes and Gillespie conducted thermal analysis on large thermoplastic composite joints. 10 These studies laid the foundation for the application of resistance welding technology in the field of thermoplastic composites.
However, for another major category of composite materials, thermosetting composites, the application of resistance welding technology is relatively rare. Take the most common and classic thermosetting composite material, CF/EP, as an example. After curing, the resin matrix of CF/EP does notremelt when heated, but instead carbonizes or vaporizes. In addition, the resin matrix of CF/EP has a smooth surface and is chemically inert after curing, making it difficult to bond effectively with other organic materials. Therefore, based on these characteristics, it is almost impossible to use resistance welding to connect CF/EP directly, as is the case with thermoplastic composites. In order to solve the problem of the difficulty of achieving high-quality resistance welding of thermosetting composites represented by CF/EP, a large amount of research on resistance welding of thermosetting composites has been developed. The key to achieving resistance welding of thermosetting composites is how to successfully construct a high-strength thermoplastic/thermosetting composite structure, in which the bonding method and strength of the thermoplastic resin layer and the thermosetting composite are crucial. Currently, there are two main approaches to constructing high-strength thermoplastic/thermosetting composite structures: surface plasticization and surface treatment.
Surface plasticization primarily involves co-curing a thermoplastic layer on the surface of the thermosetting composite material to construct a high-strength thermoplastic/thermosetting composite structure, thereby enabling resistance welding. For example, in the Thermabond™ process, a thin layer of amorphous polymer can be co-cured onto a reinforced fiber composite layer for welding. 11 This method requires that the glass transition temperature of the matrix material be higher than the melting point of the film to ensure that the matrix structure is not damaged during the welding process. In addition, the monomer diffusion-reaction mechanism at the interface has also been widely researched. Research by Rajagopalan et al. 12 has shown that epoxy resins and amine monomers can penetrate thermoplastic polymers and cross-link during the curing process to form a new transition phase structure. The cross-linked network obtained after co-curing provides an effective connection mechanism for thermosetting/thermoplastic composite structures. In summary, surface plasticization is a technology that involves introducing a thermoplastic resin coating layer at a specific location on the surface of thermosetting composite materials prior to molding to construct thermoplastic/thermosetting composite material structures. This technology is innovative and forward-looking in terms of research, but it involves numerous technical details, is difficult to operate, and lacks flexibility in engineering applications. Once the composite material is plasticized and molded, it is impossible to change or adjust the position and size of the plasticized interface as required, making it difficult to meet the requirements of modern industry for high efficiency, production flexibility, and consistency.
In contrast, surface treatment is a more direct and efficient way to construct high-strength thermoplastic/thermosetting composite structures. Surface treatment is a technology for treating any part of the surface of a thermosetting composite material after it has been cured and molded. The physical and chemical properties of the surface of the thermosetting composite material are improved after surface treatment, allowing a layer of thermoplastic resin to be directly coated on it, and a high-strength thermoplastic/thermosetting composite structure to be formed directly after the thermoplastic resin is heated and melted. Surface treatment usually relies on specialized equipment to treat the surface of the material to improve its surface properties, thereby achieving high-quality resistance welding. This technology was first applied to metal surface treatment and has gradually extended to advanced materials with the development of science and technology. Existing surface treatment technologies include, but are not limited to: plasma treatment of CF/EP using a plasma emitter, 13 polymer surface etching using laser equipment, 14 mechanical grinding of metal composite surfaces using high-precision grinding machines, 15 treating semiconductor material surfaces with chemical mechanical polishing technology, 16 or using ozone treatment 17 and surface fluorination 18 and other chemical-physical combination technologies. Compared with surface plasticization, surface treatment acts directly on the molded composite material itself without the need to introduce additional new materials. It involves fewer technical details and simpler operations, making it more controllable in engineering and more common in industrial production.
However, these existing surface treatment technologies are often very expensive or inefficient within industrial grade application scenarios, and cannot simultaneously meet the needs of efficient and cost-effective industrialised production. This is mainly due to the fact that existing surface treatment technologies rely on expensive specialised equipment or complex treatment environments to treat materials. For example, the surfaces treatment techniques such as laser etching, plasma processing, chemical mechanical polishing or mechanical grinding is usually highly efficient (Surface treatment technology mentioned above usually takes only a few minutes,13–18 but the equipment used is very expensive. e.g., an industrial-grade laser etcher can cost tens of thousands of USD (Universal Laser Systems PLS6.150D, priced at 40,000 USD; Universal Laser Systems, 2024), 19 and an industrial-grade plasma transmitter can cost tens or even hundreds of thousands of USD (Plasma Etch BT series, priced at 90,000 USD, Plasma Etch Inc, 2024; Anatech SCE series, priced at 125,000 USD, Anatech USA, 2023)20,21 and an industrial-grade high precision mechanical grinder can cost hundreds of thousands of USD (Barnes Aerospace Horizontal material grinding machines, primarily used for surface preparation of aerospace materials, priced at 200,000 to 800,000 USD, Barnes Aerospace, 2024), 22 and an industrial-grade chemical mechanical polishing (CMP) processing machine often costs millions of USD (Tokyo Electron CLESIA series, priced at 3,000,000 to 5,000,000 USD, Tokyo Electron Limited, 2024). 23 Other surface treatment technologies, such as ozone treatment and fluorination, are less efficient, although less costly compared to other surface treatment technologies.
For example, treating materials using ozone treatment technology requires placing the material in an ozone-filled chamber and using an ozone generator in combination with ultraviolet (UV) light to accelerate the process and improve the treatment efficiency. 17 However, despite this, ozone treatment has very limited effect on some inert materials and the effect is not long lasting, so the treatment efficiency is not high. Fluoridation treatment, on the other hand, requires exposing the material to fluorine gas or a mixture of fluorine gas and inert gas in a plasma environment, which requires preparing the plasma environment and energising the fluorine gas or a mixture of fluorine gas and inert gas in advance, 18 resulting in high treatment cost and low treatment efficiency. Therefore, although the existing surface treatment technologies have the prospect and possibility to meet the modern industrial production in enhancing the surface properties of materials, the strict requirements of these technologies on the equipment or the treatment environment cause them to still be difficult to meet the current requirements of large-area, continuous production and controllable cost in the industrial field.
In order to solve the technical pain point that existing surface treatment technologies cannot combine low cost and treatment efficiency, this study proposes a surface treatment technology that combines low cost and treatment efficiency: Treatment of CF/EP surfaces with concentrated sulfuric acid. Specifically, this technique significantly improves the surface roughness, wettability, and chemical activity of CF/EP by treating the CF/EP surface with concentrated sulfuric acid under mild conditions (45 min at 50°C),thereby increasing the strength of physical embedding and chemical bonding with PA6. PA6 is an ideal composite resistance welding support material 24 due to its excellent mechanical properties, thermal stability, and low production cost. In addition, PA6 has excellent electrical insulation properties, which can effectively prevent current leakage during the resistance welding process. The conductive material used in this research is stainless steel metal mesh (hereinafter referred to as “metal mesh”). The two types of conductive materials commonly used in resistance welding are metal mesh and carbon fiber mesh. The reason for choosing metal mesh as the conductive material in this research is that, compared with carbon fiber mesh, metal mesh can provide a more uniform temperature distribution and more stable process performance. 25 Concentrated sulfuric acid, on the other hand, has a significant advantage over other strong oxidising reagents (e.g., HNO3 , KMnO4/H2 SO4 ) for the etching treatment of CF/EP materials, thanks to its chemical properties. Specifically, concentrated sulfuric acid, thanks to its strong dehydrating and oxidizing properties, can effectively break the chemical bonds in the epoxy resin and achieve highly efficient etching of the epoxy resin layer in CF/EP, but at the same time, it causes very little damage to the carbon fibre, and therefore it is recommended by the standard GB T 3855-2005 26 to be the only standard etching reagent for the detection of the resin content of carbon fibre reinforced plastics. Other strong oxidants such as HNO3 or KMnO4/H2 SO4 , although they can also etch epoxy resins efficiently, at the same time, they also have a comparatively stronger etching effect on carbon fibres in CF/EP. 27 This can lead to some reduction of the strength of the carbon fibres even consequently damage the overall strength of the CF/EP, and is therefore unsuitable as an etching reagent in this study.
The experimental results showed that after Acid-etching treatment, the single lap shear strength (LSS) of CF/EP and PA6 welded joints increased significantly by 163.11% ± 14% to 21.47 ± 1.2 MPa compared with the initial value, and reaches the level of single lap shear strength of common aerospace adhesive bonded joints 28 and the single lap shear strength of CF/EP resistance welded joints treated with other surface treatment technologies such as Plasma treatment and mechanical grinding. 33
Compared with the existing surface treatment technologies, the Acid-etching surface treatment technology in this study has the following significant advantages: (i) Balance of cost and treatment efficiency: The technology is simple and has good treatment efficiency (main treatment time is only 45 min) using only concentrated sulfuric acid as the main treatment medium, without the need for costly additional equipment or harsh treatment environments. This results in a significant reduction in treatment costs while maintaining treatment efficiencies (the international purchase price of industrial grade concentrated sulfuric acid is approximately USD 57 to USD 143 per tonne
29
). (ii) Ease of operation: mild treatment conditions (50°C, 45 minutes), low equipment requirements, easy control of process parameters, and seamless integration into existing production processes. (iii) Scalability: Since the etching area can be freely selected, the Acid-etching technology can easily realize large-area, continuous surface treatment, which is particularly suitable for the needs of large-scale industrialized production.
The Acid-etching surface treatment technology proposed in this study is innovative, economical and feasible, and opens up a broad prospect for the industrialized application of CF/EP resistance welding. In modern industry, this technology can provide a reliable solution for efficient resistance welding of CF/EP components to meet lightweight design and high performance requirements. In summary, the Acid-etching surface treatment technology in this study solves the key difficulties of CF/EP resistance welding and provides a new idea for the industrial application of composite joining technology. This technology is expected to promote the wider application of CF/EP in modern industry and other fields, and also lays a solid foundation for the future development of high-performance composite material joining technology, which has important academic value and industrial application prospects.
Experimental methods
Raw materials
The commercially available industrial-grade concentrated sulfuric acid (hereinafter referred to as concentrated sulfuric acid) was supplied by Nanjing Chemical Reagent Co. Ltd, Nanjing, China, at a concentration of 98%. Baking soda (NaHCO3) was supplied by JKChemical Reagent Co. Ltd, Beijing, China, at a concentration of 10%. The commercially available CF/EP laminate was provided by Rhyxeon General Aviation Co. Ltd, Liaoning, China. The thickness of the laminate was 3 mm with [0]16 layup, and the epoxy resin (type L-285) and amine curing agent (type H 287) used in the preparation of the laminate were supplied by Hexagon Ltd, Switzerland, the carbon fibre (T300) woven fabric used in the preparation of the laminate supplied by Weihai Guangwei Composite Material Technology Co. Ltd, Shandong, China. Stainless-steel metal mesh (SUS 304, wire diameter 0.15 mm, wire spacing 0.164 mm) was supplied by Jingfeng Stainless-Steel Material Co. Ltd, G-uangzhou, China. The PA6 resin layer was 1 mm thick and was supplied by Intamsys Co. Ltd, China. The CF/EP laminate is cut to standard size (25.4 mm × 101.6 mm) using a miniature table saw in accordance with ASTM D5868. In order to match the standard size of the laminate and to facilitate electrode clamping, the stainless- steel metal mesh was cut to length × width of 25.4 mm × 70 mm. To match the standard size of the laminate and the size of the metal mesh, the PA6 was cut to length × width of 25.4 mm × 25.4 mm. The required raw material is cut to the described dimensions to obtain Figure 1. The above materials were ultrasonically cleaned twice with anhydrous ethanol for 20 min each time, and then dried in an oven at 60°C for 6 h. The materials were then dried for 6 h at 60°C. Raw materials. (a) Standard sized laminate (top view). (b) Metal mesh after cutting. (c) Standard sized laminate (front view). (d) PA6 after cutting.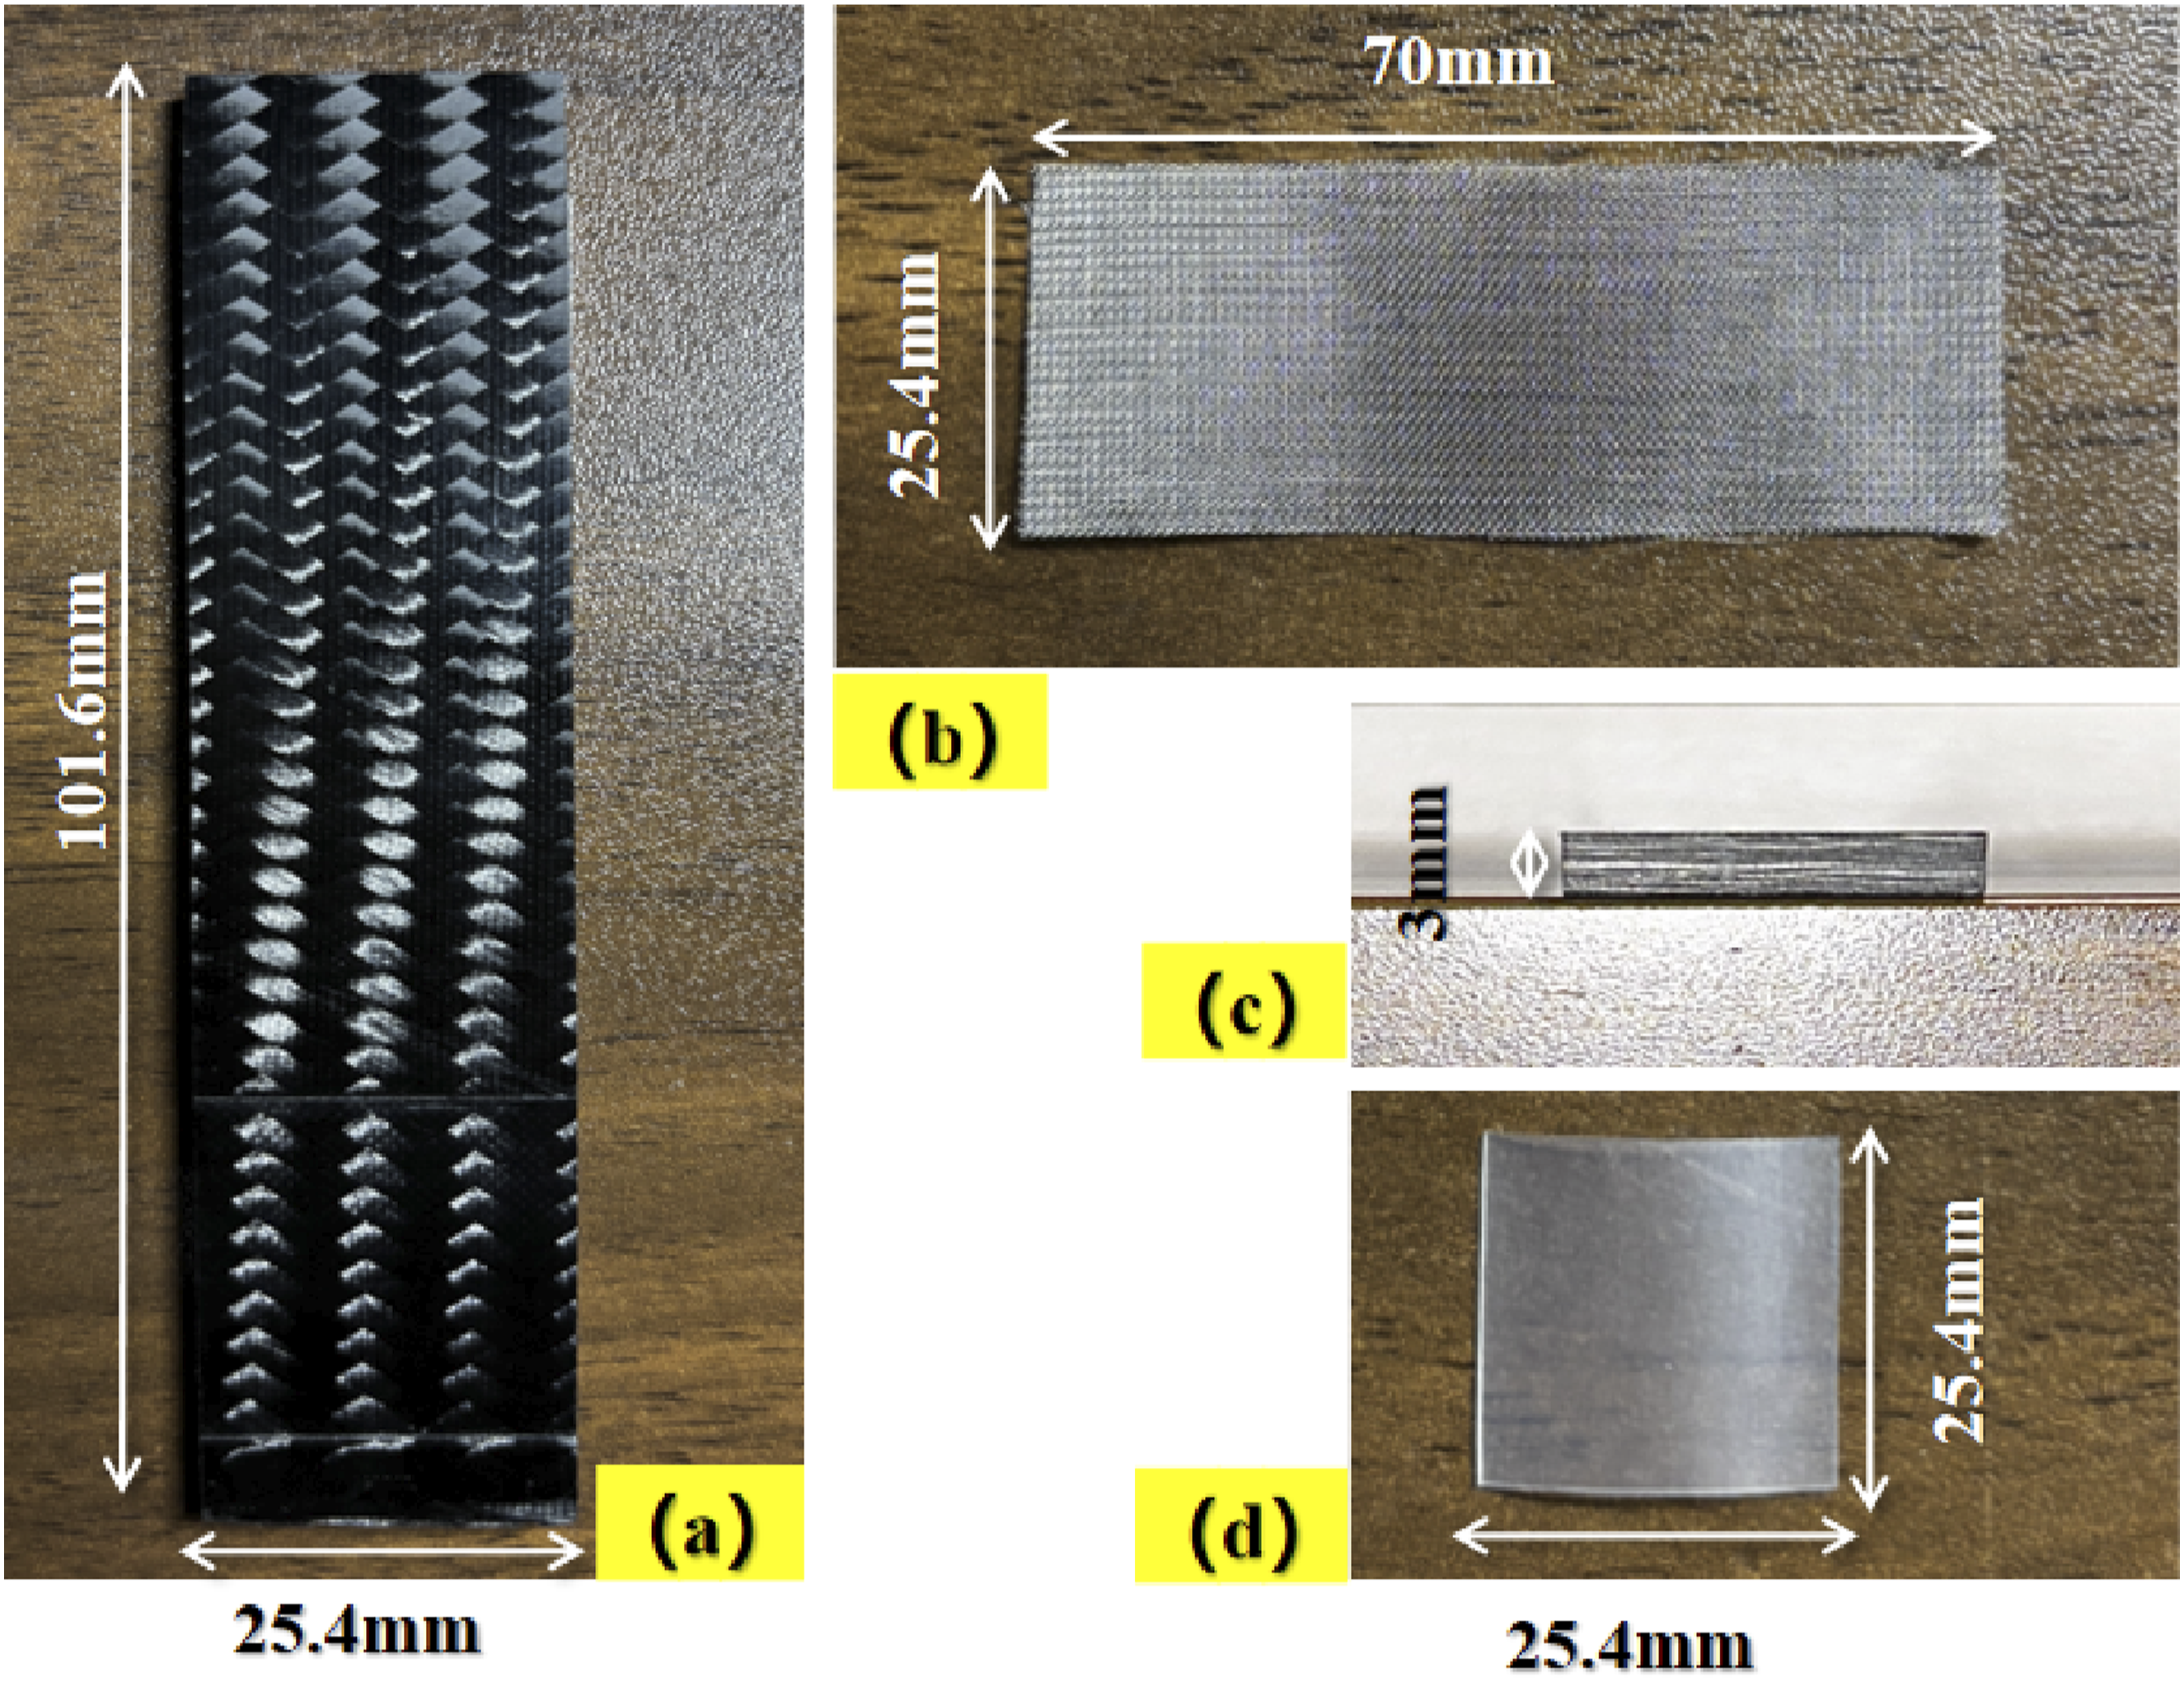
Research equipment
In this study, a self-built resistance welding platform, as shown in Figure 2(a), was used for resistance welding. This self built resistance welding platform consists of a bipolar pulse power supply, a hand-held pressure regulator, 4 purple copper electrodes and a GF/PI insulated platform. Purple copper has better electrical and thermal conductivity compared to other electrodes, so double-side purple copper electrodes are used in this experiment to reduce the loss of power flow. Each side of the electrode is divided into upper and lower two pieces, and the ends of the metal mesh will be clamped in the middle of the two electrodes during welding and connected using bolts and nuts to ensure that the electrodes remain well connected to the heating element. In the resistance welding process, the upper and lower laminates may conduct electricity, in order to reduce the heat loss, it is necessary to add ceramic insulating spacers on the upper and lower sides of the laminates. GF/PI composite material has the characteristics of high-temperature resistant and insulating, so the whole experiment will be carried out in the insulated platform made of GF/PI laminate. The use of pulsed power supply can effectively avoid current leakage, and the output mode of power supply is selected as constant current output in order to control the current. The hand-held pressure regulator is selected to provide pressure in the experiment, which can quickly and timely adjust the pressure to ensure constant welding pressure to the joints during the welding process. Resistance welding platform and welding process. (a) Self-built resistance welding platform. (b) Resistance welding process.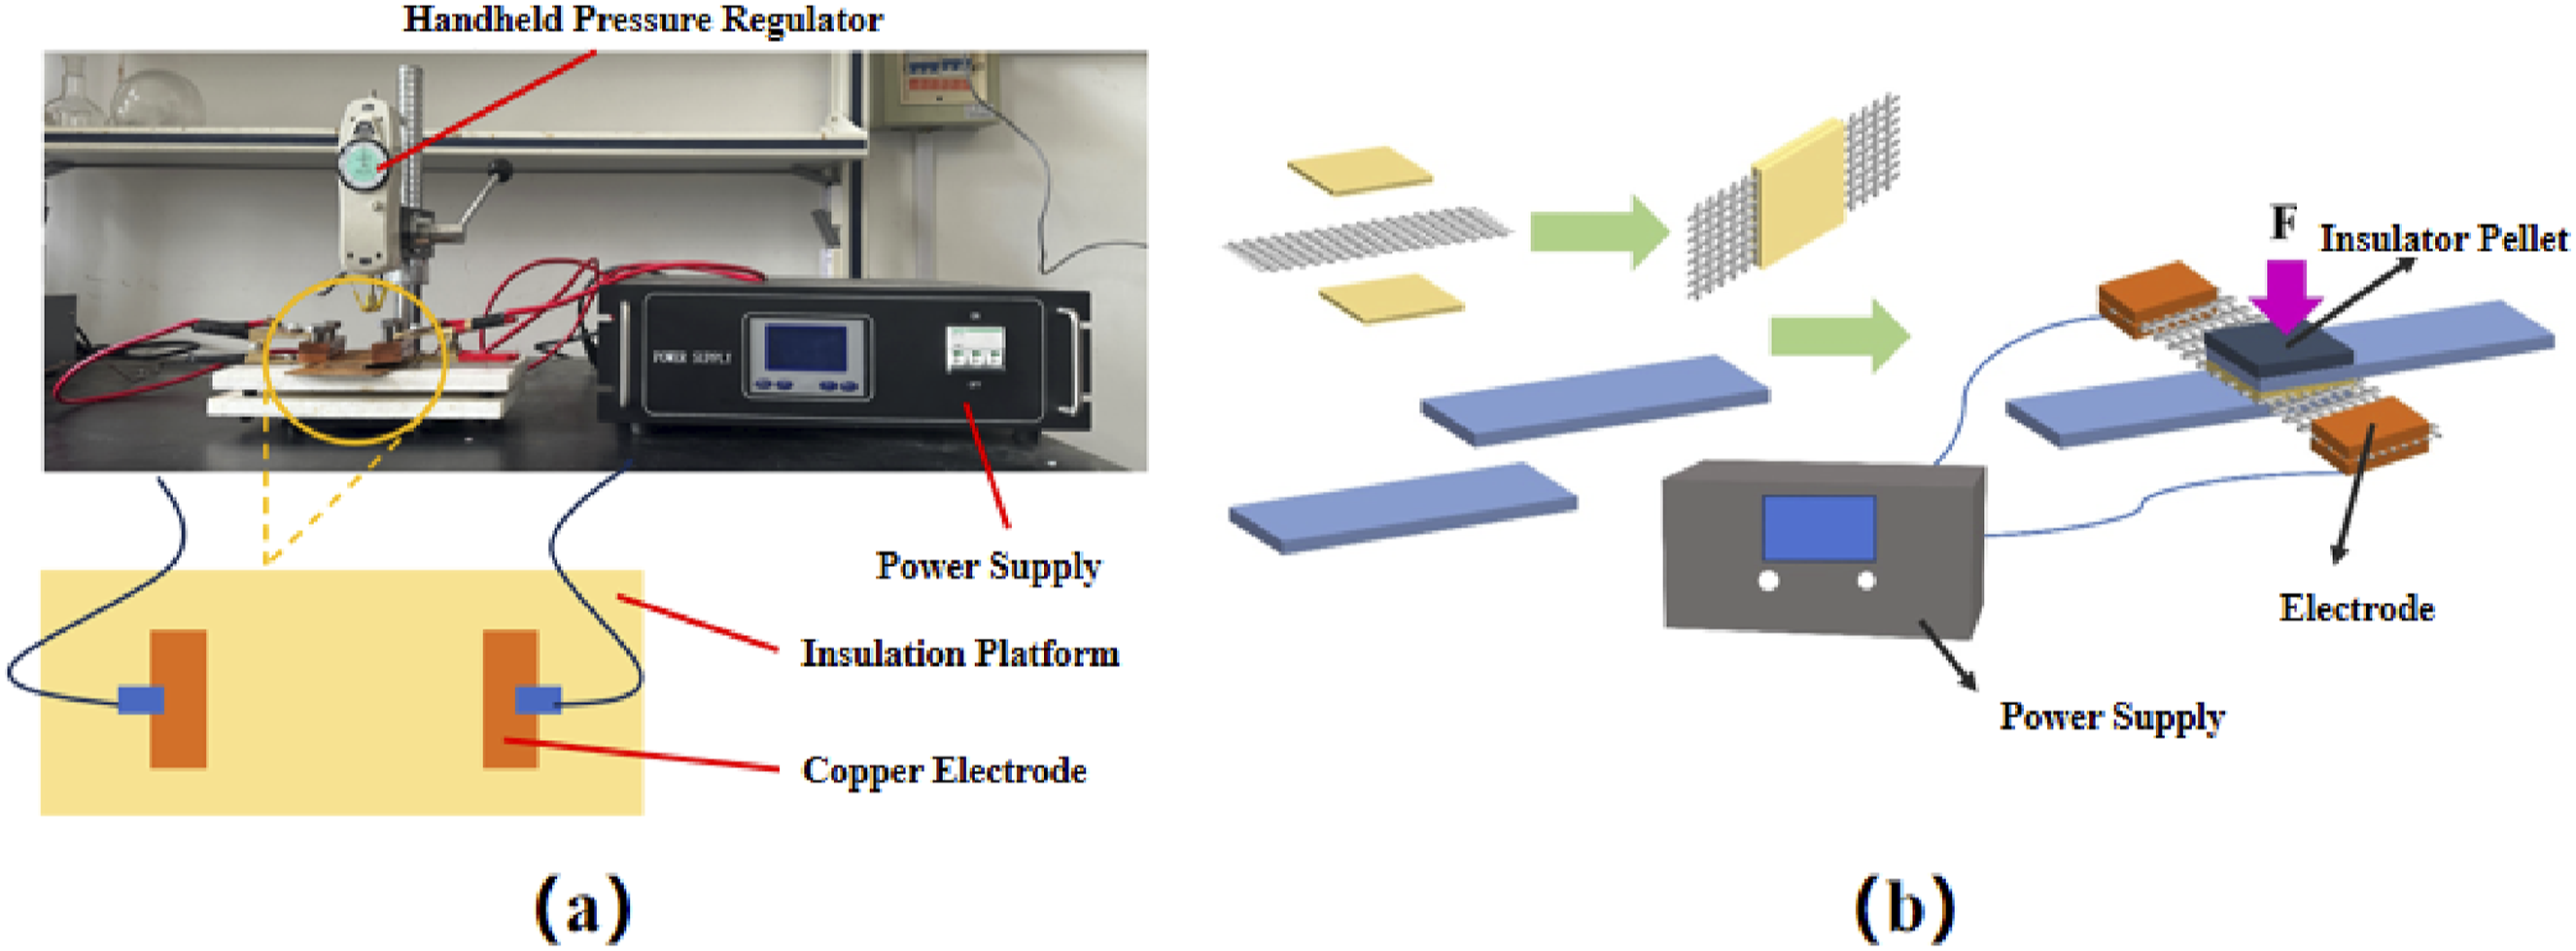
To provide a sufficient amount of resin to the welding area during welding, two pieces of PA6 with the dimensions of 25.4 mm × 25.4 mm were placed on the upper and lower sides of a stainless-steel metal mesh (dimensions: 25.4 mm × 70 mm) to form a sandwich structure. This sandwich structure is called the heating element, and the PA6 serves as the resin layer of the heating element. The heating element was placed between the welding areas of two standard-sized laminates to form a pre-welded part. The pre-welded part was placed onto the insulated platform of the self-built resistance welding platform (as shown in Figure 2(a)) and pressurized using a hand-held pressure regulator. After fixation, purple copper electrodes were clamped on both sides of the metal mesh, and the power supply was activated to perform resistance welding; the welding process is illustrated in Figure 2(b). Upon completion, the welded part was obtained and tested on a universal testing machine to determine its single lap shear strength (LSS).
ASTM D5868 is a reference standard used to evaluate the LSS mechanical properties of various welded joints.
30
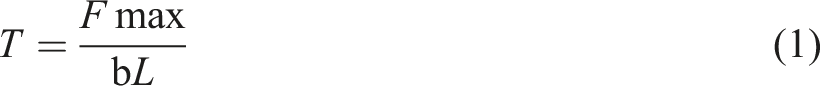
Resistance welded parts were tested in tension using an INSTRON Series 5980 Universal Testing Machine (UK) with a maximum load of 75 kN. The LSS of welded joints were measured three times for each set of welded parts, and the average value was recorded as the final result. The LSS was calculated based on the following relationship:
In this study, MP-41 transmission reflectance polarizing microscope and ZEISS Sigma-300 field emission scanning electron microscope were used to observe the micro- morphological changes of CF/EP surface before and after Acid-etching, and Thermo Scientific ESCALAB Xi + X-ray photoelectron spectroscopy was used to analyze the changes in chemical element content and acid-groups content of CF/EP surface before and after Acid-etching. The changes in chemical element content and chemical groups content of CF/EP surface before and after Acid-etching were analyzed using Thermo Scientific ESCALAB Xi + X-ray photoelectron spectroscopy, and the changes in wettability of CF/EP surface before and after Acid-etching were analyzed using Dataphysics OCA-20 optical interface analyzer.
Determine the resistance welding process parameters
The resistance welding parameters consist of Welding Power, Welding Time, and Welding Pressure, which directly determine the welding quality. 31 Welding Power and Welding Time determine the heat generation of the heating element, while Welding Pressure determines the degree of contact at the welding surface. Excessively high or low heat generation (e.g., too high Welding Power and too long Welding Time or too low Welding Power and too short Welding Time) will lead to ablation damage of the resin layer in the heating element or incomplete melting. Similarly, excessive or insufficient Welding Pressure may extrude molten resin out of the weld zone and damage the laminate, or result in poor resin-laminate contact. Therefore, optimized welding parameters combination provide appropriate heat and pressure to ensure the thermoplastic resin flows adequately without overheating or decomposition, thereby forming a strong bond with the laminate surface.
Firstly, this study preliminarily determines the value intervals of welding parameters by direct temperature measurement method. Considering that the edge effect
32
would make the heat generation in the welding area uneven, K-type thermal probes were embedded at three different points in the welding area to detect the average time required for the welding area to reach the desired temperature (melting temperature of PA6) during resistance welding. When the average temperature of the welded area reaches 220°C (the melting temperature of PA6), different welding powers and corresponding welding times are recorded, so as to preliminarily determine the appropriate parameter intervals of welding power and welding time. The temperature measurement method is shown in Figure 3, and the results of the temperature measurement are shown in Table 1. During this period, the welding pressure was initially set to 0.8 MPa according to the relevant research on CF/EP resistance welding.
33
Heat detection method. Temperature measurement results in the welding area.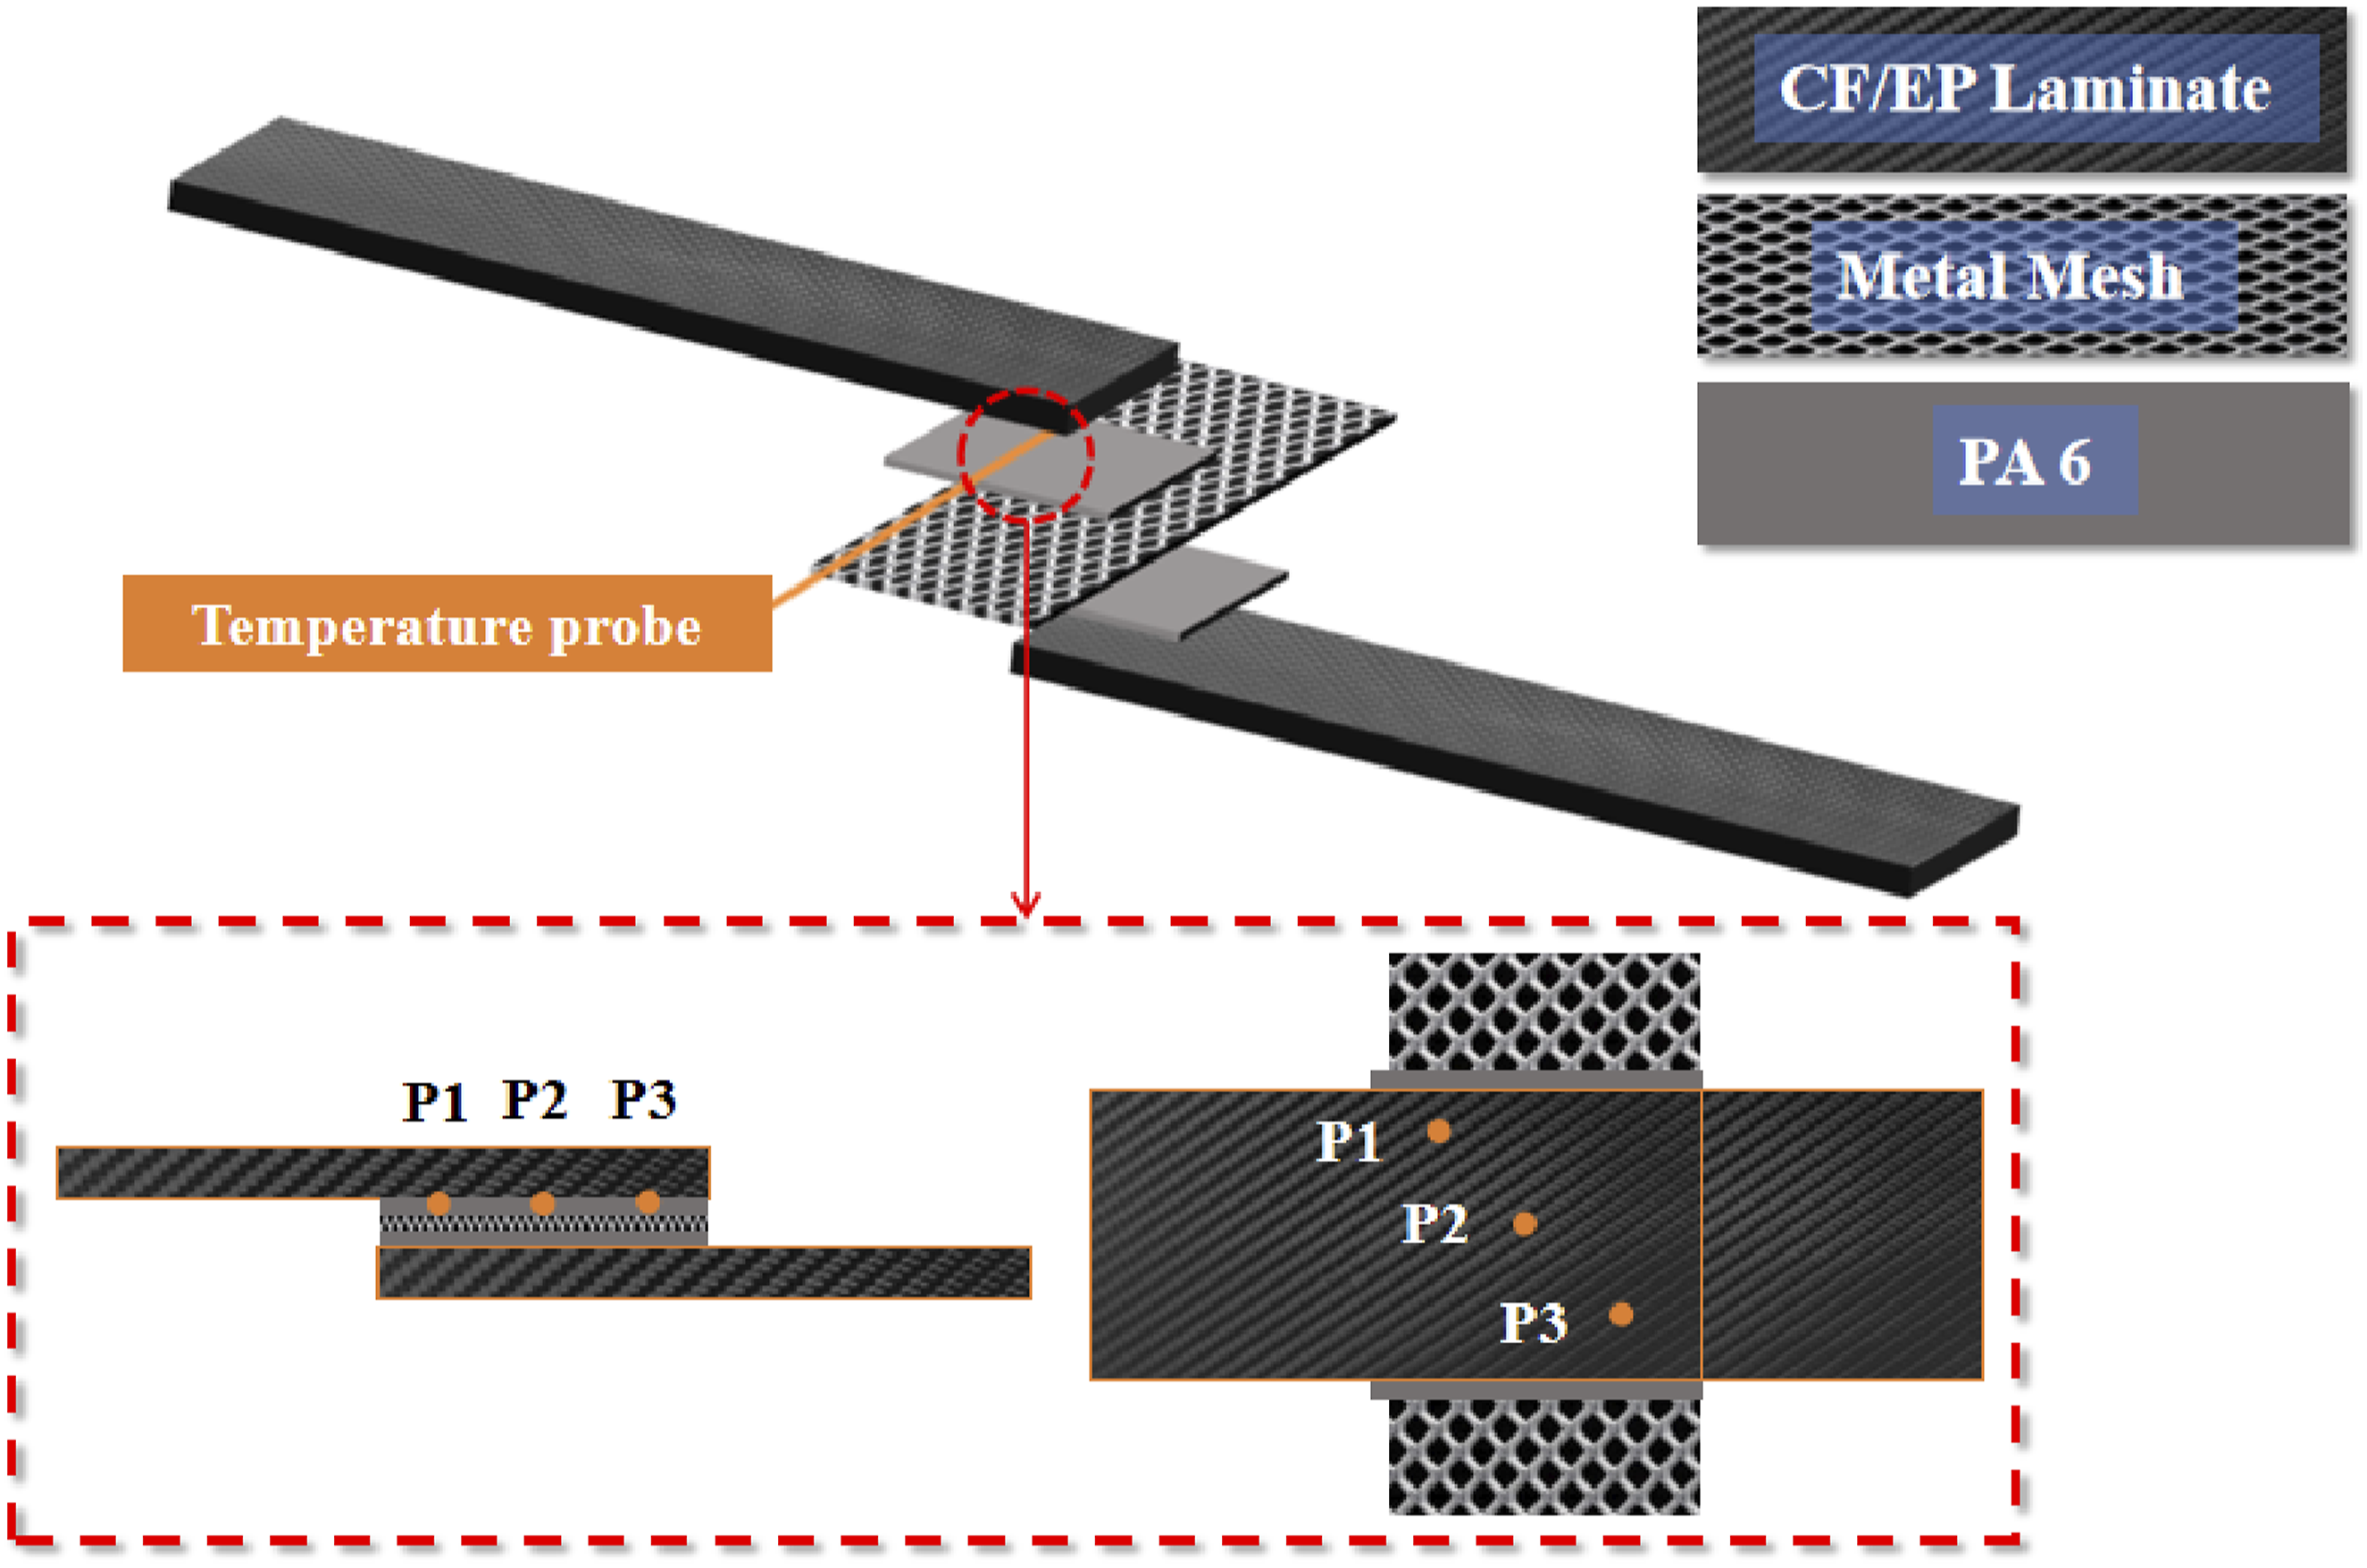
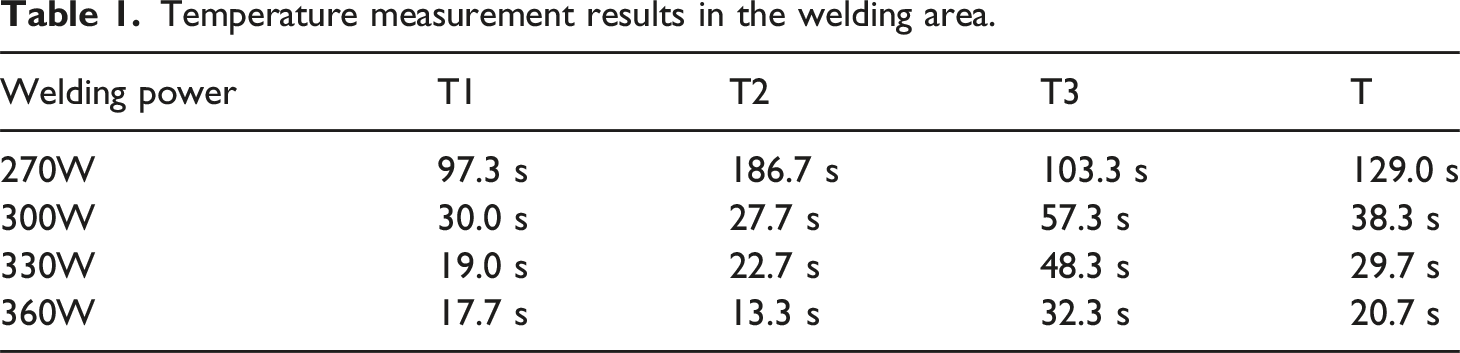
In Table 1, where T1 denotes time for point 1 to reach 220°C, T2 denotes Time for point 2 to reach 220°C, T3 denotes Time for point 3 to reach 220°C. T denotes average time to reach 220°C in the welding area.
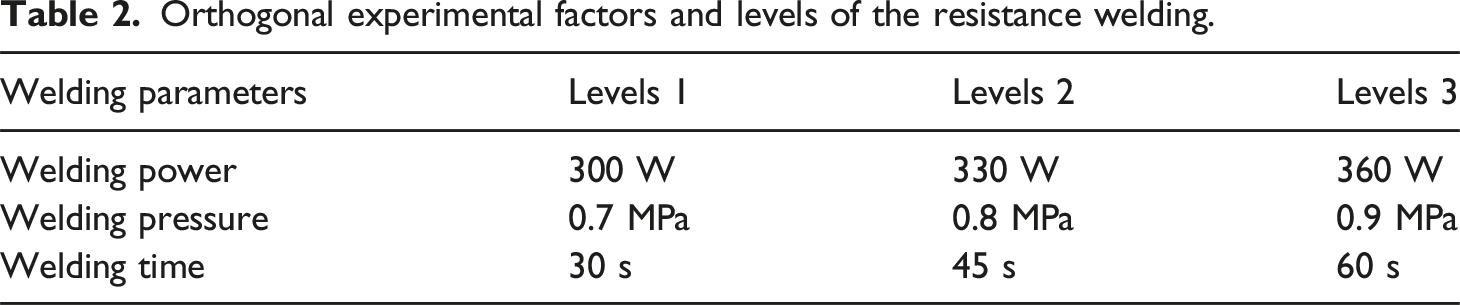
Orthogonal experimental factors and levels of the resistance welding.
It is worth mentioning that, as can be seen from the temperature measurements in Table 2, when the welding power is 270W, the time required for the welded area to reach 220°C is significantly longer than for the other welding powers. In general, for the heat generation of the metal mesh itself, as long as the input electric power increases, the heat power generated by the metal mesh increases accordingly, and this increase tends to be approximately linear (the electrical resistance of the metal tends to increase with increasing temperature, but this increase is not significant 34 ). However, for this study, the heat in the welded area is not directly equal to the heat generation of the metal mesh, but equal to the degree of heat contribution of the heat generation of the metal mesh to the entire welded area i.e., the heat in the welded area should be equal to the heat generation of the metal mesh minus the amount of heat loss that diffuses into the environment.
When the welding power is low, most of the heat loss from the metal mesh is caused by convection or heat conduction, which tends to be relatively small. Therefore when the welding power is increased from 270 W to 300 W, this results in a rapid increase in heat in the welded area. However, when the welding power reaches a certain level, a large amount of heat is generated in the metal mesh, causing a rapid increase in heat throughout the welded area, resulting in a conversion of heat loss from the metal mesh from being lost primarily by convection and conduction to being lost through radiative cooling, which tends to be much greater than the heat lost by convection or conduction. 35 This is based on Stephen Boltzmann’s law, 36 which concludes that the amount of heat lost by radiation from a material is proportional to the fourth power of the absolute temperature of the surface of the material. Therefore, even if the electrical power input to the metal mesh continues to increase, the metal mesh, while continuing to increase its heat generation, is dissipating more heat to the environment, i.e., the efficiency of the heat transfer from the metal mesh to the weld area decreases. This results in a very insignificant change in heat generation in the welded area when welding power is increased from 300 W upwards compared to 270 W upwards, and also results in an abnormally long time for the welded area to reach 220°C at 270 W from the temperature measurement results.
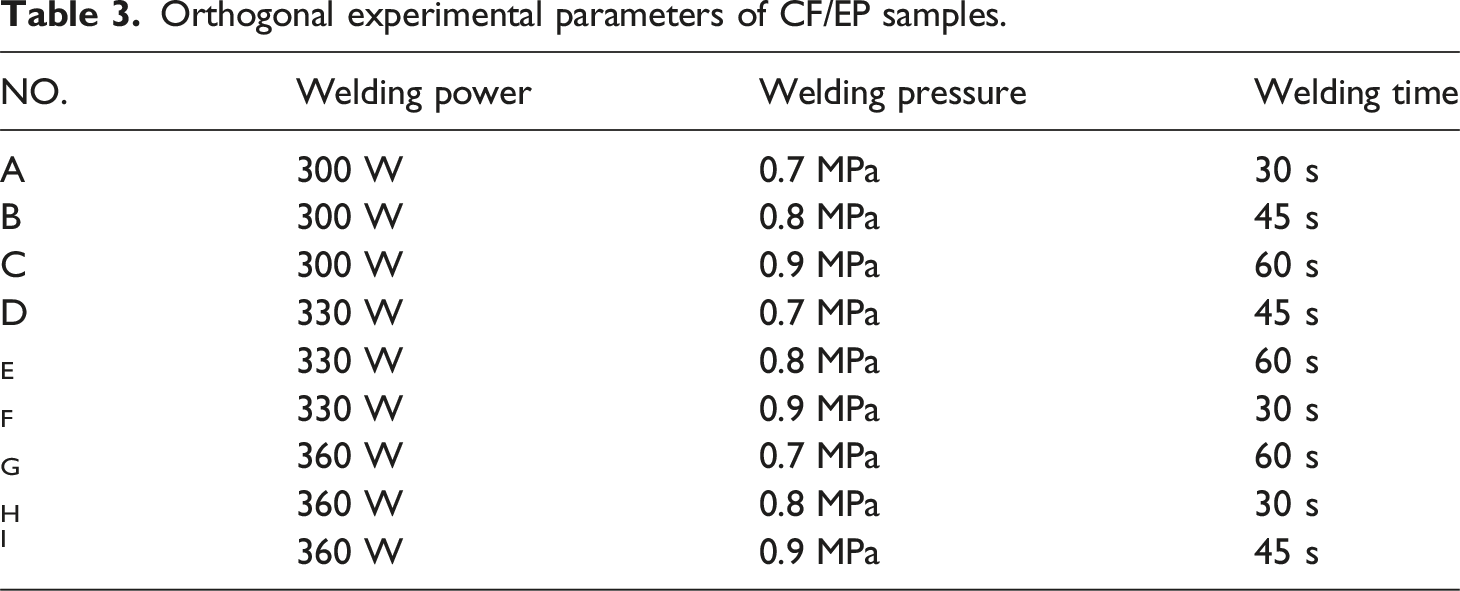
Orthogonal experimental parameters of CF/EP samples.
The individual LSS of CF/EP resistance-welded joints is a quality indicator that can be expressed by equation (2); the larger its value,
40
the better the quality, so the signal-to-noise ratio is used to larger-the-better formula.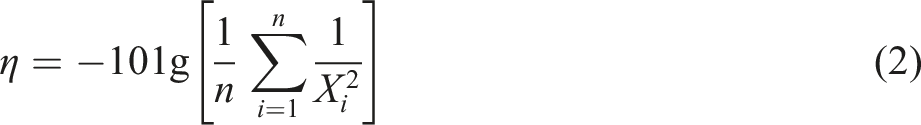
According to equation (3), the average signal-to-noise ratio value of each factor can be calculated to predict the optimal combination of CF/EP resistance welding parameters. Where f denotes the factor, i denotes the level, N denotes the number of experiments, and η denotes the signal-to-noise ratio. 
By calculating and taking the maximum value as the main effect of the parameter, the main effect Figure 4 of the CF/EP resistance welding parameters was obtained. According to Figure 4, the main effect level of each parameter was obtained. From Figure 4, it can be seen that the resistance welding single LSS of the CF/EP exhibited a trend of increasing first and then decreasing with increasing welding pressure and power, while a monotonically decreasing trend was observed with the increase of the welding time. This suggests that the optimal resistance welding parameters should be: welding pressure 0.8 MPa, welding power 330 W, and welding time 30 s. This is because these parameters correspond to the maximum signal-to-noise ratios for each factor, respectively. As a result, the LSS value of the CF/EP welding joint obtained by resistance welding using the optimal resistance welding parameters was 8.16 ± 0.85 MPa. Main effect diagram of single lap shear strength of CF/EP welded joints.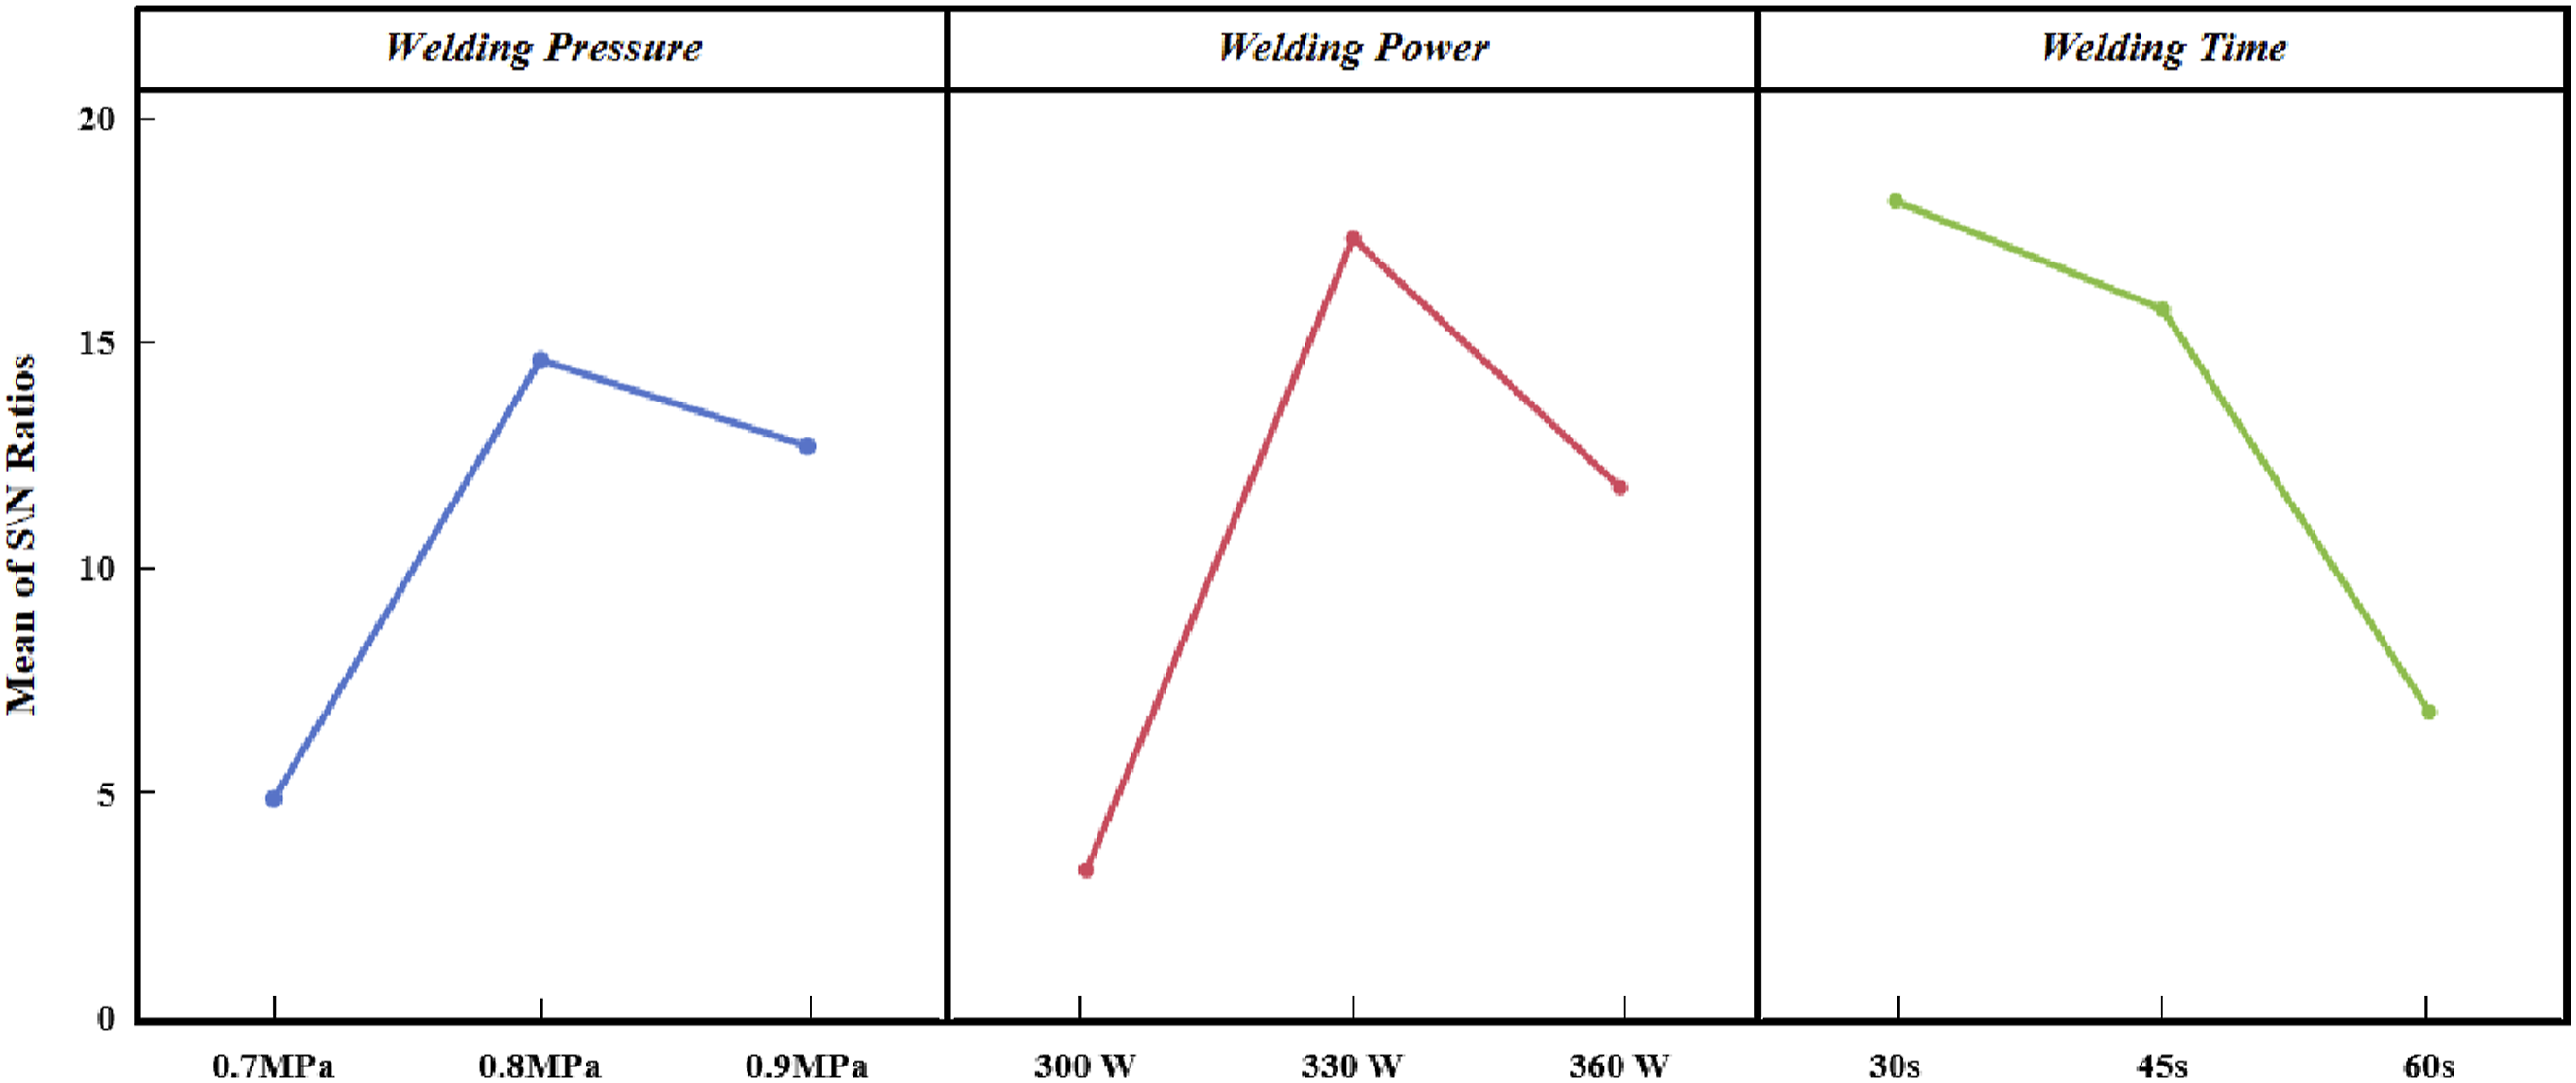
Acid-etching surface treatment and characterization of mechanical property of treated welded joint
In order to realize Acid-etching surface treatment in specific surface areas, an Acid-etching method was designed for the laminates: A 25.4 mm × 25.4 mm area was reserved as the etching area at one end of a standard-size laminate, and a 30 mm wide, 0.6 mm thick PTFE tape was placed to cover the rest of the laminate. An acid corrosion-resistant pipette was used to drop 0.5 mL of 98% concentrated sulfuric acid into the etching area. The excess acid is gently scraped off with a Teflon spatula and the sample is placed in an oven at a certain temperature for 30 minutes to control the degree of etching. Use four different ovens and set their temperatures to 25°C, 50°C, 75°C and 100°C. The degree of etching was adjusted by placing the sample with acid into these different temperature ovens for 30 min. After etching, the samples were removed from the oven, the PTFE tapes were removed, and the etching area was rinsed with a slow water stream for 30 s to dilute residual acid. Baking soda (NaHCO3) at 10% concentration was prepared as a neutralizing solution, and the samples were immersed to completely remove residual acid. During neutralization, the samples were removed every 1 min to test the pH of the etched area using pH paper until neutrality. The fully neutralized samples were rinsed with purified water and dried in an oven for 30 min. Finally, a set of etched laminate samples with fixed etching time and variable temperature (hereafter referred to as the Temperature-variable experimental groups) was obtained. The Acid-etching method is shown in Figure 5(a). Acid-etching treatment of CF/EP laminates. (a) Acid-etching method. (b) Surface morphology of laminates for temperature-variable groups. (c) Surface morphology of laminates for time-variable groups. (d) LSS for temperature- variable groups. (e) Percentage of increase in LSS for temperature-variable groups. (f) LSS for time-variable groups. (g) Percentage of increase in LSS for time-variable groups.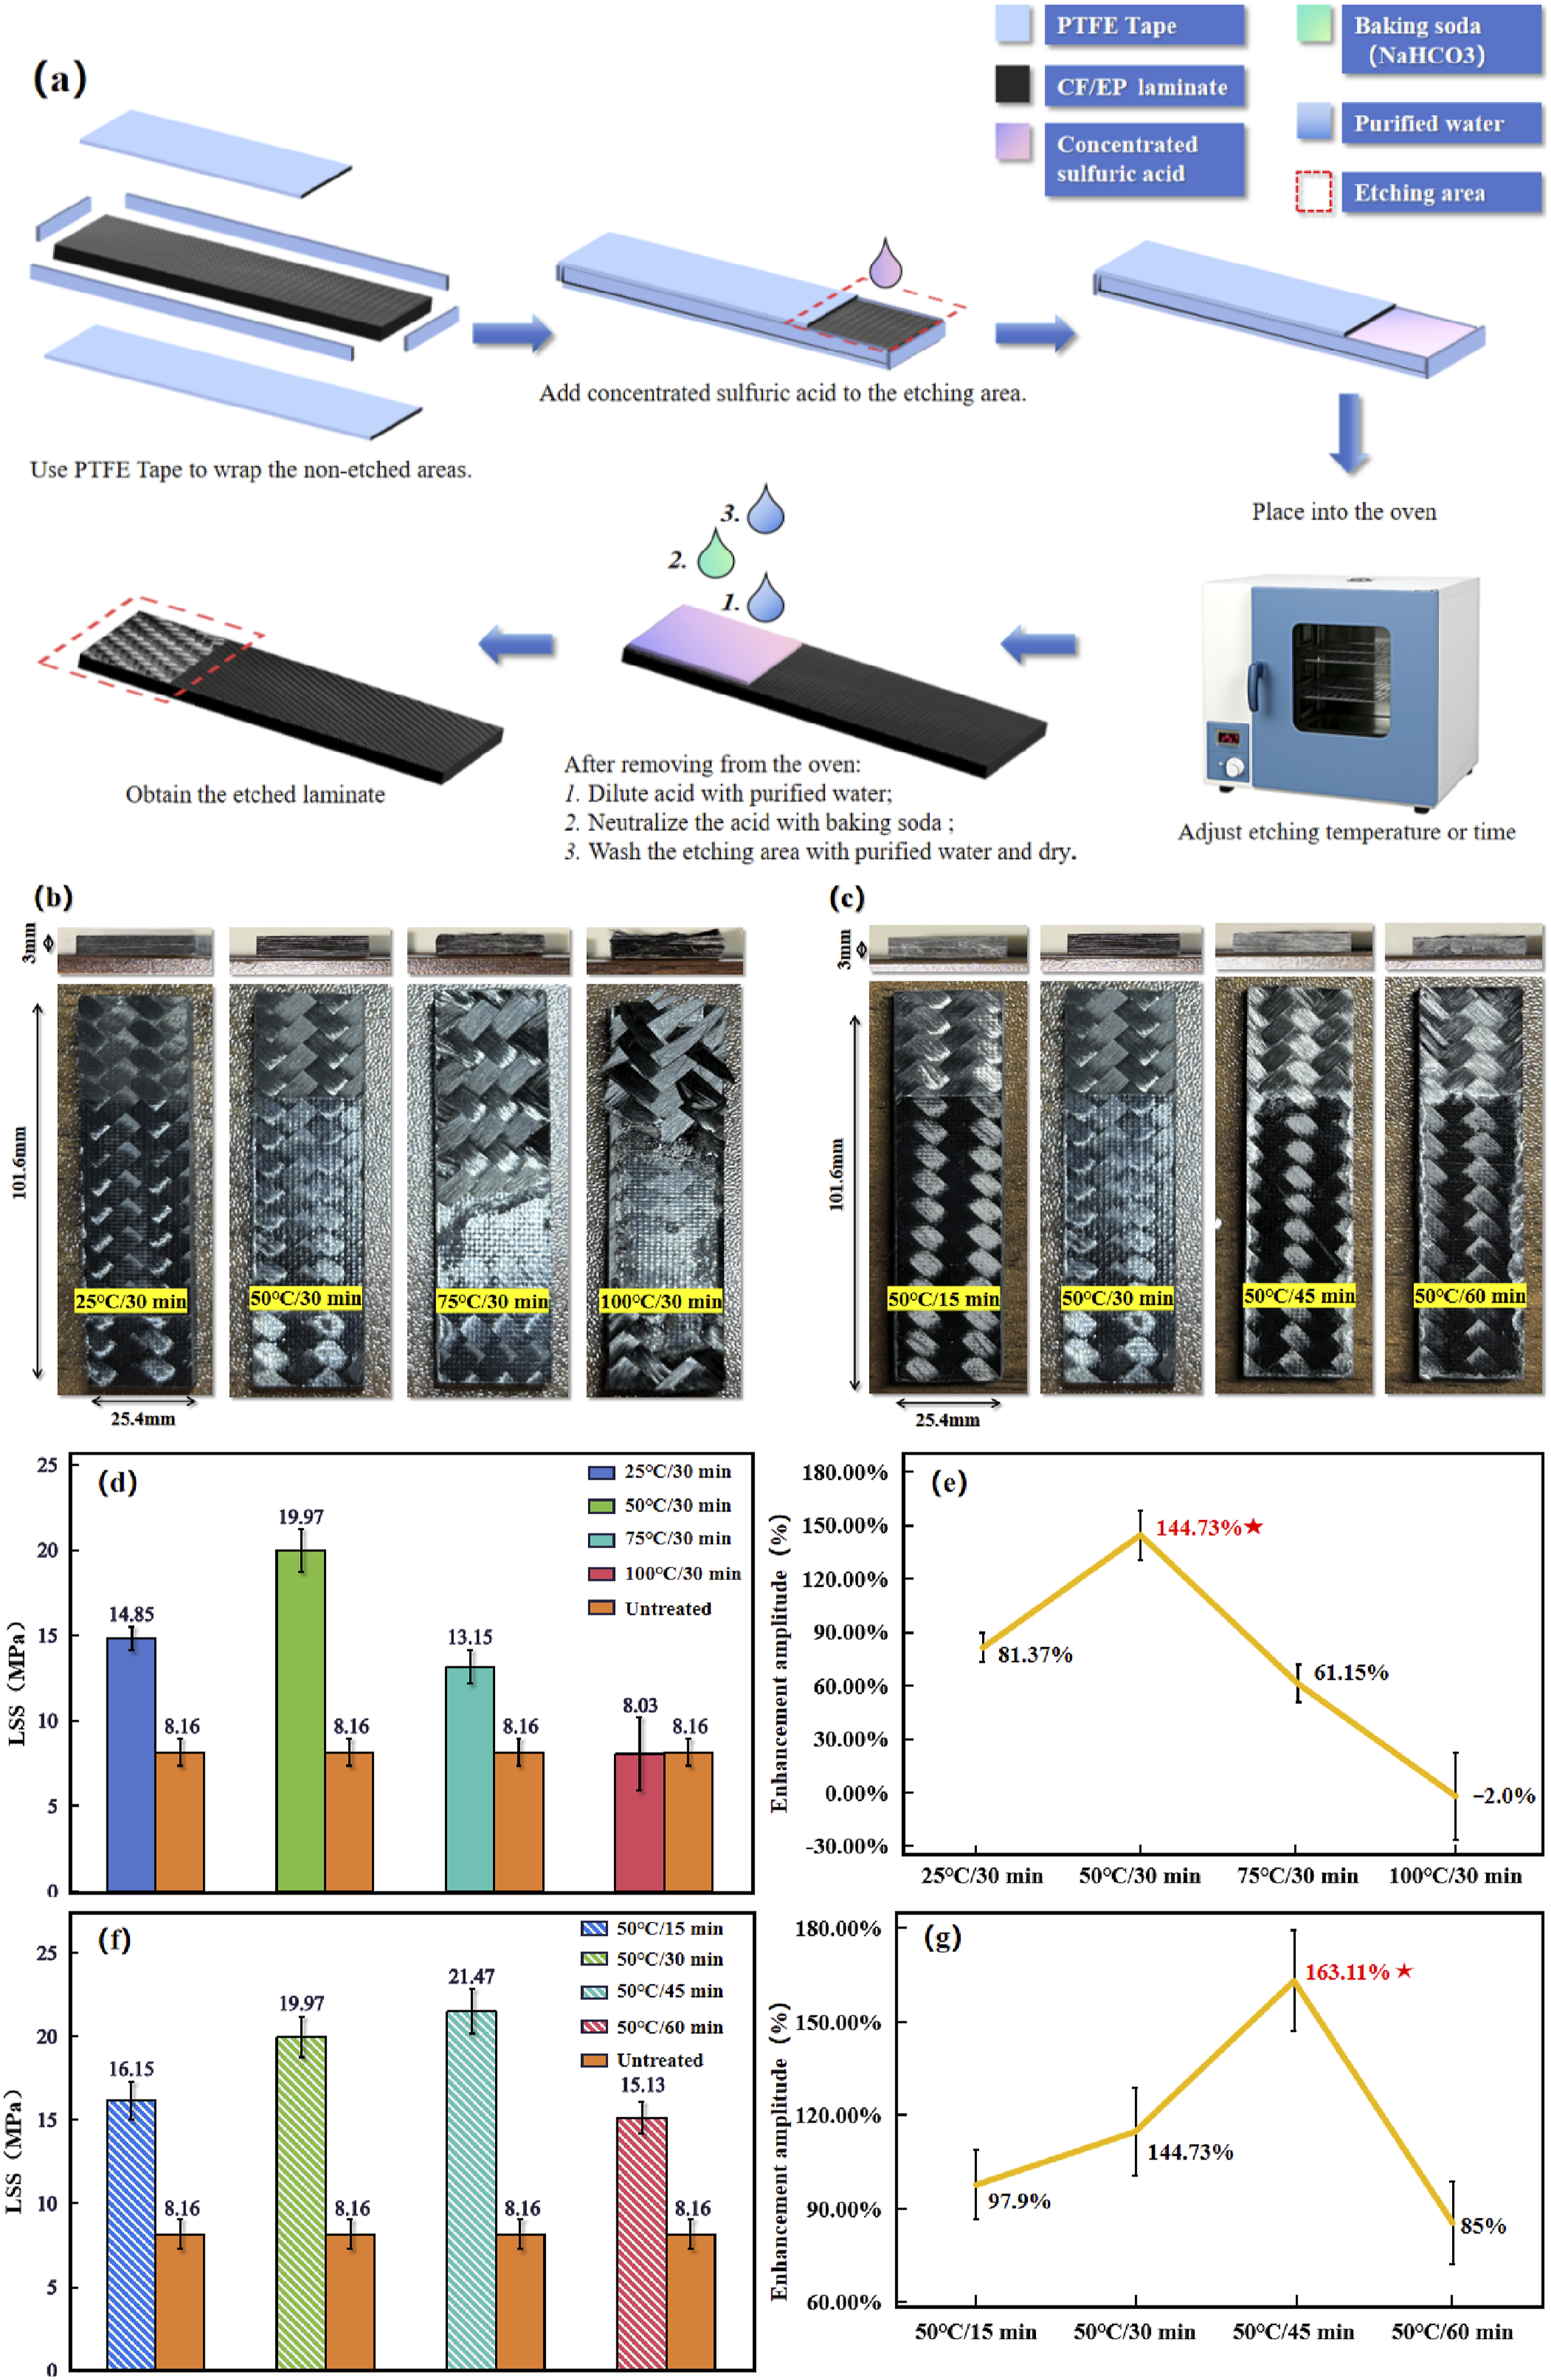
It is necessary to emphasise here that why we first study the effect of etching temperature on the etching effect under the premise of constant etching time. According to the Arrhenius equation,
41
the relationship between the rate constant K and the temperature T of a chemical reaction is:
From equation (4), it can be seen that for the same chemical reaction, the chemical reaction rate K is an exponential function of the temperature T. This means that chemical reaction rates are very sensitive to changes in chemical reaction temperatures. Therefore, the reaction temperature will have a direct effect on the reaction rate and have a significant impact on the chemical reaction. Meanwhile, the effect of reaction time (t) on the chemical reaction is linear because there is no parameter of reaction time (t) in the Arrhenius equation, which indicates that the change of reaction time does not affect the rate of the chemical reaction, but rather the degree of completeness of the chemical reaction, which suggests that the effect of reaction time on the reaction is linear and relatively mild.
Therefore, when etching CF/EP surface with concentrated Acid-etching, the effect of etching temperature on etching rate is faster, and the effect of different etching temperatures on etching effect can be found quickly, that is, the etching effect can be quickly adjusted by the adjustment of etching temperature. And the effect of etching time on etching rate is gentle, so in the case of fixed etching temperature, the etching effect can be fine-tuned by adjusting the etching time, and finally find the most suitable Acid-etching parameters for the conditions of this study.
Therefore, in this study, we decided to control the etching time first and find out the optimum etching temperature on the basis of this, and then the final optimum etching parameter combination was derived by adjusting the etching time under the premise of determining the optimum etching temperature.
Firstly, we investigate what is the optimum etching temperature that gives the best LSS value for CF/EP single lap joints for a fixed etching time of 30 min.
As observed in Figure 5(b), for the Temperature-variable groups, the etched area remained within the target 25.4 mm × 25.4 mm at lower temperatures (e.g., 25°C). However, at 75°C and above, the etched area expanded beyond the target region due to accelerated acid activity and PTFE tape deformation under heat, allowing the concentrated sulfuric acid seepage.
By etching the laminate surface with concentrated sulfuric acid at 25°C for 30 min (hereafter referred to as 25°C/30 min), the epoxy was partially removed from the etched area, but fiber clarity was low. Acid-etching at 50°C for 30 min (hereinafter referred to as 50°C/30 min) resulted in a stable fiber structure in the surface layer and improved fiber clarity compared to the previous groups. Acid-etching at 75°C for 30 min (hereinafter referred to as 75°C/30 min), the fiber clarity in the etched area was further improved, but the fibers at the edges showed loosening and visible burrs. Acid-etching at 100°C for 30 min (hereinafter referred to as 100°C/30 min) caused structural damage to the surface fibers, characterized by mutual debonding and abnormally loose bare fibers, indicating the delamination damage of the laminate.
Resistance welding of the samples with etching temperature as a variable at the optimal resistance welding parameters (Welding Power: 330 W, Welding Time: 30 sec, Welding Pressure: 0.8 MPa) yielded different weldments. The LSS of these weldments were tested using an electronic universal test system.
As shown in Figure 5(d) and (e), the LSS data plots demonstrate the performance of welded joints under different Acid-etching parameters, along with the corresponding percentage increases. As can be seen from Figure 5(d) and (e), for the Temperature-variable groups, the best welded joint LSS values were obtained at etching conditions of 50°C/30 min, yielding an LSS of 19.97 ± 1.03 MPa—an increase of 144.73% ± 13% compared to untreated parts.
Since the effect of concentrated sulfuric Acid-etching on the surface of CF/EP laminates is not only related to the etching temperature, but also related to the etching time. Therefore, in order to explore the effect of etching time on Acid-etching, four ovens were also set up, and their etching temperatures were fixed at 50°C, but their heating times were adjusted to 15 min, 30 min, 45 min and 60 min. In order to prevent other variables from affecting the experimental results, the rest of the experimental steps and experimental details were kept unchanged inline with those of the Temperature-variable experimental group. Finally, the etched laminate samples with fixed etching temperature and variable etching time (hereinafter referred to as the Time variable experimental group) were obtained, as shown in Figure 5(c).
From Figure 5(c), further extension of the etching time did not lead to the expansion of the etched area when the etching temperature was fixed at 50°C. Only when the etching time was elevated to 45 min and above, the etched area expanded to some areas along the edge of the laminate. As can be seen from the previous section, the effect of chemical reaction time on the chemical reaction effect tends to be linear,. Therefore, the acid seepage phenomenon and the warping effect of the PTFE tape are relatively mild during the longer etching process.
Further observations showed that when the laminate surface was acid etched at 50°C for 15 minutes (hereinafter referred to as 50°C/15 minutes), the fiber definition in the etched area was low and a partial distribution of epoxy resin was still visible on the fibers. When the laminate surface was acid etched at 50°C for 45 minutes (hereinafter referred to as 50°C/45 minutes), the clarity of the etched fibers improved and a white powder covering of the surface could be observed. When the laminate surface was acid etched at 50°C for 60 minutes (hereinafter referred to as 50°C/60 minutes), the white coverage of the etched areas became faded and some of the fiber edges showed bumps and burrs.
Resistance welding of the samples with etching time as a variable at the optimal resistance welding parameters (Welding Power: 330 W, Welding Time: 30 s, Welding Pressure: 0.8 MPa) yielded different weldments. The LSS of these weldments were tested using an electronic universal test system. As can be seen from Figure 5(f) and (g), when the etching temperature is fixed at 50°C, the optimum etching time is 45 min, and the average LSS value of CF/EP resistance welded joints obtained is 21.47 ± 1.2 MPa, with an increase of 7.5% ± 0.11% compared to the samples after 50°C/30 min Acid-etching treatment and an increase of 161% ± 14% compared to the untreated parts.
In summary, the optimum Acid-etching parameter for CF/EP surface treatment in this research is 50°C/45 min. The obtained LSS of the welded joints of the treated laminate was 21.47 ± 1.21 MPa, which increased by 163.11% ± 14% compared to the untreated parts.
Effect of acid-etching on the physical properties of laminate surfaces
Temperature-variable experimental groups micro morphology and roughness analysis
The CF/EP samples were cut into 10 mm × 10 mm × 3 mm blocks using a miniature table saw. Acid- etching surface treatments with controlled etching time and adjusted etching temperature were performed as previously described to obtain block samples for the Temperature- variable experimental group. The etched surface morphology was observed by FE-SEM with a magnification of 40 μm, and the results and the corresponding etching mechanism are shown in Figure 6. FE-SEM observation of Acid-etching effect (Temperature-variable experimental groups). (a) Untreated sample. (b) 25°C/30 min-treated sample. (c) 50°C/30 min-treated sample. (d) 75°C/30 min-treated sample. (e) 100°C/30 min-treated sample and (f) Mechanism diagram of Acid-etching action.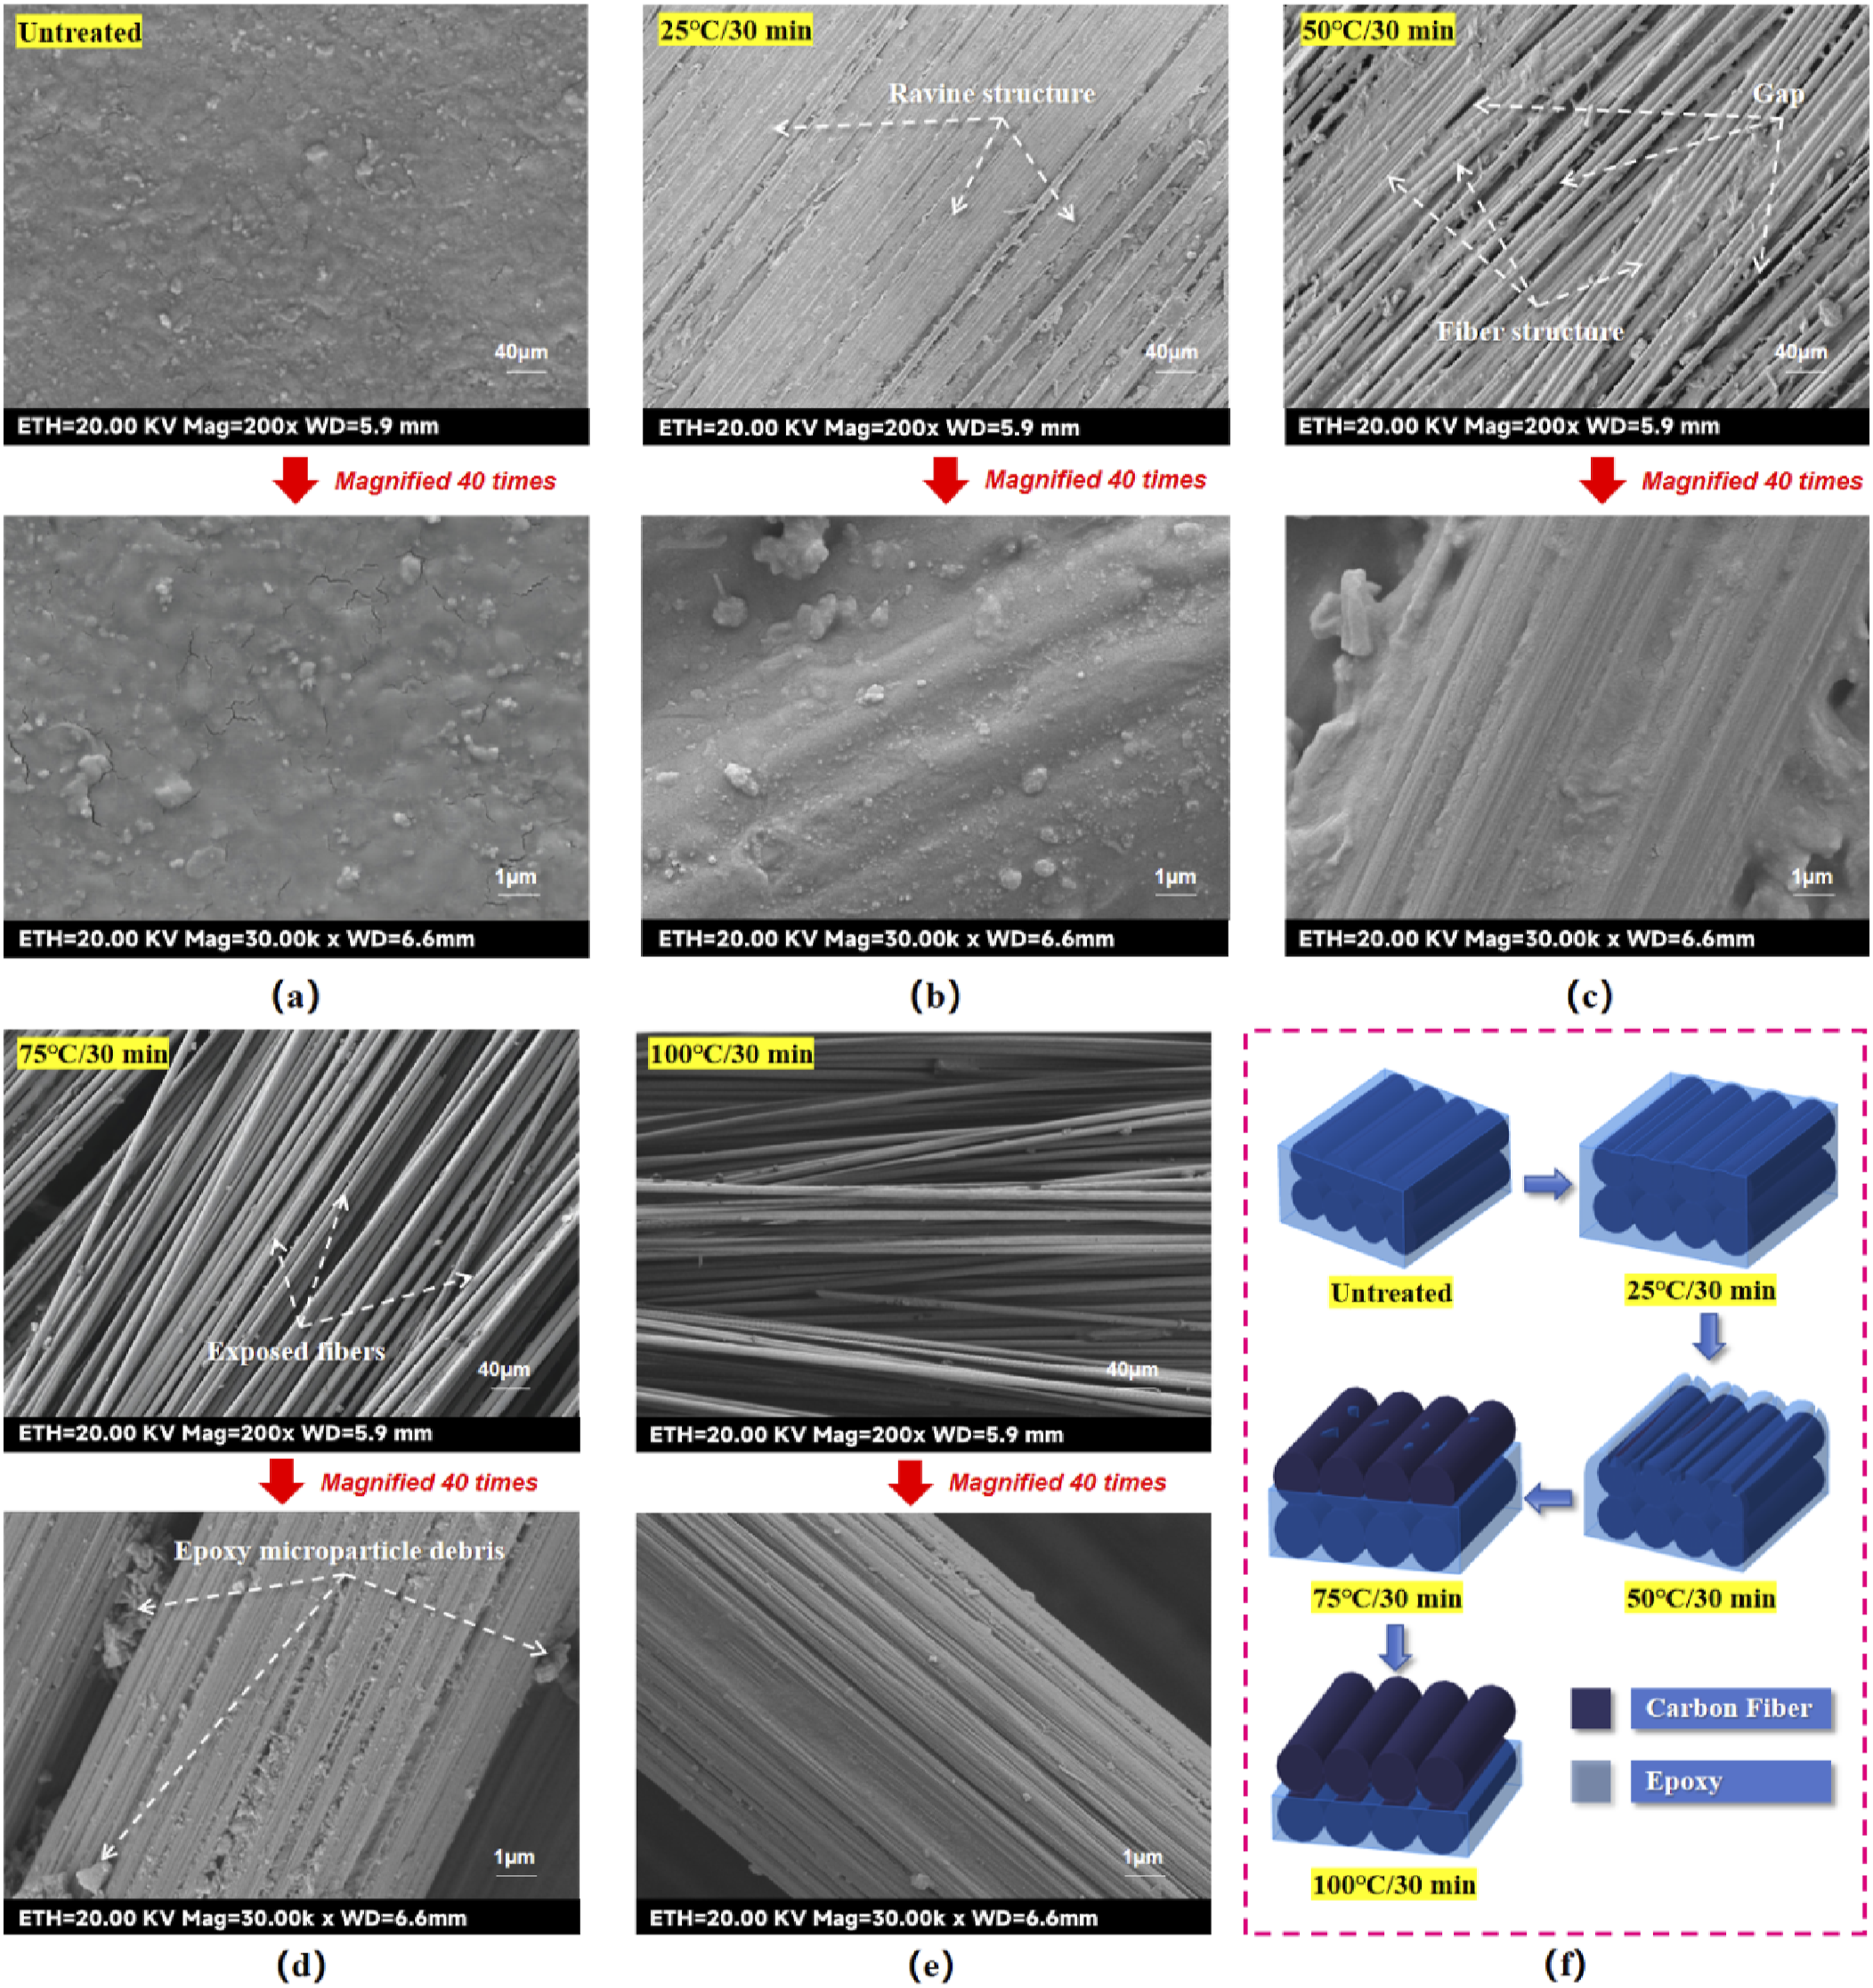
For the Temperature-variable experimental groups samples, when the etching condition is 25°C/30 min, as seen in Figure 6(b), part of the epoxy resin on the laminate surface is removed by the etching of concentrated sulfuric acid, but the degree of etching is shallow, the groove structure of the laminate surface is not obvious, the roughness is low, and there are fewer anchorage sites available for the bonding of the molten PA6. When the etching condition is 50°C/30 min, as seen in Figure 6(c), with the increase of the etching temperature, the groove structure of the laminate surface is deepened, the surface roughness is increased, and the fiber structure is clearly visible, which provides more anchoring and bonding sites for the molten PA6, and may also improve the wettability of the surface. When the etching condition is 75°C/30 min, as seen in Figure 6(d), with the further increase of the etching temperature, the surface epoxy resin of the laminate is almost completely removed and the surface fibers are exposed. Observation of the fiber single bundle morphology shows that only some tiny epoxy resin debris remains on the surface fibers, which leads to a decrease in the surface roughness of the laminate. However, thanks to the sparse surface structure of the laminate at this time, its surface wettability may be improved. 42 When the etching condition is 100°C/30 min, as seen in Figure 6(e), the surface fibers are not only separated in-plane, but also bulged and stabbed out in the vertical direction. From the observation of the morphology of single fibers, it can be seen that the surface fibers have almost no visible epoxy residue, which can be regarded as a pure fiber. Obviously, this is caused by the excessively fast chemical reaction rate. On the one hand, due to the accelerated etching effect of the acid, the surface epoxy layer was removed by wider and deeper etching, resulting in the removal of the epoxy debris remaining on the surface fibers as well, making the surface fibers appear excessively smooth. On the other hand, as the etching effect of the acid in the surface reaches saturation prematurely, it penetrates into the deeper structure of the laminate to further etch the epoxy structure of the lower layer, which directly leads to the delamination defects of the laminate and the vertical bulging of the surface fibers. It is worth mentioning that since the laminate at this point is not only sparsely structured in the surface layer, but also the upper and lower layers are separated from each other, it is favorable for the liquid to spread out and penetrate downwardly within the layer, and it is likely to further enhance the surface wettability of the laminate surface.
In summary, it is obvious that under the premise of fixed etching time, the increase of etching temperature can greatly accelerate the Acid-etching reaction rate and remove more epoxy resin in a deeper and wider range. The reaction mechanism of chemically etching the laminate surface is shown in Figure 6(f), from which it can be seen that the Acid- etching rate changes rapidly with the increase of the etching temperature, resulting in a large gap between the surface micro-morphology and roughness of the laminates surface that treated with different Acid-etching temperatures at a fixed etching time.
Time-variable experimental groups micro morphology and roughness analysis
The CF/EP samples were cut into 10 mm × 10 mm × 3 mm blocks using a miniature table saw. Acid-etching surface treatments with controlled etching temperature and adjusted etching time were performed as previously described to obtain block samples for the Time-variable experimental group. The etched surface morphology was observed by FE- SEM with a magnification of 40 μm, and the results and the corresponding etching mechanism are shown in Figure 7. FE-SEM observation of Acid-etching effect (time-variable experimental groups). (a) Untreated sample. (b) 50°C/15 min-treated sample. (c) 50°C/30 min-treated sample. (d) 50°C/45 min-treated sample. (e) 50°C/60 min-treated sample and (f) Mechanism diagram of acid-etching action.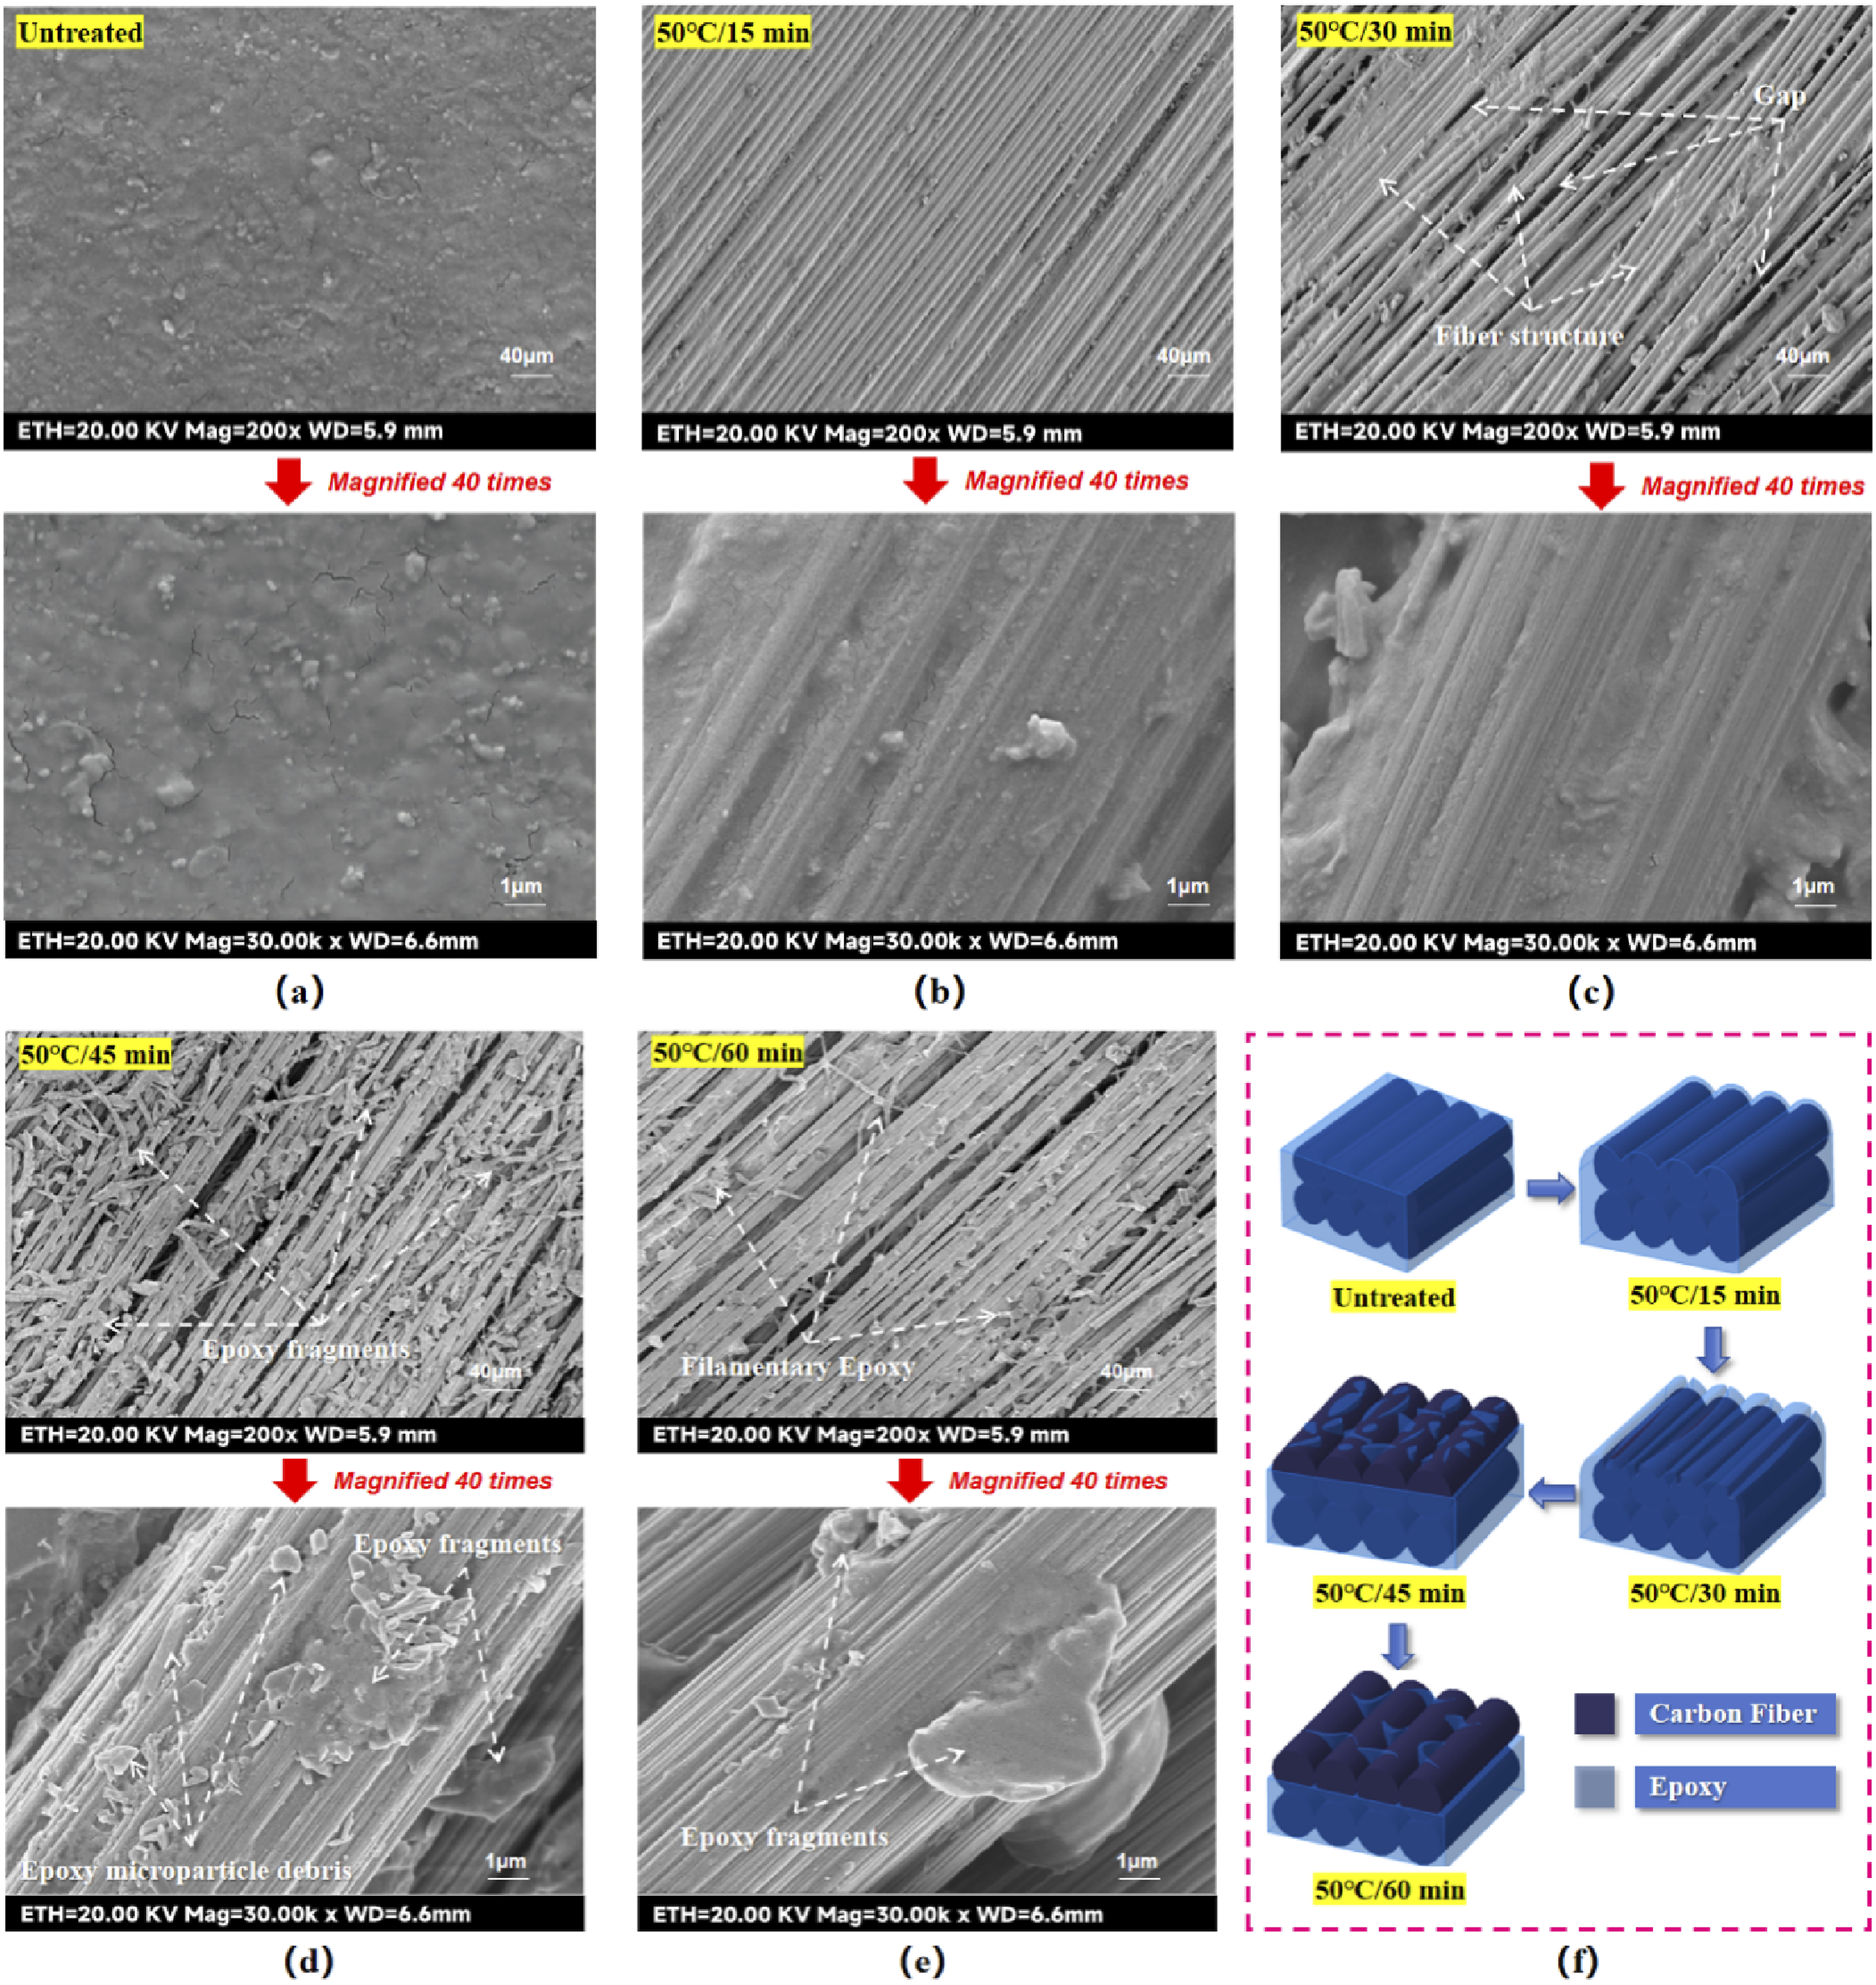
For the Time-variable experimental groups, when the etching condition was 50°C/15 min, as seen in Figure 7(b), the surface of the laminate showed obvious groove structures due to Acid-etching. Observation of the fiber bundles shows that the fiber clarity at this etching stage is significantly higher than that at 25°C/30 min, which makes the roughness of the laminate surface at this time higher than the 25°C/30 min experimental group. This will not only increase the anchoring and bonding sites of PA6 in the laminate surface, but also may enhance the wettability of the laminate surface. The microscopic morphology of the laminate surface when the etching condition is 50°C/30 min has been described in the previous section, so it will not be repeated. When the etching condition is 50°C/45 min, the epoxy resin on the surface of the fiber bundles and between the bundles is fractured and detached by further etching, forming a large number of large-grained debris, as seen in Figure 7(d). From a macroscopic point of view, these large particles are dispersed over the entire laminate surface, which explains why, in the previous section, when the etched area of the laminate was observed with the naked eye, it was found to be covered by a layer of white powder at this etching stage. From a microscopic viewpoint, the epoxy resin on the fiber bundles was etched into large irregularly shaped chips, which further enhanced the roughness of the laminate surface layer, and may also further improve the wettability of the laminate surface layer. When the etching condition was 50°C/60 min, as seen in Figure 7(e), the epoxy resin on the surface fibers was shrunken and thinned due to long-time etching, and became short filamentary or long thread-like epoxy resin entangled in the surface layer of the fiber bundles and the inter-bundle. Observation of the single fiber bundle shows that the epoxy resin on the fiber bundle is further removed by etching at this time, and only some sporadic epoxy particles remain, which makes the surface roughness of the laminate reduced compared with the previous groups. However, thanks to the removal of the residual epoxy resin on the surface layer, the gap between the fiber bundles on the surface layer is enlarged, and the structure is more sparse, which may lead to a better material surface layer wettability compared with the previous groups.
In summary, when the etching temperature is constant, the extension of etching time can enhance the reaction rate of Acid-etching more gently, indicating that the reaction rate of the Acid-etching reaction is more insensitive to the change of etching time,and thus the etching effect can be fine-tuned by adjusting the etching time. The mechanism of the effect of Acid-etching on the surface roughness and microstructure of the laminate with etching time as a variable is shown in Figure 7(f), from which it can be seen that the epoxy removal degree of the laminate surface changes gradually with the extension of etching time.
Surface wettability analysis
In order to verify the conjecture of different etching stages on the wettability of the laminate surface, the CF/EP samples were cut into 10 mm × 10 mm × 3 mm block samples using a miniature table saw. The surface of the laminate was then acid etched according to the treatments and processes described in the previous section and block samples were obtained after treatment. Using deionized water as the liquid to be tested, droplets were placed at two different points on the laminate surface and the average value of the final static contact angle of the droplets was recorded using a Dataphysics OCA- 20 Optical Interface Analyzer and the results are shown in Figure 8. For the same material, the smaller the static contact angle between the surface and deionized water, the better the hydrophilicity of the surface.
43
Surface contact angle of materials after surface treatment with different variable (time-variable and temperature-variable) groups. (a) Surface contact angle of untreated parts. (b) Surface contact angle of temperature-variable experimental groups. (c) Surface contact angle of time-variable experimental groups.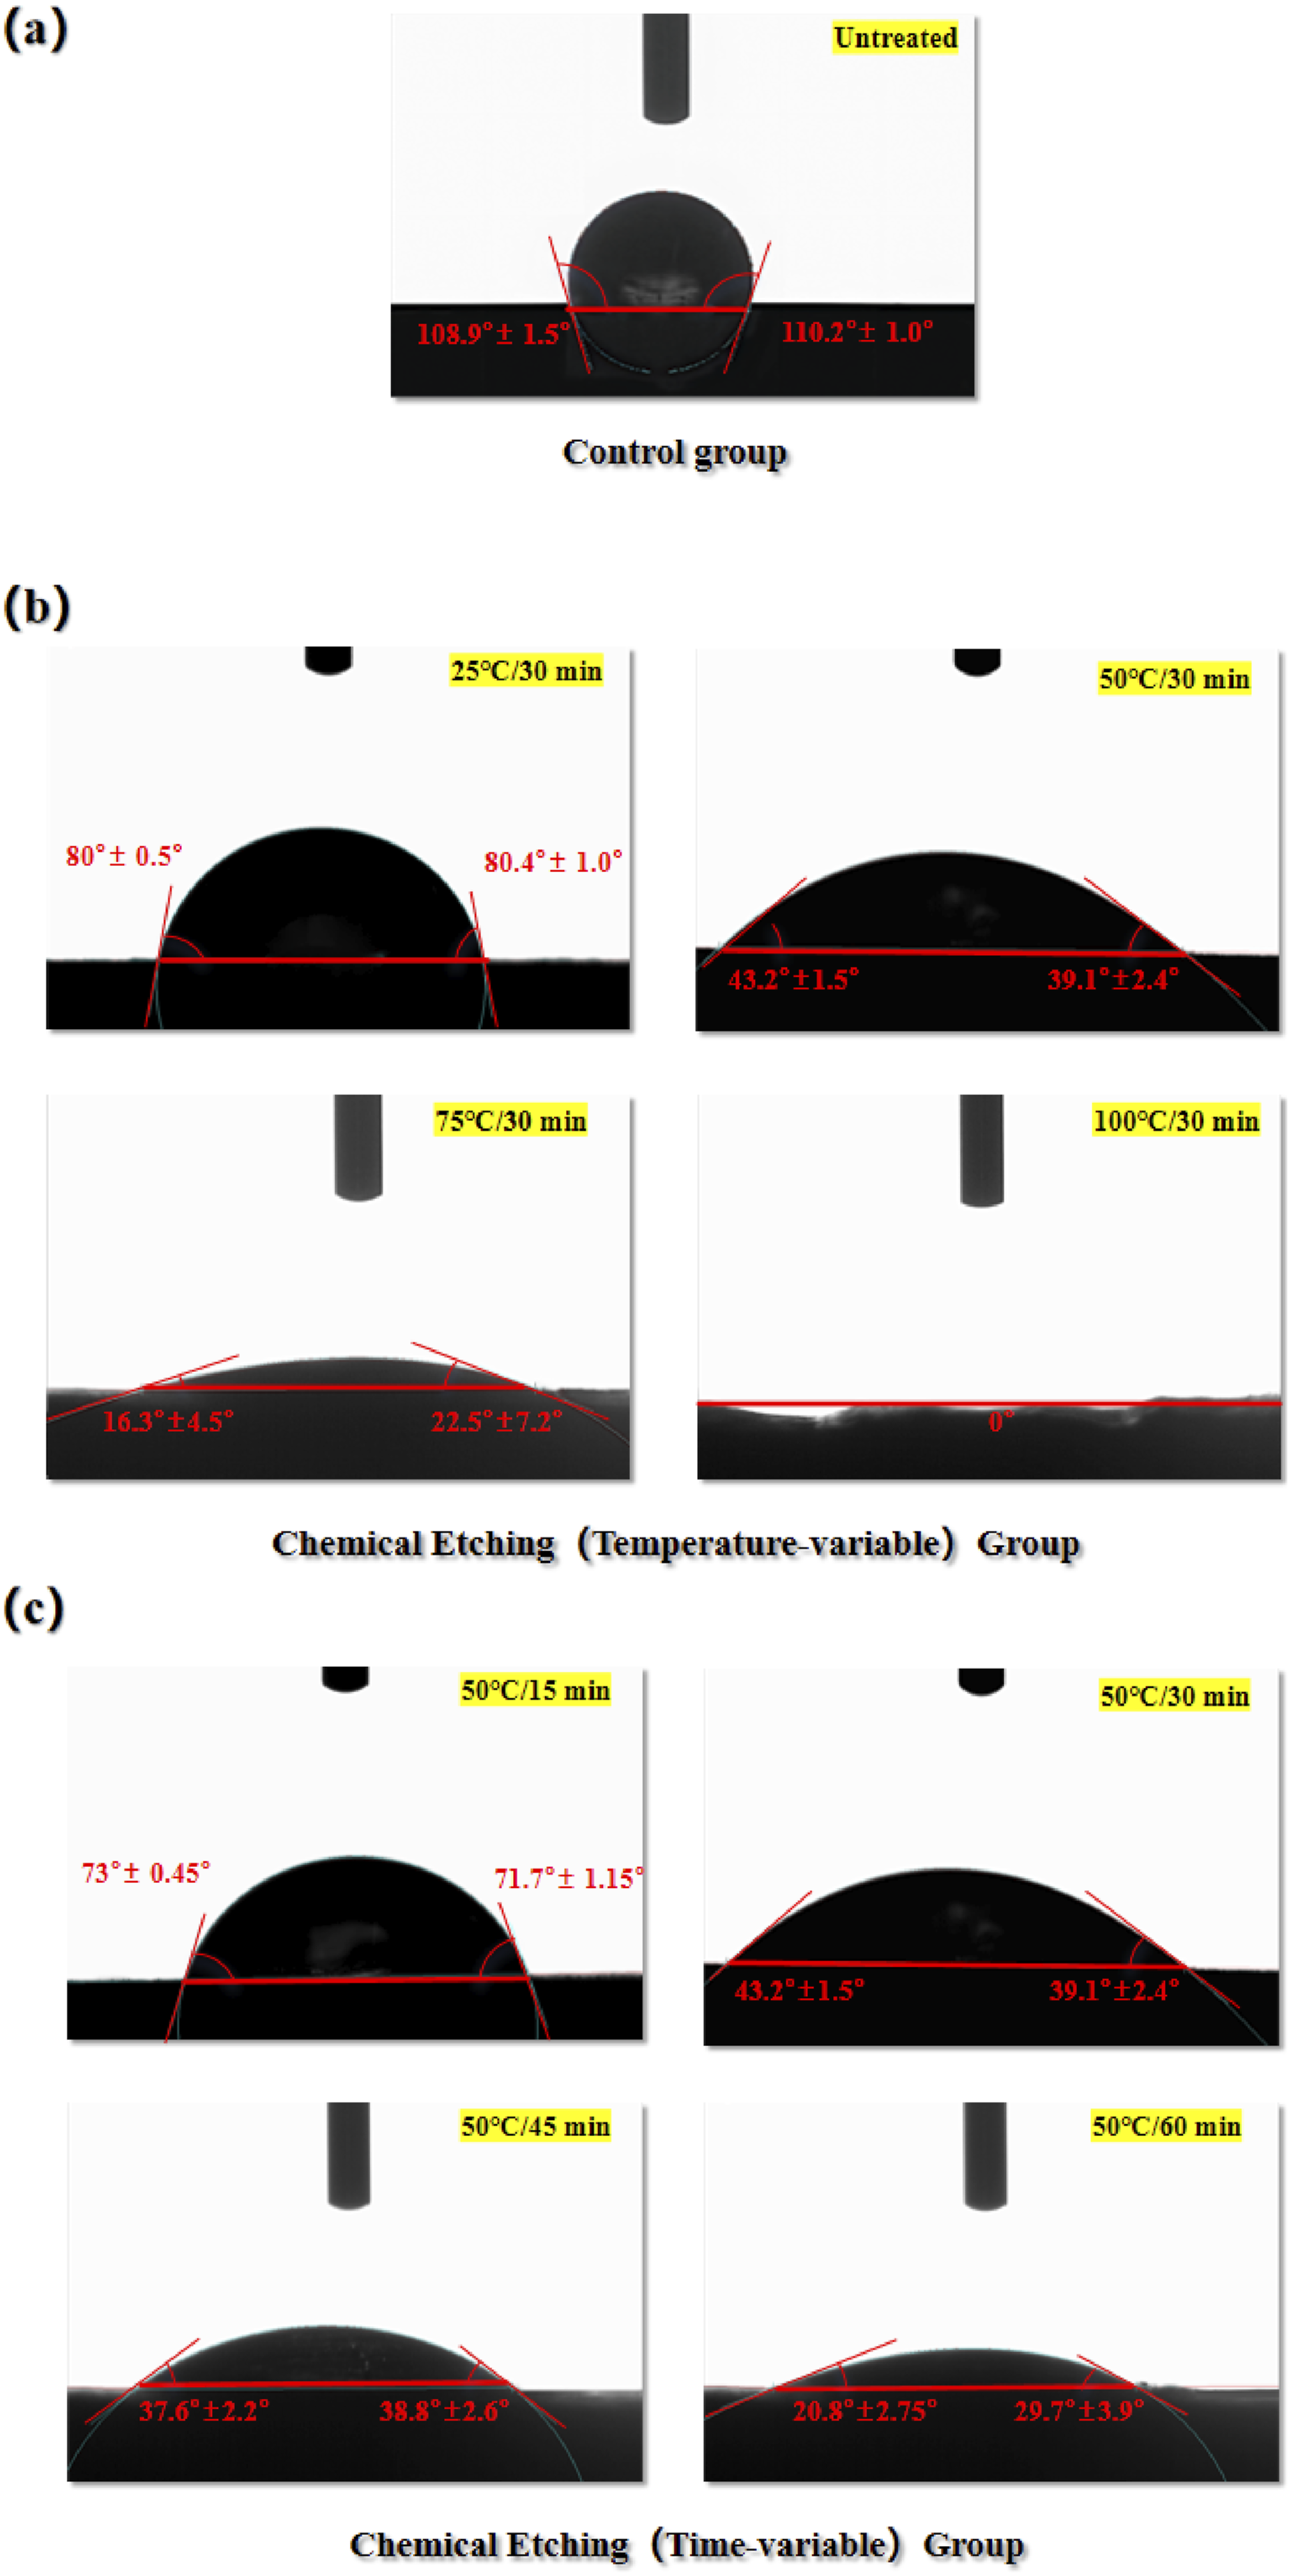
As shown in Figure 8(a), for the untreated laminate surface, the average static contact angle of deionized water droplets on it is 109.55° ± 1.25°, indicating that the laminate surface is a typical hydrophobic surface at this point. For the experimental group with variable temperature, as shown in Figure 8(b), after the surface Acid-etching treatment, the average contact angle on the laminate surface decreases rapidly as the etching temperature increases. This indicates that the hydrophilicity of the laminate surface increases rapidly with increasing etching temperature at a fixed etching time. As can be seen in Figure 8(b), after surface treatment, the average contact angle of the Temperature- variable experimental group decreased to θ25 C/30min = 81° ± 2.9°; θ50 C/30min = 44.15° ± 3.95°; θ75 C/30min = 19.4° ± 5.85°; and θ100 C/30min = 0°, respectively. Based on the relationship between the static contact angle and the hydrophilicity of a material, a material surface can be called superhydrophilic if a water droplet does not stabilize on the surface after contacting it, but spreads rapidly so that the final static contact angle is close to or reaches 0°. 44 However, this is not possible for real physical surfaces, suggesting that when the etching conditions reached 100°C/30 min, the surface of CF/EP was somehow defective, resulting in the deionized water droplets penetrating the surface of the CF/EP and being absorbed by the laminate. In fact, as shown in the previous section, when the etching condition reaches 100°C/30 min, the surface fibres of CF/EP have been debonded and disordered, and delamination defects appear in the laminate, leaving the surface carbon fibres in a bare state. Excessive Acid-etching leads to a sparse fibre structure on the surface of CF/EP, and due to the delamination and debonding of the surface fibres of CF/EP, it is known that the structure below the surface must have appeared different degrees of pores or debonding defects, which makes the constraints of CF/EP on its surface structure disappear. At this time, although the carbon fibre is a typical hydrophobic material, but thanks to the loose fibre arrangement on the surface at this time, the deionized water can easily penetrate through the surface layer of CF/EP and diffuse into the interior of CF/EP, which is ultimately absorbed by CF/EP, making the static contact angle on the surface of the material finally reach 0°.
In summary, the above conclusions confirms the previous conjecture, indicating that the increase in etching temperature rapidly enhances the hydrophilicity of the laminate surface and ultimately leads to complete wetting of the water droplets on the surface.
For the Time-variable experimental group, the trends of the mean static contact angle on the laminate surface after surface etching treatment are similar to those of the Temperature- variable experimental group, both showing a decreasing trend. As can be seen in Figure 8(c), the average contact angle values of the Time-variable experimental group decreased to θ50 C/15min = 72.35° ± 0.8°; θ50 C/30min = 44.15° ± 3.95°; θ50 C/45min = 38.2° ± 3.55°; θ50 C/60min = 25.25° ± 1.83°, respectively, after the surface etching treatment. This result also verifies the corresponding conjecture in the previous section, indicating that the wettability of the material surface layer improves as the etching time increases. However, it is worth mentioning that the trend of the mean value of the static contact angle of the surface of the material with the increase of etching time shows that the effect of the increase of etching time on the improvement of the wettability of the surface of the laminate is relatively flat under the premise of controlling the etching temperature unchanged, and the mean value of the static contact angle of the surface of the processed laminate decreases by at most about 43% even if the etching time is doubled.
Effect of acid-etching on the surface chemistry of laminates
Surface chemical element content analysis
X-ray Photoelectron Spectroscopy (XPS) is a method of using an electron spectrometer to measure the energy distribution of photoelectrons and electrons emitted from the surface of a sample when irradiated with X-ray photons. The principle of XPS is to irradiate a sample with X-rays, which results in the stimulated emission of electrons or valence electrons from the inner layers of atoms or molecules. 45 XPS can be used for qualitative or semi-quantitative analysis, generally through the peak position or shape of the XPS spectrum to obtain the distribution of chemical elements and groups on the material surface, and through the peak intensity to determine elemental content and concentration.
The XPS scans of elemental content on the laminate surface before and after Acid-etching treatment were divided into two groups: the Temperature-variable experimental groups and the Time-variable experimental groups. The results are shown in Figure 9. Surface elemental content before and after acid-etching. (a) XPS full spectrum of chemical elements in the surface of laminate (temperature-variable experimental groups). (b) Percentage of elemental content of C and O in the surface of laminate (temperature-variable experimental groups). (c) Percentage of elemental content of N in the surface surface of laminate (temperature-variable experimental groups). (d) XPS full spectrum of chemical elements in the surface of laminate (time-variable experimental groups). (e) Percentage of elemental content of C and O in the surface layer of laminate (time-variable experimental groups). (f) Percentage of elemental content of N in the surface of laminate (Time-variable experimental groups).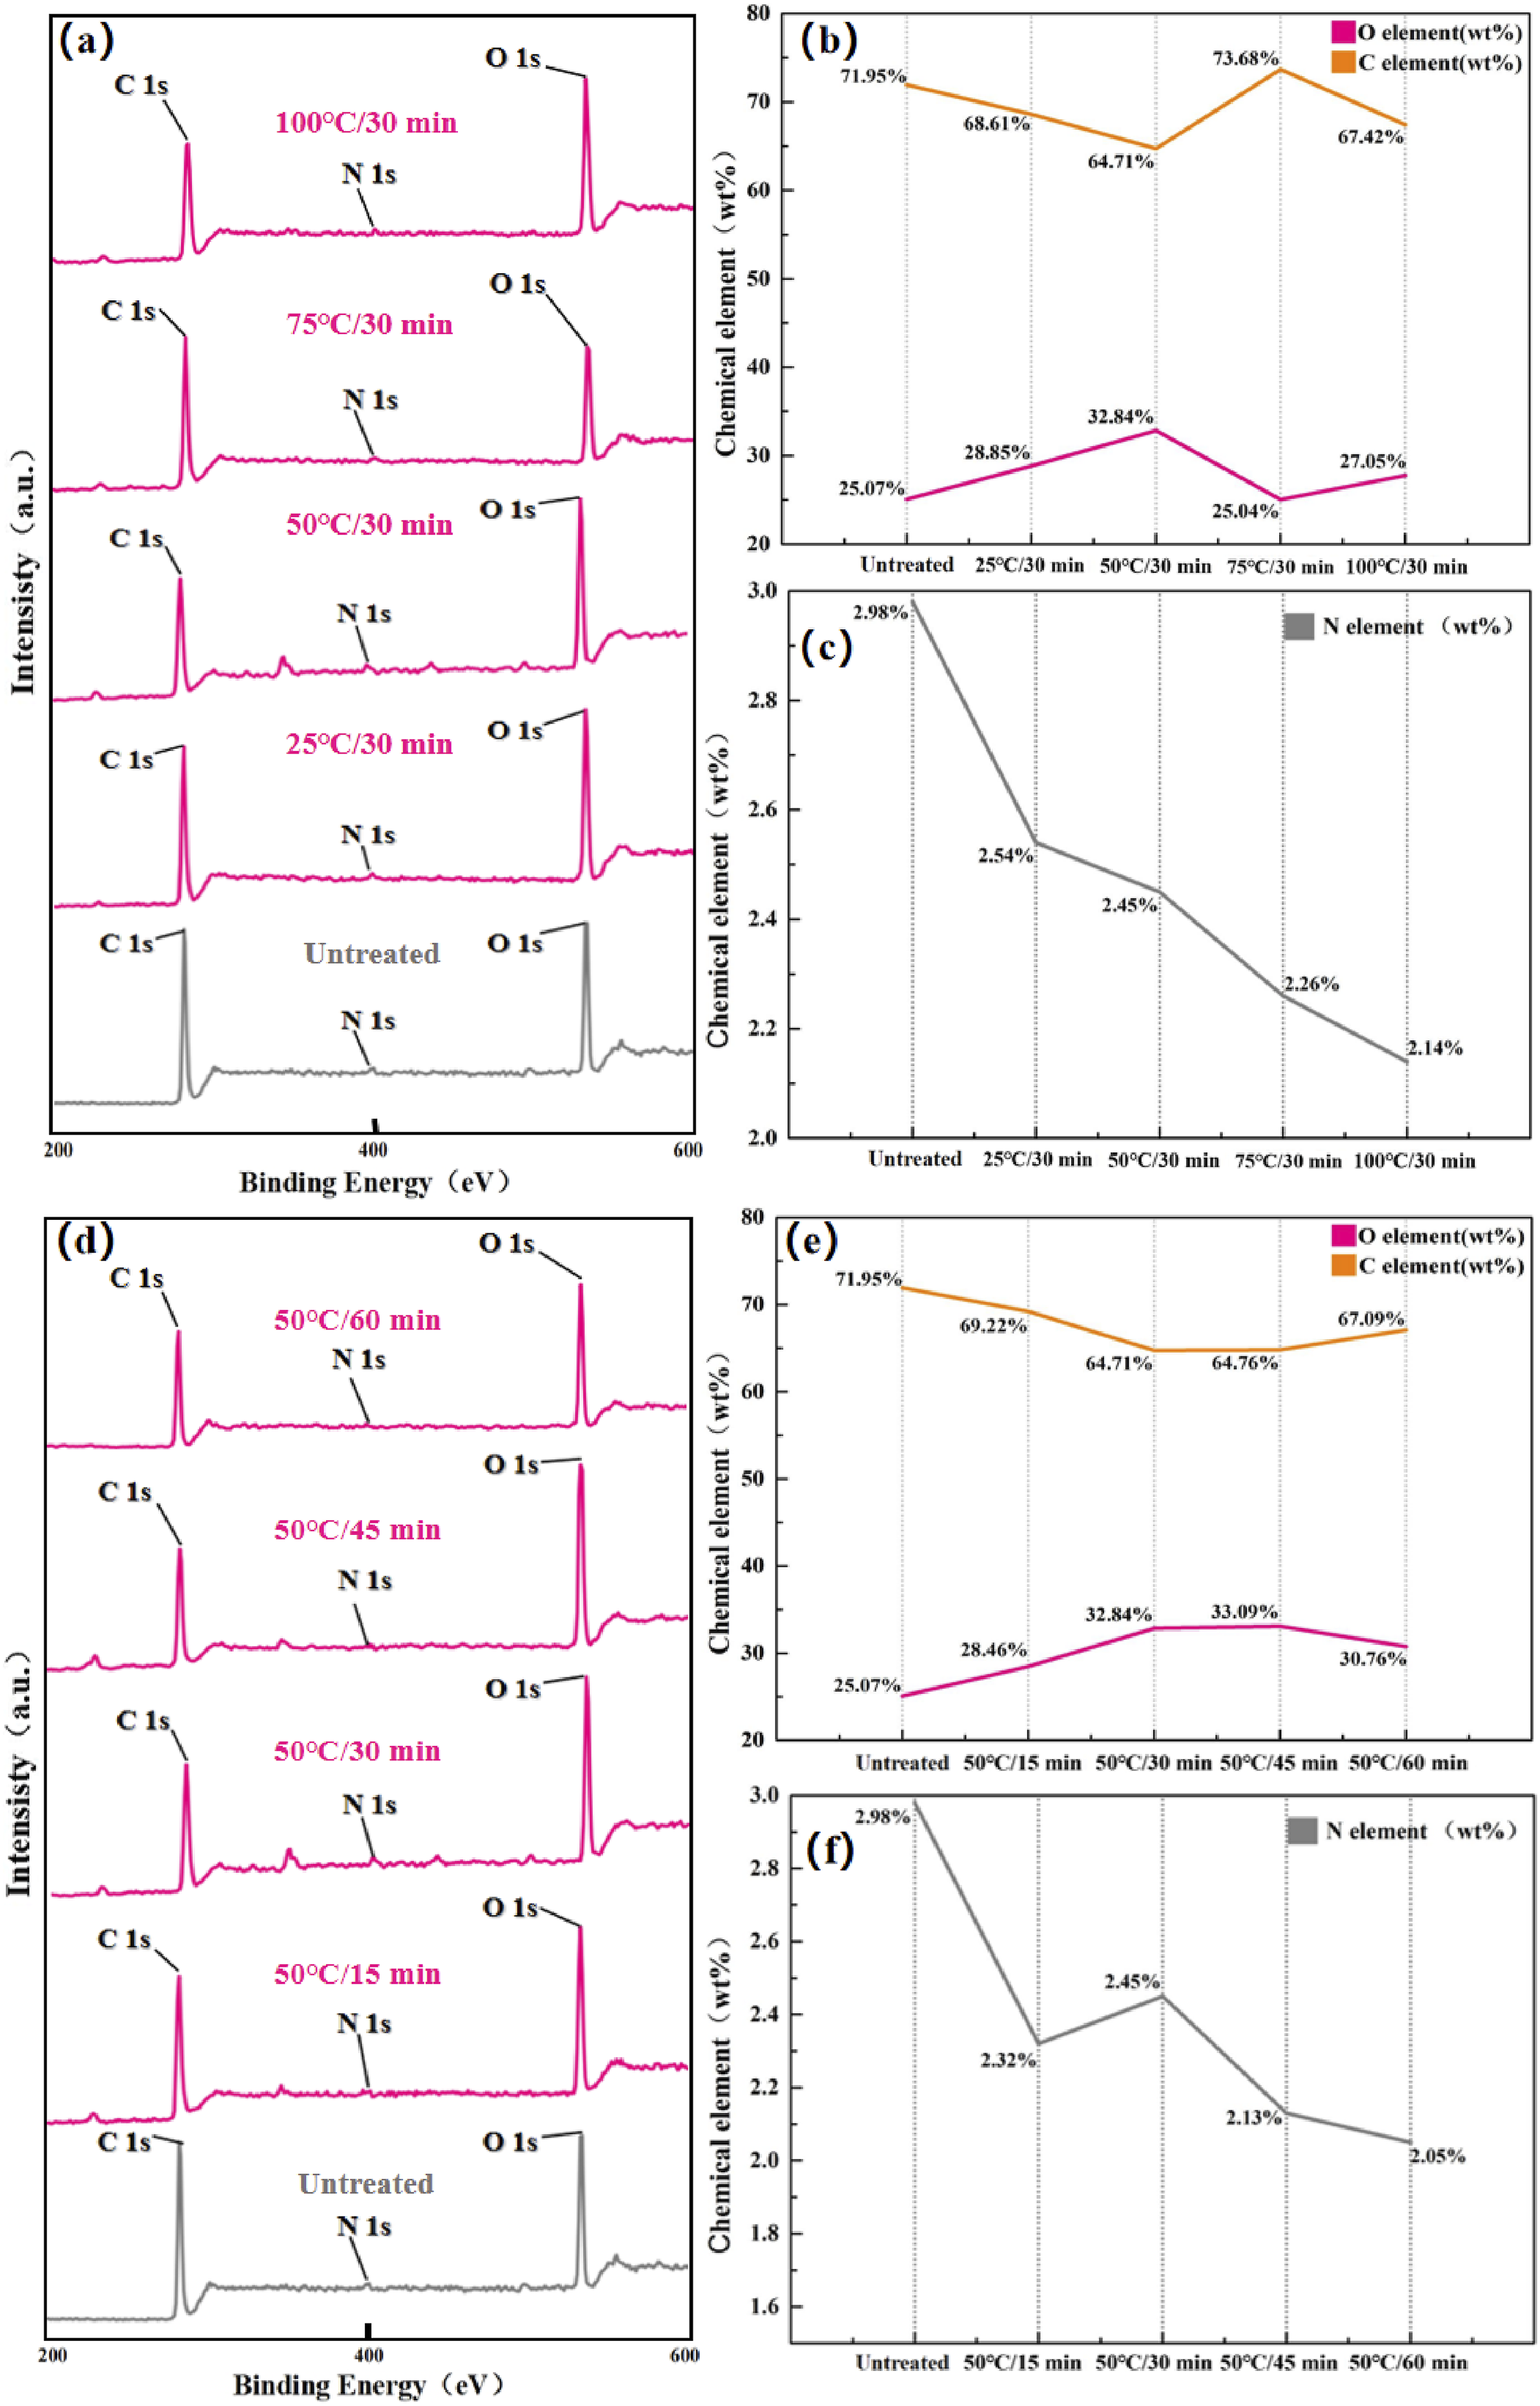
For the Temperature-variable experimental groups, it can be observed from Figure 9(b) and (c) that when the fixed etching time is 30 min, the changes of C,N, and O elemental percentages on the laminate surface are as follows: the percentage of C elemental content decreases, then rises and then decreases again, the change of the percentage of O elemental content is exactly opposite to the change of the percentage of C elemental content, and the percentage of N elemental content decreases all the time. Since the N element content on the laminate surface is relatively small, the percentage of O element content and the percentage of C element content can almost be regarded as being affected only by the change of each other’s content. The mechanism of the effect of Acid-etching on the O element content of the laminate surface is complicated, On the one hand, since concentrated sulfuric acid is a strong oxidizing agent, some O elements are introduced to the laminate surface during the Acid-etching process. However, at the same time, the epoxy resin in the laminate surface itself contains O elements, so that the removal of the epoxy resin during the Acid-etching process also means that some O elements are lost. Therefore when the Acid-etching reaction occurs mainly between concentrated sulfuric acid and epoxy resin, the change in the percentage content of O elements on the surface of the laminate is actually determined by the race between the content of O elements introduced by the Acid-etching reaction and the content of O elements taken away by the Acid-etching reaction. As can be seen from Figure 9(b) and (c), when the etching temperature is lower than 50°C, the O elements introduced by the Acid-etching reaction are more than those taken away by the Acid-etching reaction, so the percentage content of O elements on the laminate surface rises. However, as the etching temperature was further increased, the etching speed was accelerated, resulting in more epoxy being removed in the same etching time. At the same time, the excessively fast etching rate also leads to a rapid decrease in the number of reaction sites available for reaction on the laminate surface and premature saturation of the oxidation reaction, resulting in a decrease in the amount of introduced O elements. As a result, the percentage content of O elements decreases when the etching temperature is increased from 50°C to 75°C. However, as the etching temperature continued to increase, the etching rate continued to accelerate, resulting in the Acid- etching reaction prematurely removing a large portion of the epoxy resin from the surface of the laminate, so that the Acid-etching reaction changed from a reaction between the concentrated sulfuric acid and the epoxy resin to a reaction between the concentrated sulfuric acid and the carbon fibers at a certain point in time. Since concentrated sulfuric acid is a strong oxidizing agent, it will introduce some O elements when treating carbon fibers and cause them to adhere to the surface of the carbon fibers, so the percentage of O elements increases when the etching temperature is increased from 75°C to 100°C. For the N element, it comes from the amine curing agent added during the curing process of the epoxy resin. Since Acid-etching does not introduce elemental N to the surface of the laminate, it gradually decreases with the decomposition of the epoxy resin, as shown in Figure 9(c).
For the Time-variable experimental group, it can be seen from Figure 9(d) and (e) that when the etching temperature is fixed at 50°C, the percentage changes of C, N and O elements on the laminate surface with the extension of etching time are as follows: the percentage of O elements increases and then decreases, the percentage change of C elements is in the opposite direction, and the N element decreases with the extension of etching time. The analysis of the percentage change of O element content shows that with the extension of etching time, O element slowly enters the laminate surface through oxidation reaction and reaches saturation at 45 min etching time. At this time, since the oxidation reaction is saturated and the Acid-etching reaction is not saturated, the Acid-etching reaction will continue to remove the epoxy resin, so that the content of the introduced O elements is gradually less than the content of the removed O elements, resulting in a decrease in the percentage of O elements when the etching time is extended from 45 min to 60 min. It is worth noting that, as can be seen in Figure 9(d), the percentage change in O and C element content not only has a simpler trend, but also a smoother change compared to the Temperature-variable group. This suggests that the Acid-etching reaction rate is more sensitive to the etching temperature than to the etching time for similar amounts of variation, and also implies that the chemical elements introduced can be more finely tuned by adjusting the etching time with a fixed etching temperature.
Surface chemical groups content analysis
To further investigate the percentage content of chemical groups on the surface of the laminates in the Temperature- variable experimental groups, Advantage V5.9922 analytical software was used to fit the high-resolution C 1speaks on the surface of the as-is and chemically-etched-treated composite laminates to the full-spectrum charge-corrected peak at 284.6 eV, resulting in Figure 10(a) shows that the chemical groups on the surface of the laminate changed after Acid-etching, and the relative concentration of the fitted chemical groups is shown in Figure 10(b). Results of XPS analysis of samples (Temperature-variable experimental groups). (a) High-resolution C 1s fitted peaks of laminates. (b) Percentage of chemical groups content in the surface layer.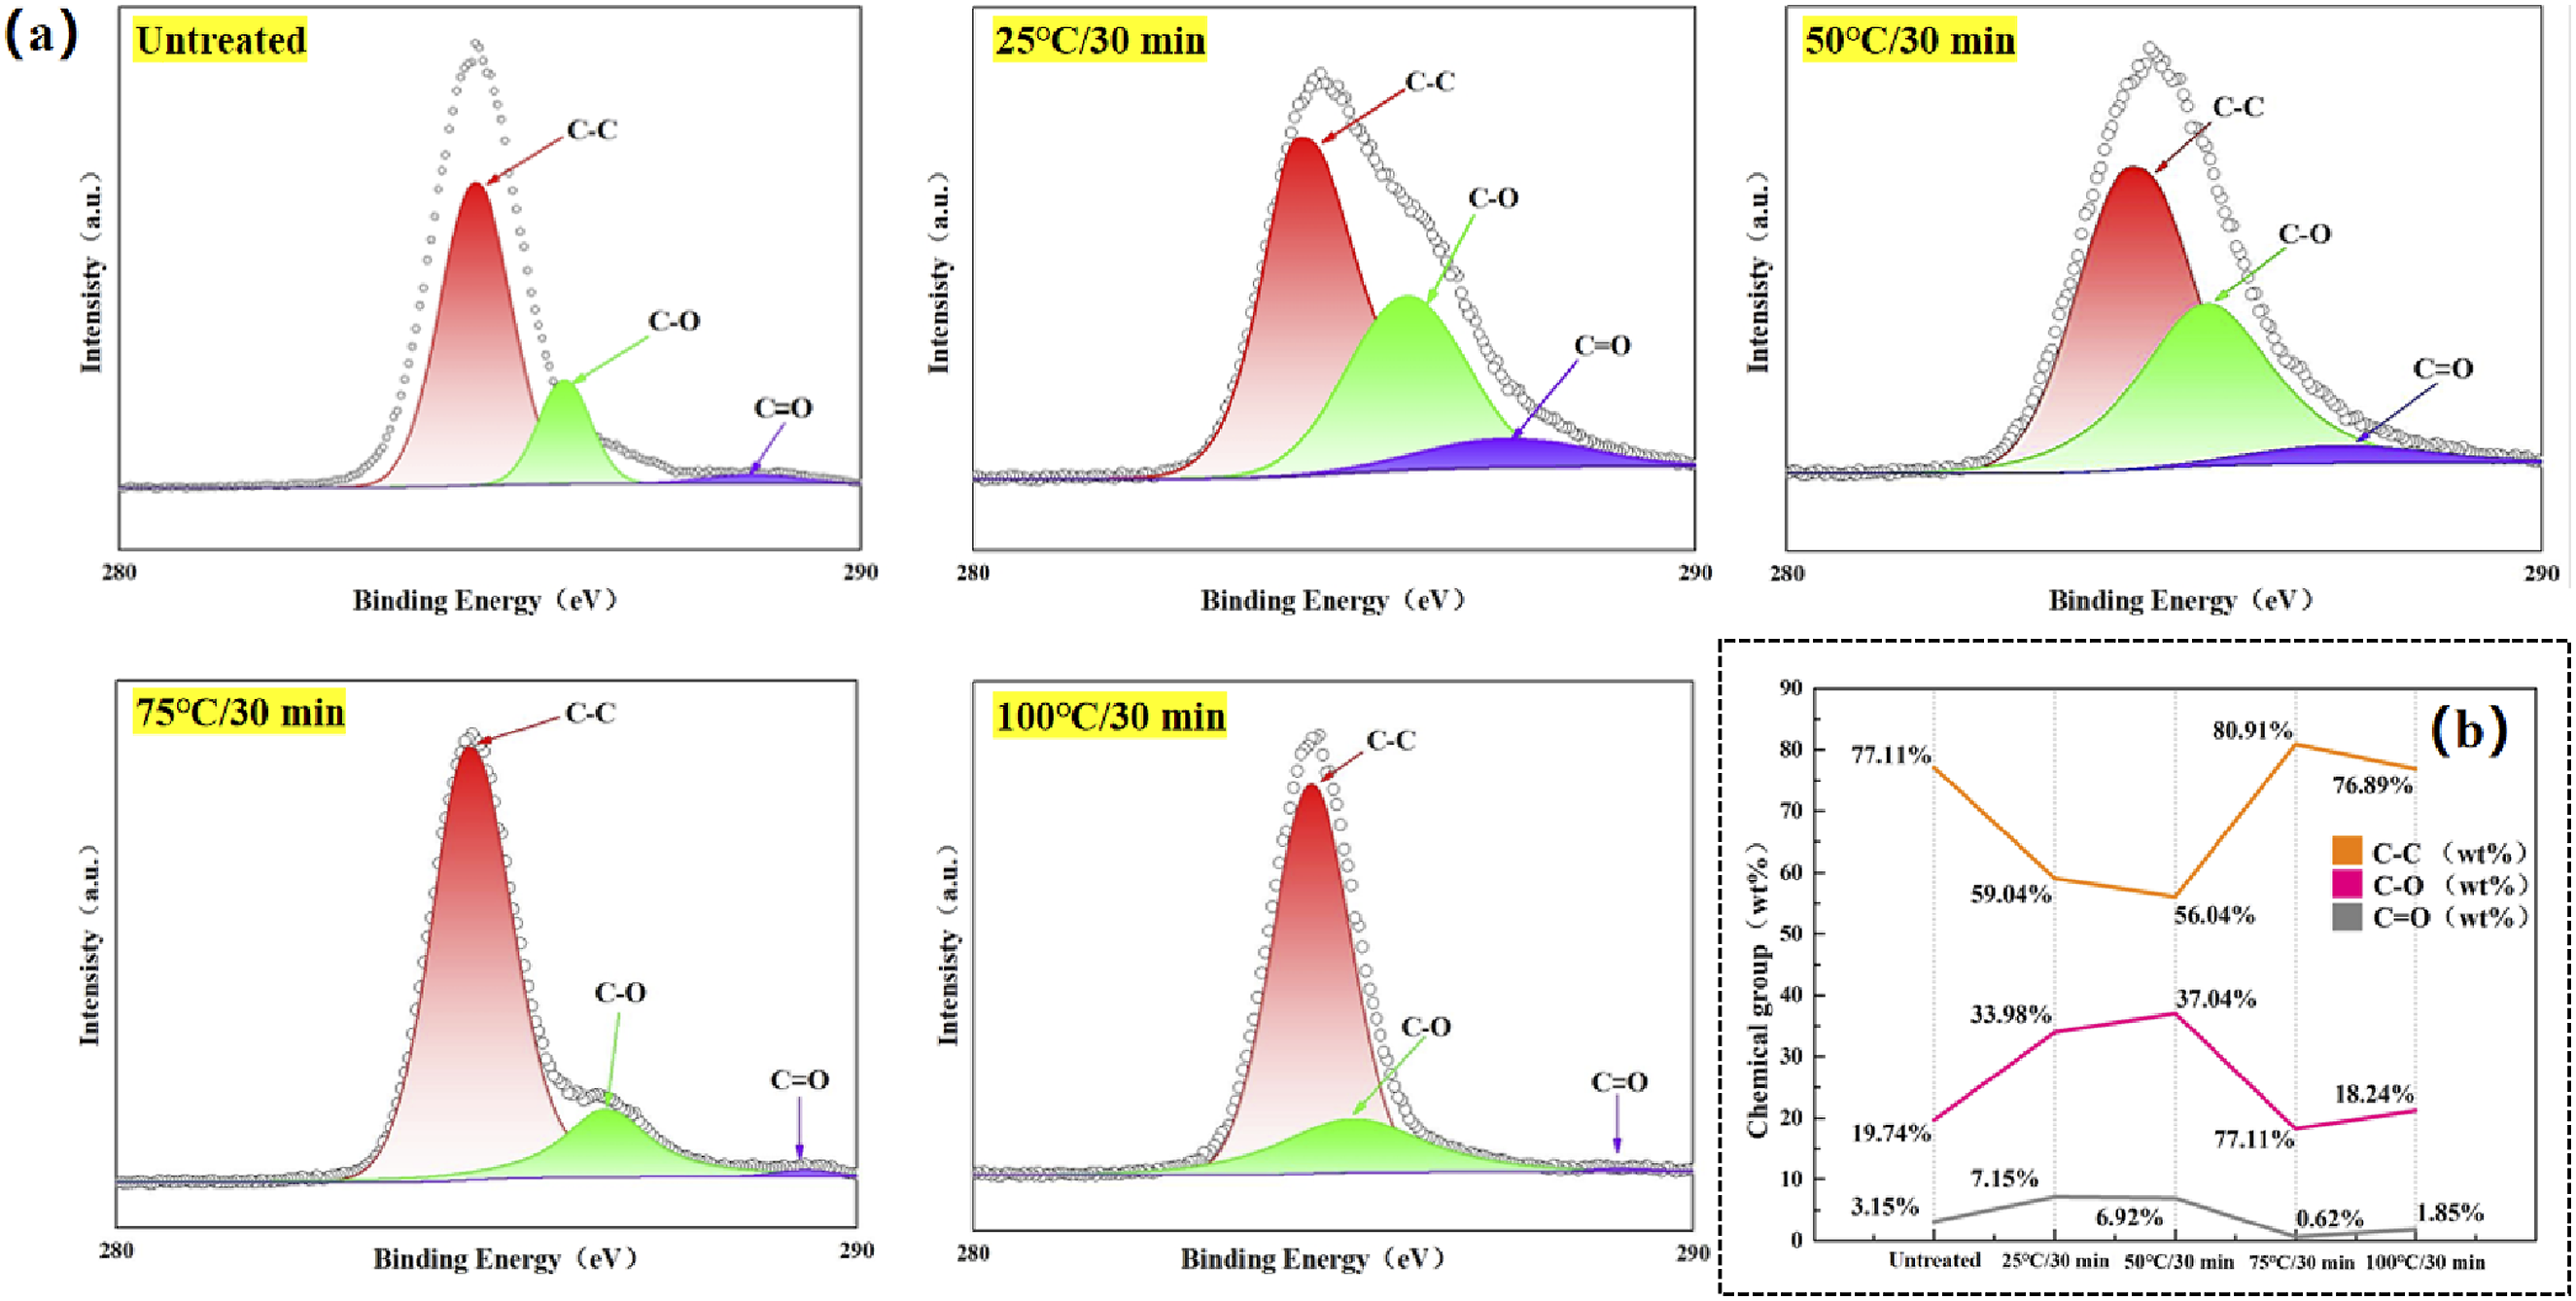
From Figure 10(a), it can be observed that C 1s has three peaks, which are C–C (284.8 eV), C–O (286 eV), and C = O (288.5 eV). At a fixed etching time (30 min), the relative content of C–C groups on the laminate surface decreases, then increases and then decreases again with the increase of etching temperature, whereas the opposite is true for C–O and C = O groups, where the content increases, then decreases and then increases again. This indicates that when the etching temperature is low, the strong oxidizing property of concentrated sulfuric acid will accelerate the breakage of C–C bond in the epoxy resin with the increase of etching temperature, so that a part of C–C groups is converted into C–O groups and C = O groups due to Acid- etching and oxidizing, 46 which makes the content of this kind of oxygen-containing functional groups reach the peak value when the etching temperature is 50°C. The presence of these oxygen-containing functional groups enhances the surface energy of the laminate and improves the bonding strength between the laminate surface and the PA6 resin.
When the etching temperature is raised to 75°C and above, it is clear from the observation of the micro- morphology of the laminate surface under the corresponding etching conditions in the previous section that the epoxy resin on the laminate surface is almost completely removed at this stage, so the Acid-etching will be mainly converted from the etching of the epoxy resin by the concentrated sulfuric acid to the etching of the carbon fibers by the concentrated sulfuric acid. As the graphite layer in the carbon fiber will break the bond under acidic conditions, the local carbon atoms will combine with oxygen atoms and form more C–O groups and C = O groups. 47 Therefore, as seen in Figure 10(b), the percentage content of C–O groups and C = O groups decreases when the etching temperature is increased from 50°C to 75°C, but increases again when the etching temperature is increased from 75°C to 100°C.
Similarly, in order to further investigate the percentage content of chemical groups on the surface of the laminates in the Time-variable experimental groups, Advantage V5.9922 analysis software was used to fit the high-resolution C 1s peaks on the surface of as-is and chemically etched- treated composite laminates to the full-spectrum charge- corrected with C 1s at 284.6 eV as the reference peak to get Figure 11. Figure 11(a) shows that the surface chemical matrix content of the laminates after the Acid-etching was performed the surface chemical groups changed, and the relative concentration of chemical groups is shown in Figure 11(b). Results of XPS analysis of samples (time-variable experimental groups). (a) High-resolution C 1s fitted peaks of laminates. (b) Percentage of chemical groups content in the surface layer.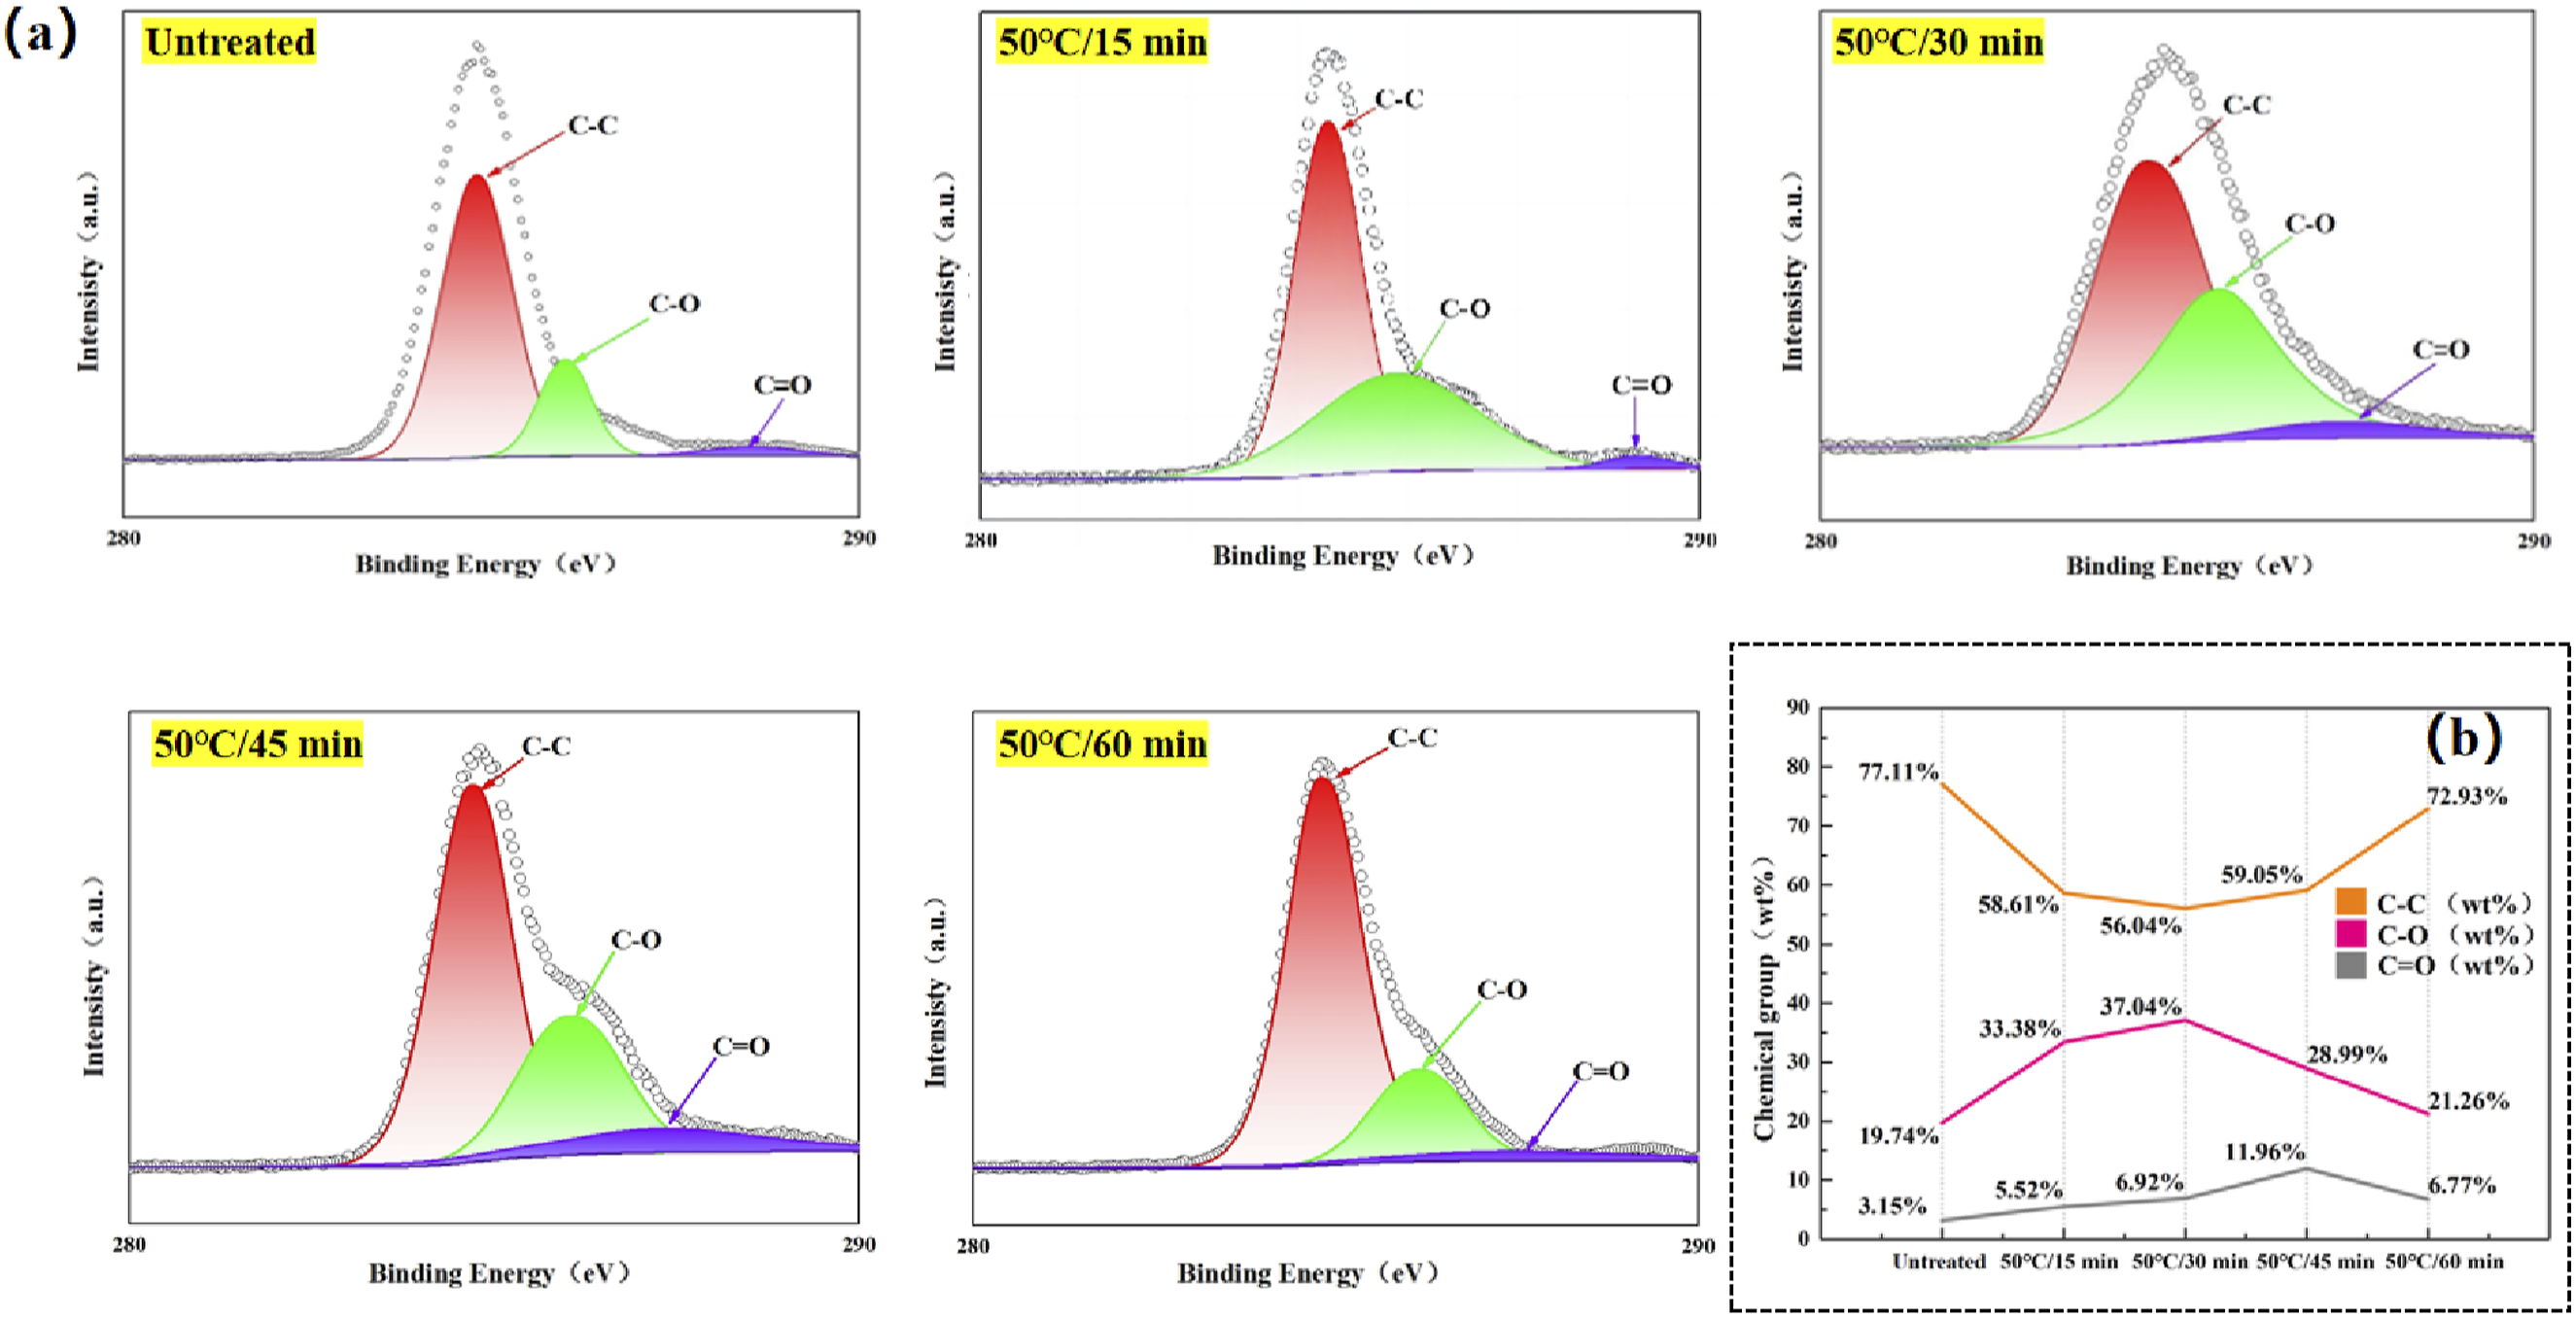
From Figure 11(a), it is also observed that C 1s has three peaks: C–C (284.8 eV), C–O (286 eV), and C = O (288.5 eV). At a fixed etching temperature (50°C), the relative percentage content of C–C groups on the laminate surface decreases and then increases with the etching time, while the relative percentage content of C–O and C = O groups decreases and then increases. As can be seen from the previous micro-morphological observations of the laminate surface under the corresponding etching conditions, for the time-variant experimental groups, except for the 50°C/60 min experimental group, the degree of carbon fiber exposure of the laminate surface under each etching condition is not high, and thus the Acid-etching is mainly an etching reaction between the concentrated sulfuric acid and the epoxy resin. As can be seen from Figure 11(b), except for the 50°C/60 min experimental group and the untreated groups, the percentages of C–C groups are close to each other in the three experimental groups, but the percentages of C–O groups and C = O groups are different from each other. In the 50°C/15 min and 50°C/30 min experimental group, the C = O content of the 50°C/15 min experimental group was 36.4% of that of the 50°C/30 min experimental group, while the C–O content was 90% of that of the 50°C/30 min experimental group. It indicates that the 50°C/15 min experimental group is inferior to the 50°C/30 min experimental group in terms of the percentage content of different oxygen-containing functional groups. Therefore, the 50°C/30 min experimental group is superior to the 50°C/15 min experimental group in terms of surface chemical bonding ability. However, for the 50°C/30 min and 50°C/45 min experimental group, the contents of different oxygen-containing functional groups are better or worse than each other; the content of C = O groups in the 50°C/30 min experimental group is 57.8% of that in the 50°C/45 min experimental group, and the content of C–O groups is 127% of that in the 50°C/45 min experimental group. In general, C = O bonds are very polar, while C–O bonds (e.g., ether bonds or alcohol hydroxyl groups) are also somewhat polar, but less polar than C = O bonds. This is due to the fact that the oxygen atom in the C = O group carries part of the δ - , and the carbonyl atom carries part of the δ +. 48 For example, the lone pair of electrons on the oxygen atom of the carbonyl group can form strong hydrogen bonds with the hydrogen atom in PA6, while the δ + of the carbonyl group can have dipole-dipole interactions with the δ - of PA6. These interactions are exothermic processes that release energy and favor PA6 adsorption and spreading on the material surface. While the oxygen atoms in the C–O bond can also form hydrogen bonds with PA6, the hydrogen bond strength is weaker than that formed between C = O and PA6, and the dipole-dipole interactions between C–O and PA6 are also weaker than those between C = O and PA6. Therefore, in terms of surface chemical bonding capacity, the 50°C/45 min experimental group, which contains more C = O groups (42.2% more content than the 50°C/30 min experimental group) and only contains slightly less C–O groups (27% less content than the 50°C/30 min experimental group),is clearly superior.
Quality analysis of welded joints
Quality analysis of welded joints in temperature-variable experimental groups
There are three failure modes of composite resistance welded joints, namely
49
: (1) interlayer failure; (2) interface failure; and (3) sample failure, as shown in Figure 12(a). These three failure modes are determined by the magnitude of several key strengths of the welded joints: (1) the strength of the metal mesh to damage: metal mesh strength; (2) the strength of the metal mesh combined with the thermoplastic resin layer: metal mesh-resin bonding strength; (3) the strength of the thermoplastic resin layer in contact with the surface of the laminate: interlayer strength; (4) Strength to pull out the surface structure of the laminate: pull-out strength; (5) Strength to cause damage to the laminate: laminate strength. As shown in Figure 12(b). (a) Welding joint failure mode. (b) Critical strength interface. (c) Thermoplastic resin layer failure mode.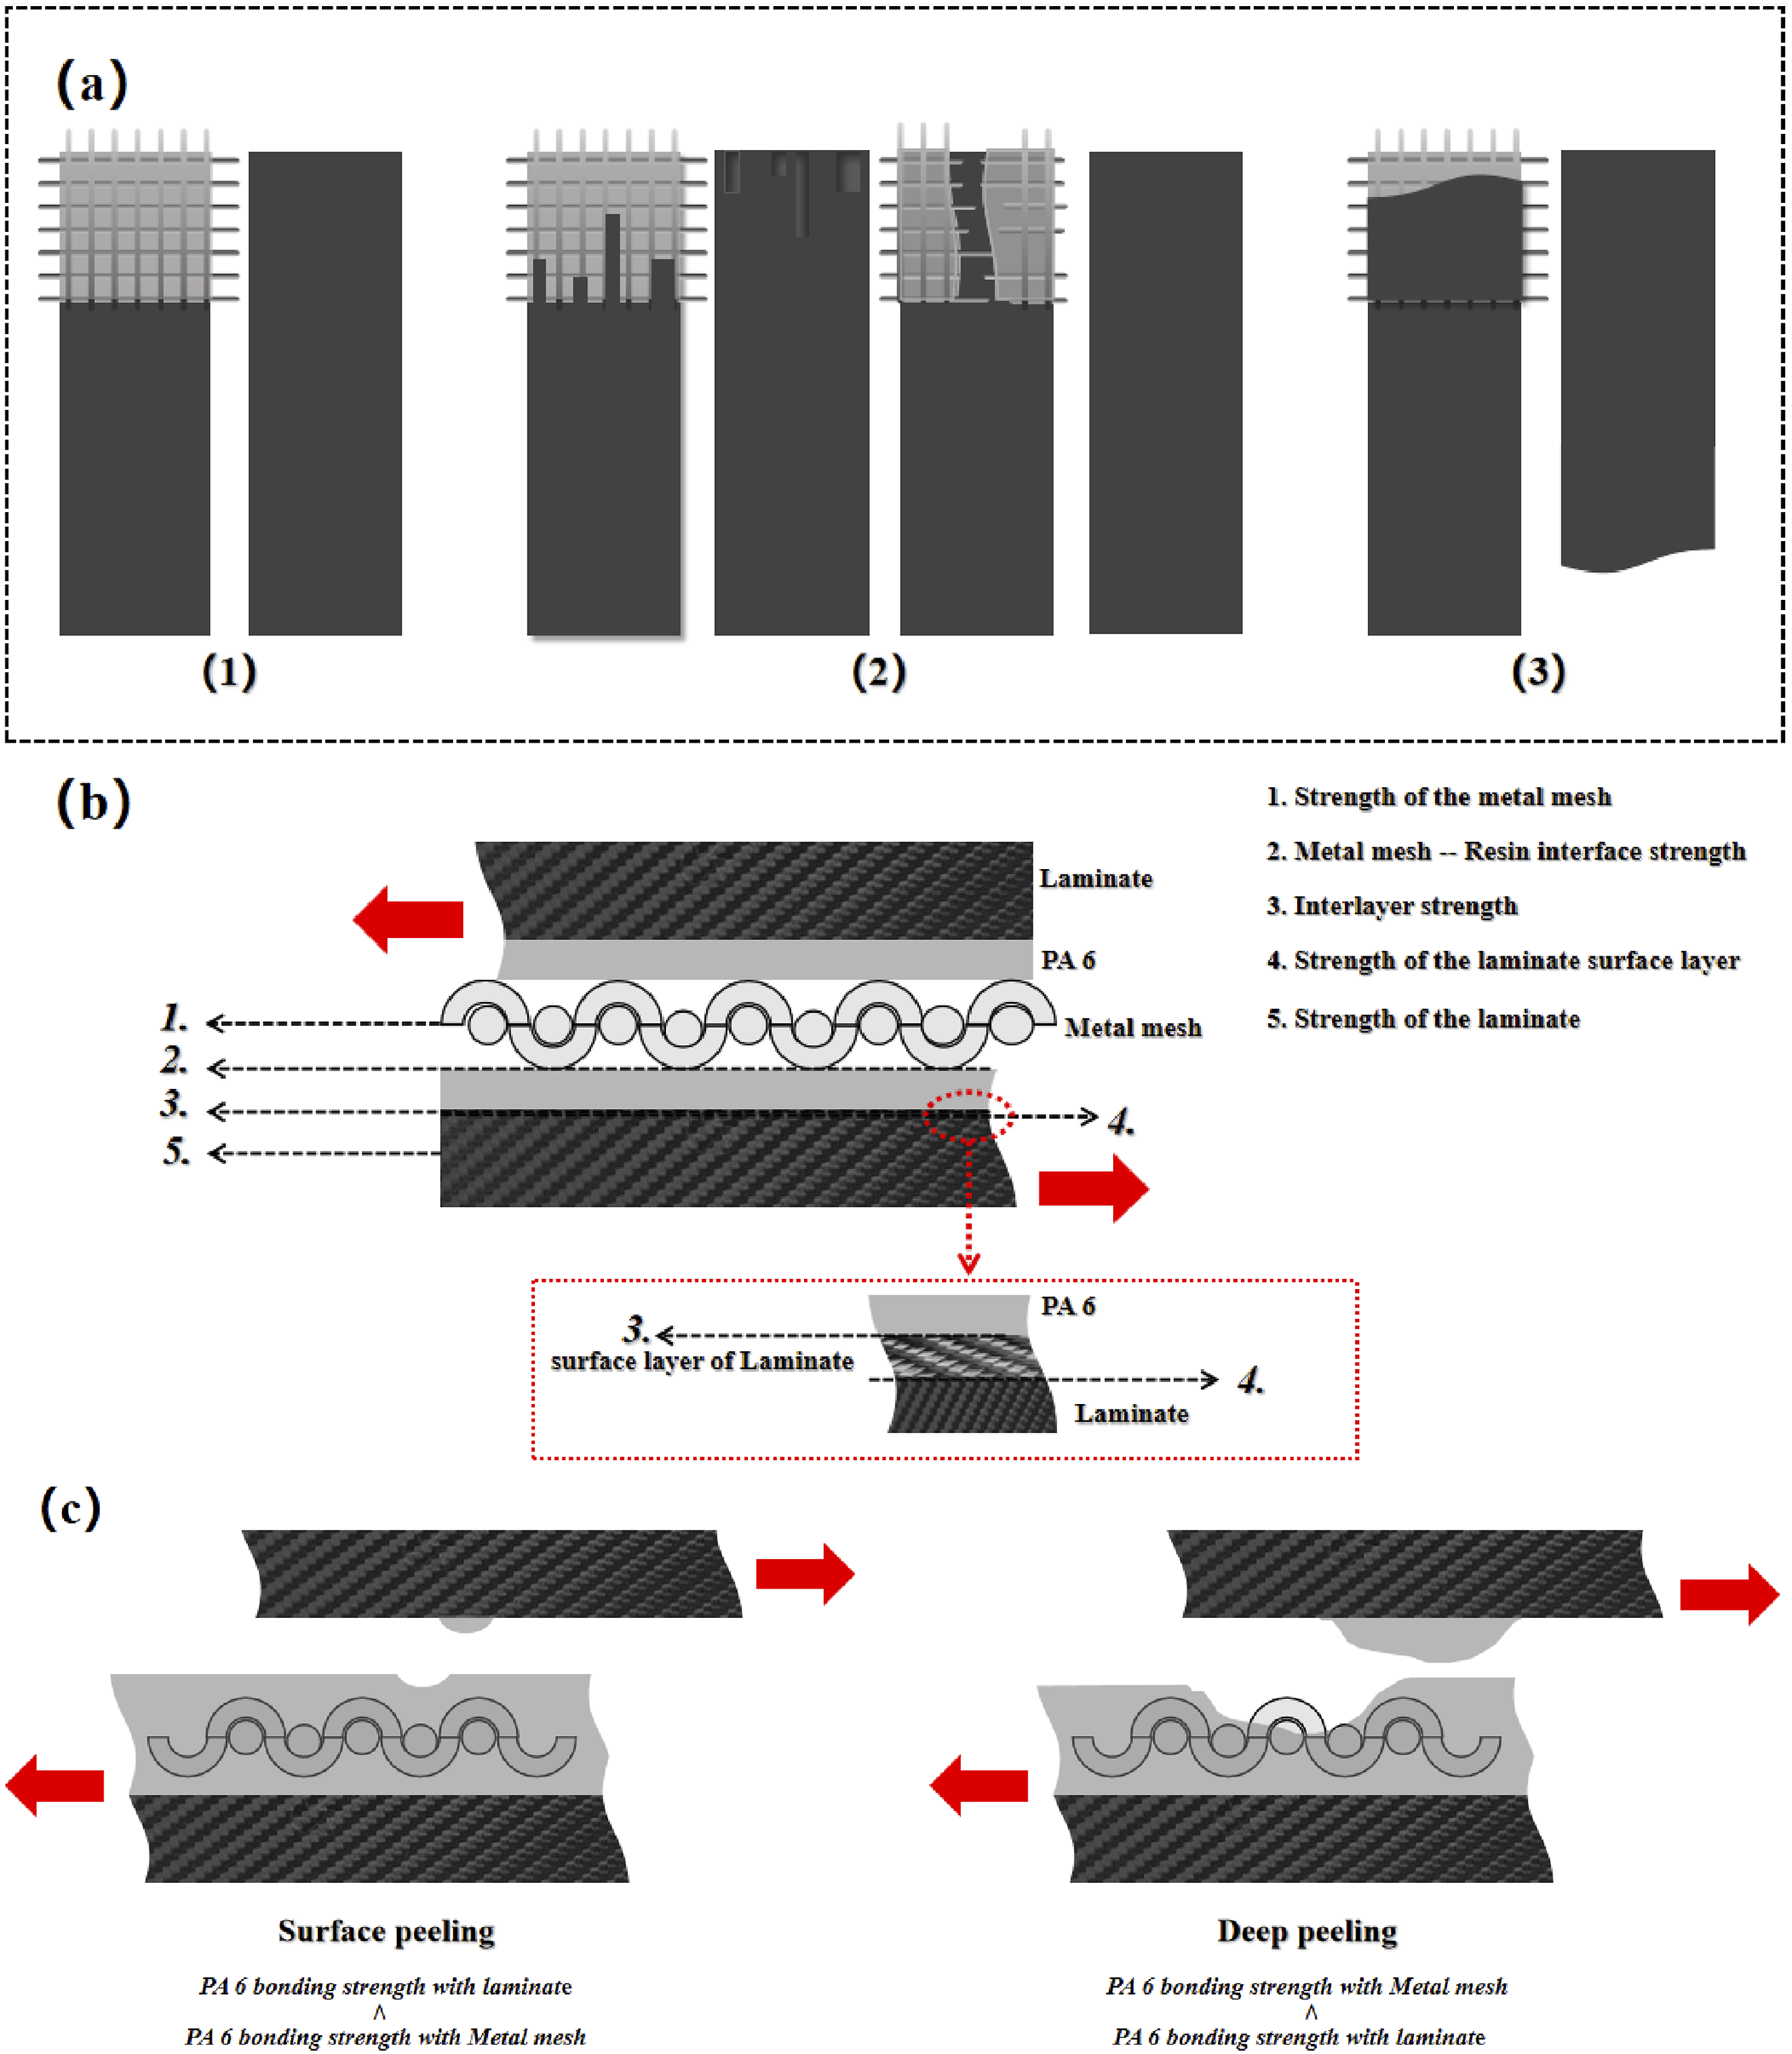
When the interlayer strength is less than the other strengths, it indicates that the interlayer strength is the weakest bonding strength and thus leads to interlayer failure of the welded joint. This failure mode indicates that the thermoplastic resin is not able to form a good bond with the surface of the laminate, often resulting in a low welded joint strength. When the interlayer strength is equal to or higher than any other strength or strengths, the failure interface is transformed into a mixture of multiple interfaces. This mixing of failure interfaces causes the failure mode to transform into an interface failure with a higher strength of the welded joint. For example, when the interlayer strength is higher than the metal mesh-resin bonding strength, a portion of the failure interface will be transferred to the interior of the heating element, resulting in peeling of the thermoplastic resin layer, creating a mixture of two failure interfaces (the contact surface of the thermoplastic resin layer with the laminate and the contact surface of the thermoplastic resin layer with the metal mesh). Since welded joint may experience a mixed failure of multiple failure interfaces, dispersing the tensile strength into multiple interfaces, therefore will lead a higher LSS for the welded joint. When the laminate strength is the only weakest strength, this indicates that the overall strength of the welded joint is higher than the laminate strength, and can lead to damage occurring in areas that are located within the laminate and away from the welded area, causes the sample failure. This failure mode does not give any information about the quality of the welded joint.
In addition, there are two failure modes in the metal mesh resin interface: surface peeling and deep peeling, as shown in Figure 12(c). These two failure modes characterize different two metal mesh-resin bonding strengths. Surface peeling is a failure in which the outermost layer of the thermoplastic resin layer is torn off during tensile failure, and deep peeling is a failure in which the entire portion of the thermoplastic resin layer is torn off during tensile failure. Surface peeling indicates that the bonding strength between PA6 and the laminate surface is weaker than the bonding strength between PA6 and the metal mesh at the time of tensile failure, so that the thermoplastic resin layer cannot be peeled off from the heating element as a whole at the time of peeling. Deep peeling means that the bonding strength of PA6 to the laminate surface is stronger than the bonding strength of the metal mesh at the time of tensile failure, so that the PA6 is peeled off from the heating element as a whole. In general, the deep peel mode indicates that the failure interface is shifted from the contact surface of the thermoplastic resin and the laminate to the contact surface of the thermoplastic resin and the metal mesh, which results in a higher LSS.
A miniature table saw was used to cut the welded joint area of the Temperature-variable experimental group of welded samples with tensile failures to obtain the corresponding heating element failure parts and laminate failure parts. In order to simultaneously observe the surface morphology of the heating element and the internal morphology (PA6 and metal mesh bonding state), the heating element failure parts were placed under a transreflective polarized light microscope with a magnification scale of 300 μm. In order to observe the surface morphology of the laminate and the distribution of PA6, the laminate failure parts were placed in FE-SEM to observe the failure interface with a magnification scale of 300 μm to obtain Figure 13. Morphological observation of welded joint failure interface (temperature-variable experimental groups). (a) Welded joint failure interface. (b) Heating element failure interface. (c) Laminate failure interface.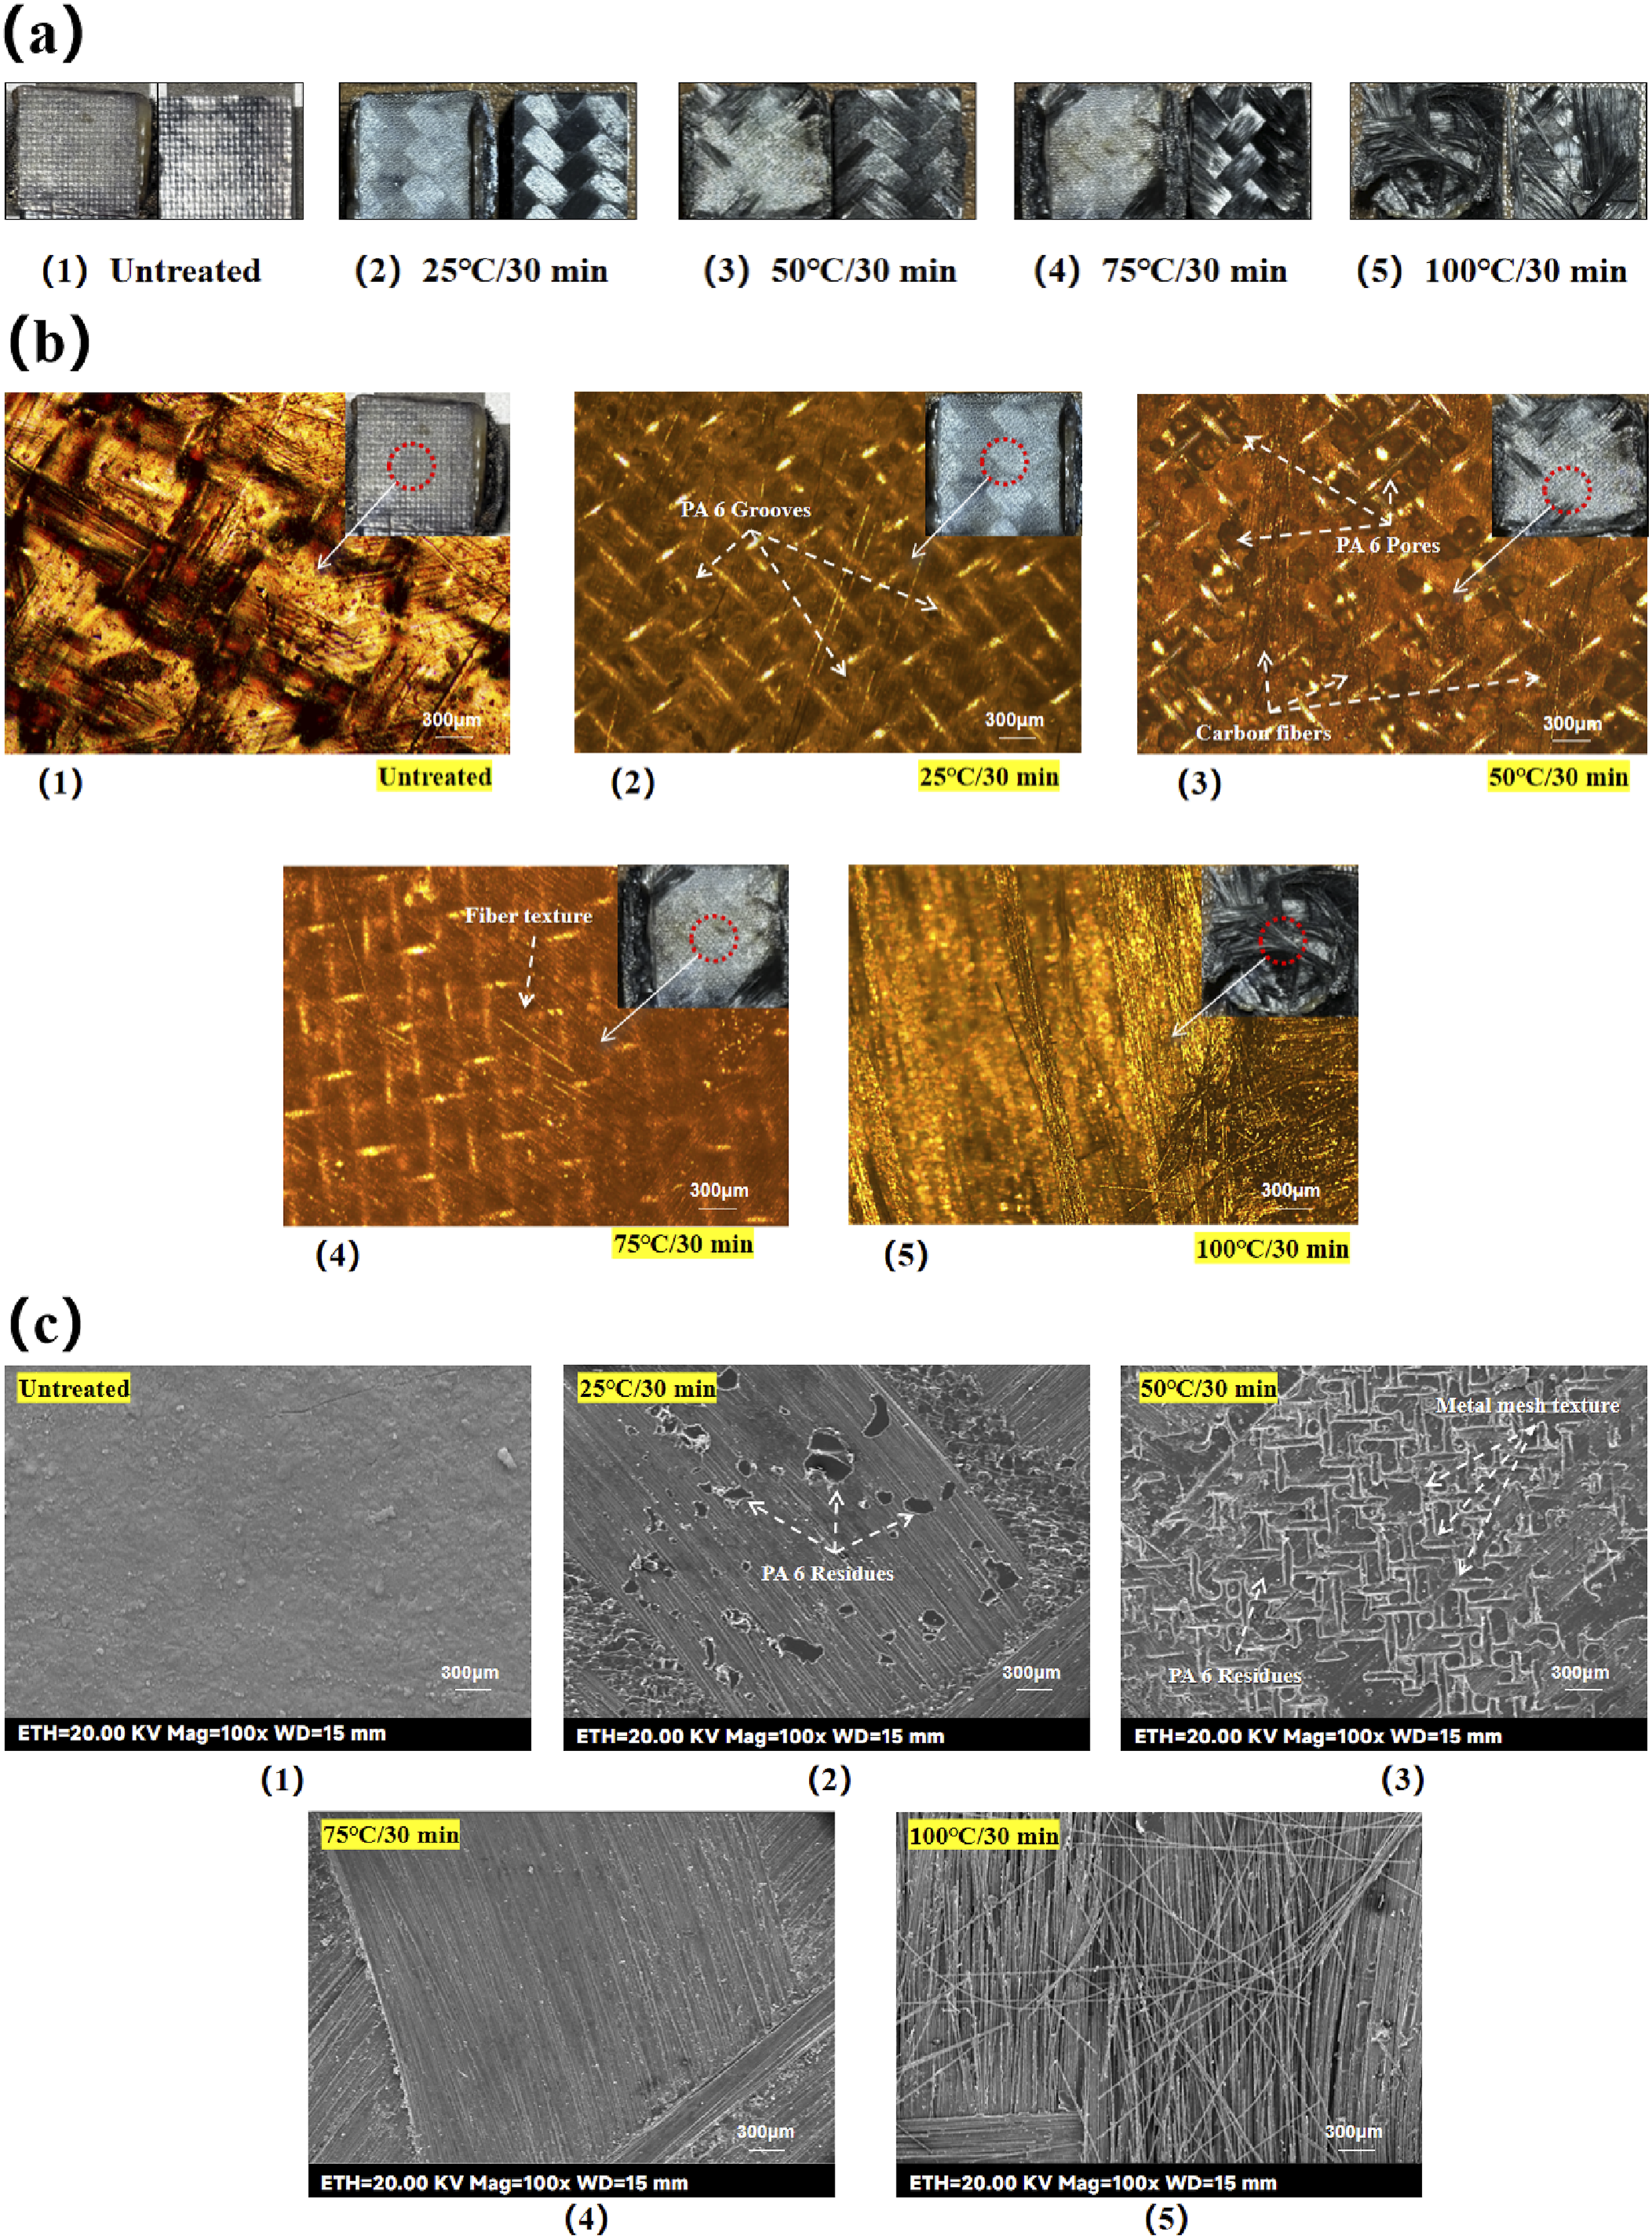
It can be observed that the surface of the untreated part was covered by epoxy resin, and PA6 could not find the groove structure or fine protruding structure on it to form an anchorage bond, and could only rely on the limited roughness of the laminate surface for a weak physical bonding, which resulted in a low physical embedment strength of the welded joint at this time. In addition, at this time, the surface chemical inertia of the laminate is also stronger, the relative content of oxygen-containing functional groups is lower, so the infiltration of the laminate surface is also poor, and it is unable to form a good chemical bond with the molten PA6, resulting in the chemical bonding strength of the welded joint at this time is also low. As shown in Figure 13(a1), the welded joints did not show laminate damage or heating element damage at failure. As seen in Figure 13(b1) and (c1), the surface of the heating element failure part is smooth, with no traces of damage, and there are no traces of damage or PA6 residue on the surface of the laminate failure part, indicating that the failure interface is located between the thermoplastic resin layer and the surface of the laminate at this time, and that the failure mode belongs to the interlayer failure.
When the etching condition was 25°C/30 min, no damage to the laminate or damage to the heating element was detected when observing the welded joint failure interface, as shown in Figure 13(b1). Observation of the heating element failure part can be seen clear traces of fiber grain and a few pores distributed on it, as shown in Figure 13(b2). A small amount of speckled PA6 residue was observed on the surface of the laminate failure part, but no metal mesh pattern was seen on these residues, indicating that the peeling mode of PA6 was surface peeling, as shown in Figure 13(c2). Since there was no damage to the laminate and heating element at the time of failure, and the peeling mode of PA6 was surface peeling, Indicates that the failure interface is located at Contact surface between PA6 and laminate surface. Therefore the LSS of the welded joint at this time was not high, and the failure mode was interlayer failure.
When the etching condition was 50°C/30 min, observation of the welded joint failure interface showed that the carbon fibers were pulled out and remained around the heating element during the tensile failure, as shown in Figure 13(a3). Observation of the heating element failure part revealed that a large number of pores appeared on the surface of the heating element, as shown in Figure 13(b3), which microscopically indicated the loss of the resin layer of the heating element. Observation of the surface morphology of the laminate failure part found that a large area of PA6 residue appeared on the surface of the laminate, and these PA6 residues have some metal mesh patterns on it, indicating that the PA6 was peeled off directly from the metal mesh, as shown in Figure 13(c3). At this time, the peeling mode of PA6 is deep peeling, and the carbon fibers in the laminate surface are pulled out, indicating that the failure interface is a mixture of three different interfaces – the contact surface between the laminate surface and fibers, the contact surface between PA6 and the metal mesh and the contact surface between PA6 and the laminate surface. At this time, the bond strength between the laminate surface and PA6 is greater than the bond strength between PA6 and metal mesh as well as the bond strength between the laminate surface and surface fibers, leading to the failure of these two interfaces during tensile failure. This is mainly due to the higher surface roughness and more reactive groups content of the laminate, as well as better surface wettability, which changes the failure mode of welded joints from interlayer failure to interface failure.
When the etching condition was 75°C/30 min, the carbon fibers were pulled out during the tensile failure and the resin layer of the heating element became thin when observing the welded joint failure interface, as shown in Figure 13(a4). Observation of the heating element failure part can be seen obvious fiber grain, but no pores or grooves, indicating that there is no peeling of PA6, as shown in Figure 13(b4). Observation of the surface of the laminate failure part also did not find PA6 residue, as shown in Figure 13(c4). In summary, it indicates that the failure interface at this time is not located on the contact surface of PA6 and metal mesh, nor on the metal mesh body, but on the contact surface of the laminate surface with PA6 and laminate surface with surface fibers. It means that at this time the pull-out strength of the pulled-out fibers in the laminate surface is exactly equal to the interlayer strength at this time.
The reason for this failure mode is: At this etching stage, the laminate surface fiber arrangement is sparse, low roughness, and low oxygen-containing functional groups content, is not conducive to the combination of PA6 and the laminate surface. Therefore, in the welding process, the molten PA6 can not form a good combination with the laminate surface, and is squeezed by the pressure to the left and right sides of the welding area. Due to the edge effect, the fluidity of the squeezed resin is enhanced at high temperatures. Thanks to the sparse fiber arrangement of the laminate surface at this etching stage, the squeezed resin penetrated into some of the edge fibers that were warped due to the loss of epoxy constraints and formed a stronger bond. While a small portion of the squeezed but unbound PA6 vaporized under the high temperature of the edge effect and left charred black residual traces of PA6 on both sides of the weld area. Thus at tensile failure, a portion of the actual failure occurred between the pulled out edge fibers and the laminate surface, where the molten PA6 formed a strong bond with the edge ends of the edge fibers and tore the edge fibers away from the laminate at tensile failure. As the interlayer strength at this time is exactly equal to the pull-out strength, the failure interface is a mixture of the two interfaces, so the failure mode at this time is the interface failure.
When the etching condition is 100°C/30 min, observing the failure interface of the welded joints, a large number of fibers were pull out from the laminate and bonded to the heating element, and at this time, the same large number of disordered fibers still existed on the failure interface of the laminate failure part, as shown in Figure 13(a5). Observation of the heating element revealed a large number of laminate surface fibers that had been removed from the motherboard, as shown in Figure 13(b5). These surface fibers were stacked on top of each other, obstructing the field of view and making it impossible to observe the distribution of PA6 on the heating element. A large number of disordered fibers separated from each other and piled up on the failure interface were visible when observing the laminate failure parts, and no obvious PA6 residue was found, as shown in Figure 13(c5). This indicates that the failure interface of the welded joint is located inside the laminate alone, so the failure mode should be sample failure.
Observation of the laminate failure part shows that the failure interface is a bare fiber structure, and only a small amount of epoxy resin residue is visible. This means that the molten PA6 is almost not effectively connected to the failure interface, and the failure mode of the welded joint can be approximated as a sample failure with the bare fibers peeled off from the motherboard. This is probably caused by two reasons:
First, the amount of PA6 on the heating element is limited, excessive Acid-etching cause the deeper etching depth, so the limited PA6 can not fully penetrate into all the bare fibers to form a composite structure that can be stressed. Those bare fibers which are not forms bonds with PA6 transformed into internal defects of welded joints . These internal defects are dispersed in the vertical and horizontal directions, greatly destroying the stability of the welded joints, making it easy to be damaged internally by small forces and causing failure of the sample;
Secondly, a part of the Acid-etching in this stage acts directly on the carbon fibers themselves, which promotes an increase in the content of reactive groups of the carbon fibers in the surface, which is conducive to the bonding of the molten PA6 with the bare fibers of the surface. In addition, a large number of burrs and protruding structures appear on the laminate surface at this stage due to the loss of the main epoxy constraints in all directions, which improves the surface roughness of the laminate, and is also conducive to the bonding of the molten PA6 with the bare fibers in the surface. As a result, the surface fibers are not only more likely to form a better bond with the PA6, but also more likely to peel away from the motherboard, which naturally leads to failure within the laminate.
Quality analysis of welded joints in time-variable experimental groups
A miniature table saw was used to cut the welded joint area of the Time-variable experimental group of welded samples with tensile failures to obtain the corresponding heating element failure parts and laminate failure parts. In order to simultaneously observe the surface morphology of the heating element and the internal morphology (PA6 and metal mesh bonding state), the heating element failure parts were placed under a transreflective polarized light microscope with a magnification scale of 300 μm. In order to facilitate the observation of the surface morphology of the laminate and the distribution of PA6, the laminate failure parts were placed in FE-SEM to observe the failure interface with a magnification scale of 300 μm to obtain Figure 14. Morphological observation of welded joint failure interface (Time-variable experimental groups). (a) Welded joint failure interface. (b) Heating element failure interface. (c) Laminate failure interface.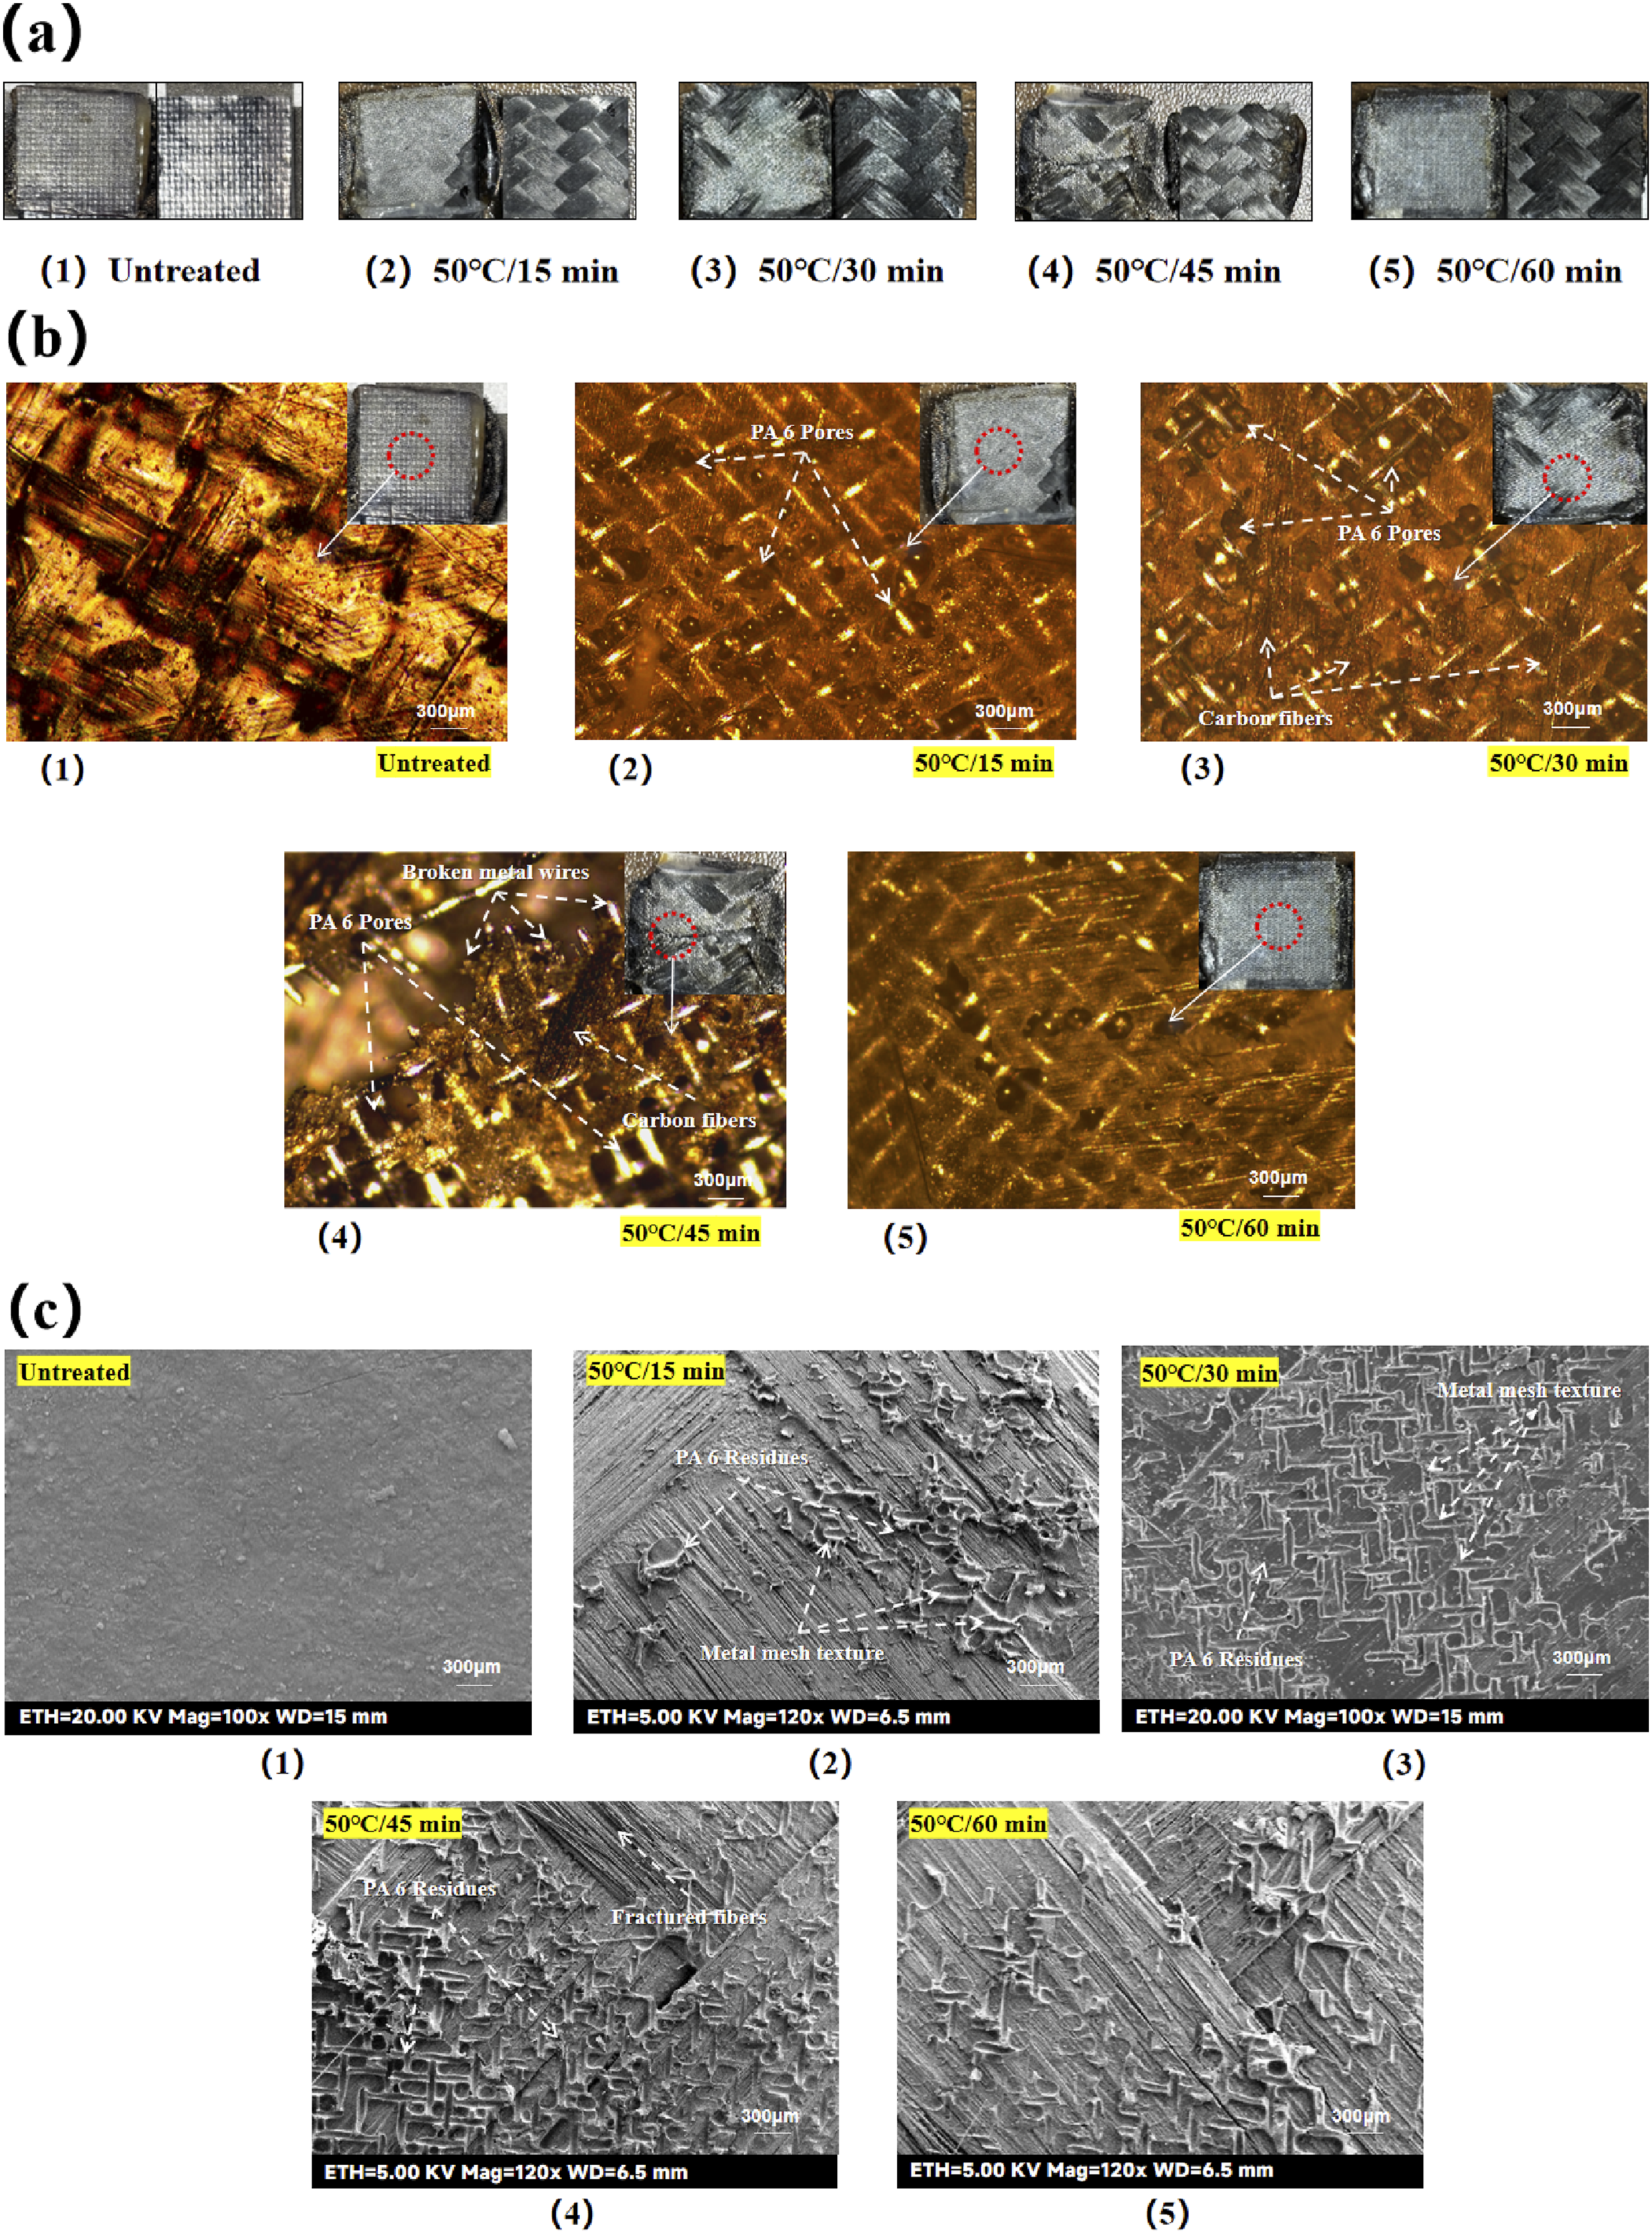
When the etching condition was 50°C/15 min, the carbon fiber was pulled out at the lower right edge when observing the failure interface of the welded joint, as shown in Figure 14(a2). Observing the failure interface of the heating element failure part, the resin layer has obvious fiber lines and scattered pores, as shown in Figure 14(b2). Observation of the laminate failure part can be seen, the laminate surface covered with a little PA6 residues, and these PA6 residues have some metal mesh patterns on it, indicating that at this time the peeling mode of PA6 is deep peeling, as shown in Figure 14(c2). Since the peeling mode of PA6 is deep peeling, and the carbon fiber of the laminate surface has been pulled out during the tensile failure, the failure interface at this time is a mixture of three interfaces:the contact surface between the fibers of the laminate surface and the laminate surface, the contact surface between PA6 and the metal mesh and the contact surface between PA6 and the laminate surface.
Therefore, the failure mode at this etching stage is interface failure. Comparing the failure interface morphology and failure mode of the 25°C/30 min experimental group with the 50°C/15 min experimental group, it can be seen that the bonding strength between PA6 and the laminate surface of the 50°C/15 min experimental group is better than that of the former, which is mainly reflected in the damage mode of the heating element and the morphology of the PA6 residues. It is observed that in the 25°C/30 min experimental group, the peeling mode of PA6 is surface peeling. While in the 50°C/15 min experimental group, the peeling mode of PA6 is deep peeling. It indicates that the bonding strength between the laminate surface and PA6 in the 25°C/30 min experimental group is not strong enough to make the PA6 detach from the heating element completely. In contrast, in the 50°C/15 min experimental group, the bonding strength of the laminate surface with PA6 has been enhanced to the extent that it is sufficient to peel offPA6 from the metal mesh.
When the etching condition was 50°C/45 min, the carbon fiber was pulled out and the thermoplastic resin layer became thinner and the metal mesh was torn when observing the failure interface of the welded joint, as shown in Figure 14(a4). Observation of the failure interface of the heating element failure part shows that the metal mesh is broken and there are a lot of pores on the resin layer, as shown in Figure 14(b4). Observation of the failure interface of the laminate failure part shows that a large number of PA6 residues with metal mesh patterns on it densely distributed on the surface of the laminate, as shown in Figure 14(c4). At this time, the failure interface is a mixture of four failure interfaces: the contact surface between the laminate surface fibers and the laminate surface, the contact surface between PA6 and the metal mesh, the contact surface between PA6 and the laminate, the metal mesh itself. In addition, due to the large amount of PA6 residues in the surface of laminate failure part, the area with no PA6 residue is significantly less than that with PA6 residues, indicating that the PA6 laminate contact surface is not the main failure interface. It shows that in this tensile failure, In addition to the laminate strength, the interlayer strength is the strongest strength of all strengths (stronger than metal mesh strength, metal mesh resin bonding strength and pull-out strength), which is a proof that the surface treatment technology has reached its limit in terms of strengthening the LSS value of CF/EP welding joints.
When the etching condition is 50°C/60 min, the observation of the failure interface of the welded joint shows no carbon fiber is pulled out, and the resin layer of the heating element is not significantly thinned, as shown in Figure 14(a5). Observing the failure interface of the heating element failure part, it can be seen that there are certain small pores in the resin layer of the heating element, as shown in Figure 14(b5). Observing the failure interface of the laminate failure part, there is a small amount of PA6 residues with metal mesh pattern on it distributed on the surface of the laminate, but the distribution is sparse, as shown in Figure 14(c5). In summary, the peeling mode of PA6 is deep peeling, but there is no phenomenon of carbon fiber being pulled out, so the failure interface at this time is a mixture of PA6 and laminate contact surface and PA6 and metal mesh contact surface, which means that the failure mode at this point is interface failure. From the LSS of the welded joints, it can be seen that the Acid-etching effect of the 50°C/60 min experimental group should be intermediate between the 50°C/45 min experimental group and the 75°C/30 min experimental group, which is also reflected in the morphology of the failure interface. For the 50°C/60 min experimental group, Acid-etching weakened its surface roughness and also reduced the content of surface active chemical groups. However, the surface epoxy is still remain on the fibers in a macroscopic form and has not almost disappeared due to excessive Acid-etching as in the 75°C/30 min experimental group. Therefore, some of the epoxy debris may still accumulate with each other, leaving some areas of the laminate surface with considerable surface roughness. Moreover, it can be seen from the previous section that there are more oxygen-containing functional groups in the 50°C/60 min experimental group than in the 75°C/30 min experimental group. These reasons are coupled with each other, resulting in a better LSS of welded joints in the 50°C/60 min experimental group than in the 75°C/30 min experimental group.
Summary of the effect of acid-etching on the strength of welded joints
In this chapter, the intrinsic correlation between failure interface and failure mode was revealed. The experiments show that the 50°C/45 min experimental group exhibits optimal LSS performance, and its core advantages are reflected in the following three aspects: (i) Bonding mechanism: Surface treatment of laminates at 50°C/45 min Acid-etching parameters results in the formation of a high-roughness structure on the laminate surface, with a significant increase in the content of reactive functional groups and the surface wettability, at the same time, avoids the problem of fiber destabilization caused by excessive etching. (ii) Unique failure interfaces: CF/EP resistance-welded joints have a variety of failure interfaces. In addition to the failure interface within the laminate itself, which causes the sample failure and does not give any information about the quality of the welded joint, there are four types of failure interfaces, namely, interface between the laminate surface and the PA6, interface between the PA6 and the metal mesh, interface between the surface fibers and the laminate surface and the metal mesh itself. The failure interface of the 50°C/45 min experimental group is a mixture of all possible failure interface except the failure interface within the laminate itself. This indicates that except the failure interface within the laminate itself, all other interfaces of the welded joints are involved in the tensile process, and the interlayer strength is the strongest strength, which is a direct manifestation of the welding joint LSS is close to its limit. (iii) Parameter optimization advantages: 50°C/45 min experimental group compared to short-term experimental groups or low-temperature experimental groups (such as 50°C/15 min experimental group and 25°C/30 min experimental group): Appropriate extension of the etching time and increase the etching temperature so that the Acid-etching is more adequate.50°C/45 min experimental group compared with high- temperature experimental groups or a long period of time experimental groups (such as 75°C/30 min experimental group and 50°C/60 min experimental group): Reasonable control of etching time and etching temperature can effectively avoid the sparse arrangement of surface fibers, the decrease of surface roughness, and the loss of active chemical groups. 50°C/45 min experimental group compare with over-etching experimental groups (e.g., 100°C/30 min experimental group): The structural integrity of the fibers is retained and the risk of internal defects is eliminated.
The experimental data show that the LSS of the 50°C/45 min experimental group is 21.47 ± 1.21 MPa, which is 161% ± 14% higher than that of the untreated samples, proving that the optimal Acid- etching parameter is 50°C/45 min.
Conclusion
In this study, an Acid-etching surface treatment technology is proposed to treat CF/EP, a typical composite material commonly used in modern industry, by using inexpensive raw materials and simple process steps, without relying on specialised large-scale equipment, which improves the surface properties of CF/EP, enhances its bonding strength with thermoplastic resins, and ultimately achieves high-quality resistance welding of CF/EP. Compared with traditional surface treatment technologies such as laser etching, plasma treatment, high-precision mechanical grinding and chemical mechanical activation, the Acid-etching surface treatment technology proposed in this study, although slightly lagging behind in terms of treatment efficiency (the aforementioned technologies generally require only a few minutes of treatment time),but possesses an incomparable advantage in terms of treatment cost. Compared with other chemical surface treatment methods such as ozone treatment or fluoridation treatment, Acid-etching surface treatment technology does not require strict preparation of the experimental environment or the introduction of additional equipment (such as ultraviolet light sources or plasma treatment devices), and thus has significant advantages in terms of treatment efficiency and treatment cost.
The results show that after treating the CF/EP surface with concentrated sulfuric acid at 45°C for 30 minutes, the roughness and wettability of the CF/EP surface and the content of chemically active groups in CF/EP were significantly improved, and high-quality resistance welding between CF/EP and thermoplastic resin (PA6) was achieved. At the same time, due to the relatively mild acid etching conditions (treated at 50°C for 45 minutes), the concentrated sulfuric acid used in the acid etching surface treatment technology proposed in this research does not cause dangerous phenomena such as boiling or splashing, nor does it cause deformation of the PTFE tape, thereby avoiding acid penetration into unexpected areas. In addition, the mild acid etching conditions allow the laminate to maintain its structural integrity after acid etching surface treatment, without damaging the laminate itself or affecting the overall structural strength, thus enabling high-quality resistance welding of carbon fiber/epoxy resin (CF/EP). However, the method used in this research still has certain limitations, such as the treatment of waste liquid obtained after acid-etching and the safety design for operators.
This research and its results provide a low-cost and easily replicable approach to welding thermosetting composites using thermoplastic resins. This approach makes it possible to weld other non-thermoplastic materials using thermoplastic materials, greatly expanding the application areas of thermoplastic materials. The acid-etching surface treatment technology proposed in this research has obvious advantages in terms of cost and ease of operation compared with other surface treatment technologies. However, if it is to be applied in industrial production and manufacturing, further consideration of environmental friendliness and operational safety is still needed based on this research.
Footnotes
Declaration of conflicting interests
The author(s) declared no potential conflicts of interest with respect to the research, authorship, and/or publication of this article.
Funding
The author(s) disclosed receipt of the following financial support for the research, authorship, and/or publication of this article: this work was supported by the Shenyang Aerospace University.