
Abstract
Researchers are actively exploring sustainable alternatives to conventional materials through the development of biopolymer nanocomposites (NCs). In this study, blend NCs of polyvinyl alcohol (PVA) and Maranta arundinacea starch, reinforced with lithium silver oxide (LiAgO) nanoparticles (NPs), were synthesised using water as a green solvent. The successful incorporation of LiAgO into the polymer matrix was confirmed by Fourier-transform infrared (FTIR) spectroscopy and X-ray diffraction (XRD), which revealed characteristic peaks of the nanoparticles. UV-visible spectroscopy showed enhanced optical absorbance with increasing LiAgO concentration, with the 9 wt% nanocomposite showing optimal performance, including the lowest bandgap and highest refractive index. Scanning electron microscopy (SEM) revealed uniform nanoparticle dispersion at 9 wt%, whereas higher concentrations led to agglomeration. Thermal analysis showed improved thermal stability in NCs with the inclusion of LiAgO compared to a pure polymer blend. Impedance analysis showed that NCs exhibited improved electrical conductivity and dielectric properties, with 9 wt% nanocomposite achieving the highest AC conductivity of 1.4 × 10⁻⁶ S/cm at 110°C. Mechanical testing further confirmed that the 9 wt% nanocomposite demonstrated significant improvements in tensile strength, Young’s modulus and surface hardness, accompanied by reduced elongation at break. Antibacterial assay against Escherichia coli showed increasing antimicrobial efficacy with higher NP content, with the 12 wt% NC displaying the largest inhibition zone. These findings underscore the potential of PVA/ Maranta arundinacea starch /LiAgO NCs as biodegradable, multifunctional materials for optoelectronic and antibacterial applications.
Keywords
Introduction
Biopolymer nanocomposites exhibit enhanced properties and have diverse applications, including food packaging,1,2 optoelectronics, 3 wastewater treatment4,5 and so forth. These materials are favored for their biocompatibility, environmental sustainability, low toxicity, abundant availability, and regenerative properties.6–8 However, their overall strength, barrier qualities, and other physical features are often limited. A common strategy to enhance their functionality involves incorporating nano-dimensional particles into the polymer blend matrix to improve their overall performance. 9
Polyvinyl alcohol (PVA) is a synthetic biodegradable polymer, ideal for bio-nanocomposite synthesis due to its durability, biocompatibility, transparency, barrier properties, mechanical strength, and water solubility.10,11 Arrowroot, scientifically known as Maranta arundinacea starch, is a naturally occurring polymer with valuable functional properties. It is widely used in various applications due to its biodegradability, non-toxicity, and excellent film-forming ability. The presence of amylose in the starch facilitates the formation of rigid films through hydrogen bonding between the linear chains. Consequently, the addition of Maranta arundinacea starch enhances biocompatibility and provides an eco-friendly alternative to purely synthetic materials. 12 Blends of PVA and Maranta arundinacea starch present a promising opportunity for the development of new biodegradable materials with broad applications across various industries. 13 However, the compatibility between PVA and Maranta arundinacea starch may be limited due to differences in their hydrophilicity and molecular structure, potentially affecting the uniformity and performance of the blend. To overcome this limitation, nanofillers are introduced into the blend matrix. 14
The incorporation of nanofillers into the polymer matrix can enhance the interfacial adhesion between components, acting as a bridge to improve mechanical properties and overall compatibility. Among various inorganic fillers, metal oxides and metal NPs are widely considered due to their excellent electrical conductivity15,16 and antibacterial properties.17,18 Metal-doped metal oxide NP is a special class of hybrid nanomaterials that possess combined properties of both metal and metal oxide. Lithium silver oxide NPs, in particular, are a less explored filler with potential for various applications. Thimmaiah et al 19 reported that the incorporation of LiAgO in the sodium alginate polymer increased the electrical and dielectric properties to a considerable extent, suggesting its potential application in microelectronics.
Recent studies have indicated that NCs derived from PVA, Maranta arundinacea starch and their different blends are commonly used for eco-friendly and electronic applications. Azad and his co-workers synthesised blend NCs of poly (vinyl butyral)-PVA with varying concentrations of stearic acid-manganese oxide nanoflowers. 20 These NCs were employed as an adsorbents for the removal of heavy metal ions from the aqueous solution, where 6 wt% filler loading demonstrating enhanced performance. El-Mahalawy et al 21 demonstrated that Ni-doped PVA/PVP blend films are effective for sensing, limiting, waveguiding and optical filtering applications. The membranes synthesized from polyhydroxyalkanoate and Maranta arundinacea were developed and characterized by Wu et al. 22 This material exhibits excellent mechanical and antioxidant properties, along with enhanced cytocompatibility with human foreskin fibroblasts.
To the best of our knowledge, no studies have reported on PVA/ Maranta arundinacea starch blend incorporated with LiAgO NPs. Previous works have focused on individual properties without integrating multifunctionalities into the system. This work addresses this gap by incorporating LiAgO nanoparticles to enhance the mechanical, thermal, optical, electrical and antibacterial properties of the blend achieved through optimized filler dispersion and polymer-nanoparticle interactions. The primary objectives of our research include the hydrothermal synthesize of LiAgO NPs and the ecofriendly fabrication of PVA/ maranta arundinacea starch biopolymer blend NCs using water as the solvent. We intend to examine the effects of nanofillers on the surface of the polymer matrix using various spectroscopic and microscopic techniques. Additionally, the thermal stability, electrical and dielectric properties of the blend will be analyzed. The antibacterial properties of the films will also be evaluated, with the ultimate goal of developing biodegradable packaging materials.
Materials and methods
Materials
PVA (molecular weight ∼160000 g/mol), lithium nitrate (LiNO3), silver nitrate (AgNO3) and sodium hydroxide (NaOH) were procured from Nice Chemicals. Maranta arundinacea starch was obtained from the market and used as received, without purification.
Synthesis of LiAgO nanoparticles
Synthesis of LiAgO NPs was carried out by a low-temperature hydrothermal method. For this, LiNO3 and AgNO3 were dissolved in water at a 1:1 stoichiometric ratio. The entire mixture was continuously stirred for 2 h to achieve a uniform solution. Afterward, 22 mL of NaOH solution was introduced gradually to adjust the pH to 12 while maintaining constant agitation. The resulting precipitate was transferred to a Teflon-lined steel autoclave, sealed, and preheated in a hot air oven at 60°C overnight, followed by a hydrothermal reaction at 140°C for 12 h. The precipitate was then collected and washed with acetone and distilled water until a neutral pH was reached. Finally, it was dried for 24h at 60°C and stored in an airtight vial for subsequent use.
Preparation of biopolymer blend nanocomposite films
Pure PVA/ maranta arundinacea starch/LiAgO (abbreviated as PM/LiAgO) nanocomposite films were prepared using the film-casting method. A 50:50 blend of PVA and Maranta arundinacea starch was developed by dissolving both materials in water, used as an environmental friendly solvent. To the resulting homogeneous solution, different concentrations of LiAgO NPs (0, 3, 6, 9 and 12 wt%) were added, followed by ultrasonication for 10 min and magnetic stirring for 1 h to ensure uniform dispersion. The resultant solution was slowly poured onto 150 mm diameter petri plates and allowed to dry at 60°C for 24 h. The fully dried nanocomposite films with an approximate thickness of 0.15 mm were peeled-off from the petri dishes and stored in vacuum desiccators for later use. The different compositions of PVA- maranta arundinacea and LiAgO sample nomenclature was updated as: PVA-maranta arundinacea pure blend (PM), while the nanoparticle-filled blends were designated as PM/3% LiAgO, PM/6% LiAgO, PM/9% LiAgO, and PM/12% LiAgO, corresponding to 3, 6, 9, and 12 wt% of NPs, respectively. The proposed interaction mechanism between PVA, maranta arundinacea starch and LiAgO is illustrated in Scheme 1. Interaction mechanism of PVA/ maranta arundinacea /LiAgO nanocomposites.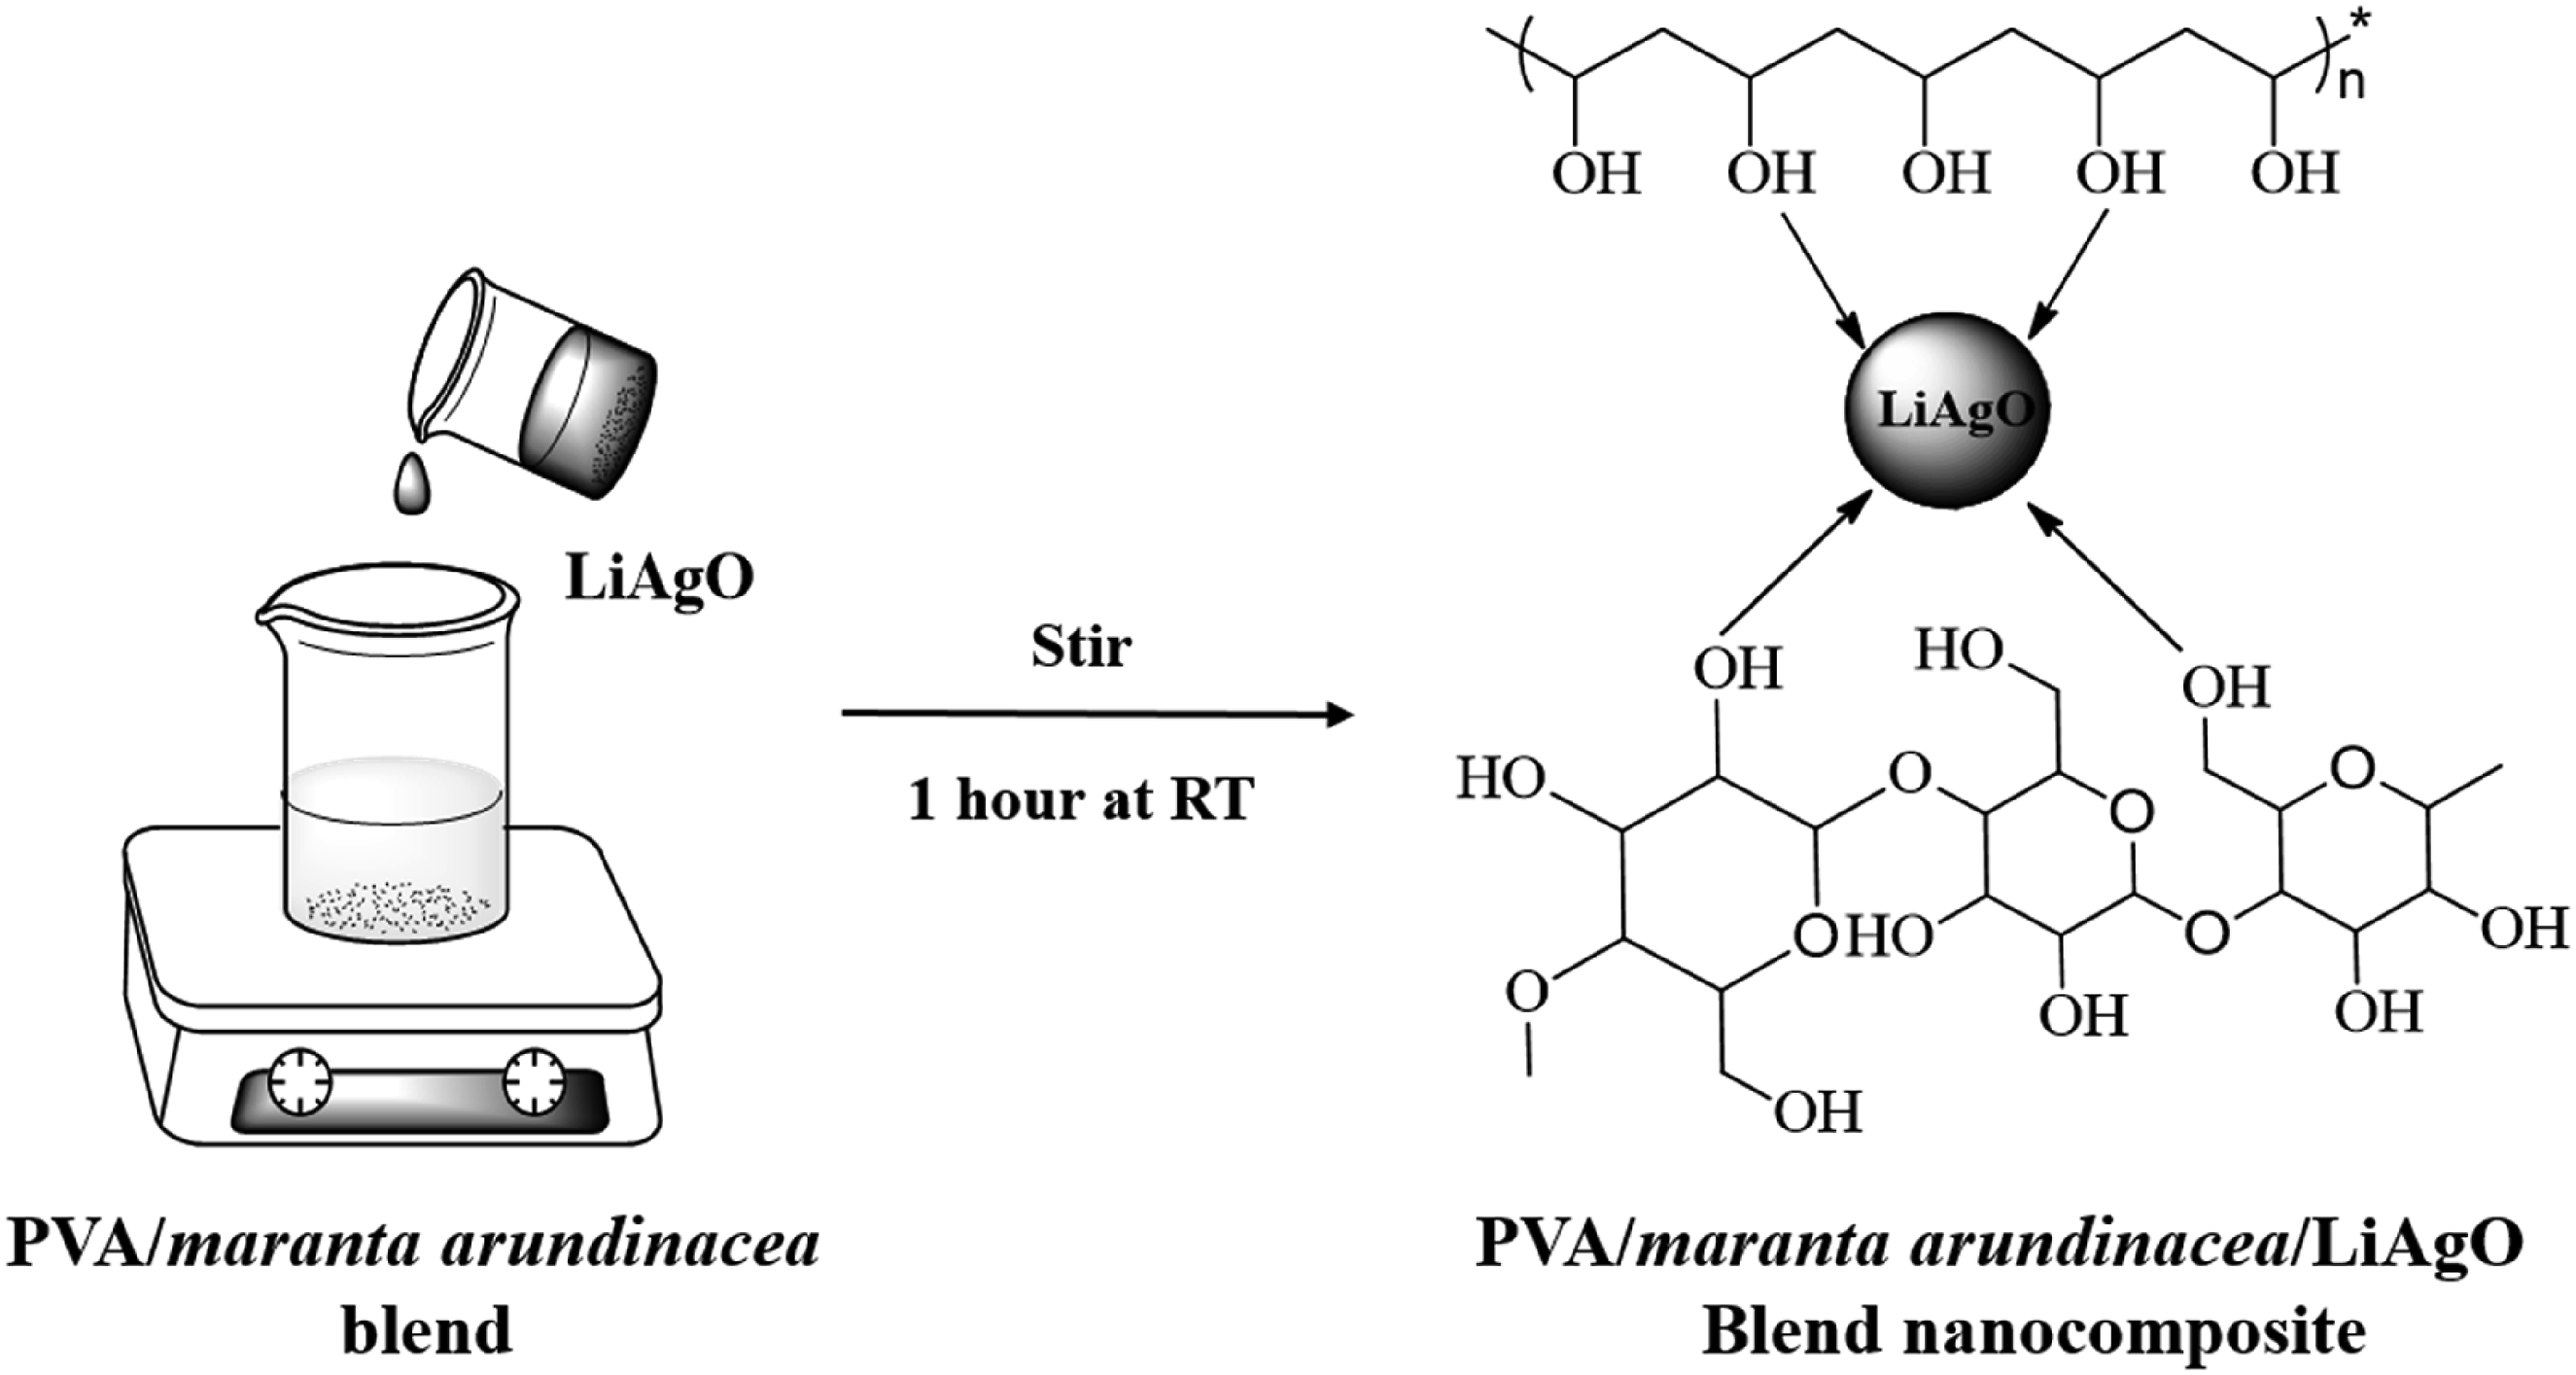
Characterization
Fourier Transform Infrared (FTIR) spectra of film samples were taken using the spectrophotometer of the model JASCO-4100 in the range 400–4000 cm−1. The Cary 5000 is a high-performance UV-visible spectrophotometer used to record the absorbance of the NCs. X-ray diffraction (XRD) analysis was done using a powder X-ray diffractometer (Model X’Pert3). The films are scanned over a Bragg angle range of 5° to 90° under Cu-K⍺ radiation (1.5406°) at a rate of 2°/min. Surface morphological features of prepared films are studied using scanning electron microscopy (Model Jeol 6390 LA). Thermal degradation of NCs in the temperature region from 30 to 750°C was evaluated by Perkin Elmer STA 8000 at a heating speed of 10°C/min under inert flow. The AC conductivity and dielectric characteristics were measured using a precision impedance analyzer (model HIOKI 3570). The elongation at break, Young’s modulus and tensile force were tested using the universal testing machine, Instron, according to ASTM D-882. A crosshead speed of 40 mm/min was used to stretch the film strips. A minimum of six components of each film were measured after a 1-week storage period to ensure reliable results. The hardness of the film was determined using a Shore A durometer. Antibacterial assay of the sample was conducted against Escherichia coli by the disc diffusion method.
Results and discussion
Fourier transform infrared spectroscopy (FT-IR)
Figure 1(a) shows the transmittance spectra of pure PVA, Maranta arundinacea starch (MA) and PVA/MA blend (PM). The FTIR spectra of PVA exhibit characteristic absorption bands corresponding to major functional groups. A broad band in the region of 3500-3000 cm−1 is attributed to O-H stretching vibrations and the peak at 1660 cm−1 arises from the C = O stretching of acetate groups in PVA. Additionally, a band observed at 1410 cm−1 corresponds to O-H bending vibrations of hydroxyl groups.
23
The FTIR spectrum of MA starch reveals several characteristic vibrational modes. A broad absorption band between 3000 and 3500 cm−1 corresponds to overlapping O-H stretching vibrations from intra and intermolecular OH groups. The peak at 1655 cm−1 arises from O-H bending vibrations of water molecules and distinct bands at 1152 cm−1 and 1081 cm−1 are assigned to C-O/C-C stretching and C-O-H bending modes, respectively. The band at 862 cm−1 reflects the hydrophilic character of starch.
24
FTIR spectra of (a) PVA, Maranta arundinacea (MA) and PM (b) PM, LiAgO, and PM/LiAgO blend NCs.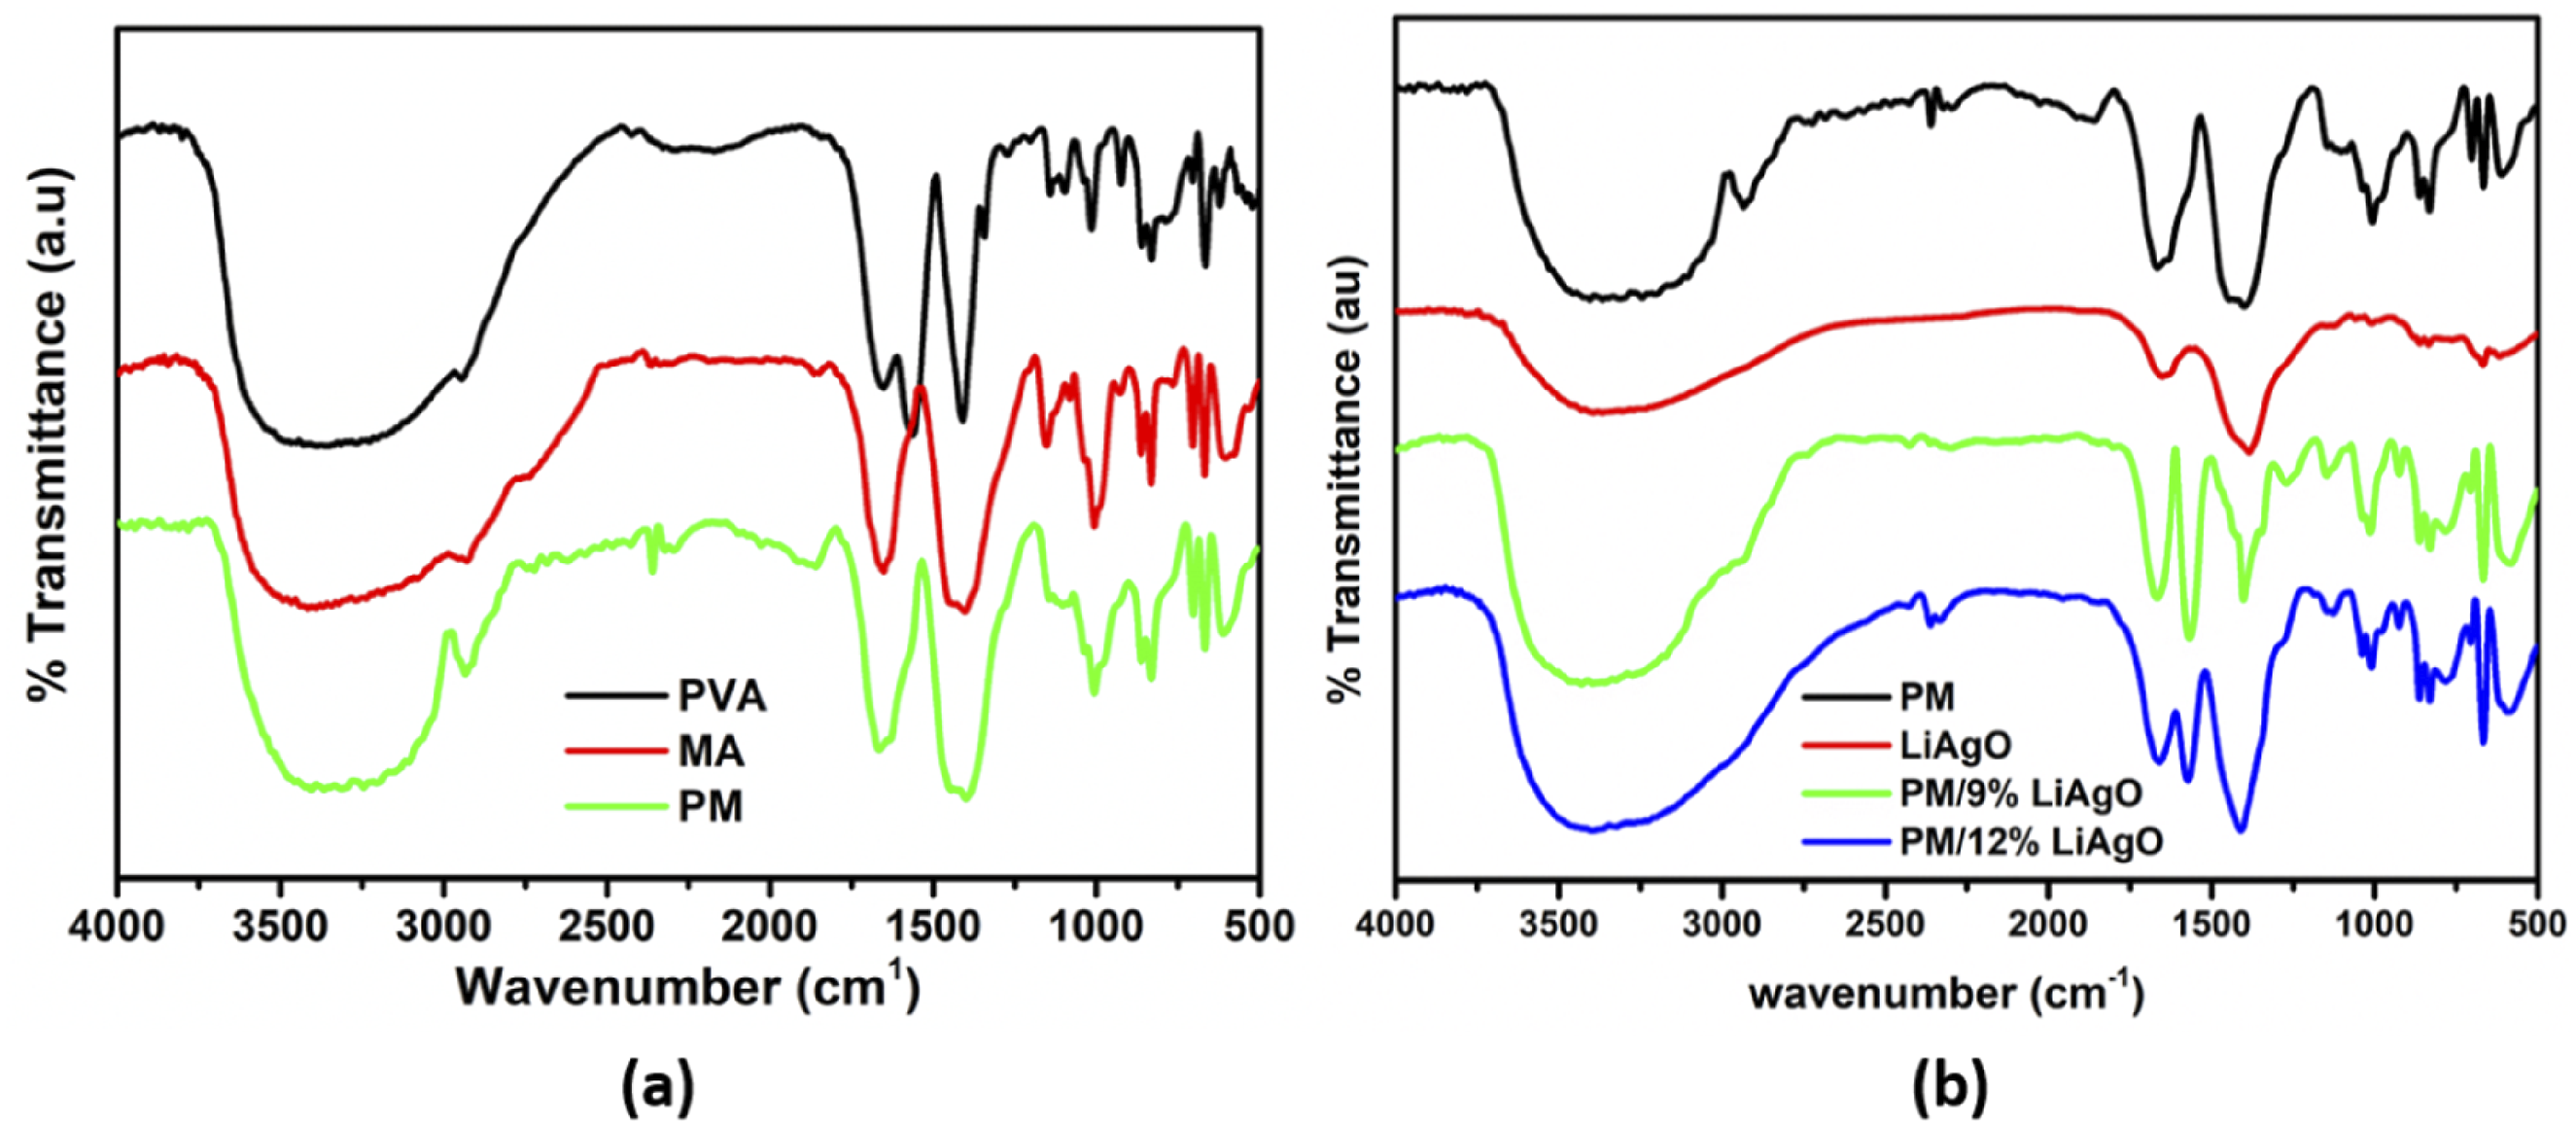
Figure 1(b) shows the FTIR spectra of PM, LiAgO, PM/9% LiAgO and PM/12% LiAgO
The spectra of PM/9% LiAgO and PM/12% LiAgO exhibit features that combine the characteristic peaks of both PM and LiAgO, with slight shifts indicating the interaction between the nanoparticle and the polymer blend segments. A new absorption band appearing at 599 cm−1 in the nanocomposite spectra corresponds to the metal-oxygen vibration of LiAgO. It provides strong evidence for the successful incorporation and reinforcement of LiAgO within the PM matrix. The consistent presence of characteristic peaks associated with the PM matrix across all samples indicates that the fundamental polymer blend structure remains intact, despite the addition of LiAgO.
X-Ray diffraction (XRD)
The XRD patterns in Figure 2 show the diffraction intensity as a function of the 2θ angle for PM, LiAgO, PM/9% LiAgO, and PM/12% LiAgO. The broad peak in the XRD pattern of PM around 20° suggests that the PM sample is amorphous or has a low degree of crystallinity. Maranta arundinacea starch is a natural carbohydrate with a crystallinity of approximately 20%. Heating the maranta arundinacea starch solution during film preparation causes the granules to swell and gelatinize. This process disrupts the starch’s crystalline structure, forming an amorphous structure.
25
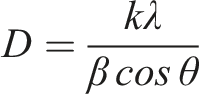
The sharp and well-defined peaks for LiAgO indicate that it is highly crystalline. The crystallite size of LiAgO, synthesized via the hydrothermal method, was determined using the Scherrer equation and measured to be 27 nm. XRD patterns of PM, LiAgO, and PM/LiAgO blend NCs.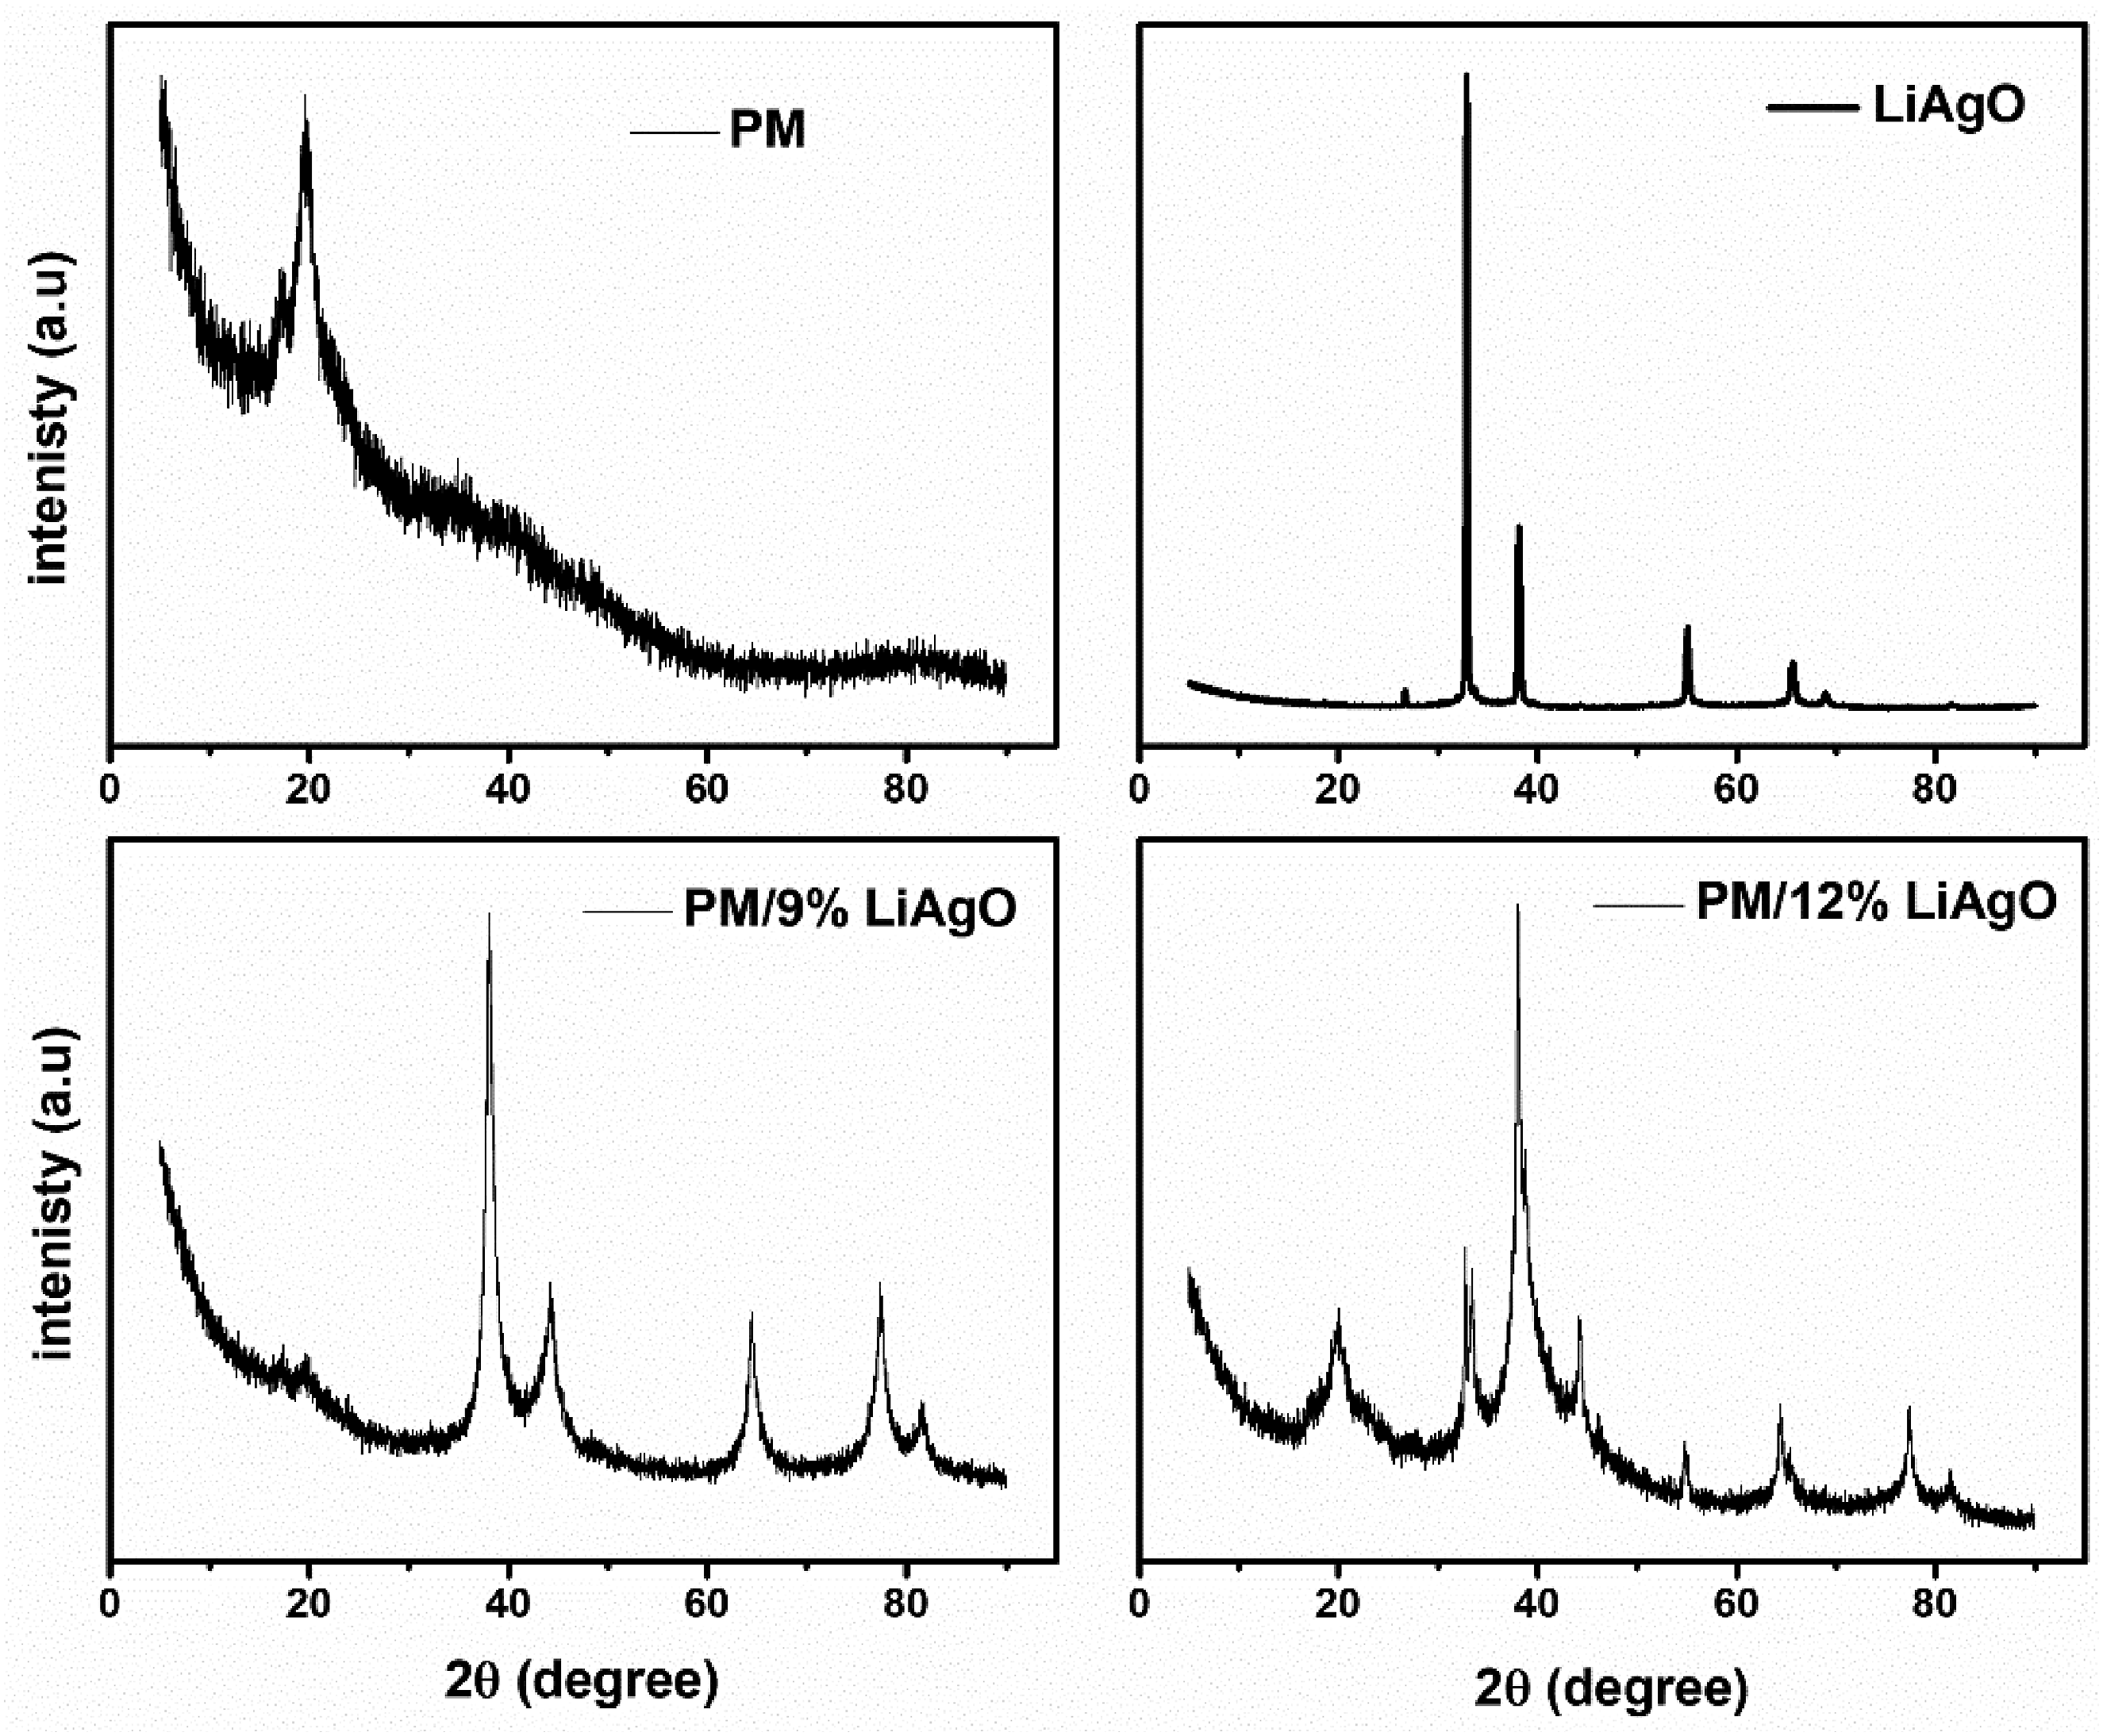
The XRD patterns observed for PM/9% LiAgO and PM/12% LiAgO blend NCs show a combination of features from both PM and LiAgO. The presence of sharp peaks indicates the incorporation of crystalline LiAgO into the PM matrix. The broad amorphous peak is still present but with decreased intensity, indicating the reduced amorphous character of the PM matrix upon the incorporation of nanofiller.
UV-Vis spectroscopy
Figure 3 shows the UV-Vis absorbance spectrum for PM, PM/3% LiAgO, PM/6% LiAgO, PM/9% LiAgO, and PM/12% LiAgO. PM blend exhibits a peak at around 260 nm, which may be due to the π-π* and n- π* transitions. The figure clearly shows that as the concentration of LiAgO increases, the absorbance intensity also increases, reaching an optimum at a 9 wt% concentration in the PM/9% LiAgO nanocomposite. This is attributed to the uniform dispersion of the nanofiller at this concentration, resulting in efficient charge transfer by maximum blend-filler interactions and enhanced optical properties. However, beyond this optimum concentration, the absorbance decreases, likely due to the agglomeration of the nanofiller, which reduces its effective interaction with the polymer matrix. This can be attributed to the stronger filler-filler interactions compared to polymer-filler interactions, which enhance scattering rather than absorbing incident photons, thereby reducing absorbance. UV-Vis spectra of PM and PM/LiAgO blend NCs.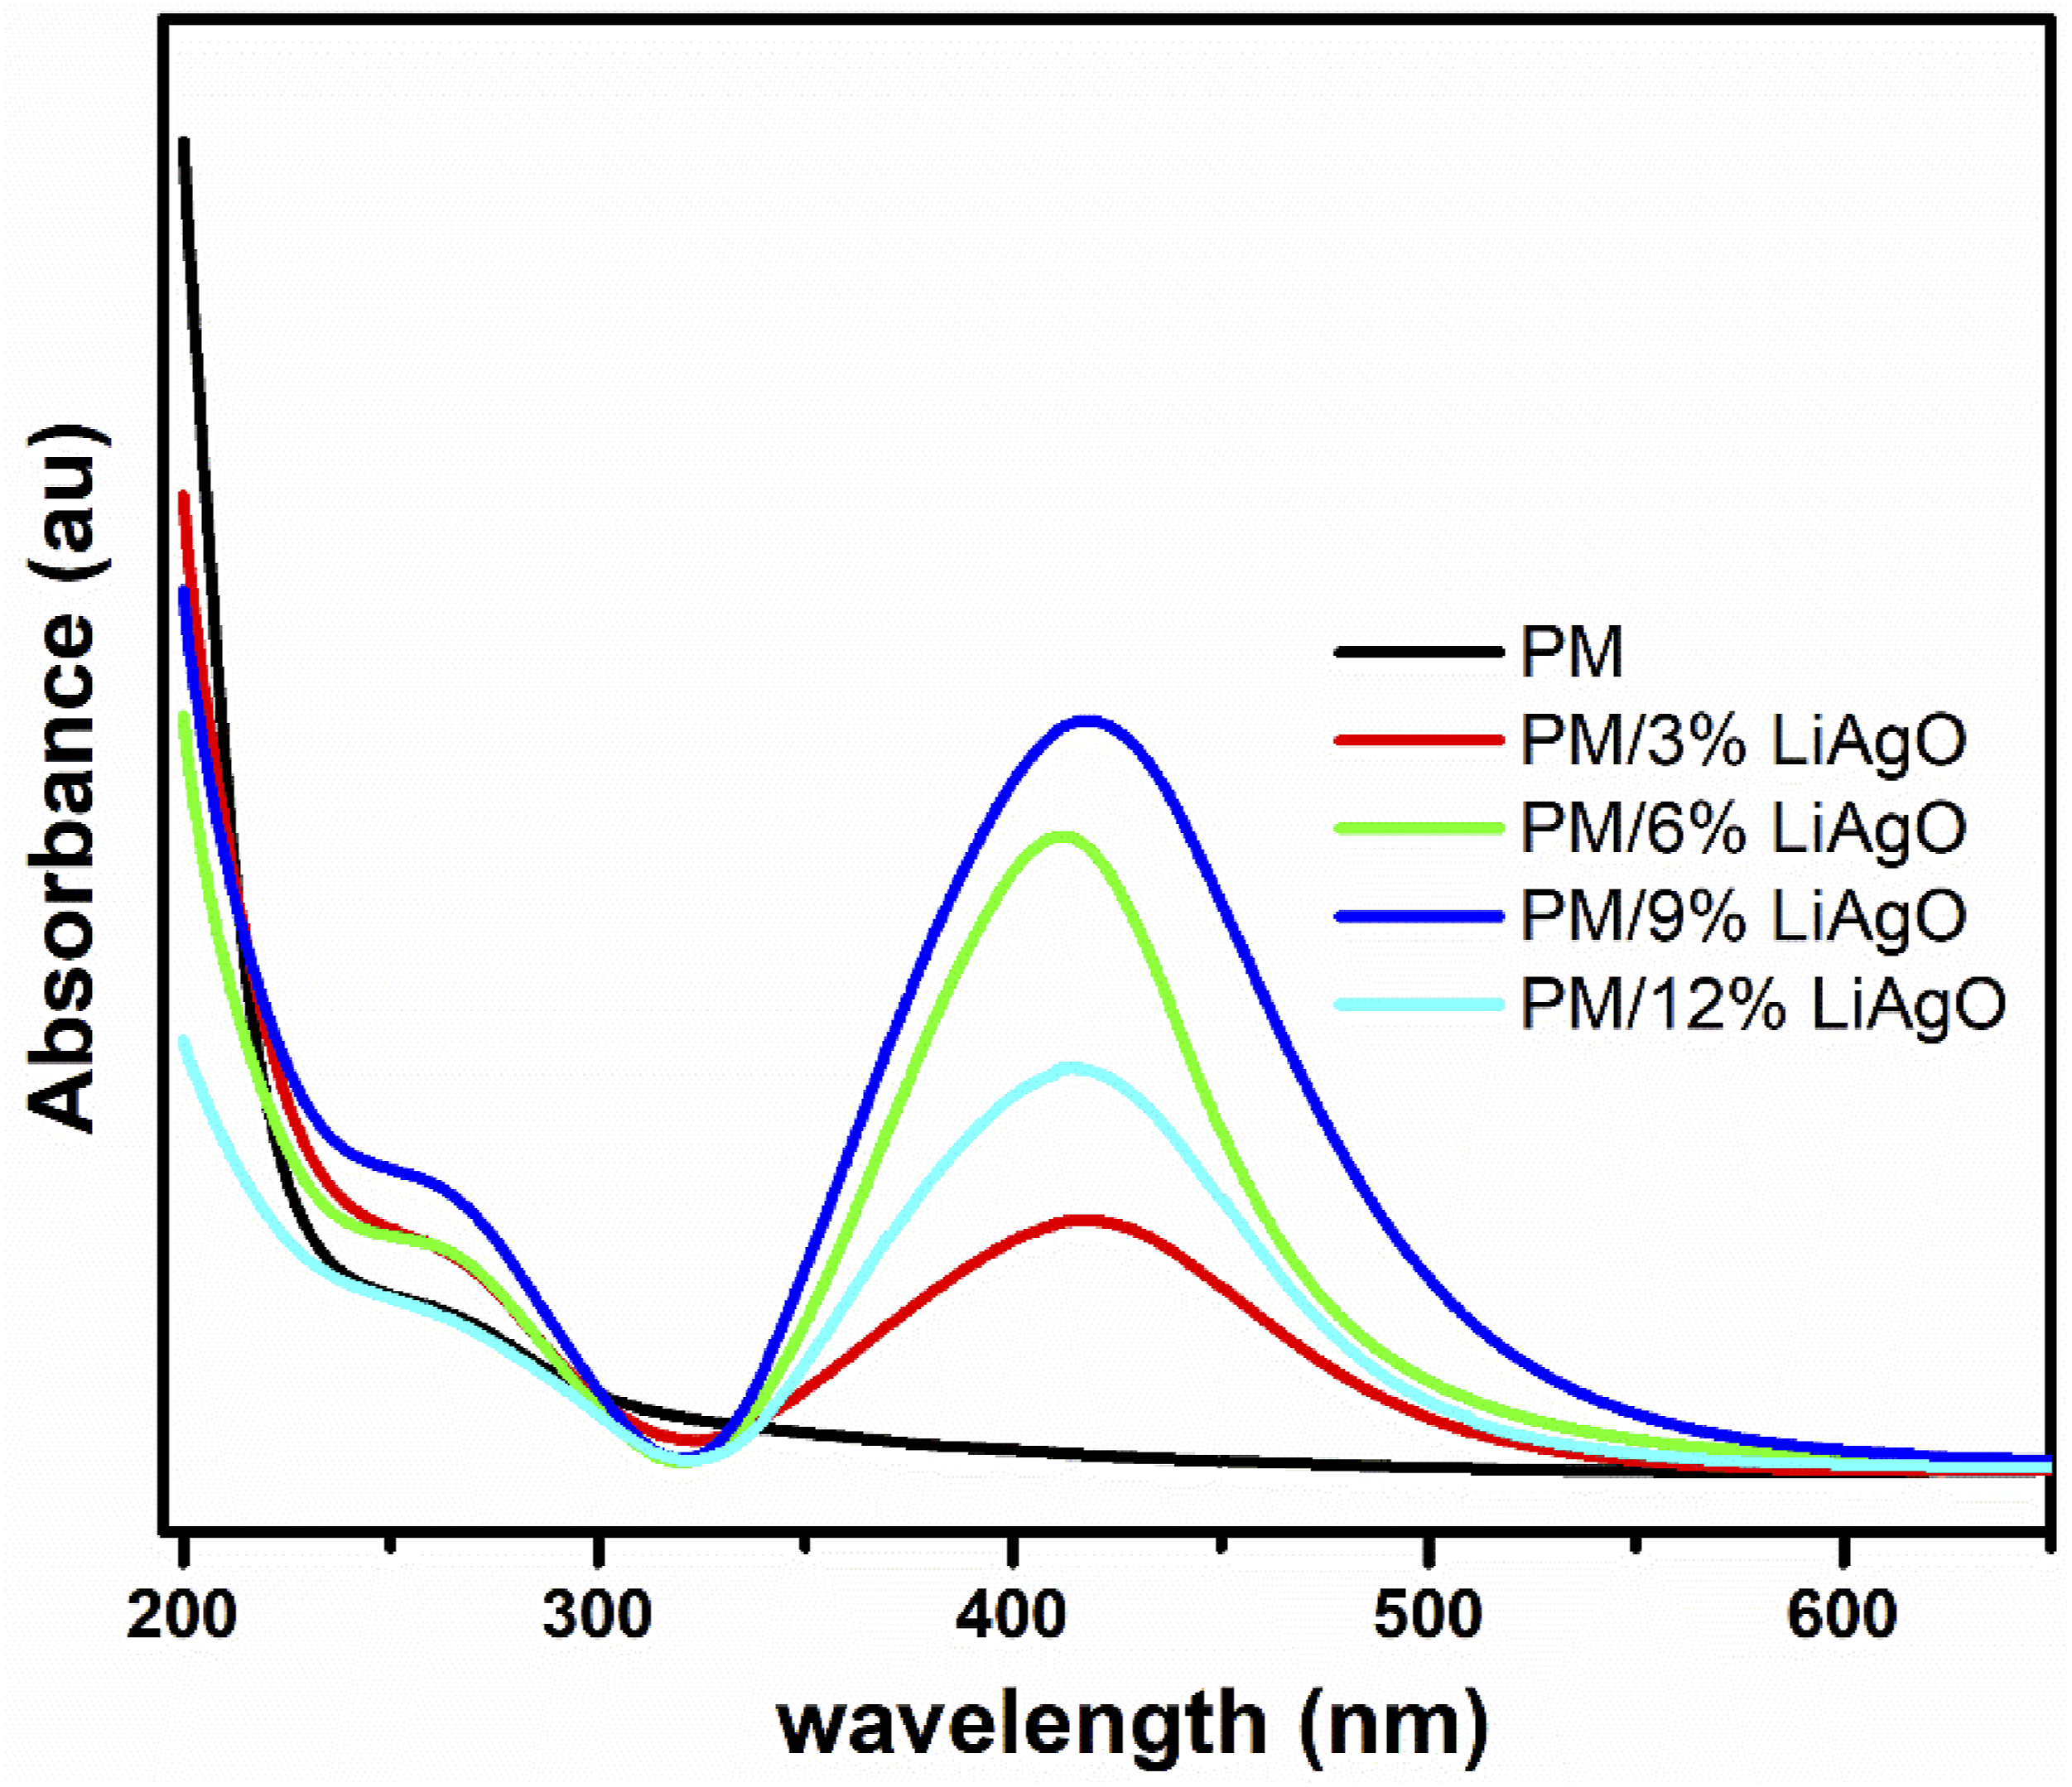
Optical bandgap energy
The optical bandgap, a key property of semiconductors and insulators, defines the energy gap between the valence and conduction bands. It is a crucial parameter in determining the optical and electronic properties of a material. In Figure 4, the optical bandgap is determined using Tauc plots, which are graphs of (αℎc/λ)2 versus photon energy (hυ), where h is Planck’s constant, α is the absorption coefficient and λ is the wavelength of the incident photon.26,27 The optical bandgap energies for PM, PM/3% LiAgO, PM/6% LiAgO, PM/9% LiAgO and PM/12% LiAgO are 5.84, 5.63, 5.43, 5.35, and 5.51 eV, respectively. It is evident that the optical bandgap energy of PM/LiAgO blend NCs is lower than that of PM. Increasing NP incorporation reduces the bandgap energy from PM/3% LiAgO to PM/9% LiAgO, due to enhanced conduction and improved charge carrier mobility. For PM/12% LiAgO, the increased bandgap energy indicates the energy needed for electron transitions, the key to its optical and electronic behavior. Optical bandgap energies of PM and PM/LiAgO blend NCs.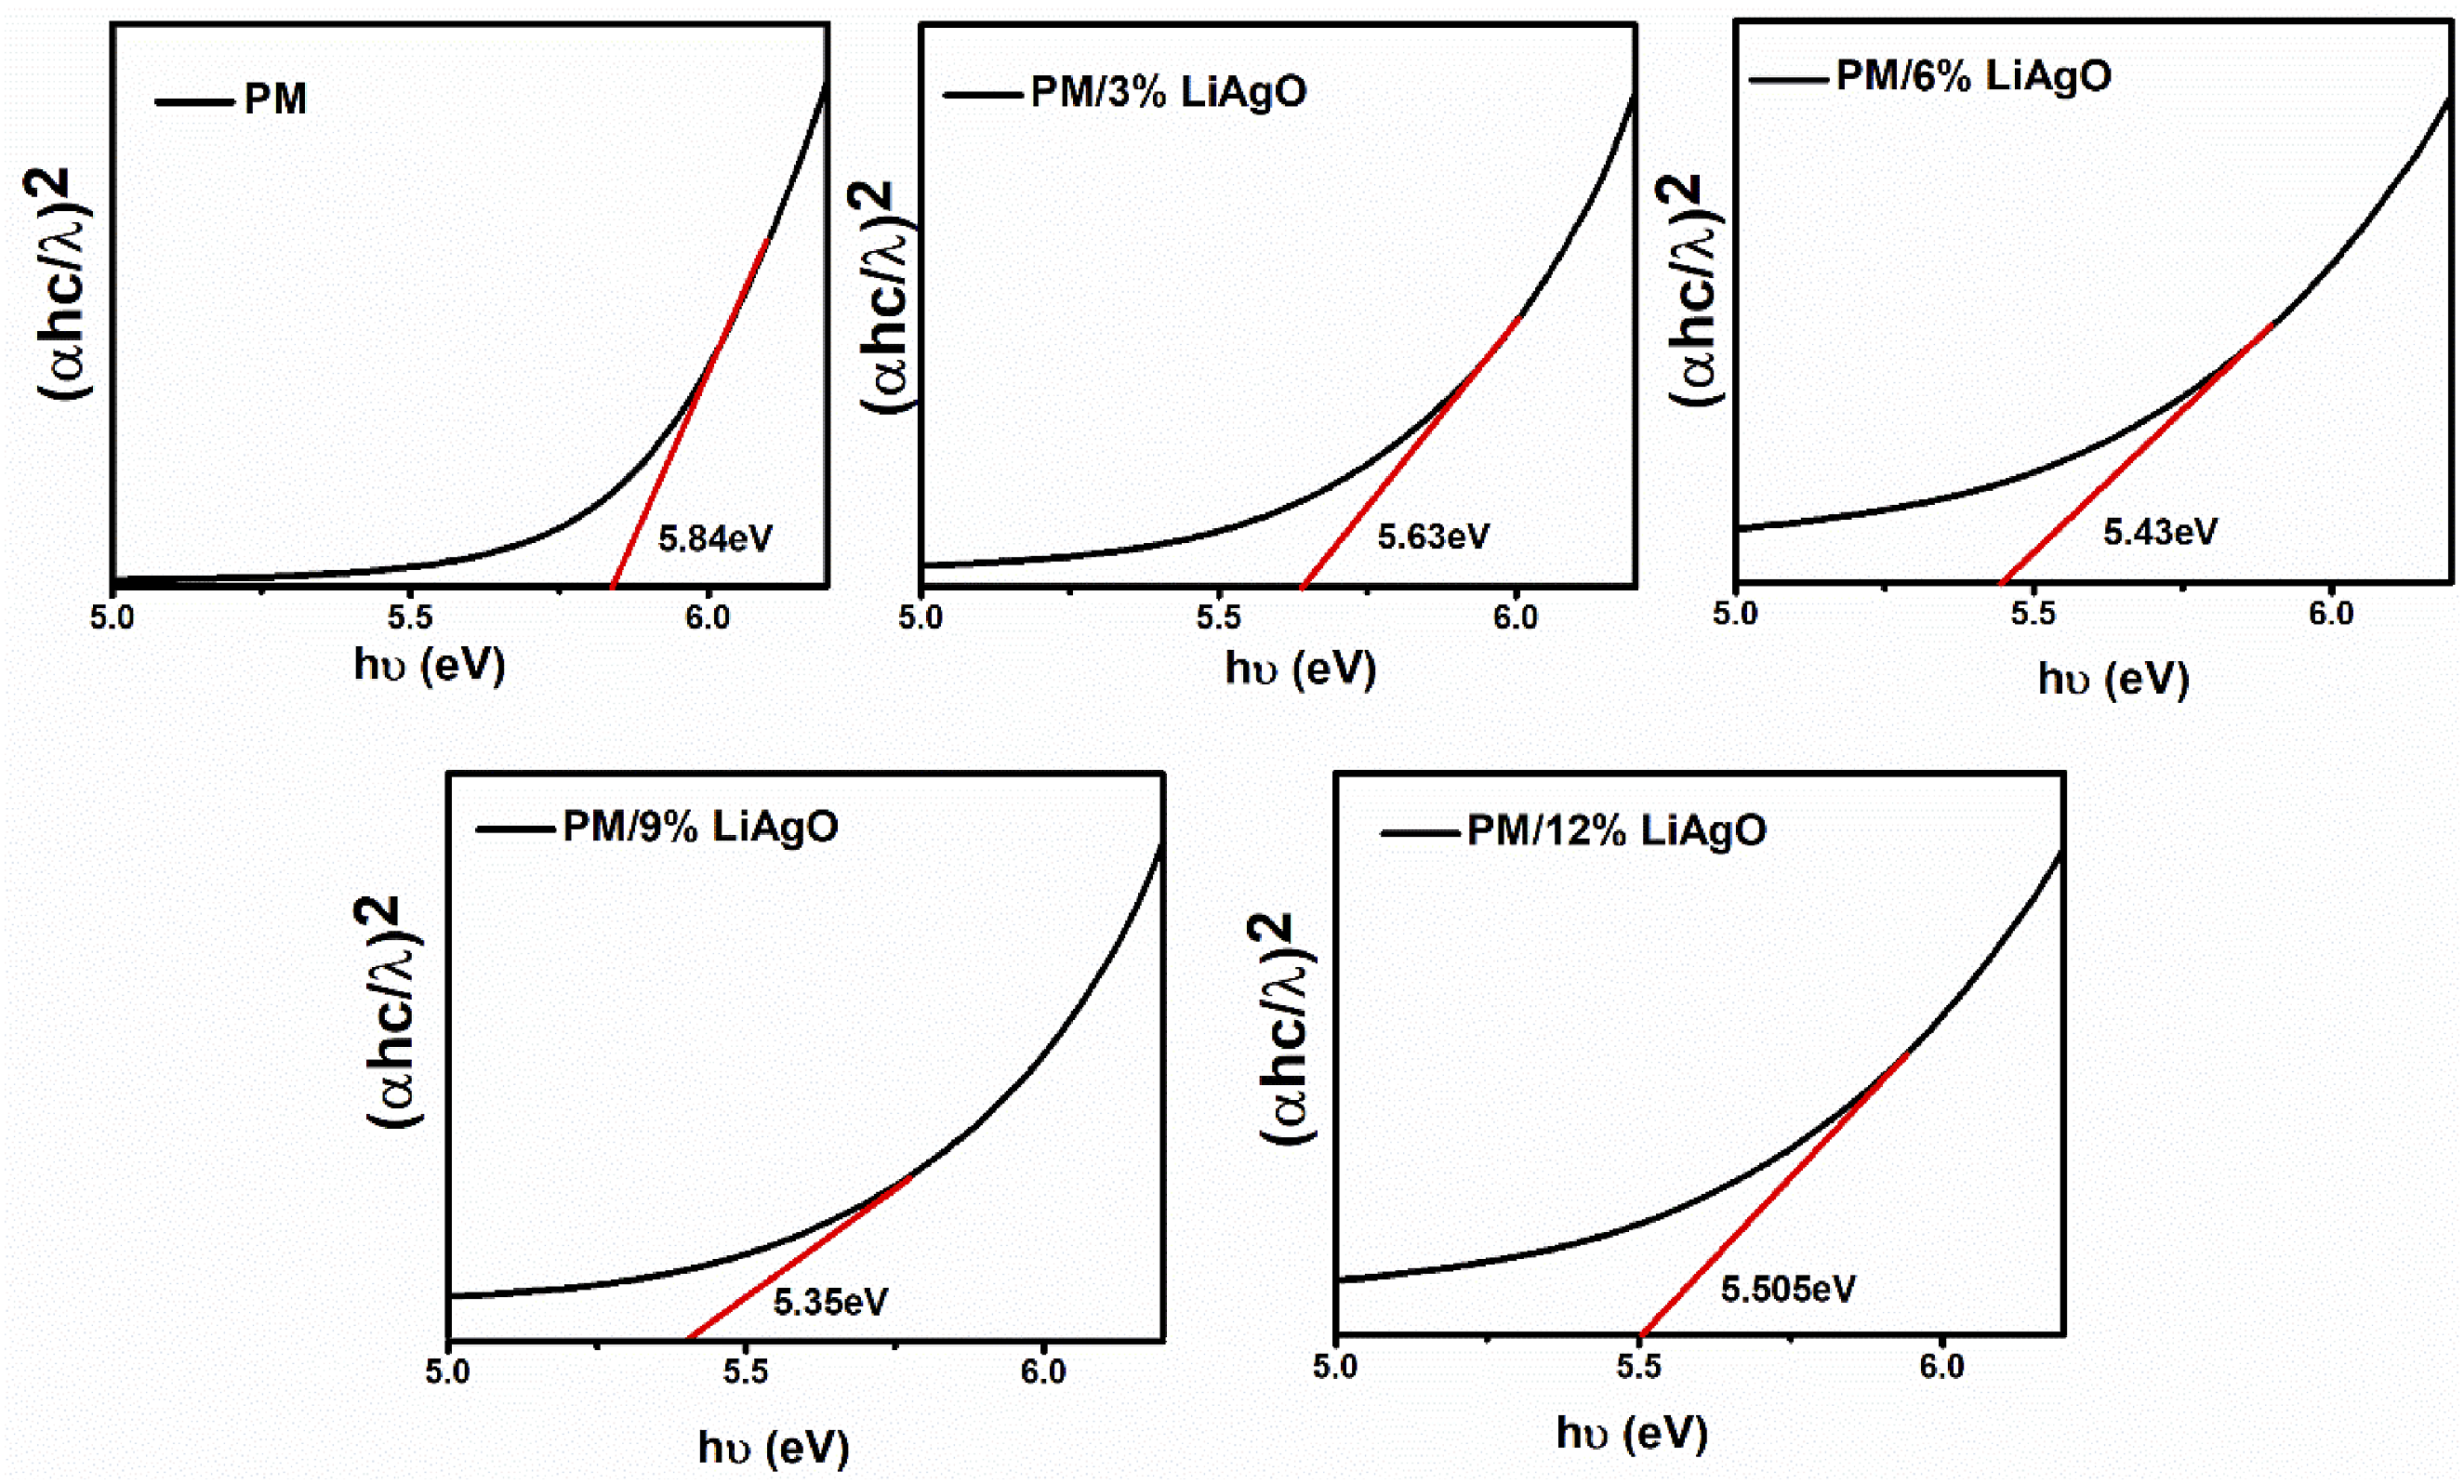
Optical bandgap energy versus refractive index
The refractive index (n) of the prepared blend nanocomposite has been calculated using the given equation:
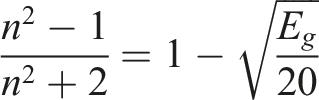
It is evident from Figure 5 that Eg and n exhibit an inverse relationship with filler loading. As the filler loading goes from 0 to 12%, the bandgap energy decreases while the refractive index increases from 1.88 to 1.95. Adding more filler makes the material more conductive to electrons thereby decreasing the bandgap energy, and increasing the refractive index.
28
Optical bandgap energy VS refractive index.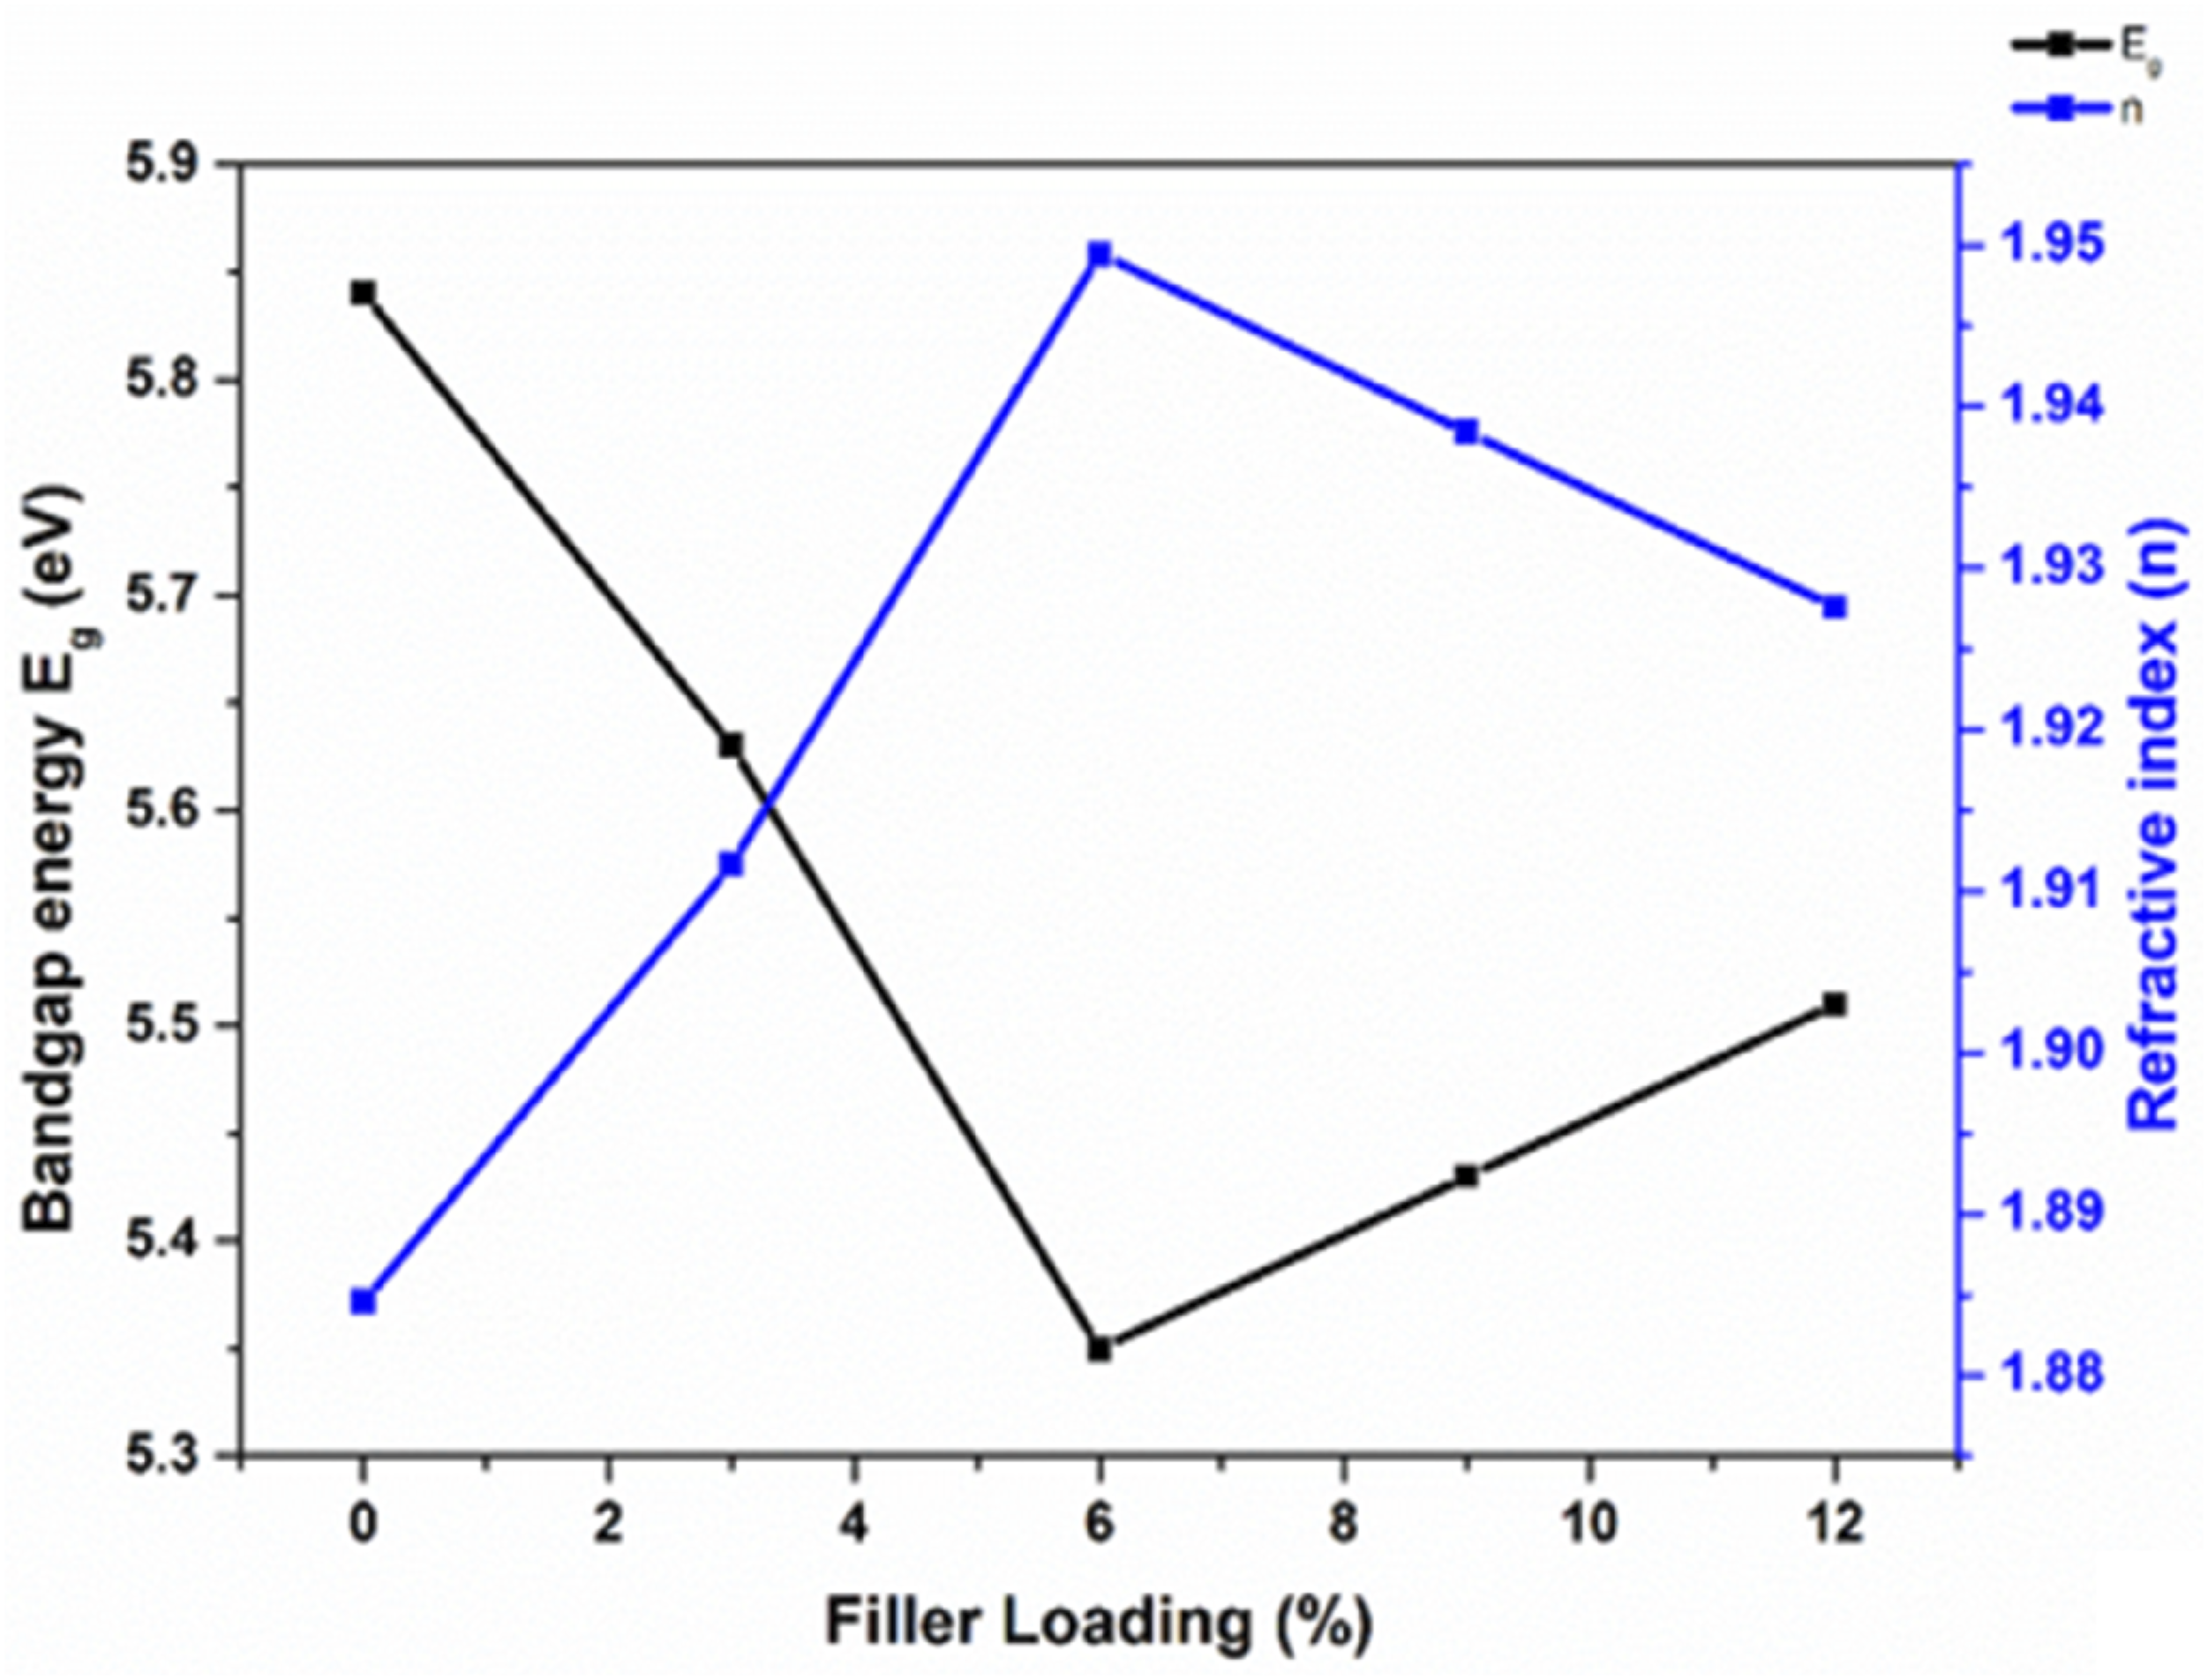
Scanning electron microscope (SEM)
Figure 6 depicts the SEM micrographs of PM, PM/3% LiAgO, PM/9% LiAgO and PM/12% LiAgO labelled as (a), (b), (c), and (d), respectively. PM blend shows a relatively smooth surface with some layered structures and cracks. As the concentration of nanoparticles increases, significant changes in the surface morphology of the PM blend become evident. PM/3% LiAgO displays a more granular texture with clusters of small particles. The surface of PM/9% LiAgO exhibits a similar texture to PM/3% LiAgO but with a more uniform distribution of particles in the PM matrix. Beyond this point, as seen in PM/12% LiAgO, the formation of large aggregated particles leads to a rough surface texture in the polymer blend nanocomposite. SEM images of PM and PM/LiAgO blend NCs.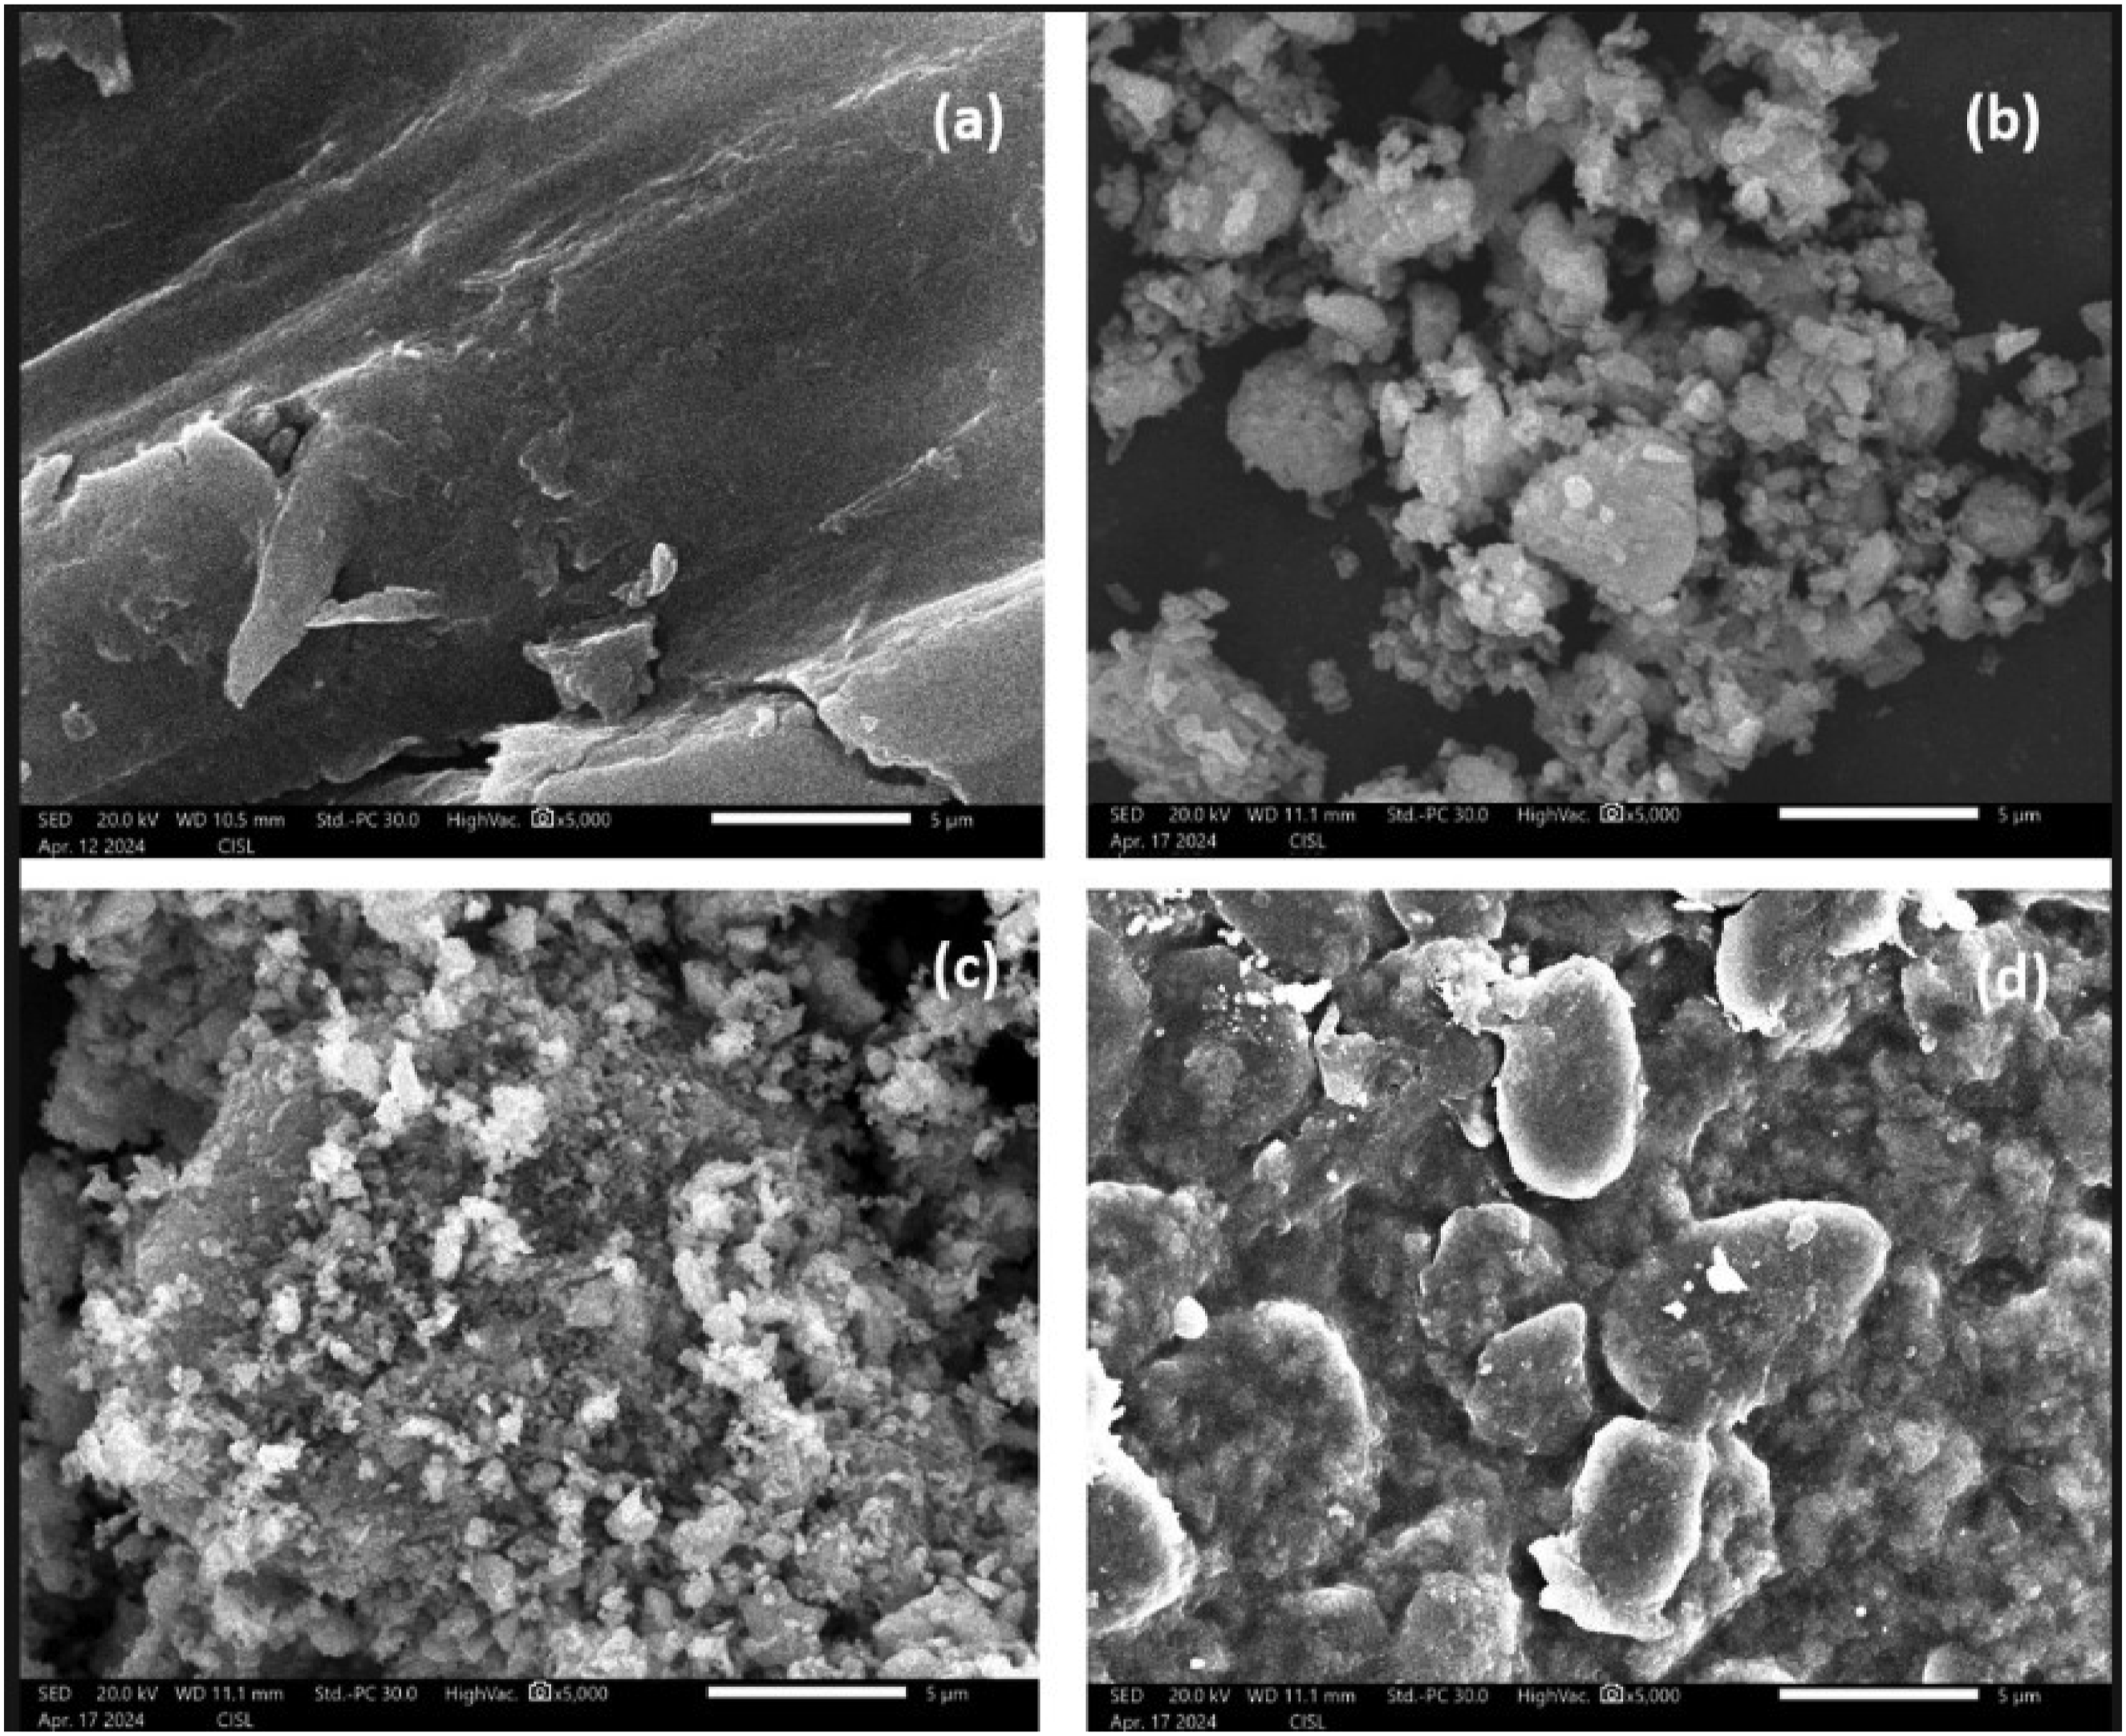
Thermal stability
Figure 7 shows the TG curves of the pure PM blend and its NCs. For each film material, the curves illustrating the three-stage degradation process are observed. The initial weight loss, approximately 12%, occurred from 55 to 175°C, likely due to the evaporation of absorbed moisture. The second and most significant weight loss, which appeared between 215 and 347°C, can be attributed to the removal of starch molecules.
29
The third weight loss, occurring above 395°C, is attributed to the residual decomposition reactions of the carbonaceous matter. The decomposition trends moved to higher temperatures as the concentration of LiAgO increased. At 500°C, the pure blend sample showed a weight loss of 8.22 %, while the sample containing 12% LiAgO showed a weight loss of 20.27%. The prevention of loss through pyrolysis or volatilization results from increased blend NCs retention. Furthermore, the residue amount increased proportionally with higher nanofiller loadings. The pure PM blend degrades most at 246°C, while the blend with 6, 9 and 12 wt% NCs degrades at 262, 267 and 282°C, respectively. The results clearly demonstrate that the incorporation of LiAgO significantly influences the degradation rate of the blend films and improves their thermal stability. The LiAgO NPs can inhibit the thermal motion of the molecular chains in the blend matrix, elevating its thermal decomposition energy barrier and thus enhancing the thermal resistance of PM/LiAgO.
30
Thermal decomposition of PM and LiAgO reinforced blend NCs.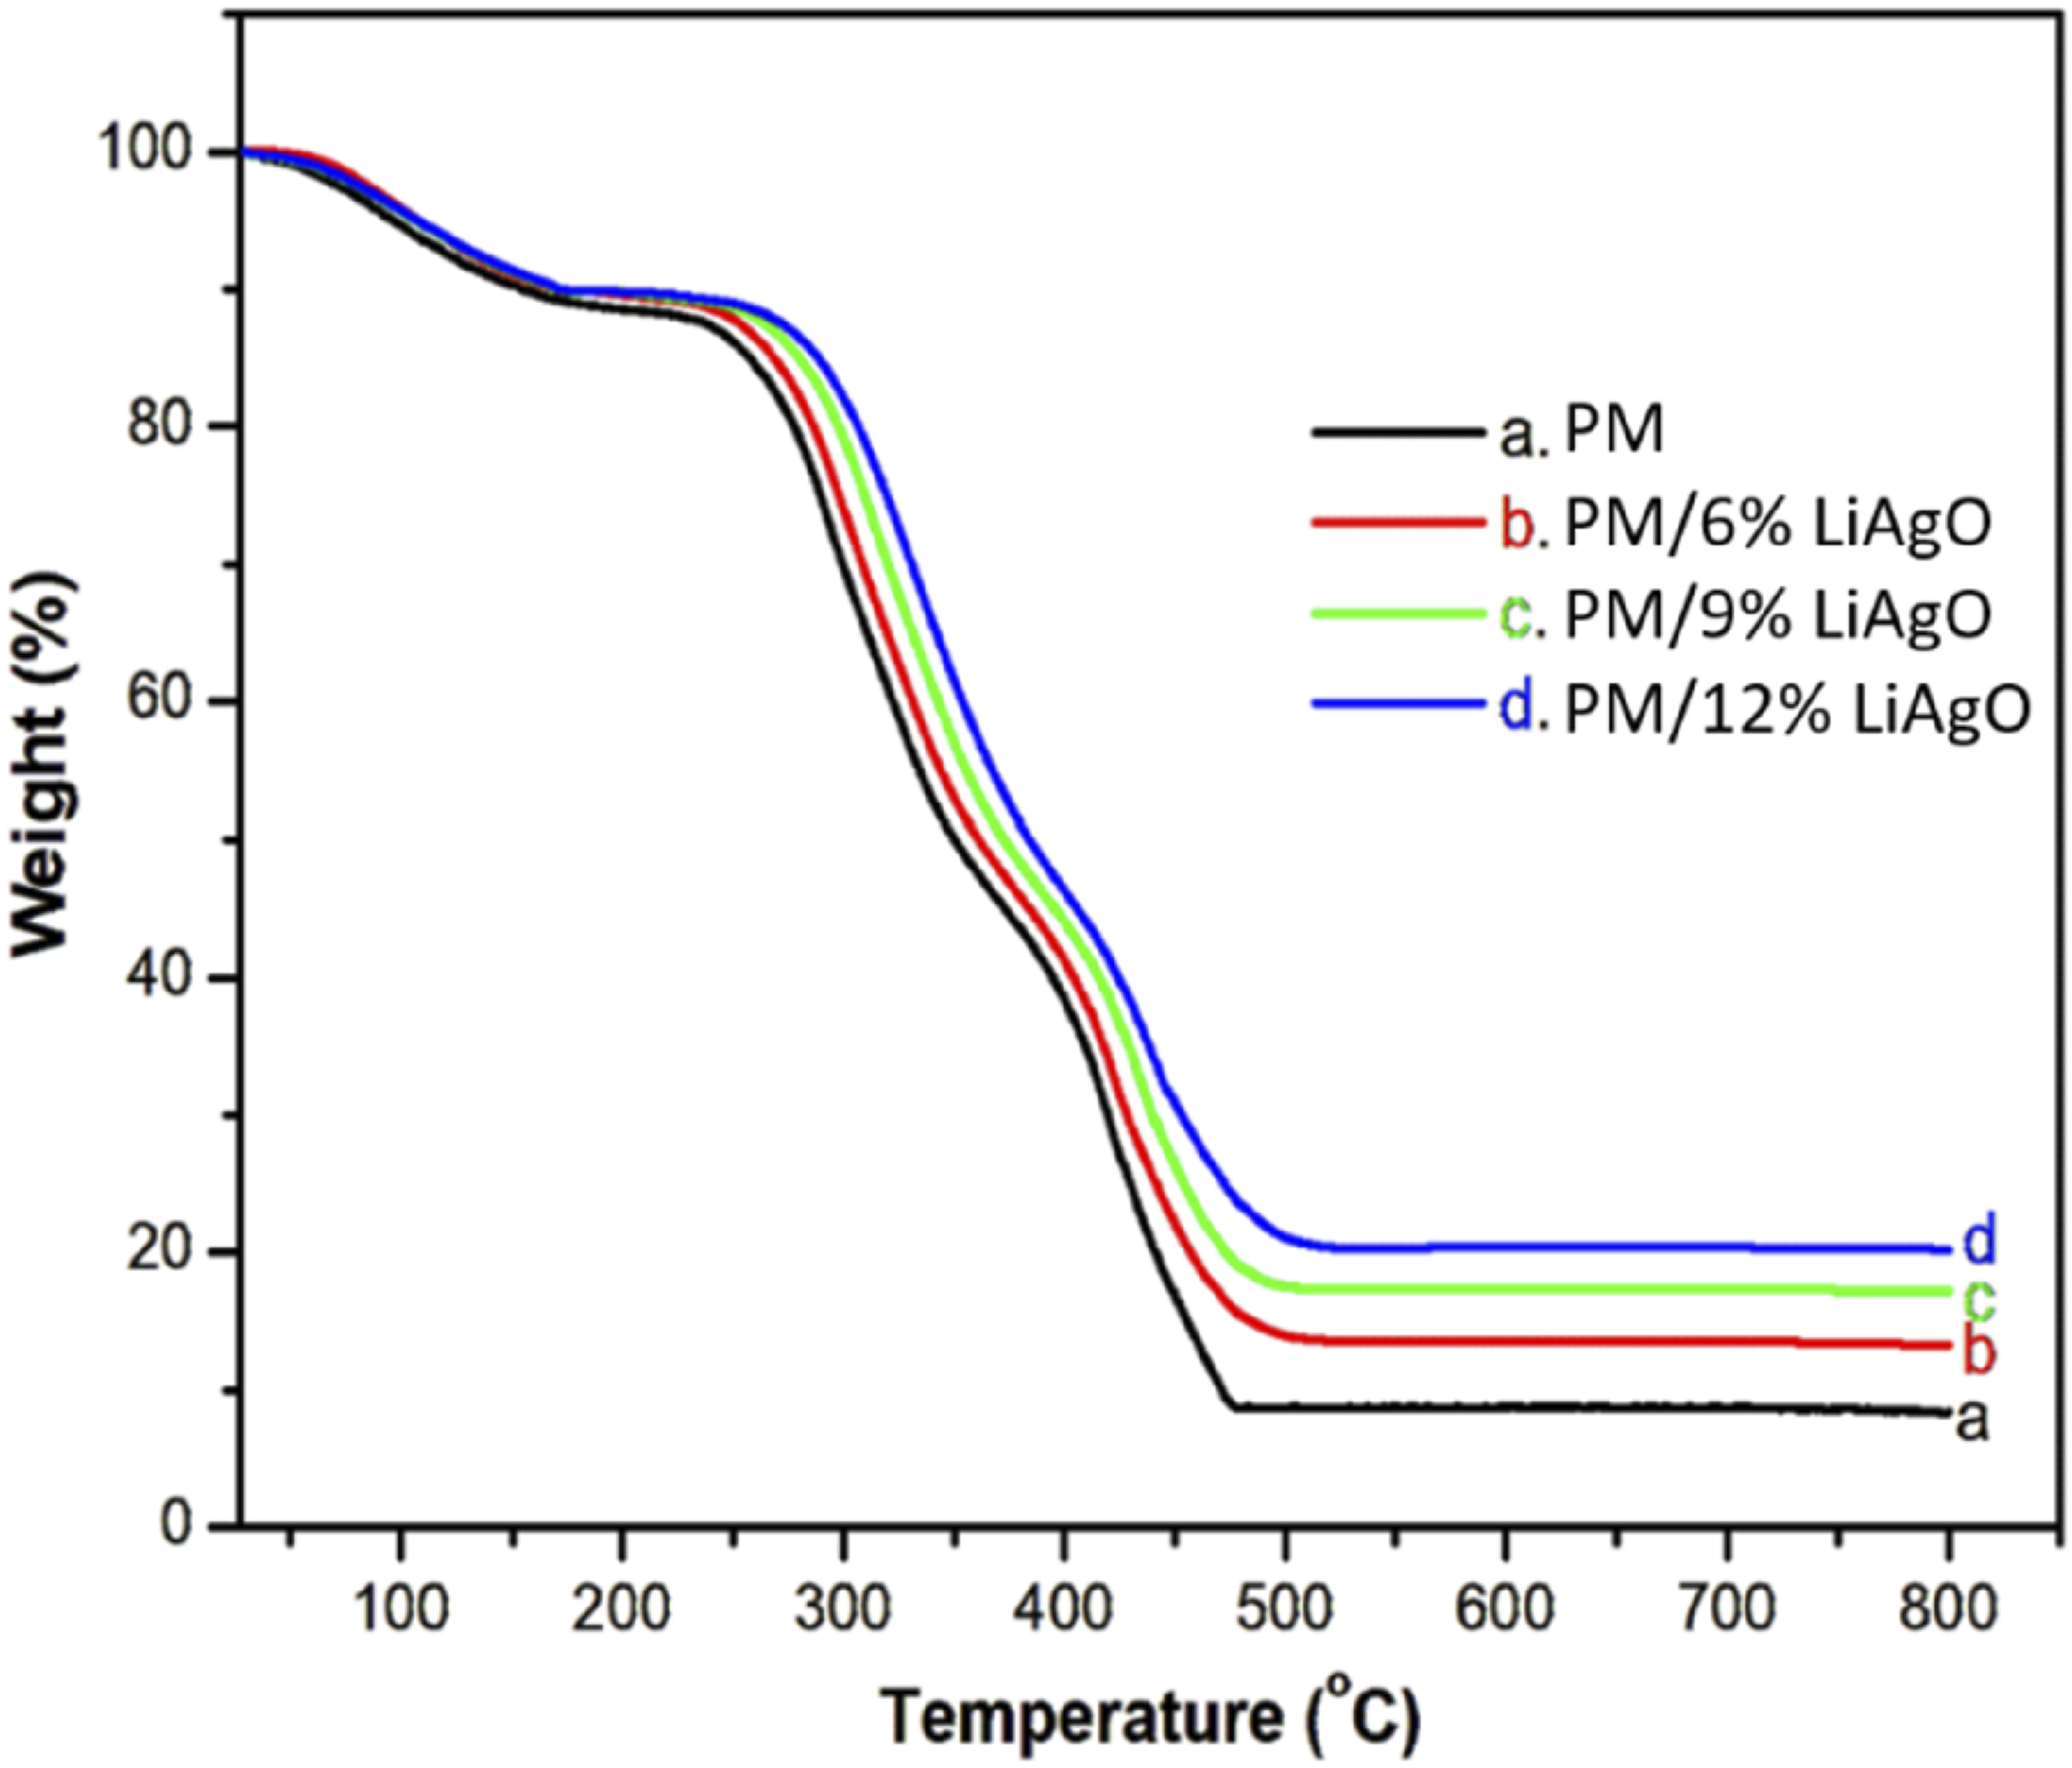
AC Conductivity
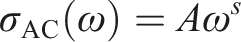
AC conductivity, or alternating current conductivity, refers to the ability of a component to conduct an electric current when an alternating voltage is applied. It is a measure of how easily electrons can move through a compound under the influence of an alternating current. AC conductivity (σAC) is known to vary with frequency (ω) and can be described by the power law: AC conductivity of PM and PM/LiAgO blend NCs at room temperature.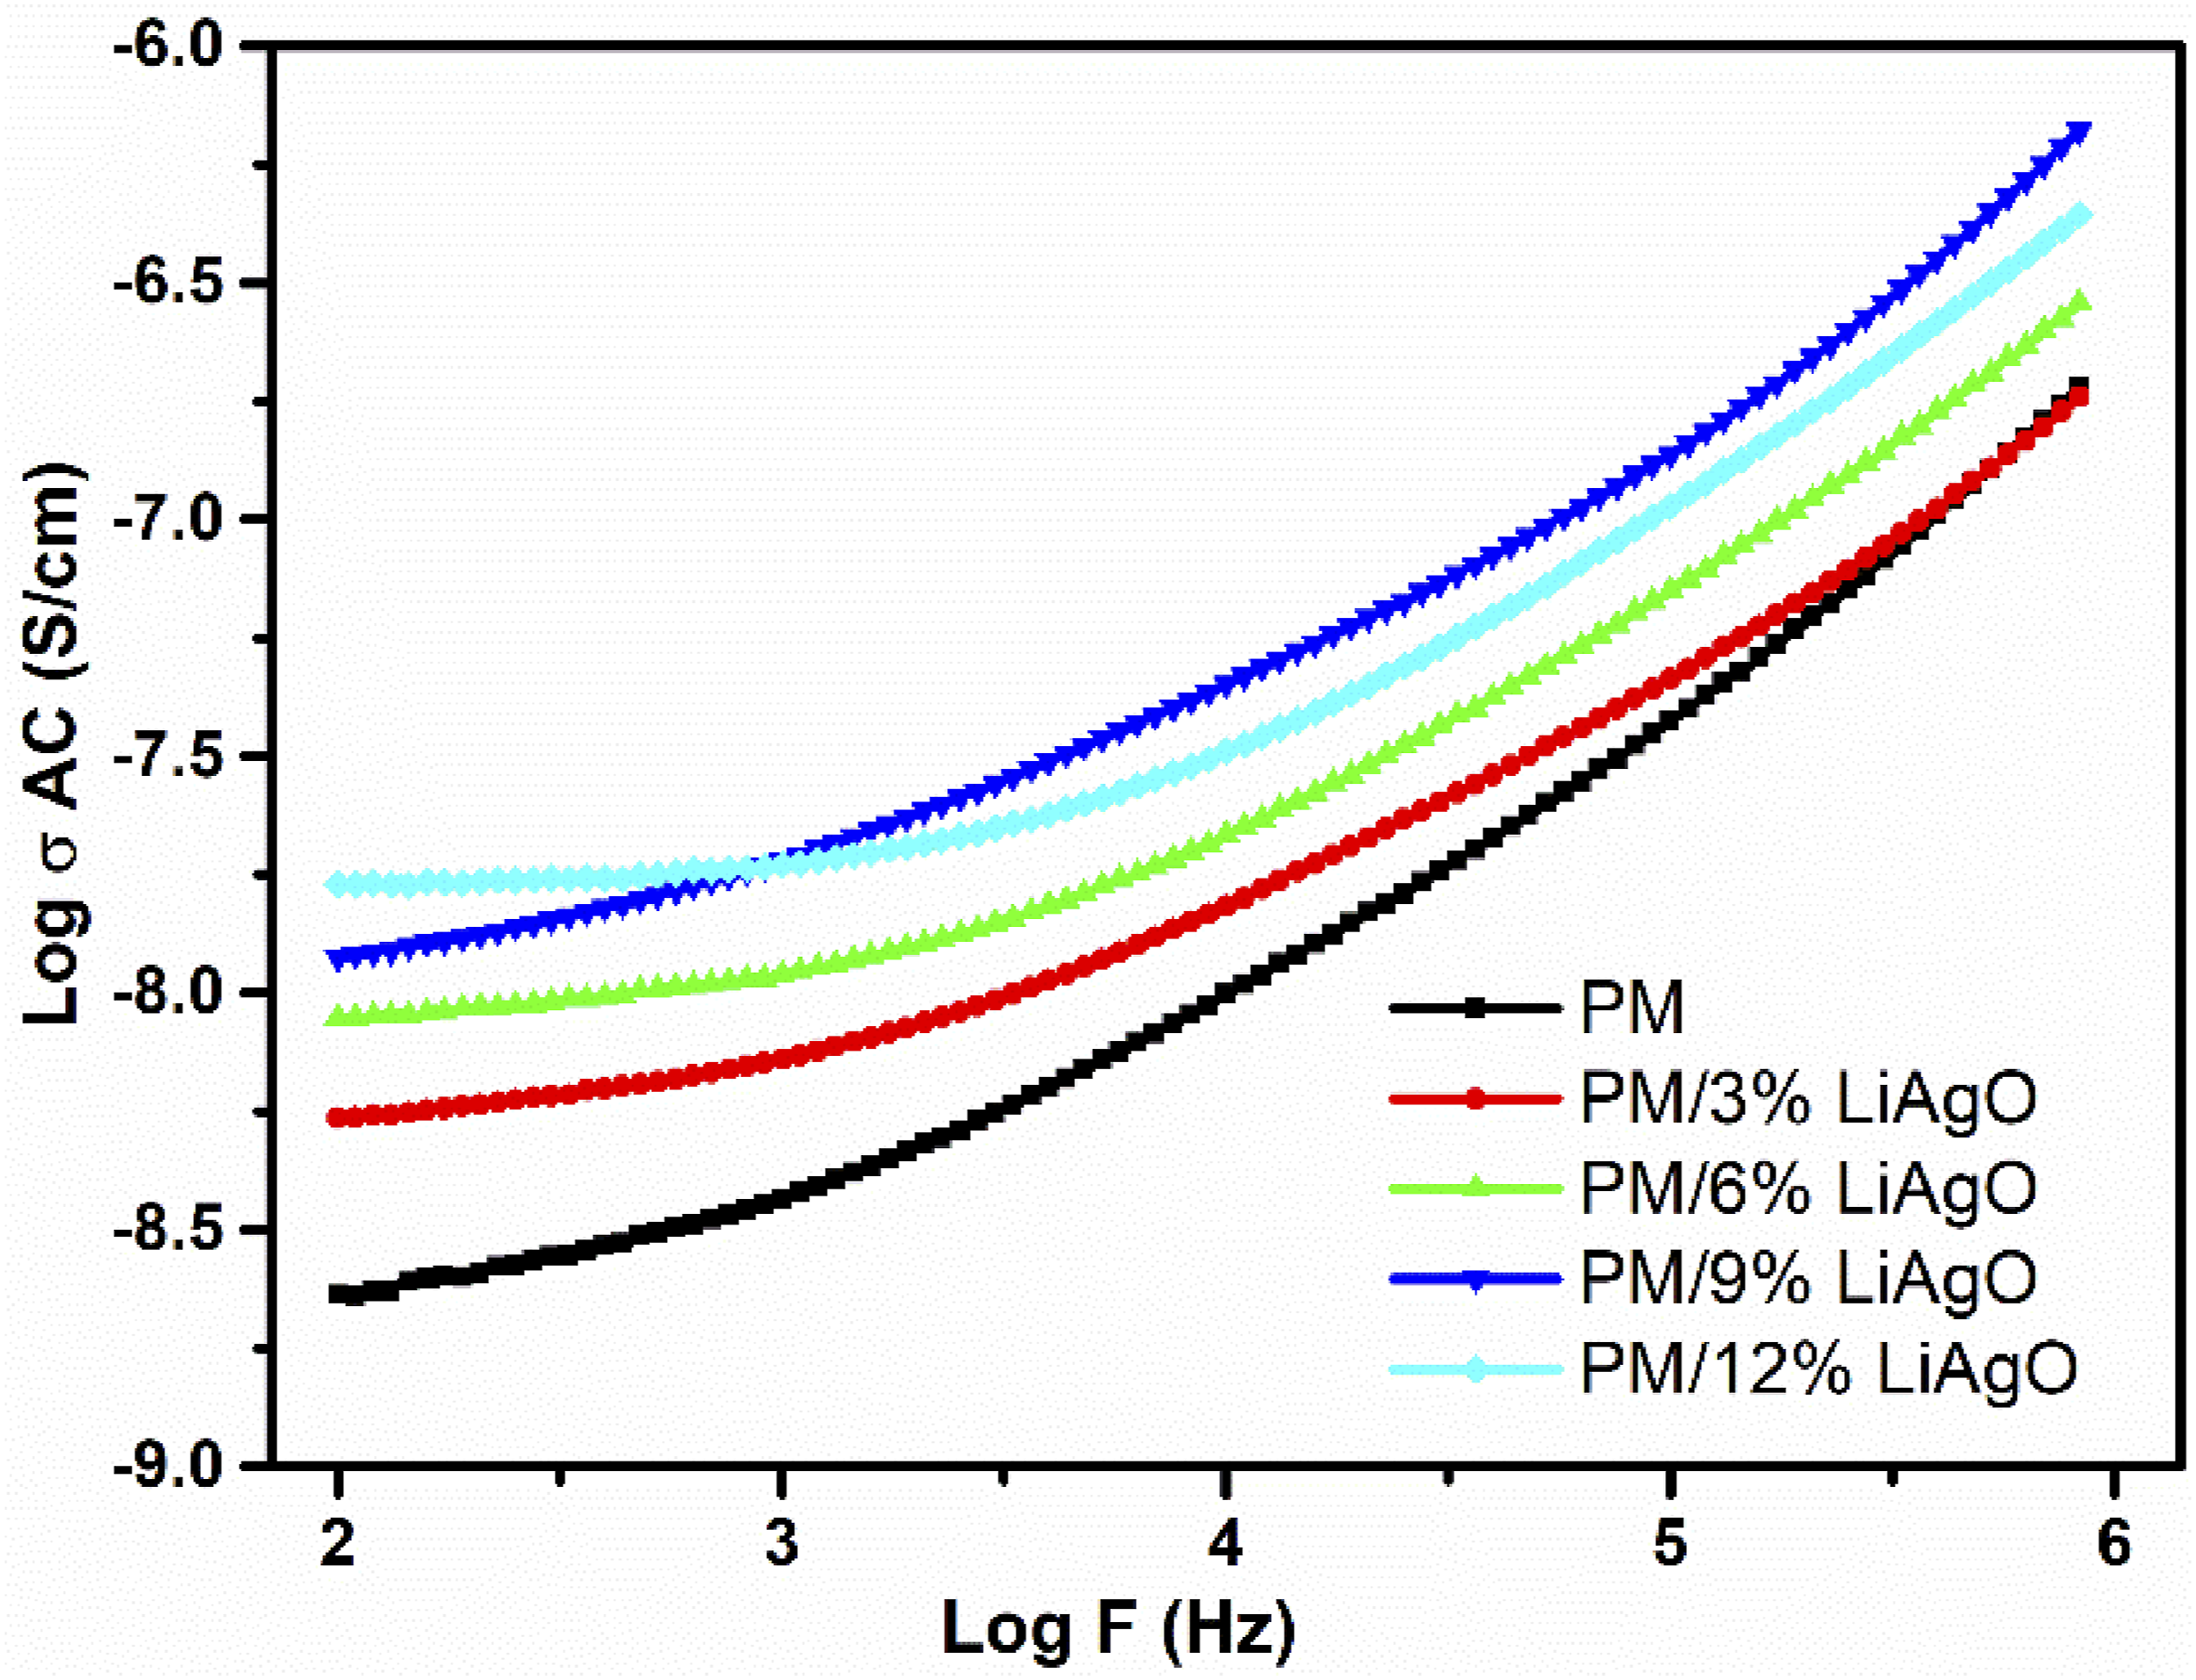
Temperature dependent AC
Figure 9 illustrates the conductivity of PM and its NCs at different temperatures. It is observed that conductivity increases with frequency across all materials, and this trend is more pronounced at the highest temperatures. In particular, when the temperature moves from 30°C to 110°C, the conductance at a given frequency increases owing to better conductive properties at high temperatures. The cooperative phenomena are most evident among the materials, with PM/9% LiAgO exhibiting the maximum conductivity. This behaviour indicates that the efficiency of these samples increases with the increase in frequency and temperature, an important characteristic for use in electronics, where high conductivity is needed under varying temperature conditions.
32
Temperature dependent AC conductivity of PM and PM/LiAgO blend NCs.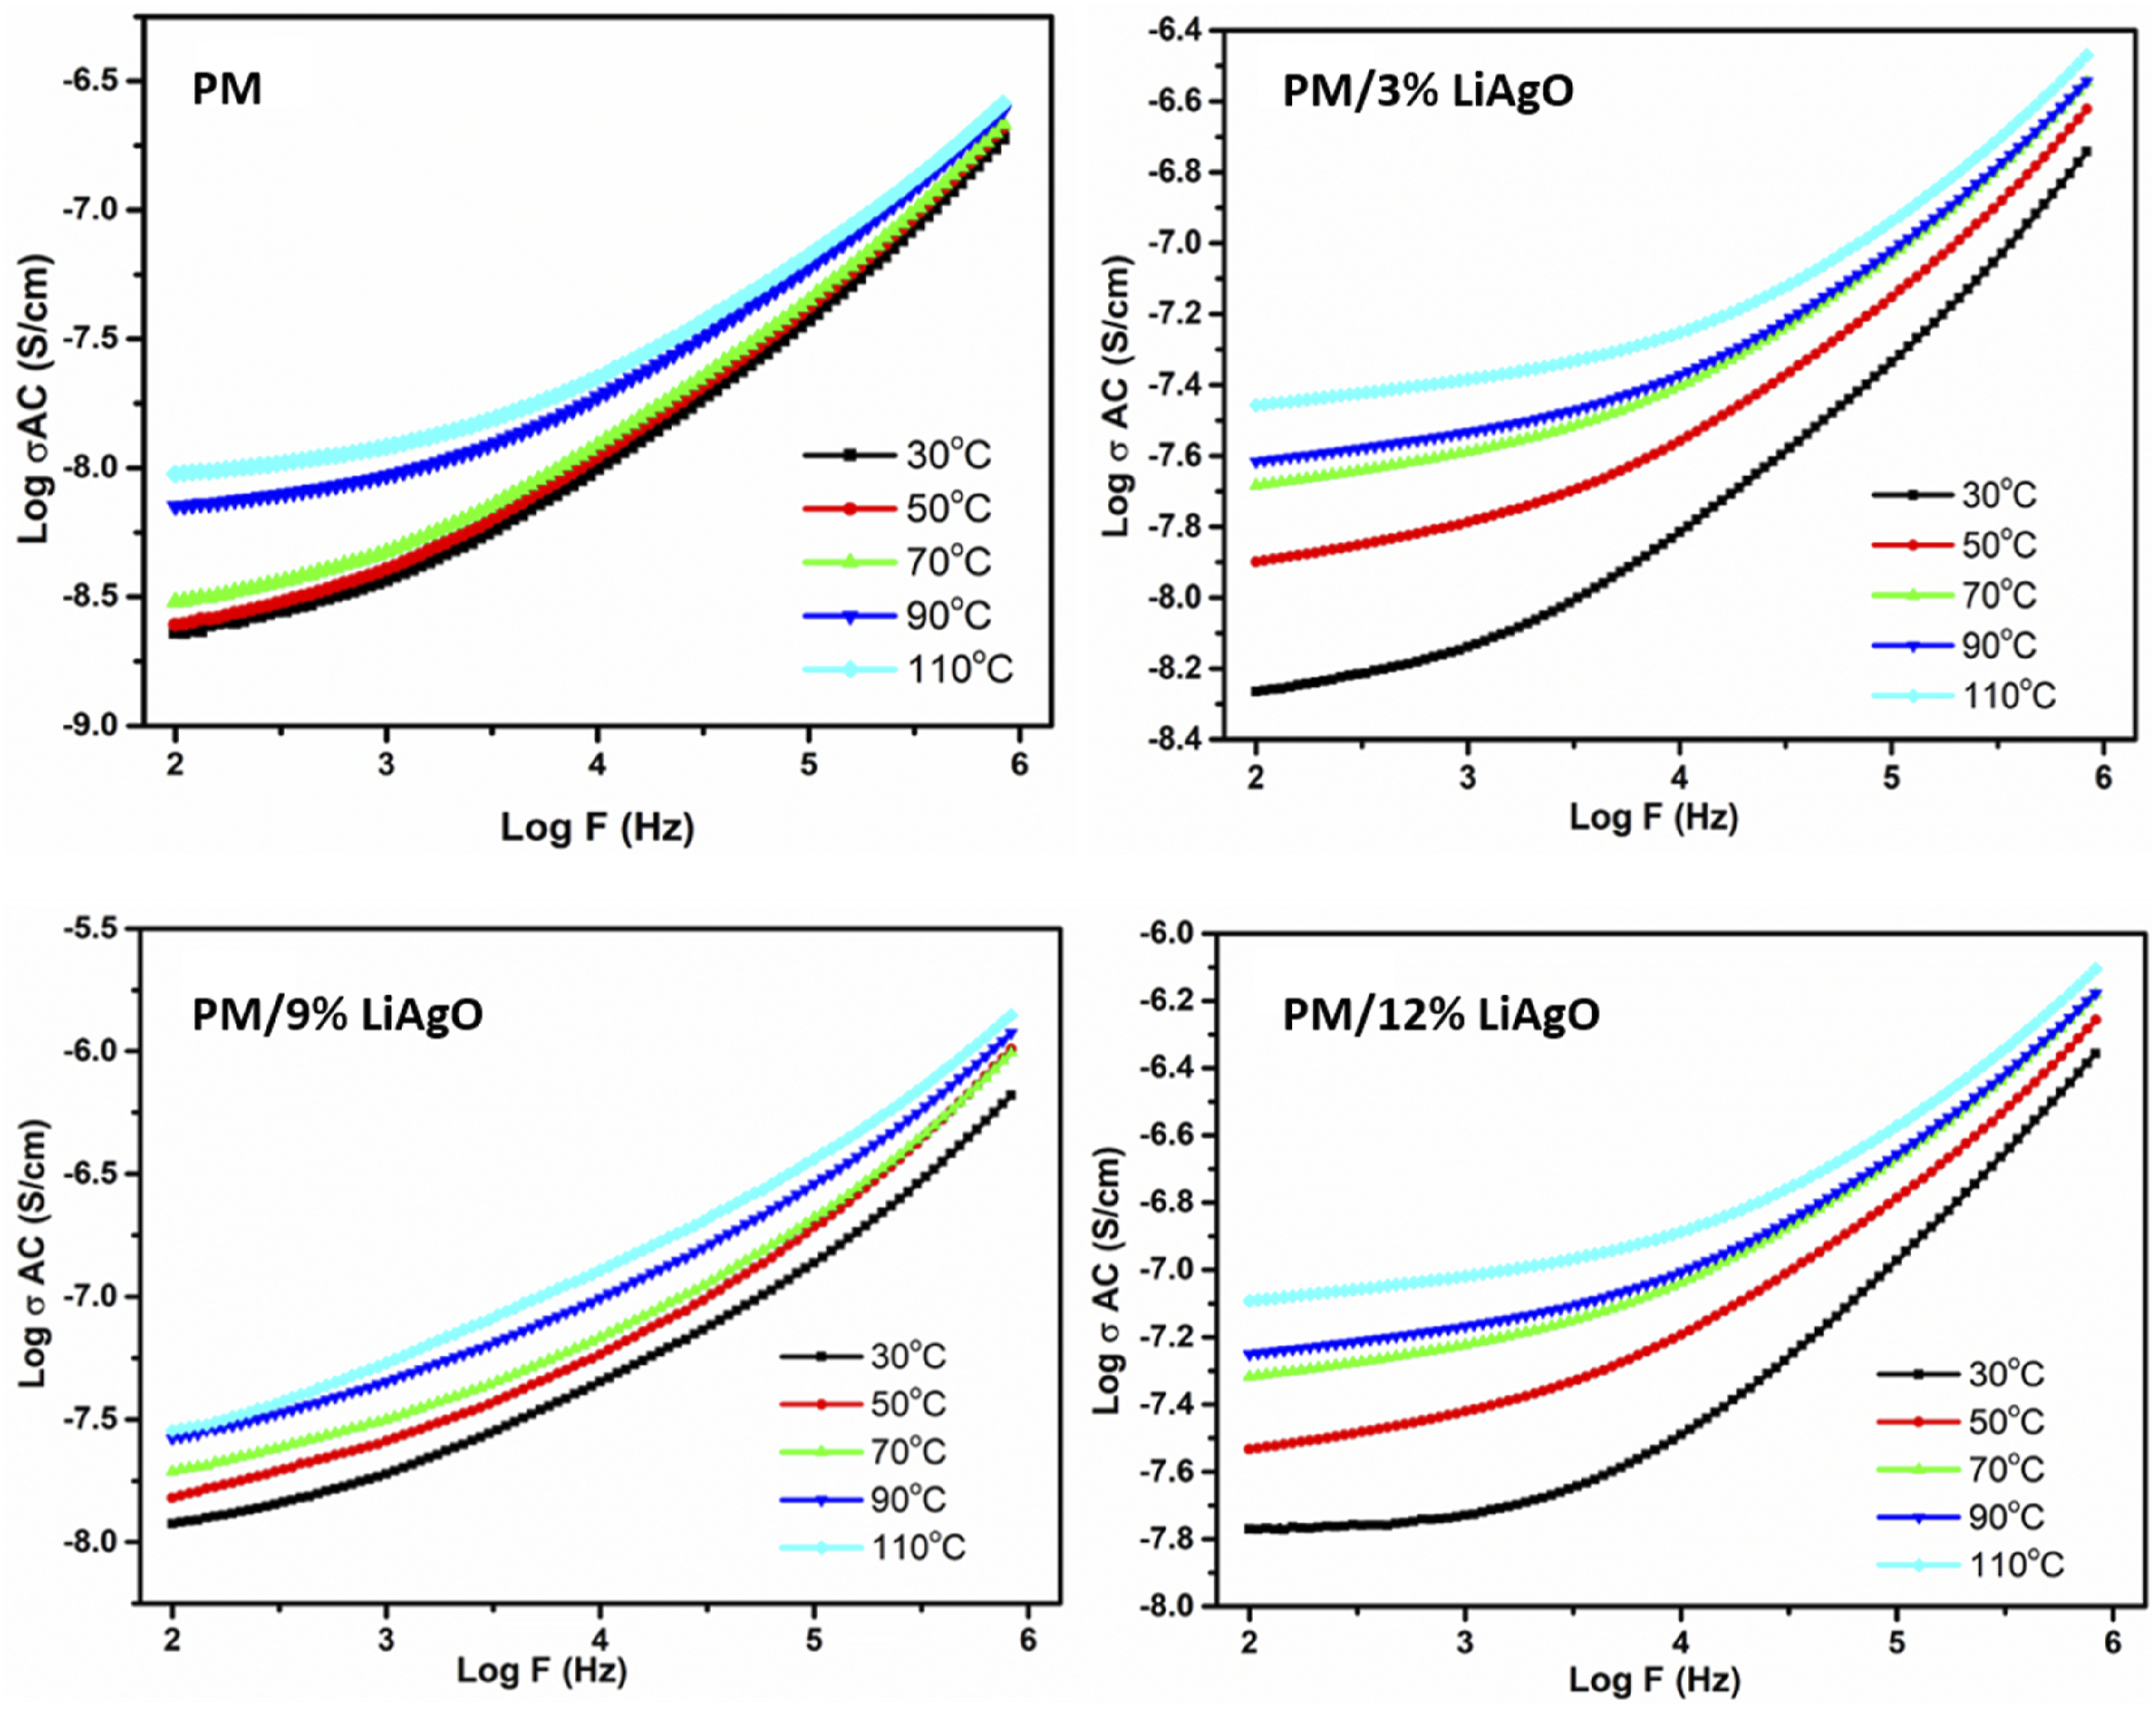
Dielectric constant
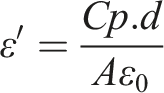
Figure 10 shows the variation of the dielectric constant against logarithmic frequency for PM and PM/LiAgO blend NCs. This is a measurement of the electrical energy storage capacity of a substance in an electric field. A greater capacity to store energy is indicated by a higher dielectric constant. This can be evaluated using the following equation: Dielectric constant of PM and PM/LiAgO blend NCs.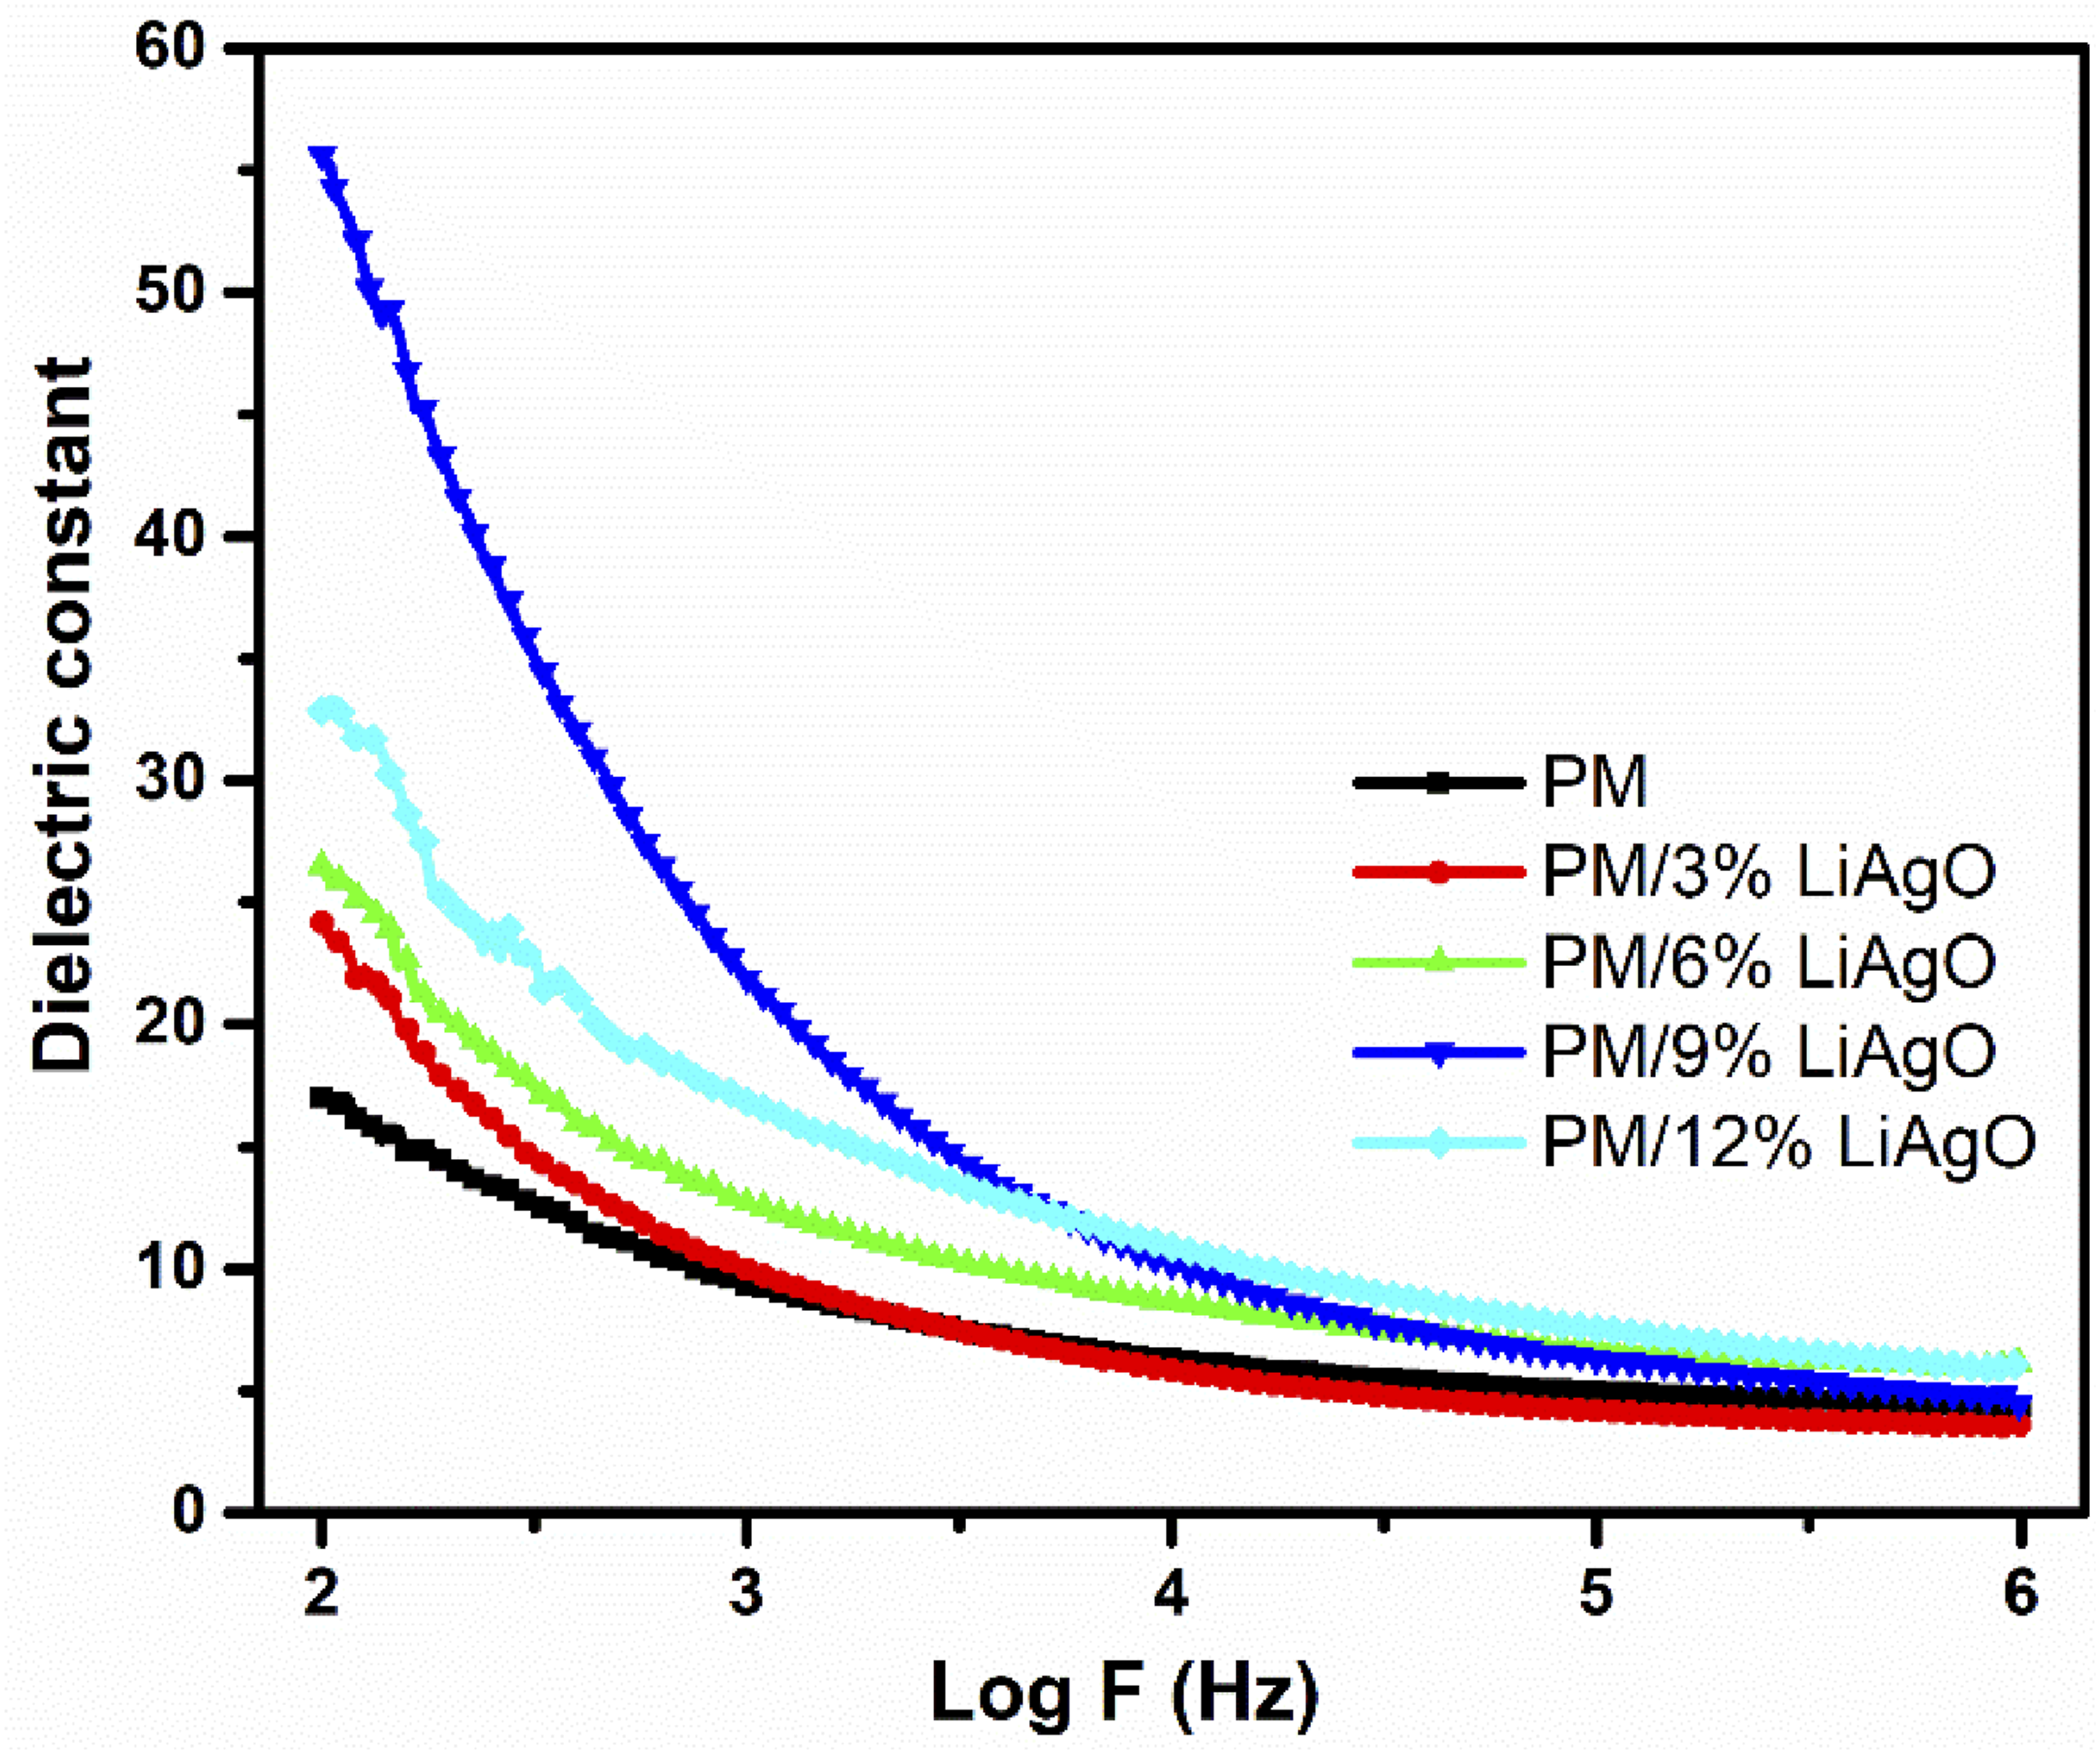
The dielectric constant decreases with increasing frequency for all materials, which suggests that the polarization mechanisms in the materials cannot keep up with the fast-changing electric field at higher frequencies. This phenomenon is typical of dielectric materials, where the ability to store electrical energy reduces with increasing frequency. 33 A comprehensive understanding of the dielectric properties of these materials at different frequencies is essential for their application in electronics, capacitors, and other devices where dielectric properties are important. As the concentration of nanoparticle increases within the polymer matrix, dielectric constant increases where PM/9% LiAgO has the highest score among the NCs produced, indicating that LiAgO is dispersed uniformly in polymer segments. In contrast, the reduction in dielectric values observed with PM/12% LiAgO loading can be attributed to the nonhomogeneous morphology caused by particle agglomeration, which disrupts the polarization process. Materials with higher dielectric constants like PM/9% LiAgO at lower frequencies might be more suitable for applications requiring high energy storage, while those with stable dielectric constants across a wide frequency range might be preferred for high-frequency applications.34,35
Temperature dependent dielectric loss tangent
Figure 11 depicts the temperature-dependent dielectric loss tangent (tan δ) against frequency for PM and PM/9% LiAgO. This phenomenon can be attributed to the reduction in the dielectric loss as frequency increases in both cases, suggesting energy associated with polarisation mechanisms becomes constrained at high frequencies. While dielectric losses are observed to be greater at elevated temperatures for both materials, the variation in loss tangents across a broad temperature range is less significant at high frequencies. Since the overall dielectric losses are less, these materials can be used in the devices more suited where energy loss must be kept to the barest minimum at high temperatures.
36
Temperature dependent dielectric loss tangent of PM and PM/9% LiAgO.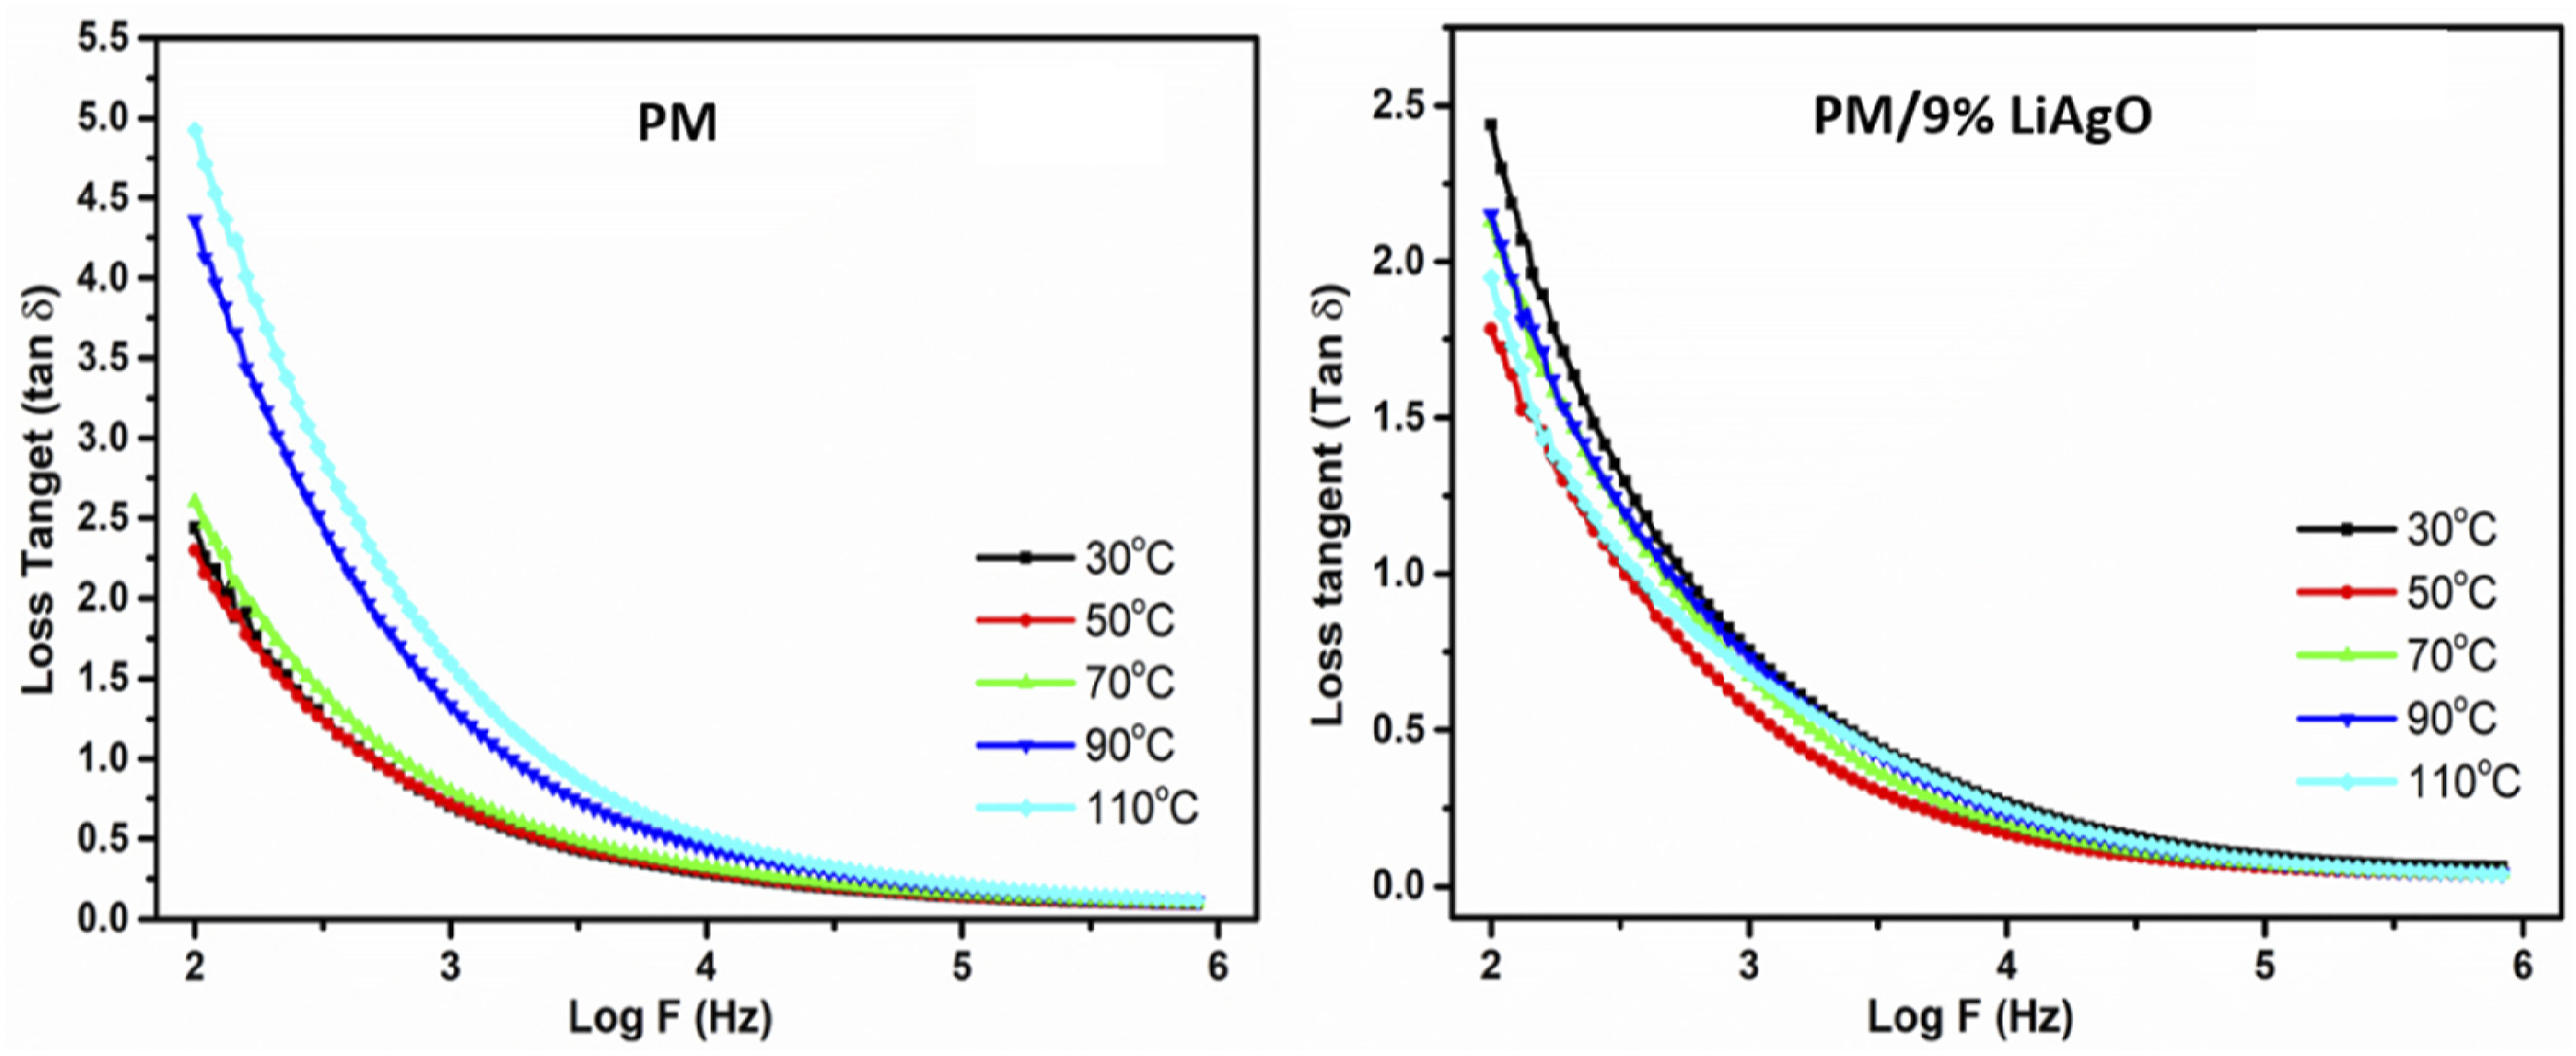
Electrical modulus analysis
The complex modulus (
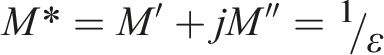
Figure 12 depicts the real electrical modulus (M′) with respect to frequency for blend NCs at various temperatures. The real modulus for all materials increases with frequency, which shows that the materials change from capacitive properties at low frequency and resistive properties at increased frequency. At all frequencies, as the temperature rises, the modulus decreases, indicating enhanced ionic conductivity due to increased charge carrier mobility. This temperature effect is strong at the lower frequencies but becomes weaker at higher frequencies. At low frequency ranges (Log F ∼ 2 to 3), the modulus becomes constant as that described by the dielectric response, where charge carriers cannot keep up with electric field applications. Real modulus (M′) of PM and PM/LiAgO blend NCs.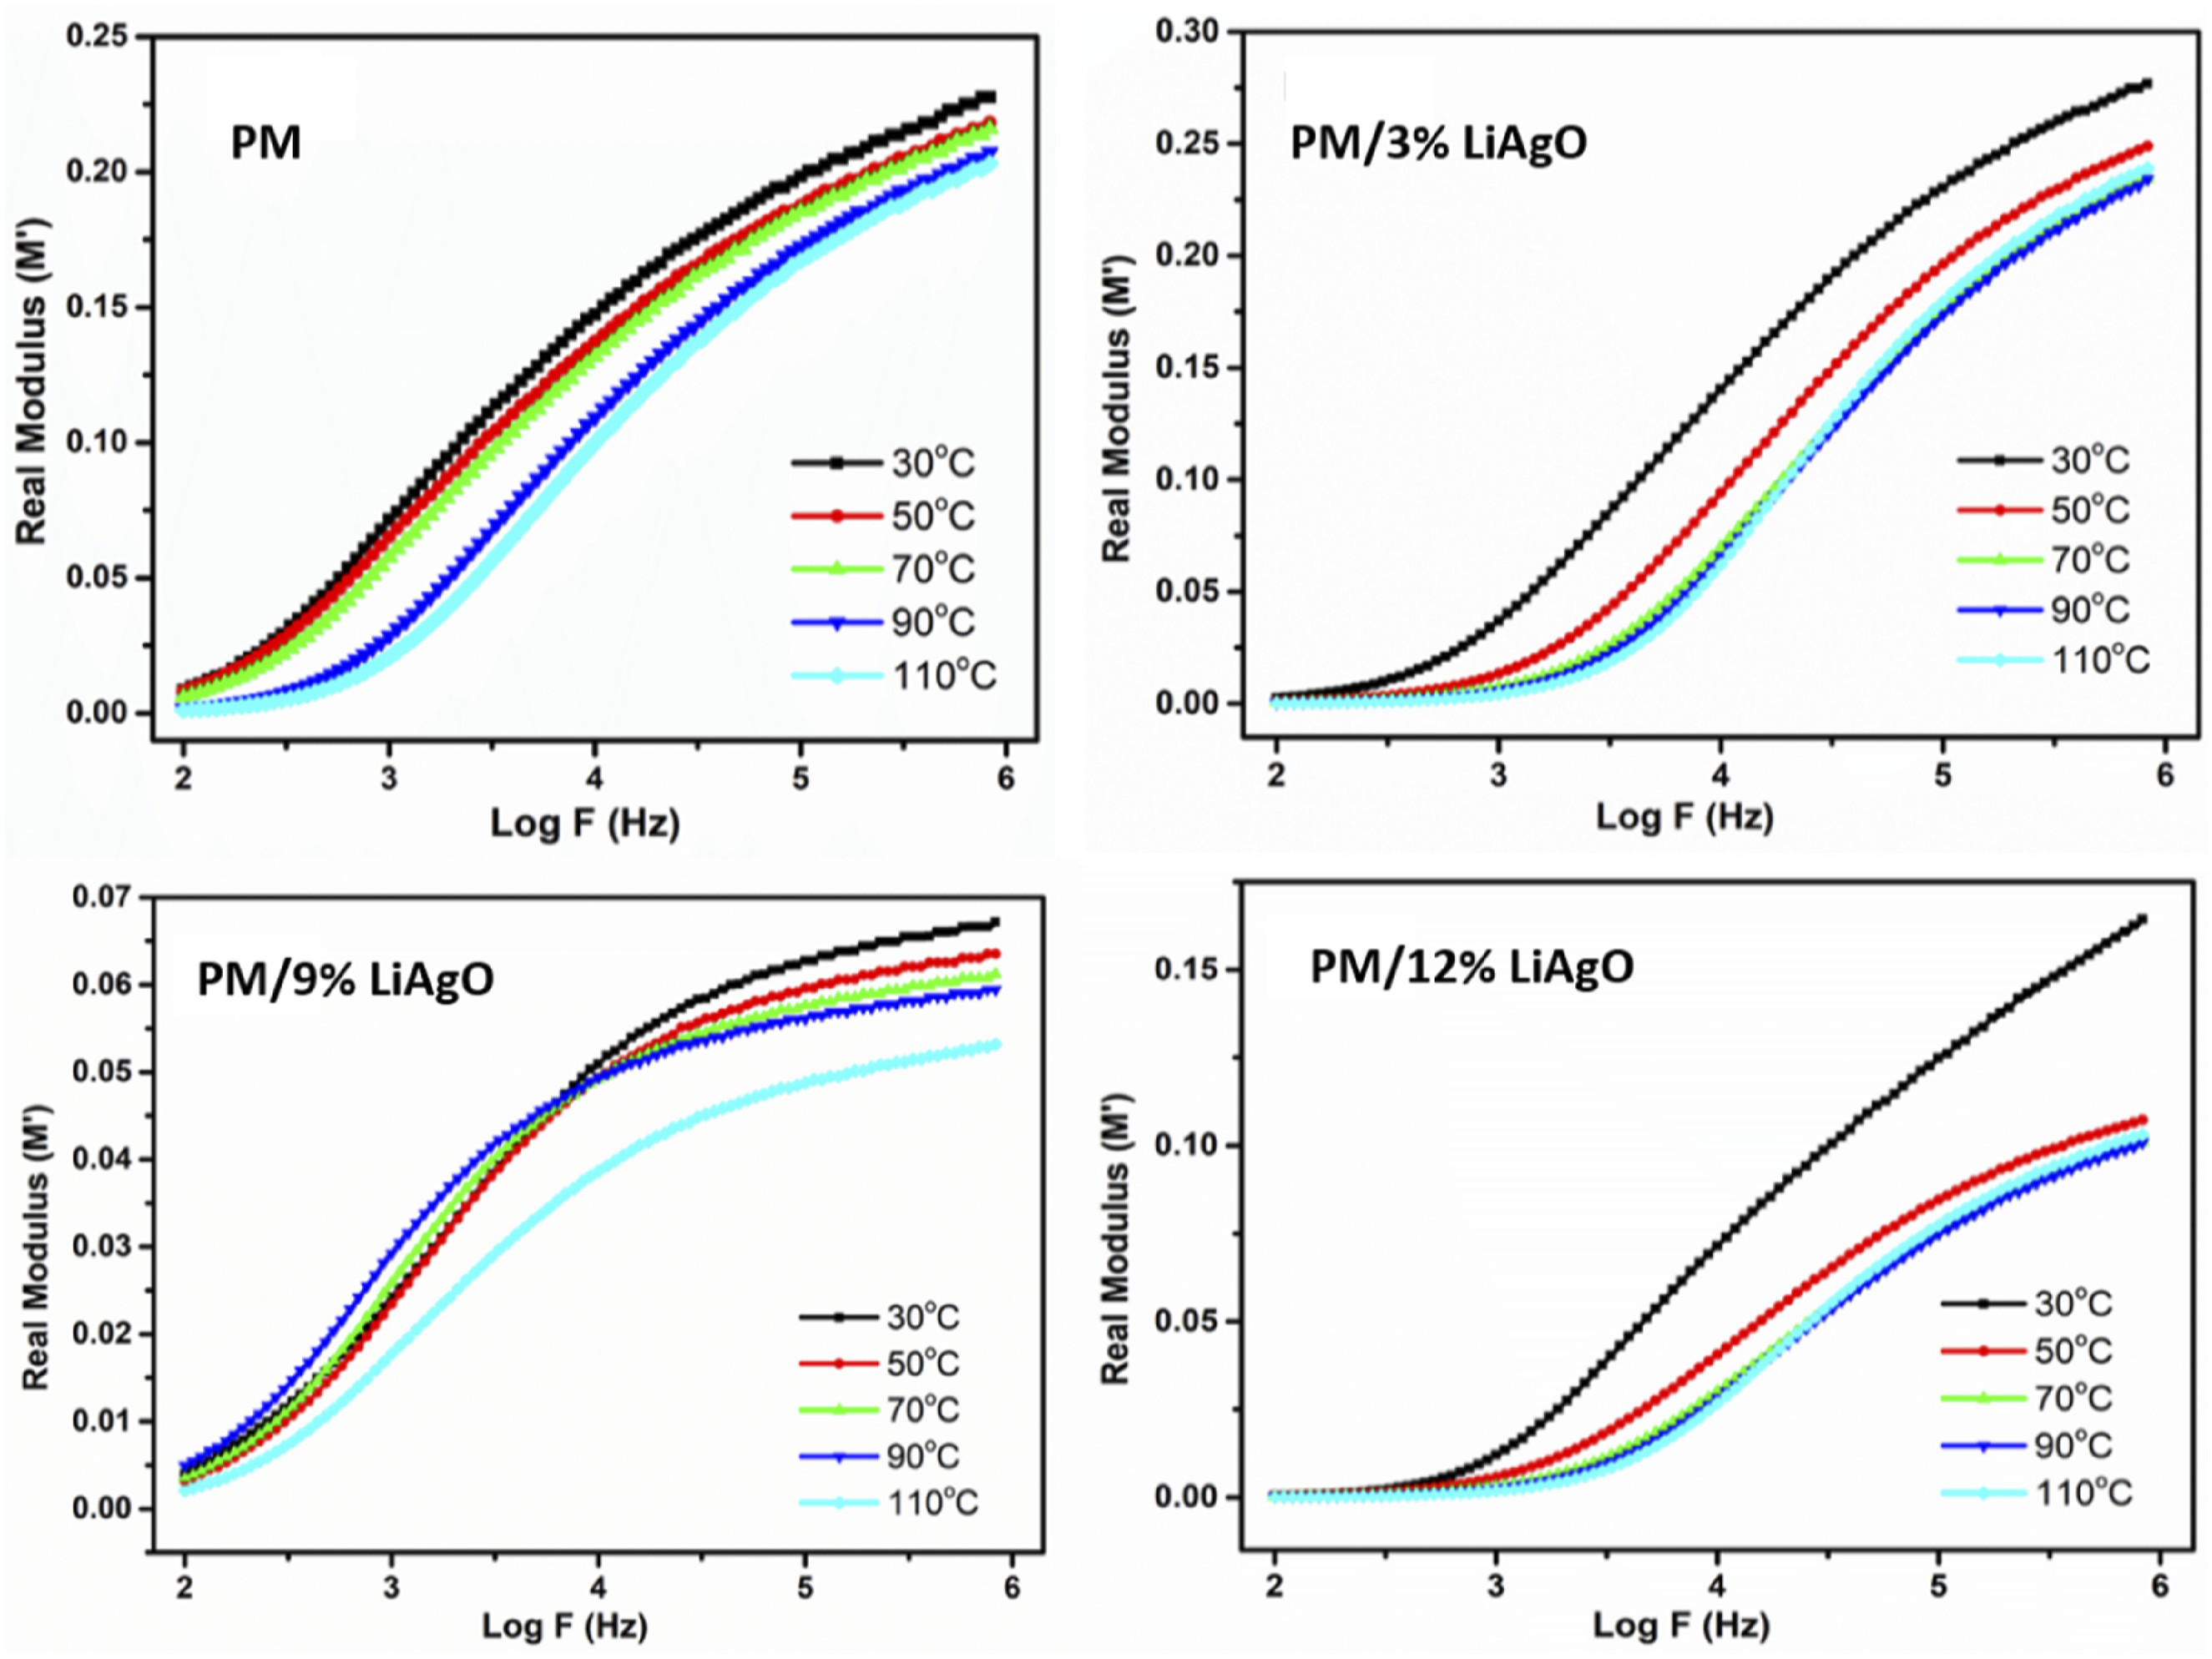
Figure 13 shows the imaginary electrical modulus (M″) versus log frequency (Log F) for the samples at varying temperatures from 30°C to 110°C. It is evident from the graph that M″ peaks move to higher frequencies with the rise in temperature, indicating quicker relaxation and improved ion movement at higher temperatures. The peak widening suggests a wider range of relaxation durations, which indicates various ion behaviors within the materials. Finally, the M″ drops off at higher frequencies, showing a shift toward more resistive behavior with diminished energy storage. The present analysis highlights the impact of temperature on energy loss and relaxation dynamics, with observed differences between materials suggesting variations in ion transport and dielectric properties. These findings help us understand and improve this polymer for ion-conductive uses.
38
Imaginary Modulus (M″) of PM and PM/LiAgO blend NCs.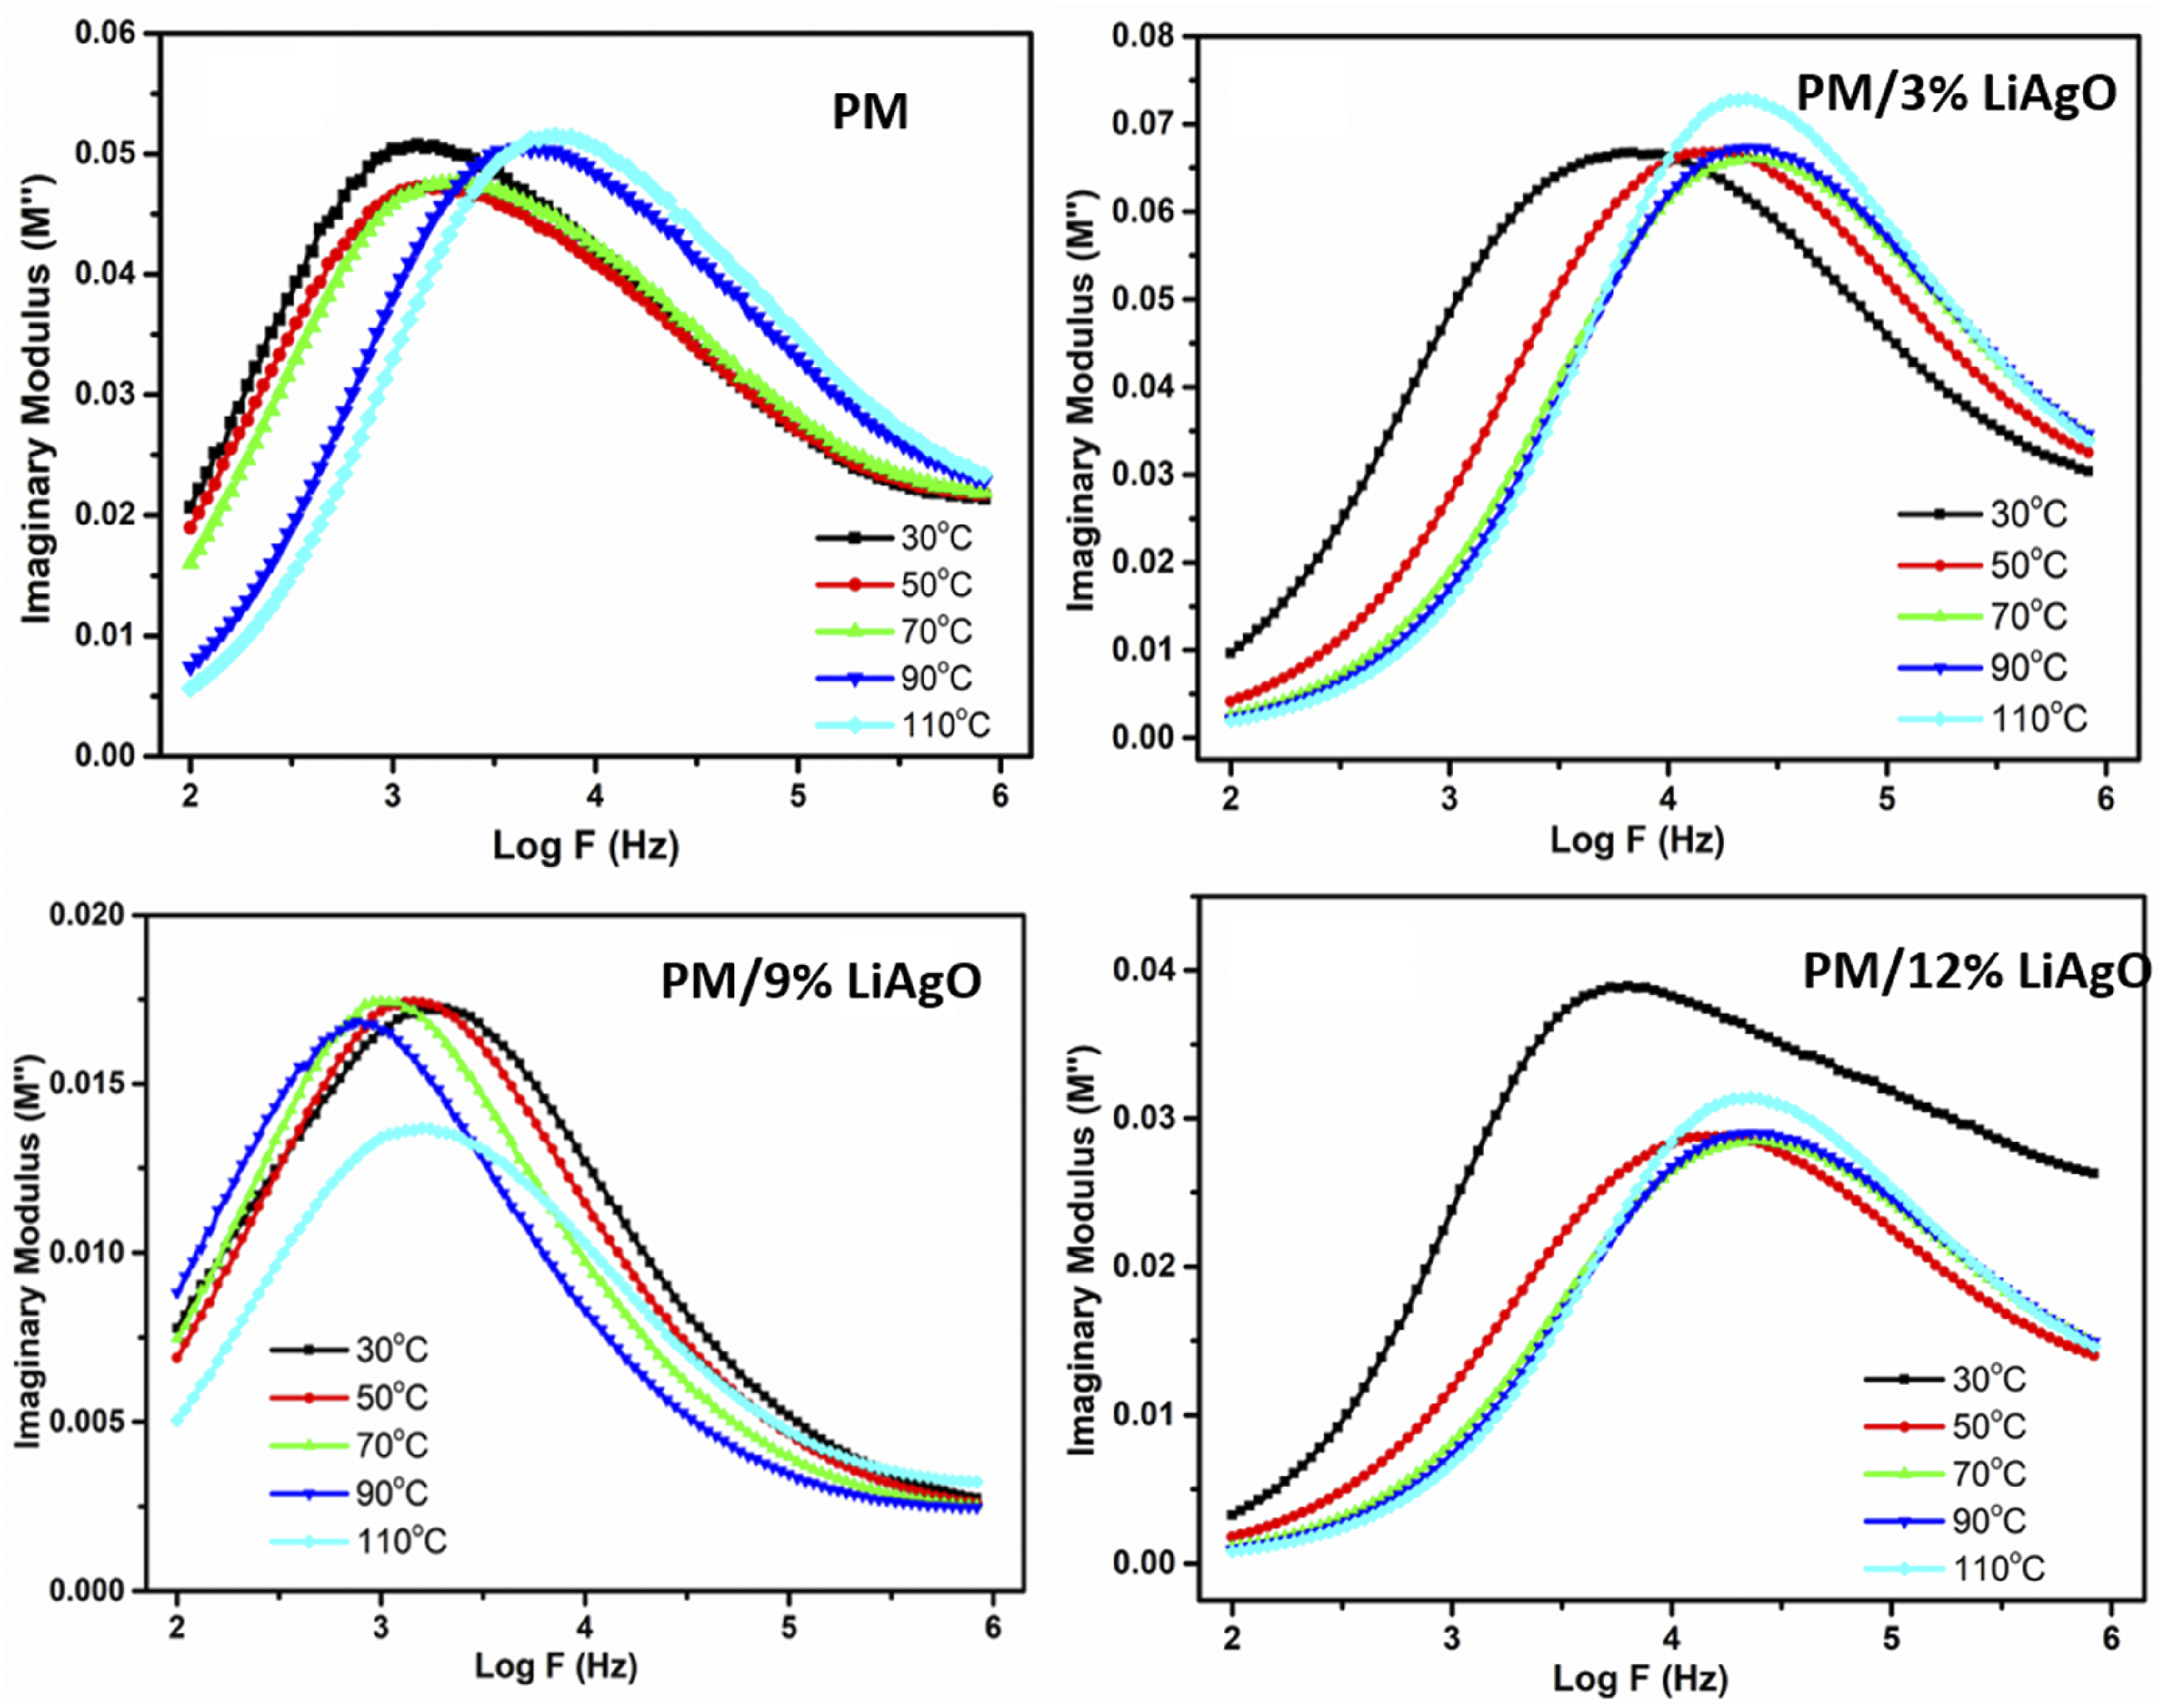
The temperature dependence of the electrical modulus is given in Figure 14. The real modulus, representing the material’s elasticity, is plotted on the X-axis, while the imaginary modulus, corresponding to energy dissipation, is displayed on the Y-axis. As the temperature increases, the imaginary modulus decreases by altering the position of the peak, indicating that such materials become softer and lose less energy with the rise in temperature. The figure illustrates that the modulus spectrum of the samples exhibits a characteristic semicircular pattern. This observation supports the conclusion of a single-phase formation of the compounds, suggesting that the relaxation processes for all examined samples are indicative of non-Debye-type relaxation phenomena.
39
This finding aligns well with the insights derived from the complex permittivity spectrum, as discussed in the subsequent sections. M” versus M’ for PM and PM/LiAgO blend NCs.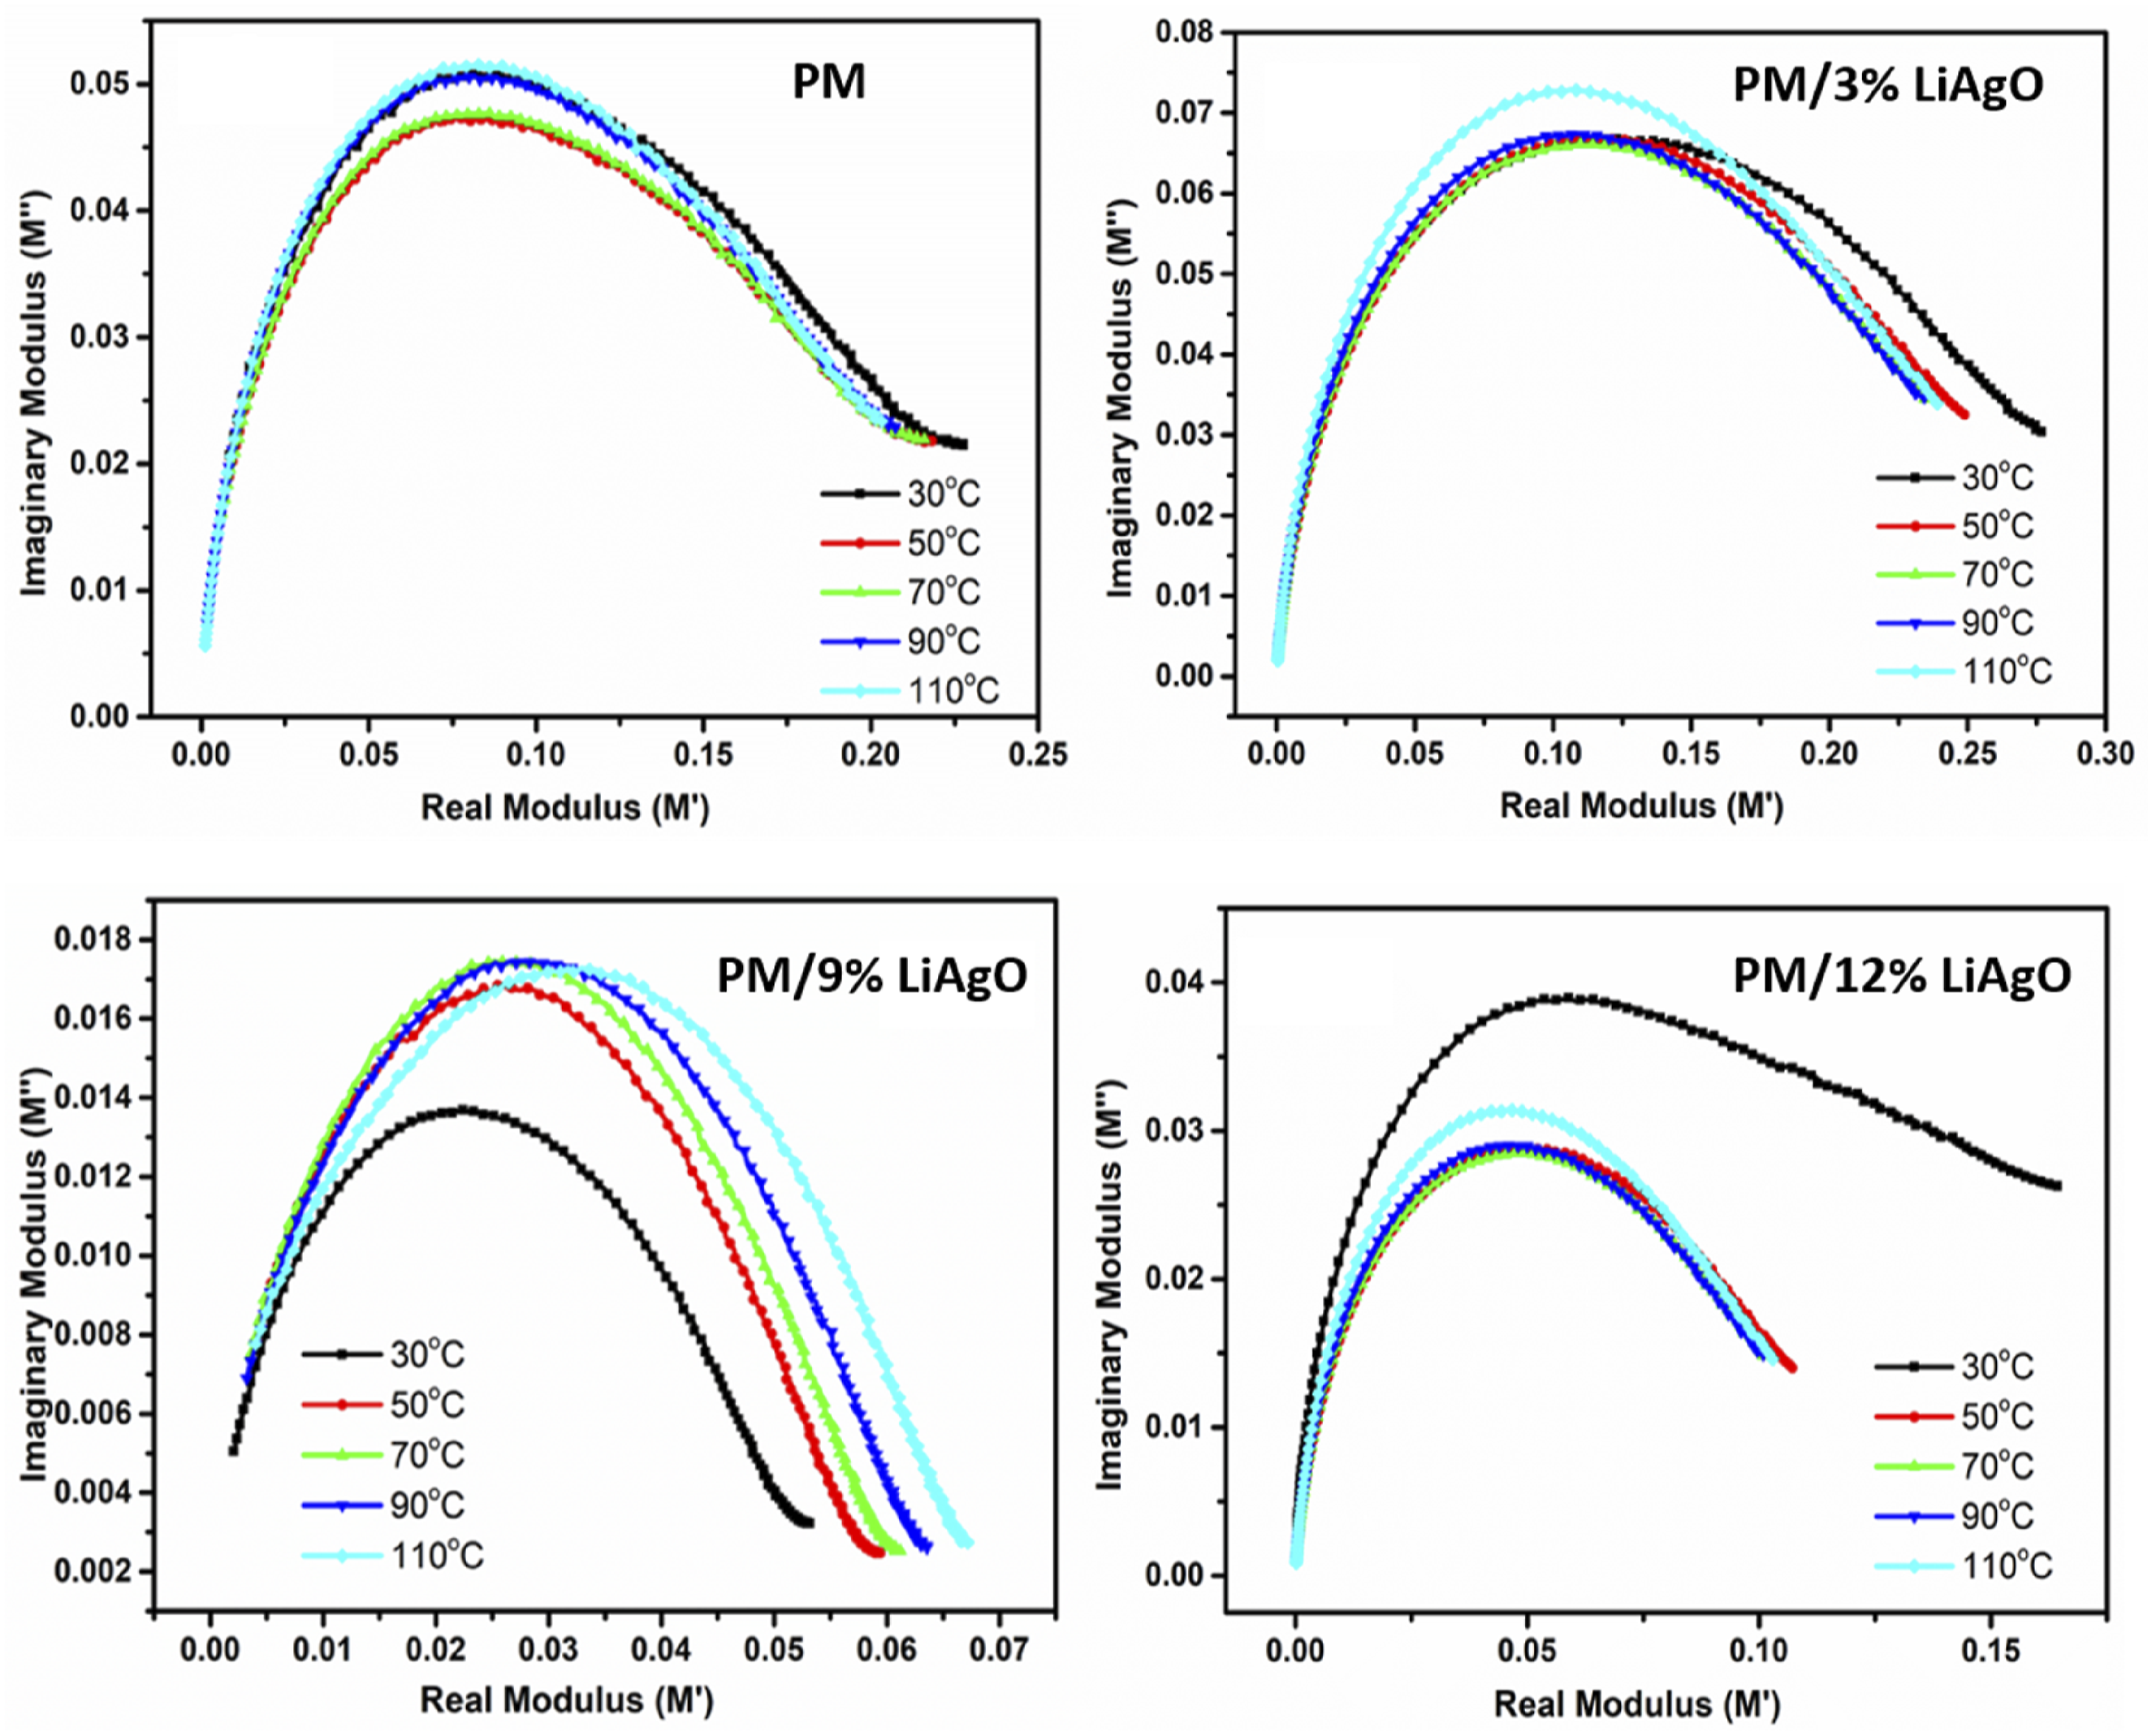
Complex impedance analysis
Figure 15 represents the real impedance (Z′) and log frequency relationships for different polymer NCs for varying temperatures. It has been observed from all graphs that the real impedance goes down significantly with increasing frequencies. This indicates that the material exhibits relatively greater resistance at lower frequencies, which gets reduced with an increase in frequency. For PM, the real impedance at 30°C drops rapidly with the rise in frequency and temperature. The temperature effect is most pronounced at lower frequencies, where impedance at 110°C is much lower, and all curves converge at high frequencies where impedance is less temperature-dependent and frequency-independent. This shows how these polymers go from higher resistance at lower frequencies to a more conductive state as frequency and temperature increase.
40
The real impedance of PM and PM/LiAgO blend NCs.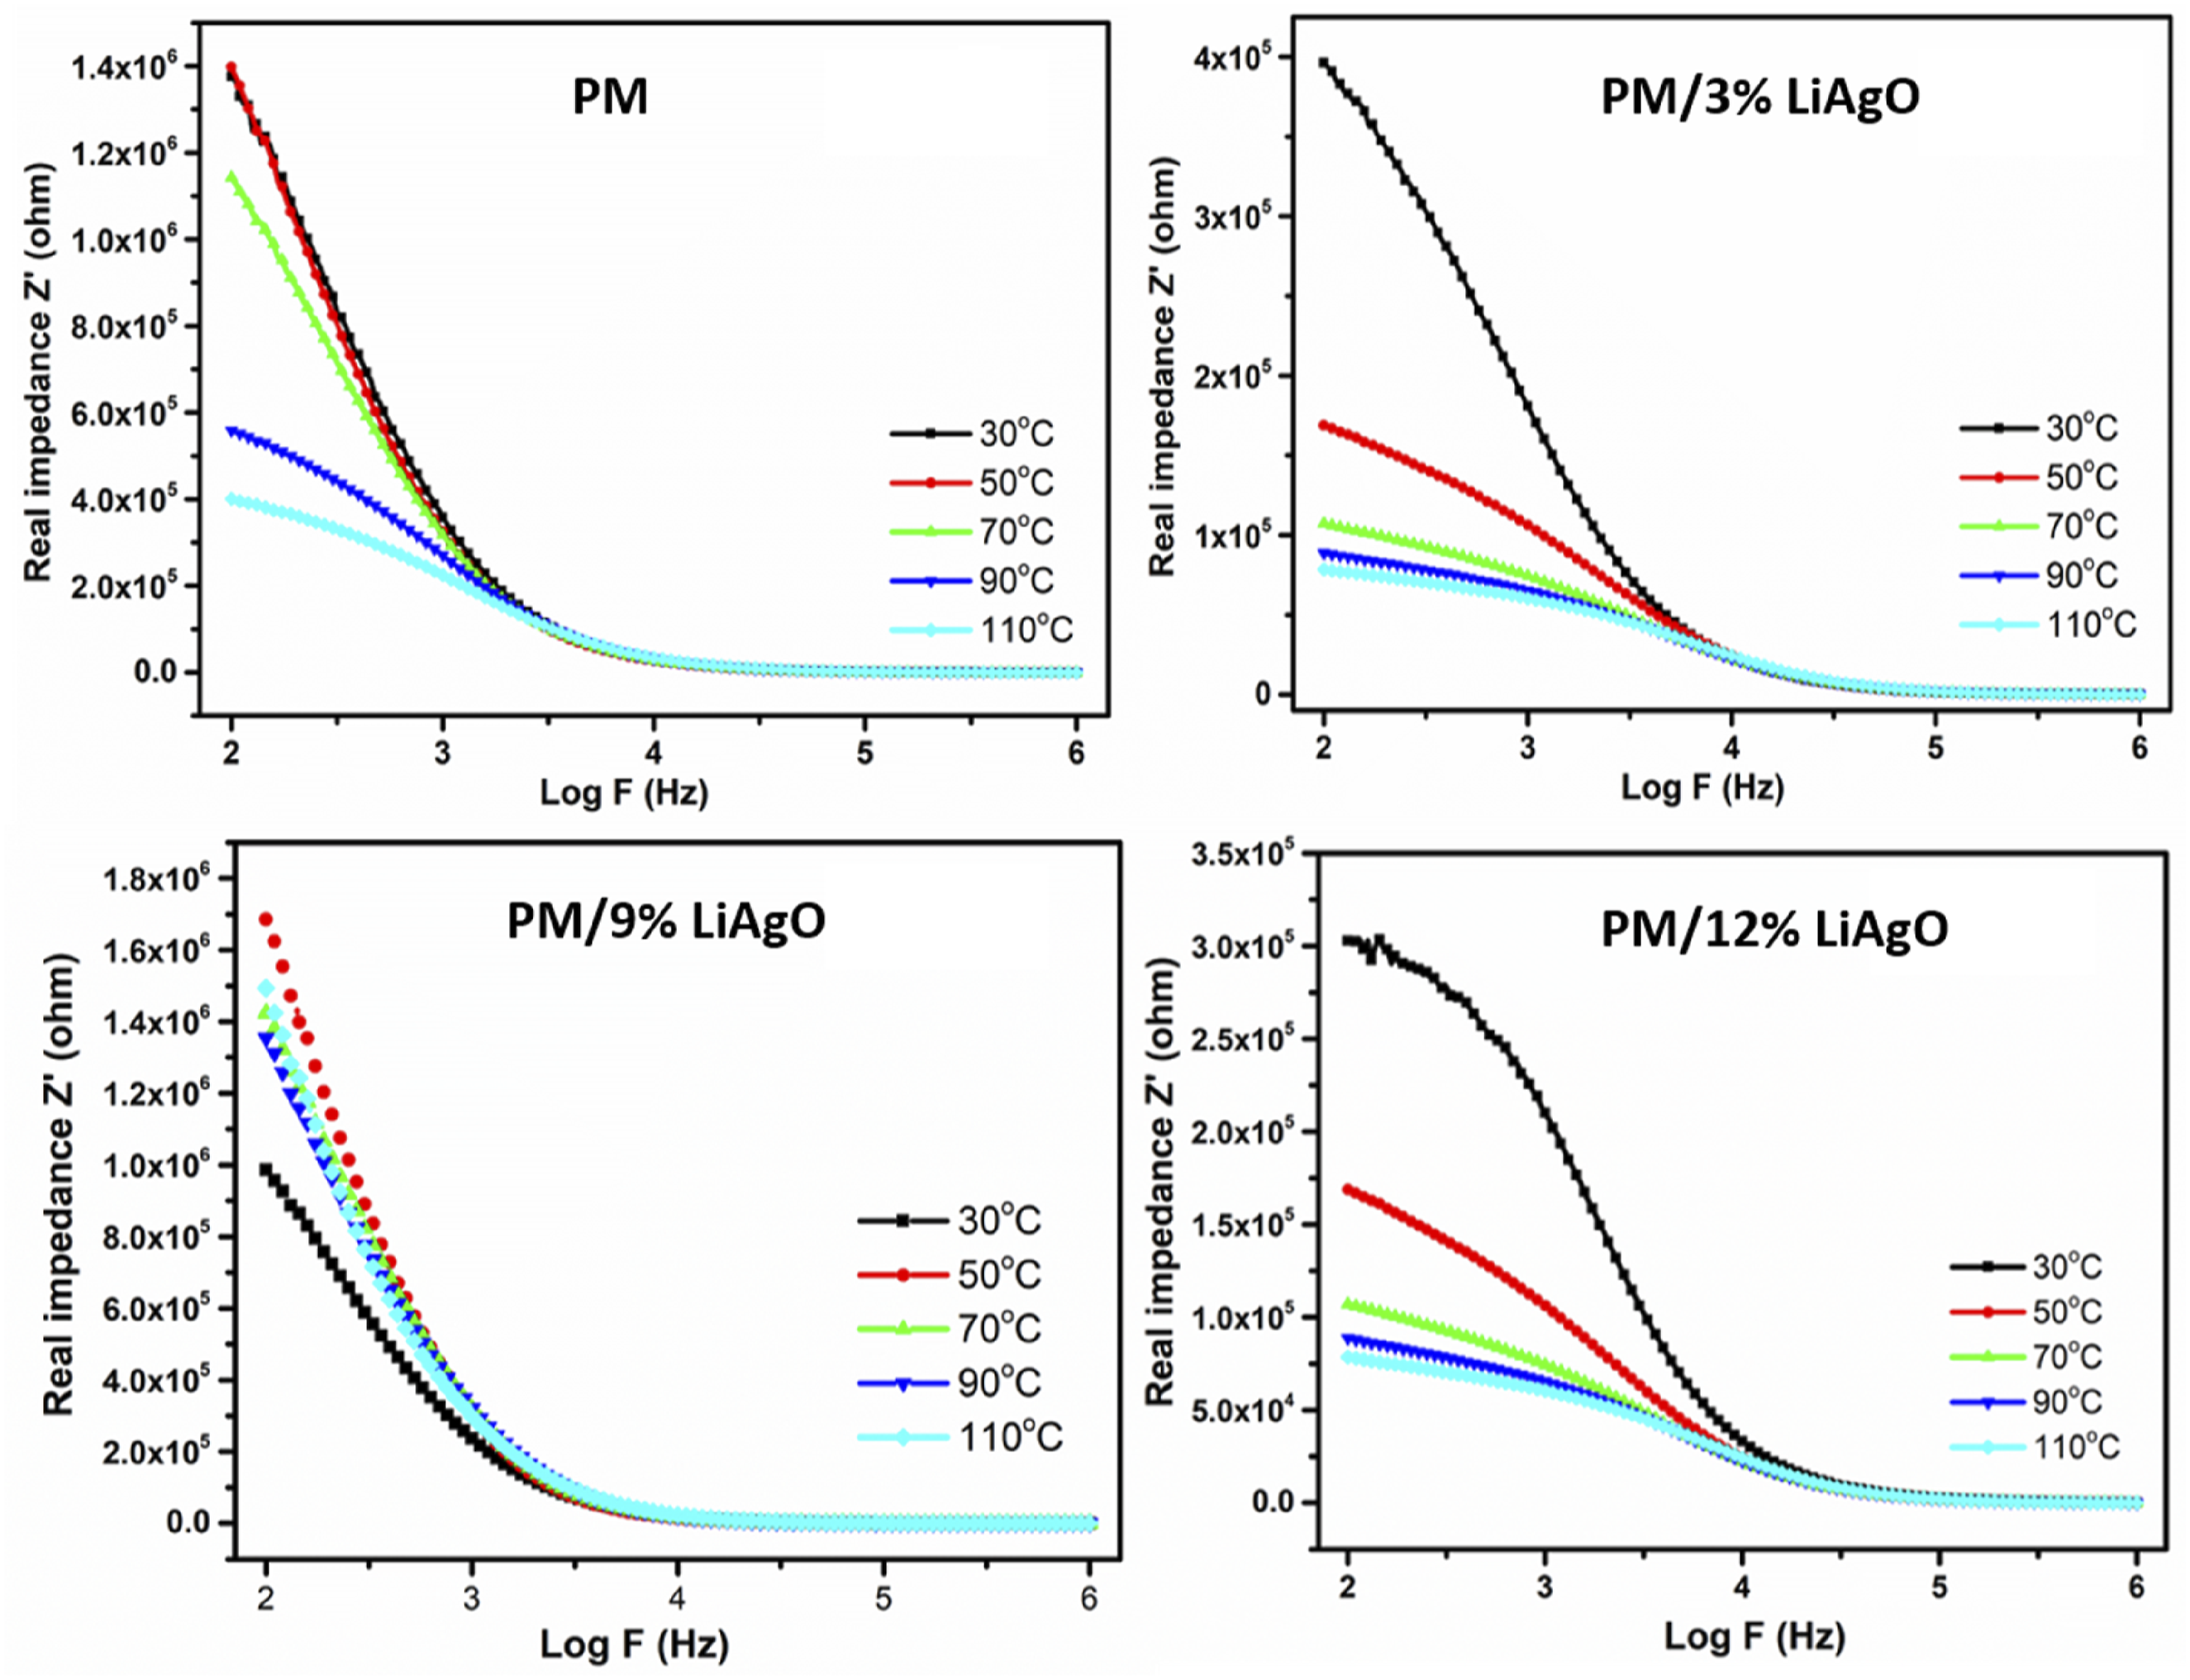
Figure 16 illustrates the variations of imaginary impedance (Z″) with logarithmically plotted frequency for various polymer samples at five different temperatures. The energy dissipation capability of the material can be appreciated from its imaginary impedance value. It is visible that the materials exhibit a peak in Z″ which is seen in between Imaginary impedance (Z”) PM and PM/LiAgO blend NCs.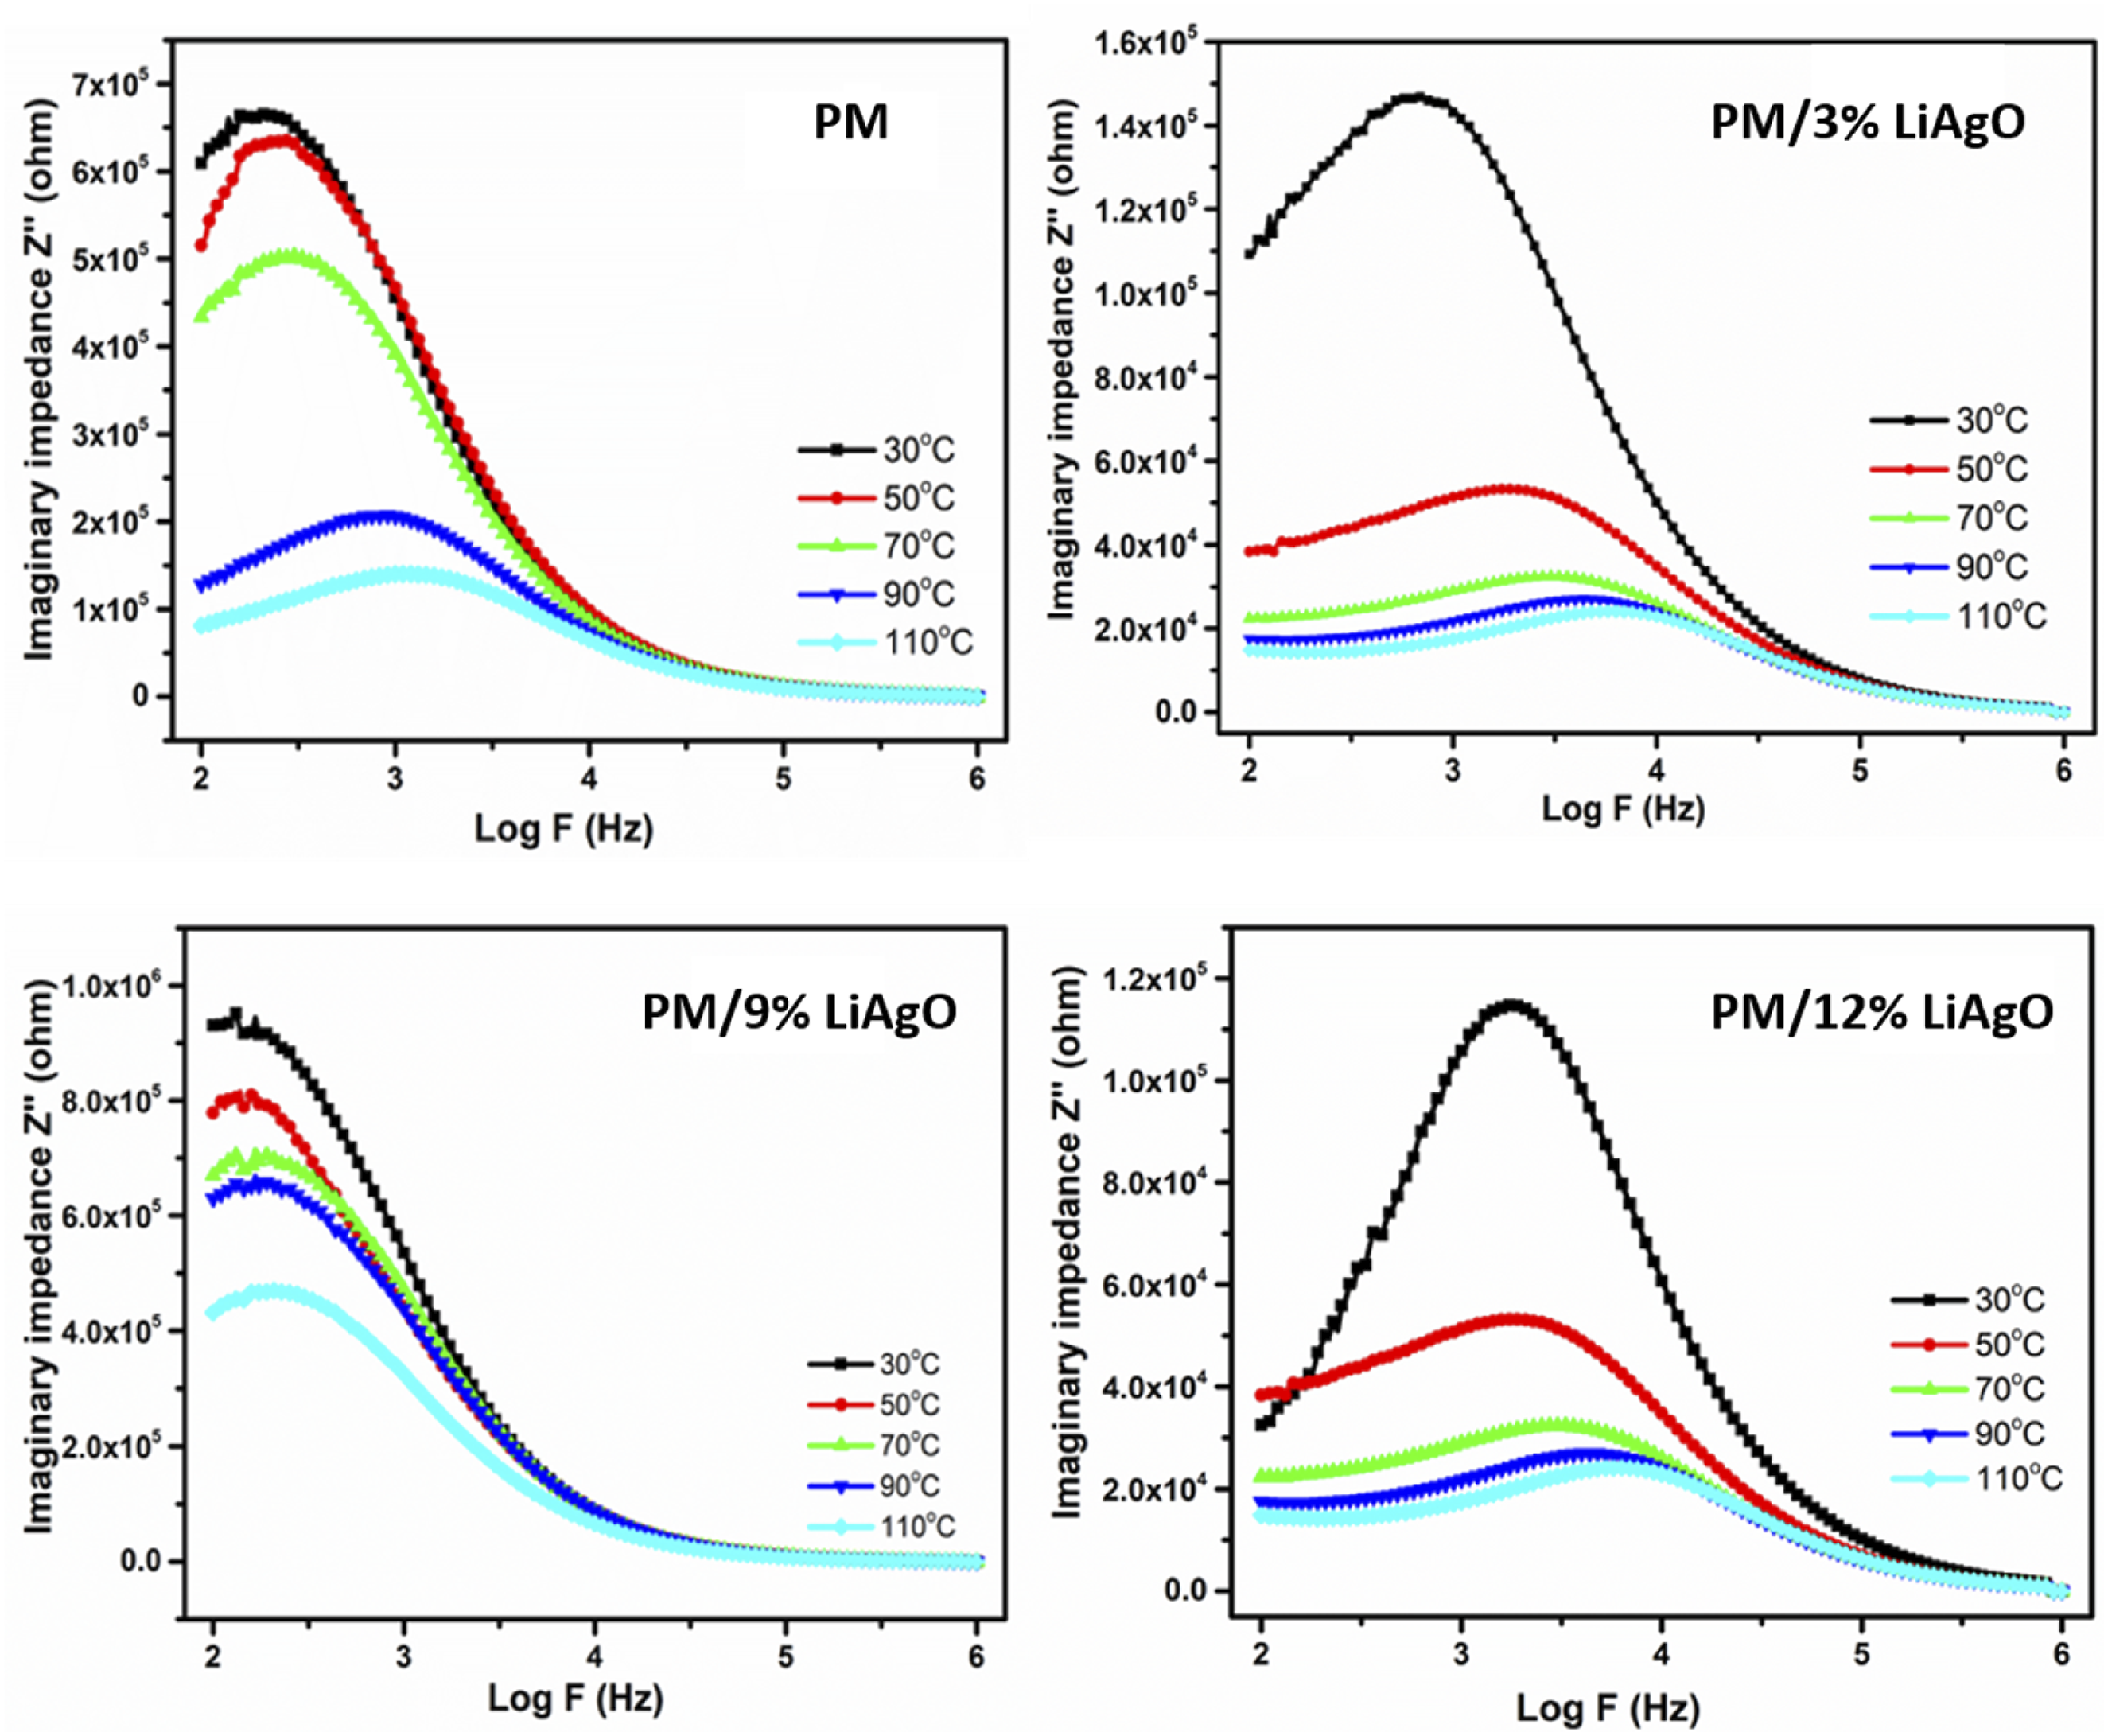
Figure 17 presents the temperature-dependent Nyquist (Cole-Cole) plot of the materials, illustrating the correlation between imaginary impedance (Z″) and real impedance (Z′). The horizontal axis corresponds to the Z′ representing the resistive part in an electrical circuit, while the axial vertical representation of Z'' represents the reactive or energy dissipative part of the circuit. Semicircles are a characteristic of the impedance spectrum. The dearth of an additional semicircle in the complex impedance plots indicates the preponderance of bulk contributions in the compounds. As the temperature increases, the intercept position on the real axis changes toward the origin, suggesting reduced resistive properties and improved conductivity.
42
These results highlight that the resistive and reactive behavior of these polymers is temperature dependent, with higher temperatures resulting in lower impedance and better conductive behavior. Z″ versus Z′ of PM, PM/3% LiAgO, PM/9% LiAgO, and PM/12% LiAgO.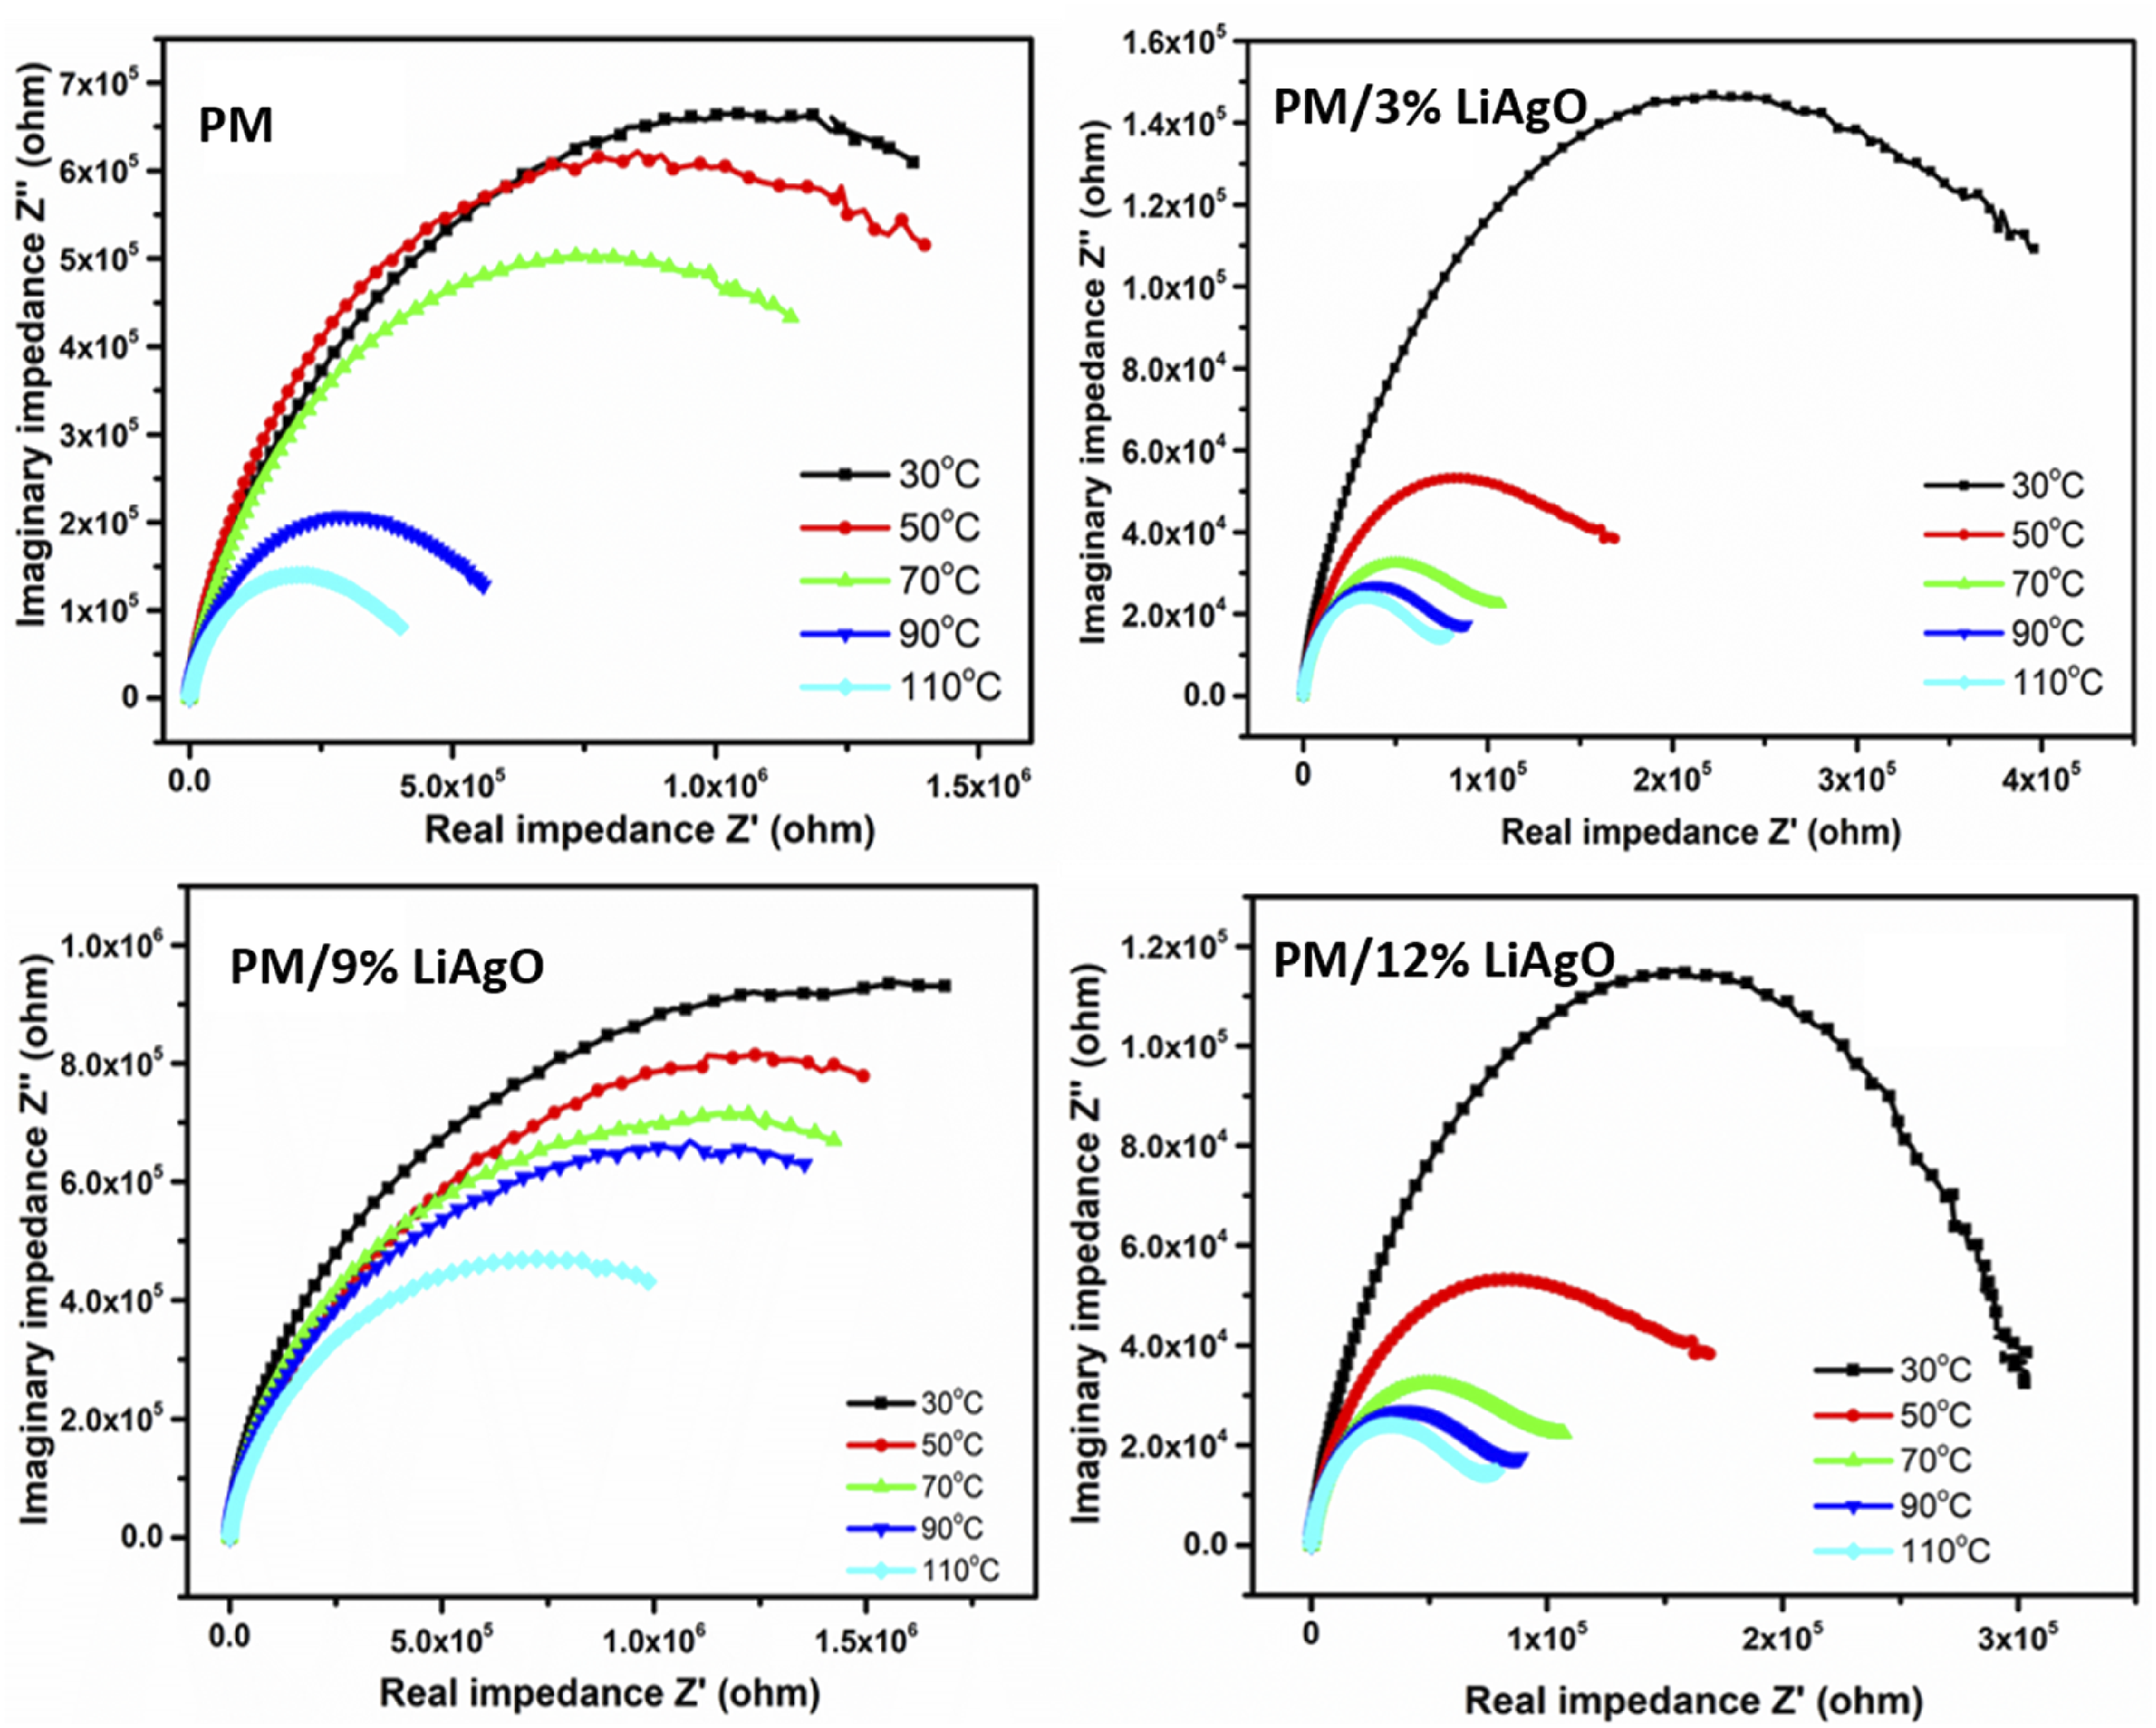
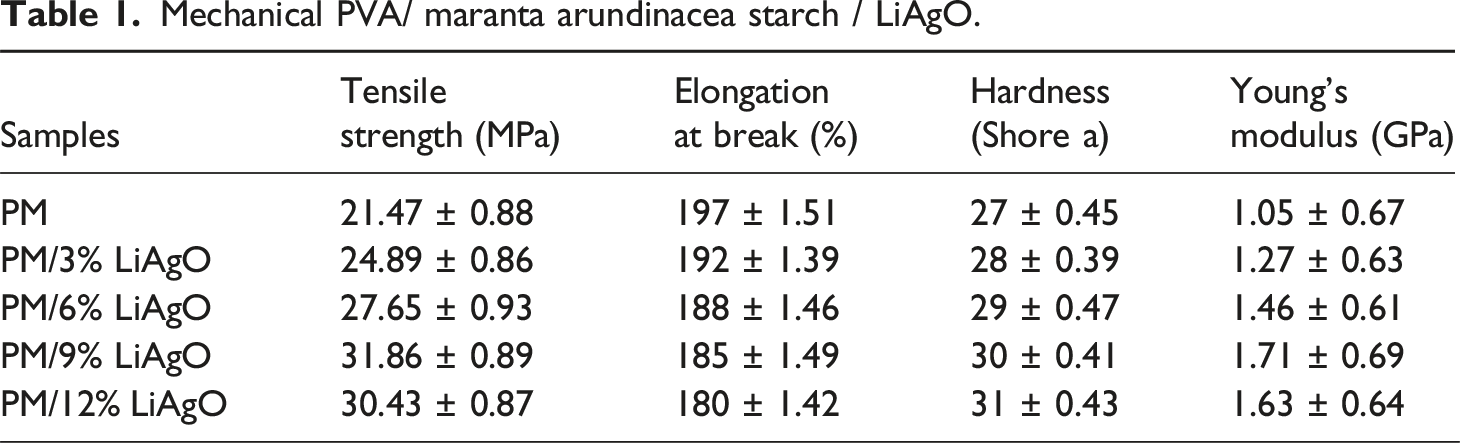
Mechanical properties
Mechanical PVA/ maranta arundinacea starch / LiAgO.
Antibacterial studies
The agar well diffusion method has been employed to assess the antibacterial activity of the prepared NCs against strains of Gram-negative (Escherichia coli) bacteria. The zone of inhibition (ZOI) for each sample has been quantified, with the presence of clear zones around the discs signifying the potency of the antibacterial agents Antibacterial activity of PM and PM/LiAgO blends NCs. ZOI values of PM and PM/LiAgO blend NCs.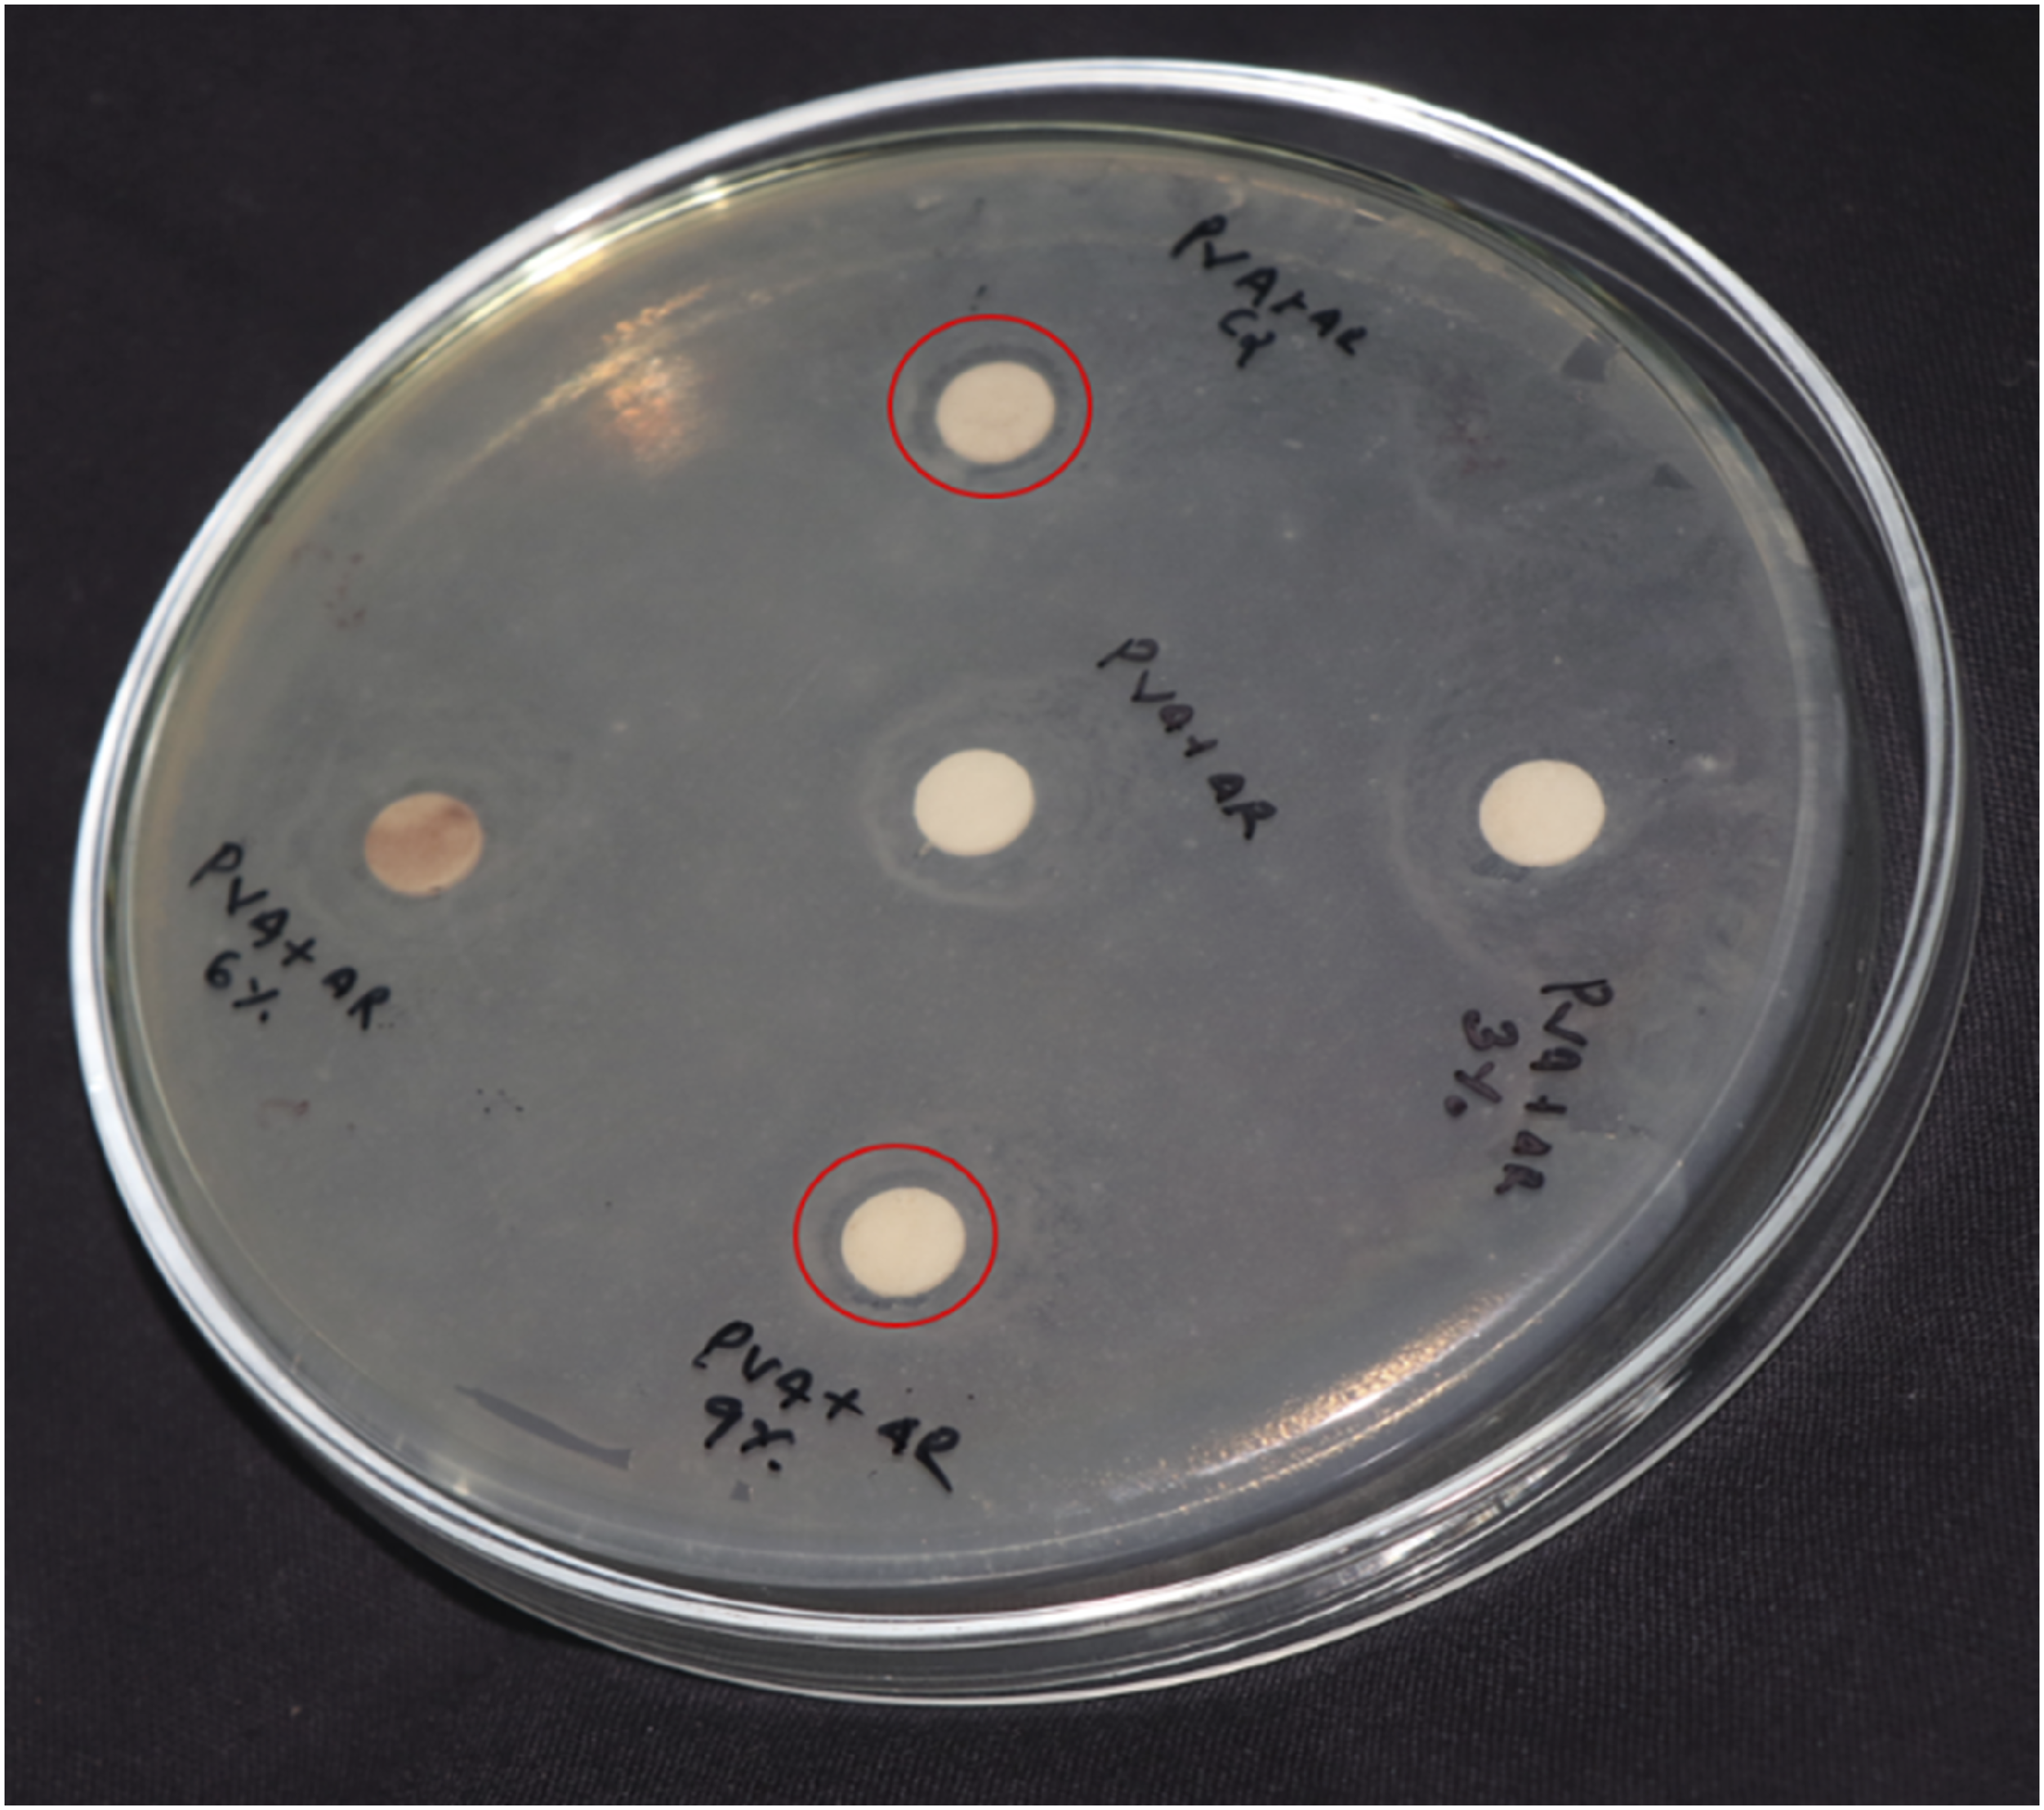
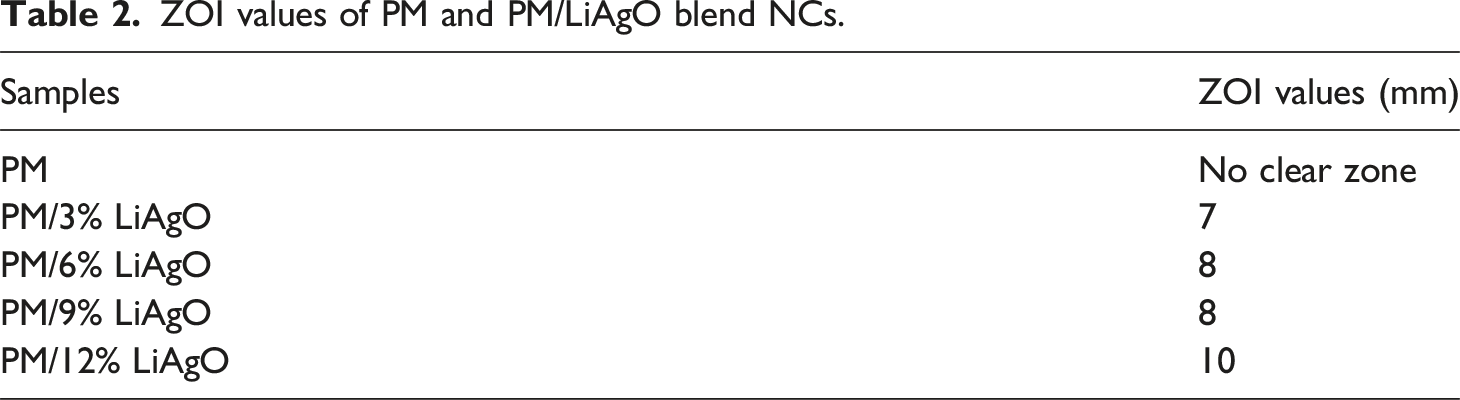
The silver ions exert antibacterial activity through different mechanisms such as disruption of the bacterial cell membrane by attaching to its negatively charged surface resulting in high permeability and release of critical internal components.46,47 Furthermore, Ag+ ions generate reactive oxygen species such as reactive OH radicals and hydrogen peroxide, causing oxidative stress and damaging important cellular components in proteins, and lipids. 48 The attachment of lithium ions further improves the antibacterial activity through diffusion and thereby promotes a sustained release of Ag+. Moreover, the uniform dispersion of LiAgO in the blend, as demonstrated by SEM analysis, enhanced their interaction with bacterial cells by increasing surface exposure. Among the tested NCs, the sample with 12 wt% LiAgO NPs demonstrated the highest antibacterial activity, exhibiting a ZOI of 10 mm against E. coli. These findings underscore the potential of PM/LiAgO nanocomposites as multifunctional materials, integrating biodegradability with good antimicrobial activity, rendering them appropriate for applications in active food packaging, biomedical films and antimicrobial coatings. 49
Conclusion
In summary, we have successfully synthesized and comprehensively characterized PM/LiAgO blend NCs, revealing significant insights into their optical, thermal, mechanical, antibacterial and dielectric performance. The interaction of LiAgO NPs within the blend matrix was confirmed by FTIR spectroscopy. The XRD analysis confirmed the presence of the crystalline LiAgO phase with the amorphous blend, indicating the successful incorporation of the nanofiller. UV-Vis spectroscopy identified the 9 wt% nanocomposite as the optimal formulation, showing maximum absorbance, reduced bandgap energy (5.35 eV) and a high refractive index (1.95). SEM analysis showed clear morphological changes with increasing LiAgO content, highlighting the importance of proper dispersion for optimal performance at 9 wt% loading. Thermal analysis showed improved thermal stability, with the 12 wt% blend NCs exhibiting a maximum degradation temperature of 282°C, surpassing that of the pure blend (246oC). Electrical characterization showed that the conductivity and dielectric properties were significantly influenced by filler concentration, frequency, and temperature. The 9 wt% blend NCs exhibited the highest conductivity of 1.4 × 10⁻⁶ S/cm at 110°C along with an enhanced dielectric constant, suggesting their potential for electronic applications. The incorporation of LiAgO significantly improved the tensile strength and Young’s modulus of the blend NC films, thereby enhancing their mechanical properties. The nanocomposite with 9 wt% LiAgO exhibited a maximum tensile strength of 31.86 ± 0.89 MPa, markedly higher than that of the unfilled blend. The antibacterial assay revealed a strong correlation between LiAgO concentration and E. coli growth inhibition, with the 12 wt% sample exhibiting the highest antibacterial activity, achieving a 10 mm inhibition zone. This study concludes that PM/LiAgO nanocomposite films demonstrated enhanced optical, morphological, thermal, mechanical, electrical and antibacterial properties. These findings highlight their potential as sustainable, environmentally benign materials for use in optoelectronics, active food packaging, and antimicrobial surfaces.
Footnotes
Acknowledgements
The authors are grateful to Rubber Research Institute of India, Kottayam and Sophisticated Test and Instrumentation Centre (STIC), CUSAT for providing characterization facilities.
Declaration of conflicting interests
The author(s) declared no potential conflicts of interest with respect to the research, authorship, and/or publication of this article.
Funding
The author(s) received no financial support for the research, authorship, and/or publication of this article.
Data Availability Statement
The data that support the findings of this study are available from the corresponding author upon reasonable request.