
Abstract
The non-isothermal crystallization kinetics of both pure ethylene-vinyl acetate copolymer (EVA) and EVA/butadiene rubber (BR) thermoplastic vulcanizate (TPV) which was prepared through dynamic vulcanization were investigated via differential scanning calorimetry (DSC). The mechanism of non-isothermal crystallization was analyzed using the Avrami model modified by the Jeziorny method, along with the Ozawa and Mo methods. The results demonstrated that the non-isothermal crystallization behavior of both EVA/BR TPV and pure EVA could not be accurately described by the Ozawa method. In contrast, the Jeziorny and Mo methods provided a more precise representation of the crystallization behavior. Data analysis revealed that EVA exhibited a faster crystallization rate compared to EVA/BR TPV. In contrast, the initial crystallization temperature of EVA was lower than that of the EVA/BR TPV. In conclusion, BR served as a nucleating agent in EVA/BR TPV, facilitating the nucleation of the EVA phase. However, due to the steric hindrance effects, the EVA crystal growth process was hindered by the existence of BR phase.
Keywords
Introduction
Ethylene-vinyl acetate copolymer (EVA) is a generally used polymer due to its versatile properties, including flexibility, toughness and transparency, which make it suitable for diverse industrial applications such as adhesives, packaging and foams.1–4 It is crucial to understand the non-isothermal crystallization kinetics of EVA in order to optimize its processing parameters and ultimate properties. The crystallization behavior of EVA under varying heating or cooling rates can be understood through the research of the non-isothermal crystallization kinetics, which affects its mechanical and thermal properties greatly. 5 In recent years, considerable efforts have been dedicated to studying the crystallization mechanisms of EVA in order to predict its processing behavior more accurately and improve its properties for various applications.
Butadiene rubber (BR) is the second-largest universal synthetic rubber in the world. It has important applications in the automotive industry, cold resistant products and cushioning products due to its characteristics including high elasticity, good low-temperature performance, excellent wear resistance and good flexural flexibility.6–9
Incorporating other elastomeric materials into EVA has gained attention for producing thermoplastic vulcanizates (TPVs) with enhanced mechanical flexibility and elasticity which consist of crosslinked rubber dispersed within a thermoplastic matrix.10–12 Due to the feature, TPVs have applications in many ways, such as automotive, construction and consumer goods applications.13–15 Because EVA is a semi-crystalline resin, the degree of EVA crystallization would have a significant impact on its mechanical properties, thermal properties and crystalline morphology. 16 It’s important to notice that the introduction of BR would inevitably affect the crystallization process of EVA. However, the non-isothermal conditions of EVA/BR blends were more complex than those of pure EVA due to the complex interaction between the thermoplastic resin and rubber phases. In order to understand the influence of the interactions on the crystallization rate, it is essential to research the non-isothermal crystallization kinetics of EVA/BR TPV.
The non-isothermal crystallization behavior of some TPV systems has been studied, such as EVA/NBR TPV, LDPE/SBR TPV, EMA/CR TPV, et.al.17–19 However, the EVA/BR TPV has not been reported. In this research, EVA was initially blended with BR to prepare EVA/BR TPV through dynamic vulcanization. The non-isothermal crystallization behavior of both EVA and EVA/BR TPV were characterized using differential scanning calorimetry (DSC). The analysis was carried out systematically by applying the Jeziorny and Mo methods.
Experimental
Materials
EVA, brand 630, with 16.0% vinyl acetate content, was commercially manufactured by Tosoh Co., Ltd., Japan; BR, grade 9000, with 96% cis content, from Dushanzi Petrochemical Co., Ltd., China. Zinc oxide (ZnO), stearic acid (SA), N-phenyl-2-naphthylamine (antioxidant D), N-cyclohexyl-N'-phenyl-p-phenylenediamine (antioxidant 4010), N-cyclohexylbenzothiazole-2-sulphenamide (accelerator CZ), tetramethyl thiuram disulfide (TMTD) and sulfur (S) used were all common industrial grade products.
Equipment and instruments
The instruments and corresponding manufacturers of the experiment.
Sample preparation
The composition of the BR system included the following compositions: 100 phr (per hundred rubber by weight) BR, 5.0 phr ZnO, 2.0 phr SA, 1.5 phr antioxidant D, 0.5 phr antioxidant 4010, 1.2 phr accelerator CZ, 0.35 phr TMTD, 2.0 phr S.
Firstly, the BR rubber was mixed with the various additives on a two-roll mill at room temperature to prepare the pre-blend. Secondly, the BR pre-blend was introduced on a two-roll mill at 160°C after the EVA was fully melted, followed by the dynamic vulcanization of 8 minutes. The weight ratio of EVA/BR was 40/60. Finally, the dynamically vulcanized sample was preheated on a plate vulcanizer at 160°C for 5 min, followed by hot pressing for 8 minutes and cool pressing for 8 min. The pressure and temperature of the hot pressing were 10 MPa and 160°C, respectively.
Characterizations
A material testing machine was used to test the mechanical properties of the pure BR, EVA and EVA/BR TPV according to ASTM D412, where the BR and EVA/BR TPV used a cross-head speed of 500 mm/min, and EVA used a cross-head speed of 50 mm/min. The size of the dumbbell-shaped test specimens are used according to ASTM D412, and each specimen is tested three times. A field emission scanning electron microscopy (FE-SEM) was used to observe the microstructure of the EVA/BR TPV. In order to observe the etched surface of TPV, the sample was placed in xylene solution at 80°C for 30 min. A DSC was used to investigate the non-isothermal crystallization process of the EVA/BR TPV and pure EVA with a sample mass of 6∼8 mg. In order to eliminate thermal history, the sample was first heated to 140°C with a heating rate of 20°C/min to ensure complete melting in a nitrogen environment, followed by maintaining a stable temperature for 10 min. Subsequently, the sample was then cooled down to room temperature at different cooling rates of 25, 20, 15, 10 and 5°C/min.
Results and discussion
Mechanical properties of the pure BR, EVA and EVA/BR TPV
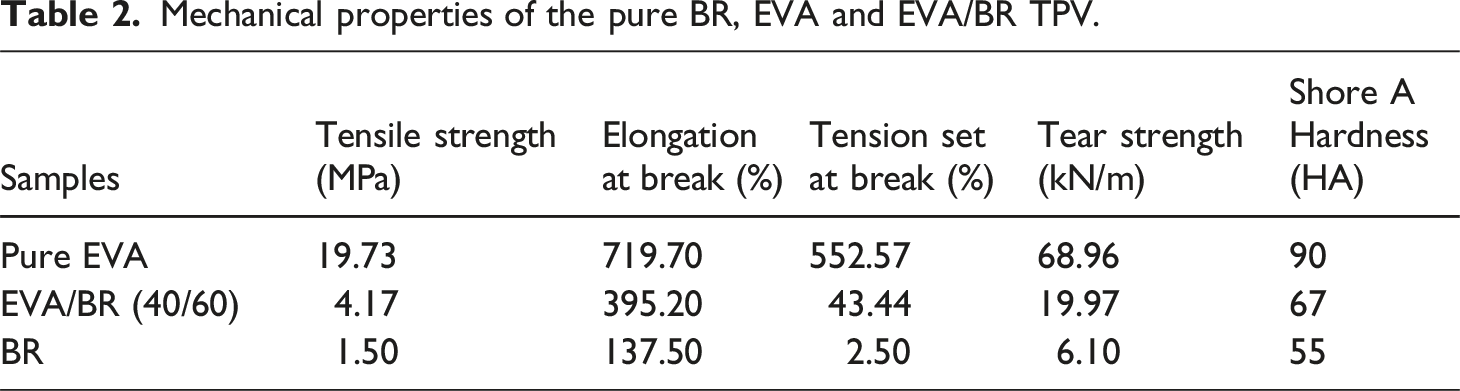
The stress–strain curves of the pure BR, EVA and EVA/BR TPV were shown in Figure 1. It can be seen from the Figure 1 that the pure EVA exhibited the tensile behavior of typical ductile plastics, meanwhile, both the stress-strain curves of the BR and EVA/BR TPV showed the obvious elastomer characteristic. The mechanical properties of the pure BR, EVA and EVA/BR TPV can be seen in Table 2. It was worth noting that the elongation at break and tension set of the EVA/BR TPV were between those of the pure BR and those of the EVA, while the tensile strength, tear strength and Shore A hardness of the EVA/BR TPV were between those of the pure BR and EVA. Stress–strain curves of the pure EVA, BR and EVA/BR TPV. Mechanical properties of the pure BR, EVA and EVA/BR TPV.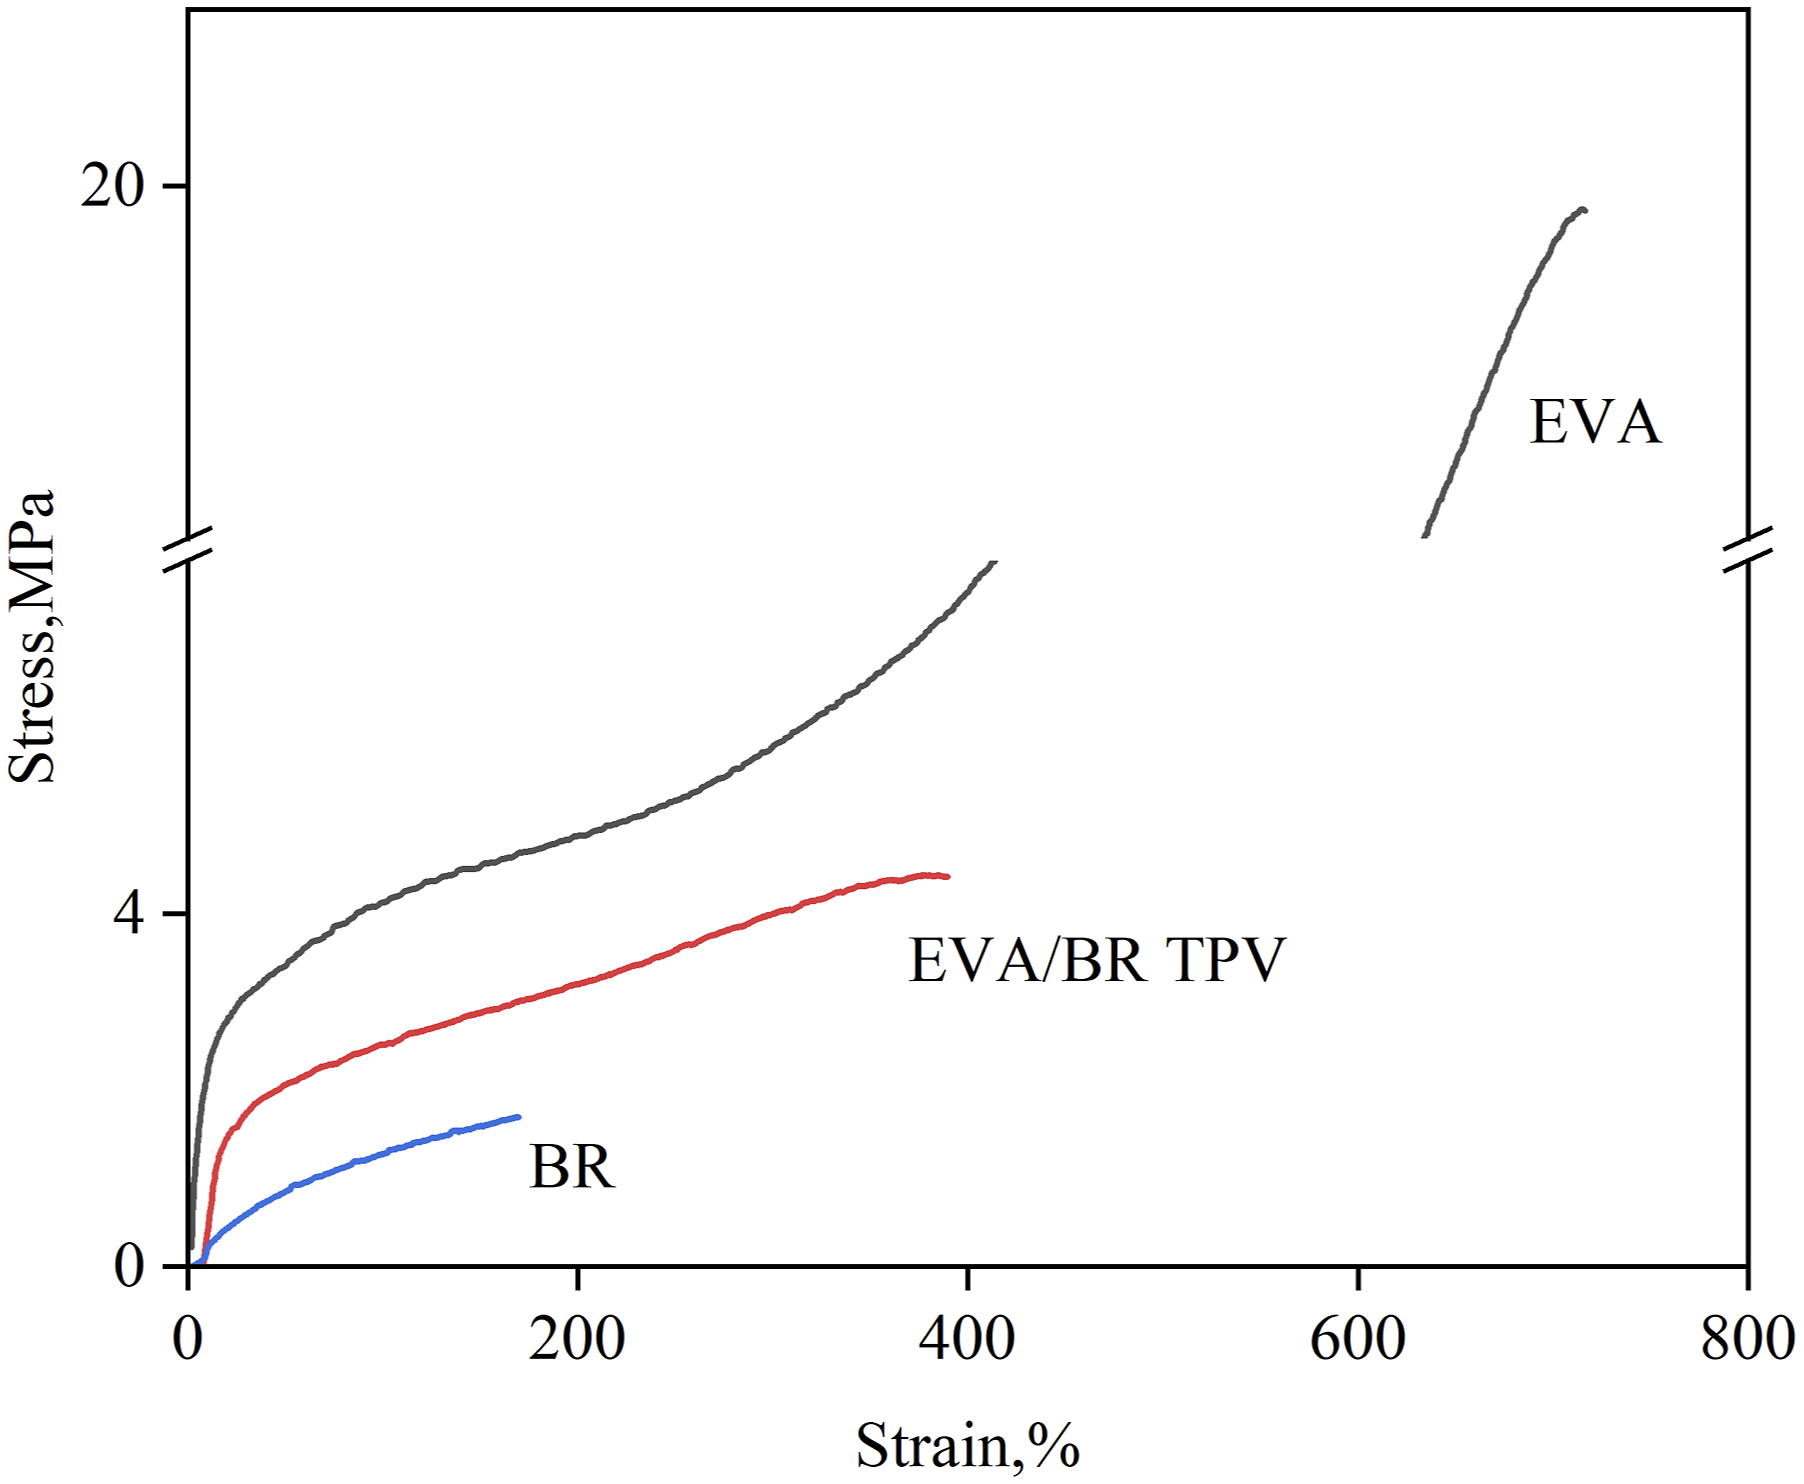
Morphology and microstructure of the EVA/BR TPV
The FE-SEM images of the EVA/BR TPV were shown in Figure 2. It can be seen that the cryogenically fractured surface was relatively flat, indicating the good interface interaction between the EVA thermoplastic resin and BR phases. A sea-island structure can be observed from the etched surface, in which the BR particles size ranged from 3–6 μm. FE-SEM images of the EVA/BR TPV (a) cryogenically fractured surface; (b) etched surface.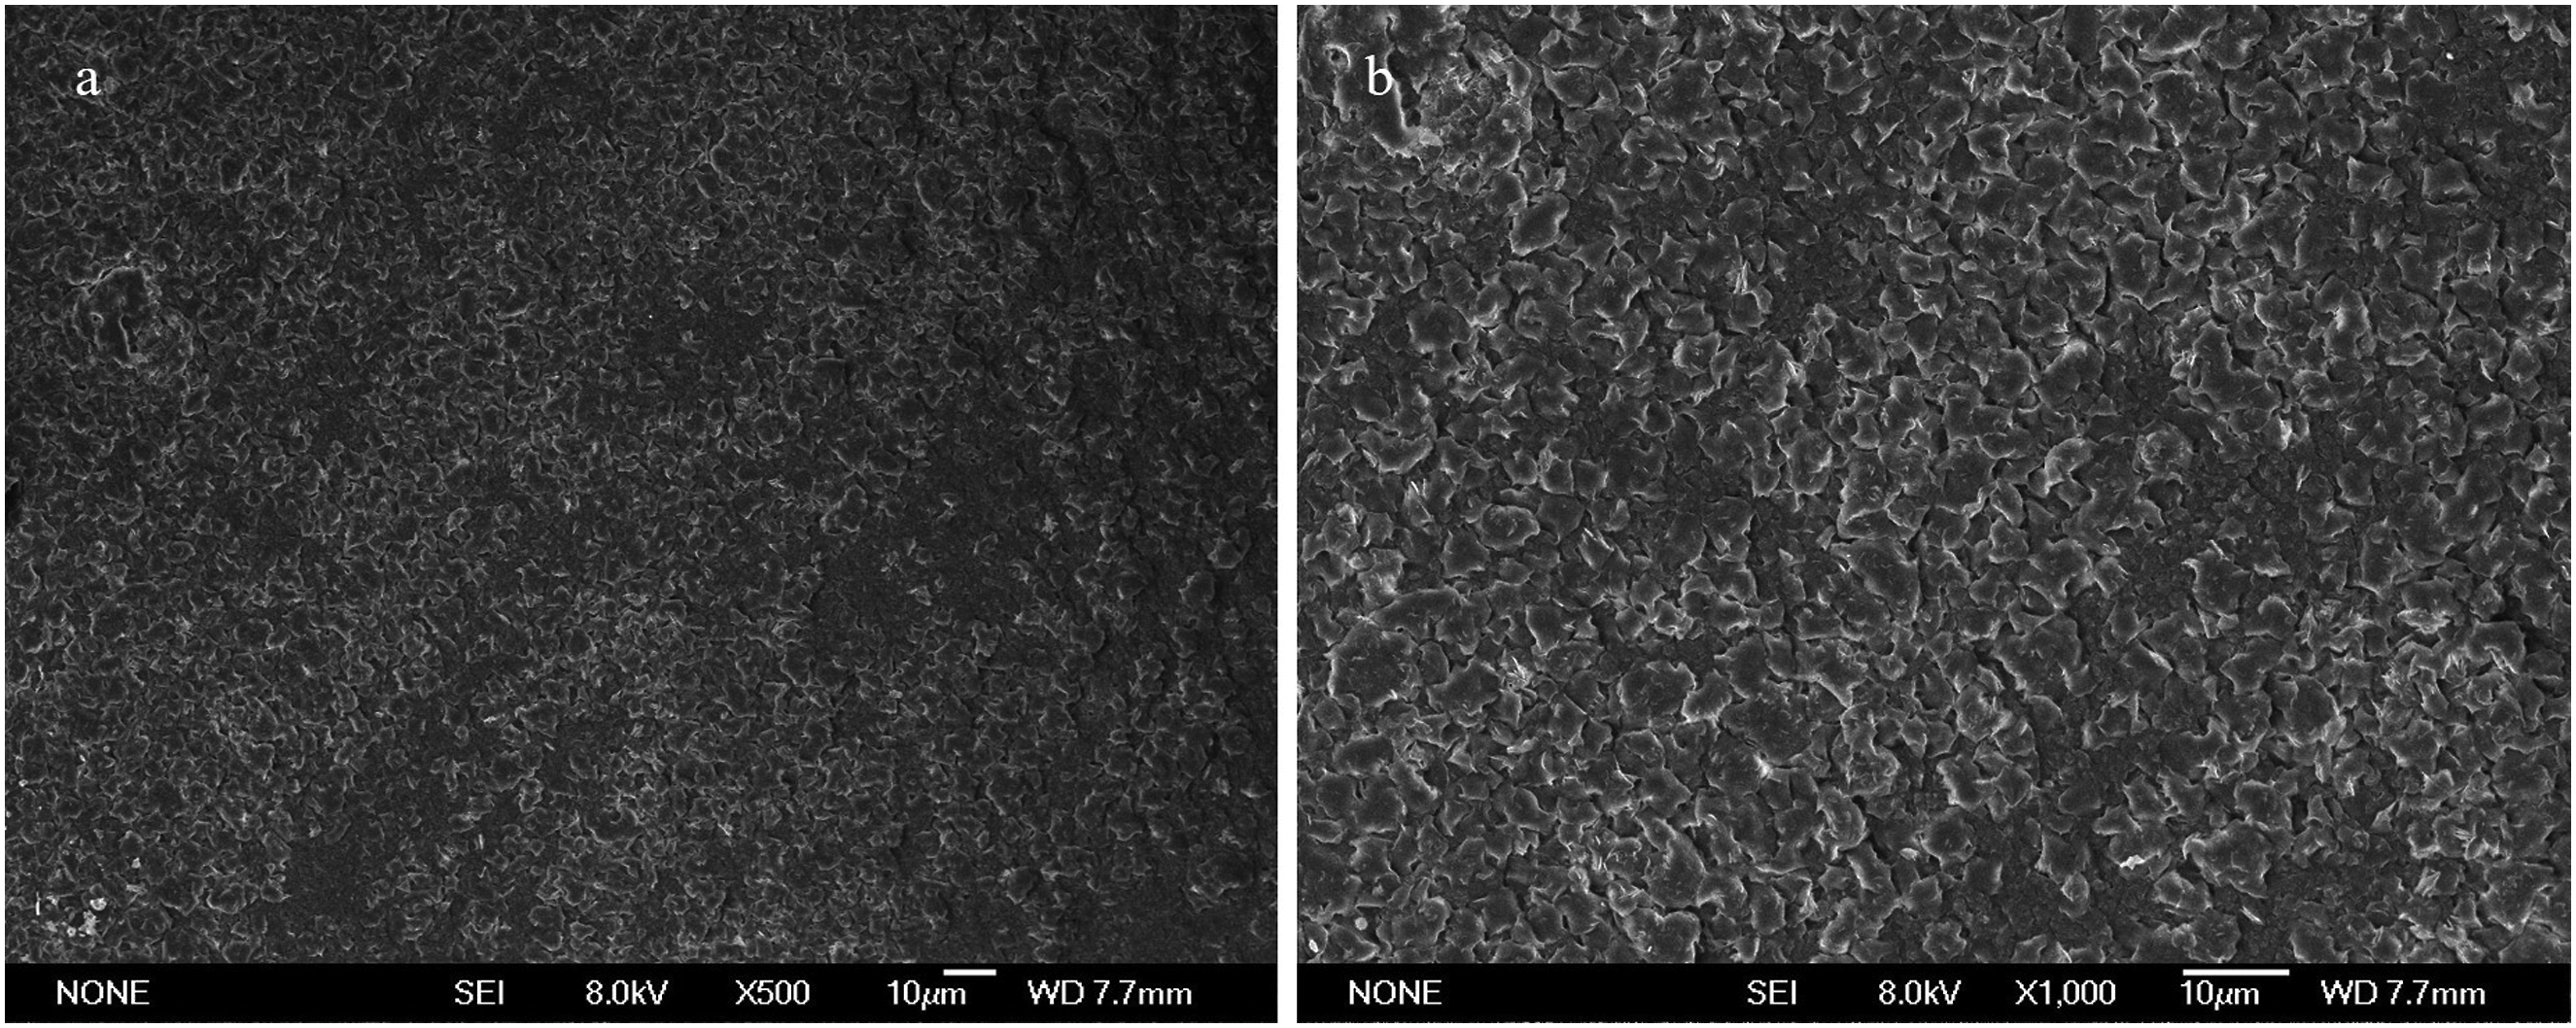
Non-isothermal crystallization kinetics of EVA and EVA/BR TPV
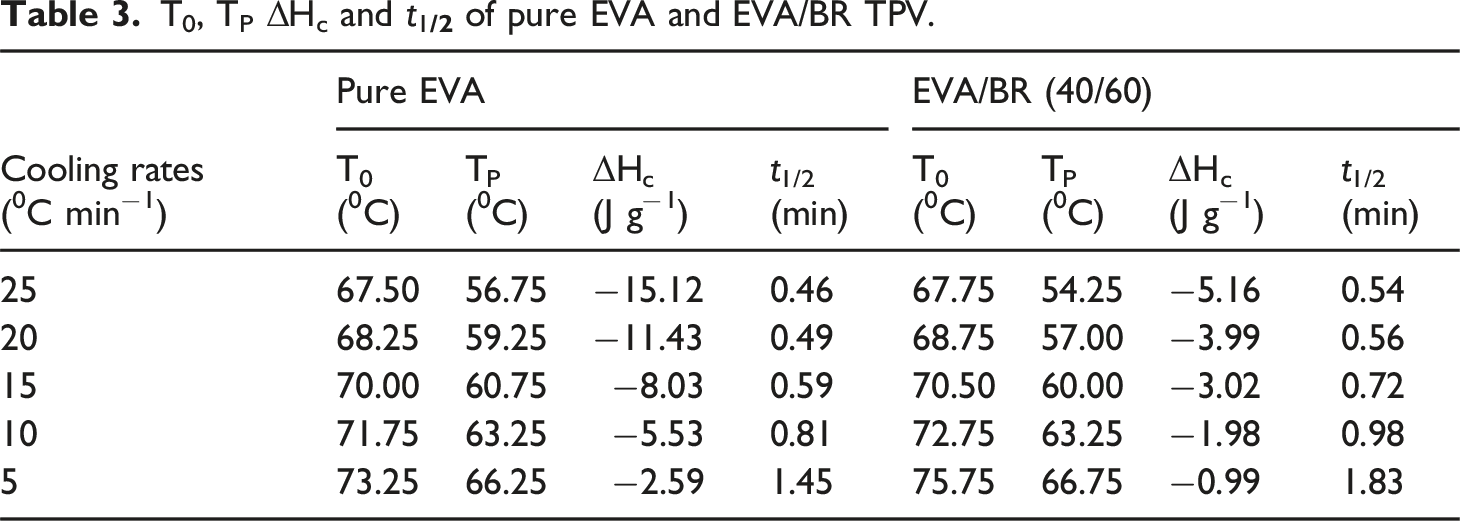
The non-isothermal crystallization curves of the EVA/BR TPV and pure EVA were shown in Figure 3. The curves of the EVA/BR TPV and pure EVA obtained at diverse cooling rates exhibit a single exothermic crystallization peak. The crystallization peak temperature (T
p
), original crystallization temperature (T
0
), crystallization enthalpy change (ΔH
c
) and half-crystallization time (t
1/2
) were listed in Table 3. The time needed to achieve 50% relative crystallinity was referred to as the t
1/2
. As the cooling rate increased, both T
0
and T
p
of the EVA decreased, with T
0
dropping from 73.25°C to 67.50°C, T
p
from 66.25°C to 56.75°C, t
1/2
from 1.45 min to 0.46 min and ΔH
c
from −2.59 J/g to −15.12 J/g. Similarly, the T
0
of EVA/BR TPV decreases from 75.75°C to 67.75°C, T
p
from 66.75°C to 54.25°C, t
1/2
from 1.83 min to 0.54 min and ΔH
c
from −0.99 J/g to −5.16 J/g. It is essential to notice that most of the T
0
and T
p
of the EVA were lower than those of EVA/BR TPV, indicating that BR acted as the nucleating agent in the crystallization process of the EVA/BR TPV and promoted the formation of the EVA crystal nucleus. The t
1/2
of EVA was lower than that of the EVA/BR TPV, indicating that BR would hinder the crystal growth of EVA, resulting in a longer time of crystallization. The decline in T
0
and t
1
/
2
with the increasing cooling rate in both EVA and EVA/BR TPV was primarily due to the relaxation characteristics of EVA macromolecular chains. The transition of macromolecular chains to an ordered lattice from a random coil required a specific time.
20
The movement ability of macromolecular chains increased with rising temperature during the non-isothermal crystallization process, indicating that the movement ability of EVA macromolecular chains was stronger at the lower cooling rate. The non-isothermal crystallization curves of the EVA/BR TPV and pure EVA (a) pure EVA; (b) EVA/BR TPV. T0, TP ΔHc and t1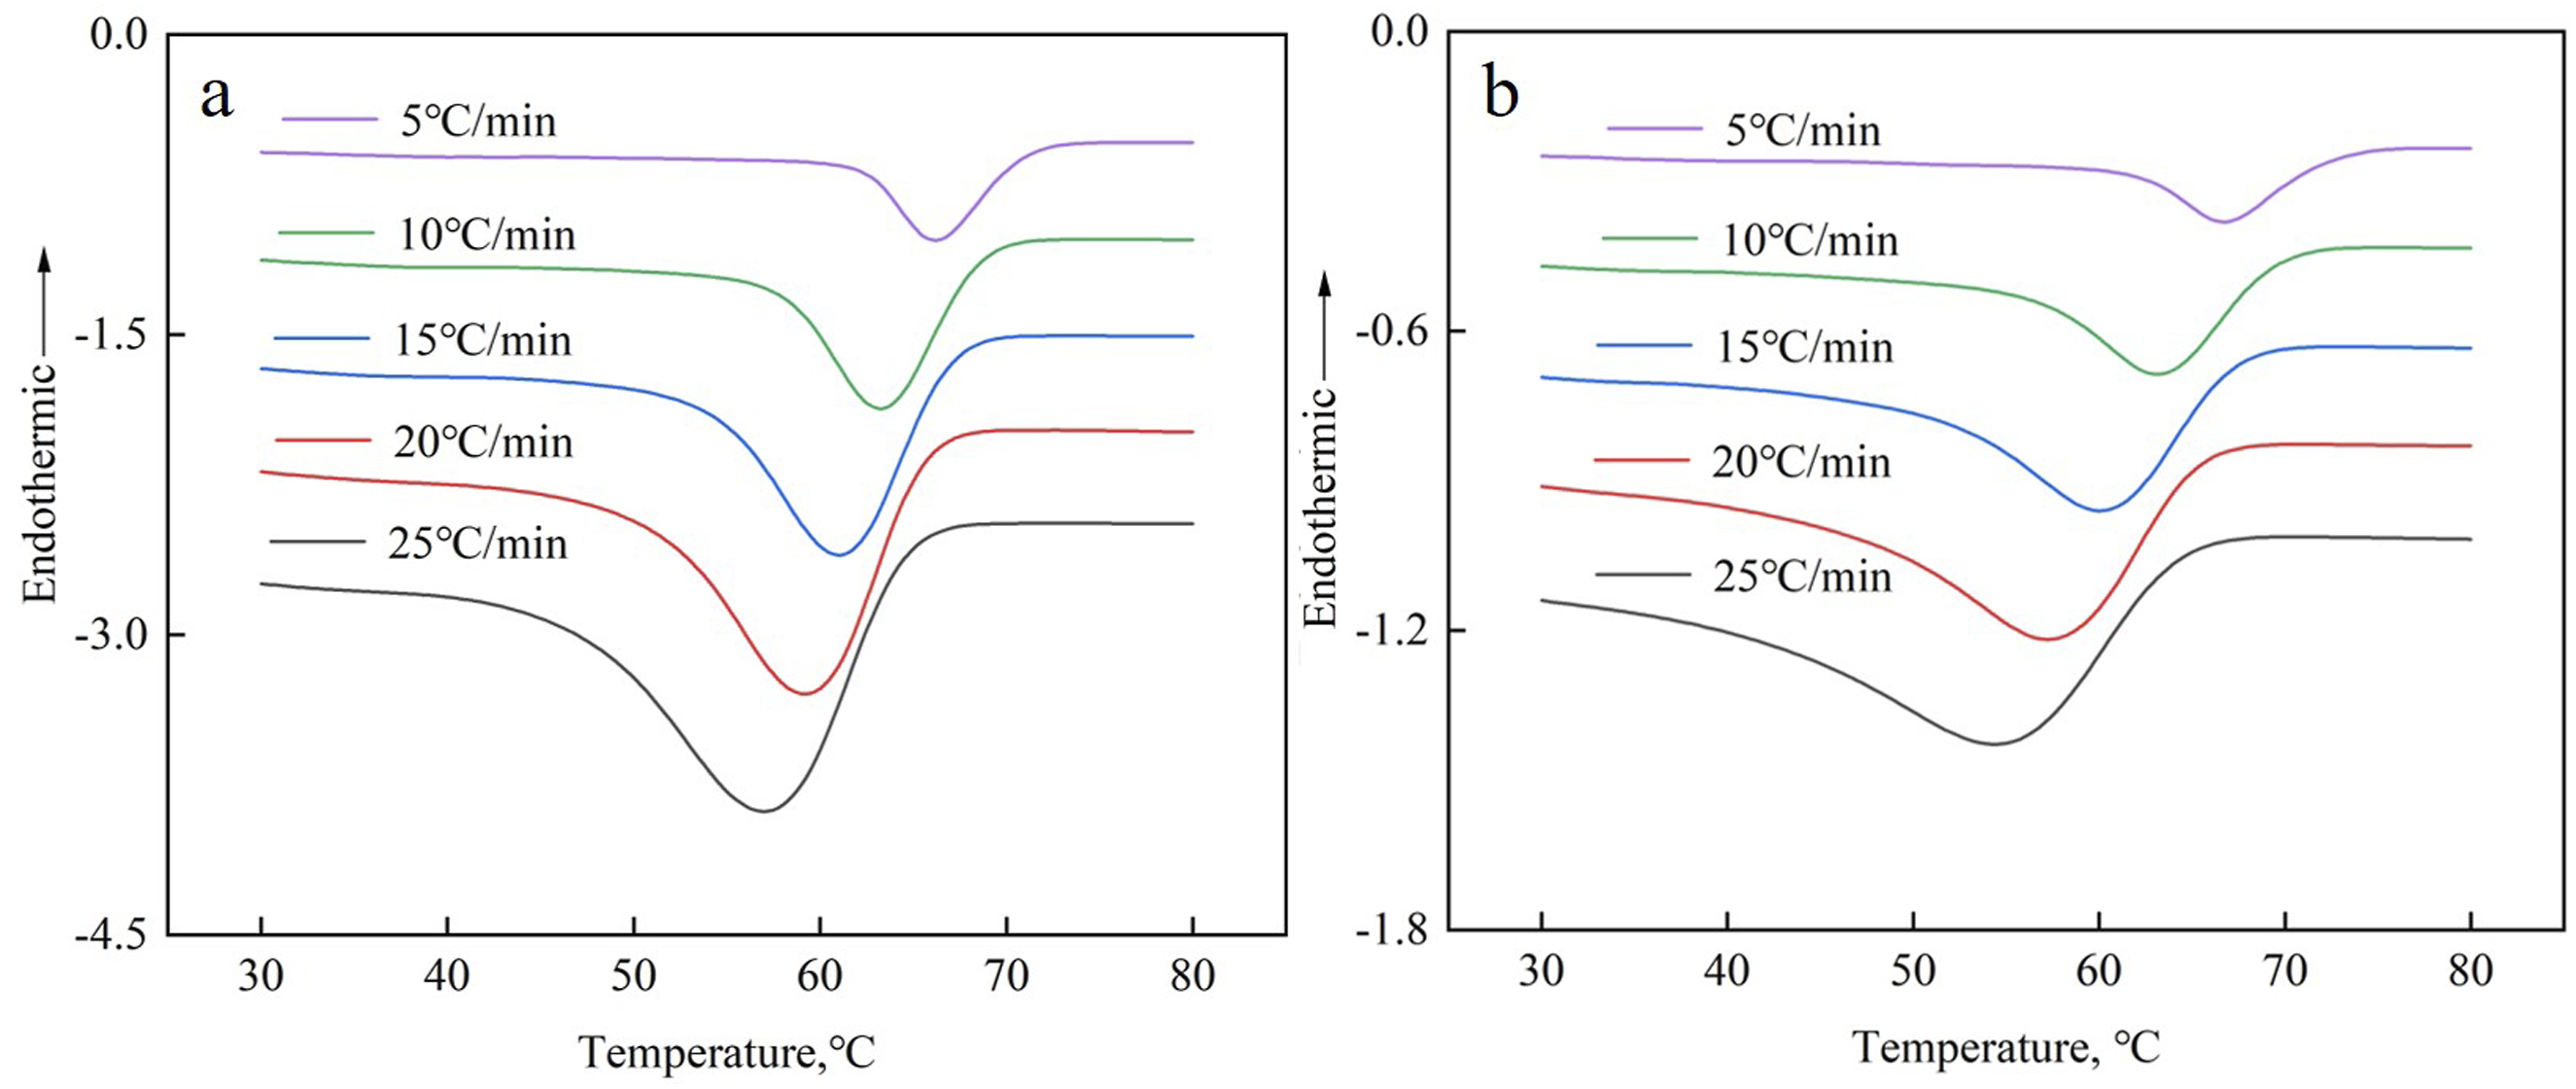
Influence of cooling rate on the non-isothermal crystallization temperature and time of both EVA and EVA/BR TPV
The relationship curves between temperature and relative crystallinity (X
t
) for EVA/BR TPV and pure EVA were shown in Figure 4. X
t
can be determined using the following formula, where dH represents the enthalpy of cold crystallization, T
c
is the termination crystallization temperature, T
0
is the original crystallization temperature, t is the crystallization time.21,22 Variation in relative crystallinity as a function of temperature for the EVA/BR TPV and pure EVA (a) EVA/BR TPV; (b) pure EVA.
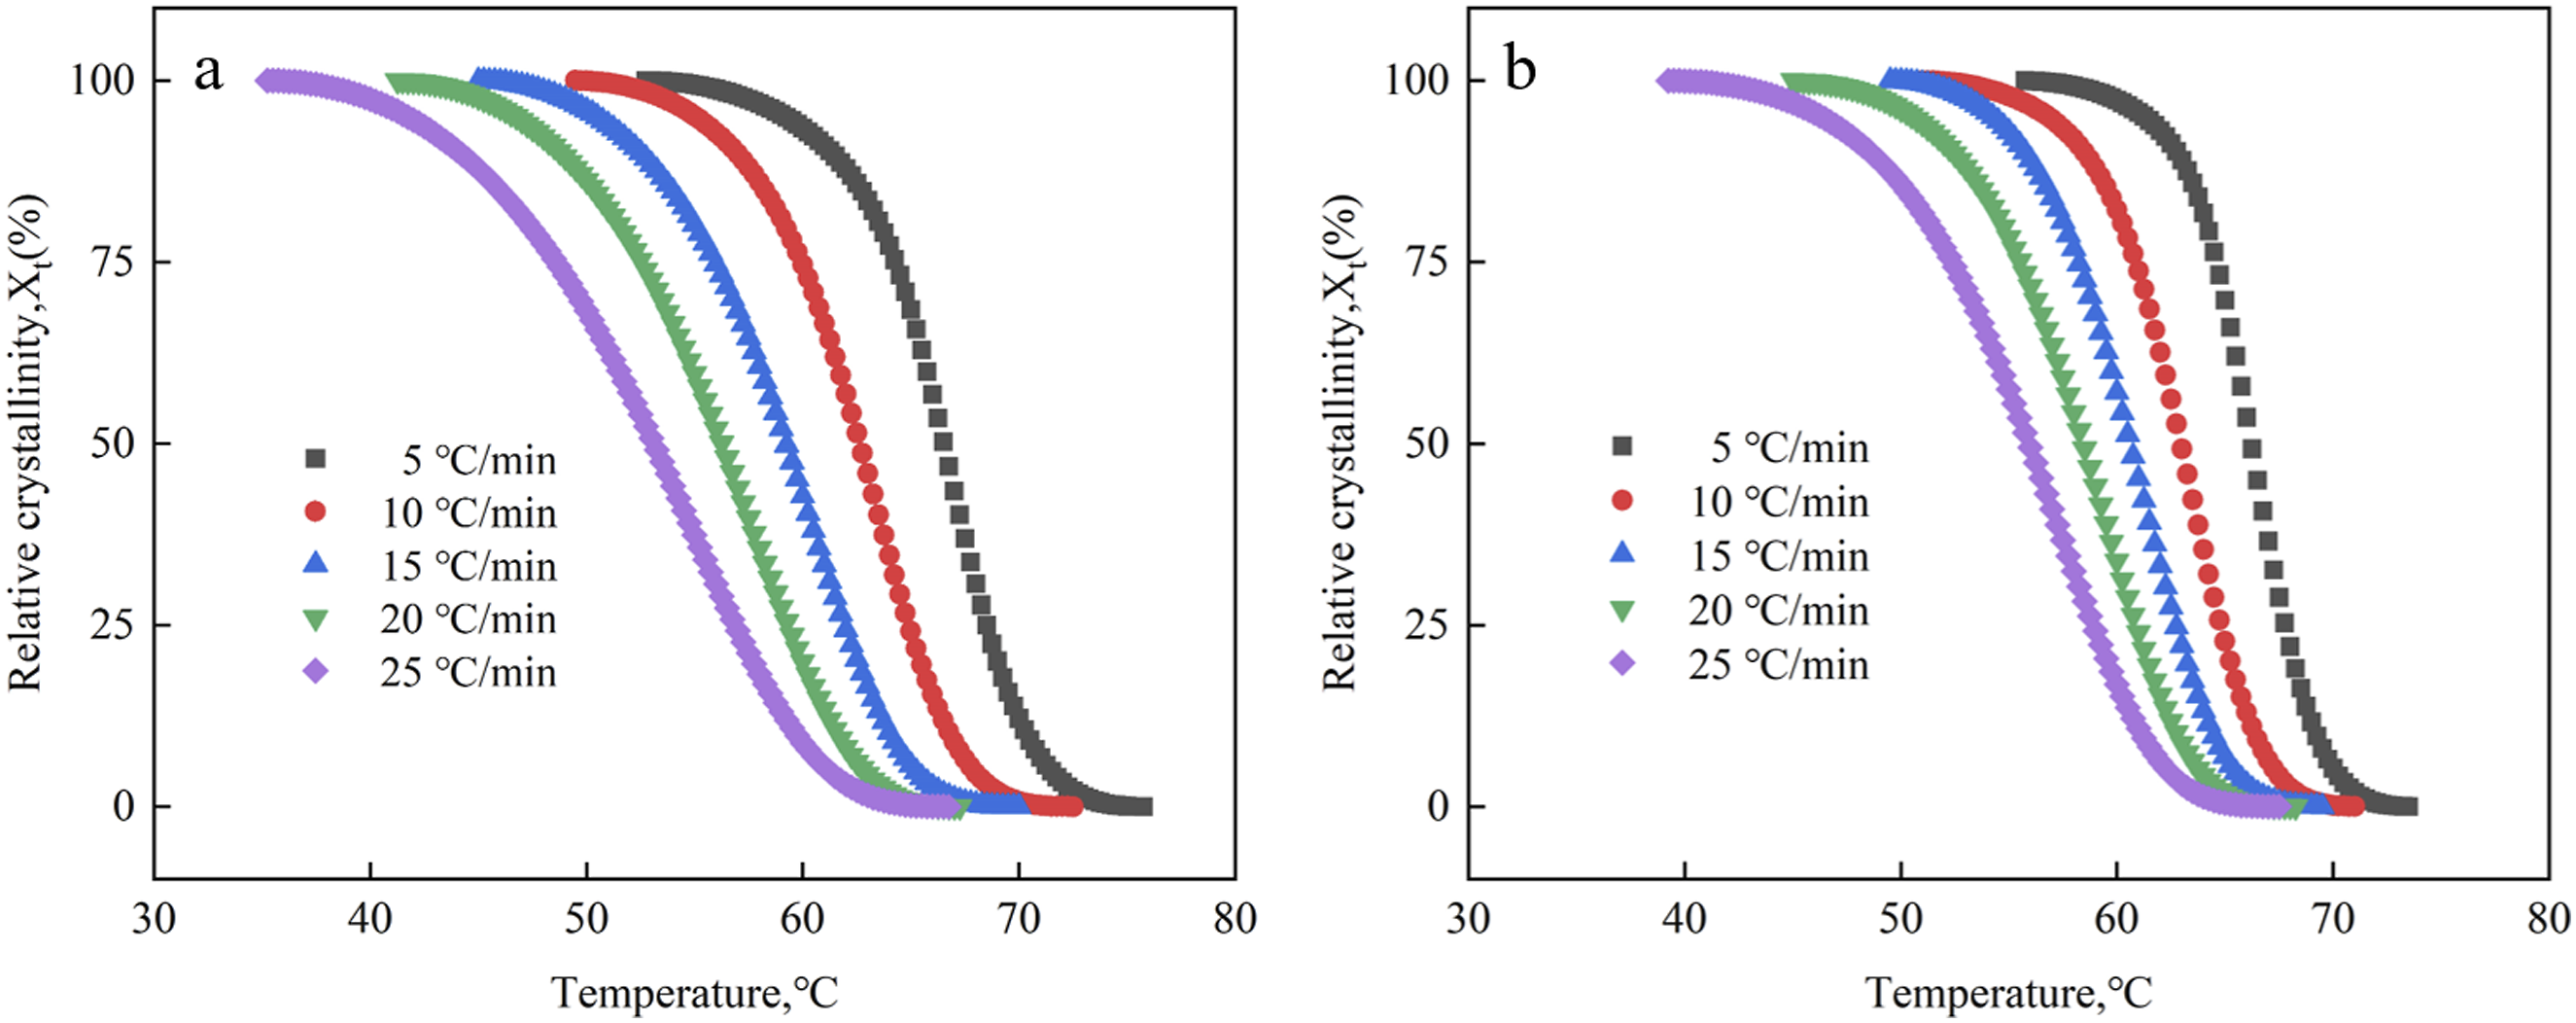
It can be seen the curves in Figure 4 were both anti-S-shaped, and the curves shifted to the left with the rising cooling rates. The X t of the EVA/BR TPV and pure EVA all increased with the decreasing cooling rate at the same temperature, because the generation of crystal nuclei and the expansion of crystals required a certain amount of time to complete, which lags behind the change in temperature. Therefore, as the cooling rate decreased, the formation of crystal nuclei and subsequent crystal growth occurred at higher temperatures, leading to a rightward shift in the curve However, the temperature associated with the initial point of the EVA/BR TPV curve was greater than that of EVA at the identical cooling rate, indicating that the formation of EVA crystal nuclei was promoted by BR phase. However, the terminate crystallization temperature linked to the EVA/BR TPV curve is lower than that of EVA, signaling that the addition of BR in the matrix inhibited the crystal growth of EVA.
The t can be obtained from formula (2) and the φ represents the cooling rate.
The correlation curves between time and relative crystallinity (X
t
) for EVA/BR TPV and pure EVA were shown in Figure 5. The curves in Figure 5 were all S-shaped and the time required for the crystallization decreased significantly with the rising cooling rate, indicating that the crystallization rate of EVA/BR TPV and pure EVA can be accelerated by increasing the cooling rate appropriately. The t
1
/
2
to reach maximum crystallinity of EVA/BR TPV were longer than those of the pure EVA, indicating that the crystallization process of EVA was hindered by the BR phase in TPV. Variation in relative crystallinity as a function of time for the EVA/BR TPV and pure EVA (a) EVA/BR TPV; (b) pure EVA.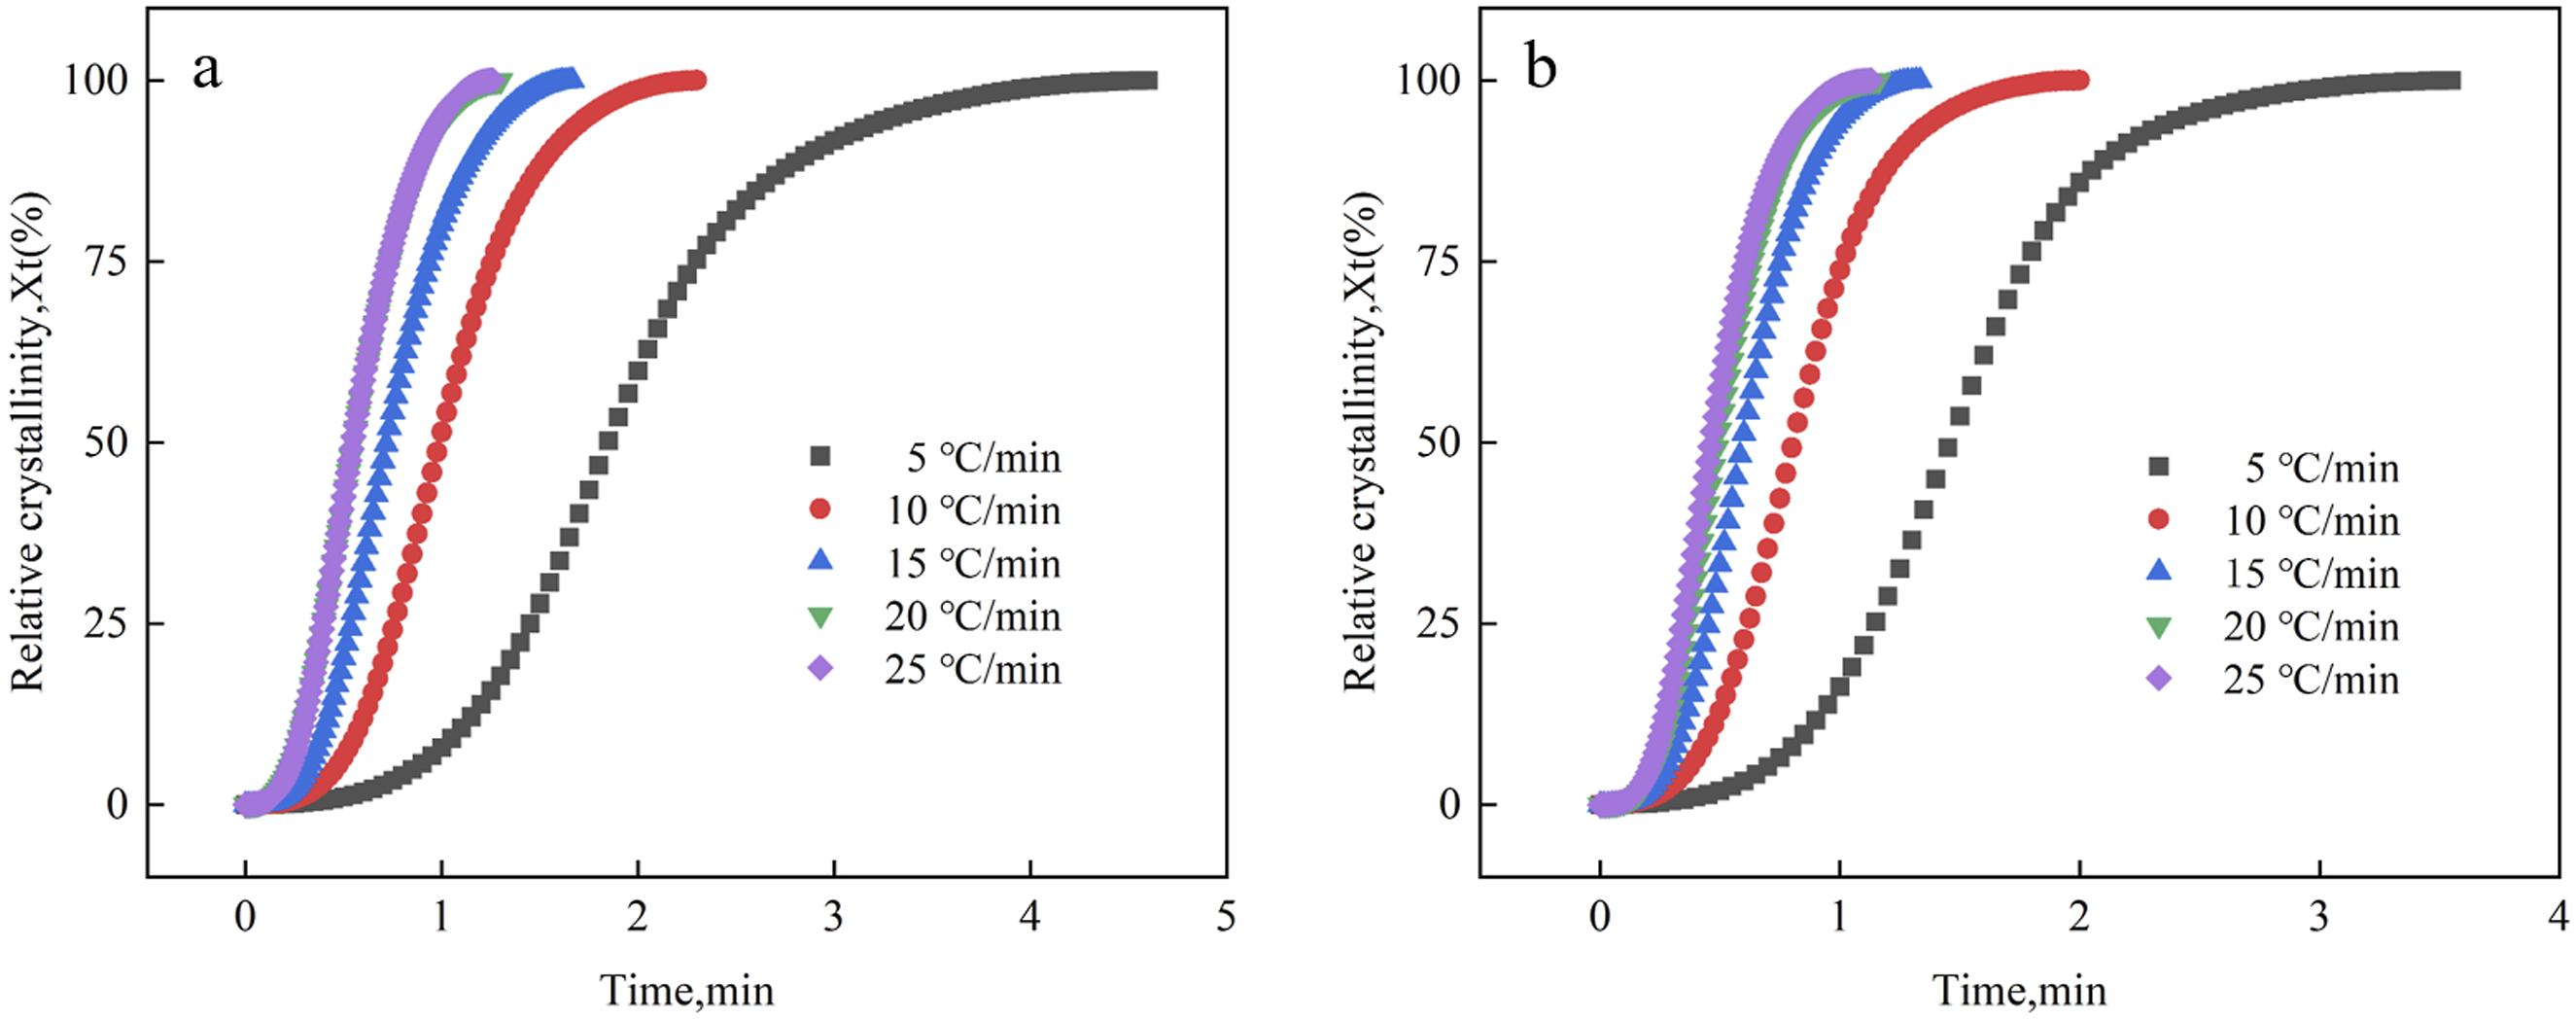
Avrami method
The influence of thermal conditions on the microstructure and crystallization process of polymer can be revealed by the non-isothermal crystallization kinetics, providing a theoretical basis for guiding the polymer molding process.
23
Additionally, the process of non-isothermal crystallization is considered to be closer to actual production than isothermal crystallization and can be evaluated through experiments systematically. The Avrami method is typically employed to examine the initial crystallization phase during the isothermal crystallization process and represent the crystallization kinetics. Typically, the Jeziorny method was used to adjust the Avrami method. The equation from the Jeziorny method is as follows24–26:
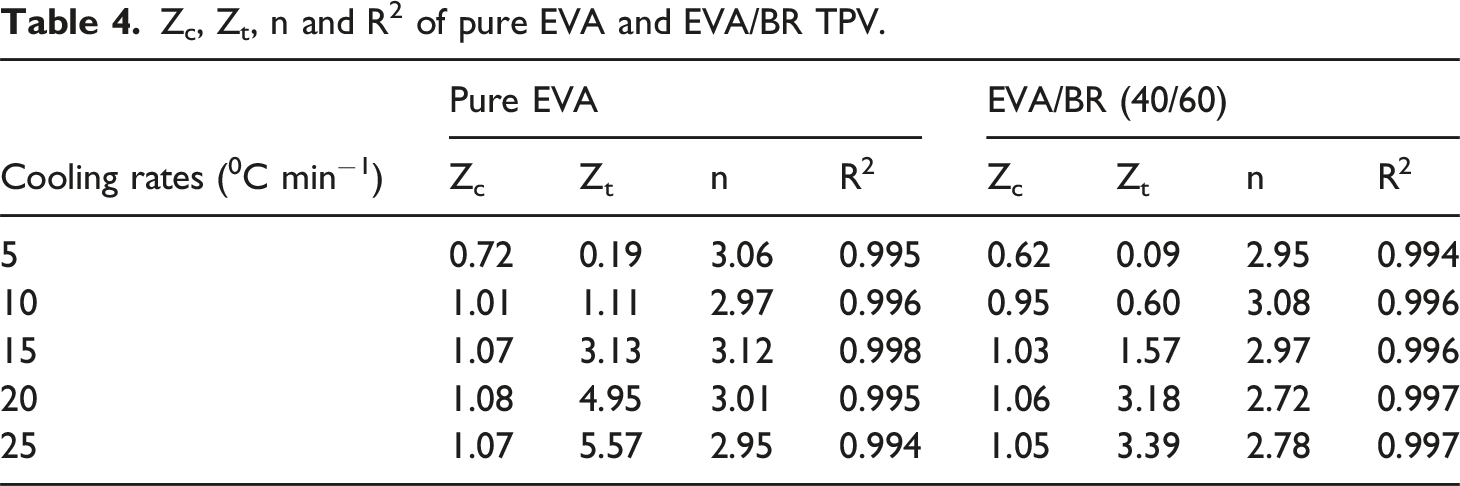
The relationship between ln t and ln[-ln(1-Xt)] for EVA/BR TPV and pure EVA was plotted and the fitted curves were obtained as shown in Figure 6. The fitted curves between ln t and ln[-ln(1-Xt)] show a linear relationship, indicating that the non-isothermal crystallization behavior of EVA/BR TPV and pure EVA can be described by the Jeziorny method accurately. The slope of the fitted curve was used to determine n, while the intercept was used to determine Z
t
. Table 4 shows the n values, Z
t
, Z
c
and correction factor R
2
values for the EVA/BR TPV and pure EVA. The n values for the pure EVA ranged from 2.9 to 3.2, while the n value for the EVA/BR TPV ranged from 2.7 to 3.1, both of which were affected by the cooling rate, indicating that the crystallization growth mode of EVA/BR TPV and pure EVA is affected by the cooling rate, exhibiting a heterogeneous nucleation process. The R
2
value can be used to indicate the quality of the fit, with the R
2
values for both EVA/BR TPV and pure EVA being greater than 0.99, demonstrating a good linear fit. It can be seen that the Z
c
of both EVA/BR TPV and pure EVA increased with the rising cooling rate of 5∼20°C/min and the Z
c
of the EVA/BR TPV was lower than that of EVA, indicating that the EVA crystallization was hindered by the addition of BR. ln(–ln(1–Xt)) versus ln t for EVA/BR TPV and pure EVA for the Jeziorny model (a) EVA/BR TPV; (b) pure EVA. Zc, Zt, n and R2 of pure EVA and EVA/BR TPV.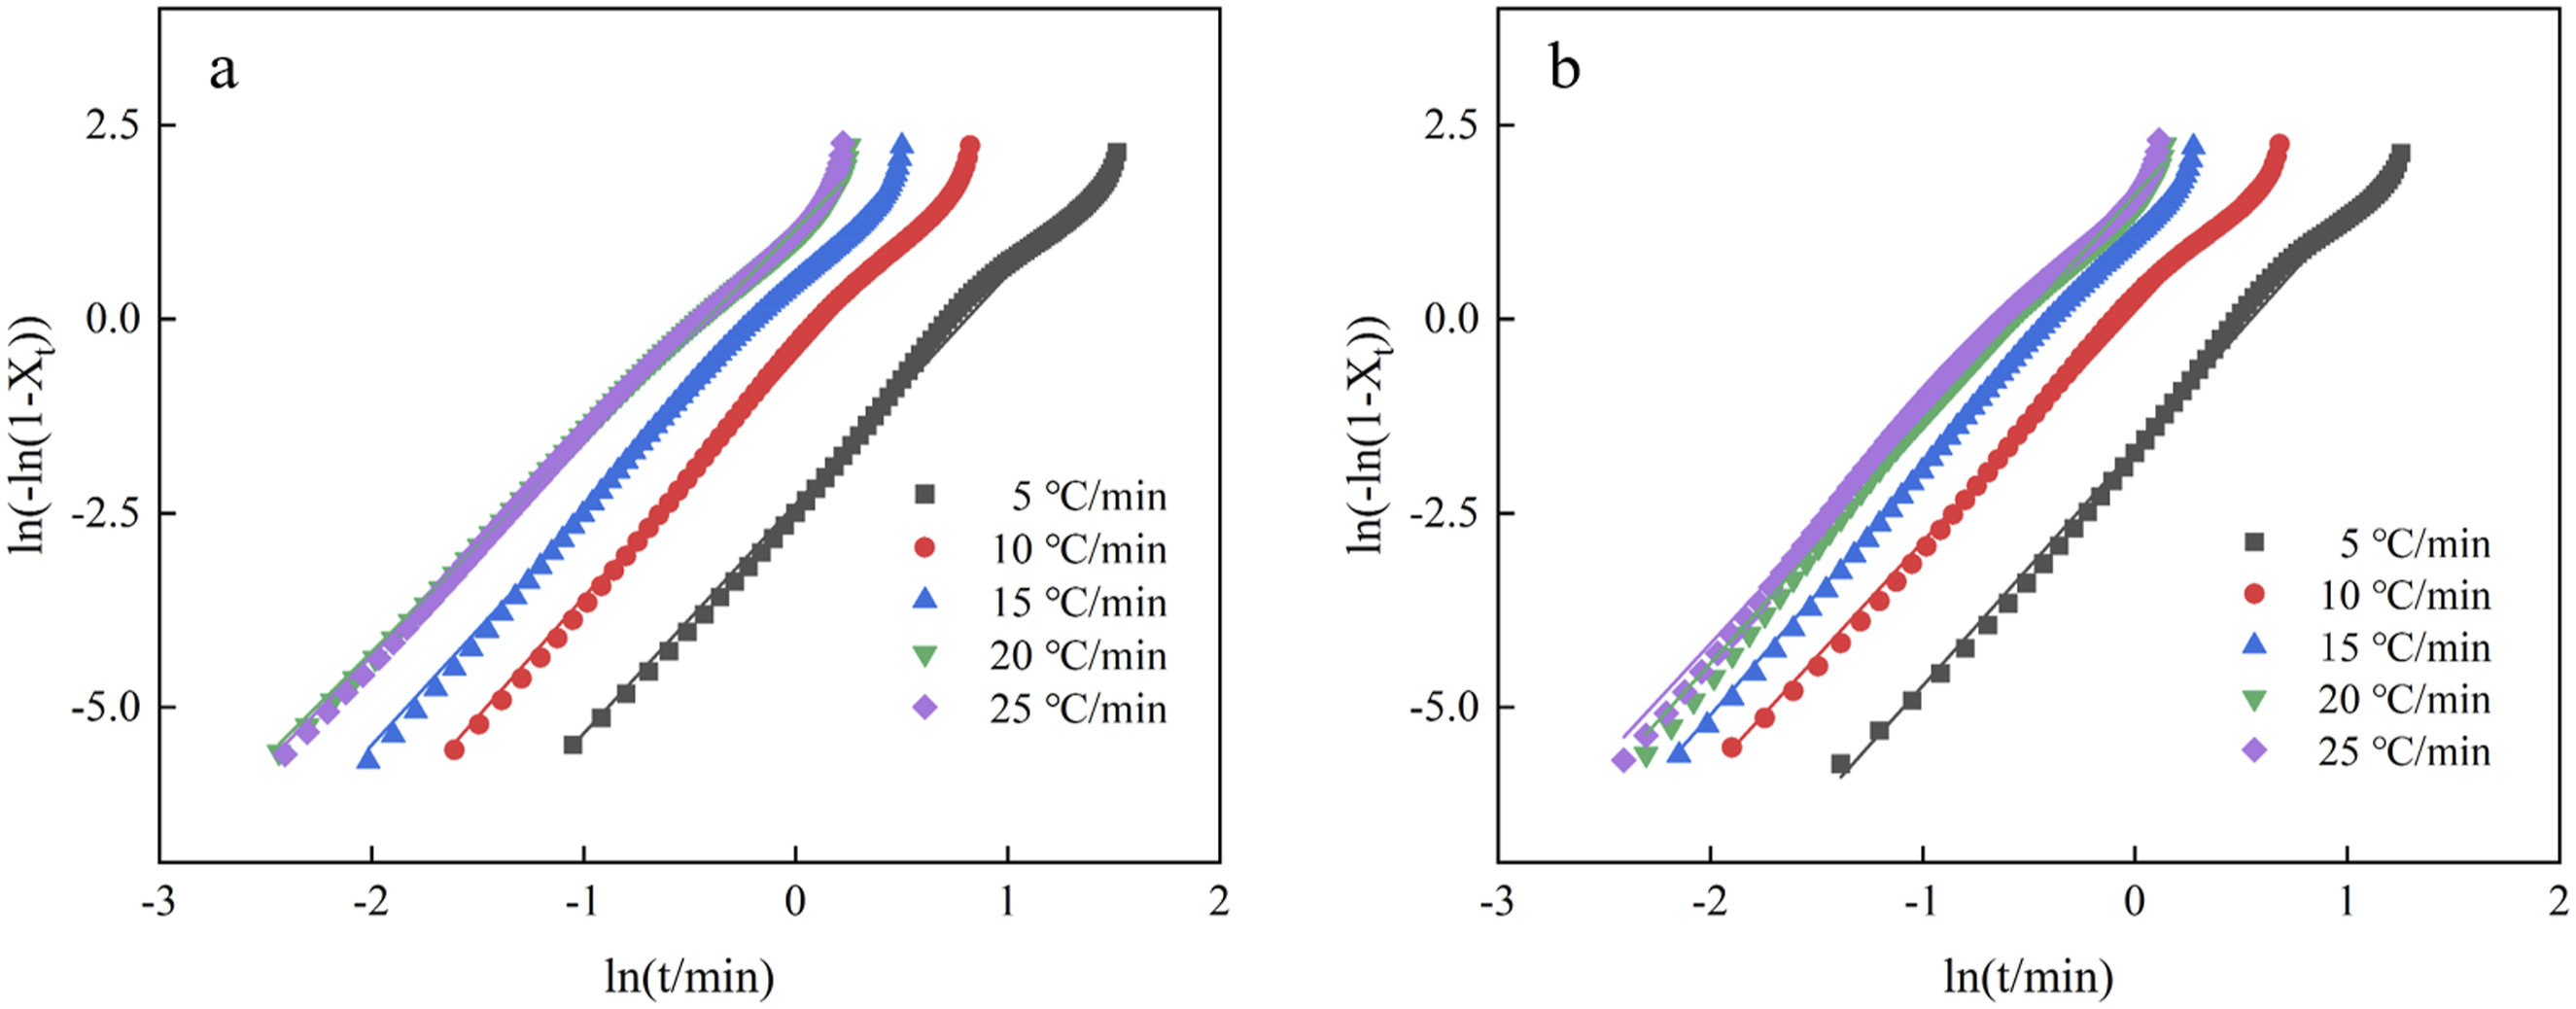
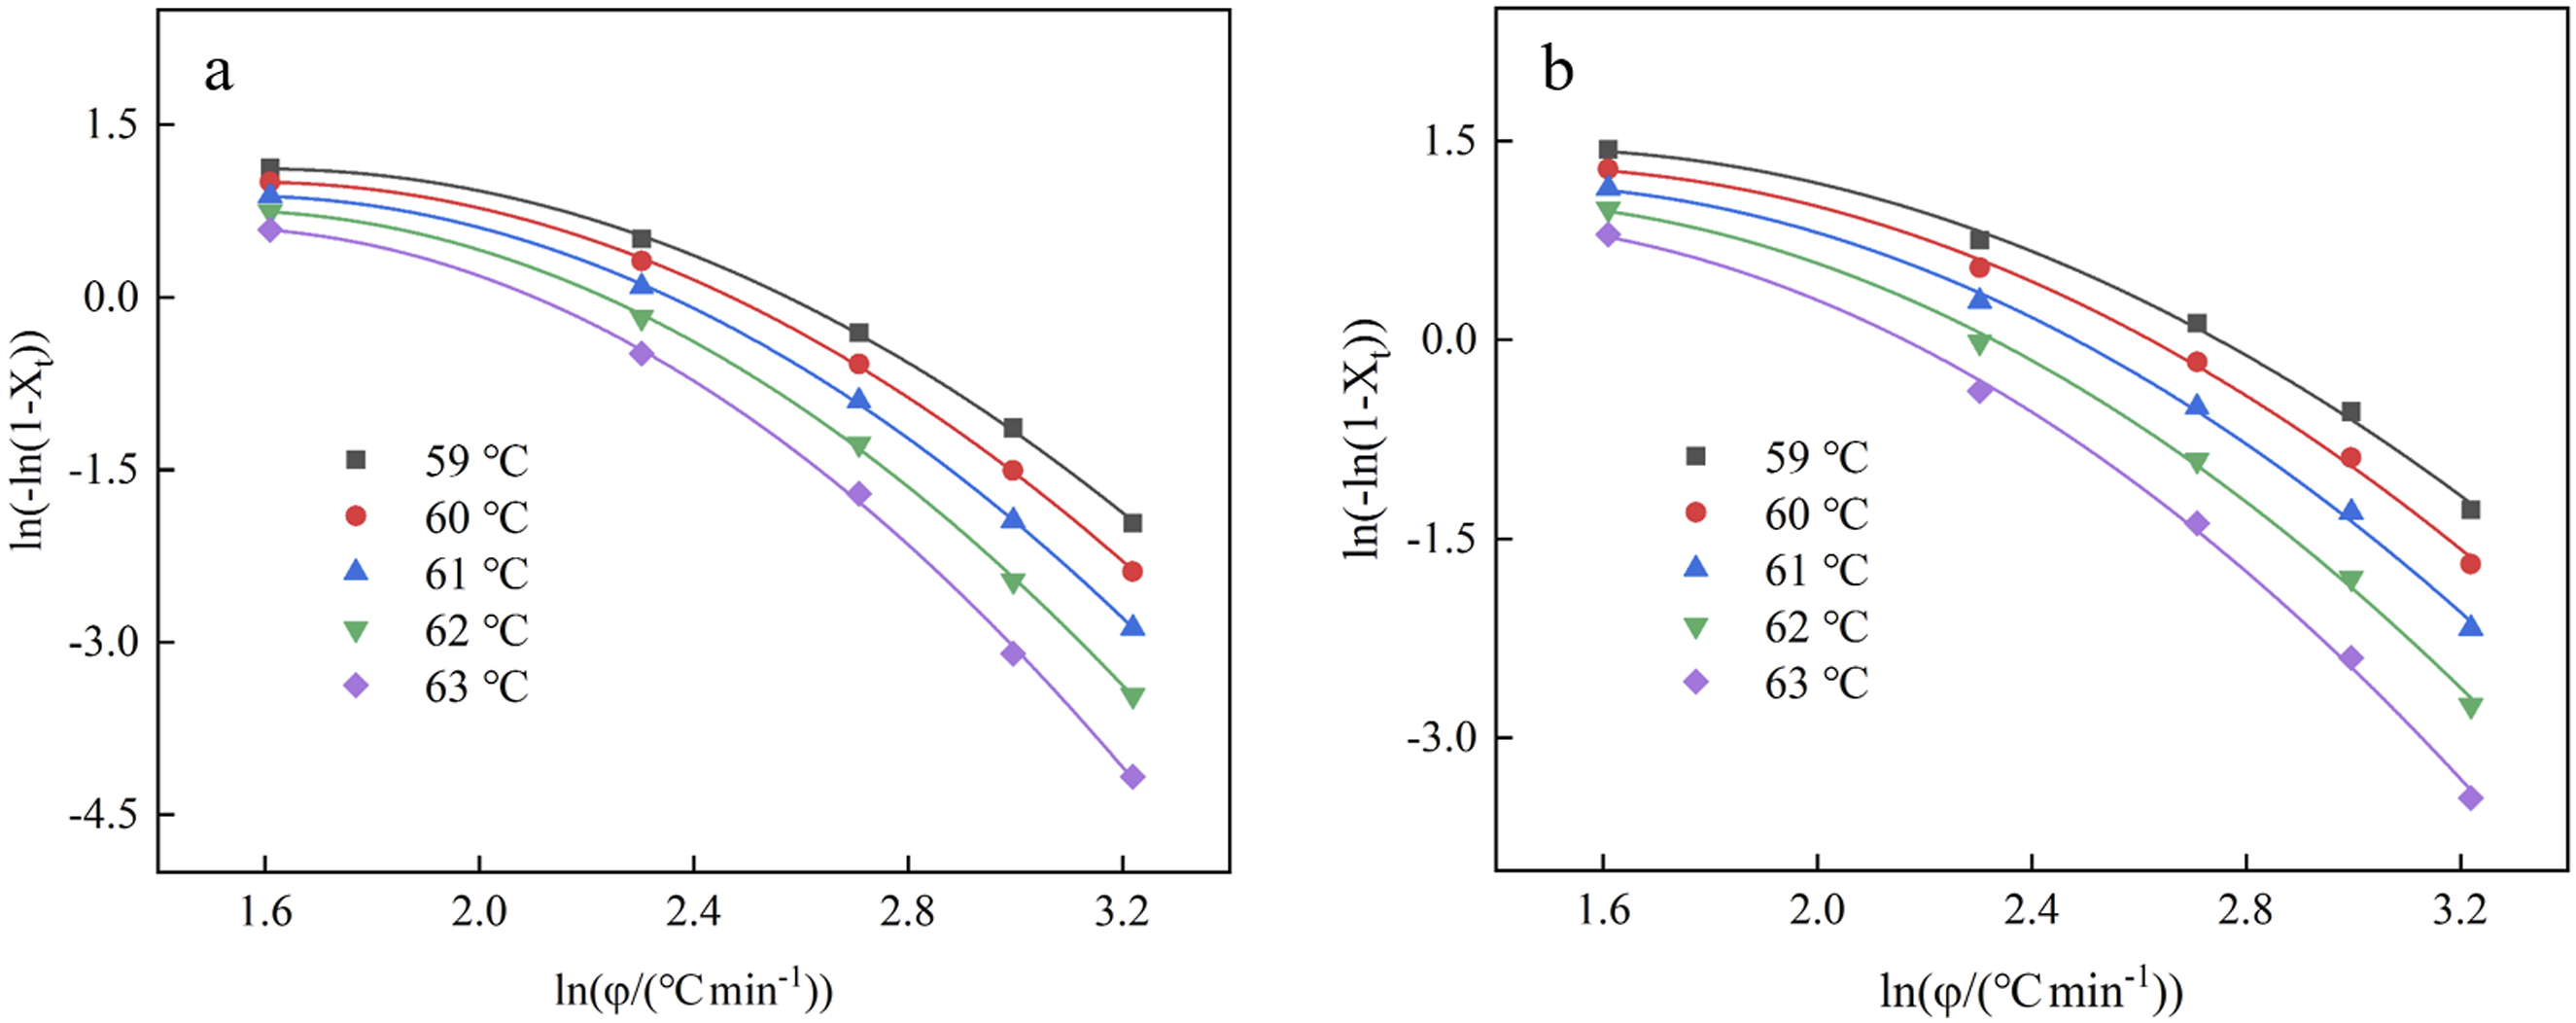
Ozawa method
The non-isothermal crystallization kinetics of polymer was studied by the Ozawa model frequently.27,28 This concept proposes that the non-isothermal crystallization process can be interpreted as an infinite series of isothermal crystallization occurrences, as expressed in the following equation: ln(–ln(1–Xt)) versus ln φ for the EVA/BR TPV and pure EVA for the Ozawa model (a) EVA/BR TPV; (b) pure EVA.
Mo method
The Mo method combines the Ozawa and Avrami equations to describe the non-isothermal crystallization behavior.29,30 The resulting equation is as follows:
In this equation, F(T) is a key parameter and denotes the cooling rate value required to achieve a specific degree of crystallization within a unit of time. A higher F(T) value indicates a lower crystallization rate. F(T) can be determined using equation(7):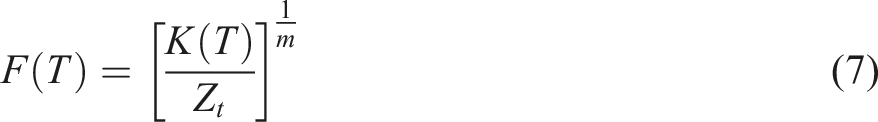

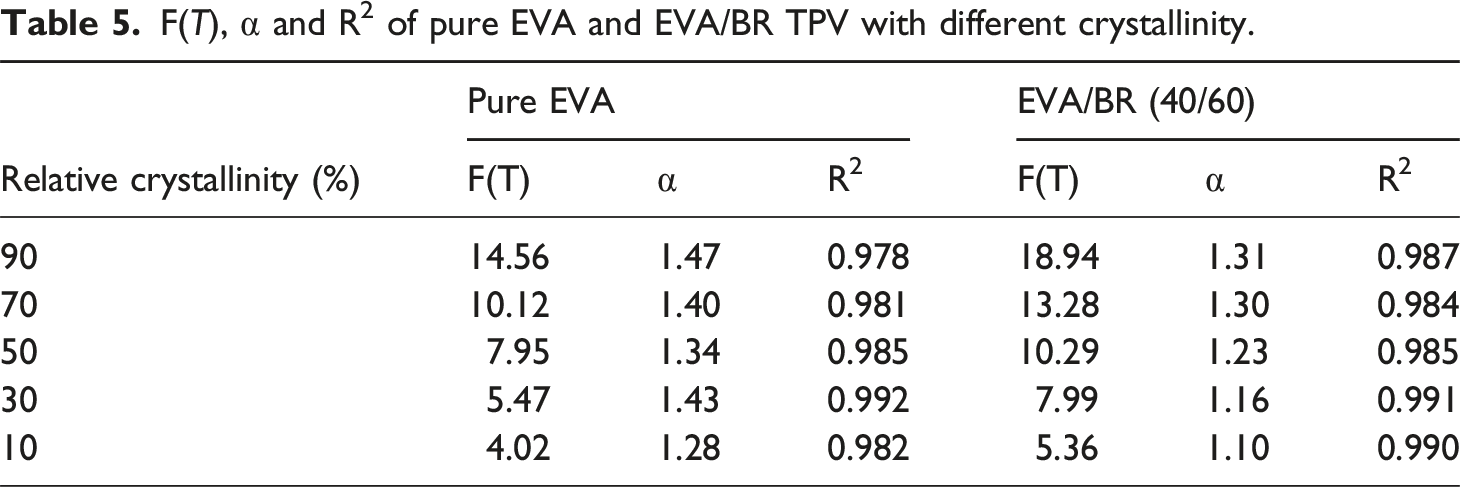
A linear relationship between ln t and ln φ for EVA/BR TPV and pure EVA was shown in Figure 8, signaling that the non-isothermal crystallization behavior of EVA/BR TPV and pure EVA can be studied by the Mo method. Table 5 shows the α, F(T) and R
2
values for EVA/BR TPV and pure EVA with different crystallinity. As the relative crystallinity X
t
increased, α slightly increased, while F(T) significantly increased and the F(T) of EVA/BR TPV was higher than that of EVA, indicating that the crystallization rate of EVA was higher than that of EVA/BR TPV, consistent with the conclusion that BR hindered the crystallization of EVA. ln φ versus ln t for the EVA/BR TPV and pure EVA for the Mo model (a) EVA/BR TPV; (b) pure EVA. F(T), α and R2 of pure EVA and EVA/BR TPV with different crystallinity.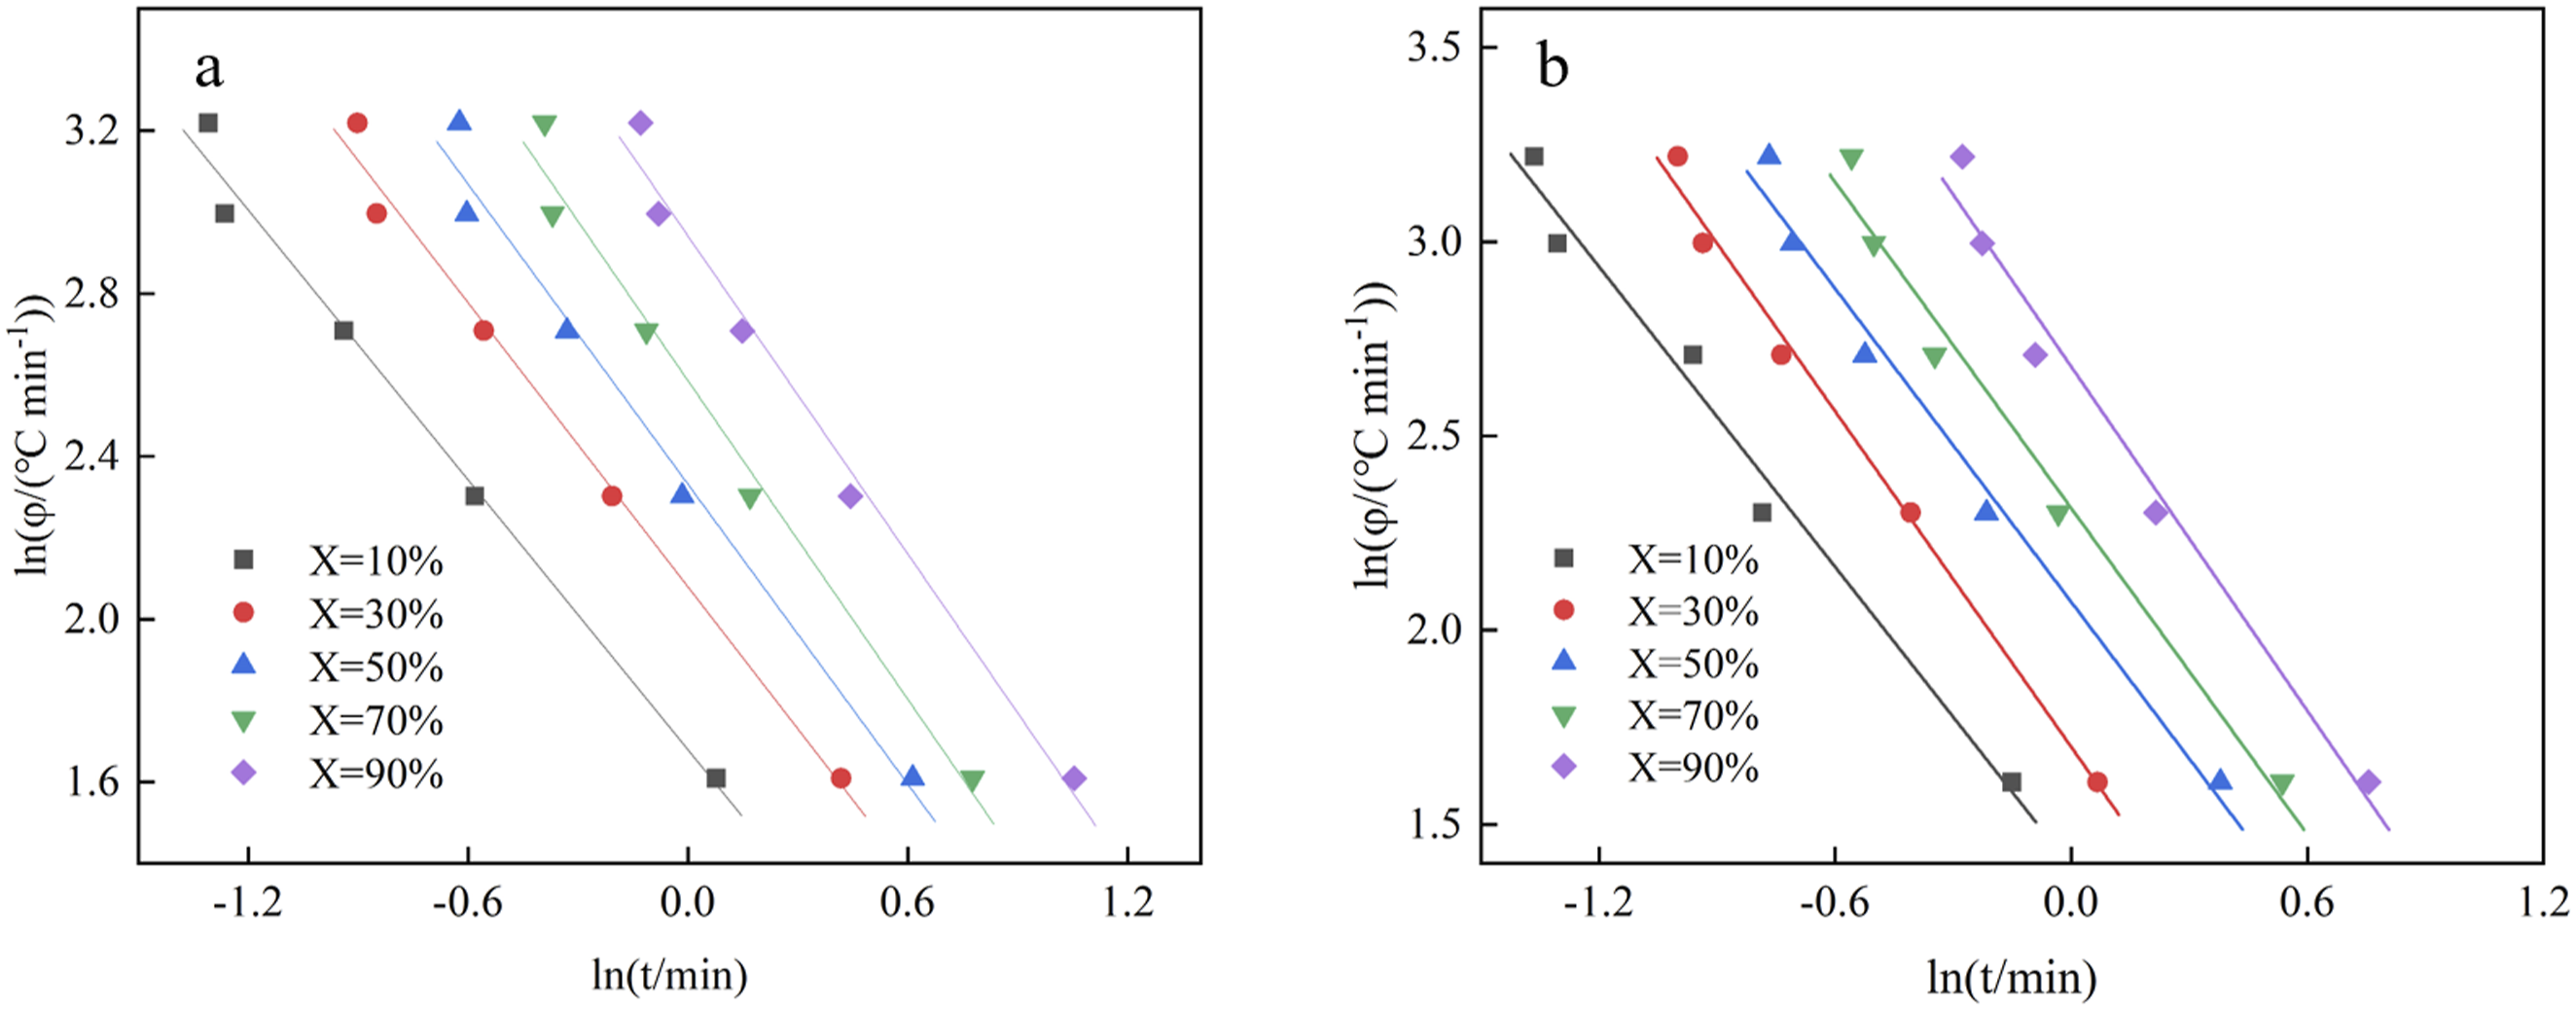
Conclusions
In this study, the non-isothermal crystallization process of EVA/BR TPV and pure EVA under varying cooling rates were investigated by DSC. The crystallization behavior of both EVA/BR TPV and pure EVA can be described by the Jeziorny and Mo methods effectively, whereas the Ozawa equation failed to describe the behavior. The findings indicate that the cooling rate had an important impact on the non-isothermal crystallization process. The initial crystallization temperature (T 0 ) of both pure EVA and EVA/BR TPV decreased with the increasing cooling rate, while the presence of BR in TPV increased the T0 of EVA phase, indicating the nucleation effect of BR. The analysis of the n values obtained from the Jeziorny method suggested secondary crystallization during the crystallization process of EVA/BR TPV and pure EVA, which accounted for why the Ozawa method could not accurately describe their crystallization behavior. Additionally, the analysis of the F(T) obtained from the Mo method showed that the crystallization rate of the EVA was faster than that of the EVA/BR TPV, aligning with the Jeziorny method's conclusion that BR inhibited EVA crystallization.
Footnotes
Author’s note
This manuscript has not been published elsewhere and it has not been submitted simultaneously for publication elsewhere.
Declaration of conflicting interests
The author(s) declared no potential conflicts of interest with respect to the research, authorship, and/or publication of this article.
Funding
The author(s) disclosed receipt of the following financial support for the research, authorship, and/or publication of this article: The work was supported by the Shandong Provincial Natural Science Foundation, China (ZR2021ME028).