
Abstract
A numerical and experimental investigation is carried out in this study to evaluate the crashworthiness behavior, the energy-absorbing parameters, and the failure mode of thermoplastic composite energy absorbers under axial loading. The energy absorbers are thin-walled circular tubes made of woven polyphenylene sulfide carbon composite and have a bevel trigger on the top. Finite element analysis are conducted to predict the structural behavior of the tubes. To validate the numerical model, four specimens are manufactured and tested under an axial compression load. During the tests, the load and displacement are measured by a load cell, the evolution of the longitudinal strains is captured by digital image correlation, and the progression of the failure is recorded by a high speed camera. The tubes show a progressive failure mode, with delamination between the middle plies. A stable damage propagation is observed throughout the tests, where the bevel trigger plays an important role in increasing the stability and failure progression of the thin-walled tubes. The test results are compared to the numerical prediction, with good agreement for both crashworthiness parameters and delamination behavior. The thermoplastic composite energy absorbers achieved specific energy absorption values of up to 70 kJ/kg, indicating an adequate crashworthiness performance.
Introduction
Composite structures have become integral in the aerospace sector given the growing concern over energy resource consumption and environmental protection. There has been a significant focus on aerospace lightweight technology, with the aim of achieving fuel efficiency and reducing emissions. The application of composites in primary components offers lighter and stronger designs compared to traditional materials. In contrast to metal structures that dissipate crush or impact energy through buckling and folding with significant plastic deformation, composite structures achieve energy absorption through progressive failure mechanisms.1–3 Hence, the development of energy absorption devices using composite materials has gained more attention in recent years.4–6
However, primary components like wings and fuselage predominantly rely on thin-walled designs crafted from thermoset composite materials, so a substantial amount of research has been conducted on the impact behavior of this composites in the aeronautical industry.7–10 In contrast, thermoplastic materials are gaining traction in aerospace applications due to their inherent advantages but have yet to be integrated into primary aircraft structures. The application of thermoplastics in primary structures presents promising advancements in sustainability and weight reduction. This however requires a complete understanding of the structural behavior of these materials in dynamic conditions, field that is not yet fully investigated.
The behavior of composite materials during a crash is quite complex, making it difficult to strike a balance. Furthermore, compared with metal materials, they are quite costly to produce, have greater challenges in high-precision numerical simulation and material design and little knowledge is available regarding the crashworthiness, indicating a lack of systematic and comprehensive study. 11 Recent studies using advanced FEA simulations have provided valuable insights into the damage mechanisms of composite materials.12,13 For instance, Rozylo et al. 14 conducted experimental-numerical failure analysis of thin-walled composite columns, highlighting the limitations of certain damage models in predicting crashworthiness. Similarly, Debski et al. 15 investigated the stability and load-carrying capacity of composite columns under eccentric compression loading, demonstrating significant improvements with advanced modeling techniques. However, these studies primarily focus on thermoset composites or specific loading conditions and do not extensively address the dynamic crashworthiness of thermoplastic composites.
Apart from that, the efficient design of thermoplastic composite structures poses a few challenges which have to be overcome for them to be widely used in industrial applications. An overly conservative design could lead to unnecessary weight, while a less conservative approach could prove fatal if the structure does not absorb enough energy during a collision.
Thermoset and thermoplastic composites exhibit distinct processing and mechanical performance characteristics. Thermoset composites are easier to process as the initial resin is in a liquid state whereas thermoplastic composites necessitate higher heat and pressure during processing. On the contrary, thermoplastic composites offer the advantage of reshaping and reforming, allowing recycling and making them a more environmentally friendly option,16–19 unlike thermoset composites which cannot be reformed after curing. Another advantage of thermoplastic materials lies in their ability to join without the need for rivets. Recent studies 20 leverage this advantage to explore the static behavior in primary structures.
These differences have ignited considerable research efforts aimed at addressing the challenges associated with the fabrication and characterization of thermoplastic composites. Advancing the knowledge in this area is likely to enhance the utilization of thermoplastic composites in engineering applications, particularly in fields that require impact resistance due to the ductile nature of thermoplastic matrices.
Jang et al. 21 investigate the damage mechanisms of thermoplastic and thermoset composites subjected to repeated low-velocity impacts. Experimental results obtained from an instrumented falling-dart impact tester reveal that delamination occurs above a threshold incident impact energy, leading to a reduction in stiffness and strength of the composite. The observed failure mechanisms differ between epoxy and polyphenylene sulfide (PPS) composites, and an elastic strain energy approach successfully predicts the threshold incident energy values. In fact, for energy absorption applications, it is crucial to avoid the global buckling mode, as it absorbs very little energy compared with the local buckling mode. 22 Liu et al. 23 investigate the crashworthiness of thermoplastic woven fabric reinforced composite tubes. The quasi-static axial compressive tests performed under different temperatures reveal three crushing modes: progressive folding, splaying, and weld seam cracking. The results demonstrate the influence of fiber orientation, tube length-diameter ratio, and testing temperature on peak and mean load, specific energy absorption, crush efficiency, and the observed crushing modes. Chen et al. 24 experimentally and numerically investigate the quasi-static compressive response and failure deformation modes of thermoplastic composite sandwich panels, considering different layer numbers and core configurations. The results showed that the perpendicular configuration exhibited optimal specific energy absorption (SEA) and crushing force efficiency (CFE), while the regular configuration demonstrated the highest peak crushing force (PCF). Increasing the layer number enhanced the SEA and mean crushing force (MCF) by inducing interlayer face sheet bending. Kim et al. 25 present the experimental investigation results of round-hat-shaped crash tubes made with glass long-fiber-mat/PA6 laminates. The crash tubes exhibited progressive splaying mode failure in dynamic tests, with a specific energy absorption (SEA) of around 52 J/g, an improvement from the quasi-static tests with a SEA of 42.0 J/g. The dependency of crash tube performance on test speed was observed at relatively low speeds (up to 1 m/s), but performance remained steady at higher impact speeds.
Moreover, substantial effort is currently being directed towards the development of numerical models to predict the behavior under dynamic and impact loads of reinforced thermoplastics. But despite simulations being considered first-principles or fully predictive methods and can provide even more information on the structure’s behavior than the equivalent experiment, experimental testing for calibration and validation is still necessary to certify components before being used.
In that regard, Falzon and Tan 26 highlight recent progress and challenges in the development of finite-element-based predictive modelling tools for assessing impact damage, residual strength, and energy absorption capacity of both thermoplastic and thermoset composites, with a focus on their application in crashworthiness assessments. The same authors 27 present the manufacturing, testing, and modelling of self-supporting corrugated-shaped thermoplastic composite specimens for crashworthiness assessment, demonstrating a 57.3% higher specific energy absorption compared to thermoset composites. The proposed mesoscale composite damage model, incorporating nonlinear shear constitutive laws, accurately captures the material response under crushing, offering a promising approach to reduce the reliance on physical testing in crashworthy structure development. Raponi et al. 28 present a numerical optimization approach for an innovative thermoplastic composite material model used in a vehicle impact attenuator. The results demonstrate the effectiveness of the proposed methodology in characterizing the composite material and improving the efficiency of the numerical model. Furthermore, Wang et al. 29 present a novel notch-shaped design of carbon fiber reinforced polypropylene plastic (CFRPP) composite specimens with different fiber orientations and explore the failure mechanism and failure criteria during the stamping process at room temperature. The proposed failure criteria based on forming limit curves outperform the conventional maximum strain and maximum stress criteria, offering better prediction results and potential application in CFRPP structure failure assessment under different service conditions.
Due to the aforementioned reasons, intense research in the area of replacement of thermoset composites by fiber reinforced thermoplastic composites (FRTP) is on the rise, evidencing the need to research the crashworthiness of thermoplastic composite components. But while there is substantial evidence highlighting their positive static performance, there is still a significant knowledge gap in comprehending their dynamic response. Understanding its behavior in dynamic conditions and characterizing its performance in progressive crushing are crucial for safe utilization in primary aircraft structures.
To address these gaps, this study seeks a comprehensive evaluation of thermoplastic composite energy absorbers, investigating their progressive failure mechanisms and energy-absorbing capabilities under axial loads at different loading rates. For that, the present research focuses on the numerical and experimental characterization of the crashworthiness performance of thin-walled circular tubes made from thermoplastic composite. Thus, this work aims to provide novel insights into the behavior of woven polyphenylene sulfide carbon composite tubes seeking significant advancements in the application of thermoplastic composites for primary aerospace structures.
In this work, the progressive damage behavior of 5-harness satin weave carbon/PPS composite tubes through numerical and experimental analysis is investigated. A three-dimensional finite element model is developed in ABAQUS/Explicit, incorporating a Hashin damage criteria and a cohesive surface to simulate delamination. An experimental test campaign is performed on specimens subjected to a displacement-controlled load at different rates to validate the numerical model. The tests are conducted on four circular tubes, two of which are tested with a loading rate of 10 mm/min, and the other two at 600 mm/min. The damage initiation and its progress are registered via a high-speed camera. The objective is to give insights into the energy absorption capabilities of thermoplastic composites, contributing to the understanding of composite behavior and informing design considerations for composite energy absorbers subjected to impact loads.
Thermoplastic energy absorbers
Geometry and material properties
The specimens investigated in this work consist of thin-walled circular tubes manufactured from a balanced 5-harness-satin (5HS) woven composite with a polyphenylene sulfide (PPS) matrix. The reinforcement consists of T300JB 3K carbon fibers, and the fiber volume fraction of the consolidated laminate is approximately 56.65%. PPS is a semi-crystalline polymer that belongs to the family of high-performance thermoplastics. The circular shape is chosen because it exhibits superior energy absorption capacity in comparison with other profiles. 30 The tube is designed with a quasi-isotropic layup [45/0/45/0] s . This specific layup has been extensively utilized in energy-absorbing structures, as evidenced by its good performance demonstrated in previous studies.31–35 Woven composites that possess a cross-ply orientation offer numerous advantages, including high strength, excellent load-bearing capacity, and exceptional dimensional stability.
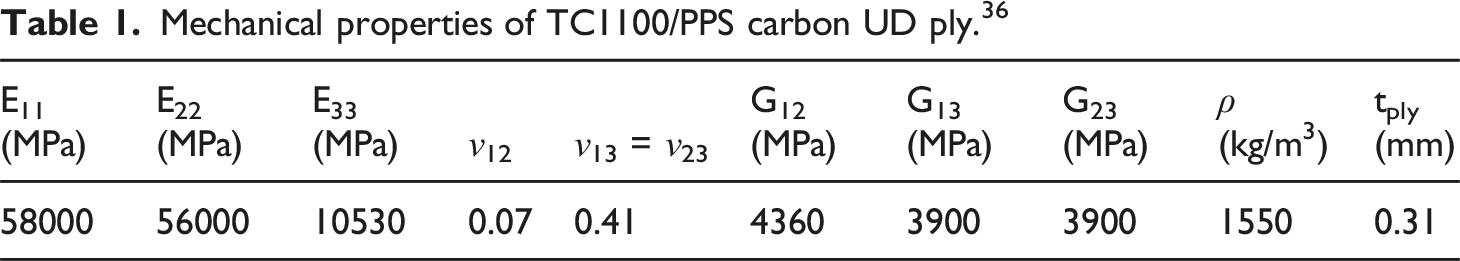
Mechanical properties of TC1100/PPS carbon UD ply. 36
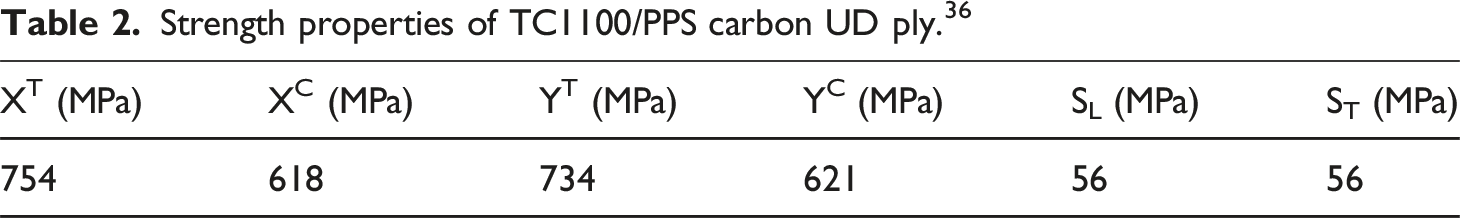
Strength properties of TC1100/PPS carbon UD ply. 36
Numerical model
A three-dimensional finite element (FE) model is created to simulate the compression test of the 5-harness satin weave carbon fiber composite tube. All simulations are carried out using the ABAQUS FEA 2022 package 37 with an explicit time integration scheme. Two rigid plates are included in the model to simulate boundary conditions: one is fixed at the lower part of the tube, while the other is positioned at the upper part, allowing movement only in the axial direction at a constant velocity. The interaction between the rigid plates and the tube is defined by employing hard contact conditions, ensuring zero penetration under compression and the potential for separation under tension. Additionally, a penalty Coulomb friction coefficient of 0.2 is applied.
In modeling woven laminates, it is commonly assumed that they can be treated as orthotropic continua. 38 To accurately capture the mechanical behavior of these laminates, constitutive relations are formulated in a local Cartesian coordinate system, whose vectors align with the warp and weft directions.
Features of the four numerical models considered in the study.
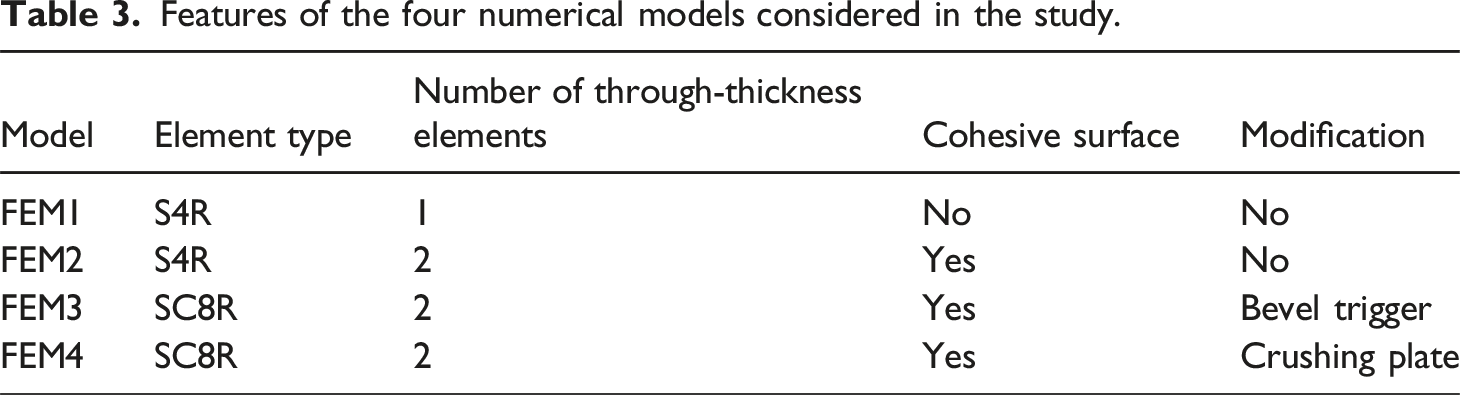
Thereafter, two models with continuum shell elements using reduced integration (SC8R type) are developed. These elements are characterized by an 8-node quadrilateral in-plane shape and include hourglass control. Each model incorporates distinct modifications to study the delamination behavior. The initial delamination is induced in the first model (referred as FEM3) by manipulating the bevel trigger, as shown in Figure 1. The second model (referred as FEM4) involves modifying the crushing plate geometry in order to achieve the splaying mechanism, as seen in literature.39,40 A detail of the crushing plate modification is presented in Figure 2. The idea is to use an artificial plug-initiator in the finite element model to initiate delamination properly and simulate the debris wedge formation during testing. Bevel trigger modification in FEM3 (dimensions in mm). Crushing plate modification in FEM4.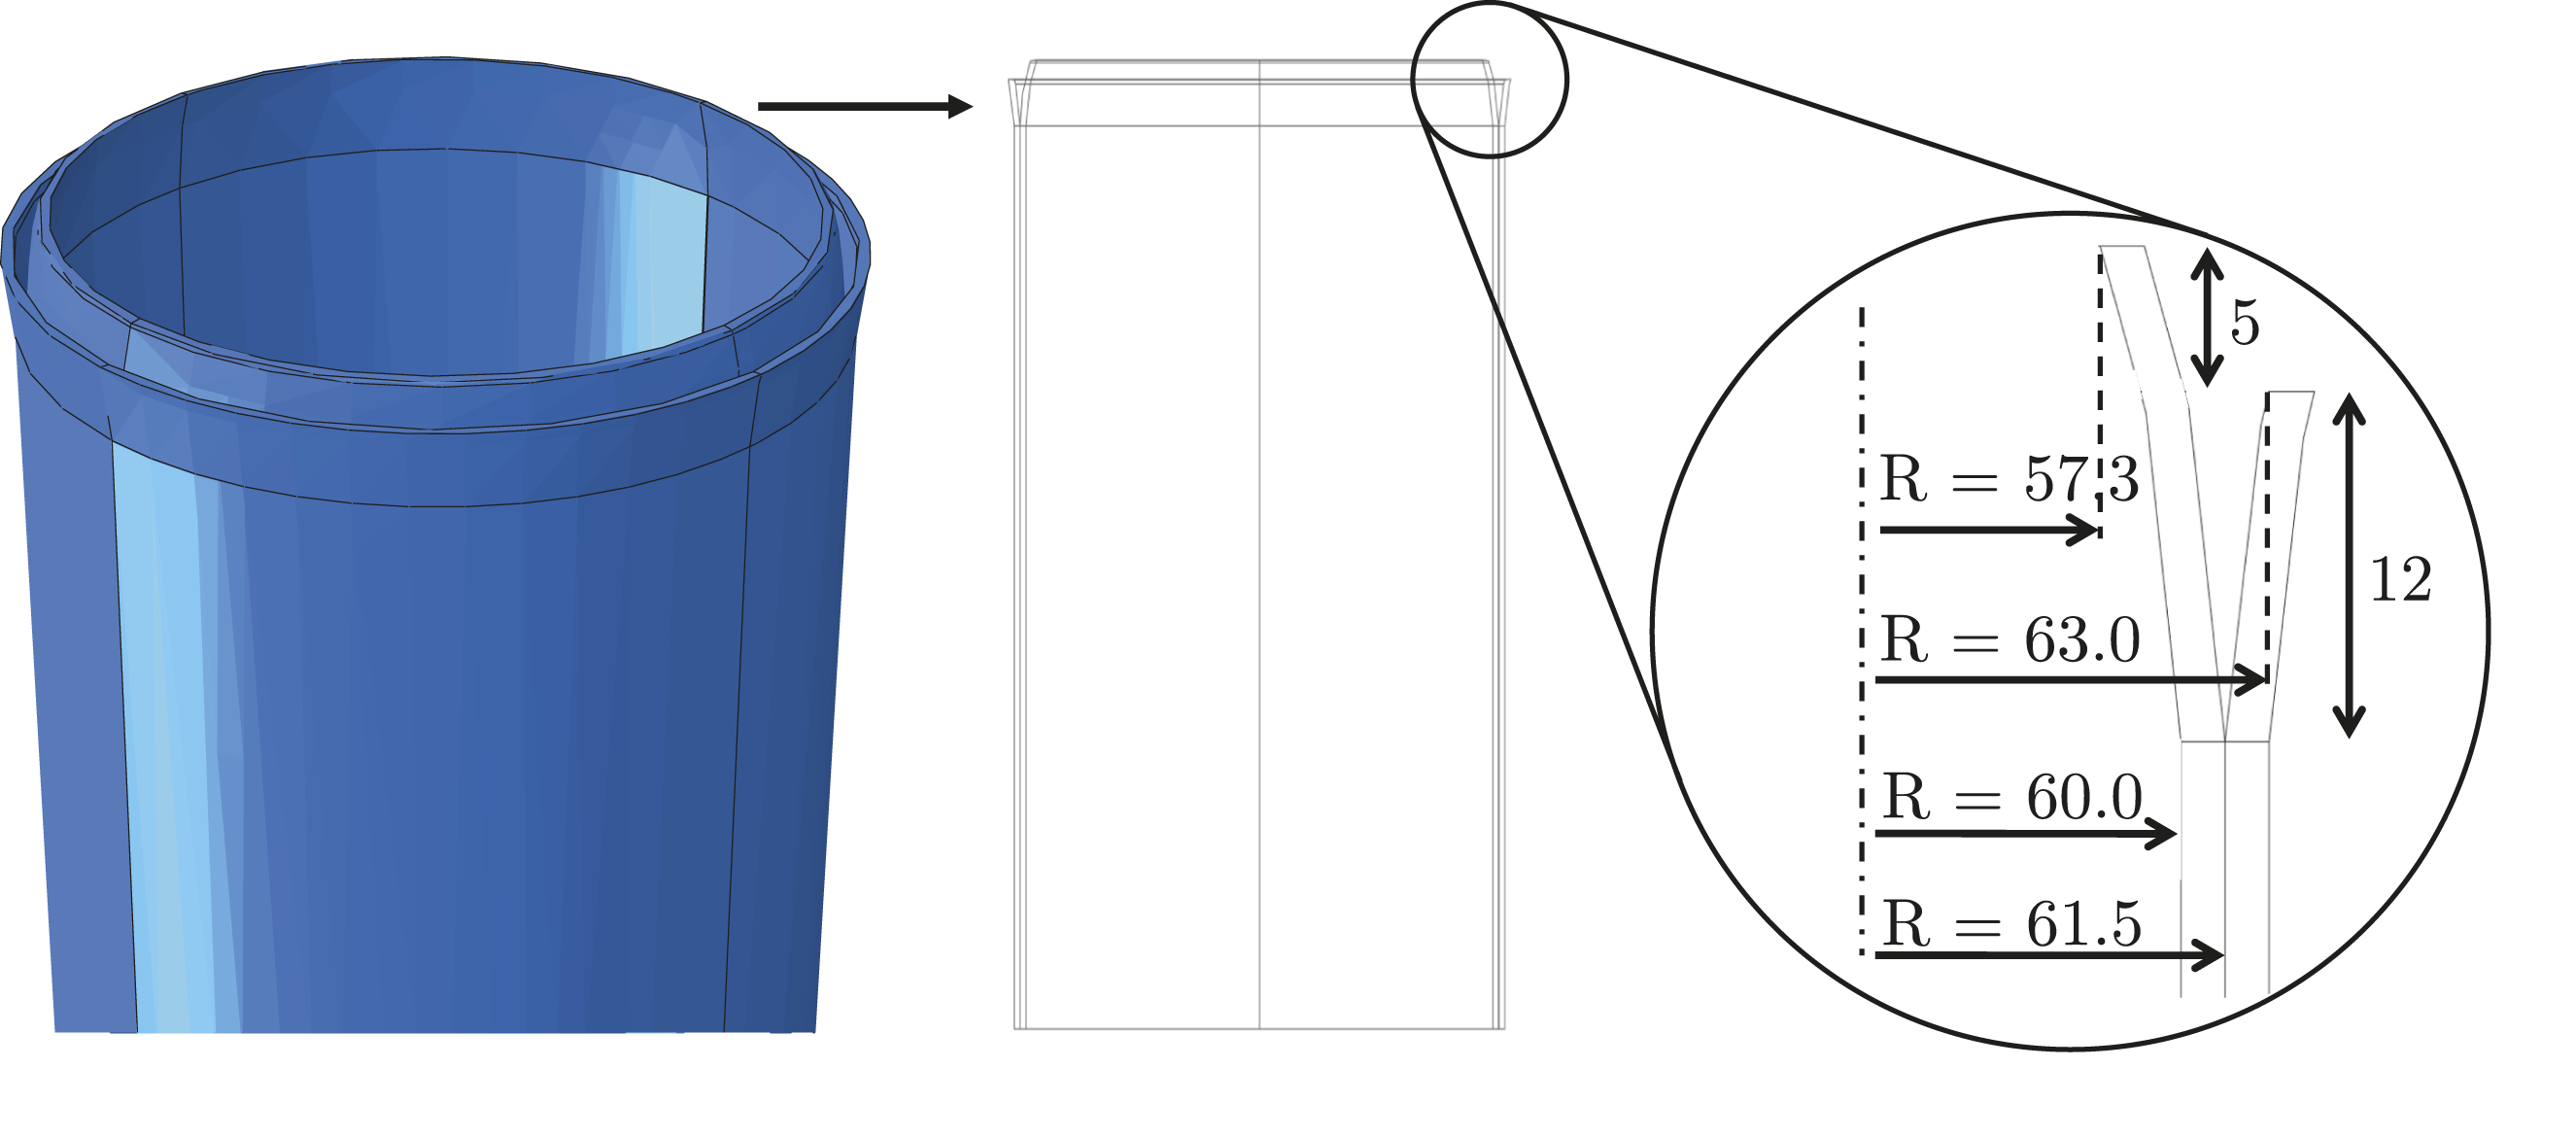
The crushing plate geometry considered in FEM4 is not representative of the experimental flat platen, yet the purpose of this plate modification is to assess whether ply splaying could be achieved, and to identify the necessary changes which could help this model to be more accurate and realistic. The formation of the wedge is essential in causing all the plies to splay, even the central ones.
To prevent excessive element distortion and consequent error termination of analysis in simulation, deletion criterion is set as 0.95 to delete failed elements from the finite element model. Through a mesh sensitivity study, it is determined that an element size of 2 mm in both the longitudinal and transverse directions provides an optimal balance between computational efficiency and result accuracy. Coarser meshes (3 mm) show acceptable performance in capturing the initial response but significantly underestimate the progressive failure phase, while finer meshes (1 mm) offer slightly improved accuracy at the expense of prohibitive computational cost. The 2 mm mesh provides sufficient resolution to capture both the onset of damage and the evolution of progressive failure, with a reasonable computational time of approximately 9 hours.
Despite the inherently nonlinear behavior of composites, a linear elastic formulation is adopted in this study due to the limited availability of reliable experimental data for the specific material under investigation. This simplification is partially mitigated by incorporating a progressive damage model based on Hashin’s failure criteria, 41 which allows simulating the degradation of material stiffness and the onset of failure mechanisms.
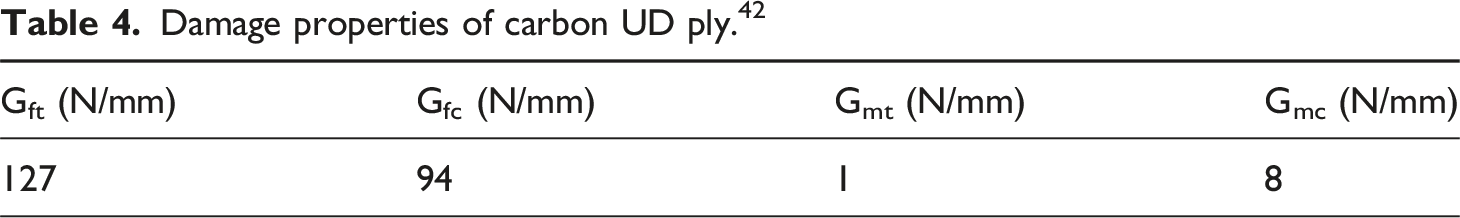
Specifically, the progressive damage of the composite material is modeled by considering three features into the numerical formulation: damage initiation, damage evolution, and damage stabilization. Damage initiation refers to the onset of material degradation at a given point. Each damage initiation criterion is formulated based on the respective tensile and compressive strengths in the fiber and matrix directions, as well as the longitudinal and transverse shear strengths. These properties are provided in Table 2. The onset of damage is detected by evaluating the effective stress tensor, which accounts for the material’s current damage state through internal variables and damage operators. Prior to damage initiation, the damage operator is equal to the identity matrix, and the effective stress coincides with the nominal stress. Once damage initiates and evolves, the damage operator modifies the stress field to reflect the material degradation.
Damage properties of carbon UD ply. 42
To enhance numerical stability, damage stabilization is introduced using a viscosity coefficient of 10−5, ensuring convergence by preserving the positive definiteness of the tangent stiffness matrix.
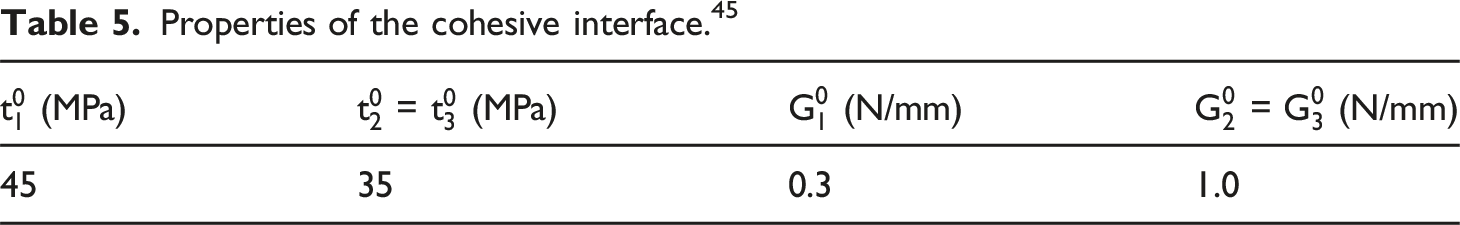
The interlaminar damage, i.e. delamination between the middle plies is modelled in FEM2, FEM3, and FEM4 using a surface-based cohesive approach. Unlike cohesive elements, this formulation does not require a finite thickness for the interface; instead, the traction–separation law is applied through interaction properties defined between the contact surfaces of adjacent plies. The damage is introduced by progressively degrading the stiffness of these interfaces based on a mixed-mode damage evolution law, without internal integration points across an element thickness. After degradation of the cohesive surfaces, contact between the delaminated plies is maintained through a hard-contact formulation, which prevents penetration under compression while still allowing tangential sliding with a friction coefficient of 0.2.
Properties of the cohesive interface. 45
A constant velocity of 1 m/s is assigned to the moving upper plate, while the lower plate is clamped in all directions, as shown in Figure 3, where an overview of the FEM3 model with the boundary conditions is presented. Note that in the numerical simulation a significantly increased loading rate is employed, while ensuring that kinetic energy does not exceed 5% of internal energy. Adopting an increased loading rate in the numerical simulation serves a twofold purpose: it enhances computational efficiency while still maintaining adequate precision. This expedited loading rate allows for a more efficient completion of simulations without compromising the accuracy of the obtained results. As Mamalis et al.
46
underscore, this approach strategically balances computational time with precision, thereby ensuring the attainment of reliable outcomes within a reasonable timeframe. Overview of FEM3 model for TC1100/PPS tubes.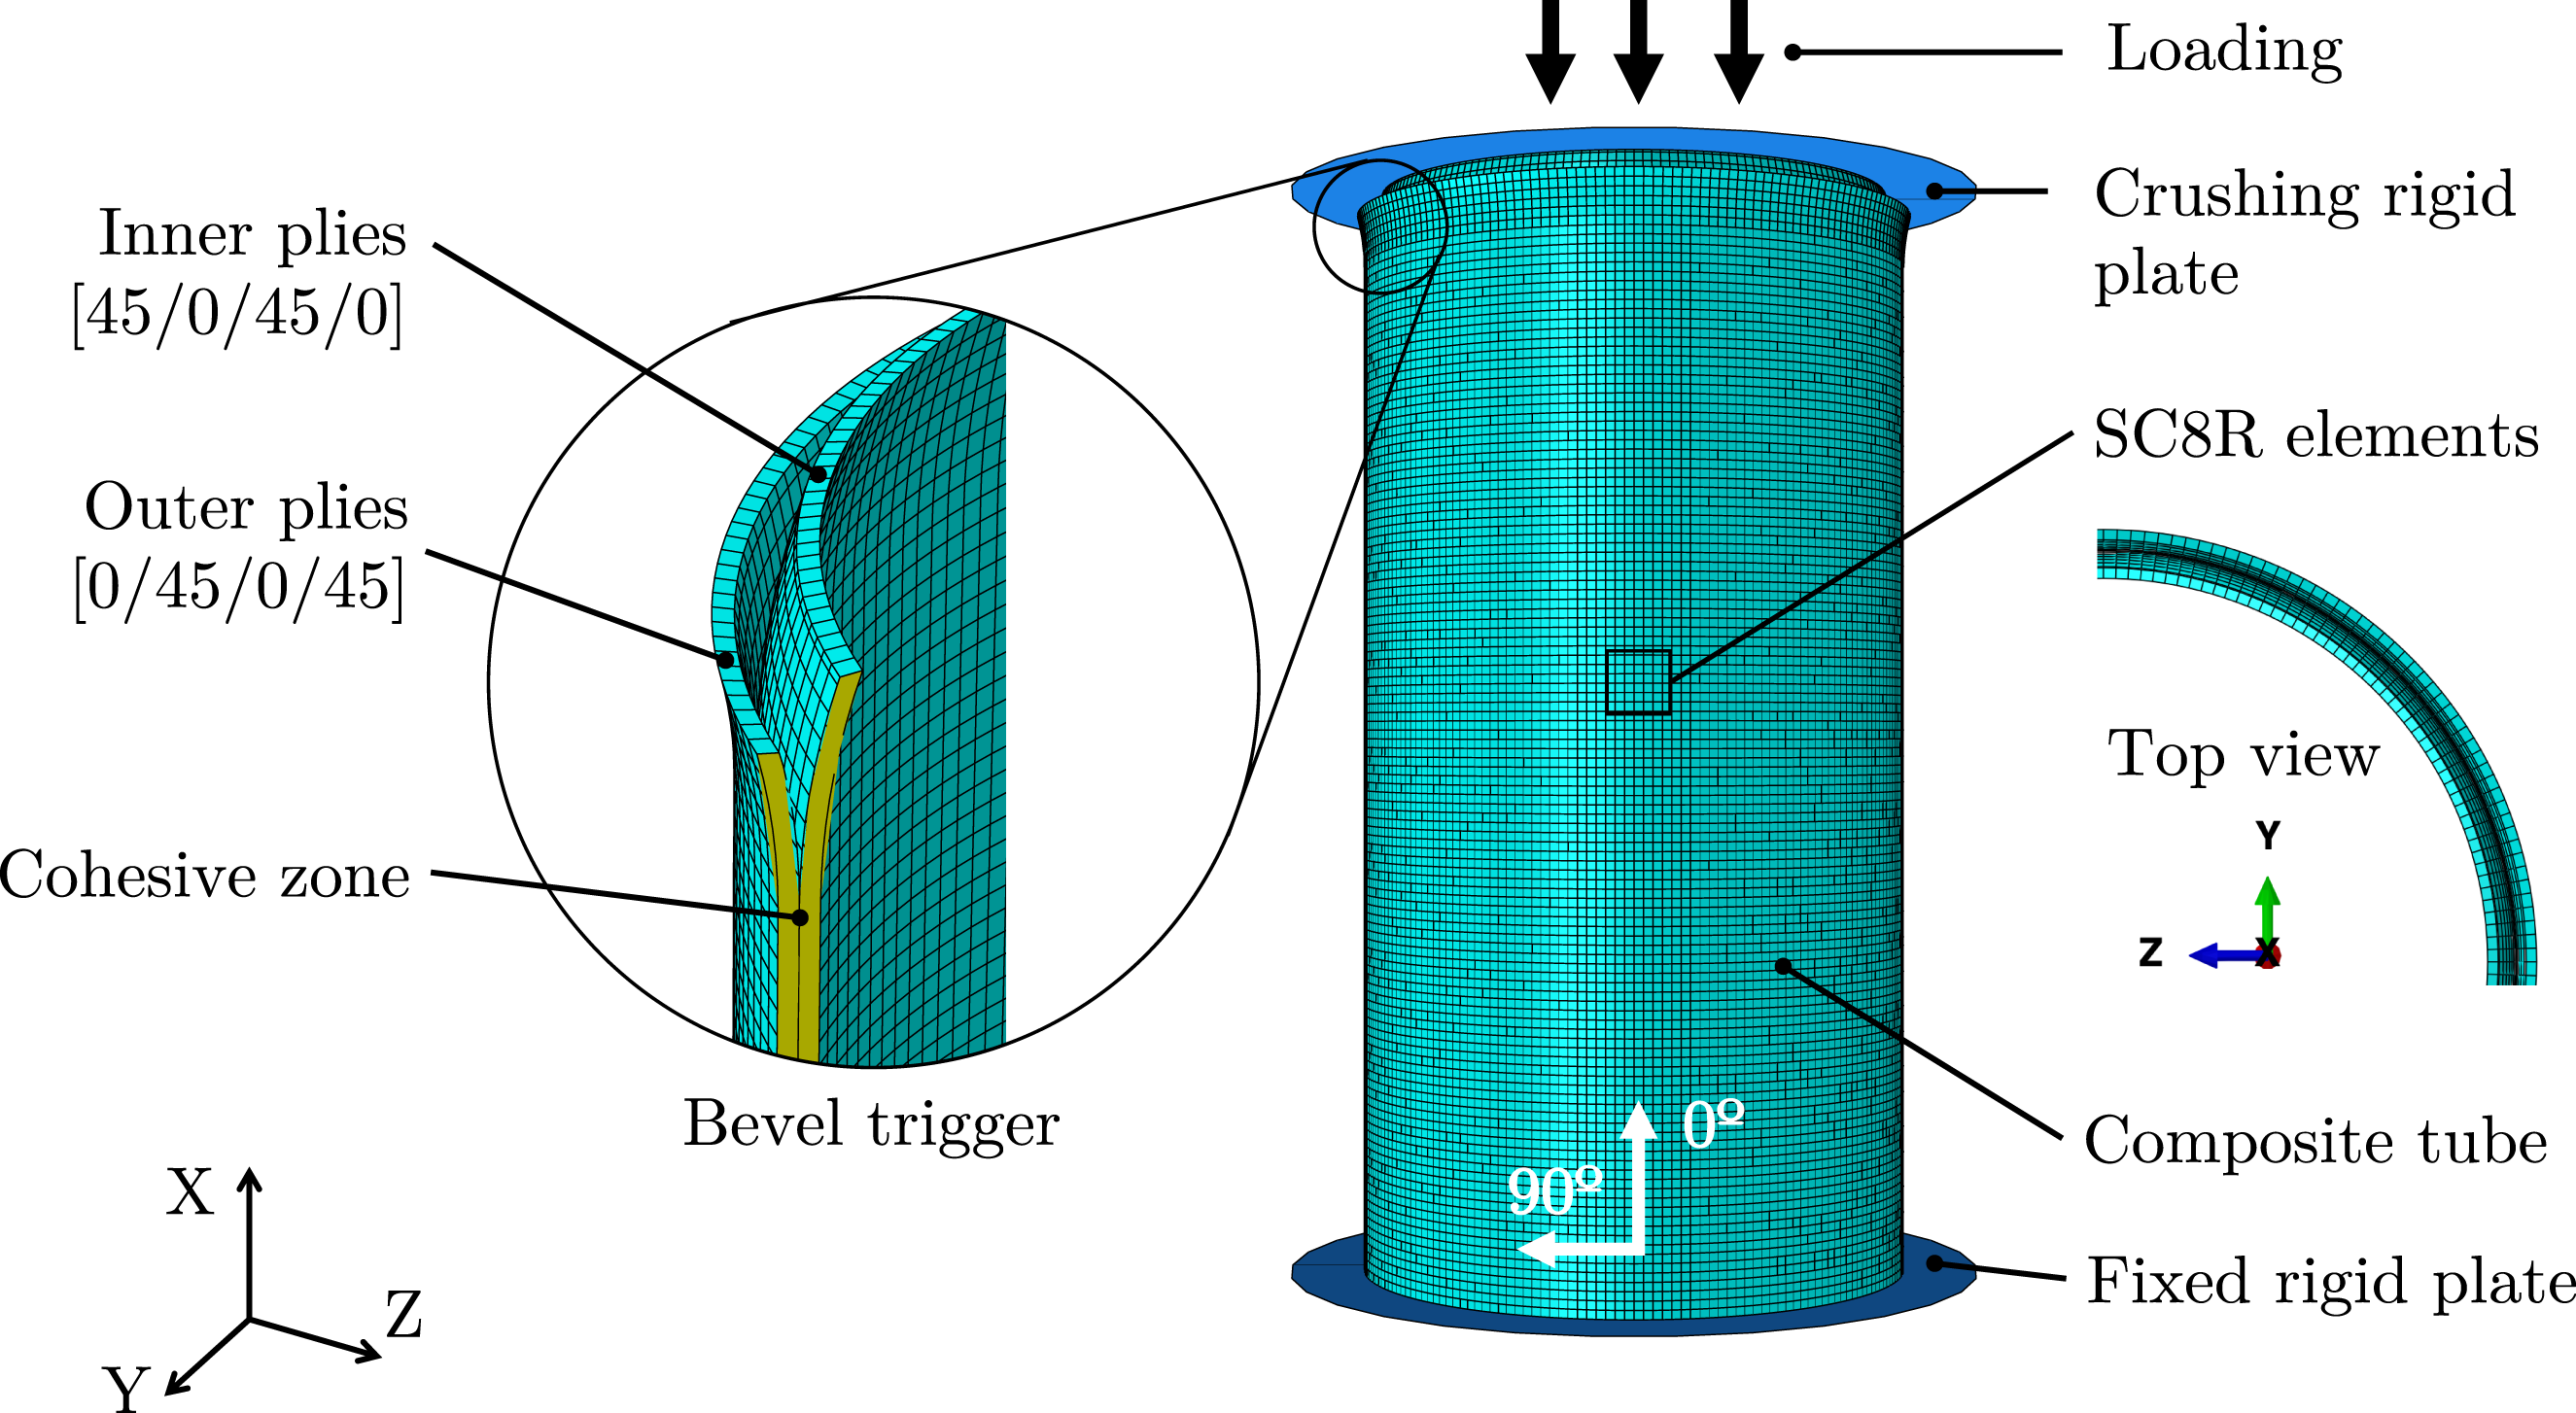
Test specimens and test set-up
Four nominally identical specimens are manufactured at the National Institute of Aerospace Technology (INTA) with the aim to evaluate the experimental crashworthiness of thermoplastic composite components, as shown in Figure 4. Furthermore, the experimental test results are used to validate the numerical analysis. Toray TC1100/PPS
36
thermoplastic composite tubes before the tests.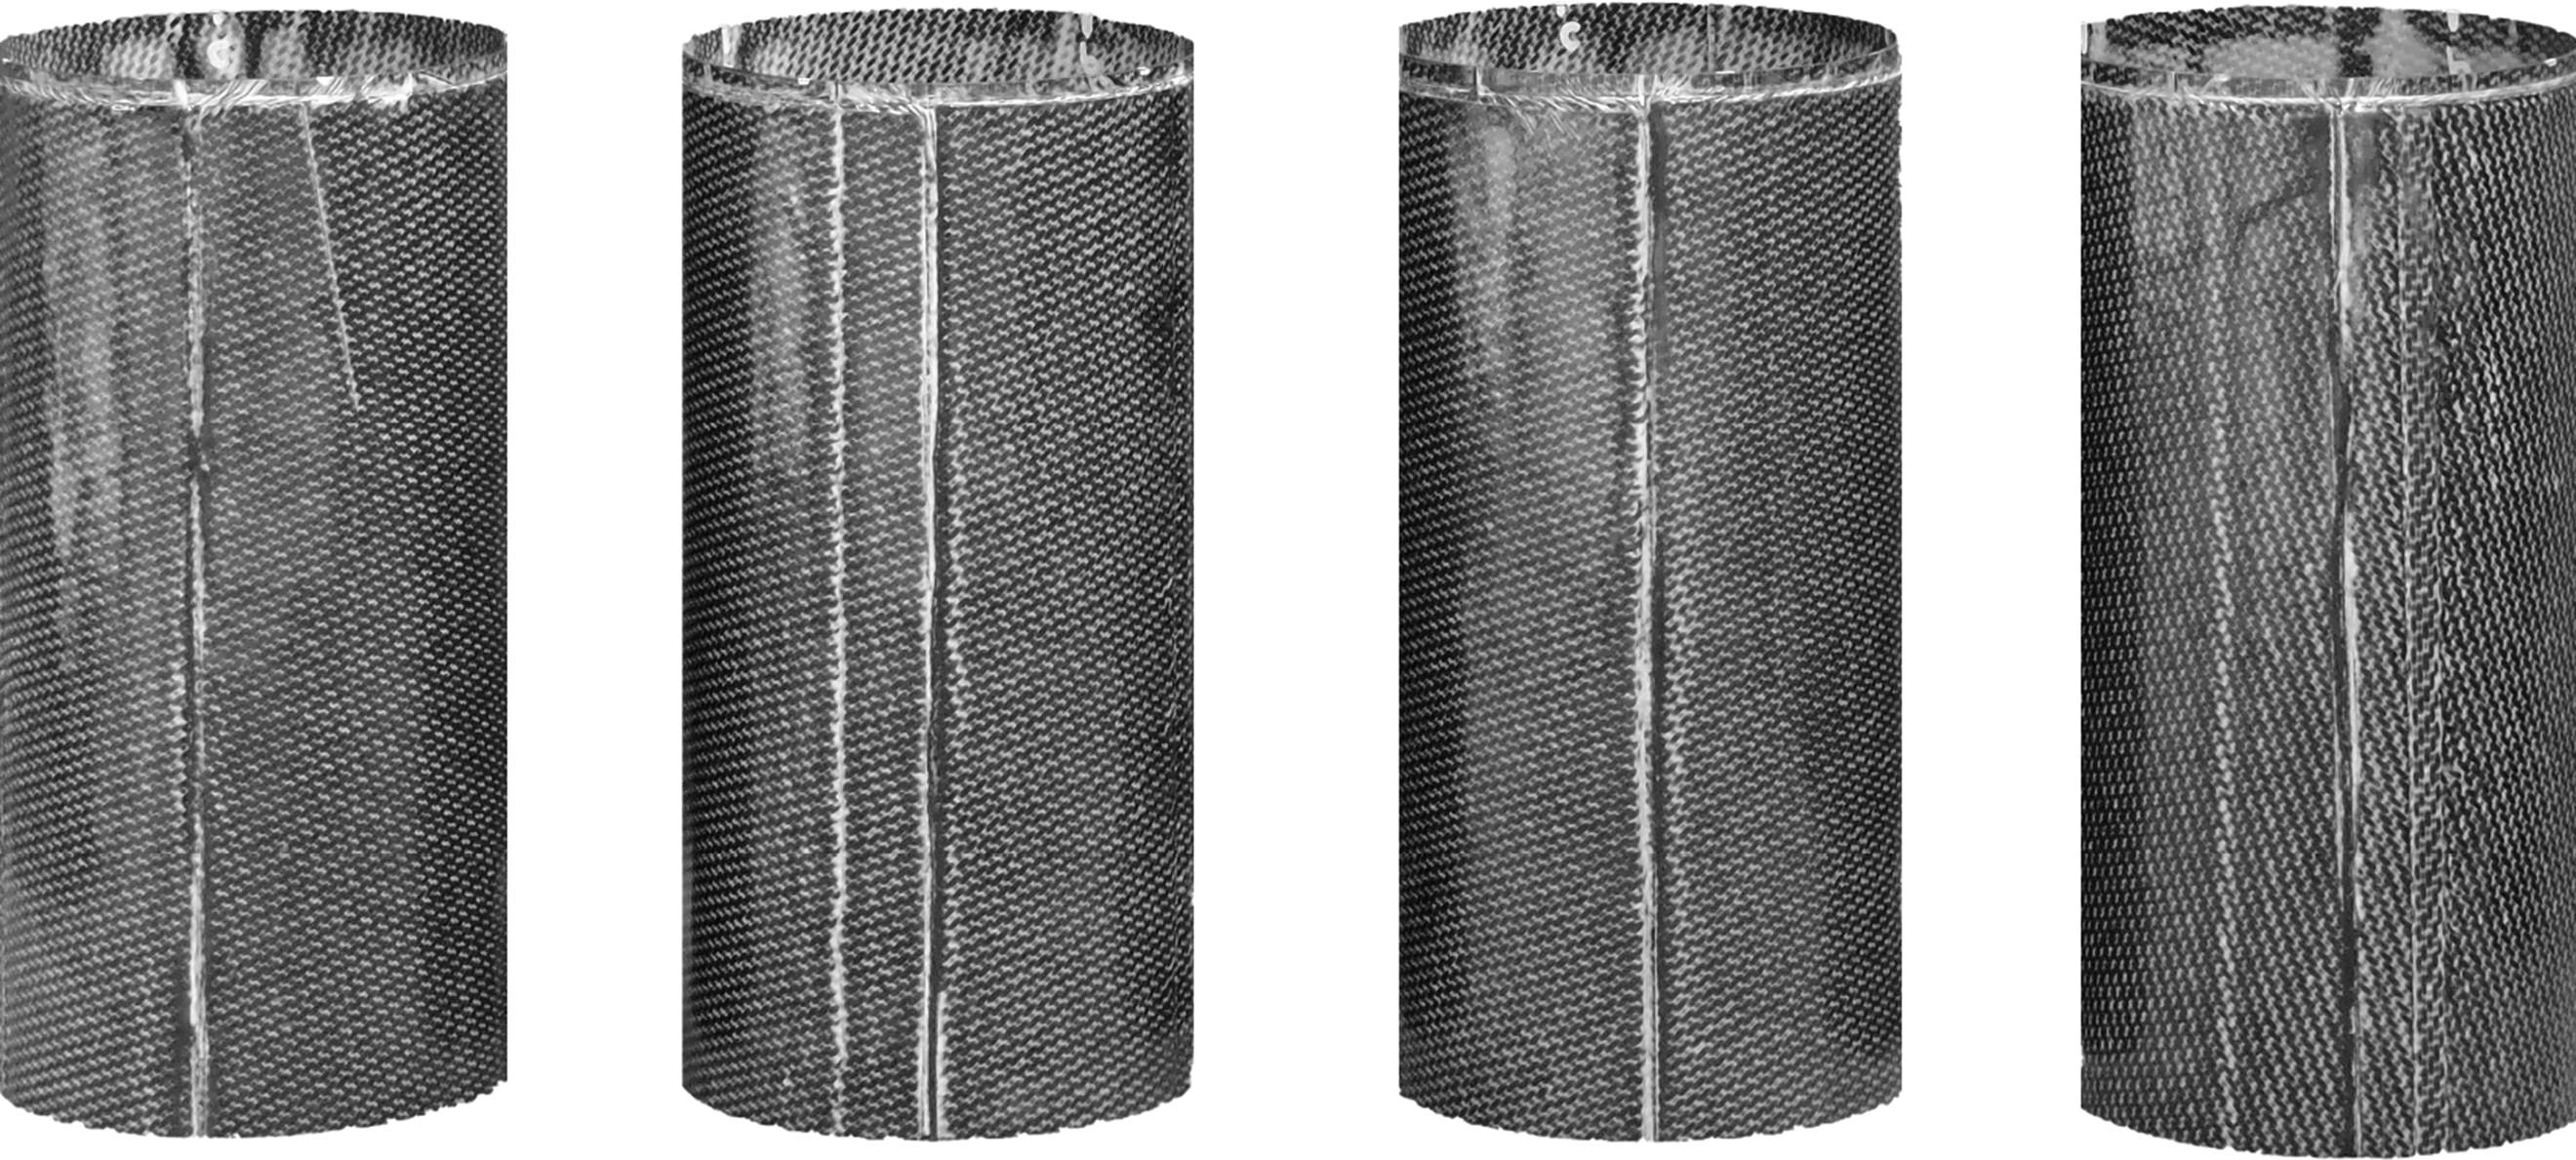
The manufacturing process of tubes initiates with the lamination procedure, in which the individual plies are spot-welded together, by precisely aligning and stacking individual layers atop a central metallic cylinder. Subsequently, three pre-consolidation stages are undertaken in an oven at a temperature of 180°C for a duration of one hour each. After that, the curing process is carried out within an autoclave by gradually heating the materials to 380°C, maintaining this temperature for a specific period, and then slowly cooling them down, all while maintaining a vacuum.
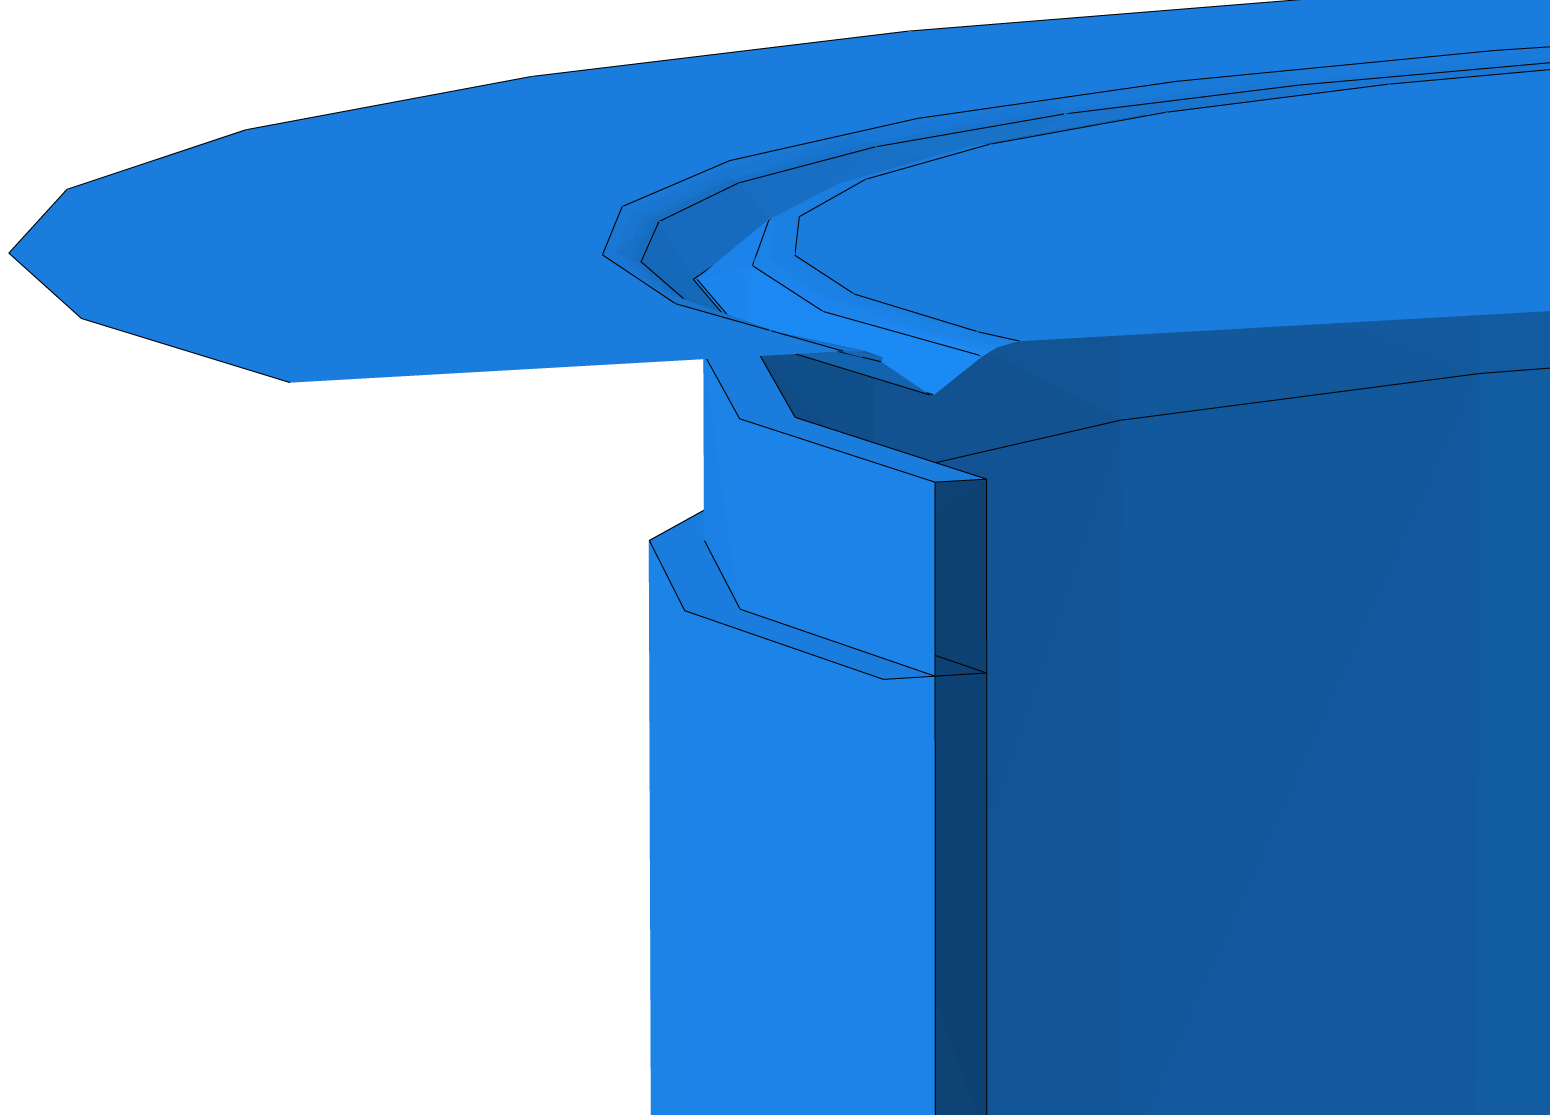
The bevelled shape of the trigger is achieved by omitting the laminate’s symmetry, so that specimen’s thickness is halved in the last 5 mm of the tube height, as it is shown in Figure 5. Detail of bevel trigger.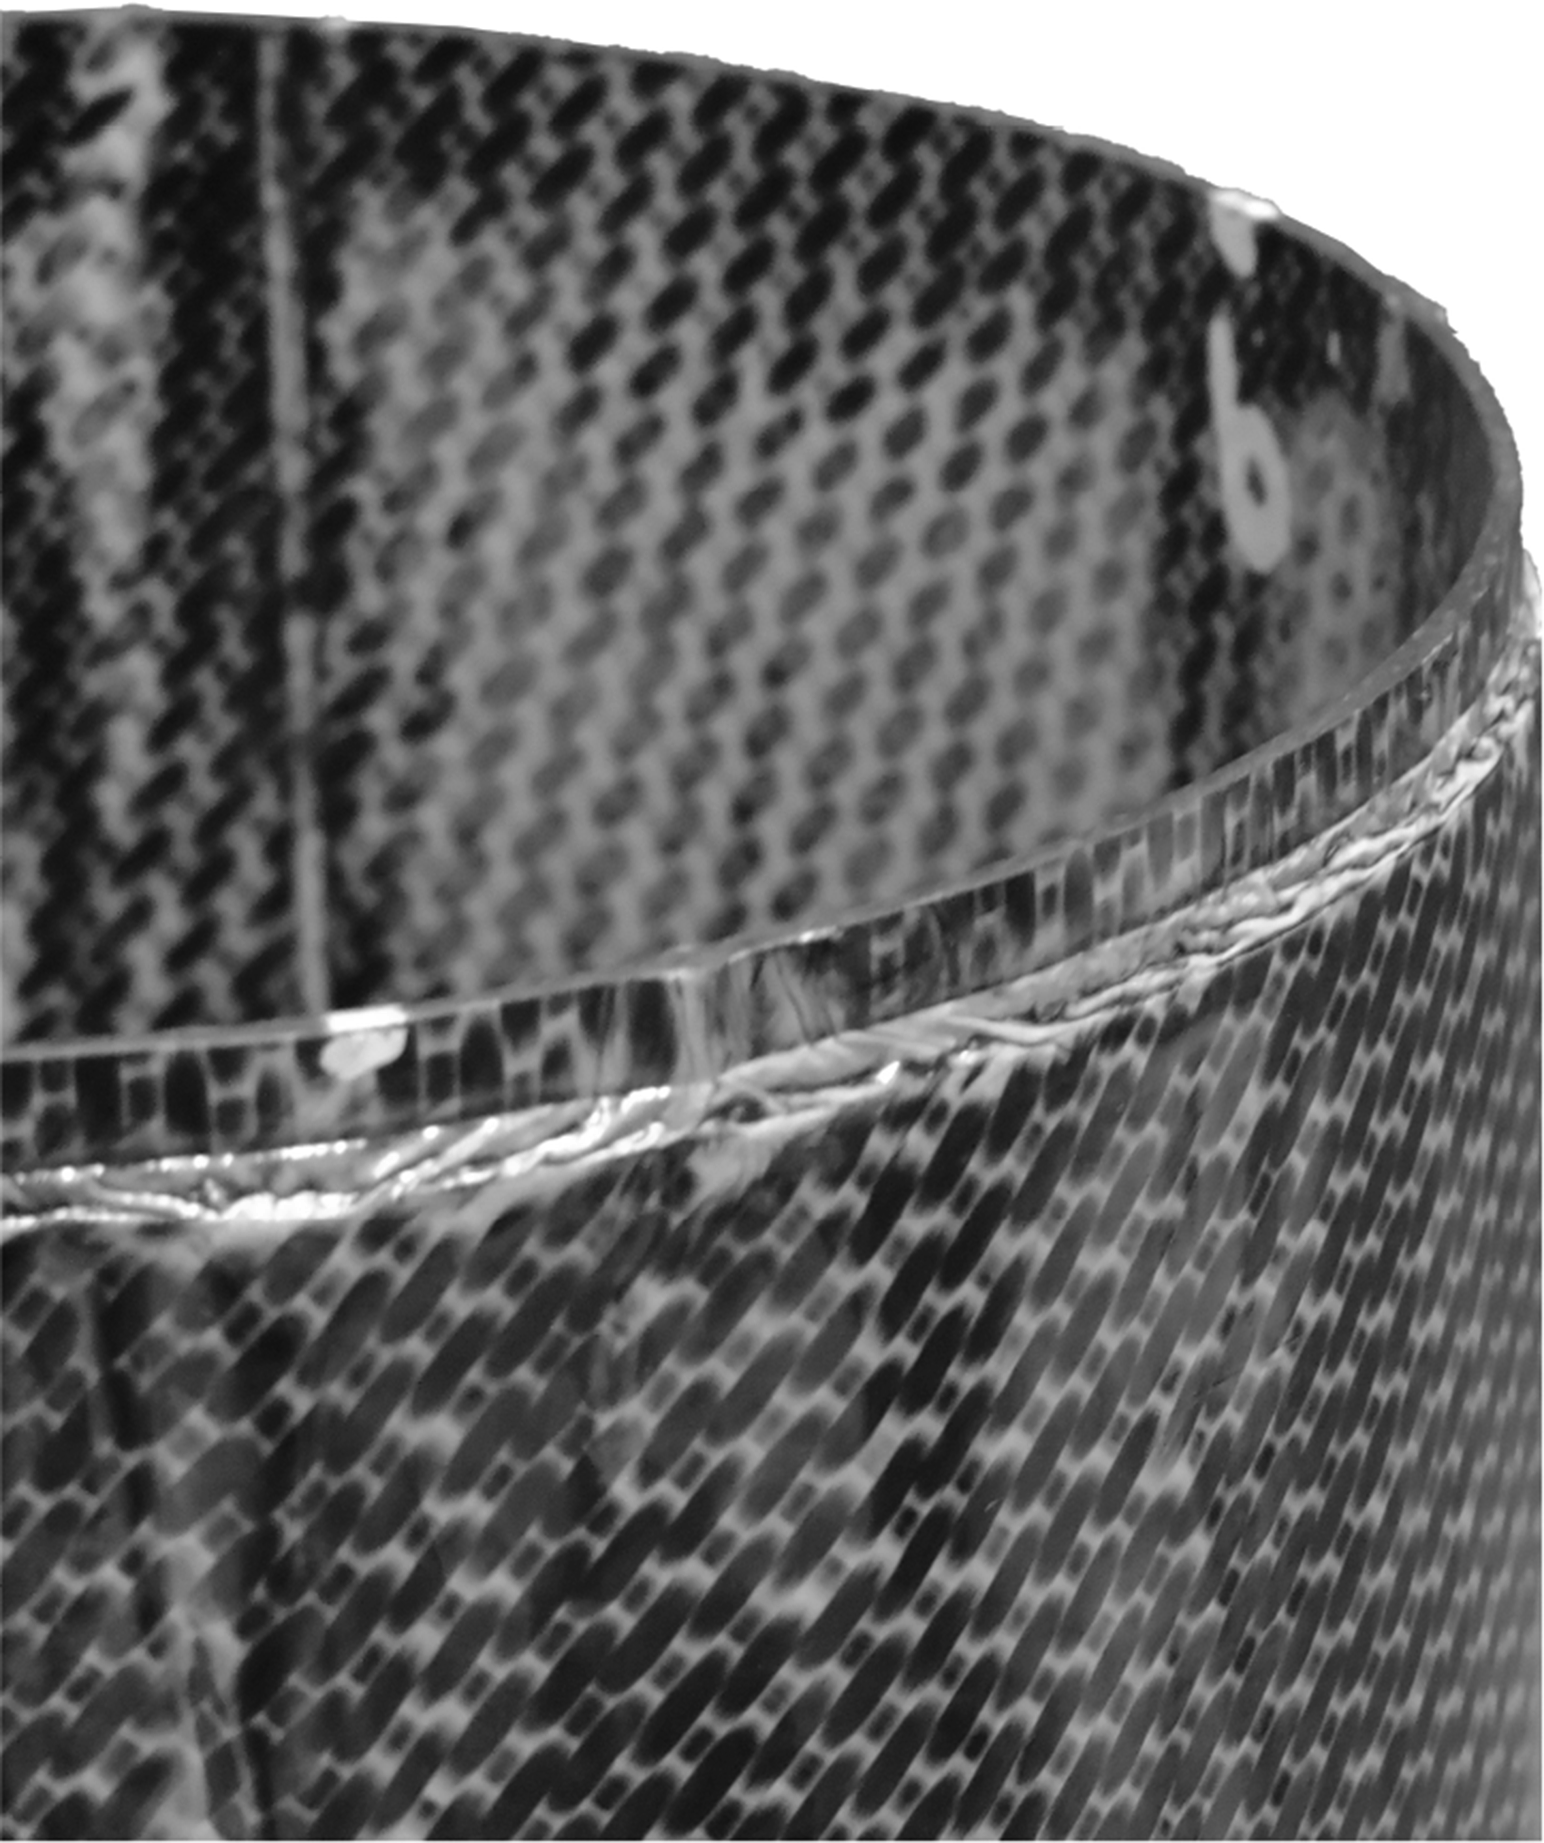
Minor geometrical imperfections are also detected in the cross-section of the specimens, such as wrinkles and variation in thickness, as a consequence of the manufacturing process of the tubes. These imperfections are shown in Figure 6. During the compaction process in the autoclave, wrinkles appear axially, causing variations in the thickness of the material. These variations lead to deformations of approximately 2 mm in the circular geometry. The bevel trigger helps to avoid undesired collapse modes caused by this fact. Geometrical imperfections in the specimens.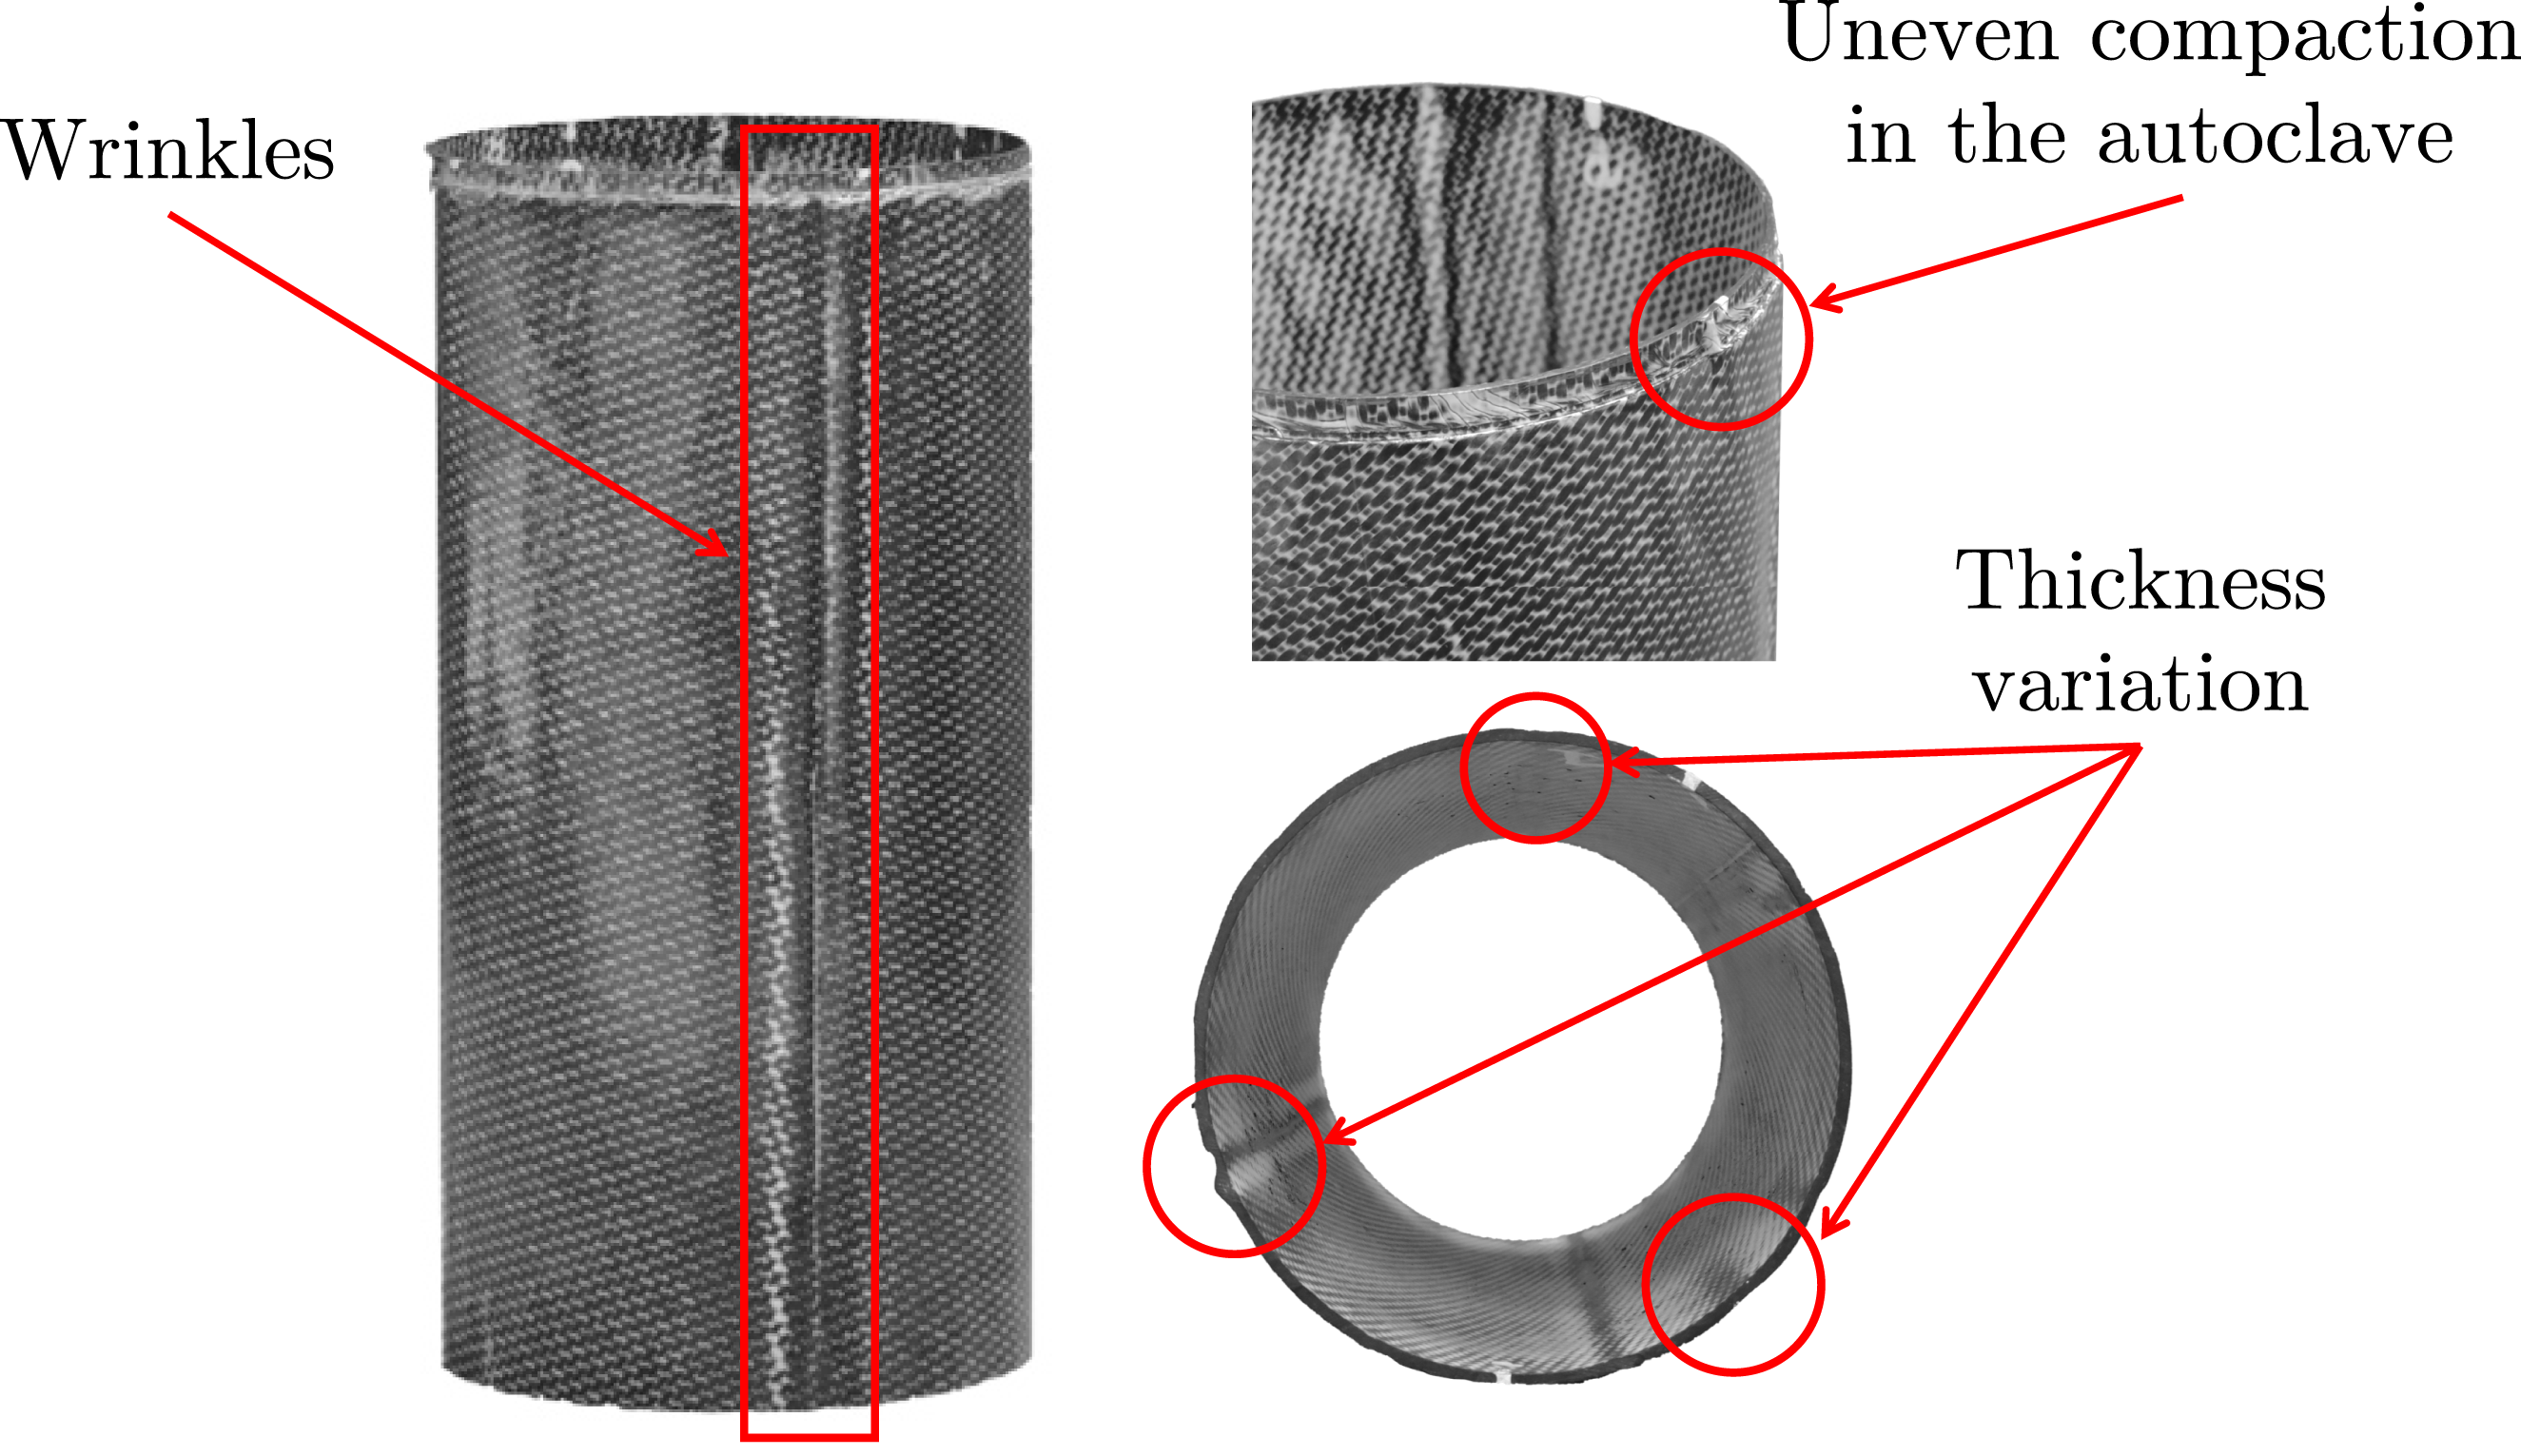
Axial crushing tests are conducted for all components to characterize the crushing behavior of the thermoplastic tubes. The tests are performed in the Aerospace Structures and Materials Laboratory at the Delft University of Technology.
The specimens are subjected to a compressive load between two flat steel platens under displacement-controlled conditions and at room temperature. A MTS servo-hydraulic testing machine with a load cell of 250 kN is adopted for all the tests. For the comparative purposes, two different rate of loading is adopted throughout the tests. The specimens identified as T1 and T2 are tested in compression with a loading rate of 10 mm/min, while specimens T3 and T4 are tested at 600 mm/min. Considering the initial specimen height, these loading rates correspond approximately to nominal strain rates of 6.67 × 10⁻⁴ s−1 for T1 and T2, and 0.04 s−1 for T3 and T4. The final crushing displacement for axial compression is set to be 150 mm for each specimen (i.e. 75% of the overall specimen’s height). Load and displacement data are recorded directly in the testing machine.
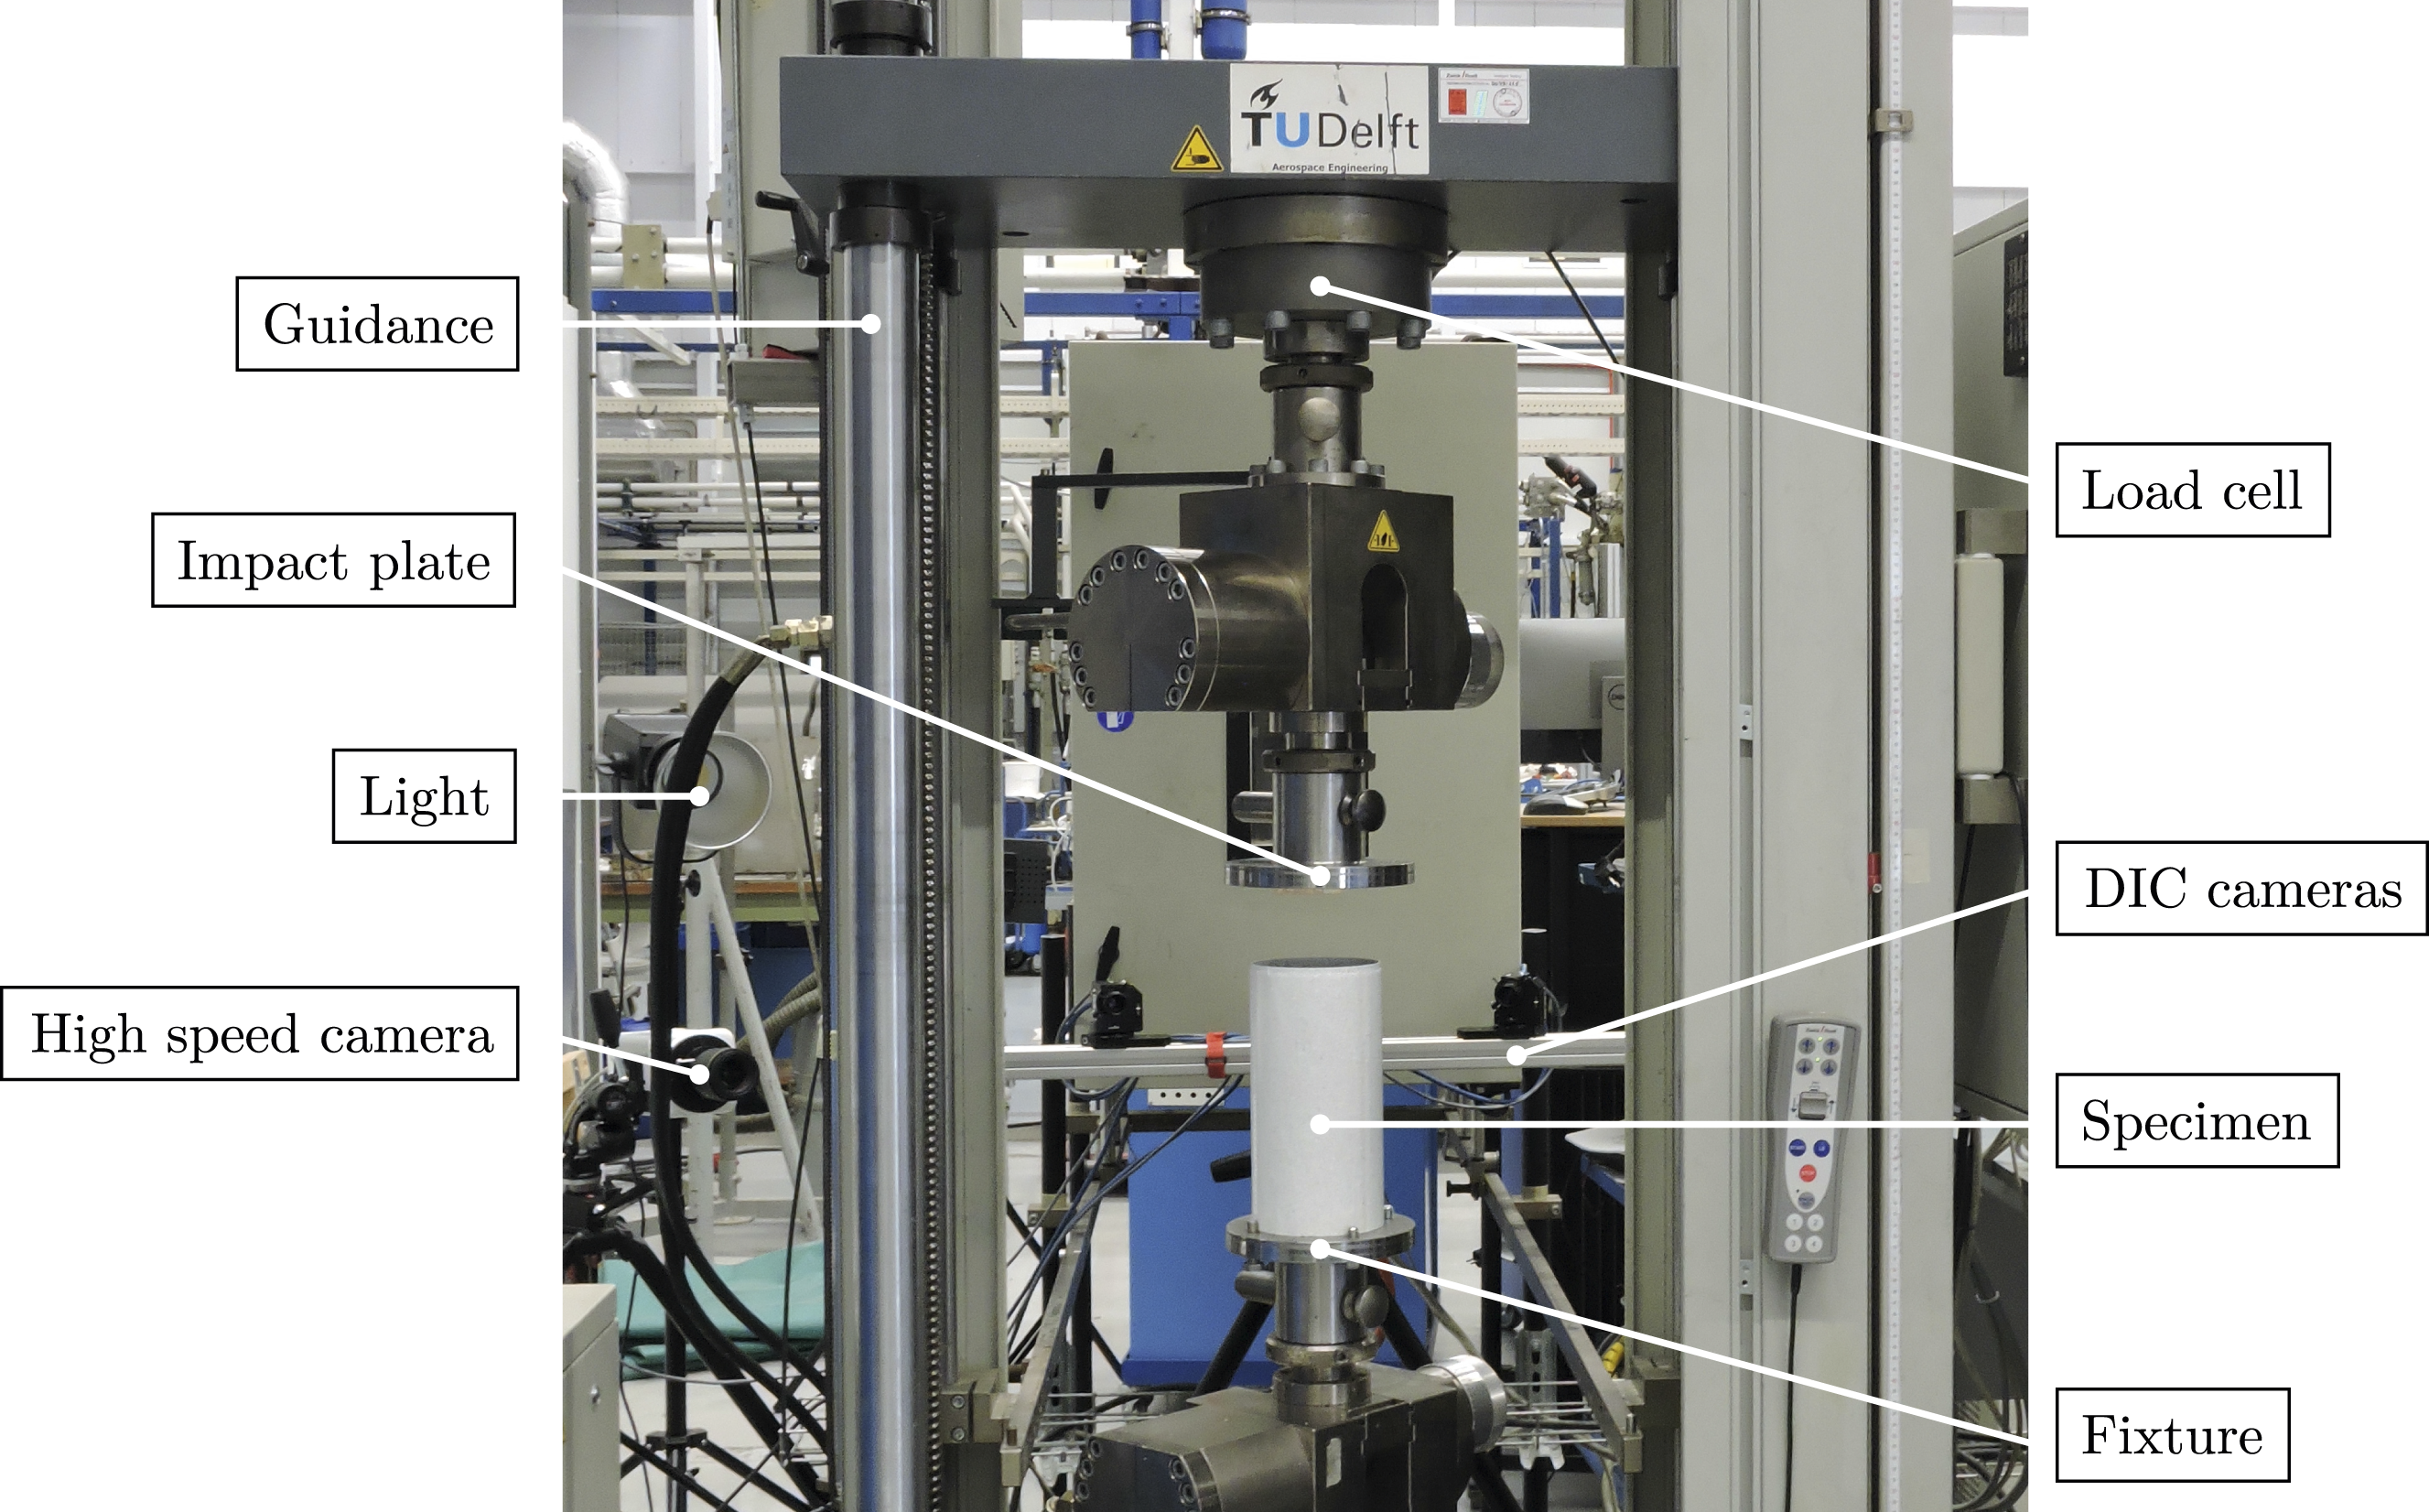
The experimental configuration used for the tests is depicted in Figure 7, with a close-up view provided in Figure 8. The specimens do not require any supporting fixture. The acquisition system collects the reaction force of the specimen. The measurement of the strains is performed with a Vic3D digital image correlation (DIC) system, equipped with two cameras. For that, three tubes (T1, T2 and T3) have to be painted with a black speckle pattern over white background. This system is adopted to retrieve strain distribution on the tubes, obtain more accurate displacement data that is not affected by machine compliance and to check that no global or local buckling occurs. The tube T4 is intentionally left unpainted to facilitate a more detailed observation and analysis of the failure mechanism within the material. A high-speed camera is also used to capture the collapse initiation and the progression of the tube crushing, recording the experiments at 2000 fps. Test set-up at the aerospace structures and materials laboratory at the Delft University of Technology. Detailed view of the test frame.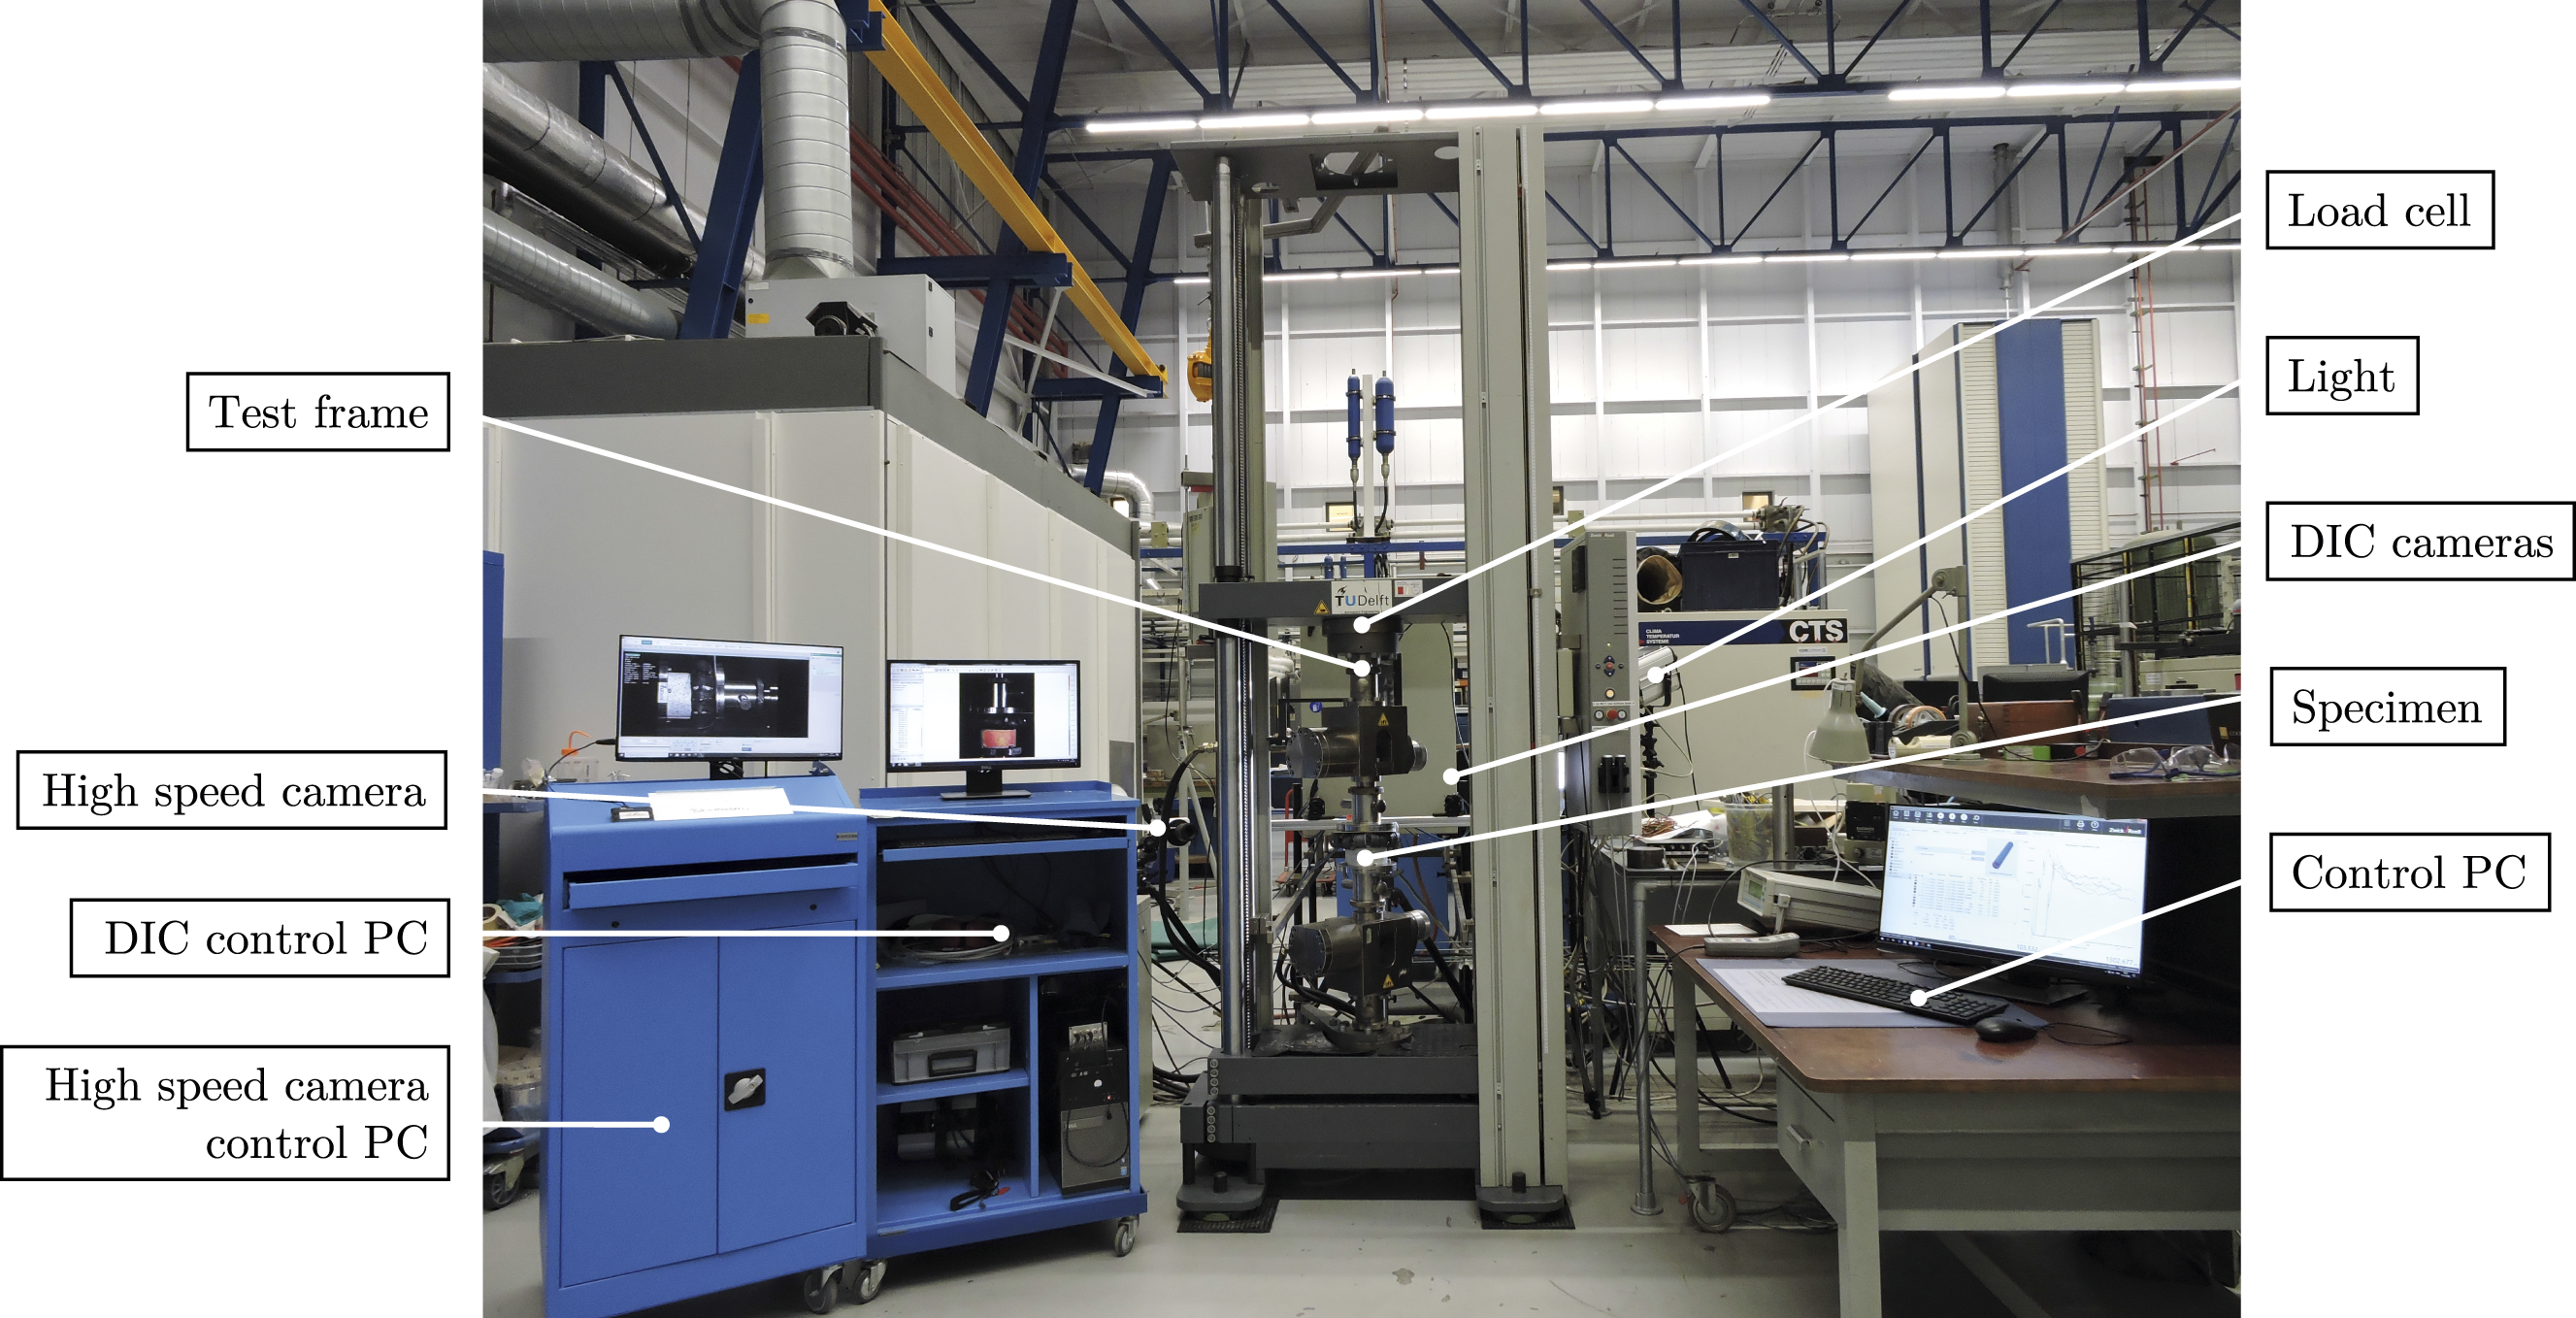
In the context of designing crashworthy structures, the primary objective is to minimize occupant injury by optimizing the structure’s ability to absorb impact energy and mitigate peak impact loads. 47 Therefore, standard crashworthiness parameters are calculated in order to assess the crash performance and facilitate the direct comparison. These parameters are: peak crushing load (Ppeak), mean crushing load (Pm), absorbed energy (Ea), specific energy absorption (SEA) and crush force efficiency (CFE).
Results and discussion
This section presents an analysis of the behavior of thermoplastic tubes. The study includes a discussion of numerical and experimental results, and the comparison between them, focusing on load-displacement curves, crashworthiness parameters, and strain fields observed on the surface. Through this analysis, a detailed understanding of the material’s response under various loading conditions is obtained.
Numerical results
The results of the numerical models analyzed are presented and discussed, through which the effects of key parameters on results are analyzed in detail. All the force values are subjected to a SAE600 filter in ABAQUS, providing a refined representation of the force-displacement curve.
Figure 9 shows the force-displacement curves predicted by the four FE models developed. It is observed that the models meshed with S4R elements (FEM1 and FEM2) inadequately captured the behavior of the material, as the deformed shape deviated significantly from the expected outcome, revealing limitations in the capacity of that type of element to replicate the tube behavior. The development of the force-displacement curve is closely linked to the gradual buckling pattern and damage observed in circular tubes subjected to axial crushing. Consequently, the deformation mode of the tube is intricately associated with its energy dissipation mechanism, playing a crucial role in regulating the overall energy efficiency of these components.
48
Comparison of force-displacement curves between the different models.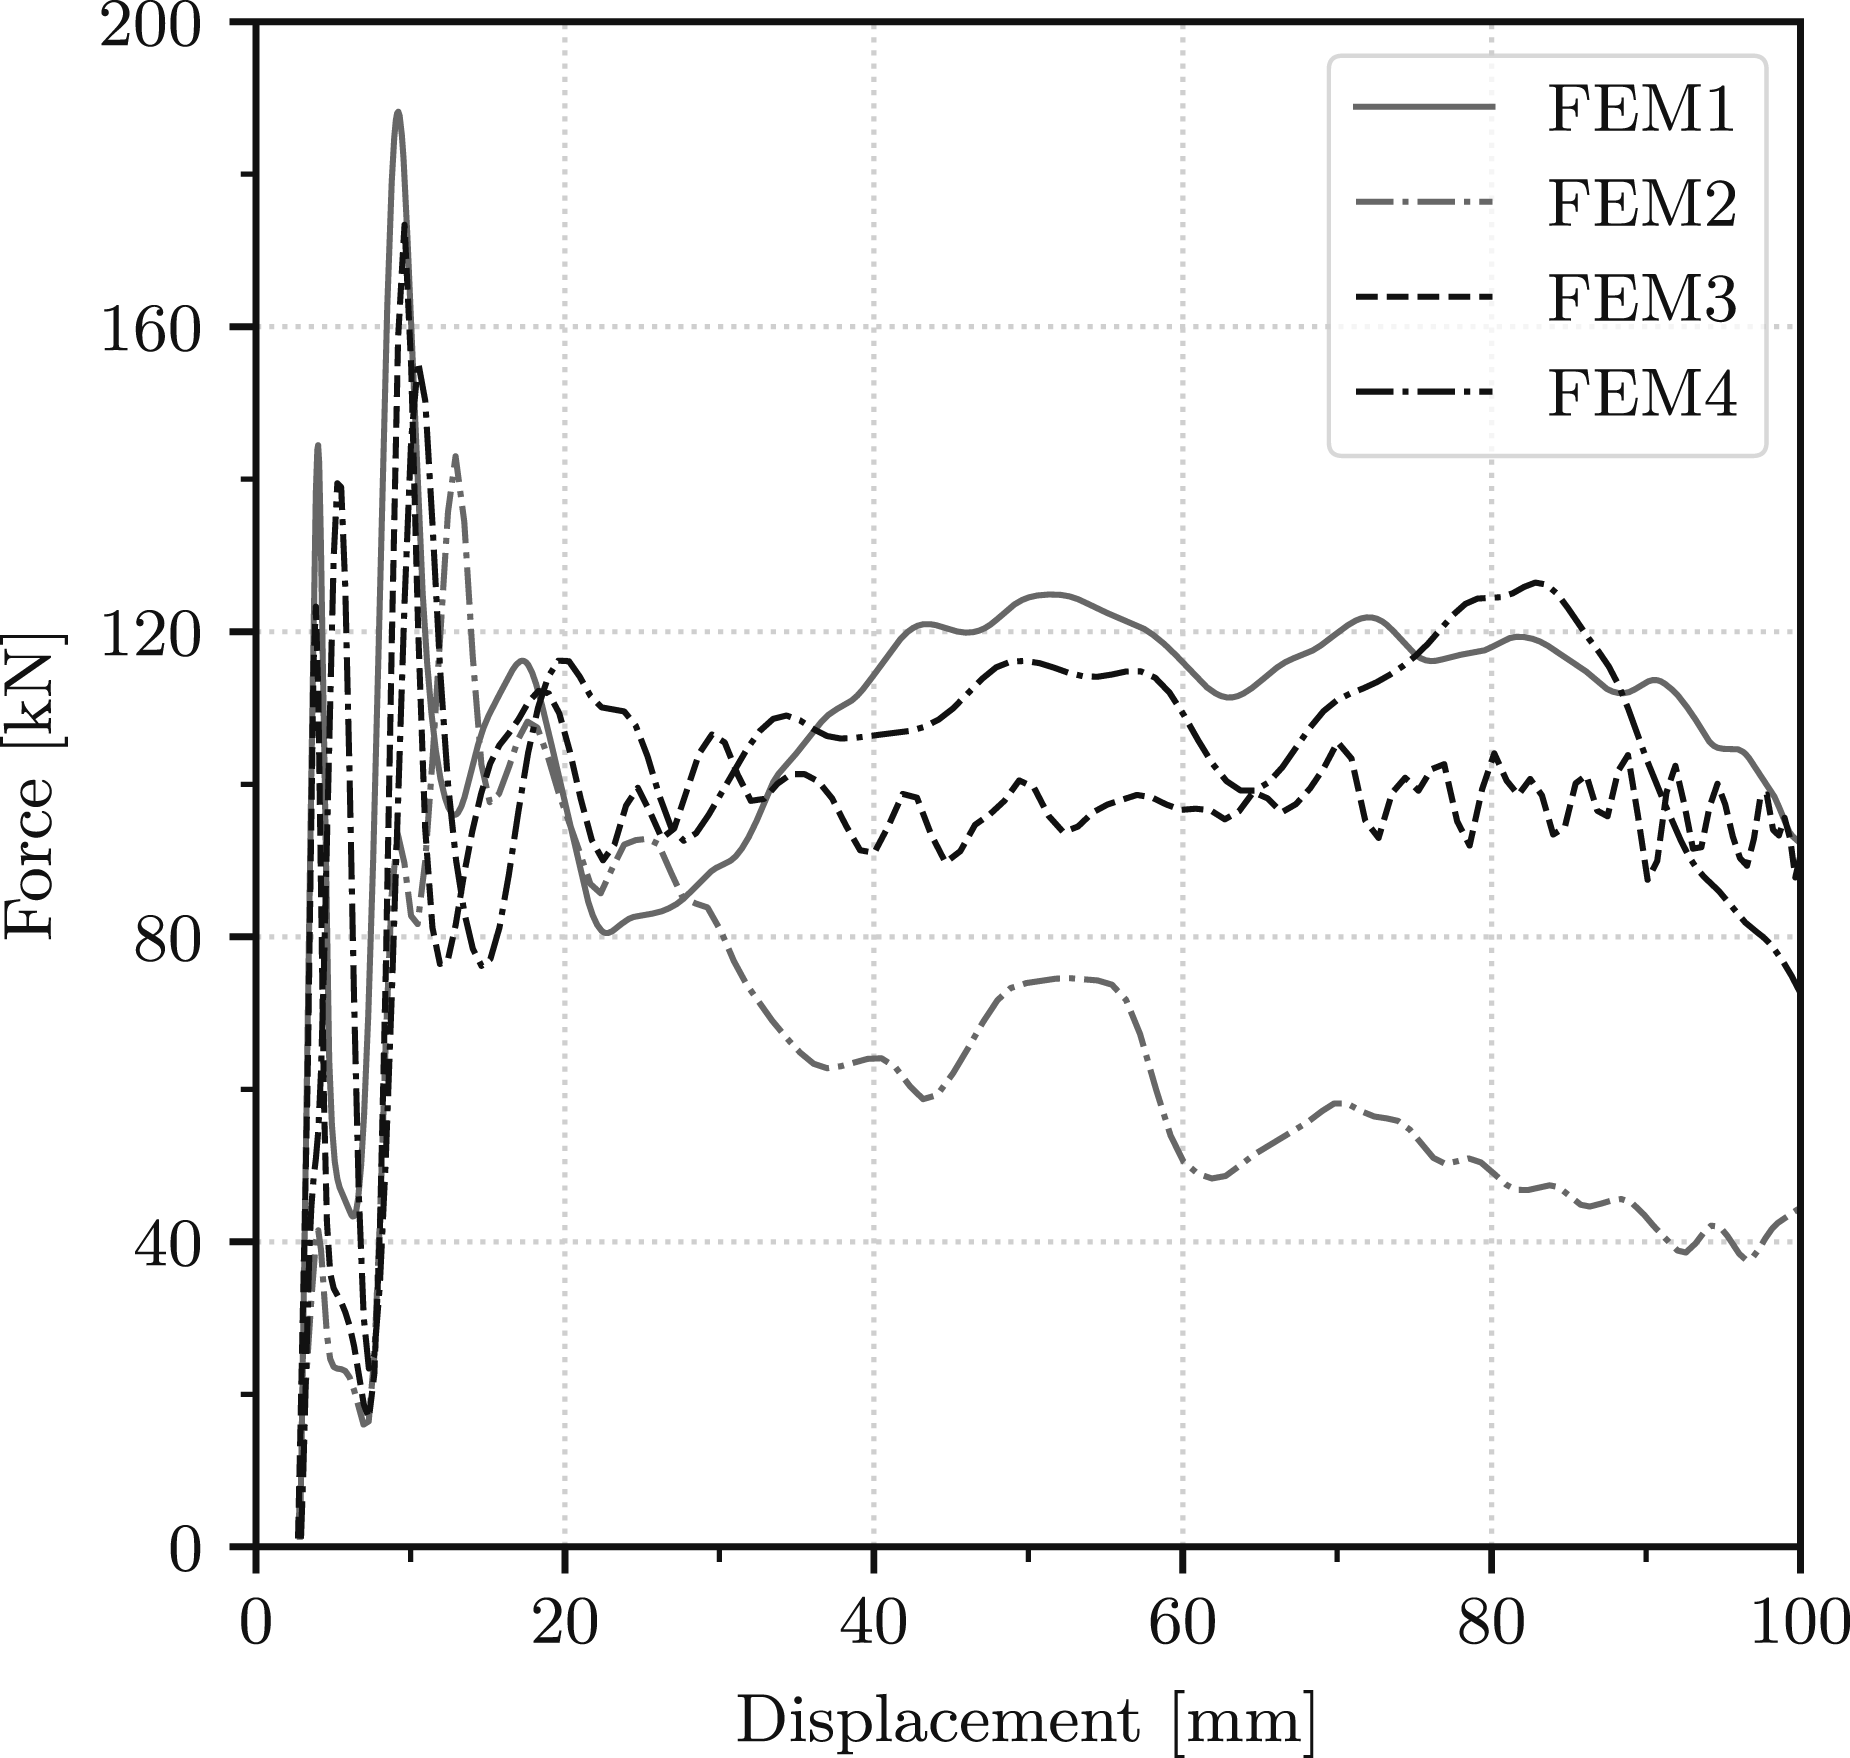
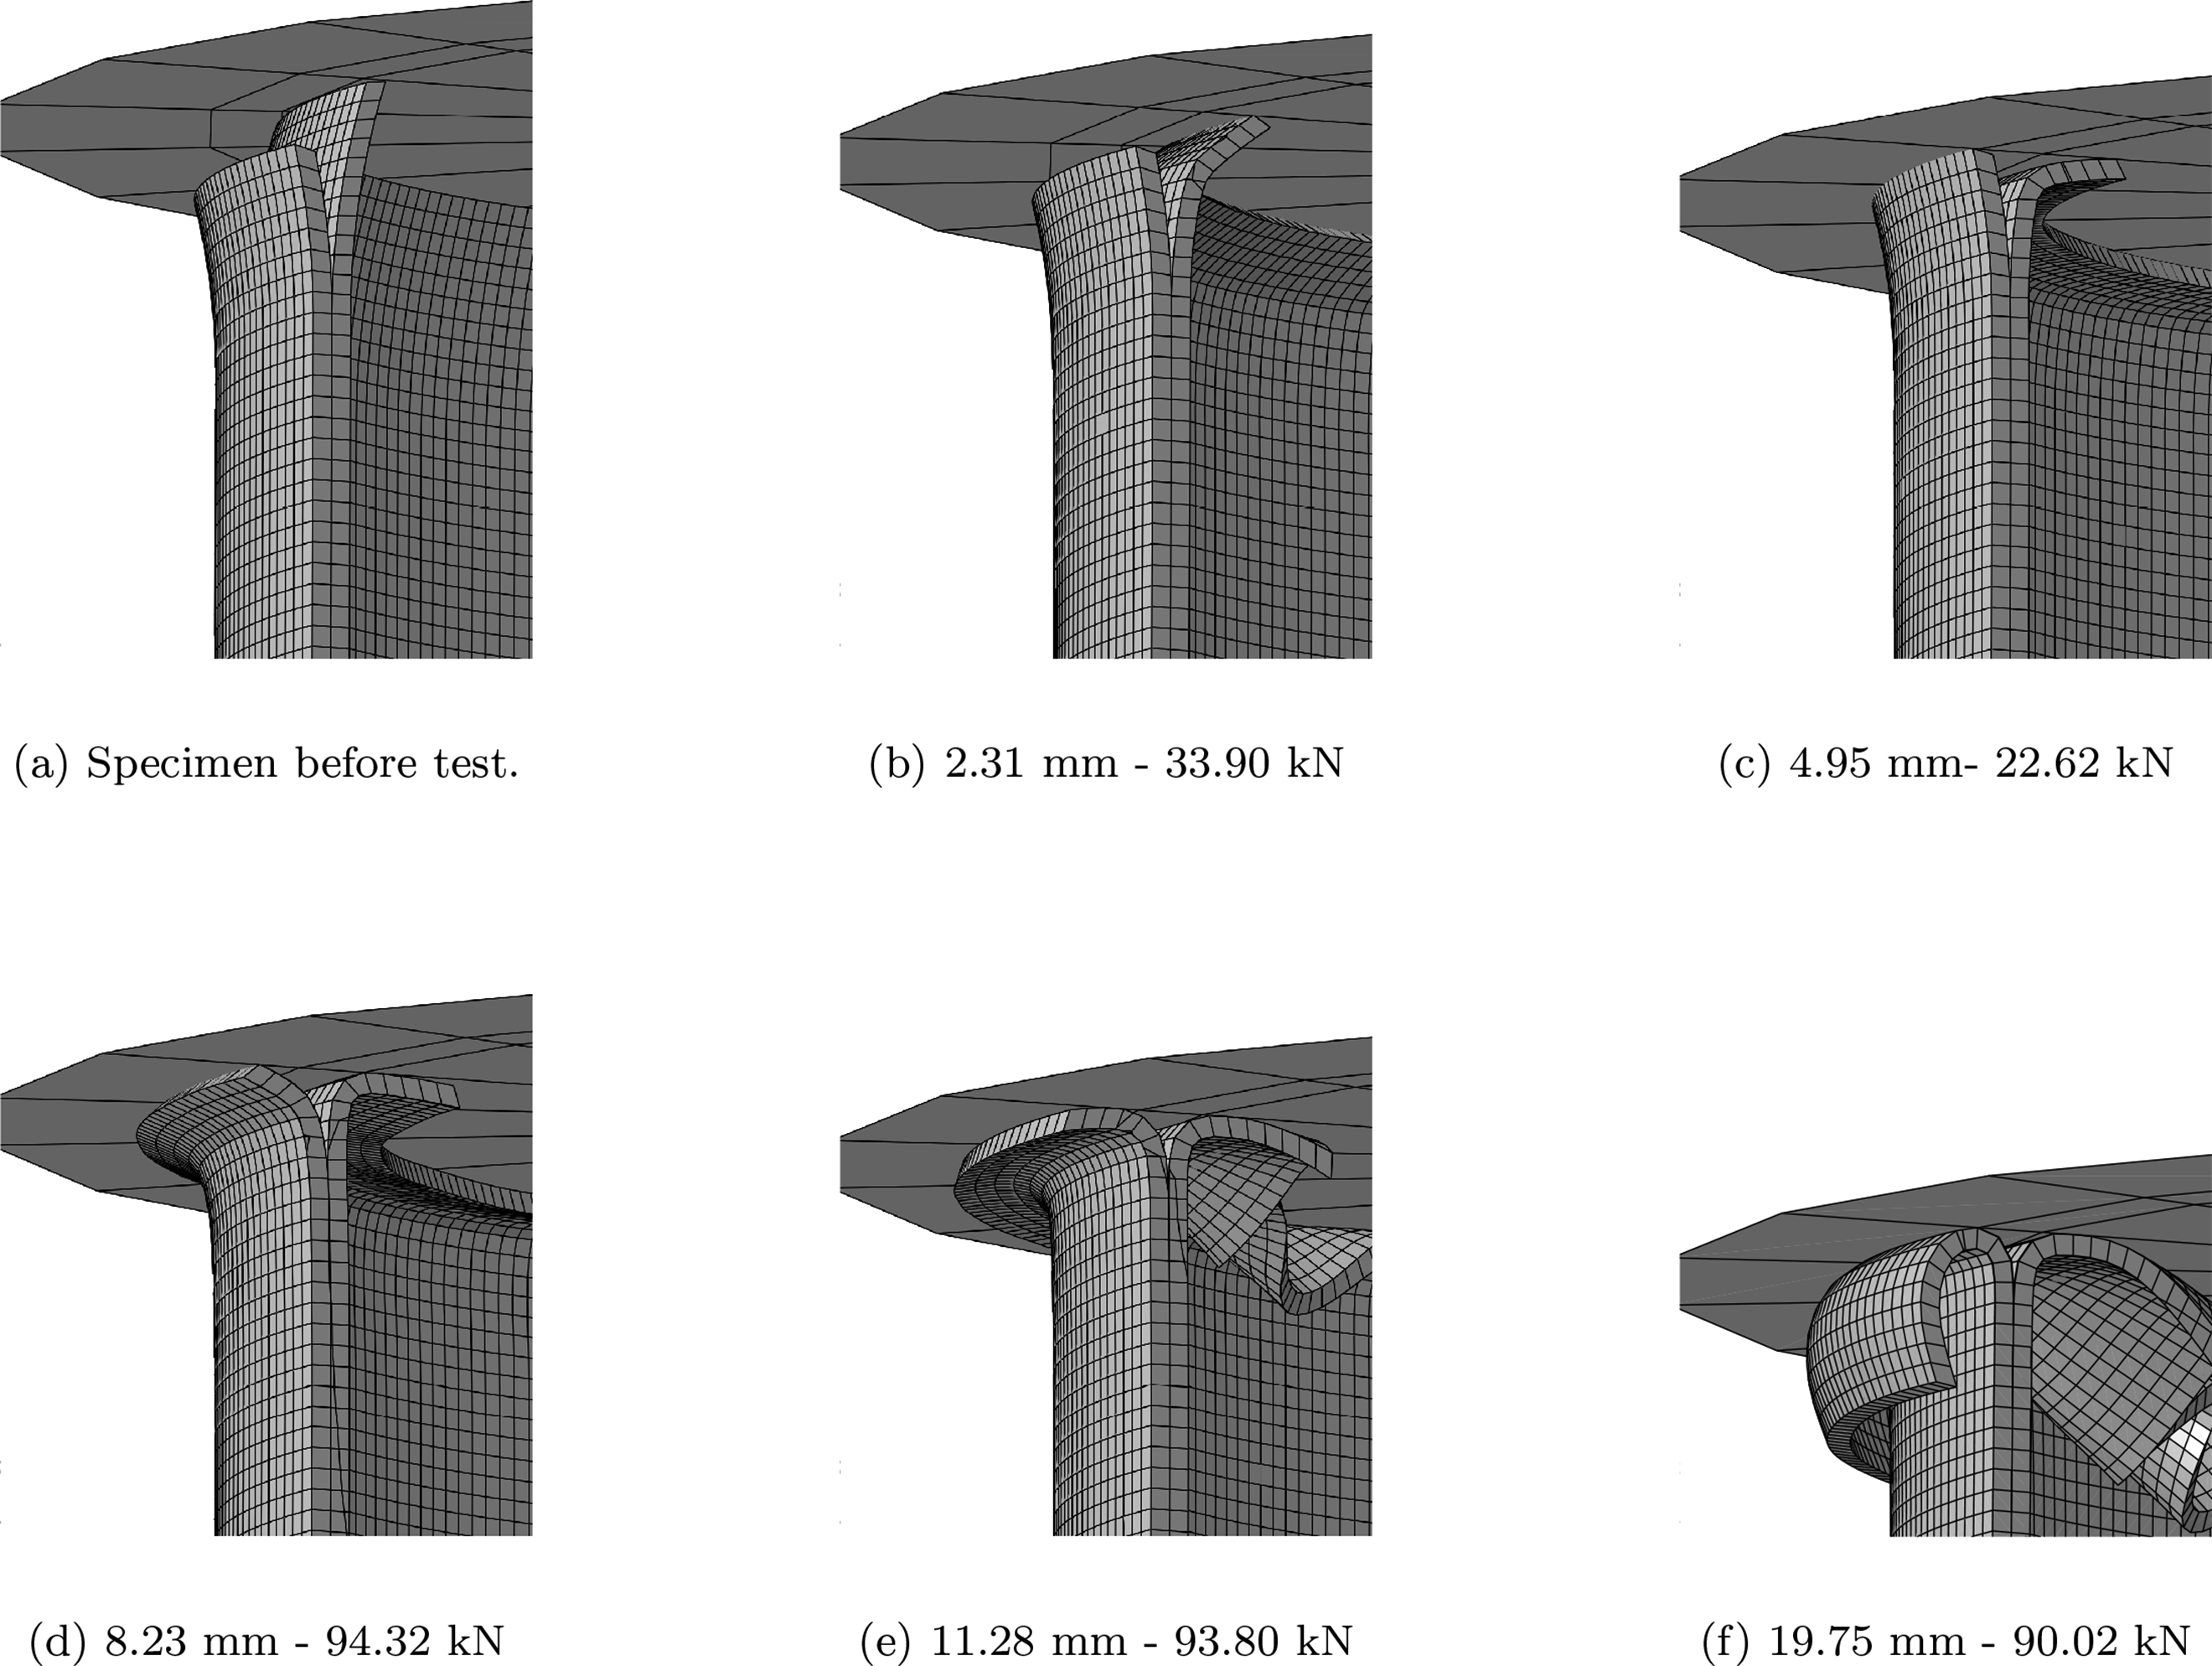
On the other hand, the models meshed with SC8R elements (FEM3 and FEM4) successfully demonstrate the capacity for delamination, resulting in a more stable progression of crushing, while FEM2, despite also incorporating a cohesive surface between the middle plies, did not capture the delamination process as effectively. Figure 10 shows the deformation during the crushing process of model FEM3. Figure 11 shows a more detailed view of the initial delamination due to the bevel trigger. Initiation of the delamination process in FEM3. Detail of the delamination process in FEM3.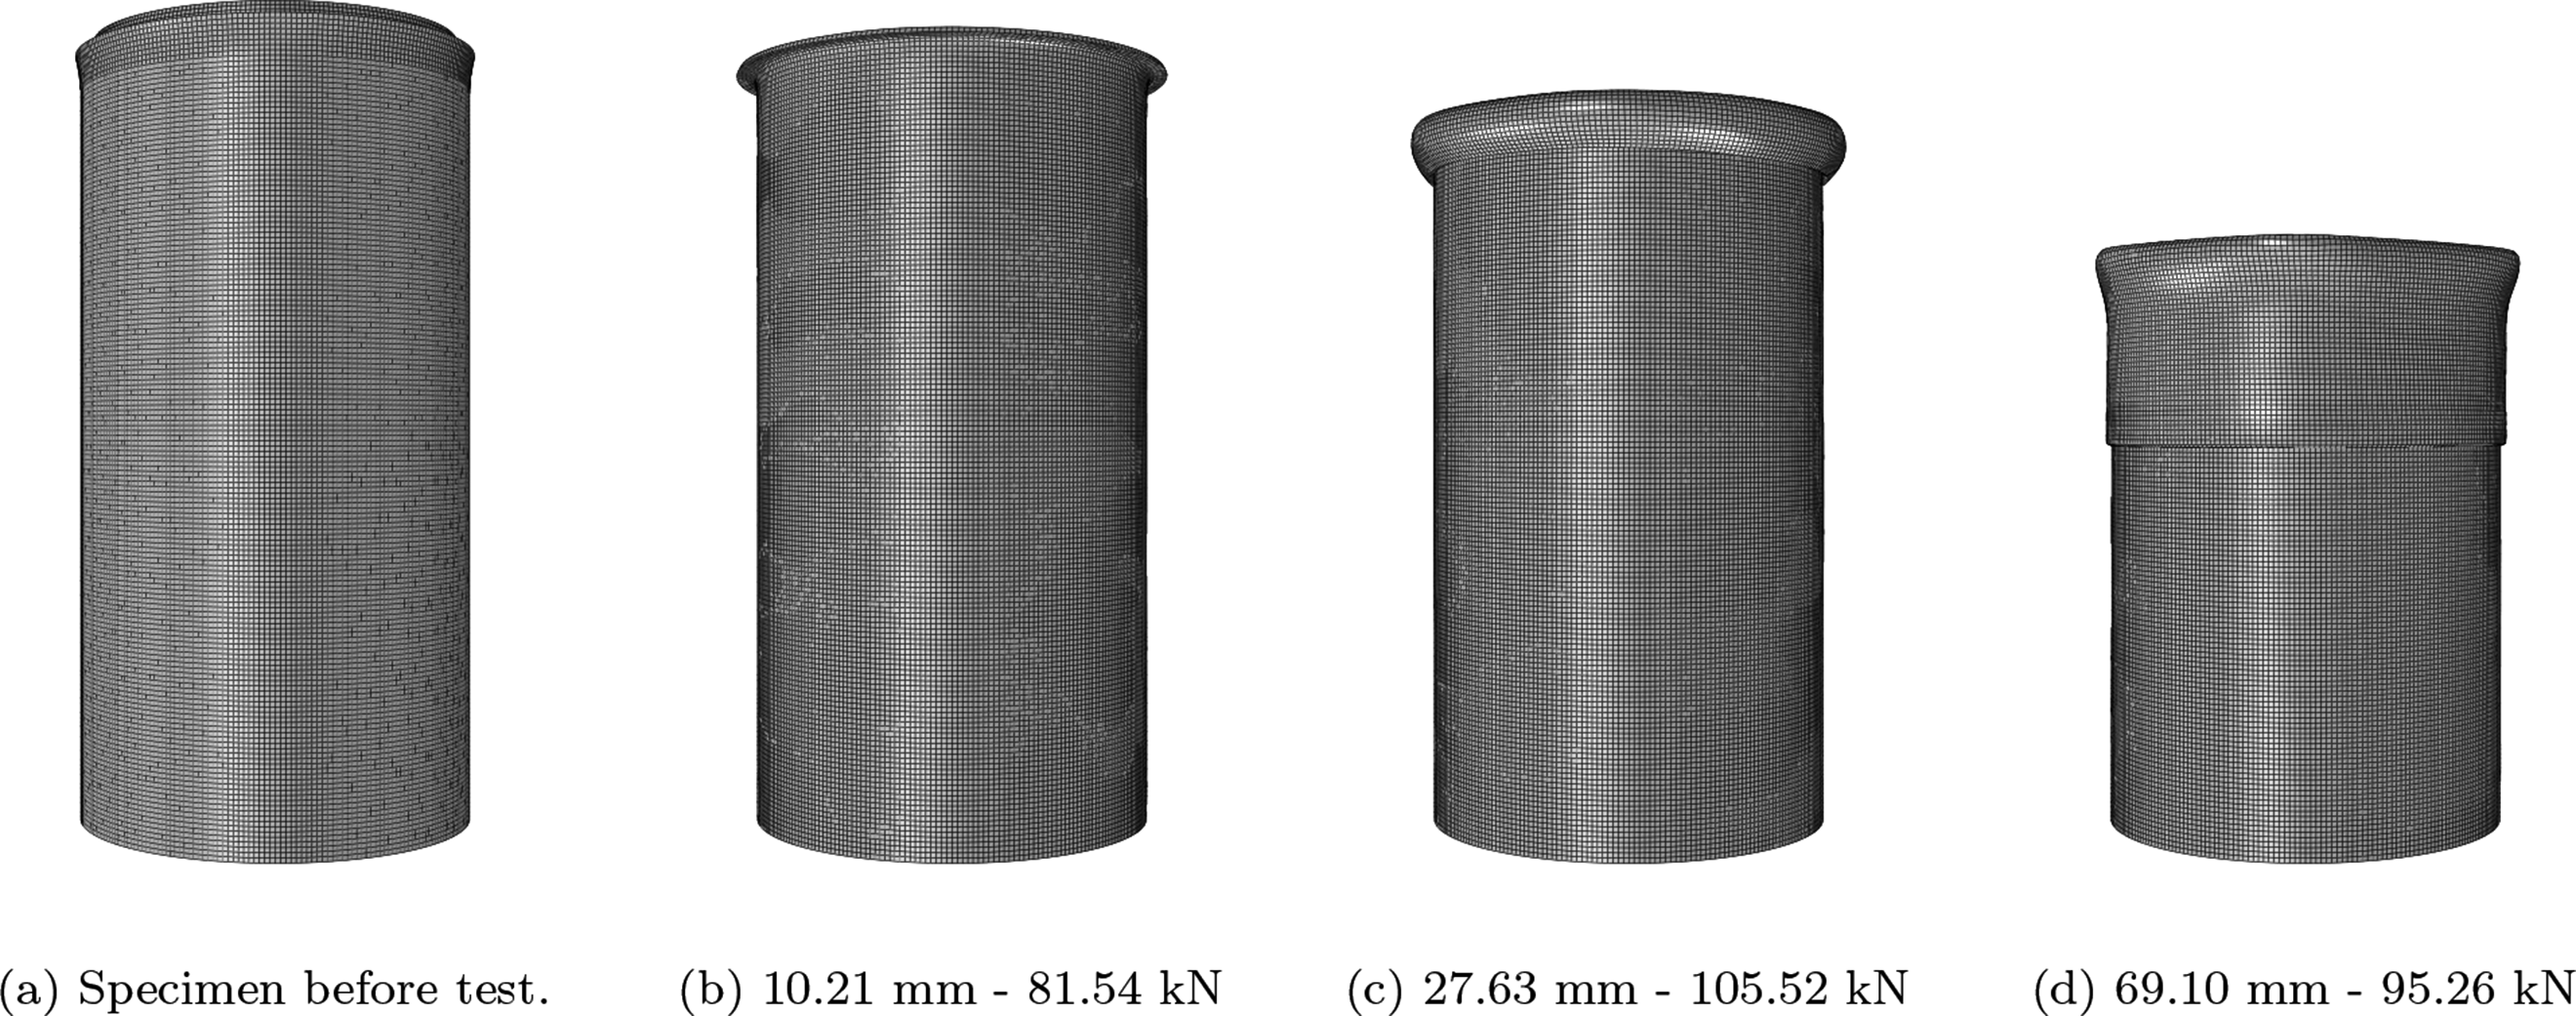
However, achieving numerical stability remains a challenge since continuum shell elements subjected to loading in the thickness direction are affected by extensive hourglassing. 37 Additionally, the cohesive elements exhibited a tendency to undergo abrupt or excessive damage. Therefore, a study is conducted using model FEM3 to analyze the variables influencing the evolution and stabilization of damage within the Hashin damage model.
To address the convergence challenges associated with damage evolution laws in the finite element code,
37
a damage stabilization factor (referred to as f) is adopted in all the simulations. To identify the most suitable value for f, a parametric study is conducted, and the subsequent results are presented herein. The peak force of the tubes is studied using the Hashin model across five different f values, ranging from zero to 10−3. As depicted in Figure 12(a), a correlation is observed between the damage stabilization factor and the peak force. It is observed that the omission or nullification of the damage stabilization factor in the model prevents it from converging to a valid solution, since excessive distortion of elements take place. Moreover, the peak force increases with the increase of the stabilization factor. This sensitivity to the damage stabilization factor is particularly notable within the range of 10−3 < f < 10−5 but appeared to stabilize within the range of 10−6 < f < 10−5. Furthermore, a smaller value of f tends to a more precise estimation of Ppeak. Effect of damage stabilization factor and fracture energies of the Hashin model on the numerical force-displacement curves in FEM3.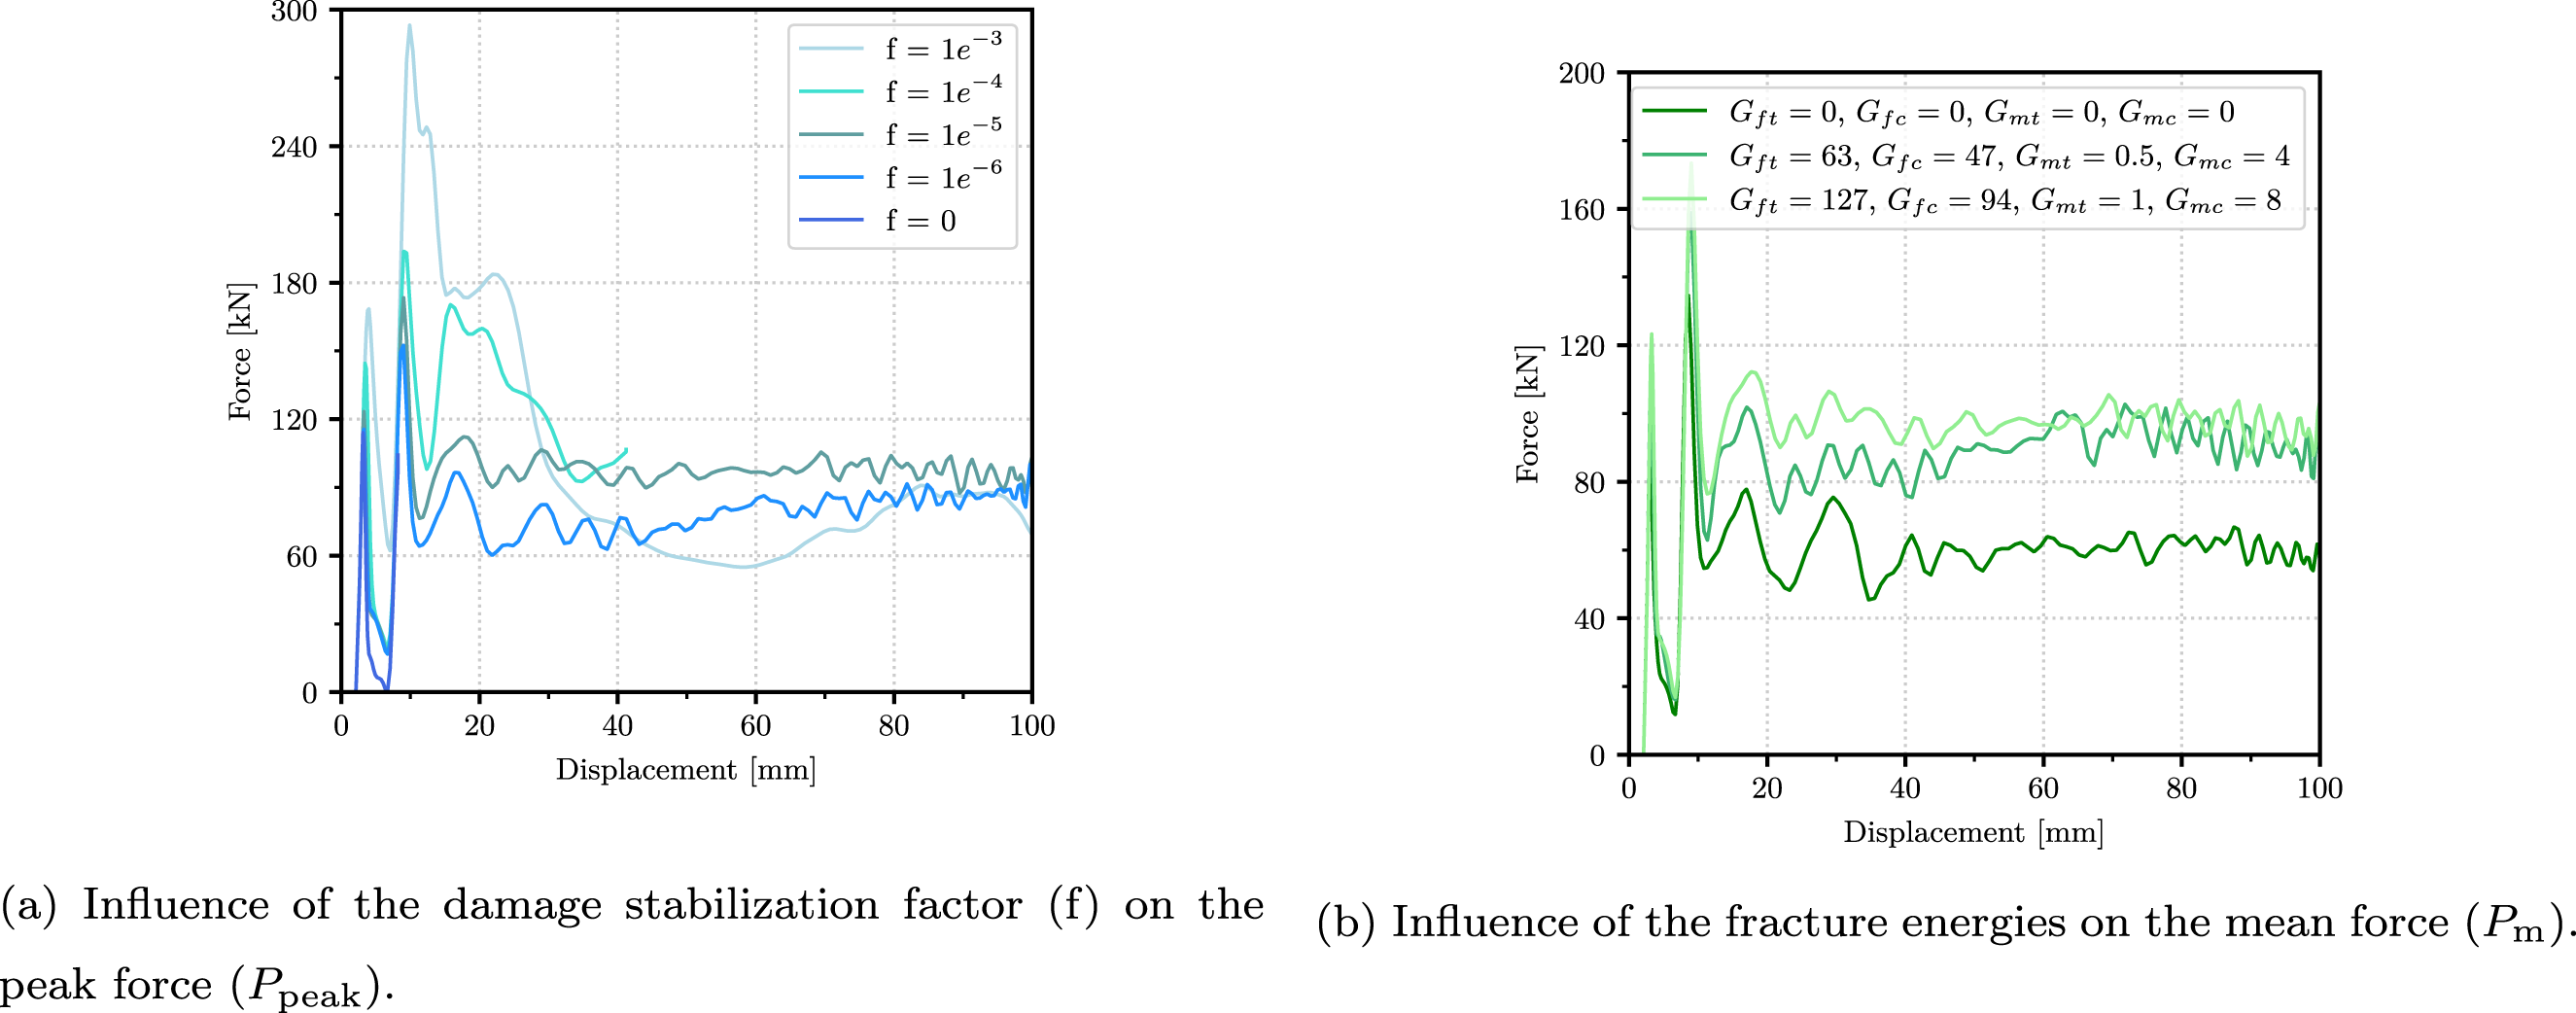
The choice of the stabilization factor (f) also influences computational time, notably shooting up for values below 10−5. This factor significantly impacts the convergence of the simulation and, therefore, computational efficiency. Values below 10−5 might lead to divergent or excessively long computations, compromising computational efficiency and overall productivity. In light of the considerations regarding the impact of f on the accuracy and efficiency of predicting Ppeak, a consistent choice of 10−5 is used for the stabilization factor.
On the other hand, Figure 12(b) shows the force-displacement curve during the crushing process with different values of fracture energies in model FEM3. Despite all the simulations developed approximately the same deformation mode, it is observed a positive correlation between the fracture energies in each direction and the crashworthiness parameters. As the fracture energies increase, the values of peak force, mean force, absorbed energy and SEA, also exhibit an increase. Comparatively, the experimental values obtained from 43 correspond most closely to the expected material behavior when compared with the simulation results, reflecting a more accurate representation of the behavior of the material under consideration.
Experimental results
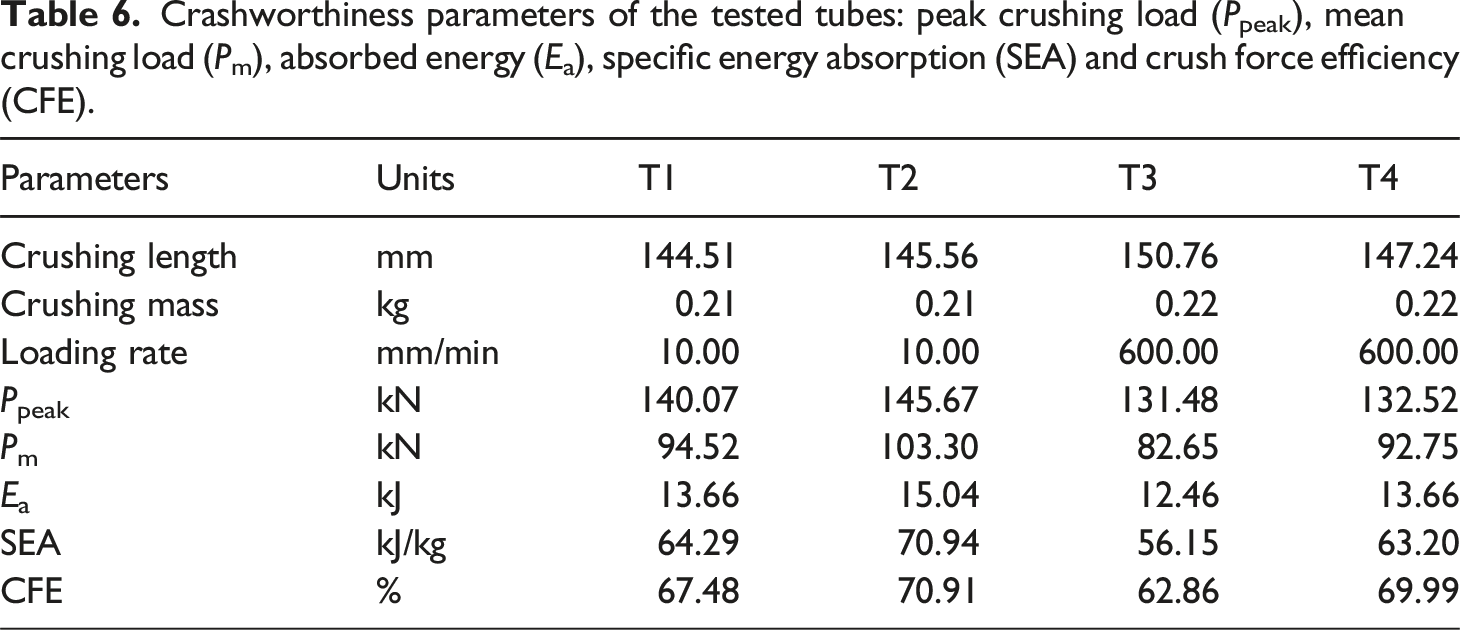
The force-displacement curves obtained from the four axial crushing tests are shown in Figure 13. In light of the curves, there is little difference between the tubes tested at different loading rates. The tubes tested at 10 mm/min obtain slightly higher peak and mean forces than the tubes tested at 600 mm/min. The standard crashworthiness parameters obtained from the force and displacement data of each test are summarized in Table 6. The consistent trend in the results across the four tests is notable, revealing a minimal deviation in parameters such as specific energy absorption (SEA), mean crushing load (Pm), and peak crushing load (Ppeak). The high values of SEA indicate an efficient energy-absorbing capability of the tubes. Furthermore, the closeness between Pm and Ppeak suggests a stable and controlled crushing behavior, resulting in high values of CFE. This consistency among the experiments underscores the robustness of the results, implying that they are less affected by any inherent imperfections or variability in the testing conditions and contributing to the reliability of the outcomes. Experimental force-displacement curve of thermoplastic tubes. Crashworthiness parameters of the tested tubes: peak crushing load (Ppeak), mean crushing load (Pm), absorbed energy (Ea), specific energy absorption (SEA) and crush force efficiency (CFE).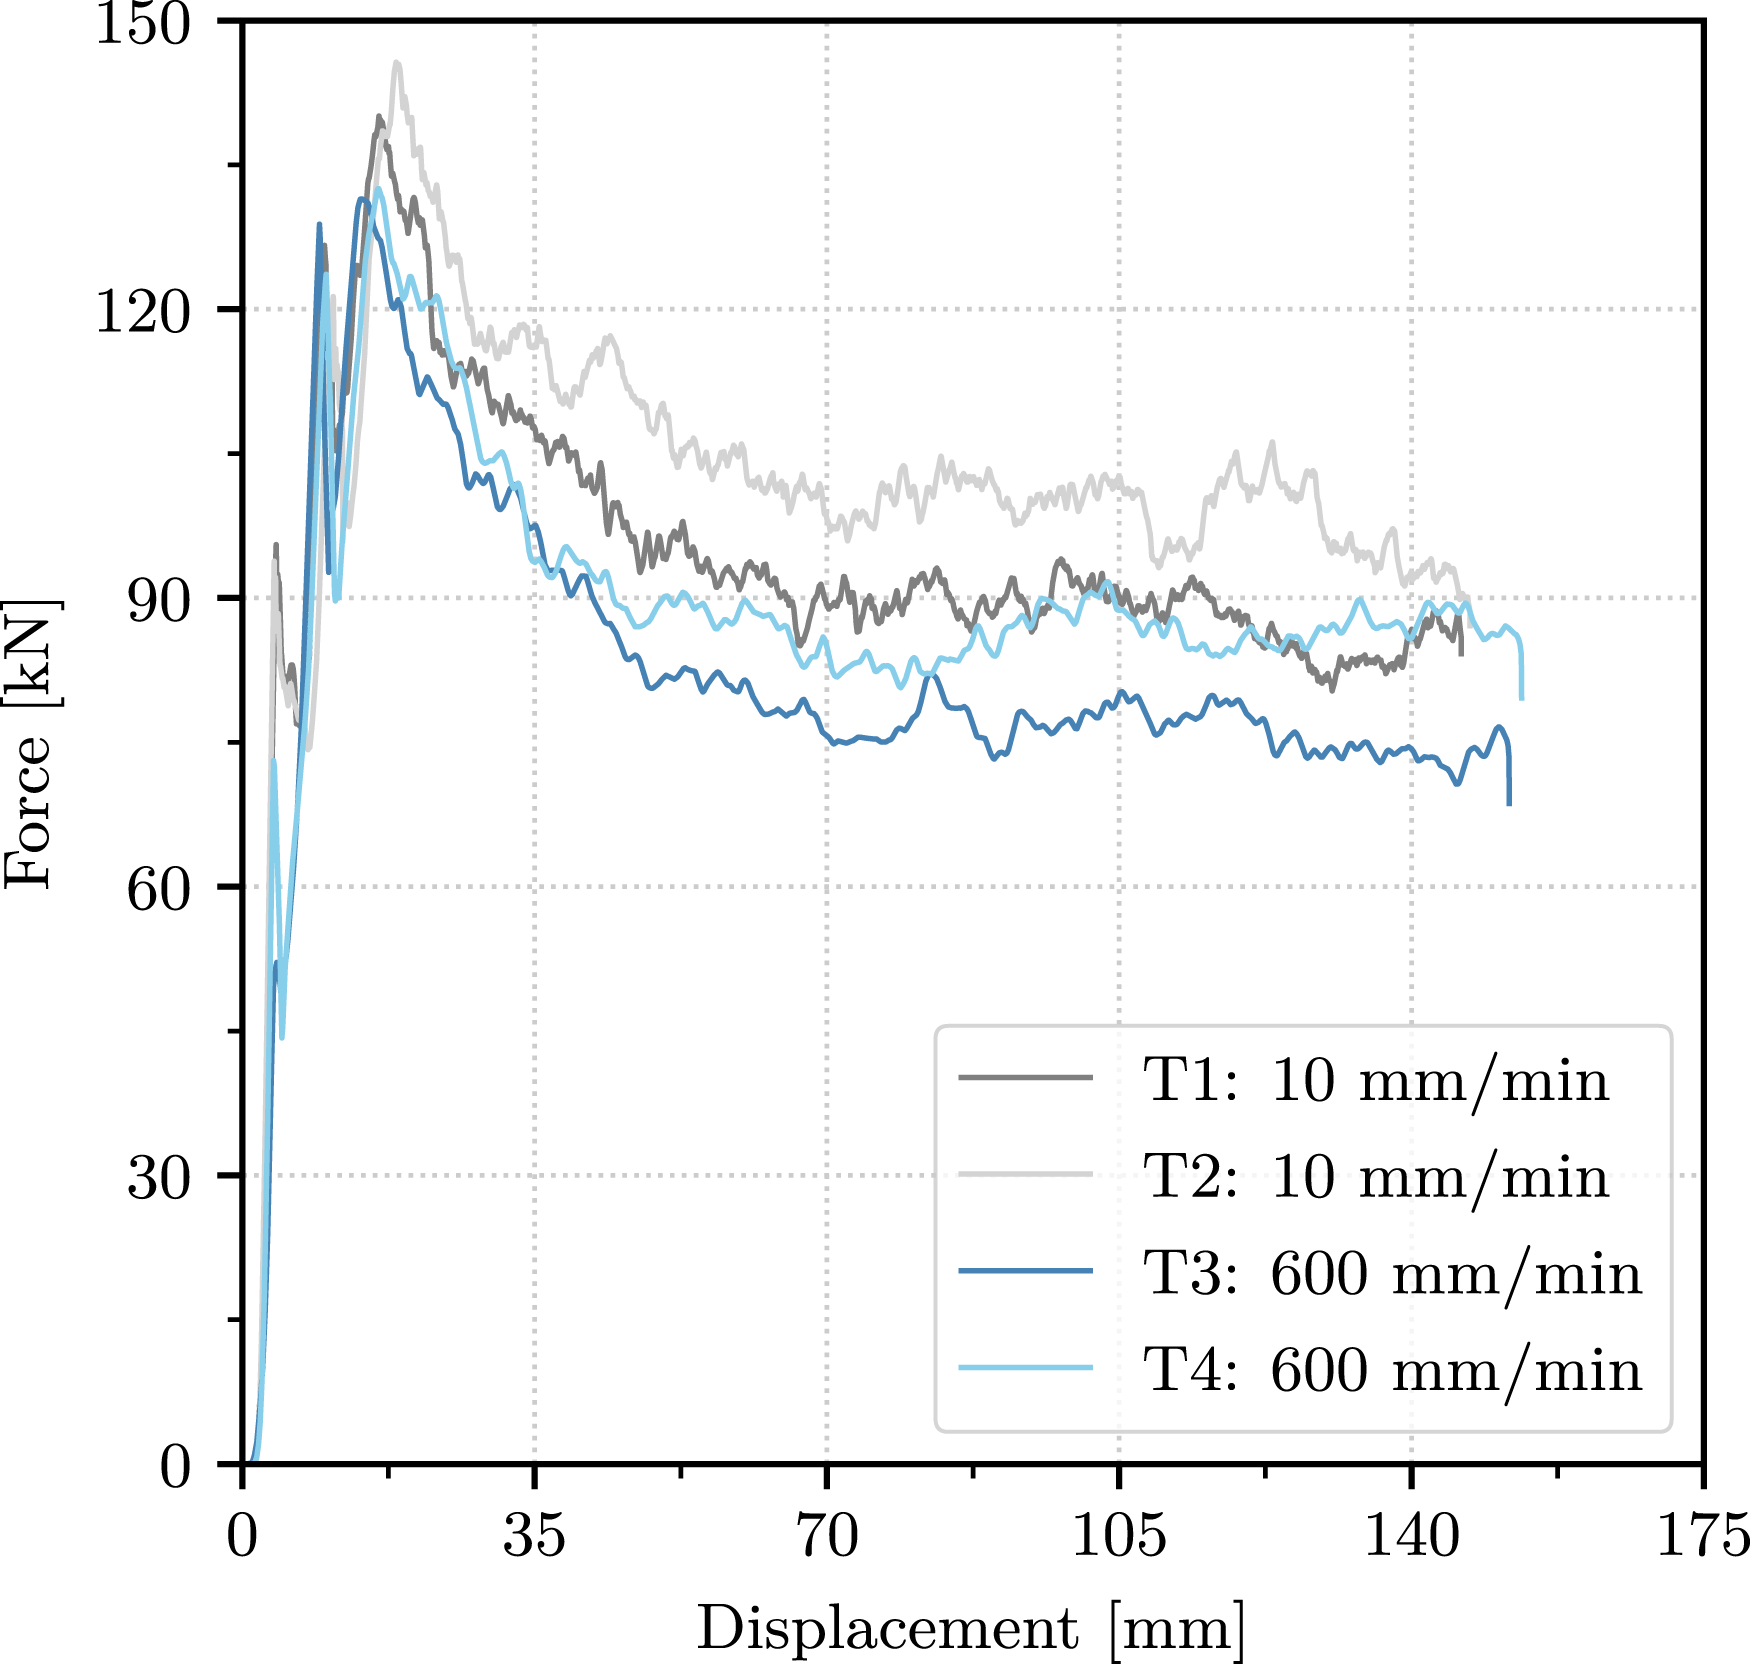
All the tubes present a stable progressive crushing mode, where both splaying and ply fragmentation are observed. All relevant effects of specimen T4 are depicted in Figure 14. The crushing process of the composite absorber is characterized by progressive failure. Point 1 marks the initiation of tube failure and the onset of breakage. Subsequently, at point 2, the tube reaches the end of the bevel trigger until it finally culminates when the damaging processes end upon reaching the peak force at point 3. This is followed by a slight decrease to the stable crushing force. At point 4, the damage then progressively spreads throughout the tube, leading to a split into external and internal fronds due to fiber failure. The behavior of the inner-most plies is similar to that of the outer-most plies, but they splay inwards. The inner plies generally experience more damage due to the internal constraints that generate a significant amount of debris. This failure mechanism offers the advantage of high energy absorption, as most of the tube is damaged over a large deflection range while maintaining an average crushing force. Crush sequence and force-displacement curve at relevant points of specimen T4.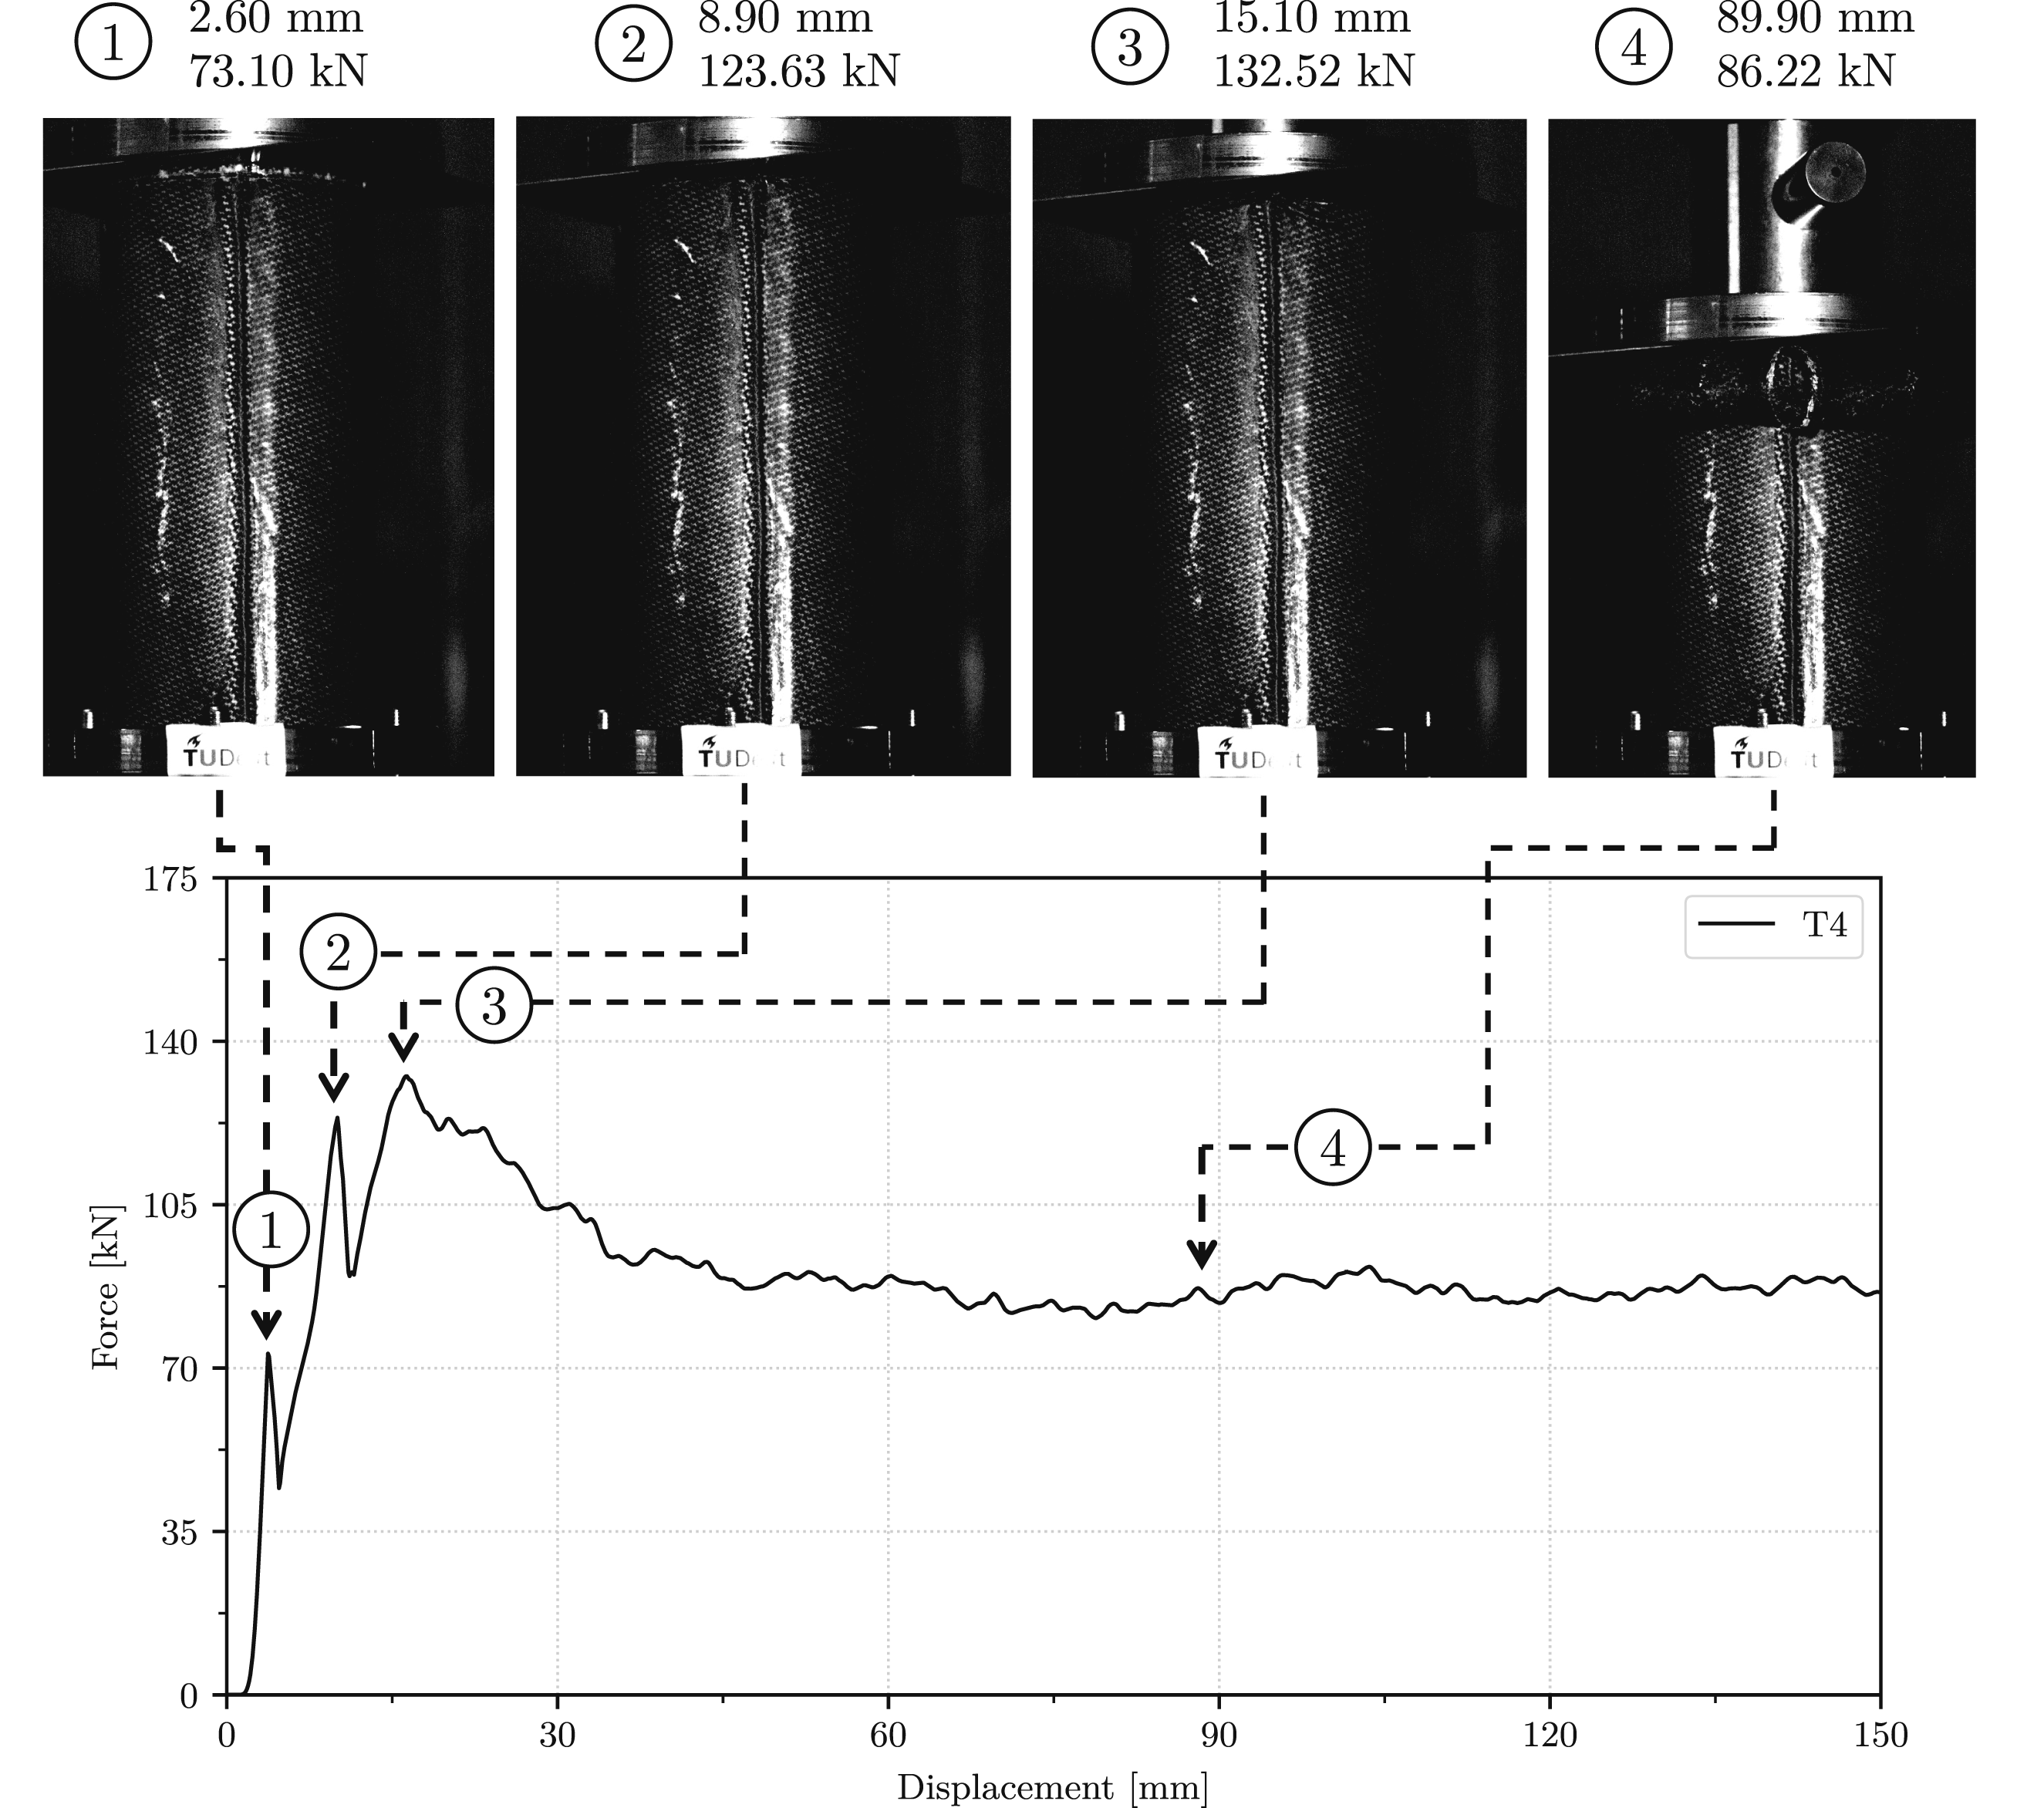
Some sequential pictures captured by the high speed camera during the testing of T3, showcasing the collapse mode, are presented in Figure 15. It demonstrates a behavior akin to that of tube T4, highlighting the consistency in the crushing mode observed throughout the displacement. Sequential images from the test of specimen T3 at 600 mm/min.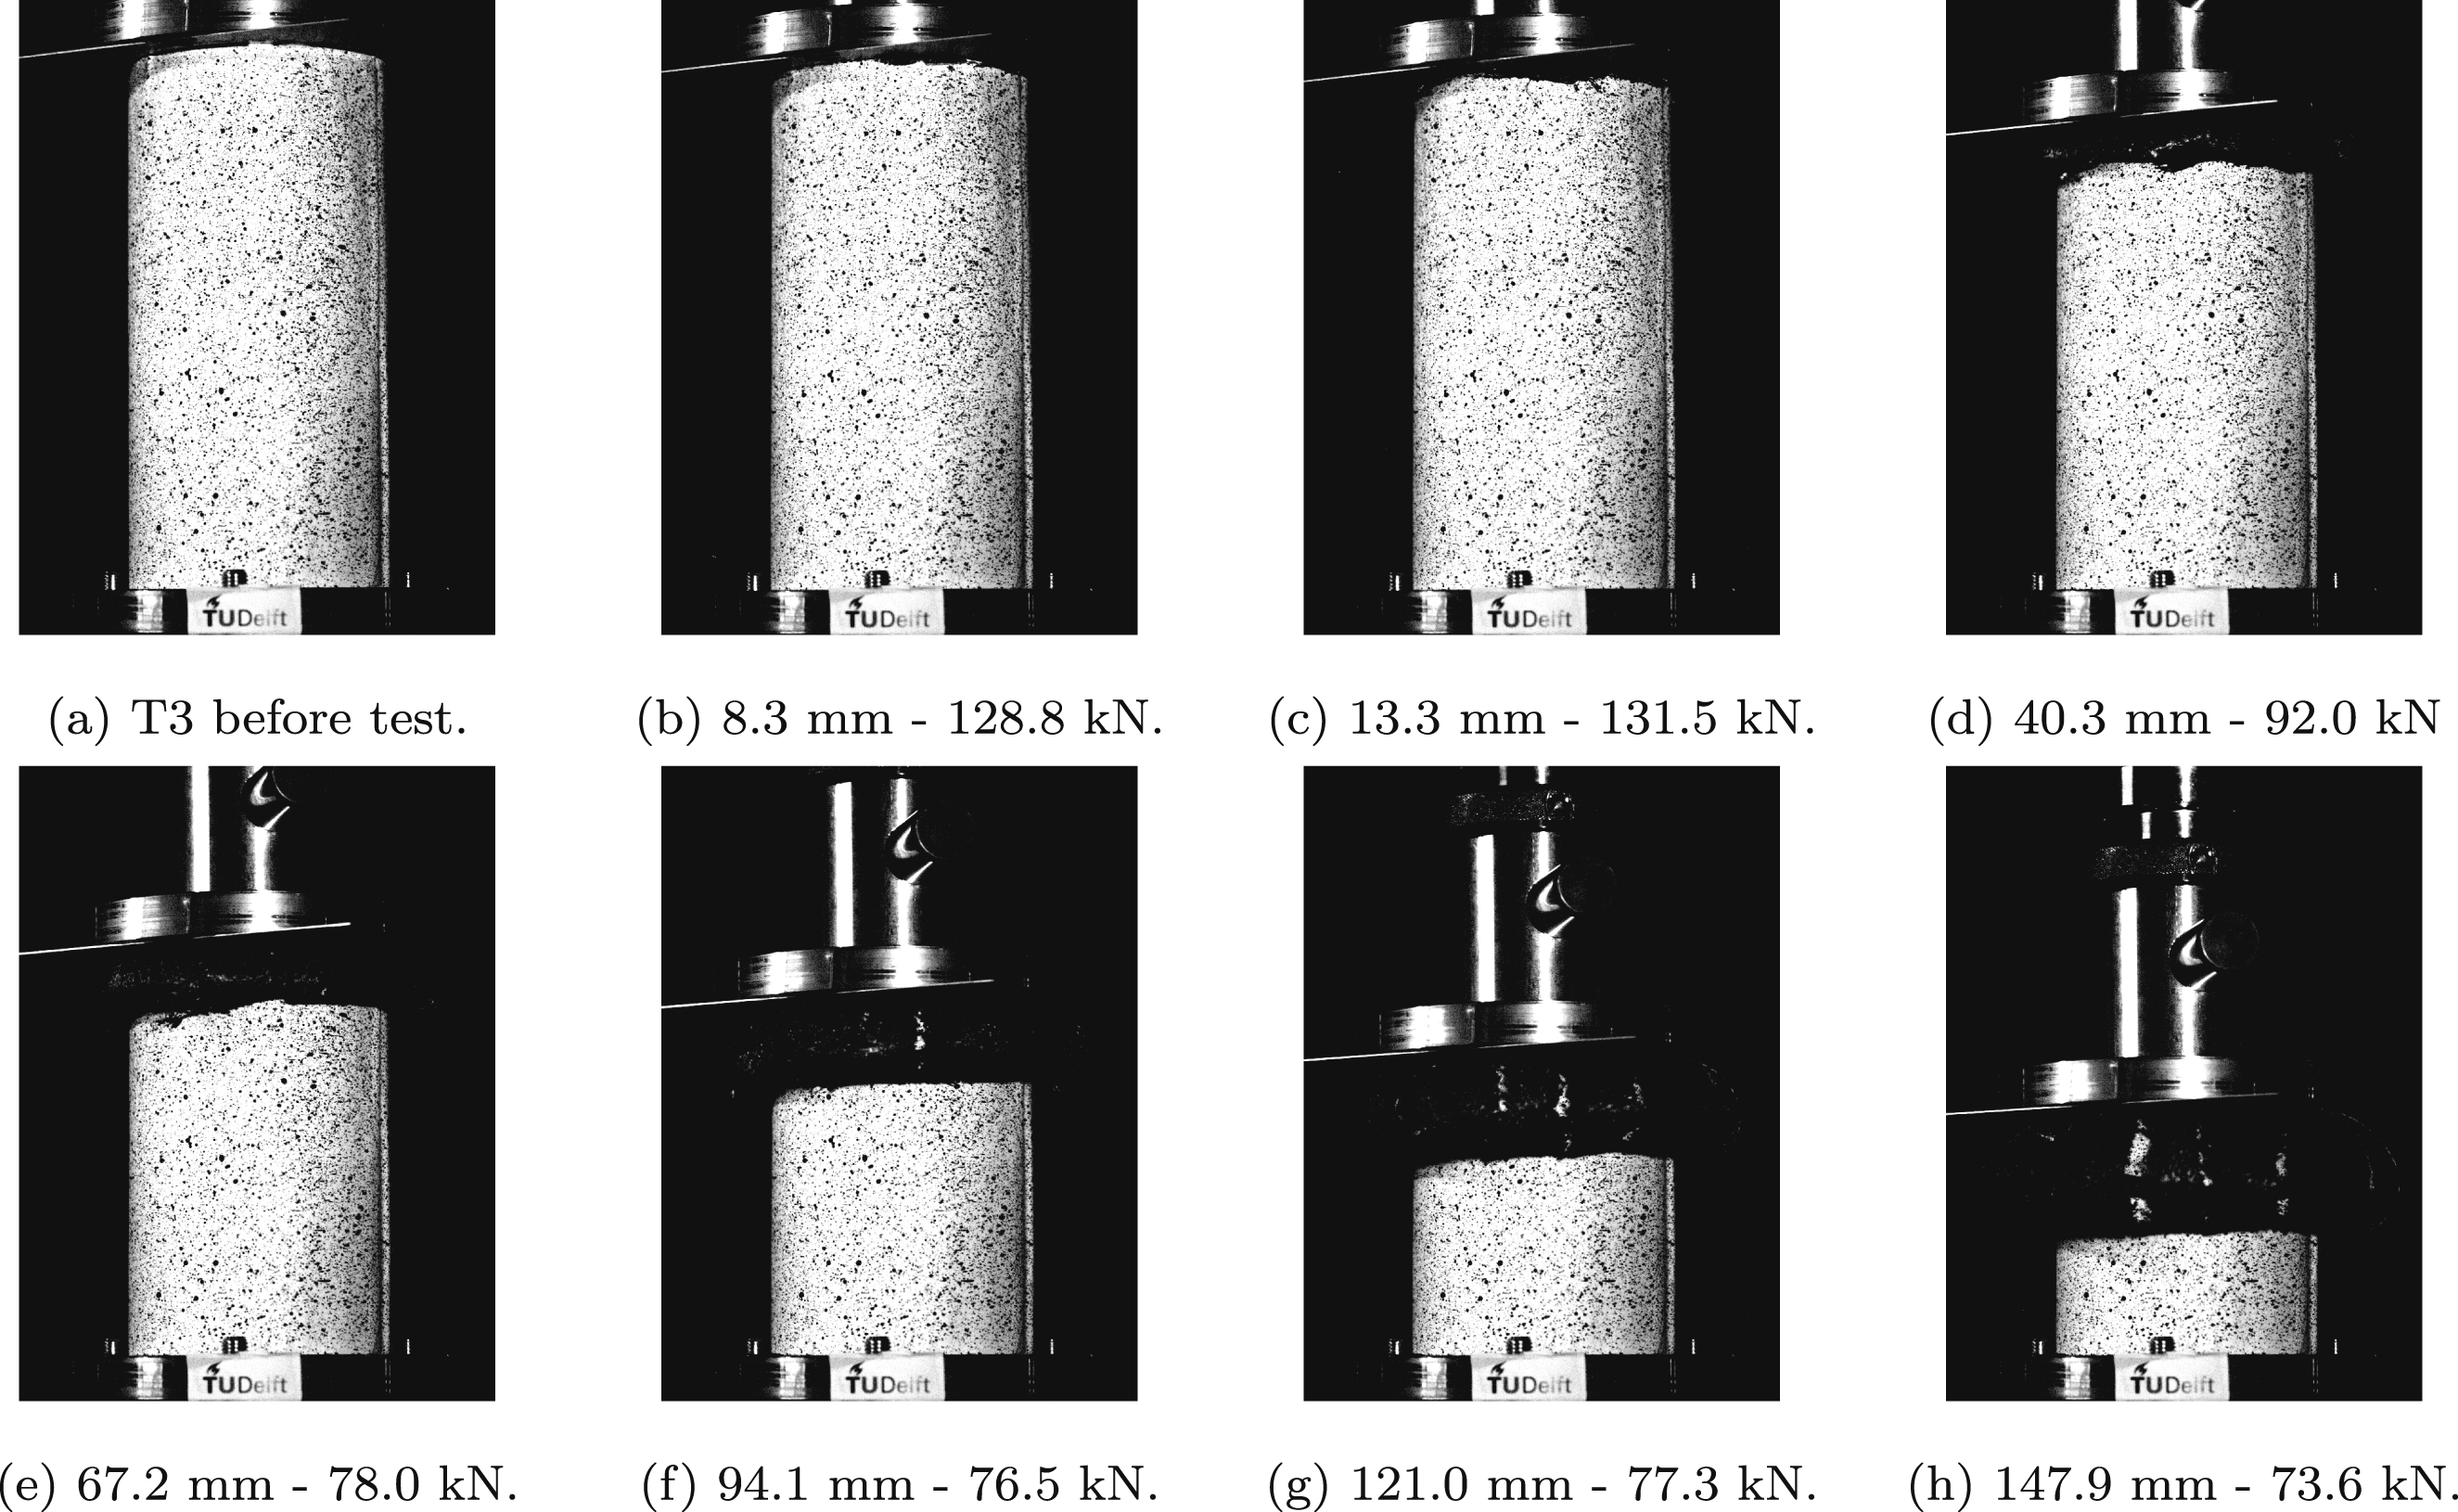
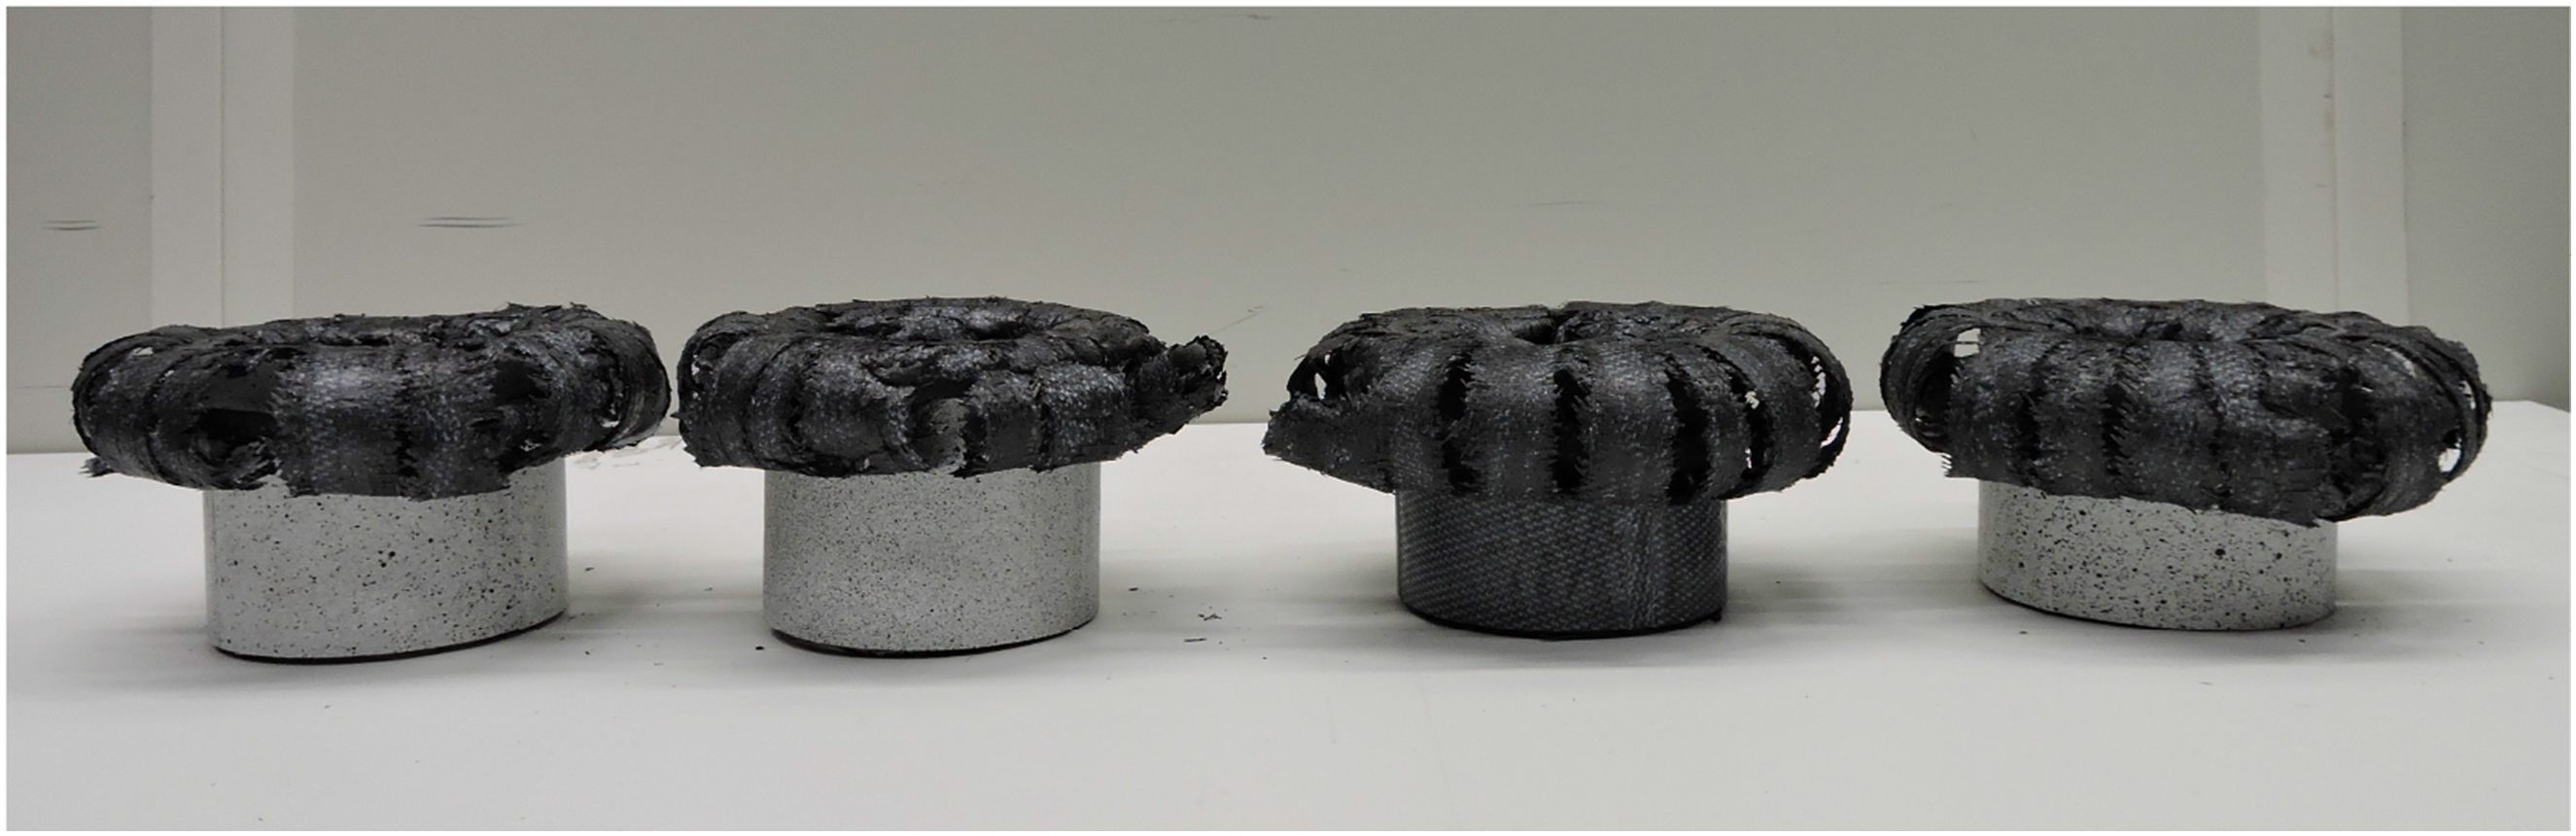
The damage details of T1 after the axial test are presented in Figure 16. The delamination starts with the initial fragmentation of plies, forming a central debris wedge that extends around the entire circumference of the tubes, initiated by the trigger. Subsequently, the outer plies begin to splay outward. Once all eight plies have splayed, a steady-state crushing process develops. The failure mode of all the specimens is consistent as it can be appreciated in Figure 17, where a photo of the tubes after testing is reported. Damage details of T1 after testing. Photo of the specimens after testing.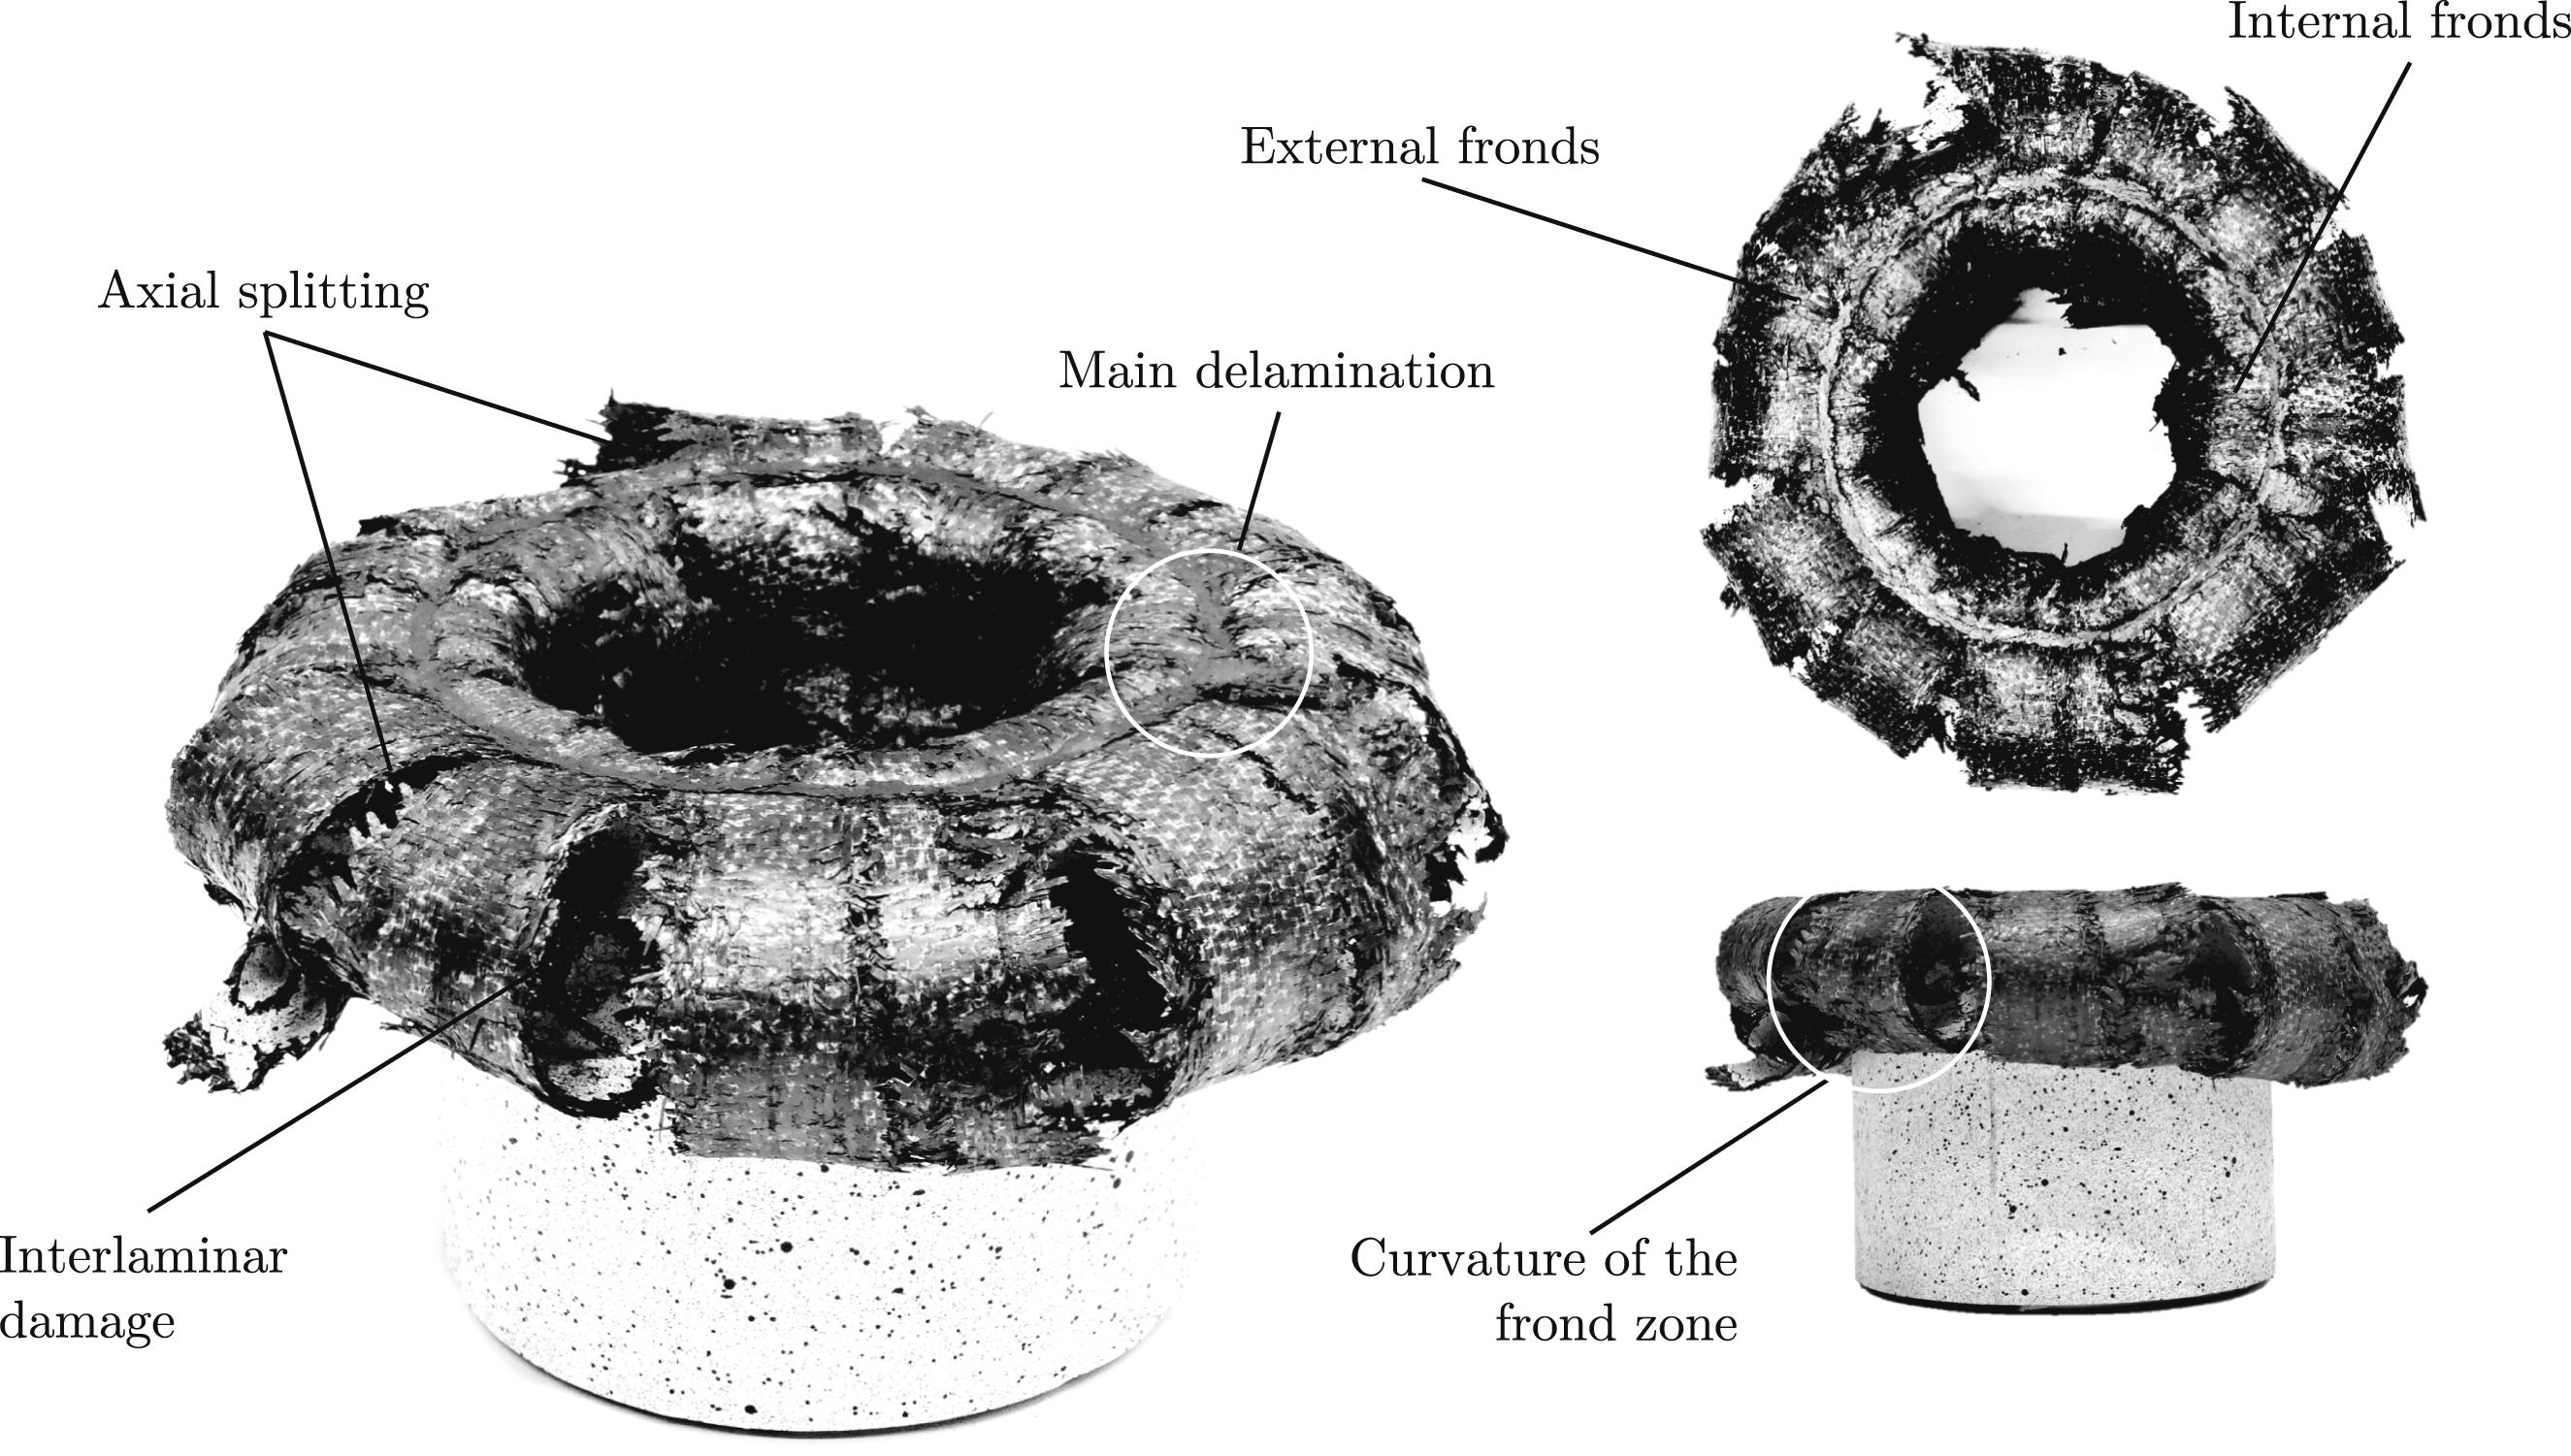
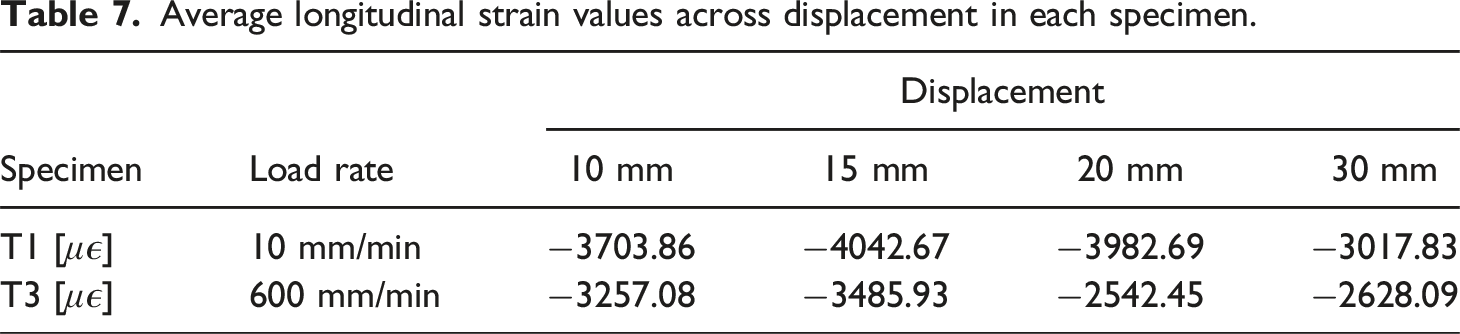
Regarding the results obtained by DIC, Figure 18 shows the longitudinal strain distributions across the tested tubes. It is notable that tubes subjected to lower testing speeds (T1 and T2) display comparatively higher strain levels than the one tested at higher speed (T3). Longitudinal strains [μɛ] at different displacements during each test.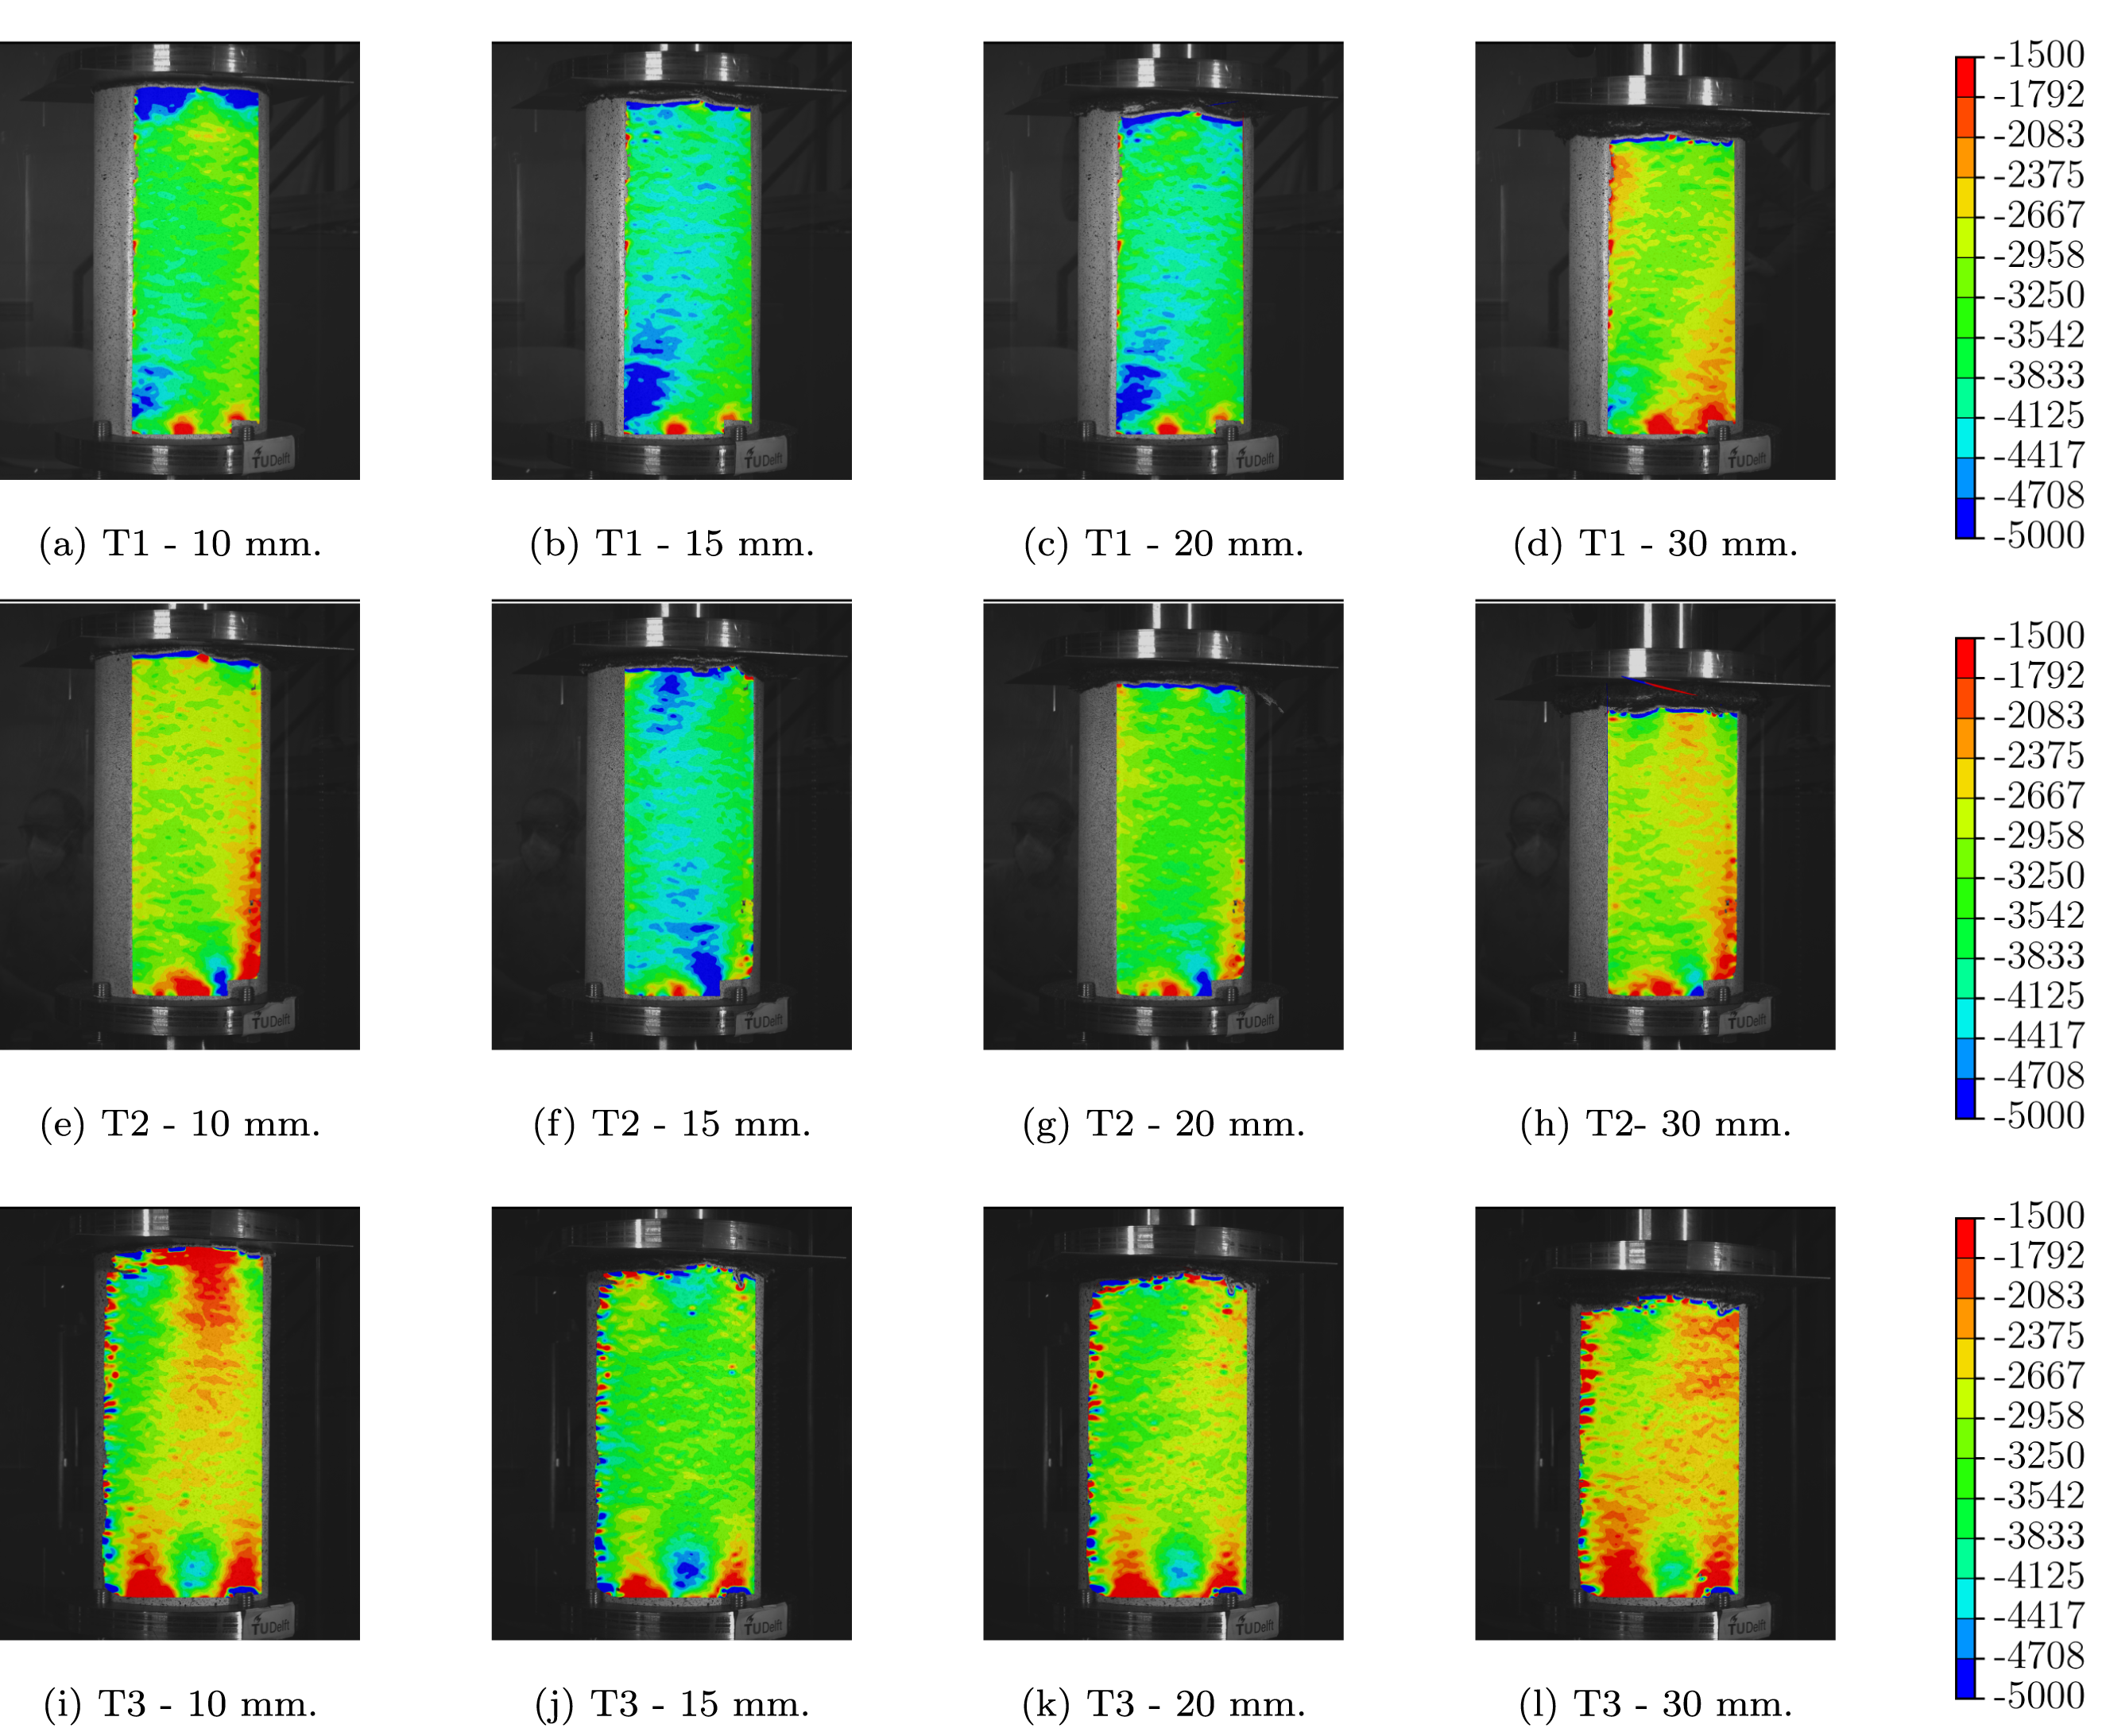
Average longitudinal strain values across displacement in each specimen.
Finally, Figure 19 shows the longitudinal strains over time of four selected pixels in each specimen. The graphical representations derived from the DIC analysis data maintain a consistent correlation with the load cell data for each respective test. While the behavior of longitudinal strains appears notably similar across all tubes, the values obtained differ depending on the speed of the test, being higher with lower load rates. Tracking of longitudinal strains across test at various points of specimens T1, T2 and T3.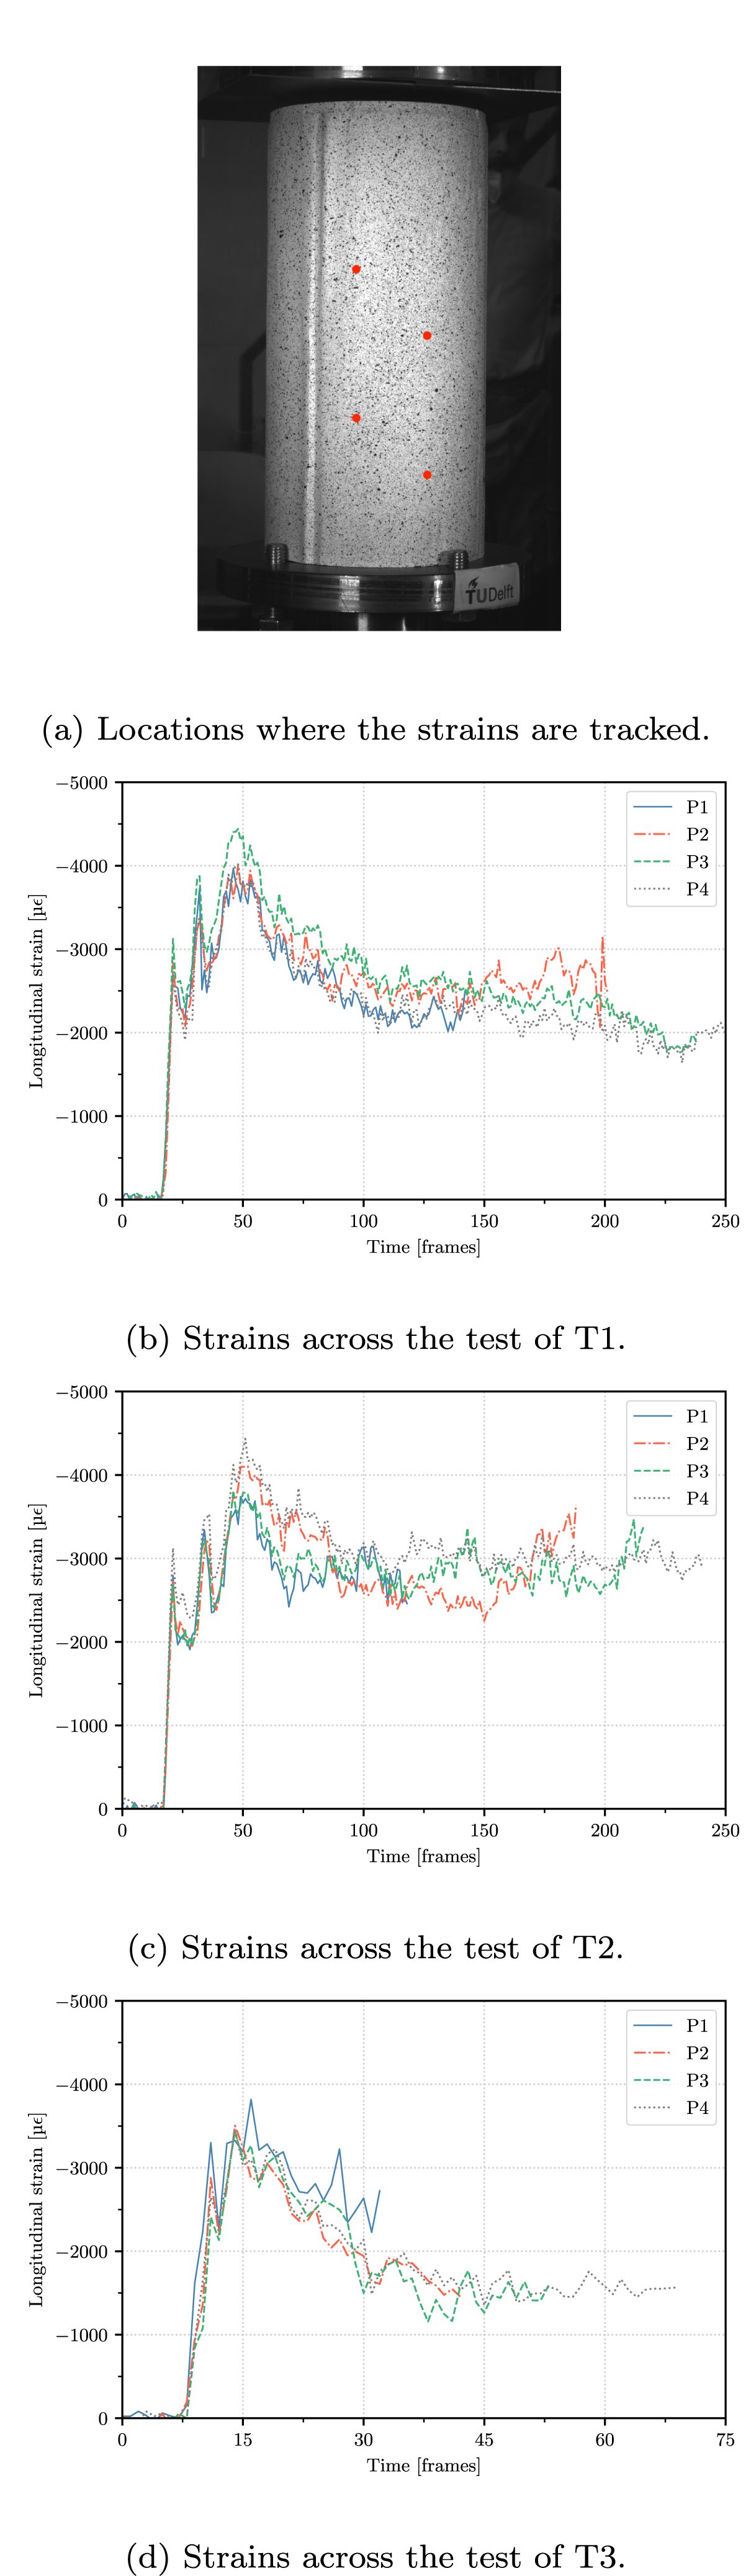
The variations in longitudinal strains exhibited across different test speeds present notable implications for the mechanical behavior of the specimens. The differences observed in strain values between tests conducted at varying speeds underscore the sensitivity of the material response to loading rates. This sensitivity can significantly influence the energy absorption capacity and structural integrity of the composite tubes under different loading conditions. Furthermore, the uniformity in longitudinal strains across all tubes indicates a consistent failure mode, predominantly by delamination, observed consistently despite variations in test speeds.
Numerical-experimental comparison
The load measured from the load cell of the test machine is compared to the prediction from the numerical models in Figure 20 for T1. Both single shell layer models exhibit limitations in representing the observed delamination failure during testing. This highlights a fundamental constraint associated with the use of shell elements, as they are unable to faithfully replicate the energy absorption failure mechanisms. Notably, the FEM2 model underestimates the crushing load observed in the experiments. Overall, it is apparent that the simulations employing single shell layer models fails to accurately capture the energy-absorbing mechanisms, resulting in significant disparities with the experimental results. Comparison of force-displacement curves between the different models.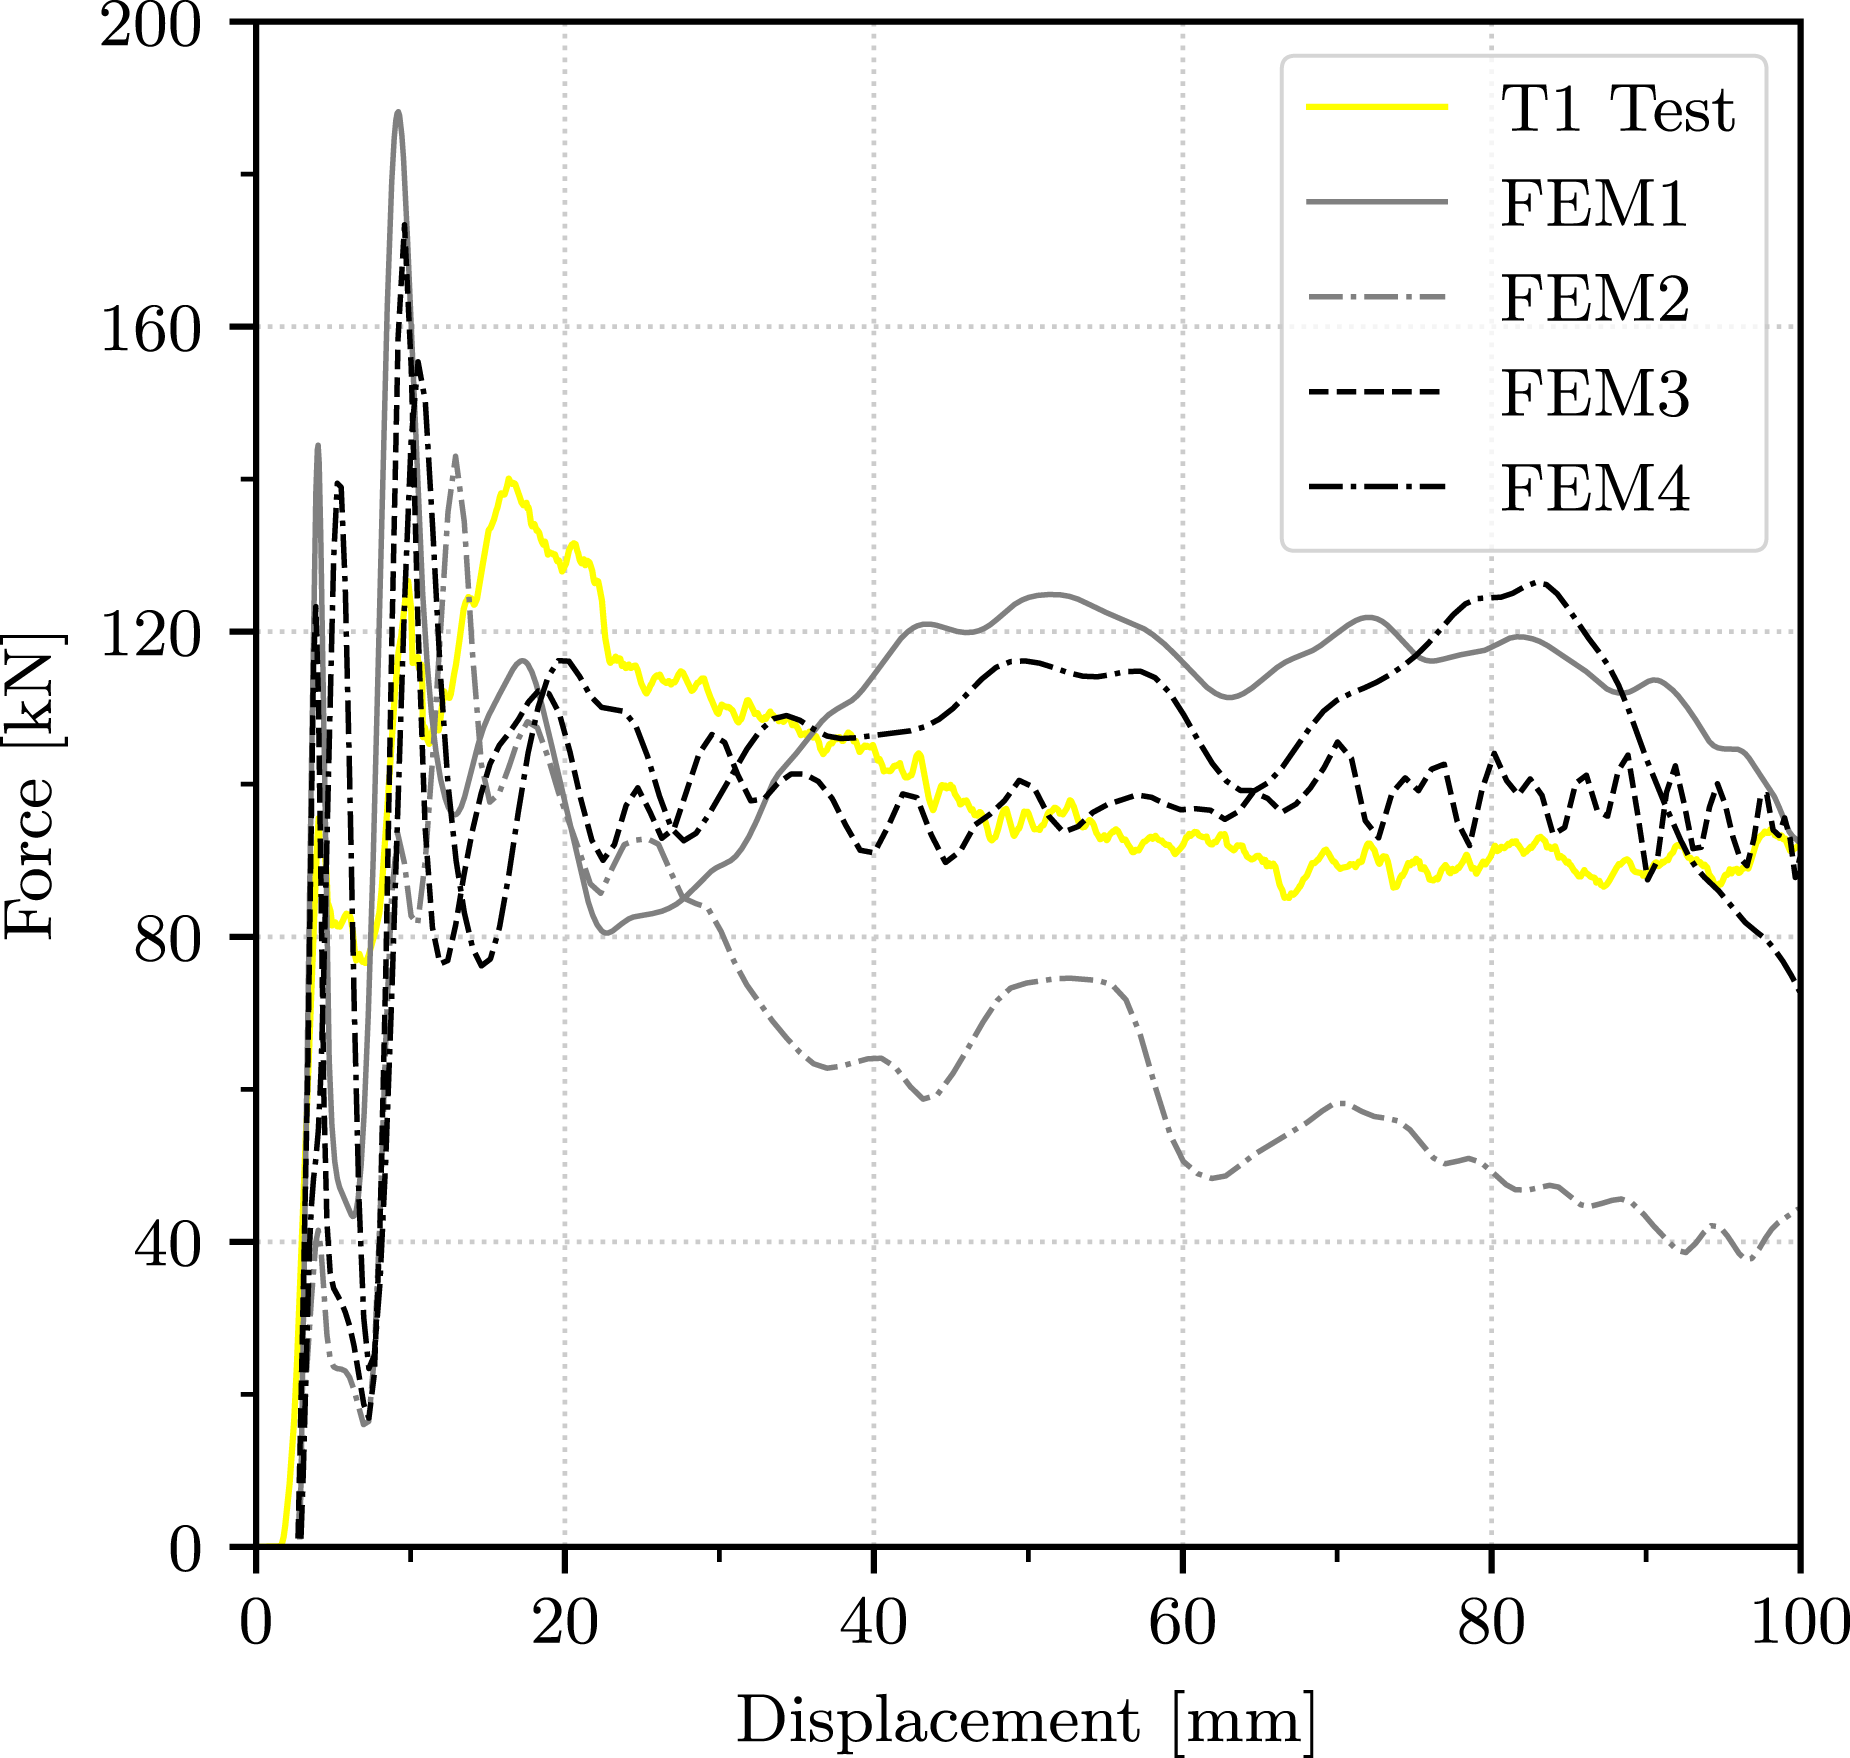
However, the numerical prediction from the continuum shell models suitably capture the crushing load measured in the experimental test. The crashworthiness parameters for T1 calculated from the force-displacement curve are summarized in Table 8, and compared with the prediction from the numerical analysis.
Crashworthiness parameters of T1 obtained from FE models and the experimental test.
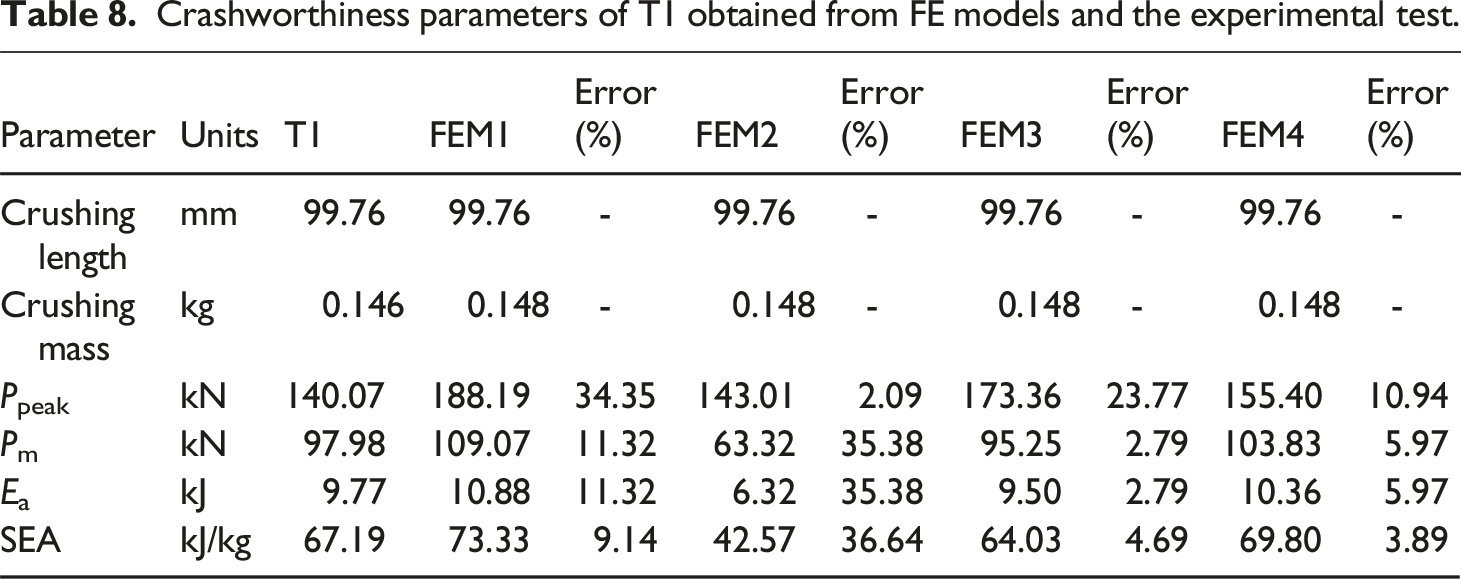
Among the two continuum shell element models, the model featuring trigger modification (FEM3) is preferred over the model with plate modification (FEM4), due to its higher fidelity to the actual test configuration. It is shown that the continuum shell model is most suitable to predict the damage progression, the delamination and all the crashworthiness parameters of the specimen T1 with relatively high accuracy.
The overall deformation mode in terms of delamination failure shows good agreement with those of the experimental test (see Figure 15). However, the primary challenge encountered in the model is its inability to accurately replicate the crushing behavior and the corresponding failure mechanism. As can be seen in Figure 10, the deformed shape after the initial delamination does not align with experimental observations. The model lacks the capability to accurately capture the post-failure behavior of the elements. Consequently, it fails to replicate the characteristic curling phenomenon observed in the experimental testing.
However, when analyzing the fiber tensile damage variable (see Figure 21(a)) and the matrix tensile damage variable (see Figure 21(b)), it can be observed that while the damage progression is visible along the axial directions, the deletion of the failed elements does not occur in the numerical model. This complicates the characteristic bending and flaring behavior observed in the experimental tests since the numerical model, by not removing elements, fails to accurately simulate the debris observed experimentally. Consequently, this results in the absence of the distinct petal-like formations. This observation in the numerical model explains the good adjustment of the force displacement curves and the crashworthiness parameters, despite the differences in the deformed shape. Output variables related to damage evolution in the fiber-reinforced composite model.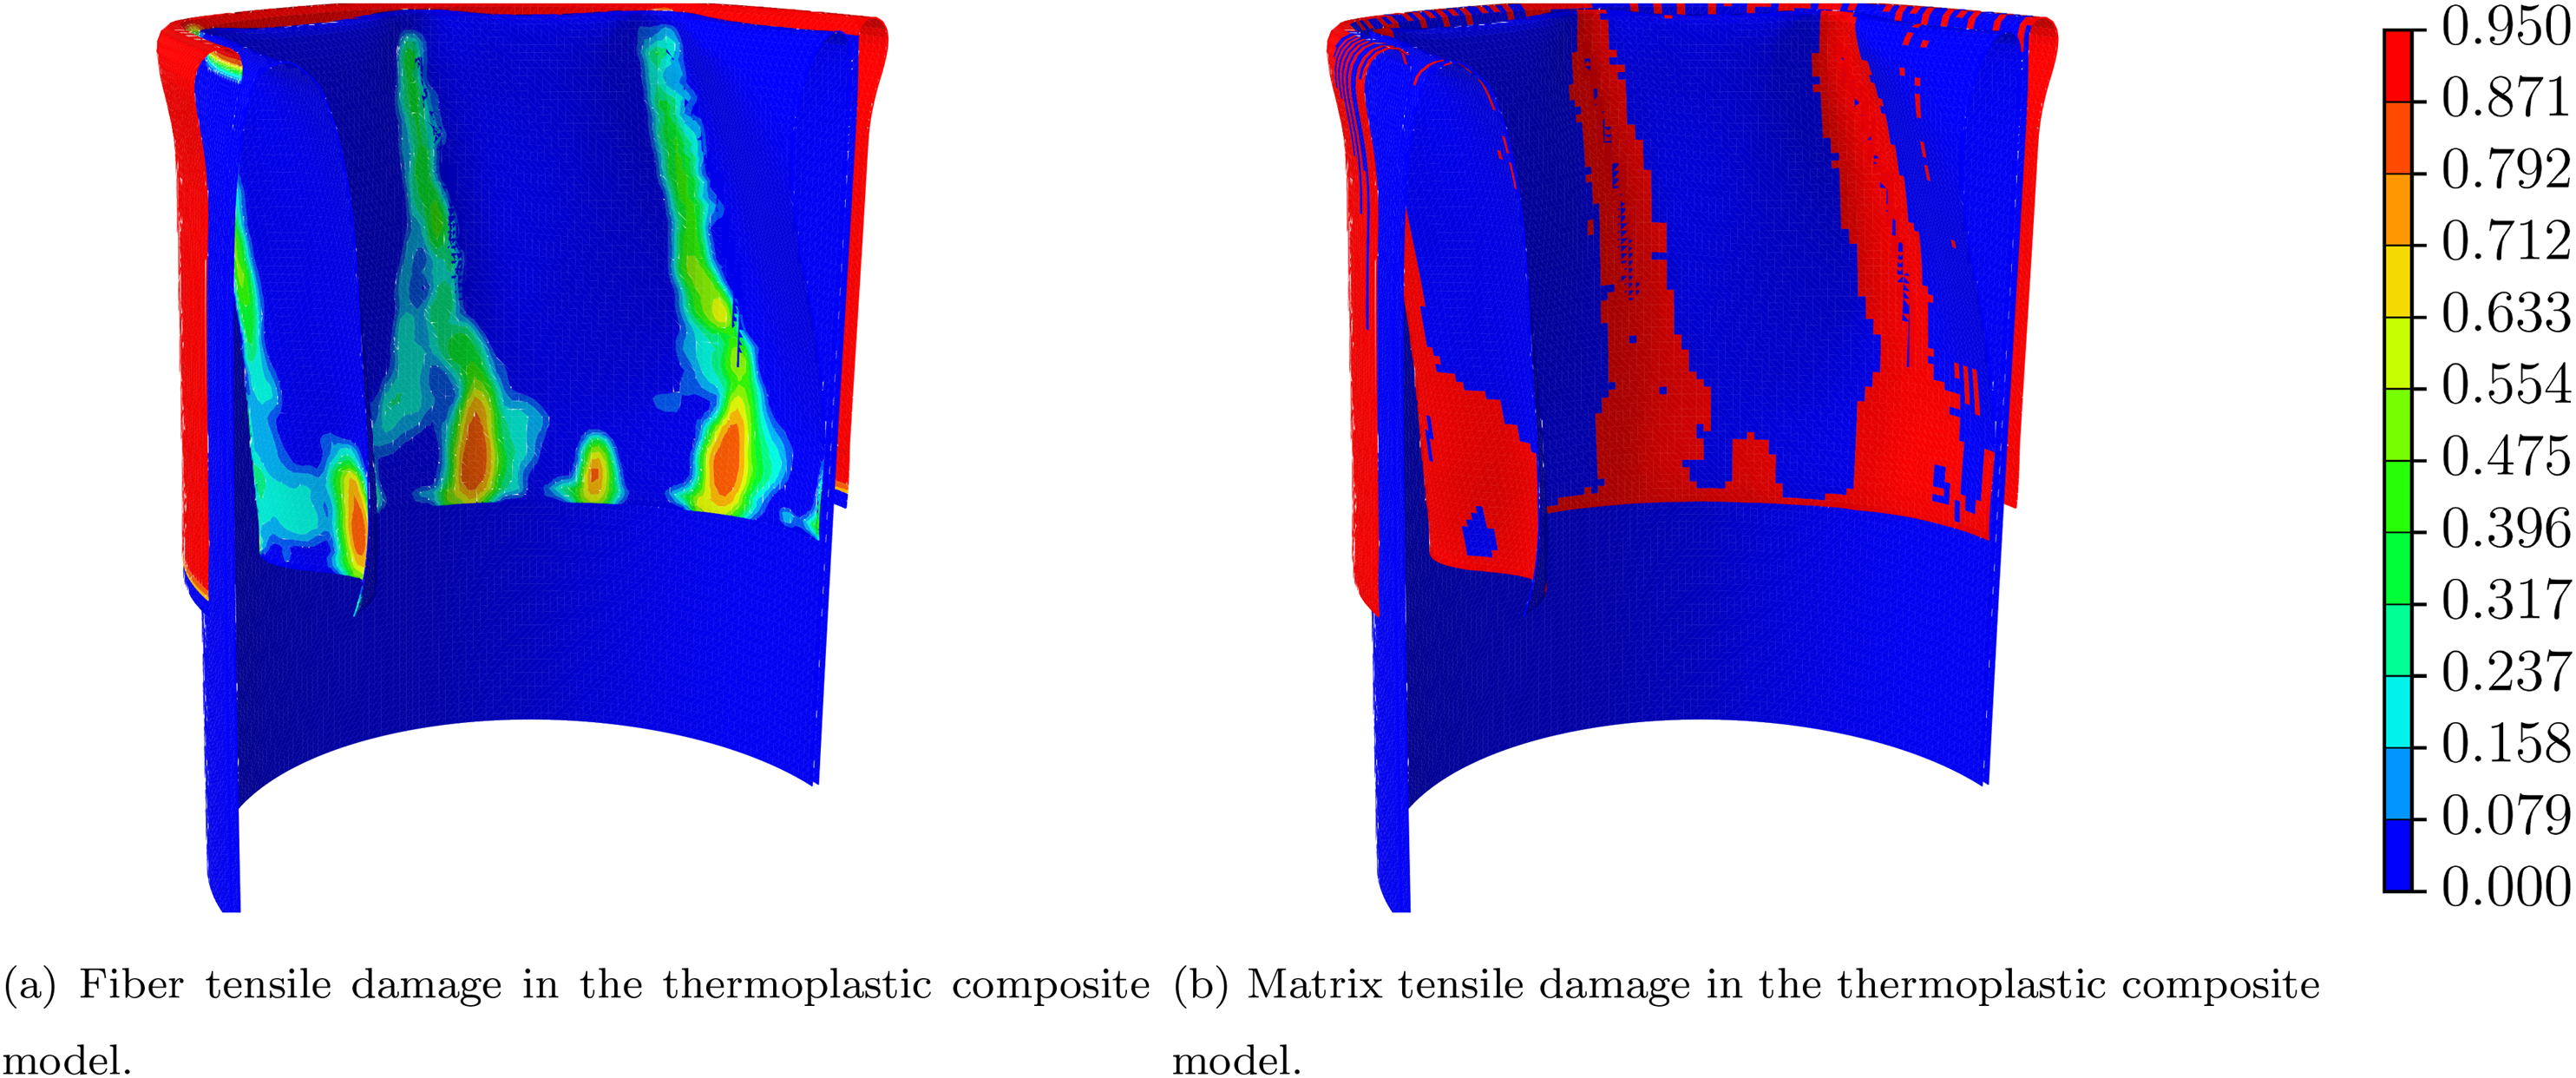
The longitudinal strain contour plots, presented in Figure 22, show a comparative analysis between the longitudinal strain outcomes of T1 derived from both numerical simulations from FEM3 and the VIC-3D experimental system. The longitudinal strains are reported at different values of the compressive load and vertical displacement, respectively. A comprehensive correspondence is discerned between the results procured via finite element modeling and the empirical measurements acquired during experimental testing. This congruence is observed consistently across all data points of the applied load, thereby affirming the validation of the numerical model. Comparison between numerical predictions and experimental results of longitudinal strains in T1.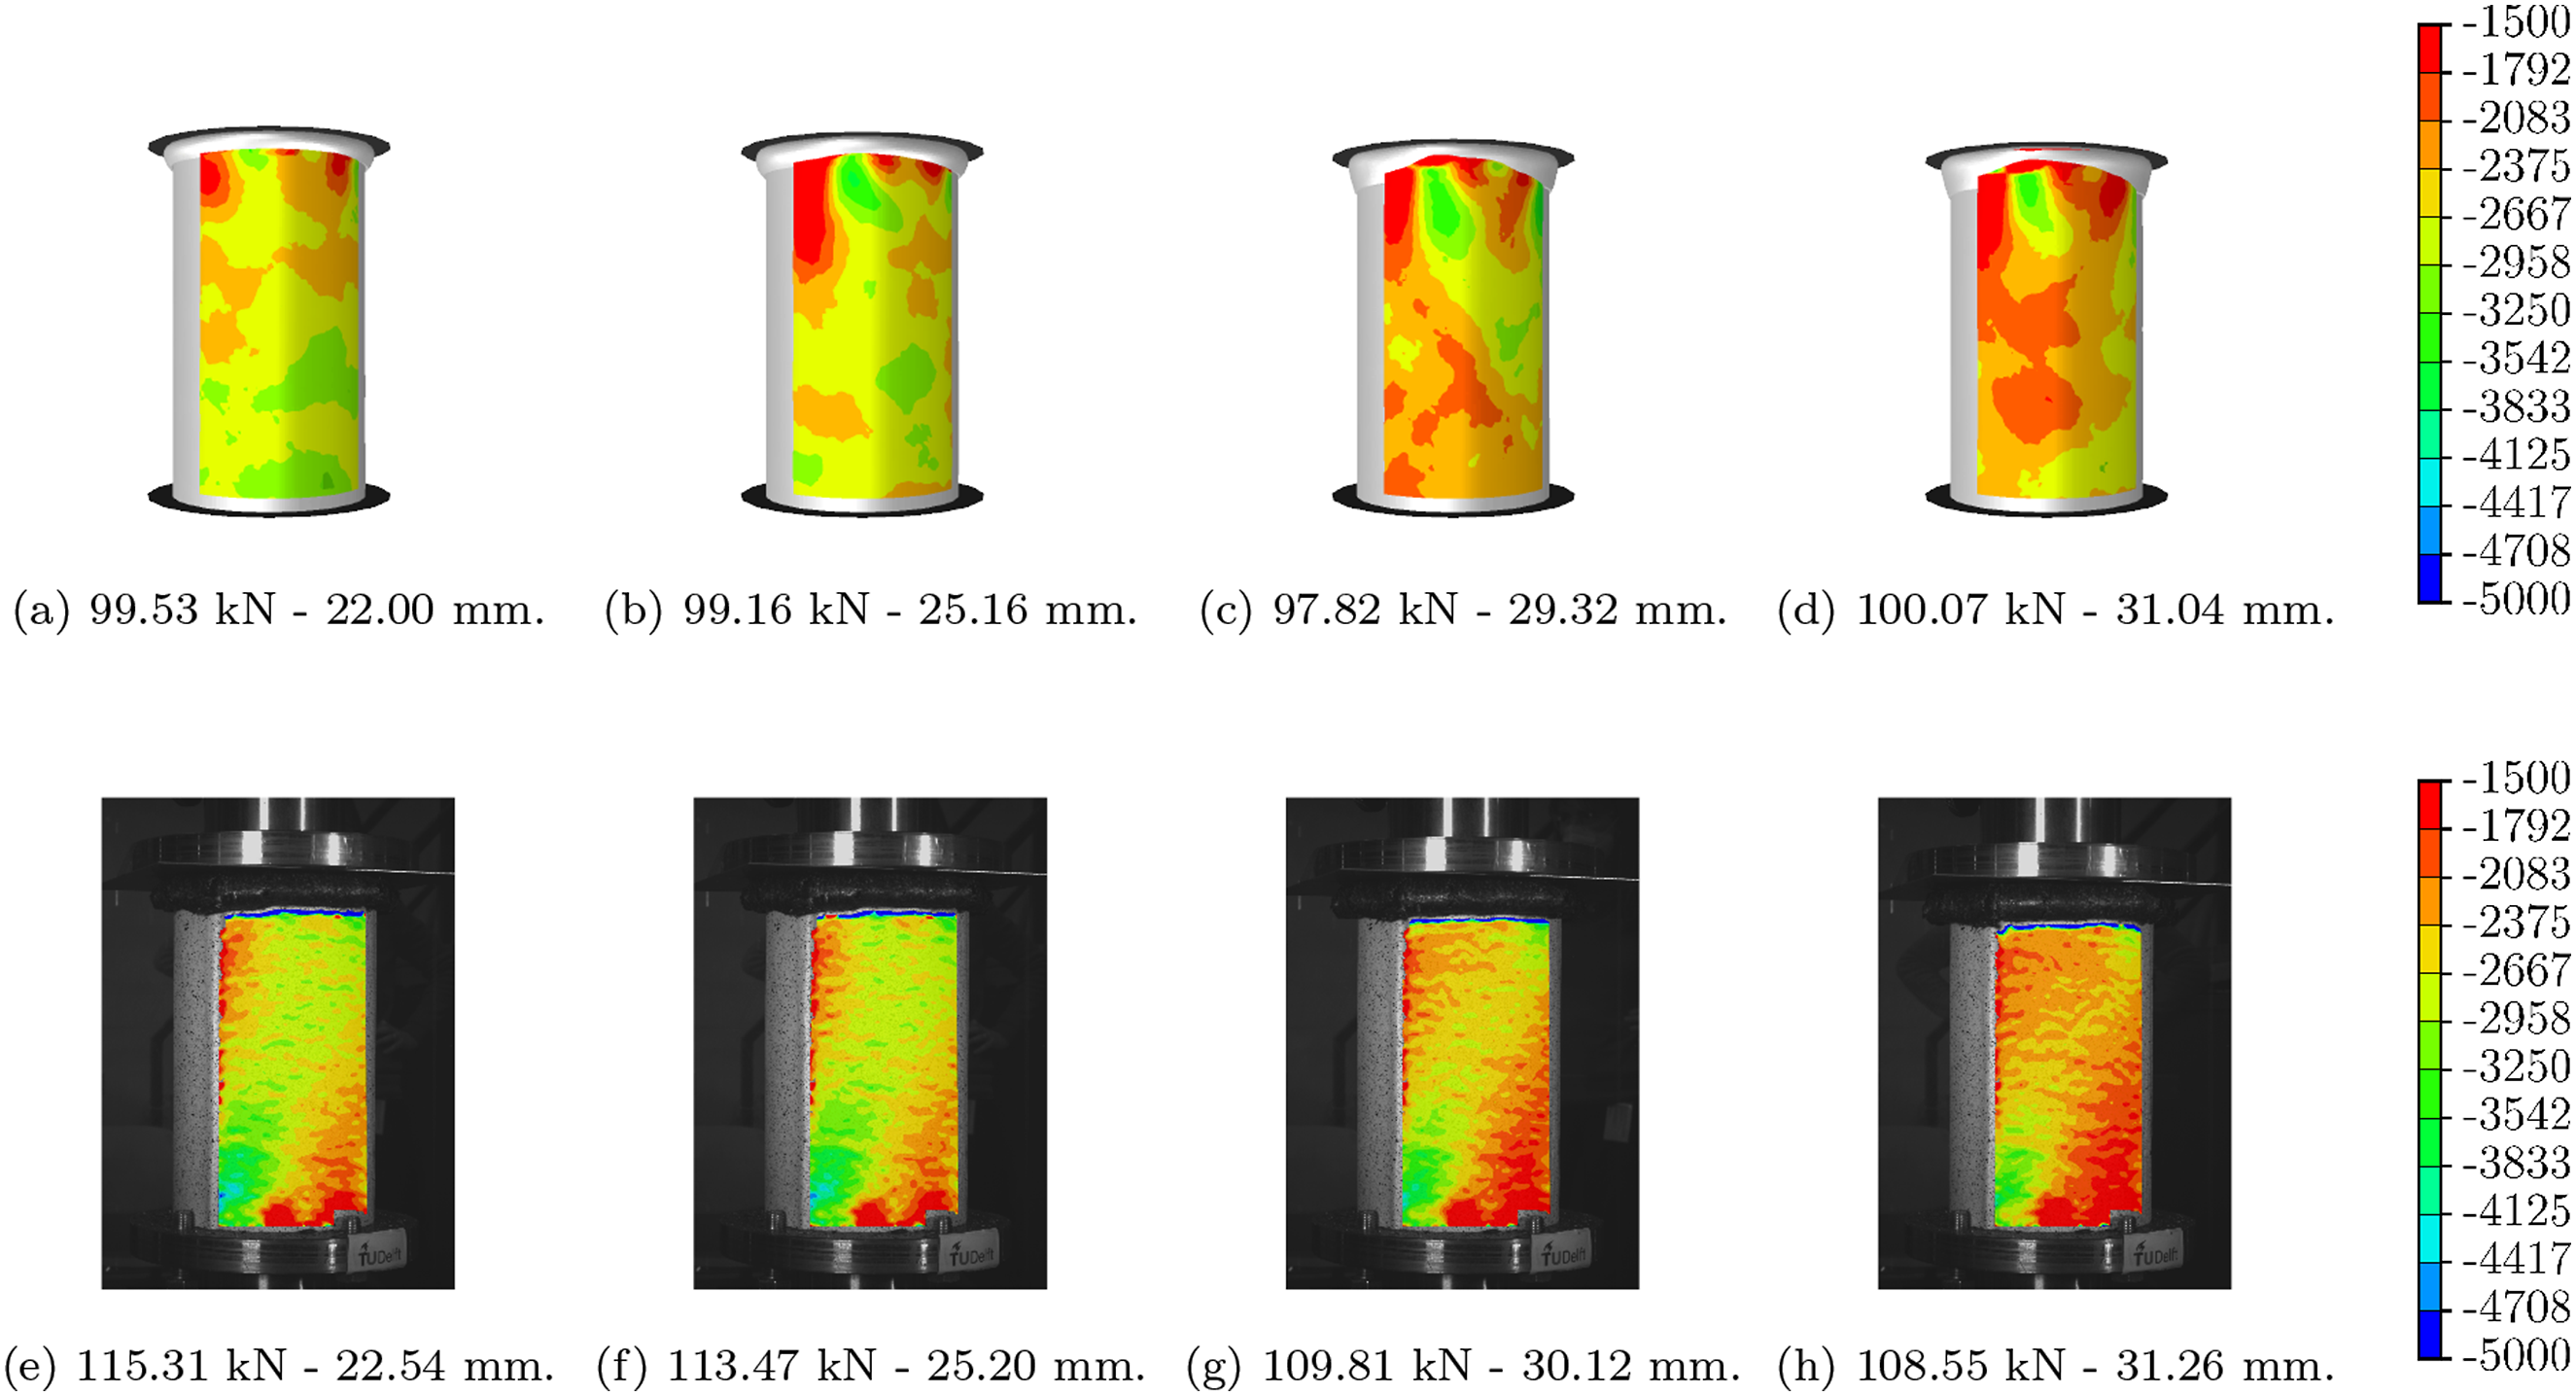
Conclusions
In this study, thermoplastic composite circular tubes are analyzed and tested to evaluate their crashworthiness behavior, energy absorption capability and failure mode. The crashworthiness parameters such as peak crushing load (Ppeak), mean crushing load (Pm), absorbed energy (Ea), specific energy absorption (SEA) and crush force efficiency (CFE) are calculated and discussed. Numerical simulations are conducted using the commercial finite element software Abaqus to predict the mechanical behavior of the tubes under axial compressive loading conditions. The damage is modelled with the Hashin damage criteria. Based on the analysis carried out in this study, the following conclusions can be drawn: • The energy absorbers exhibit an adequate crashworthiness behavior, thereby being of great potential for use in primary protective structures. All the tests present similar crushing modes despite the loading rate, characterized by a stable progressive failure with delamination between the middle plies, lending robustness and consistency to the study. This consistency hints at the material’s reliability and its predictable behavior under compressive loading conditions. Moreover, the tubes achieved specific energy absorption values of up to 70 kJ/kg and crush force efficiency values of up to 70.91%, further indicating their adequate crashworthiness performance. • The introduction of the bevel shape trigger effectively affects the stability and failure progression of the tubes, significantly improving energy absorption capability during the crushing process. The stable mean crushing load of up to 103.30 kN contributes to achieving high absorbed energy values of up to 15.04 kJ. This is attributed to the activation and propagation of delamination mechanisms triggered by the introduced bevel shape. • The structural behavior is predicted by the numerical model. A good agreement between the numerical and experimental results in terms of the load-displacement curves and the strain fields is achieved. The simulation based on continuum shell elements with reduced integration, including a cohesive surface, is able to predict the delamination mechanism and crashworthiness parameters obtained from the experimental data, while the models with four-node quadrilateral shell elements and reduced integration prove inadequate for this purpose. In quantitative terms, the model FEM3, which uses continuum shell elements, showed an error in the mean crushing load and absorbed energy of 2.79% and an error in the specific energy absorption of 4.69% compared to the real test. This indicates that the established methodology stands as a reliable instrument for the conceptualization of novel aeronautical structures using thermoplastics. • Regarding stabilization of damage, it has been observed that the stabilization factor greatly influences the behavior of the material and the convergence capabilities of the model. The omission or nullification of the stabilization factor in the model prevents it from converging to a valid solution, since excessive distortion of elements take place. It is also observed that this phenomenon is independent of the selected mesh size. The increase of the values of the damage stabilization factor causes the convergence of the model, but it exhibits incorrect behavior, resulting in inaccurate outcomes. Hence, higher values of viscosity coefficients do not ensure reliable results. It has been found that a stabilization coefficient value of 10−5 provides the best balance between computational time and result accuracy. • Different loading rates significantly influenced the longitudinal strain profiles across the tested tubes. This sensitivity highlighted how the material responded to varying loading conditions and how it affected the energy absorption capabilities of the components. At 20 mm of crushing length, the average longitudinal strain values of the tubes tested at a loading rate of 10 mm/min are 36.16% higher than those of the tubes tested at 600 mm/min. Future research should prioritize investigating the strain rate dependencies of woven fabric composites in their crushing behavior and consider integrating supplementary damage models to enhance the component’s deformation performance.
The finite element model employed in this study has demonstrated reliable predictive capability in terms of global crashworthiness metrics for the energy absorbing structures subjected to impact loading conditions investigated herein. The simplicity of the model results in relatively low computational cost. However, several aspects could be improved to enhance its predictive accuracy.
First, the intralaminar response has been modeled using a linear elastic formulation combined with the Hashin failure criterion, without accounting for plastic deformation or strain rate sensitivity. These two factors could significantly improve the model’s ability to predict material behavior under varying strain rates. In addition, progressive damage evolution is described through a bilinear degradation law, which may not fully capture the stiffness loss observed experimentally. A more realistic law, such as a nonlinear or curvilinear degradation model, could more accurately represent the behavior of failed elements. These simplifications inherently limit the model’s capability to reproduce failure mechanisms in detail, particularly at the ply level.
Moreover, it should be noted that some material properties used in this study were adopted from previous literature, due to the scarcity of dedicated experimental data for the specific thermoplastic composite investigated. While this approach has been successfully used in prior works and enables reasonably accurate predictions, a full experimental characterization of the relevant material parameters would likely enhance the predictive accuracy of the model even further.
Nevertheless, the resulting framework offers a balanced trade-off between accuracy and efficiency, making it a useful tool for preliminary design stages or structural optimization tasks, where numerous configurations must be assessed within reasonable computational times. Future work could focus on improving the predictive capabilities by incorporating more advanced material models, including plastic behavior, rate-dependent effects, and refined damage evolution laws.
Footnotes
Acknowledgments
The first author would like to express her gratitude to TU Delft for their hospitality and the testing facilities provided. The authors also wish to thank María De La Torre Lejarraga, head of the laboratory of processes and technologies of composite materials at the Instituto Nacional de Técnica Aeroespacial (INTA), for the manufacturing of the tubes.
Declaration of conflicting interests
The author(s) declared no potential conflicts of interest with respect to the research, authorship, and/or publication of this article.
Funding
The author(s) disclosed receipt of the following financial support for the research, authorship, and/or publication of this article: The research leading to these results has been conducted under Grant PID2019108307RB-I00 funded by MCIN/AEI/10.13039/501100011033. C. López acknowledges Grant PRE2020092703 funded by MCIN/AEI/10.13039/501100011033 and by “ESF Investing in your future”. This research is also supported by the Galician Government through research grant ED431C 2021/33.