
Abstract
This study investigates the decolorization of recycled green PET bottles to enhance their recyclability and broaden their applications, particularly for high-purity and transparent materials. UV-Visible spectroscopy identified the green colorants in the PET as Solvent Green 5 (SG5), characterized by absorption regions between 400-460 nm and 580-720 nm, and Pigment Green 7 (PG7), further confirmed by X-ray photoelectron spectroscopy (XPS) which detected the presence of copper, chlorine and nitrogen. Three commercially available activated carbons (ACs) were characterized; the point of zero charge (PZC) was determined to be 2.37 for ACQR, and 7.6 and 7.98 for activated carbons MC and ME, respectively, revealing this parameter as the most influential factor in their dye adsorption capacity and selectivity. The decolorization process involved dissolving the recycled green PET, adsorbing the dyes onto the activated carbons, and separating the carbons from the PET. Colorimetric analysis of the resulting PET films showed that activated carbon content significantly impacts partial decolorization (56.15%), with ACQR preferentially adsorbing PG7, while activated carbons MC and ME primarily adsorbed SG5, demonstrably influencing the CIELAB color parameters (L*, a*, b*). Thermal analysis indicated similar degradation behavior of the PET films between 400°C and 500°C; however, differences observed above these temperatures were attributed to variations in dye content. This approach demonstrates an effective method for PET decolorization, crucial for improving the quality and potential applications of recycled PET.
Keywords
Introduction
Polyethylene terephthalate (PET) is a widely used packaging material due to its advantageous properties, including exceptional chemical stability, solvent resistance, and barrier properties against oxygen and moisture.1,2 This has led to a surge in its demand, making it ideal for various applications, particularly in food packaging where its stability against food component migration is crucial. 1 Nevertheless, PET is susceptible to degradation from environmental factors. Exposure to natural or artificial environmental conditions, such as gamma or ultraviolet radiation, can negatively impact its permeability, thermal characteristics, and color, ultimately altering its optical and mechanical performance. 3
The colorants present in colored PET bottles, such as chlorinated copper phthalocyanine (green), further influence the material’s properties. 3 Phthalocyanine, acting as a pigment, can function as a nucleating agent, potentially increasing crystallinity, glass transition temperature (T g ), and viscosity in PET. While some of these changes might seem beneficial, they can also diminish its tensile strength and affect other mechanical behaviors of the polymer. 4 Therefore, decolorization is a critical step in the recycling process to restore and enhance the commercial value of recycled PET and broaden its range of applications. Removing colorants allows the recycled material to be more versatile and suitable for high-purity and transparent material applications.
Mexico plays a leading role in plastic recycling in Latin America, particularly with PET recovery. Recycling PET bottles is crucial for reducing waste and offers attractive investment opportunities. Mechanical recycling is the most common and cost-effective method, as it avoids the use of solvents and requires less expensive infrastructure.5,6 Still, this technique has limitations, including high energy consumption and the potential degradation of PET properties over multiple cycles.5,6 Given the growing global demand for PET, along with increasing environmental awareness and more restrictive environmental legislation, effective recycling strategies, including decolorization, have become essential to reduce environmental impact and optimize resource utilization. Research has also shown that PET recycling, compared to virgin PET production, can significantly reduce energy consumption and greenhouse gas emissions.
To address the challenge posed by colorants present within colored PET and restore commercial value, considerable effort has been dedicated to removing the inherent color of these bottles, especially green PET bottles, which have been prevalent in the market for more than two decades.7,8 Conventional approaches typically rely on depolymerization, a process that breaks PET down into its monomeric components, such as terephthalic acid (TPA), bis(2-hydroxyethyl) terephthalate (BHET), oligomers, and ethylene glycol (EG), depending on the method used.8,9 Among these techniques, hydrolysis 10 is a preferred process when repolymerization is the ultimate goal, as it efficiently removes colorants and additives from TPA and EG, which can be reintegrated into polymerization with minimal contaminants. Activated carbon has been employed as an adsorbent for organic pigments, providing a viable method for extracting colorants from PET prior to repolymerization. 11 Additionally, reactive extrusion, another decolorization method, has also been explored12,13; however, this process can induce molecular weight loss due to thermal degradation of the material.
This study presents an alternative approach, focusing on decolorizing PET in a dissolved state rather than through depolymerization. 14 By keeping the polymer structure intact while utilizing the solvent phase to remove pigments, this method seeks to optimize the extraction of colorants and additives while preserving the integrity of PET for high-value applications. This approach aims to offer an alternative to reactive extrusion, addressing concerns about molecular weight loss and thermal degradation. Additionally, this approach aligns with the principles of the circular economy, facilitating PET recycling and opening possibilities for recovering adsorbed colorants and additives, which could be repurposed in other industrial processes. 15
Experimental Procedure
Materials
Transparent, colorless PET (T-PET-B) and green PET (G-PET-B) bottles with a capacity of 1.5 L, specifically designed for bottling and packaging Coca-Cola® brand products, were used. These bottles were purchased directly from commercial sources. It is important to note that the green PET bottles (G-PET-B) already contain the colorants within the PET matrix, and these colorants were not added externally during the experimental procedure.
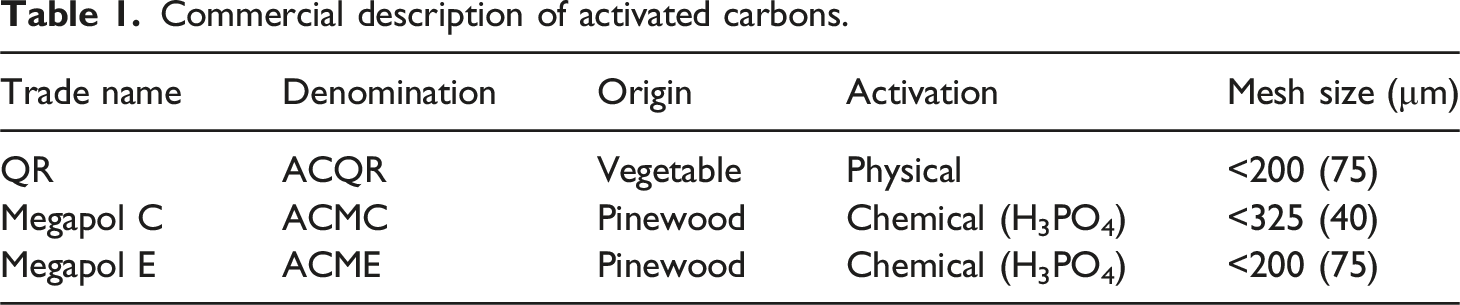
Commercial description of activated carbons.
Methodology
Experimental design
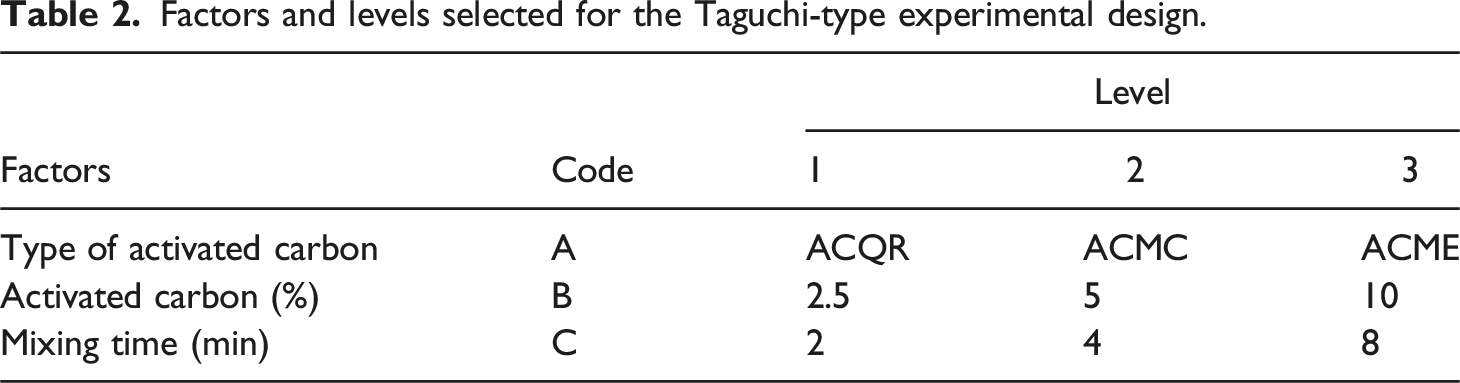
Factors and levels selected for the Taguchi-type experimental design.
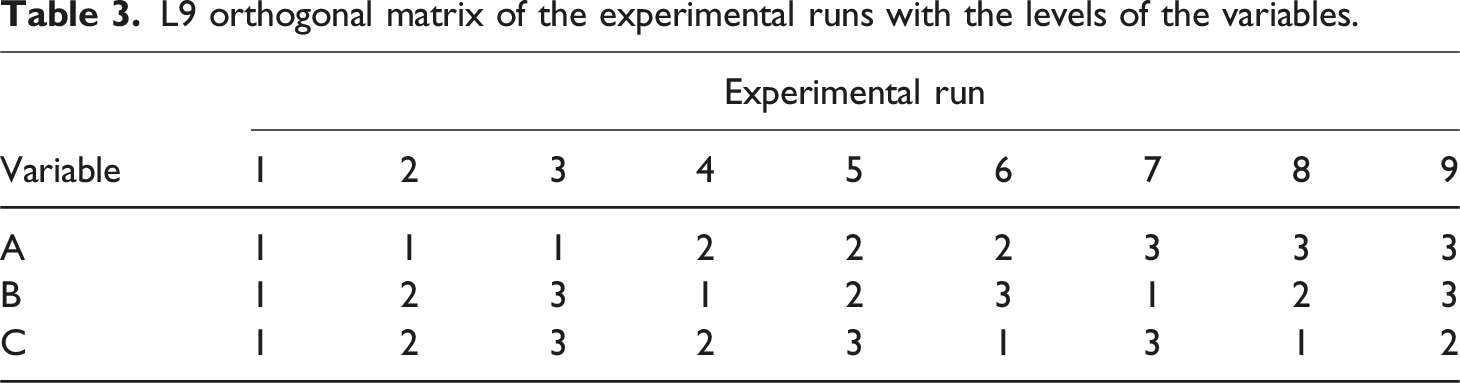
L9 orthogonal matrix of the experimental runs with the levels of the variables.
For sample preparation, 1.5 L PET bottles (both clear and green) were stripped of their labels and caps. The bottles were then ground into smaller particles using a Pagani mill (model 2030) equipped with a 4 mm mesh. The resulting PET flakes were repeatedly washed with distilled water using a metal strainer to remove any surface impurities.
Prior to each experimental run, both the PET flakes (T-PET-B and G-PET-B) and the three types of activated carbon were dried in a Felisa convection oven (model FE-291AD). The drying process was conducted at 120°C for 4 h to minimize potential hydrolytic degradation of the PET upon contact with the solvent mixture.
Dissolution tests
To conduct the experiments outlined in the orthogonal array (Table 3), a solvent mixture was prepared. The required volumes of phenol and tetrachloroethane were calculated to maintain a 60/40 wt ratio. This solvent mixture was then added to the PET in a 250 mL volumetric flask, using a ratio of 0.02 g of PET per milliliter of solvent mixture.
The flask containing the mixture was placed on a hot plate preheated to 110°C and stirred magnetically for 45 min. Visual inspections were performed after 15 min and every 10 min thereafter to monitor the PET dissolution process. The purpose of this dissolution step was to extract the colorants already present in the green PET for subsequent adsorption onto activated carbon. Once the solution cooled to room temperature, the specified amount and type of activated carbon, as detailed in the experimental design (Tables 2 and 3), was added. The resulting mixture was then stirred for the duration specified in the experimental design.
Activated carbon
Particle size distribution
The particle size distribution of the three activated carbons (ACs) was determined using a Coulter LS100 laser analyzer, which measures particles ranging from 0.1 to 1000 µm. This instrument utilizes a 5 mW, 750 nm wavelength laser diode as its light source.
For each measurement, a liquid suspension was prepared by mixing approximately 5 mg of each activated carbon sample with deionized water in a cell. The cell containing the suspension was subjected to ultrasonic agitation during measurement to ensure homogeneous particle dispersion. The sample amount was adjusted to maintain an obscuration level between 8 and 11%. Three measurement runs were performed for each AC type.
Scanning electron microscopy (SEM)
Scanning Electron Microscopy (SEM) images of the activated carbon samples were acquired using a JEOL JSM-6360LV microscope. Microstructural analyses were performed to examine the surface morphology and component distribution. Two magnifications were used: 50x and 500X, corresponding to a 500 µm and 5 µm scale, respectively. These magnifications provided both an overview of the general surface structure and more detailed views of activated carbon morphology.
Prior to SEM analysis, the samples were coated with a thin layer of gold to prevent image distortion due to static charge buildup during interaction with the SEM’s electron beam.
Surface area and pore Size Distribution
The surface area and pore size distribution of the activated carbon samples were analyzed using a Quantachrome Nova 2200e analyzer. Prior to analysis, the samples (30 mg each) were degassed at 250°C for 5 h under vacuum to remove any residual water or oil that could affect the measurements.
Surface area and pore size measurements were performed using liquid nitrogen at 77 K as the adsorbate gas. 30 adsorption and 30 desorption points were collected over a relative pressure (P/P0) range of 0.005 to 0.99. The samples remained immersed in liquid nitrogen for approximately 20 h.
The Brunauer-Emmett-Teller (BET) method 16 was used to calculate the surface area, and the Barrett, Joyner, and Halenda (BJH) method 17 was employed to determine the pore size distribution. All measurements were conducted under standard temperature and pressure conditions.
Determination of the zero charge point (ZCP)
The point of zero charge (PZC) of the activated carbons was determined using an indirect method.18,19 Five 0.01 M sodium chloride (NaCl) solutions were prepared and their pH adjusted to values between 3 and 11 using 0.1 M hydrochloric acid (HCl) and 0.1 M sodium hydroxide (NaOH) solutions. The solutions were allowed to equilibrate for 48 h, after which the initial pH of each solution was measured using an Oakton WD-35,619-23 potentiometer. Subsequently, 0.15 g of dried AC (dried at 120°C for 4 h in a Felisa FE-291AD convection oven) was added to each solution, and the mixtures were allowed to equilibrate for another 48 h. Finally, the final pH of each solution was measured.
A graph of initial pH versus final pH was constructed using the obtained pH values. Linear regression analysis was used to fit the data points to a straight line. The PZC value of the activated carbon was determined by the intersection of this line with the line where initial pH equals final pH.19–21 This procedure was performed for each of the three AC types.
Polyethylene terephthalate
UV-Visible spectrometry
An Agilent Technologies Cary 60 spectrophotometer was employed to conduct UV-Visible spectroscopy. This technique, used to identify and quantify chromophores in solution, analyzes samples using a light beam ranging from 200 nm to 900 nm, encompassing the ultraviolet (UV) and near-infrared (NIR) portions of the electromagnetic spectrum. Thin film samples (1 cm x 4 cm x 0.24 mm) were prepared from sections of green PET (G-PET-B) and transparent-colorless PET (T-PET-B) bottles for this analysis.
The film samples were washed with distilled water to remove surface impurities or residue. After washing, they were dried in a convection oven at 40°C for 15 min to remove residual moisture. The samples where then washed again with ethanol, and carefully dried with absorbent paper to ensure complete cleanliness.
Finally, the cleaned samples were placed in a quartz cell (transparent to the UV-Visible wavelength range), and UV-Visible spectra were recorded for both G-PET-B and T-PET-B samples. The resulting data were analyzed to monitor the absorption characteristics of the extracted dyes, providing a direct measurement of their presence and subsequent removal during the adsorption process. UV-Visible spectroscopy was selected for its ability to identify and quantify colored compounds in solution, making it ideal for this purpose.
X-ray photoelectron spectroscopy (XPS)
This surface-sensitive technique, which provides information on elemental composition and chemical states, was used to characterize the surface of the PET samples and the activated carbon materials.
The chemical properties of the PET sample films (T-PET-SF and G-PET-SF) were analyzed using a Thermo Scientific K-Alpha instrument equipped with an aluminum X-ray source. The analysis was performed in two stages: first, a surface analysis to determine the surface chemical composition; and second, an in-depth XPS profile to analyze the chemical composition at various depths.
During in-depth XPS profiling, the samples were etched with argon ions (Ar+) for 30 seconds at an etch rate of 7 Å/s, removing approximately 21 nm from the original surface. After etching, both survey and high-resolution spectra were acquired for the elements present, primarily carbon (C) and oxygen (O), as well as for any other elements identified in the survey spectrum.
The obtained spectra were calibrated using the carbon (C 1s) photoemission peak at a binding energy of 284.6 eV, a standard reference in XPS analysis.
XPS was employed to characterize the surface composition and chemical states of the PET samples and the activated carbon materials. This technique provides valuable information on the elemental composition and chemical bonding states at the surface, which is critical for understanding the interactions between the adsorbent and adsorbate during the decolorization process.
PET sample films formed from the filtered hot liquid of G-PET decolorization
CIELAB colorimetric analysis
An X-rite SP62 colorimeter was used to perform CIELAB analysis on the PET sample films. The goal was to quantify and compare color differences before and after the decolorization process.
This involved taking three measurements in the central area of each film sample to obtain the L*, a*, and b* color coordinates. L* represents luminosity (0 = black, 100 = white), a* represents the red-green axis (positive values = red, negative values = green), and b* represents the yellow-blue axis (positive values = yellow, negative values = blue).
The three measurements for each sample were averaged to obtain representative L*, a*, and b* values and calculate the standard deviation. To ensure consistent measurement conditions and minimize interference, all measurements were taken against a white, opaque background to prevent light reflection or other alterations caused by background color variations or irregularities.
Statistical analysis
For statistical evaluation, Euclidean distance (ΔE*), chroma (c*), hue (h*), and luminosity (L*) values obtained from the CIELAB colorimetric measurements for each experimental run (Table 3) were utilized. The effect of the experimental factors listed in Table 2 on these normalized color parameters was assessed using analysis of variance (ANOVA) with Qualitek-4 software (Nutek, Inc., Michigan, MI, USA). The ANOVA methodology incorporated ‘bigger is better' criteria for Euclidean distance and luminosity, to reflect effective color removal, and ‘smaller is better' criteria for chroma and hue, to indicate reduced residual color intensity and shift.
Where chroma (c*), hue (h*) and Euclidean distance (ΔE*) values were calculated from a* and b* values using the following equations:


Thermogravimetric analysis (TGA)
Thermogravimetric analysis (TGA) was performed on the PET films using a Perkin Elmer TGA 8000 to analyze their thermal behavior and stability. The TGA analysis was conducted from 50°C to 650°C with a constant heating rate of 10°C per minute, recording 3600 mass measurements during the process.
For this study, green PET films (G-PET-SF) and transparent PET films (T-PET-SF) were used as references, the same samples that were used in the CIELAB colorimetric analysis. In addition, the thermal behavior of the bulk of the PET films recovered from the nine tests of the Taguchi-type experimental design was analyzed. Finally, as part of the analysis, a portion of the bulk of the activated carbon MC used in test six of the Taguchi-type experimental design was taken. This AC sample was taken directly from the filter paper used in the separation of the activated carbon from the decolorized PET solution.
Green PET films (G-PET-SF) and transparent PET films (T-PET-SF), the same samples used in the CIELAB colorimetric analysis, served as references. The thermal behavior of bulk PET films recovered from the nine Taguchi experimental runs was also analyzed.
Results and discussions
Activated carbons
Three commercially available AC types were compared: activated carbons QR, MC and ME. Key properties such as particle size, pore distribution, surface area and point of zero charge (PZC) were evaluated in order to understand their characteristics and applications. Key findings are presented below, highlighting the similarities and differences between the three carbons.
Particle size distribution and SEM
Analysis of the particle size distribution (Figure 1) and scanning electron microscopy (SEM) images (Figure 2) reveals notable variations in the morphology and particle size of the three activated carbons. While the size distribution quantifies the particle size, SEM images allow the visualization of their shape and morphology, providing valuable complementary information. All carbons present irregularly shaped particles, which makes accurate particle size measurement difficult, since traditional methods assume that particles are spherical.
22
This irregularity in particle shape suggests the presence of pores and cavities on their surface. Acid treatment in activated carbons MC and ME increased surface porosity, as reported in previous studies.23–25 This treatment can remove impurities and create new pores, resulting in increased surface area and adsorption capacity. In contrast, ACQR shows a more regular surface, suggesting a lower amount of pores compared to activated carbons MC and ME. This difference in porosity could influence the adsorption properties and other applications of ACs. Particle size distribution of the three types of activated carbon. SEM micrographs of activated carbon. Scale unit: left 500 μm and right 5 μm.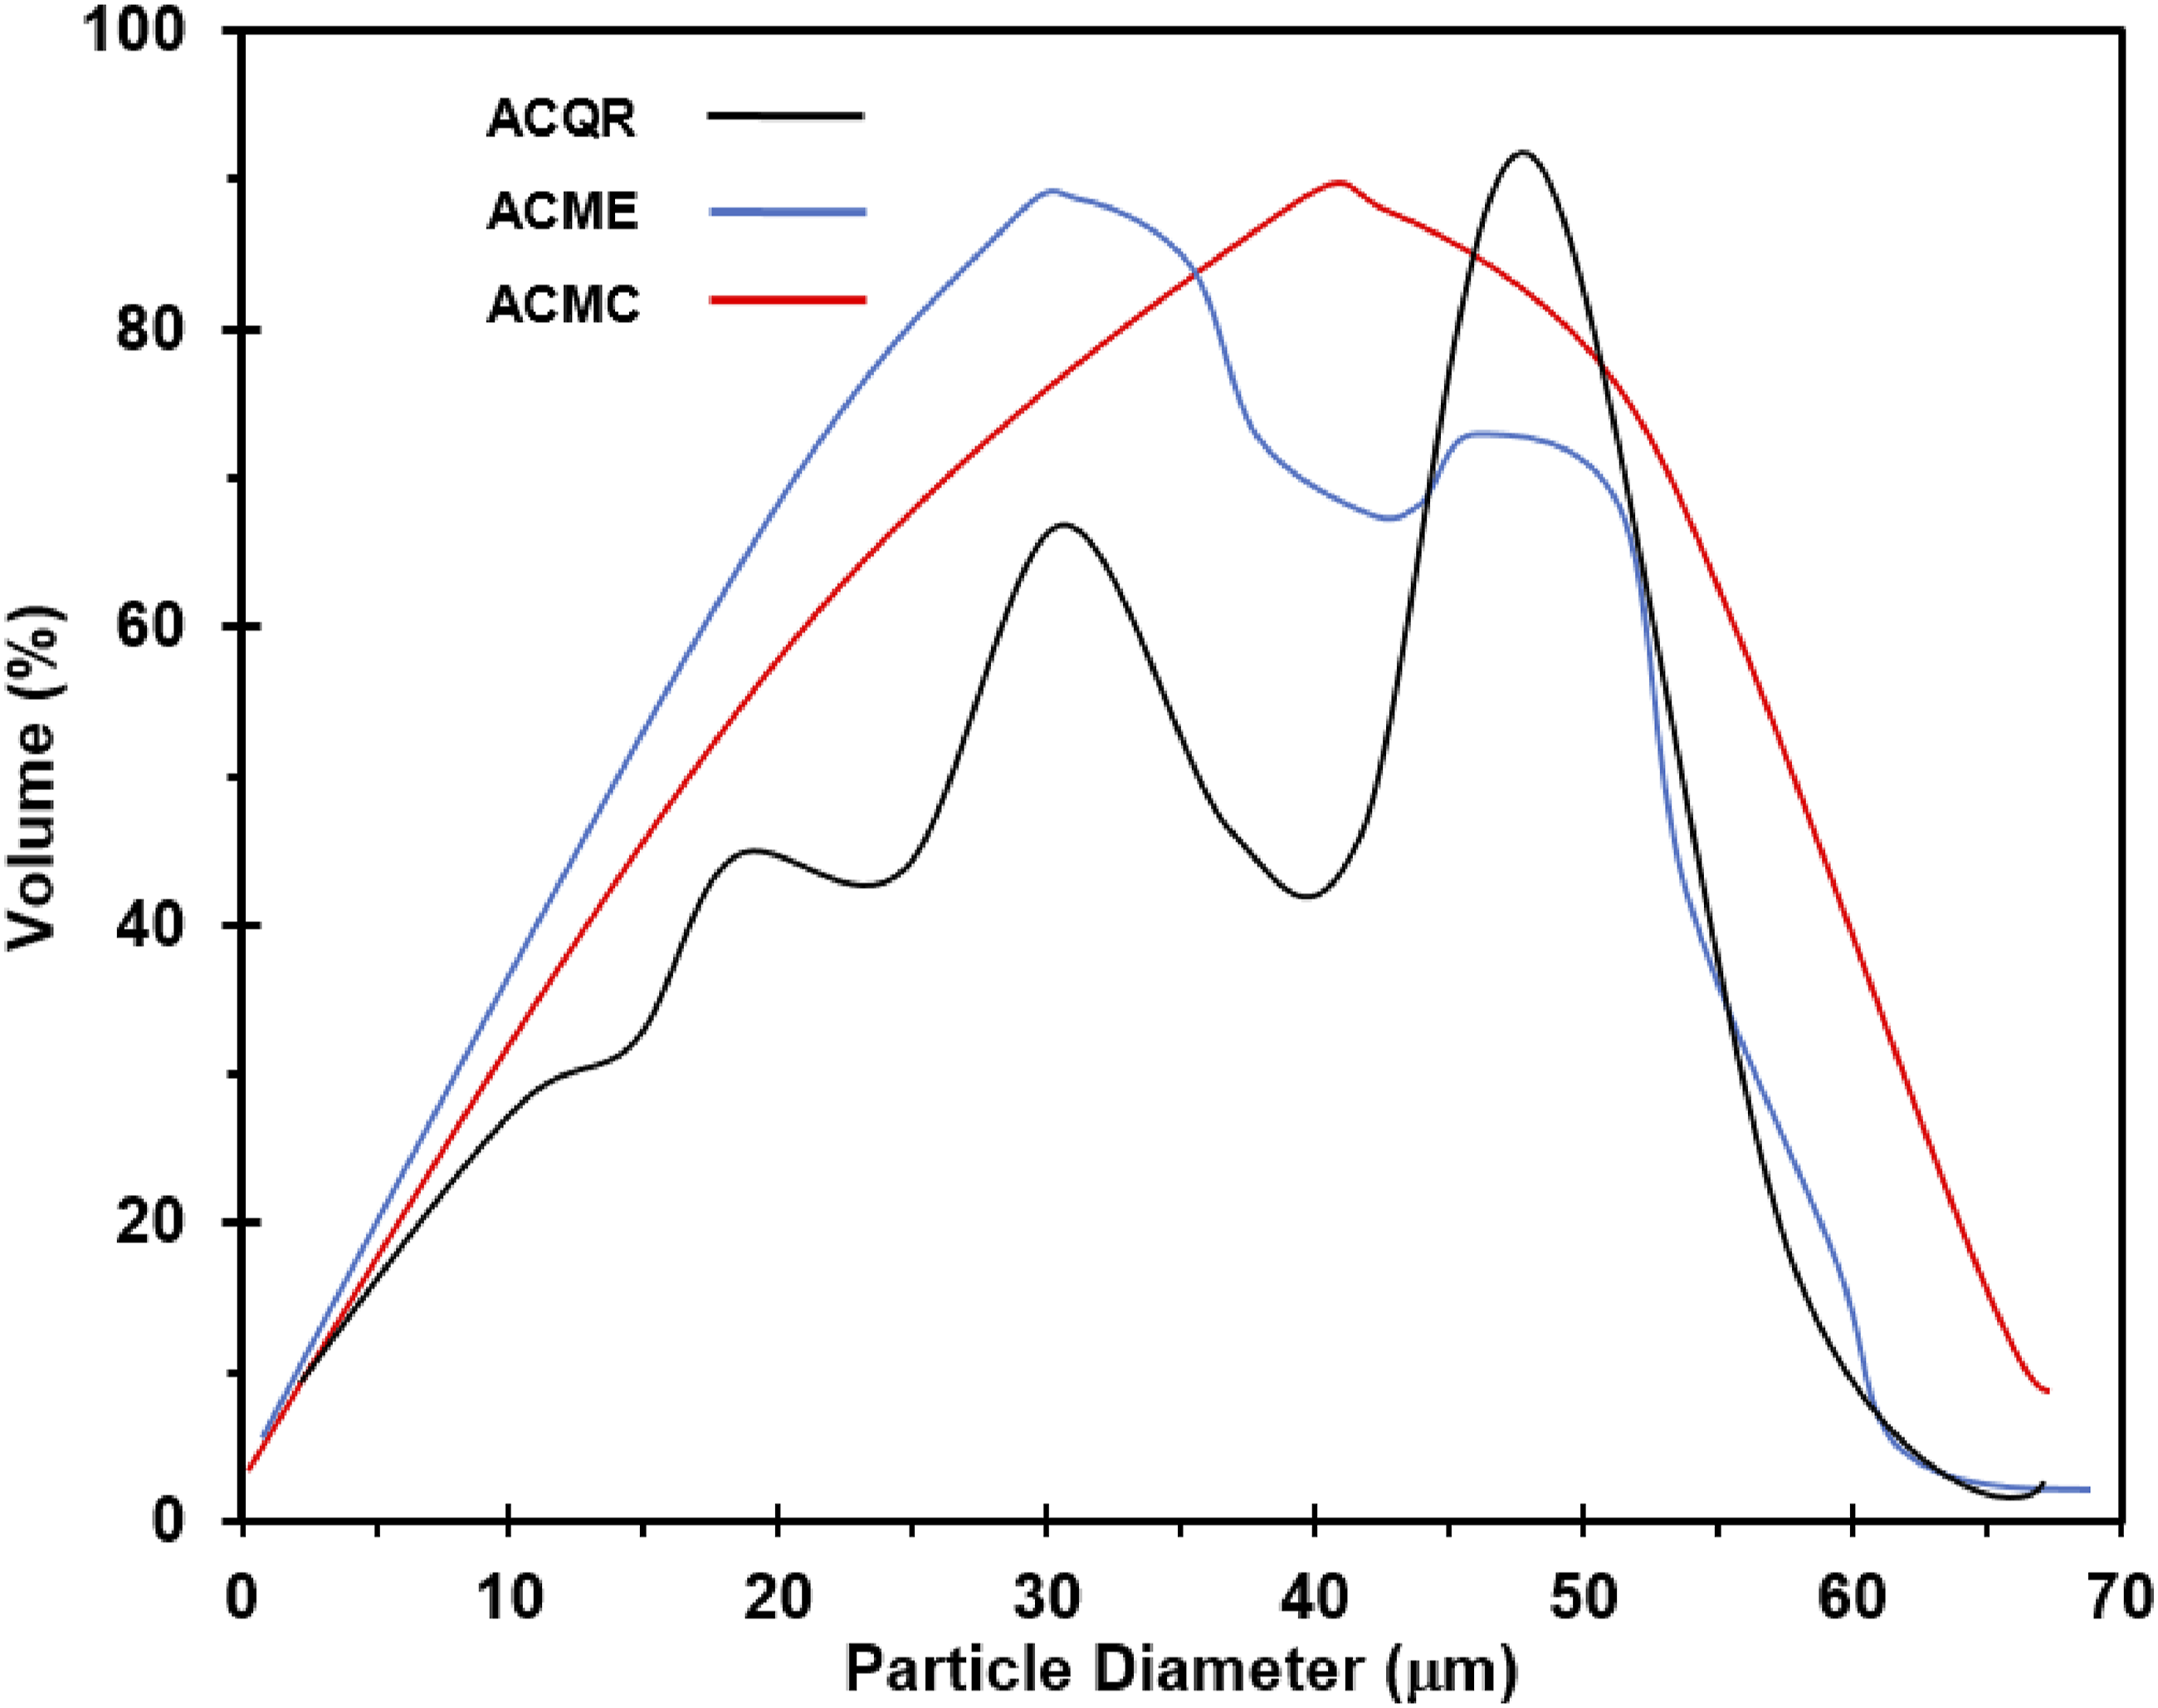
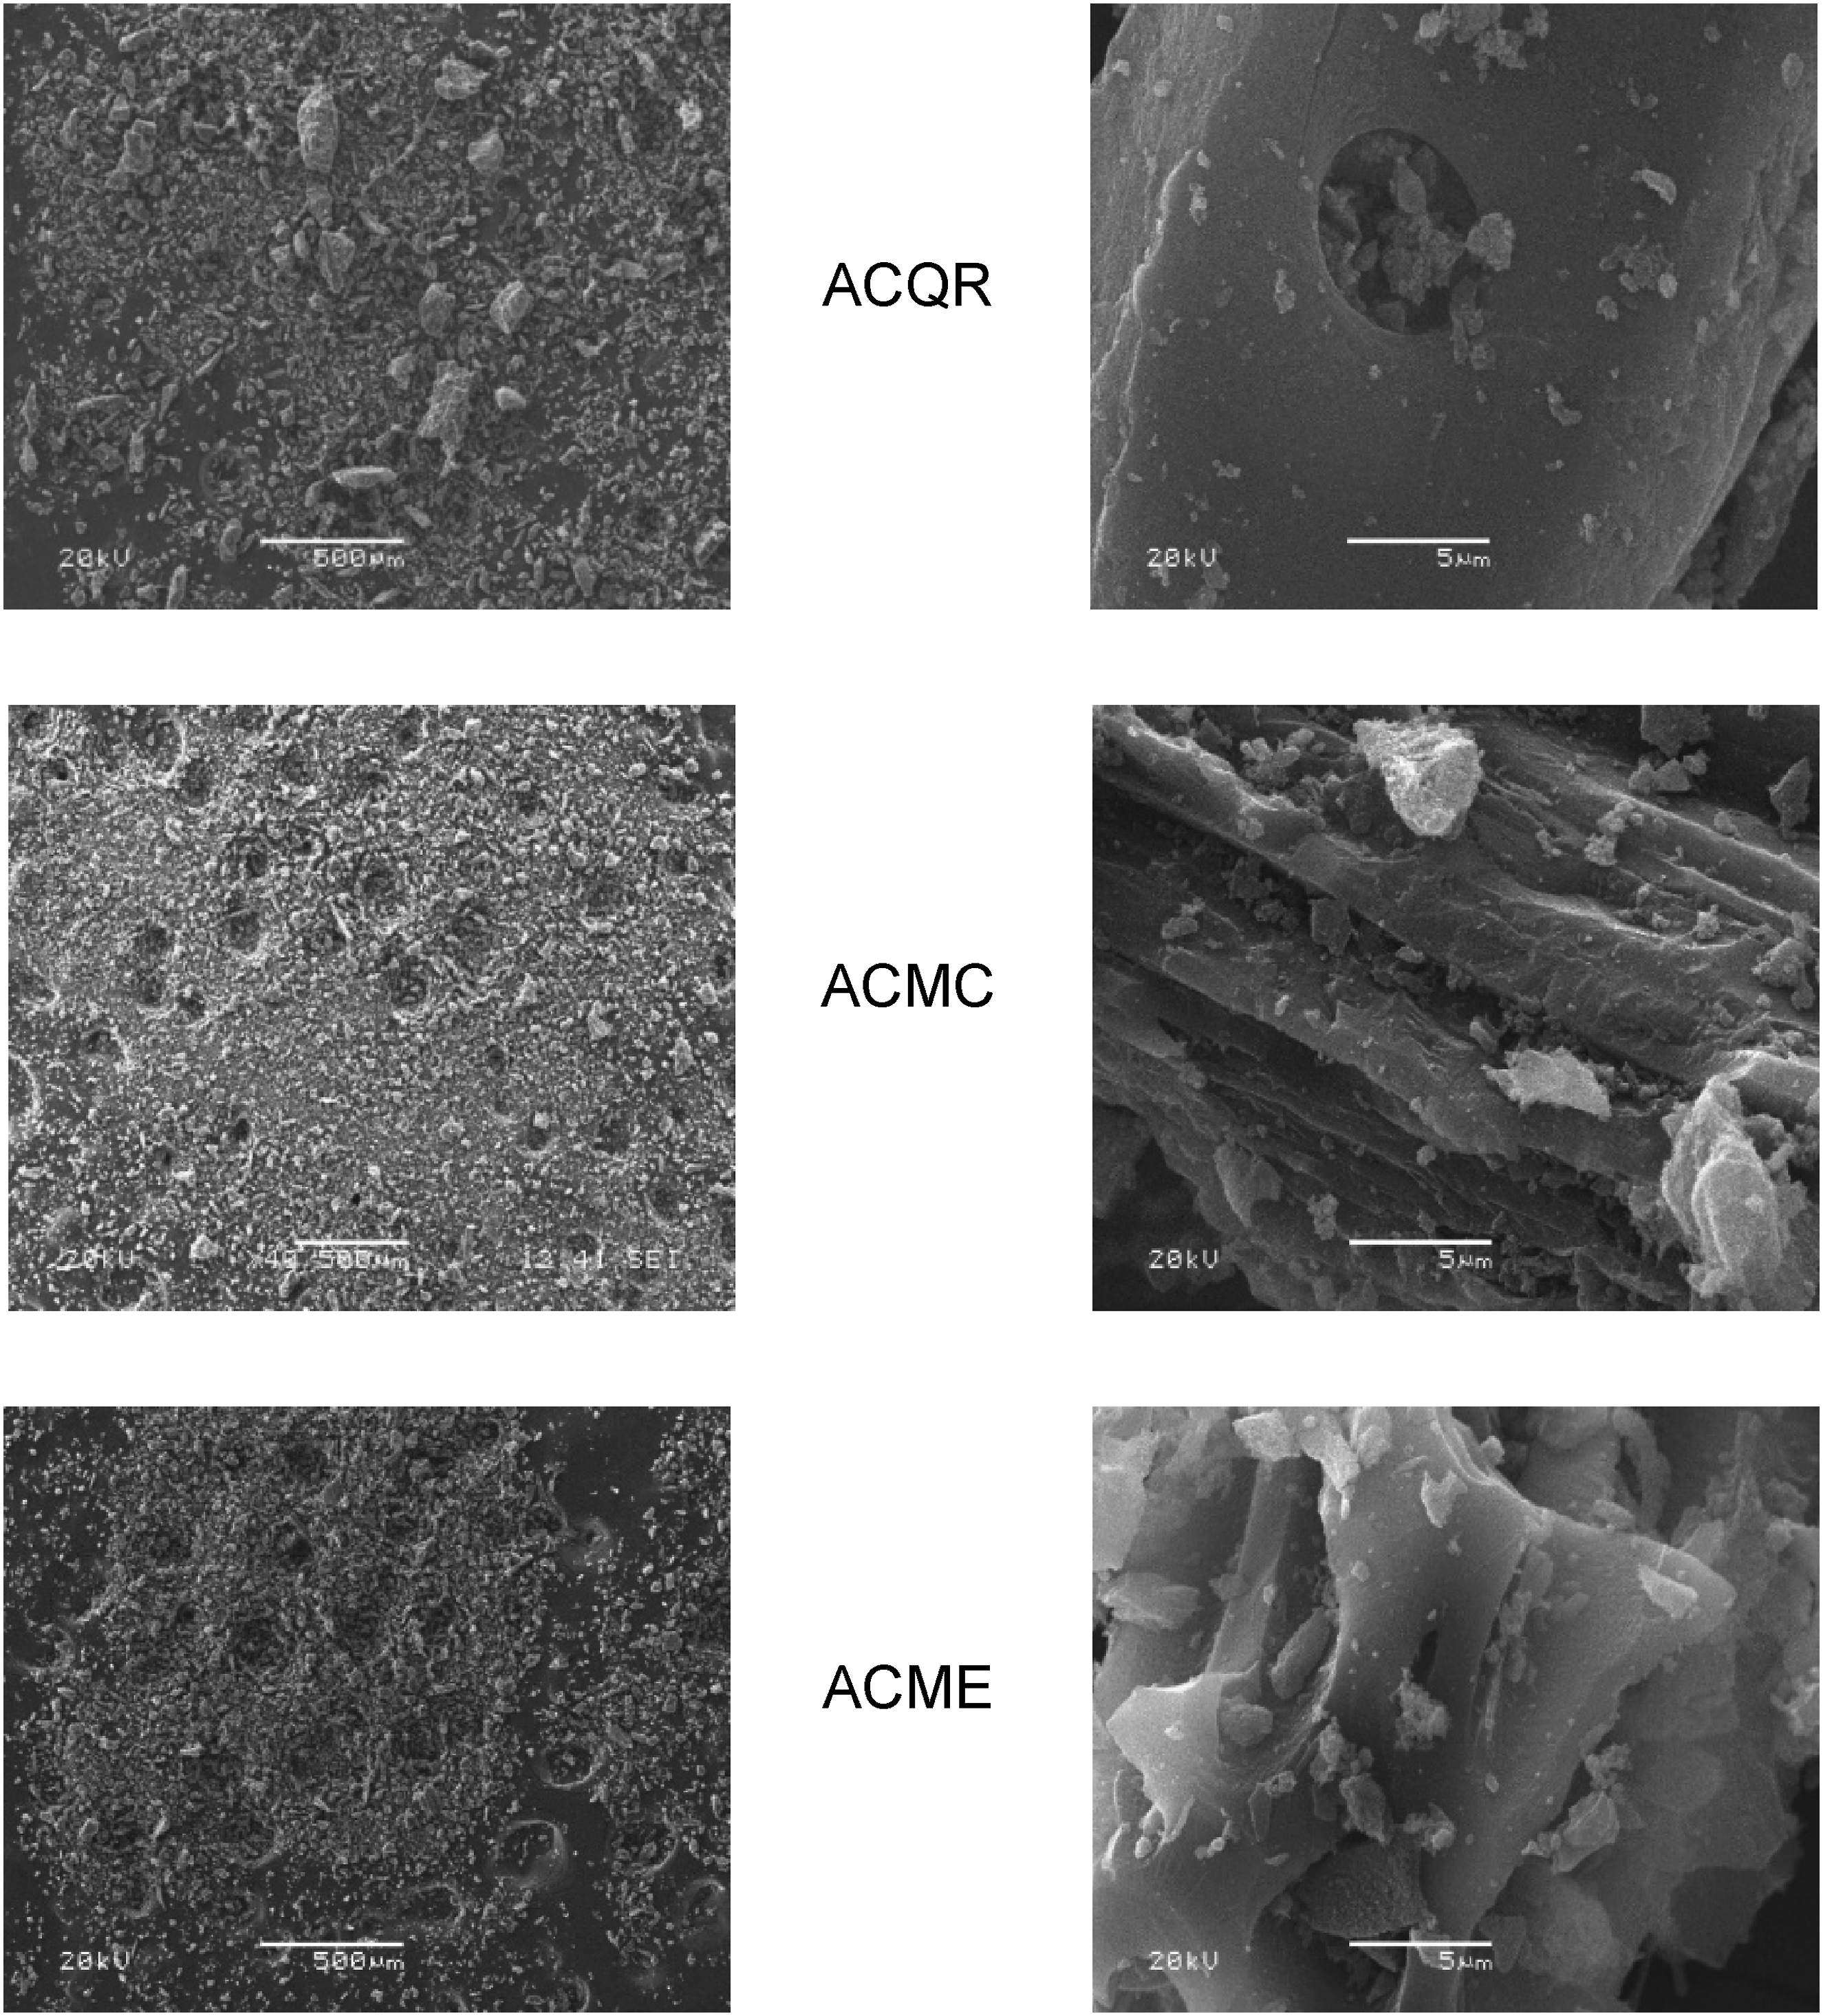
ACQR exhibits a particle size distribution with three distinct peaks: 22 µm, 35 µm and 55 µm, with a modal value of 55.14 µm. This heterogeneous distribution, where particles of different sizes coexist, suggests the possible formation of aggregates, where the smaller particles lodge in the crevices of the larger ones (Figure 2). ACMC, on the other hand, presents two predominant particle sizes: 25 µm and 43 µm, with a modal value of 45.75 µm. Although its distribution is similar to that of ACQR, it is distinguished by a wider range of diameters. In contrast, ACME shows significant particle sizes of 33 µm and 50 µm, with a modal value of 34.58 µm. ACME particles are characterized by an irregular distribution and the presence of pronounced grooves and cavities, suggesting possible increased porosity.
Surface area
The surface area, determined by the BET equation, 16 varies significantly among the carbons, with values of 1002.7, 979.1 and 628.6 m2/g for activated carbons MC, QR and ME, respectively. These results suggest that the first two carbons might have a higher adsorption capacity, since a higher surface area provides more active sites for the adsorption of molecules. However, it is important to note that the adsorption capacity does not depend only on the surface area, but also on the porosity, which provides accessible adsorption sites, and on the polar affinity, which determines the interaction between the adsorbate and the adsorbent.
The relationship between surface area and particle size, as well as their spatial distribution, indicates that a higher amount of small particles leads to a higher surface area. This is because dividing a material into smaller particles increases the total exposed surface area. As observed in the activated carbons MC and ME, which present a higher content of small particles compared to activated carbon QR, this relationship holds true. However, it is essential to consider that differences in surface area are also influenced by porosity. The internal pores of the particles, in addition to the external surface, also contribute to the total surface area and provide additional sites for adsorption.
Pore size distribution
The pore volume, which shows a direct correlation with the surface area of the activated carbon, is a key parameter to determine its adsorption capacity. Generally, a higher surface area is associated with a higher pore volume, since the latter contribute significantly to the total surface area of the material. The pore volume values obtained were 0.422, 0.303 and 0.285 cm3/g for activated carbons MC, QR and ME, respectively. This volume represents the sum of various pore sizes, including micro-, meso- and macropores,
23
with a similar distribution among the three ACs. In all cases, the volume of mesopores (2 to 50 nm) is considerably larger than that of micro- and macropores (Figure 3), which is relevant since mesopores contribute the most to the adsorption of medium-sized molecules. Furthermore, a peak in pore volume at a given size is observed, with values of 1.35, 0.88 and 0.72 cm3/g for activated carbons QR, MC and ME, respectively, in the mesopore range of 4.34-4.39 nm. This peak indicates that most of the pores are located in this size range, which could be optimal for the adsorption of certain molecules. Typical pore size behavior of activated carbon (ACQR).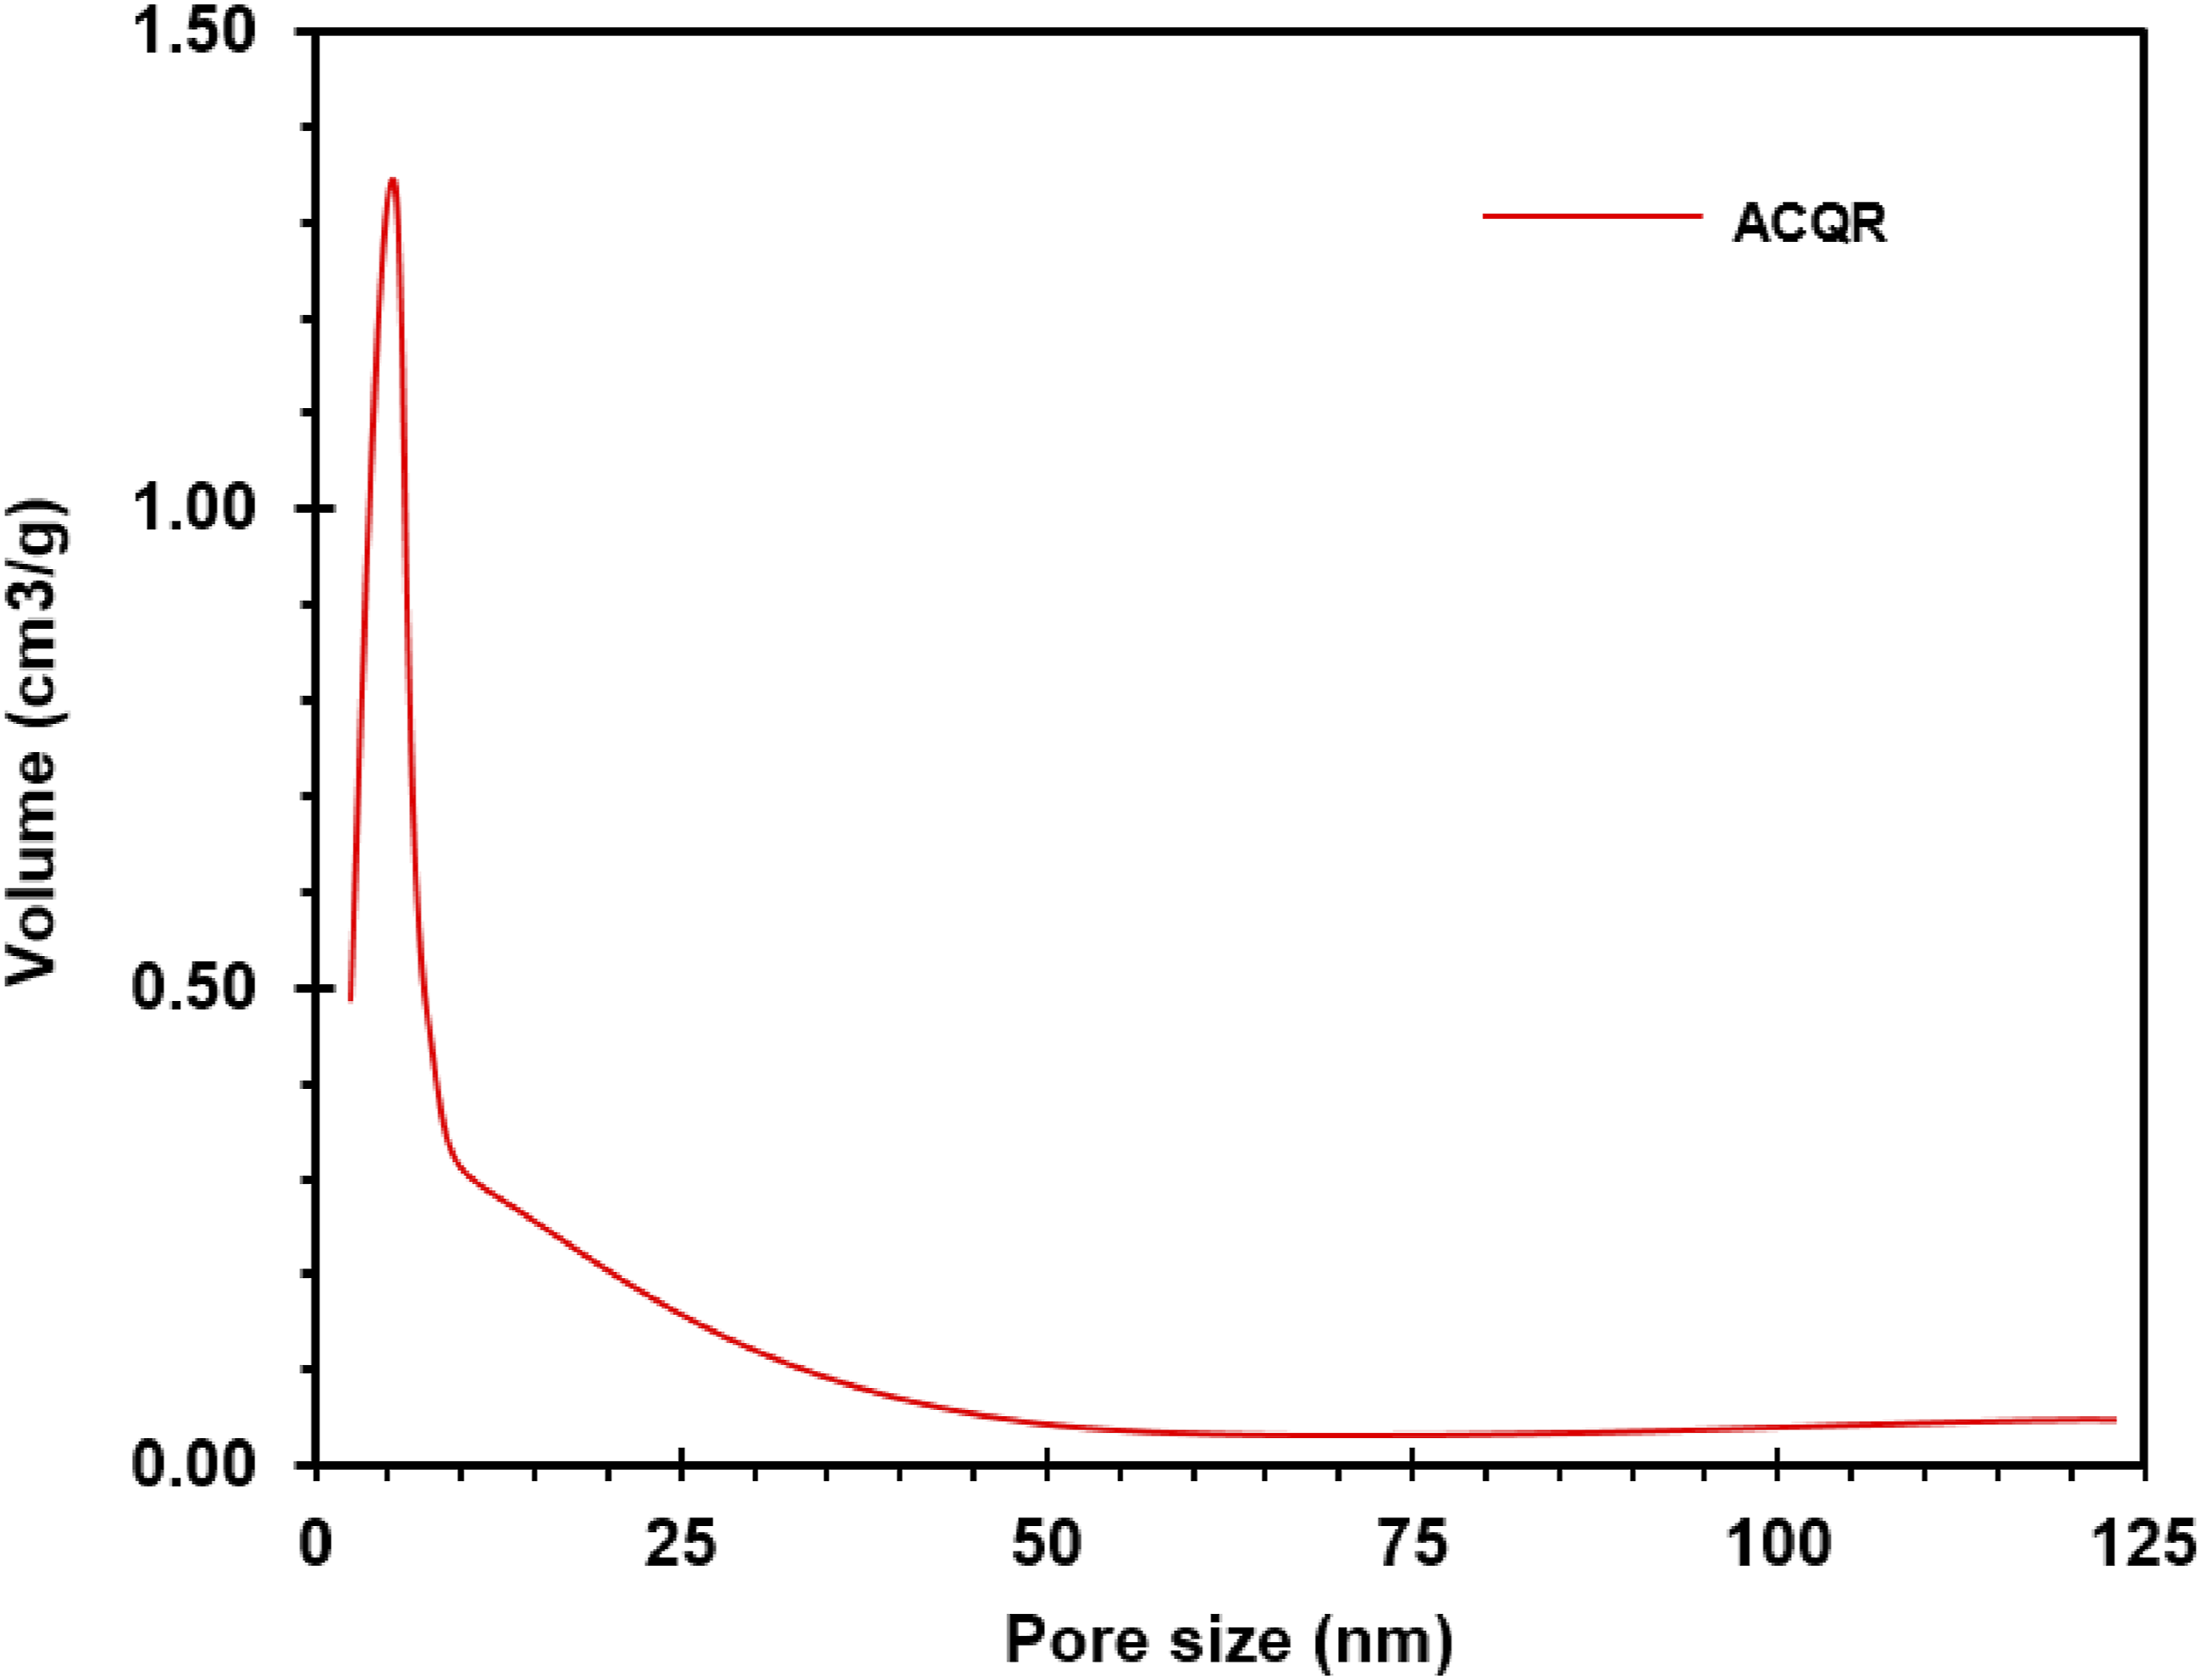
The surface area of activated carbons depends on the characteristics of the particles, such as their size, porosity and distribution, which are influenced by the type of raw material, treatments and production process. In particular, smaller and more porous particles tend to have a greater surface area. ACMC stands out for having the largest surface area, which is directly related to its larger pore volume. This characteristic gives ACMC a superior adsorbent capacity compared to the other two carbons.
Point of zero load (PZL)
Point of zero charge (PZC) is a fundamental parameter that determines the surface charge of a material and therefore influences its interaction with different chemical species. The PZC is defined as the pH at which the carbon surface has no net charge. In this study, the PZC values determined a pH of 2.37 for the ACQR, indicating an acidic surface. This surface acidity could be related to the presence of functional groups such as carboxylic, hydroxyl, anhydride or lactone,
26
which can donate protons and generate negative charges on the carbon surface. In contrast, the activated carbons MC and ME showed pH values of 7.6 and 7.98, respectively (Figure 4), suggesting slightly anionic and almost neutral surfaces. Activated carbon PZC results.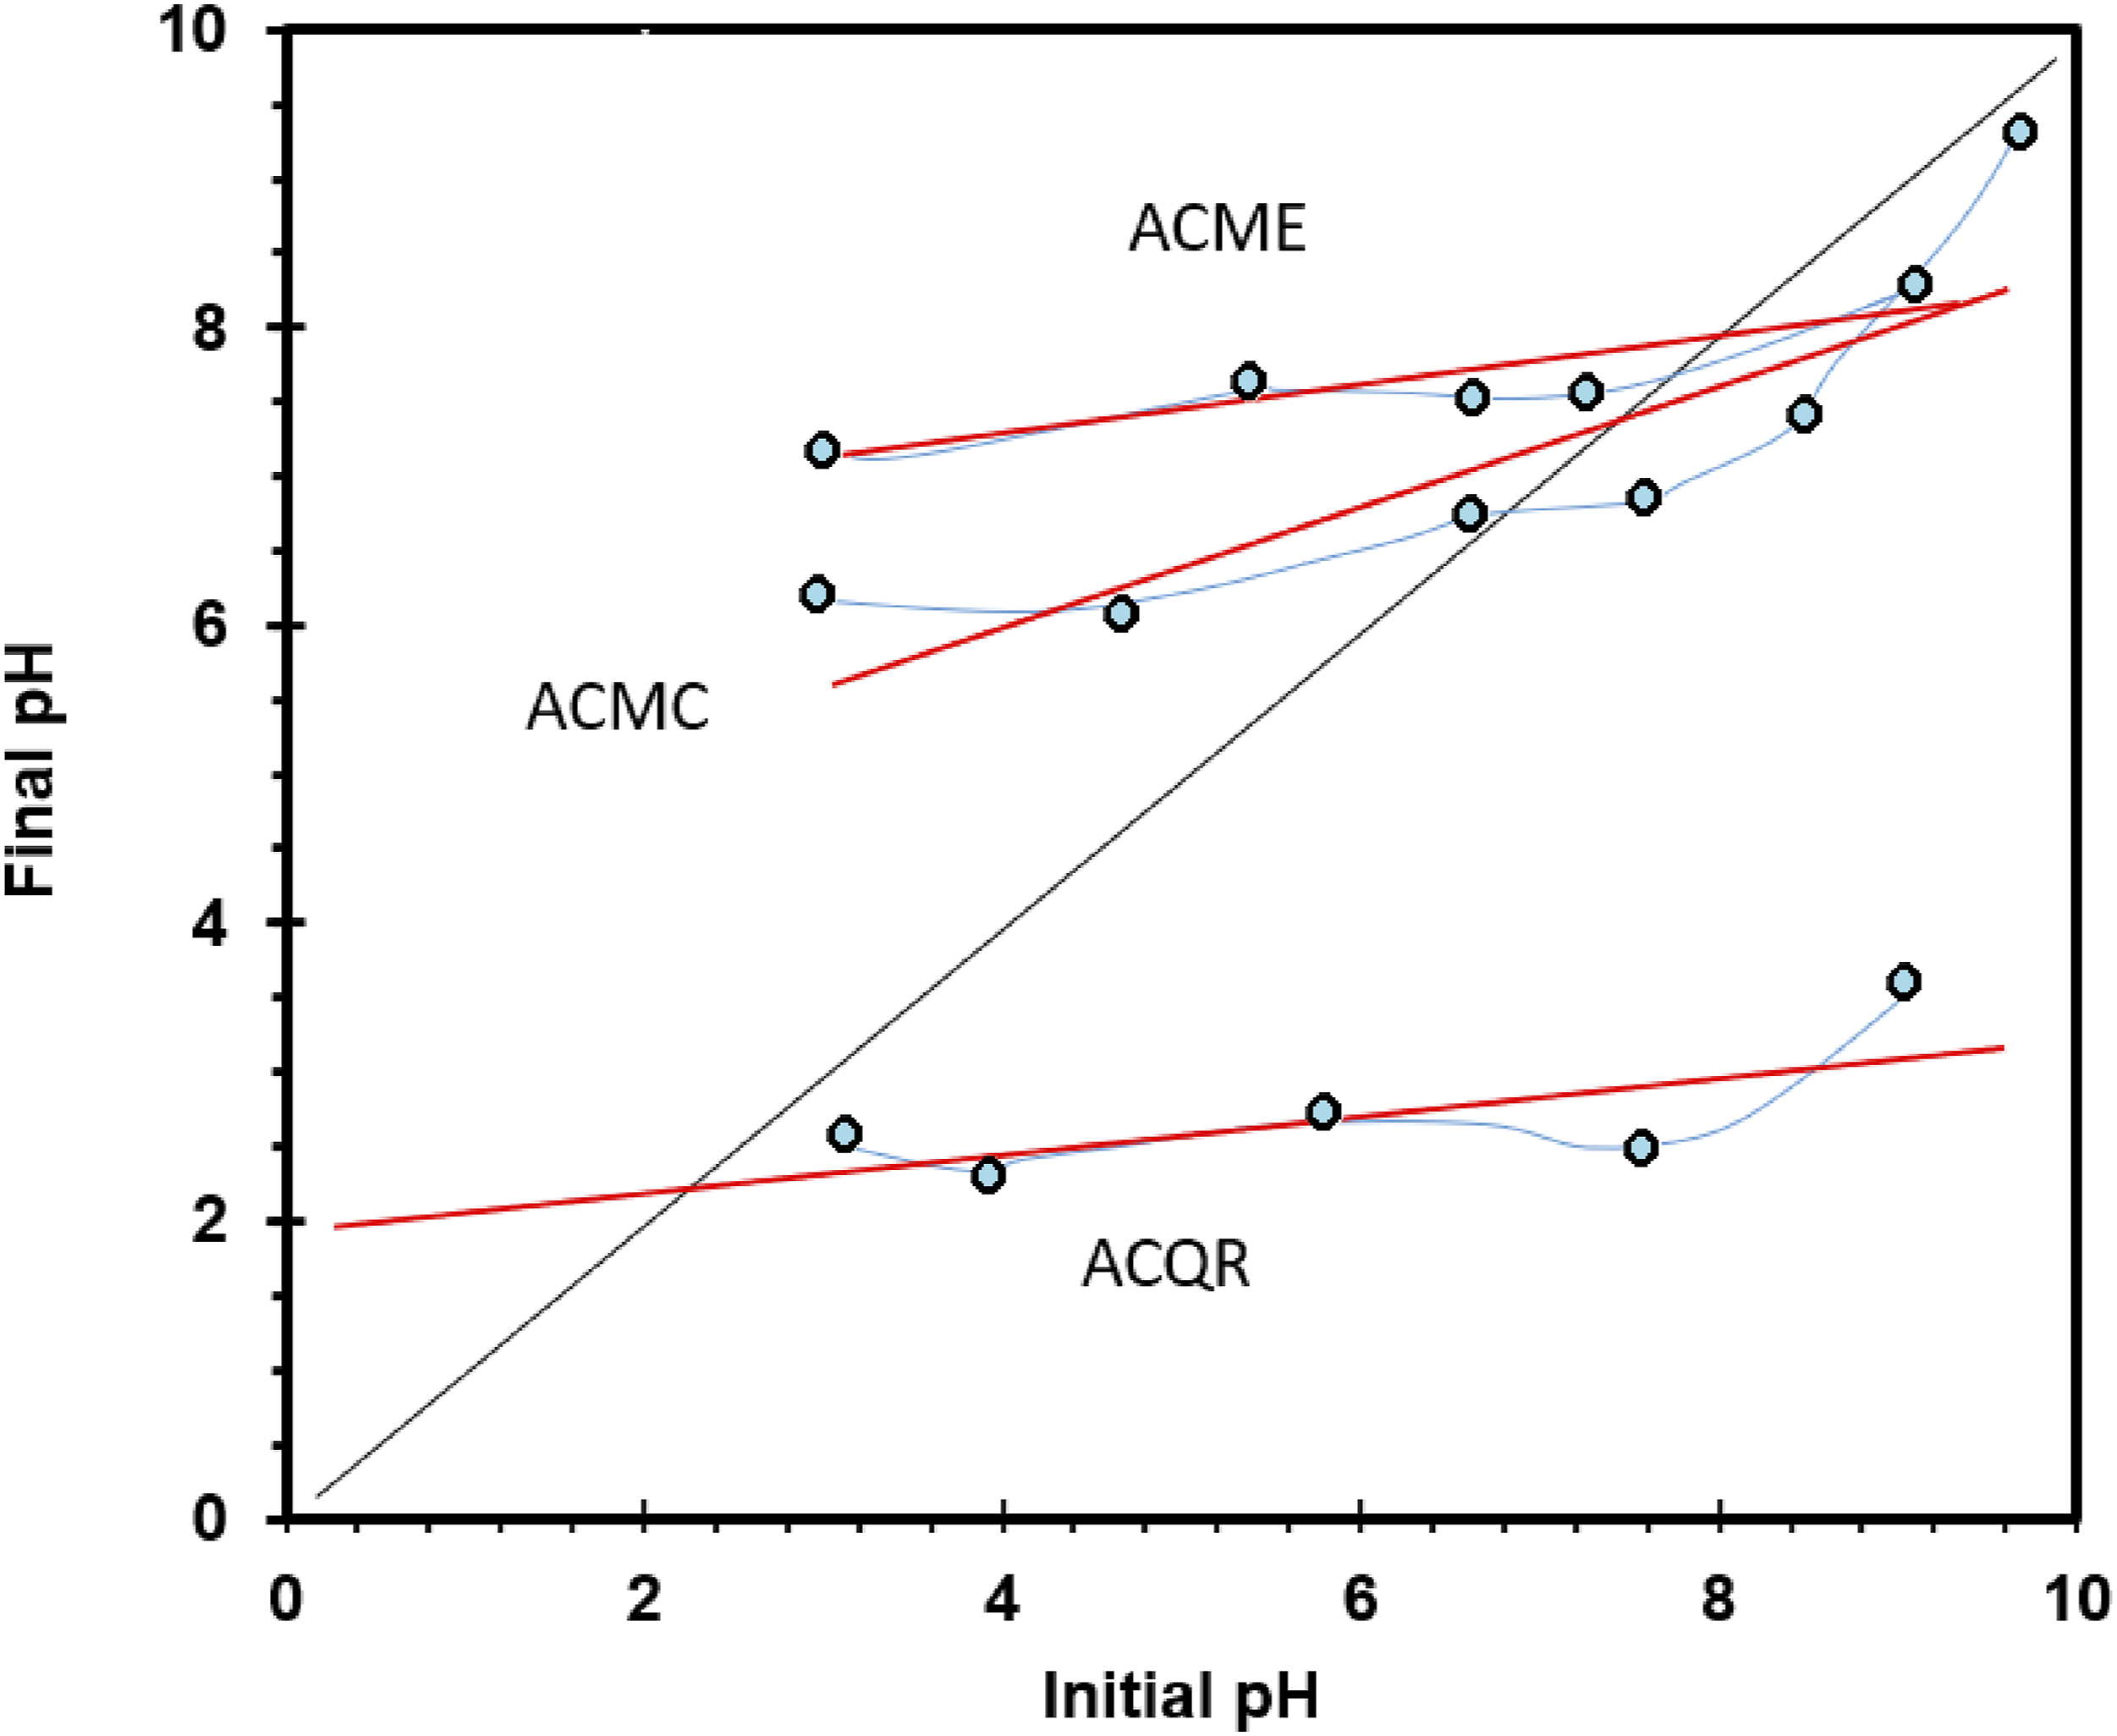
This difference in the PZC is probably due to the phosphoric acid treatment used in the production of these carbons. Treatment with this acid not only modifies PZC but can also influence other properties such as porosity and surface area. The acidic surface of ACQR, despite having the lowest surface area, could facilitate the adsorption of anions in slightly acidic or basic media. On the other hand, the slightly anionic and almost neutral surfaces of activated carbons MC and ME would be more effective for the adsorption of cations in acidic media.
Polyethylene terephthalate
UV-Visible spectrometry
UV-Visible spectroscopy analysis of green recycled PET (G-PET-B) and transparent PET (T-PET-B) bottles (Figure 5) reveals significant differences in their absorption properties. In the case of G-PET-B, main absorption regions are observed between 400-460 nm and 580-720 nm, suggesting the presence of dyes that absorb light in these wavelength ranges. The low absorption in the 460-580 nm interval is characteristic of green and yellow colors, since these colors mainly transmit or reflect light in this range.
27
On the other hand, the T-PET-B sample, not containing dyes, does not show significant absorption in the visible spectrum. This is because the carbonyl and methine groups present in the PET polymer structure absorb mainly in the ultraviolet range, not in the visible one.
28
UV-Visible absorption spectrum of PET containers.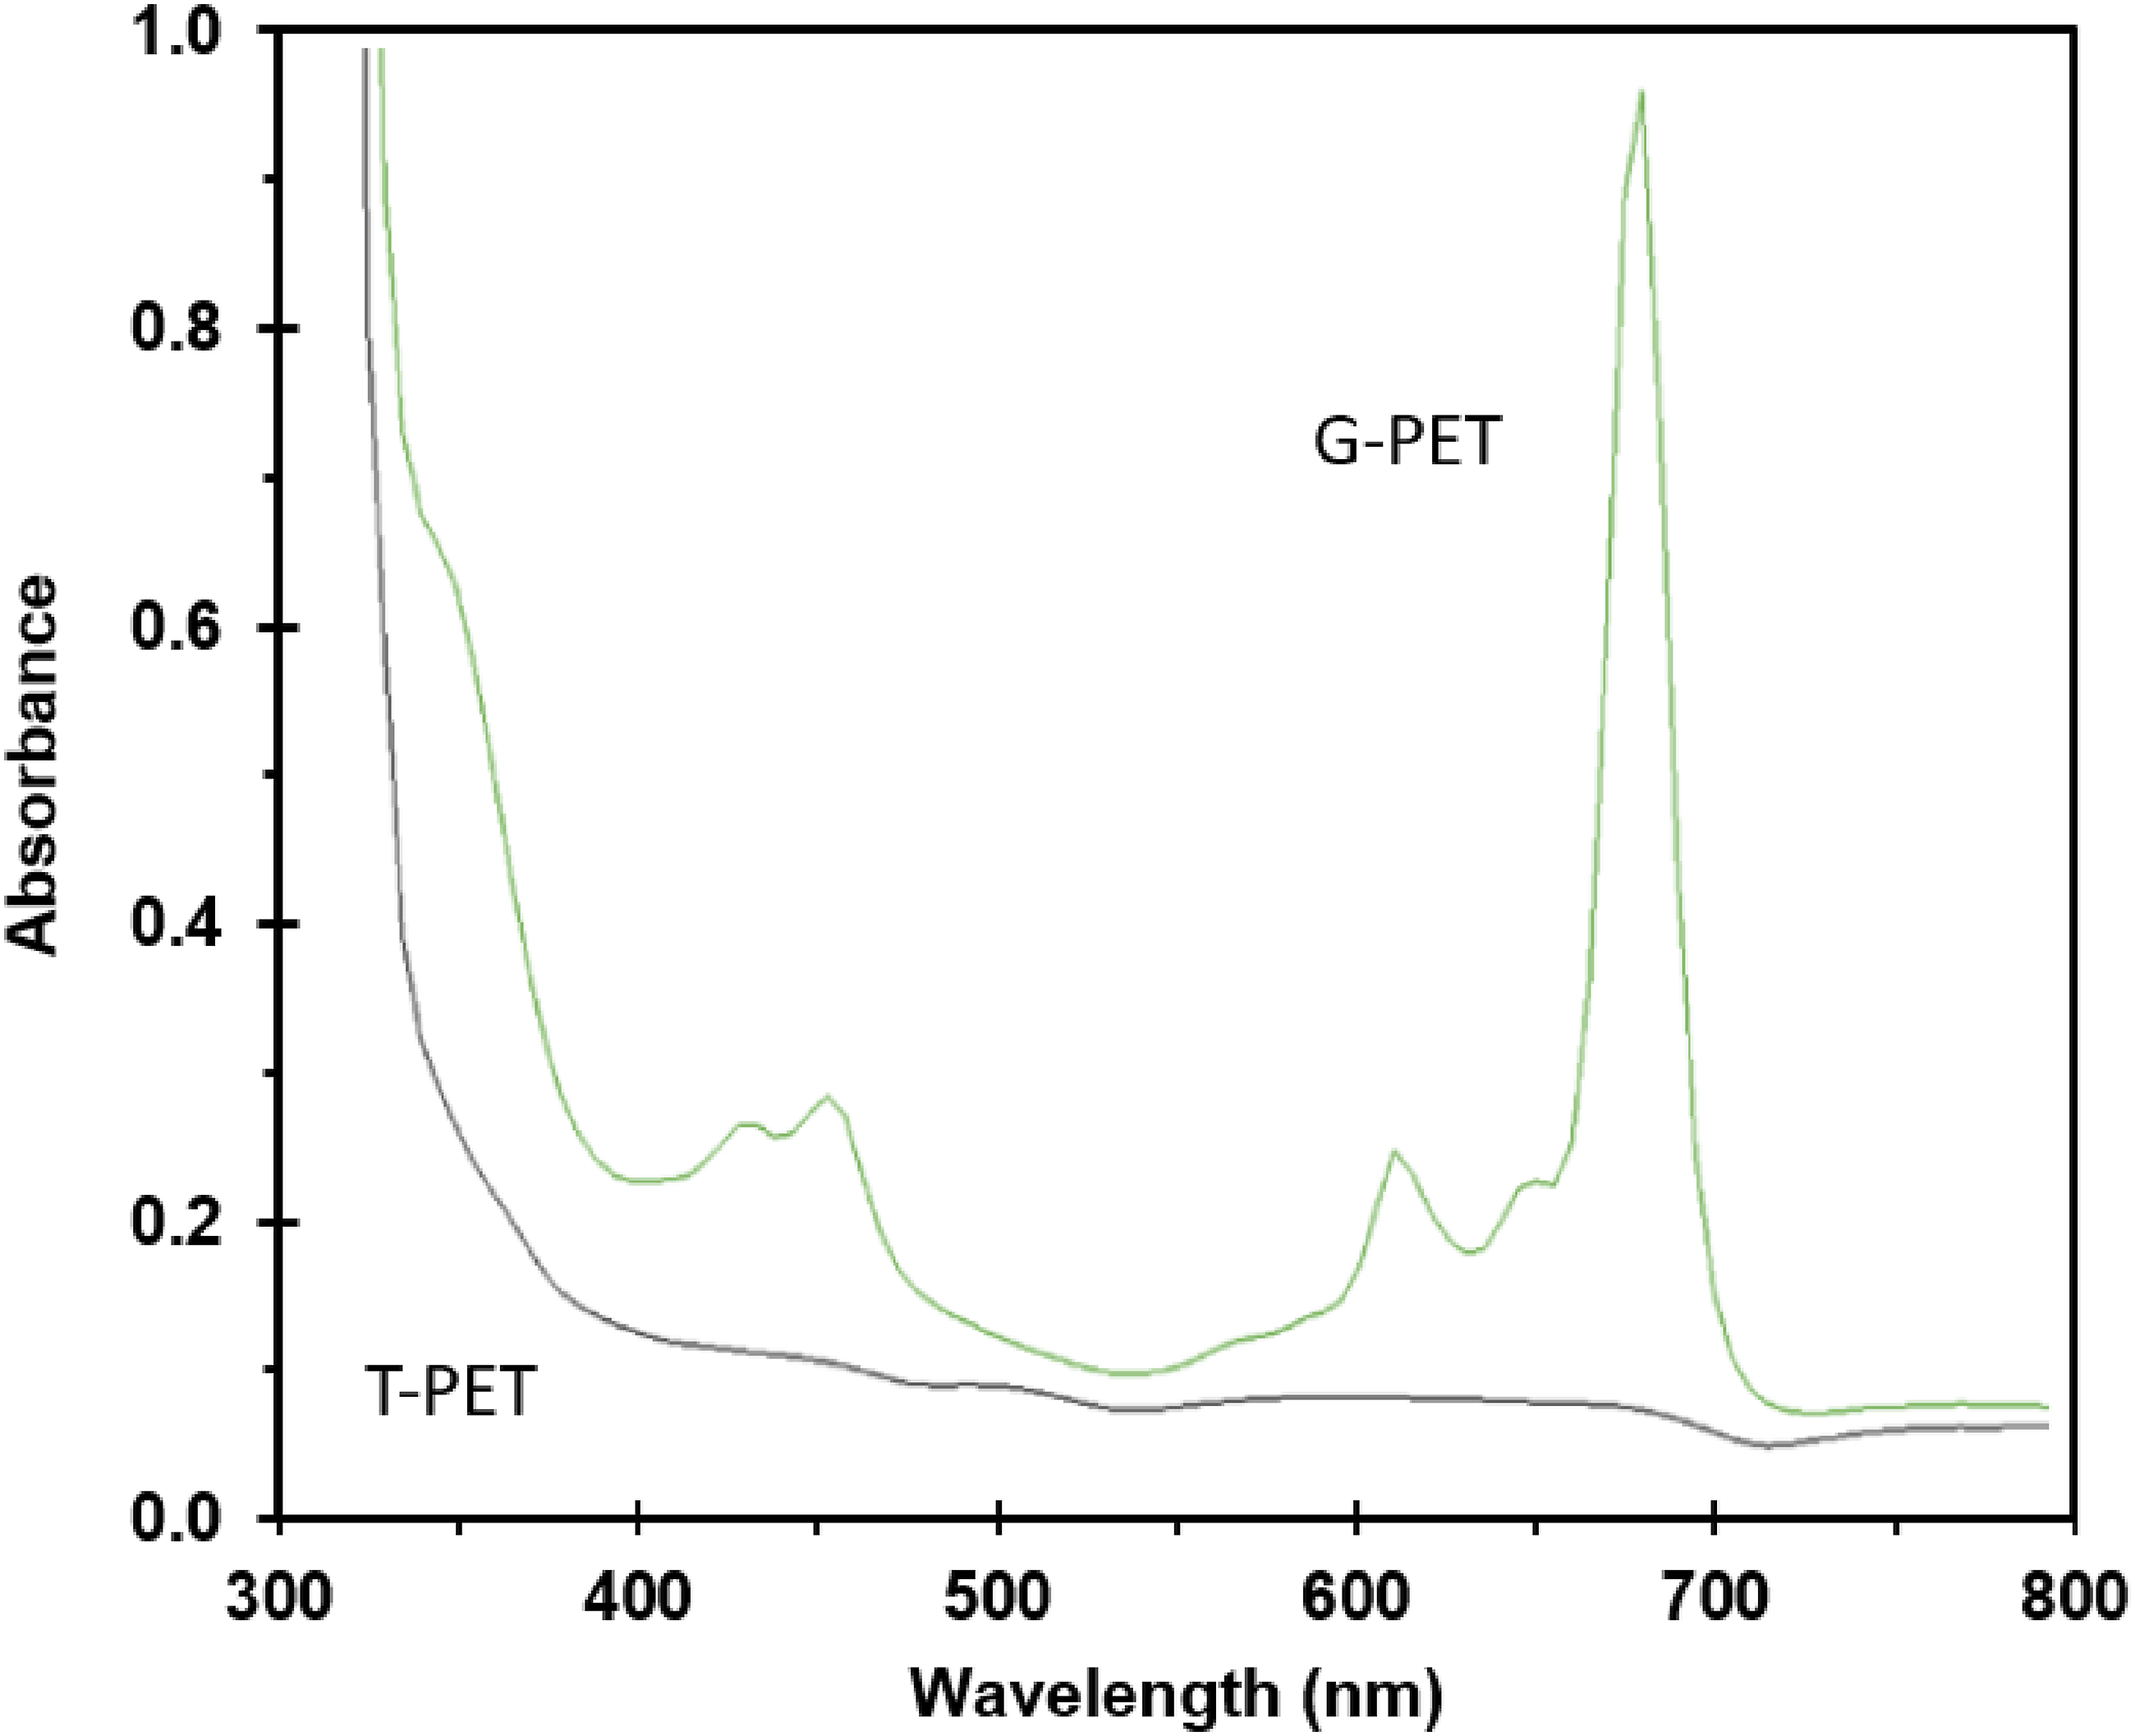
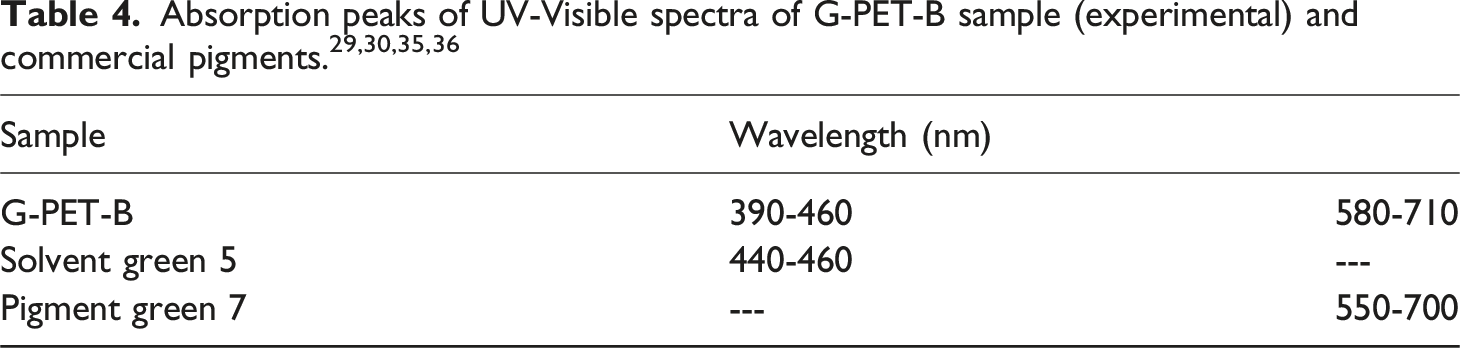
Pigment Green PG7, on the other hand, is a chlorinated copper phthalocyanine used as a pigment and exhibits three characteristic peaks in the absorption range of 580-720 nm, similar to those observed in G-PET-B. To confirm the presence of these specific dyes, X-ray photoelectron spectroscopy (XPS) analysis will be required, as this technique allows determining the elemental composition of the dyes, which is not possible with UV-Visible spectroscopy.
Energy dispersive X-ray spectroscopy (XPS)
The bulk XPS spectra obtained after erosion (Figure 6) were analyzed to eliminate potential surface contamination, ensuring that the results reflect the true bulk composition of the material. In the T-PET-B sample, five elements were detected, with oxygen (O 1s) appearing within the energy range of 529–536 eV and carbon (C 1s) at 283–287 eV, confirming the presence of the PET polymer. Additionally, minor peaks of calcium (Ca 2p) at 345–359 eV and silicon (Si 2p) at 527–538 eV were observed. Further analysis revealed possible traces of copper (Cu 2p) at 939–945 eV and 964–986 eV, nitrogen (N 1s) at 388–415 eV, and chlorine (Cl 2p) at 199–205 eV, which are reflected in Figure 7. XPS Spectrum of G-PET-B eroded sample. XPS Spectra: (a) Nanofiller elements found in sample G-PET-B eroded; (b) Pigment Green PG7 elements founded in sample G-PET-B eroded.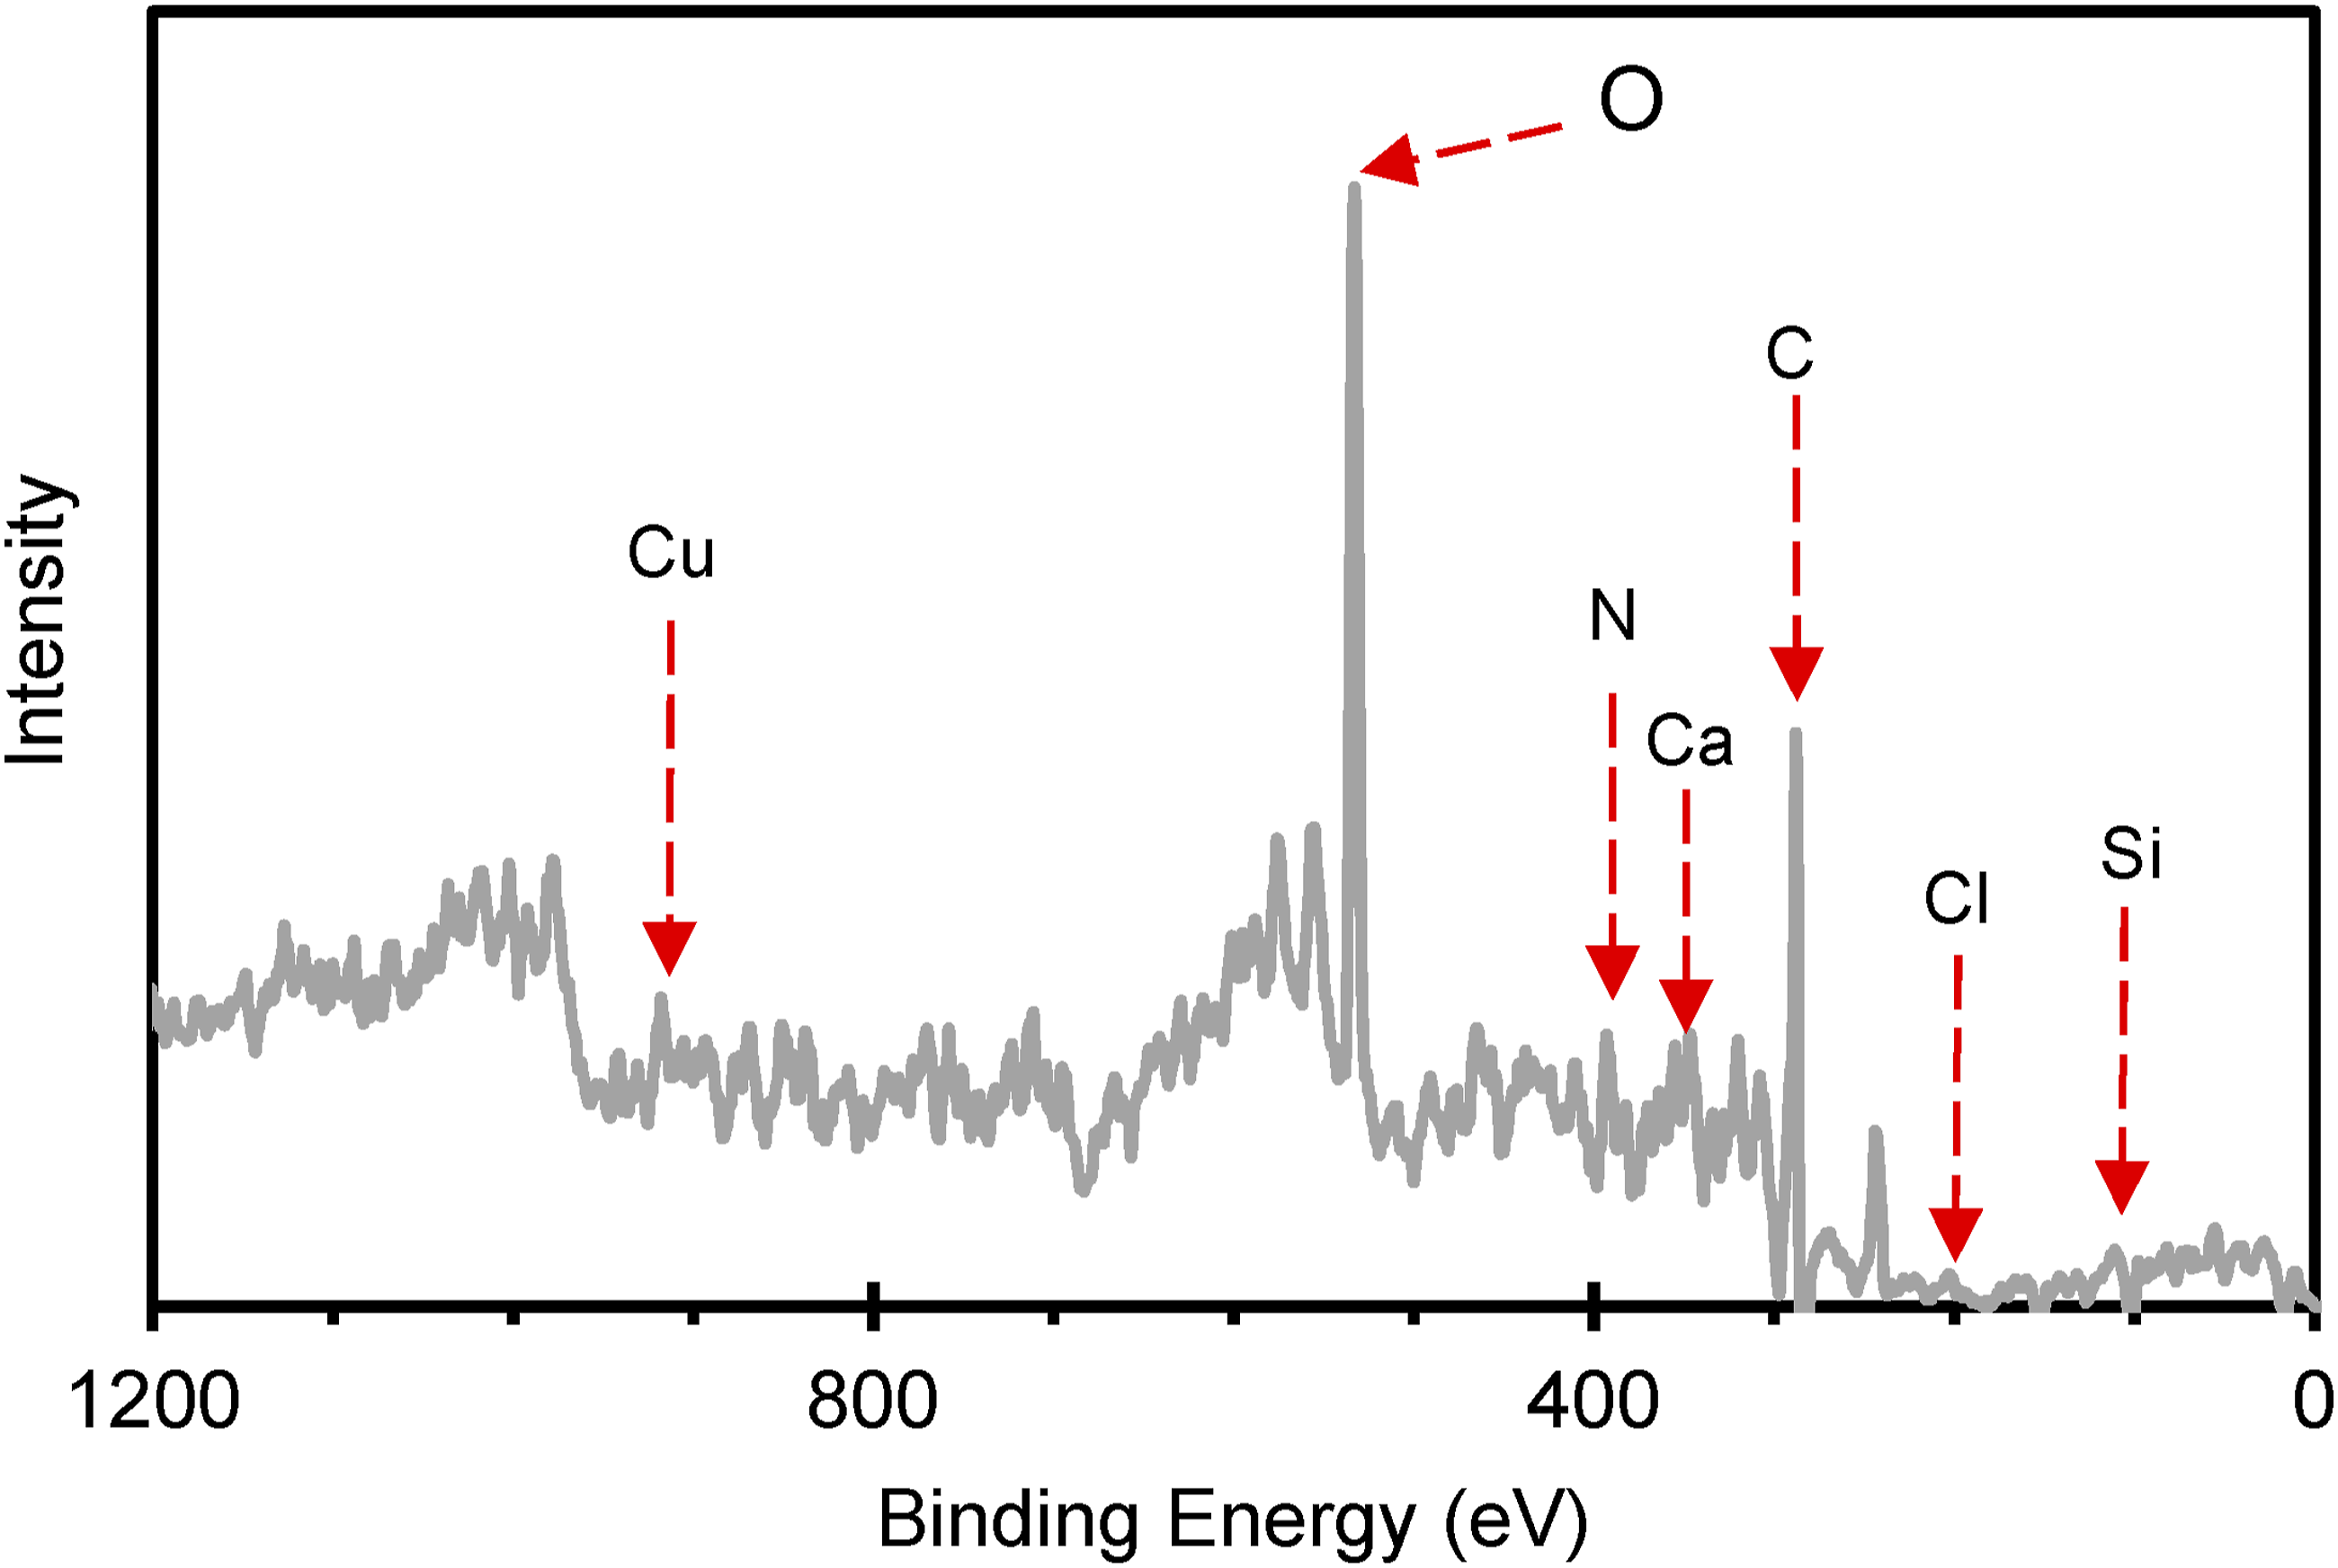
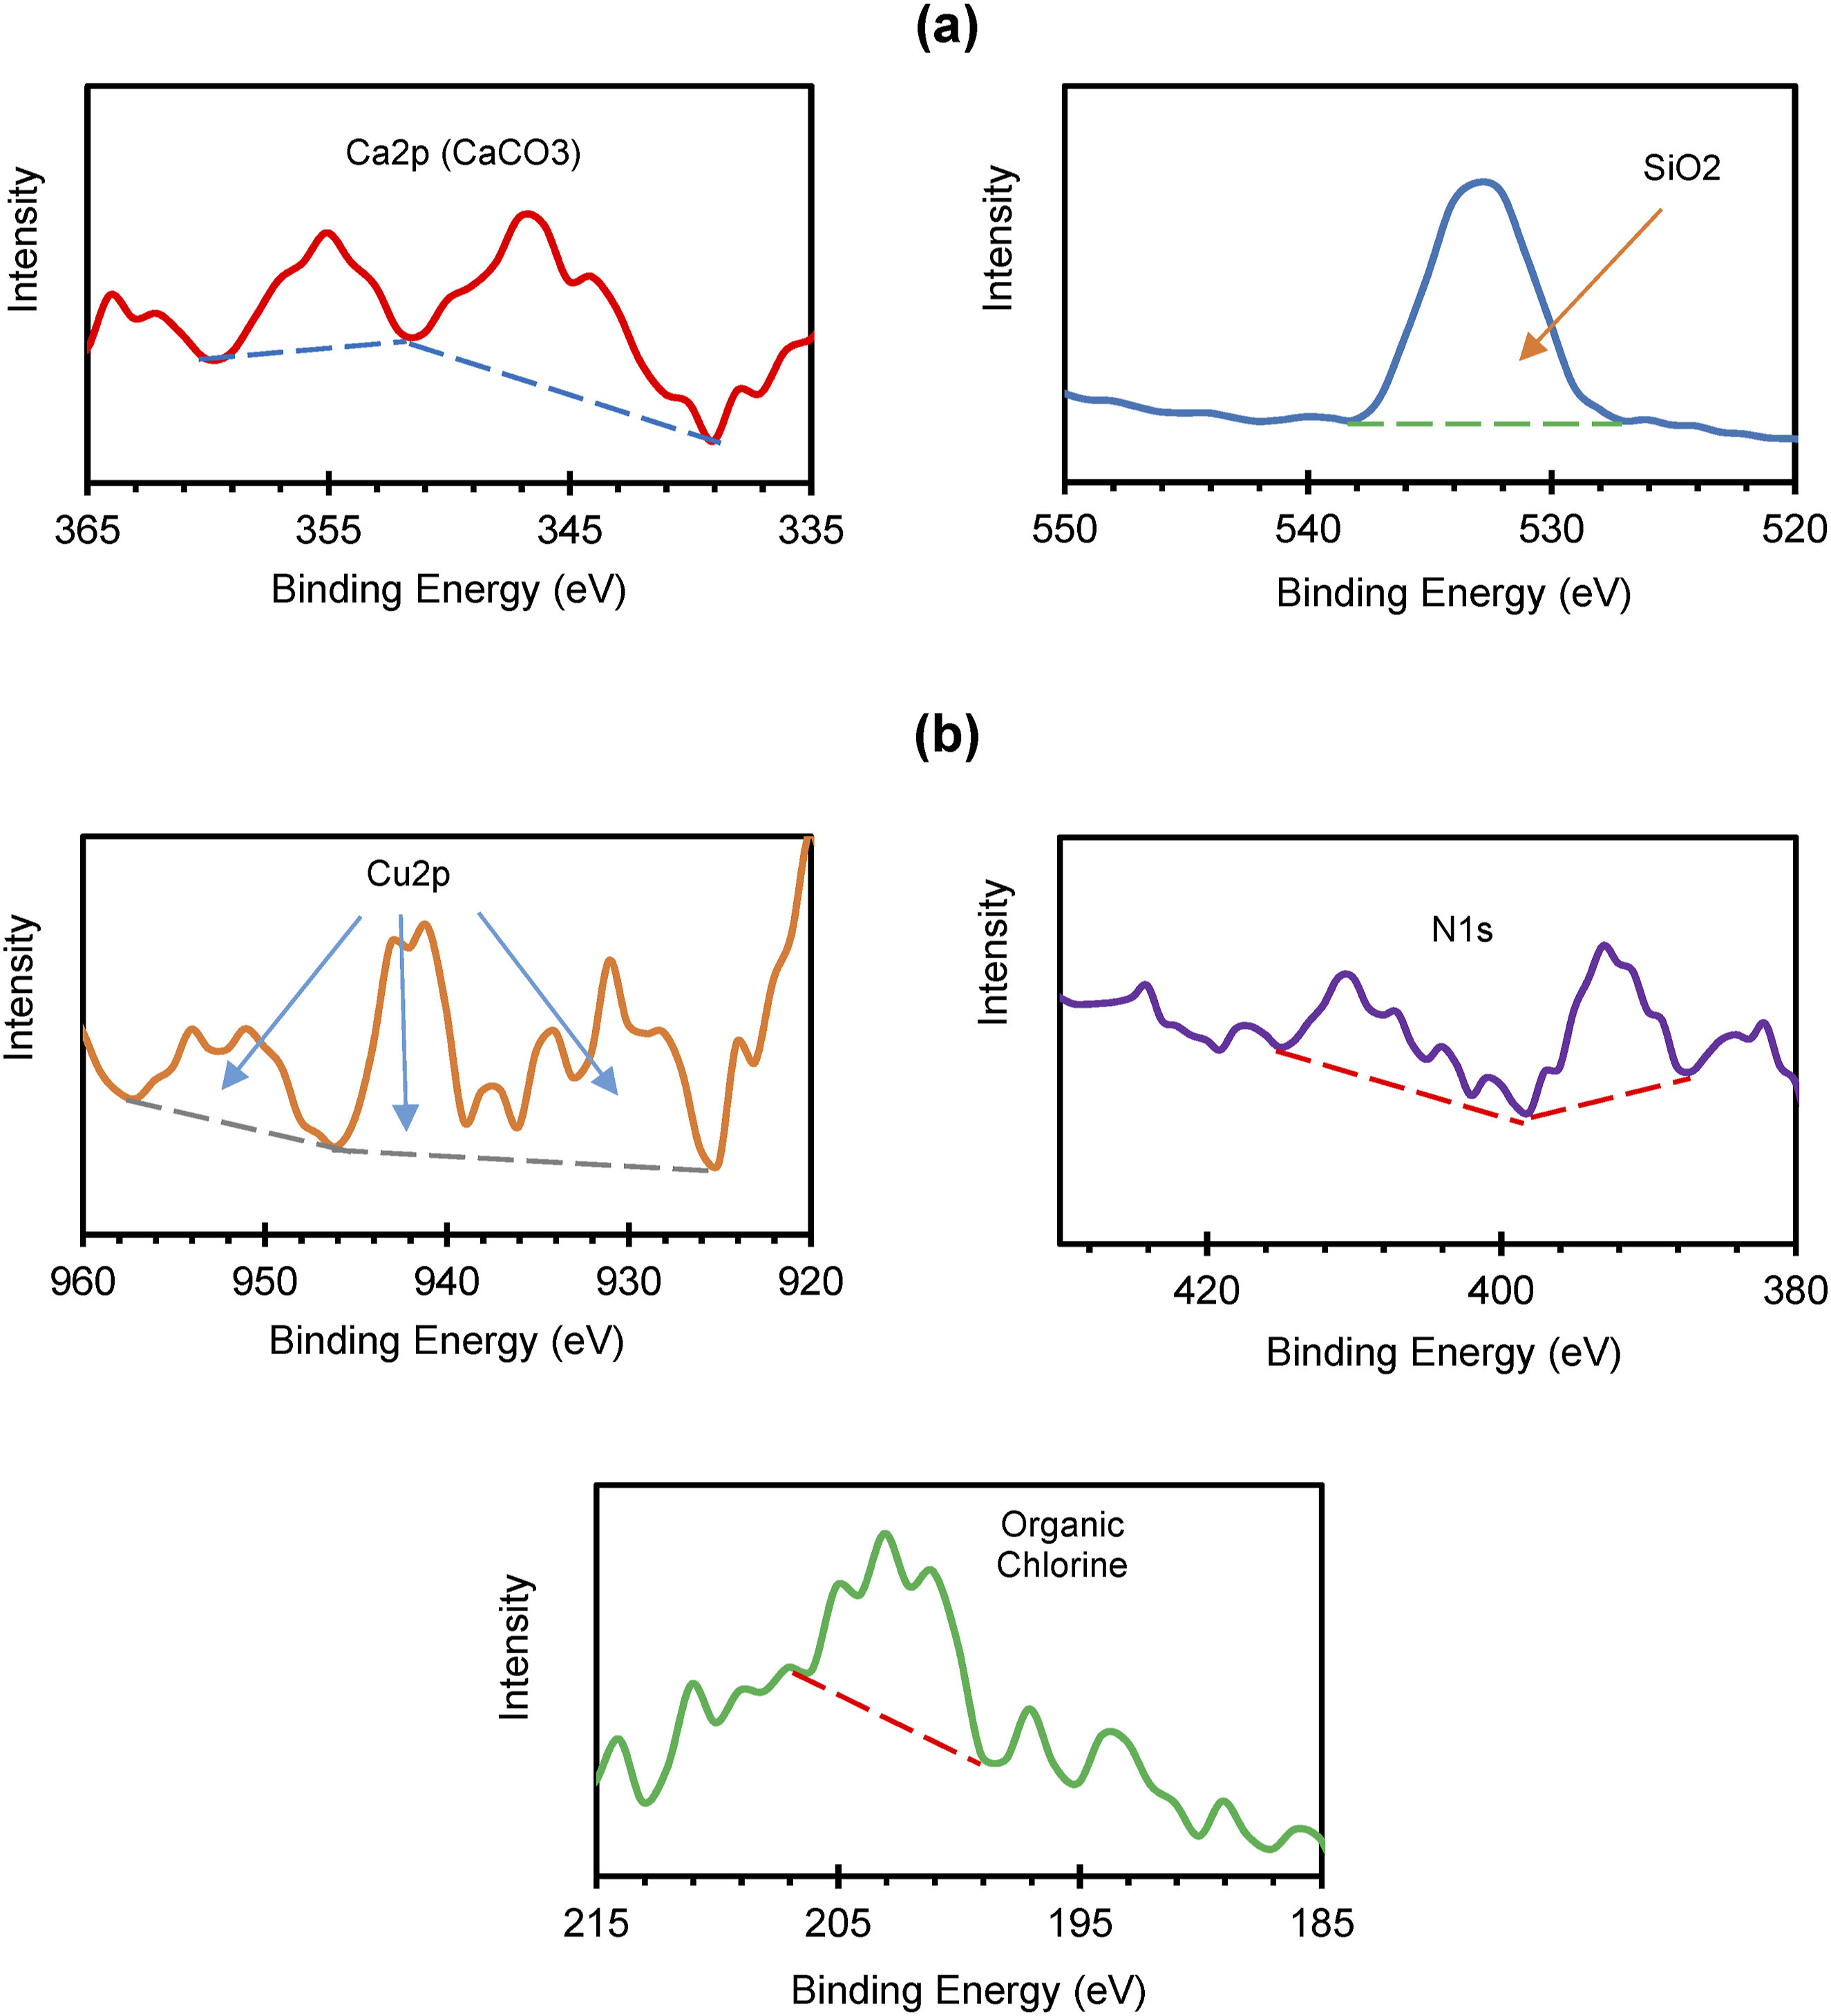
The data obtained from Figure 7 provide three critical insights: (1) the possible presence of silica (SiO2) and calcium carbonate (CaCO3), (2) the detection of organic chlorine, copper (Cu 2p), and nitrogen (N 1s), and (3) the potential association of these elements with a chlorinated copper phthalocyanine dye, whose molecular structure is illustrated in Figure 8.32,43–45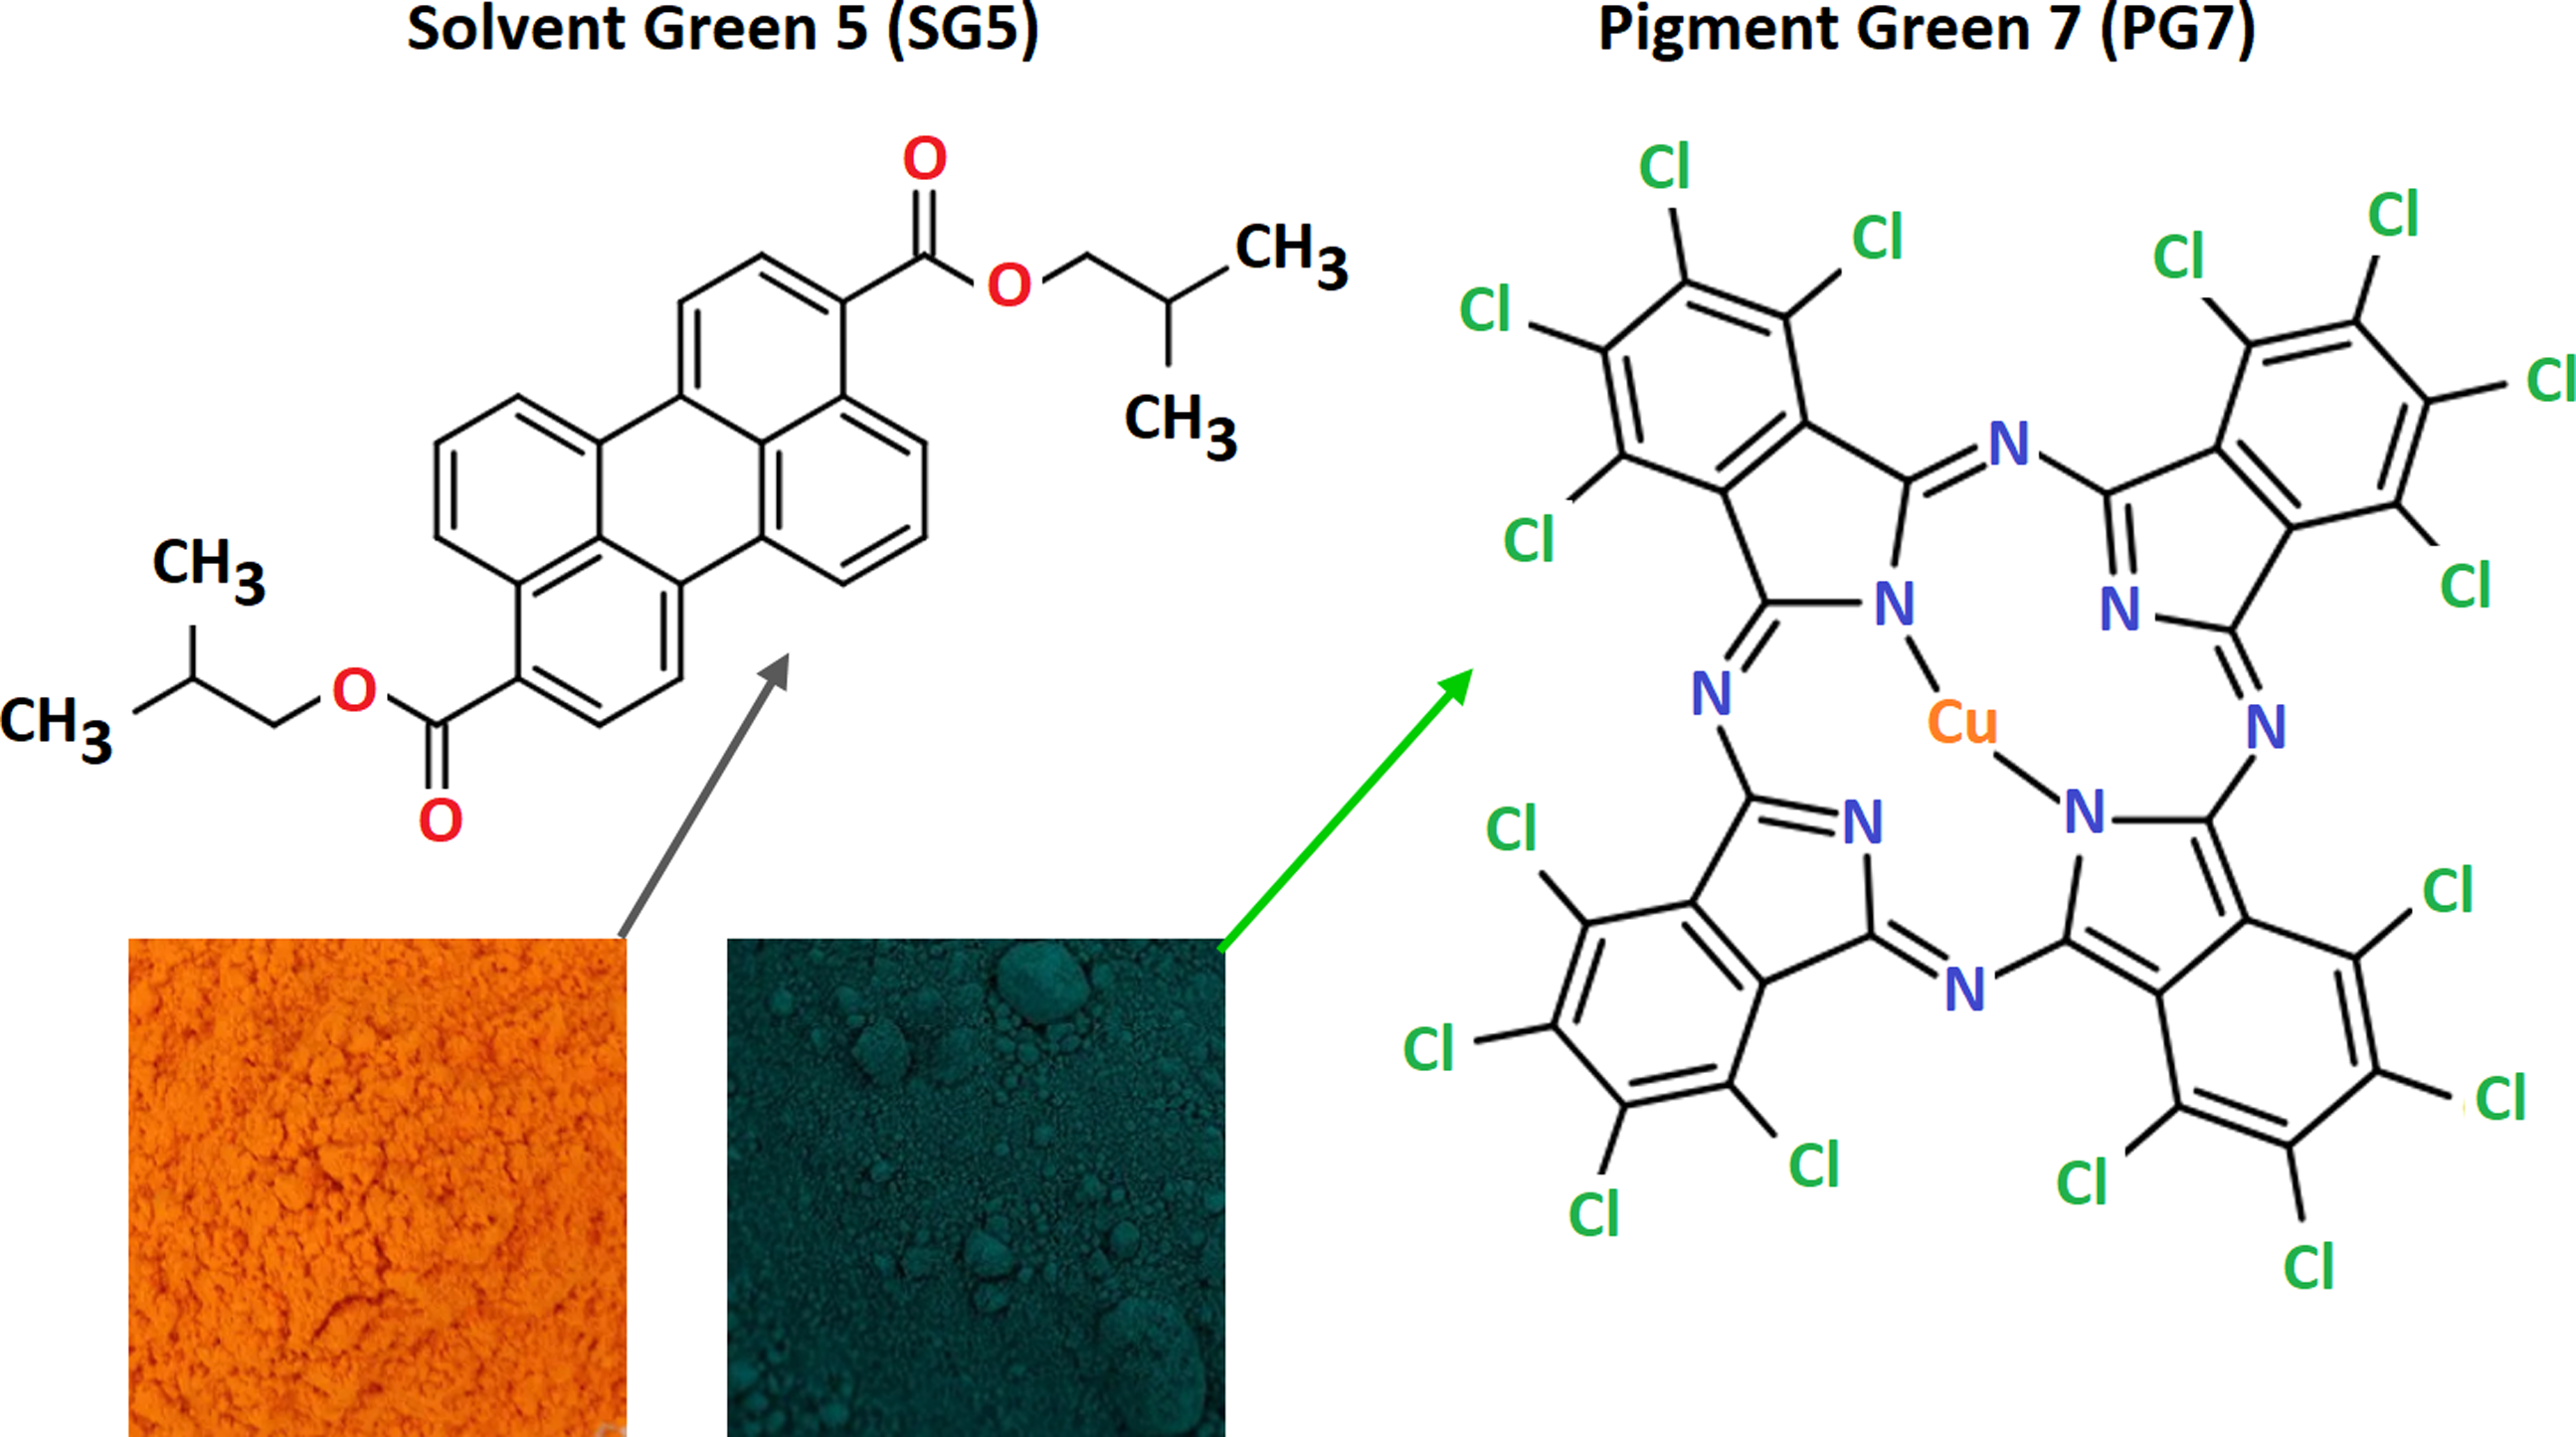
The composition of G-PET-B bottles reveals that their elemental makeup includes carbon and oxygen, fundamental components of PET and its dyes. The presence of traces of copper, chlorine, and nitrogen suggests that specific pigments are incorporated into the material. Small amounts of calcium and silicon indicate the possible existence of CaCO3 and SiO2 nanoparticles, which, as reported for other similar nanoparticles in PET such as glass fibers 37 and titanium dioxide/clay, 38 can lead to an increase in crystallinity and melting point (T m ), and a decrease in apparent viscosity 39 due to the plasticizing effect of the low particle level in the polymer matrix.
One of the green dyes likely present in G-PET-B is Solvent Green SG5, a perylene compound composed only of carbon, oxygen, and hydrogen, with the condensed formula C30H28O4 (Figure 8). The higher intensity of O (1s) and C (1s) peaks in G-PET-B, compared to T-PET-B, reinforces this assumption. This conclusion is further supported by UV-Visible spectroscopy (Figure 5).
Another probable dye in G-PET-B is Pigment Green PG7, a copper phthalocyanine (C32Cl16CuN8), whose molecular structure is displayed in Figure 8. The presence of copper in the XPS spectrum, with two distinctive peaks, aligns with the expected signal of PG7, confirming its likely role in PET’s coloration.30,31 Copper phthalocyanines are widely used due to their high stability and resistance to fading.
Since the concentration of SG5 and PG7 dyes used to impart PET’s green color is exceptionally low (ranging from 0.005% 40 to 0.15%), the detected peaks for chlorine, copper, and nitrogen represent trace elements present at detectable levels, typically measured in parts per million.
Additionally, the detection of calcium and silicon suggests the presence of calcium carbonate (CaCO3) and silica (SiO2), which, at nanometric sizes and low concentrations, could serve as nucleating agents in PET.41,42 This nucleation process enhances crystallization, resulting in small crystal sizes that improve the transparency of PET-B bottles (Figures 6 and 7). Efficient nucleation is especially important during the injection and blow molding of preforms, as it reduces heating time, increasing production efficiency. Furthermore, CaCO3 has been reported to improve PET’s thermal resistance. 42
PET films (PET-SF) recovered from tests
CIELAB colorimetric analysis
Figure 9 presents representative images of the samples obtained in the different G-PET-B dissolution tests and subsequent addition, mixing and filtering of activated carbon. These images, together with the color parameter results reported in Tables 5 and 6, allow quantifying the changes in the color of the PET films after the different treatments. CIELAB colorimetric analysis is a valuable tool that provides objective information on color variations. Samples of G-PET films filtered from the G-PET solution in 60/40 phenol/tetrachloroethane by removing activated carbon. Color results of G-PET samples before and after being thermally crystallized or with solvents. CIELAB colorimetry results of dry solute samples (PET-SF), after filtering the activated carbon.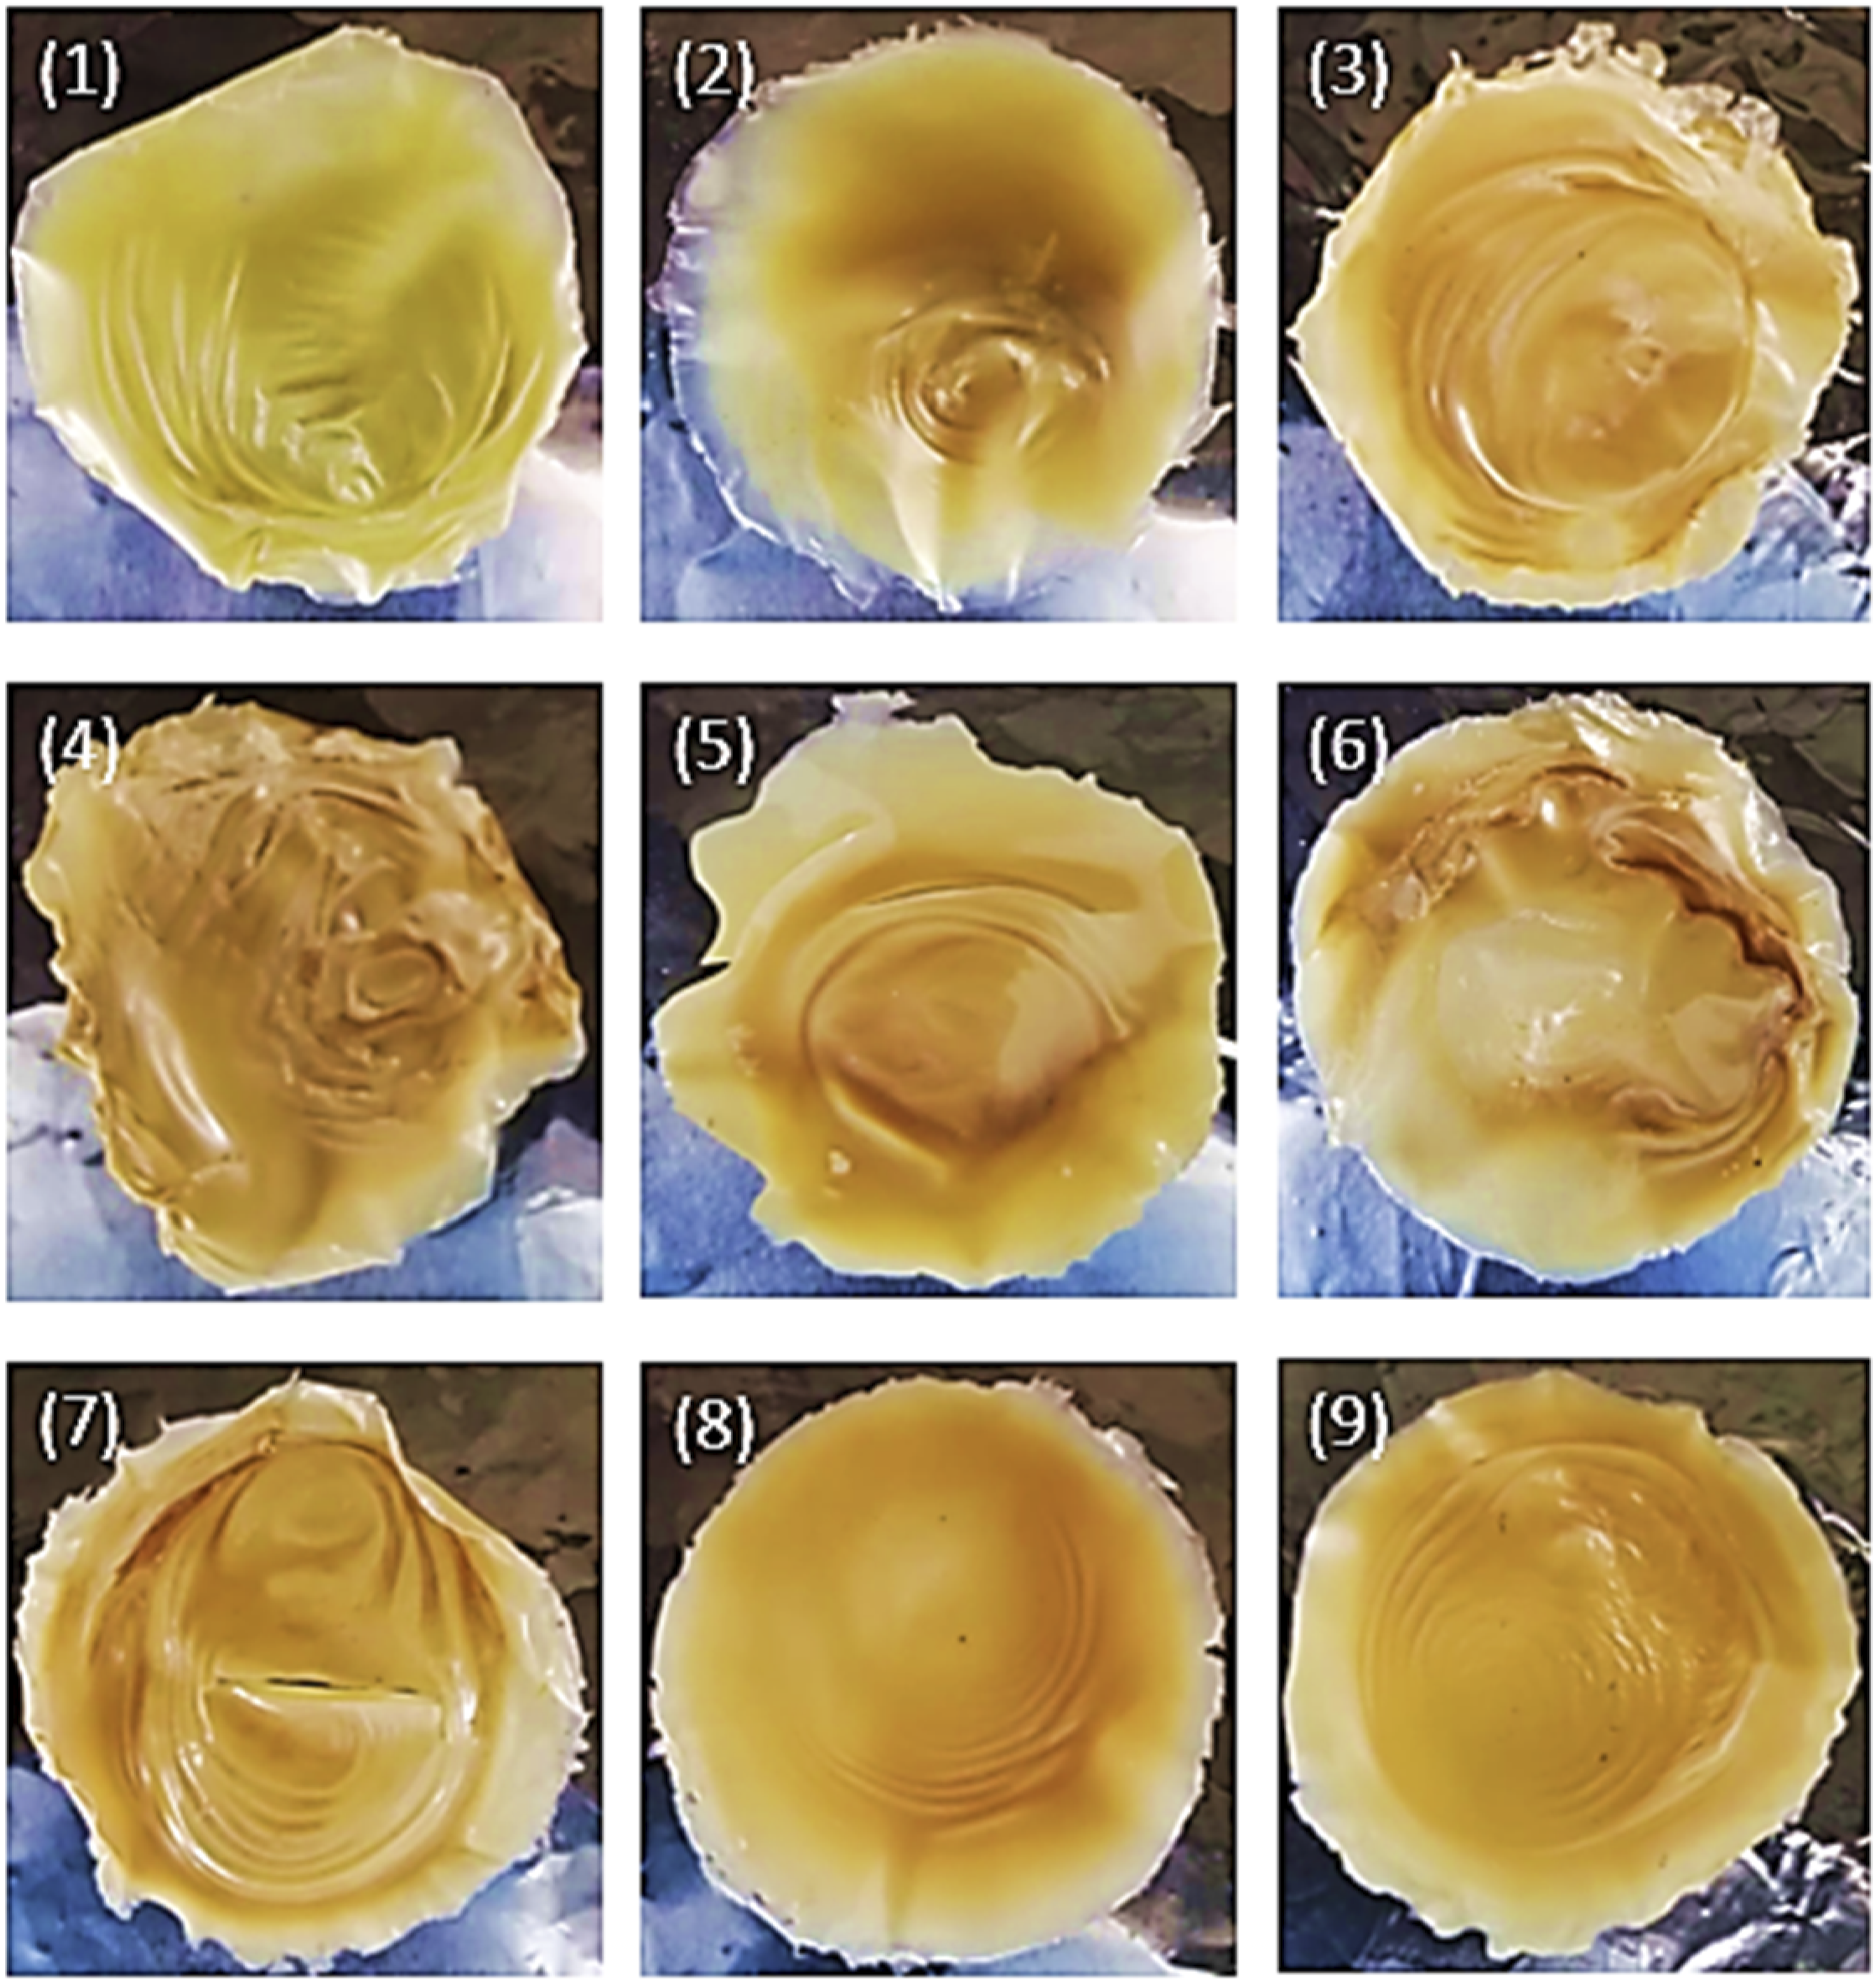
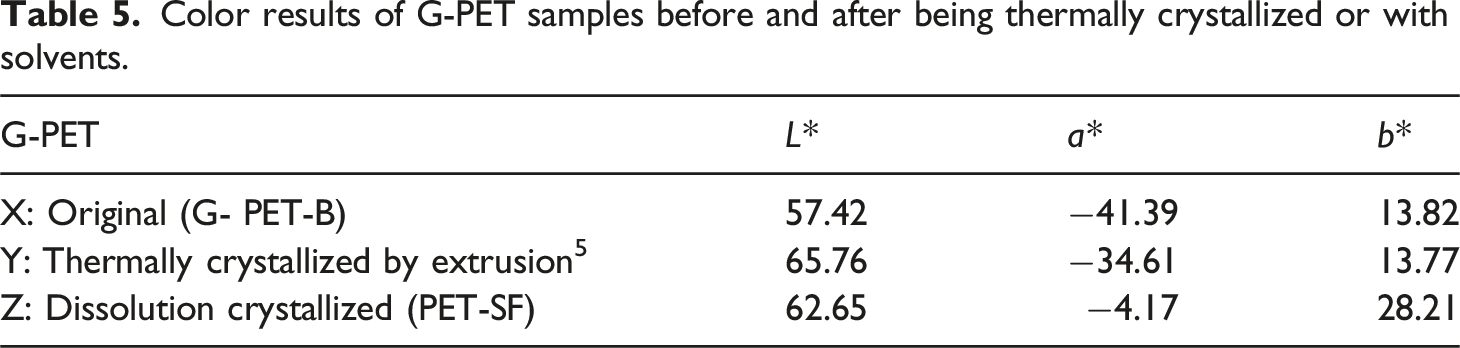
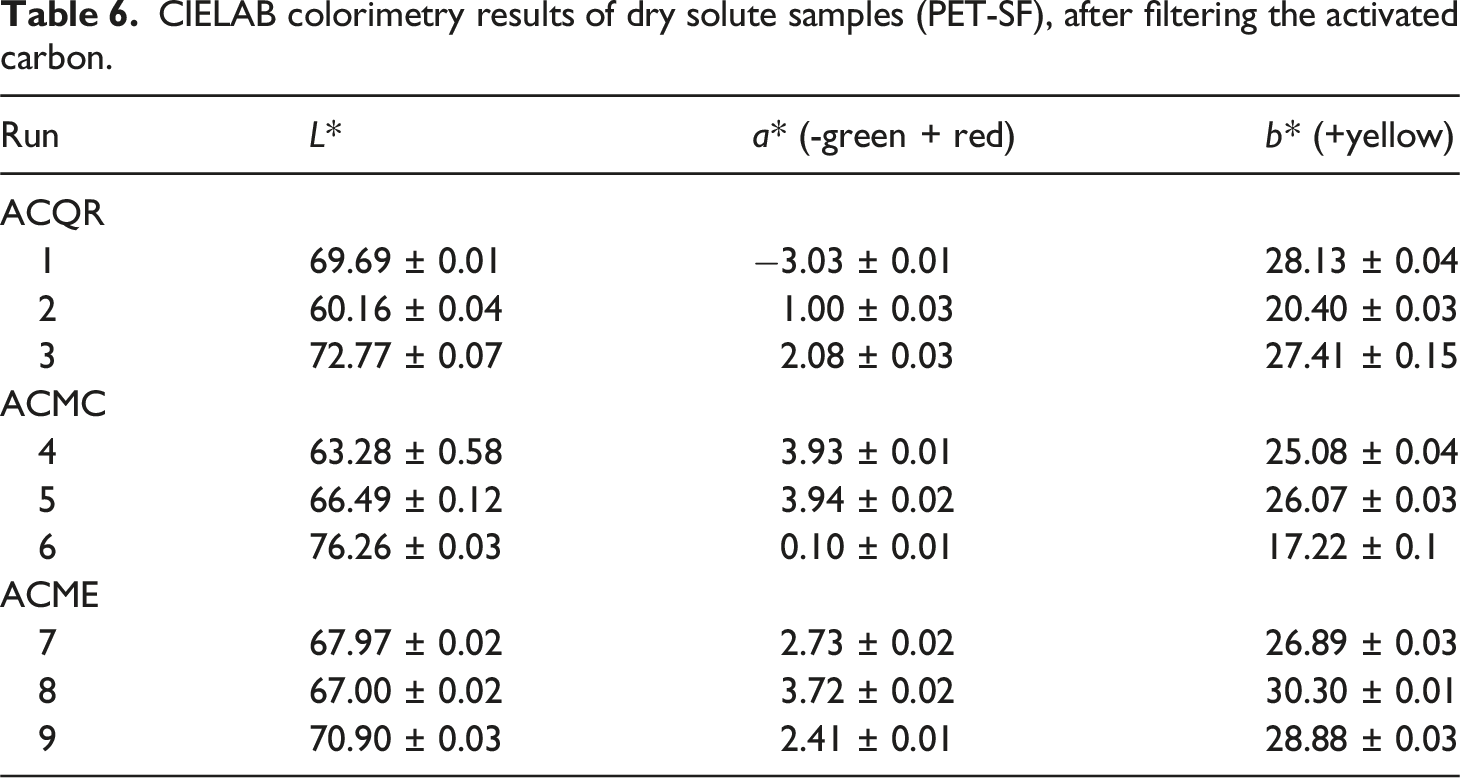
Table 5 shows that G-PET-B (sample X) in its original state has an L* value of 57.42, indicating a medium luminosity and a green-yellow coloration (a* = −41.39 and b* = 13.82). After undergoing thermal crystallization by extrusion, sample Y presents an increase in luminosity (L* = 65.76), suggesting a whitening effect. Additionally, a slight reduction in the green hue (a* = −34.61) and the preservation of its yellow coloration (b* = 13.77) are observed. These modifications in color parameters suggest that the crystallization occurring during the cooling of the molten PET extrudate generates a whitening effect, 46 possibly due to changes in the crystalline structure of the polymer.
The dissolution treatment of G-PET-B, followed by its crystallization (sample Z, Figure 10), results in a more pronounced whitening effect and a shift towards yellow tones. This is reflected in a higher luminosity (L* = 62.65), a significant reduction in the green color (a* = −4.17) and a marked increase in yellow coloration (b* = 28.21) compared to the reference sample (G-PET-B). This phenomenon can be attributed to the partial or total dissolution of the SG5 and PG7 dyes in the G-PET-B dissolved in a hot phenol/tetrachloroethane mixture. G-PET-SF reference sample.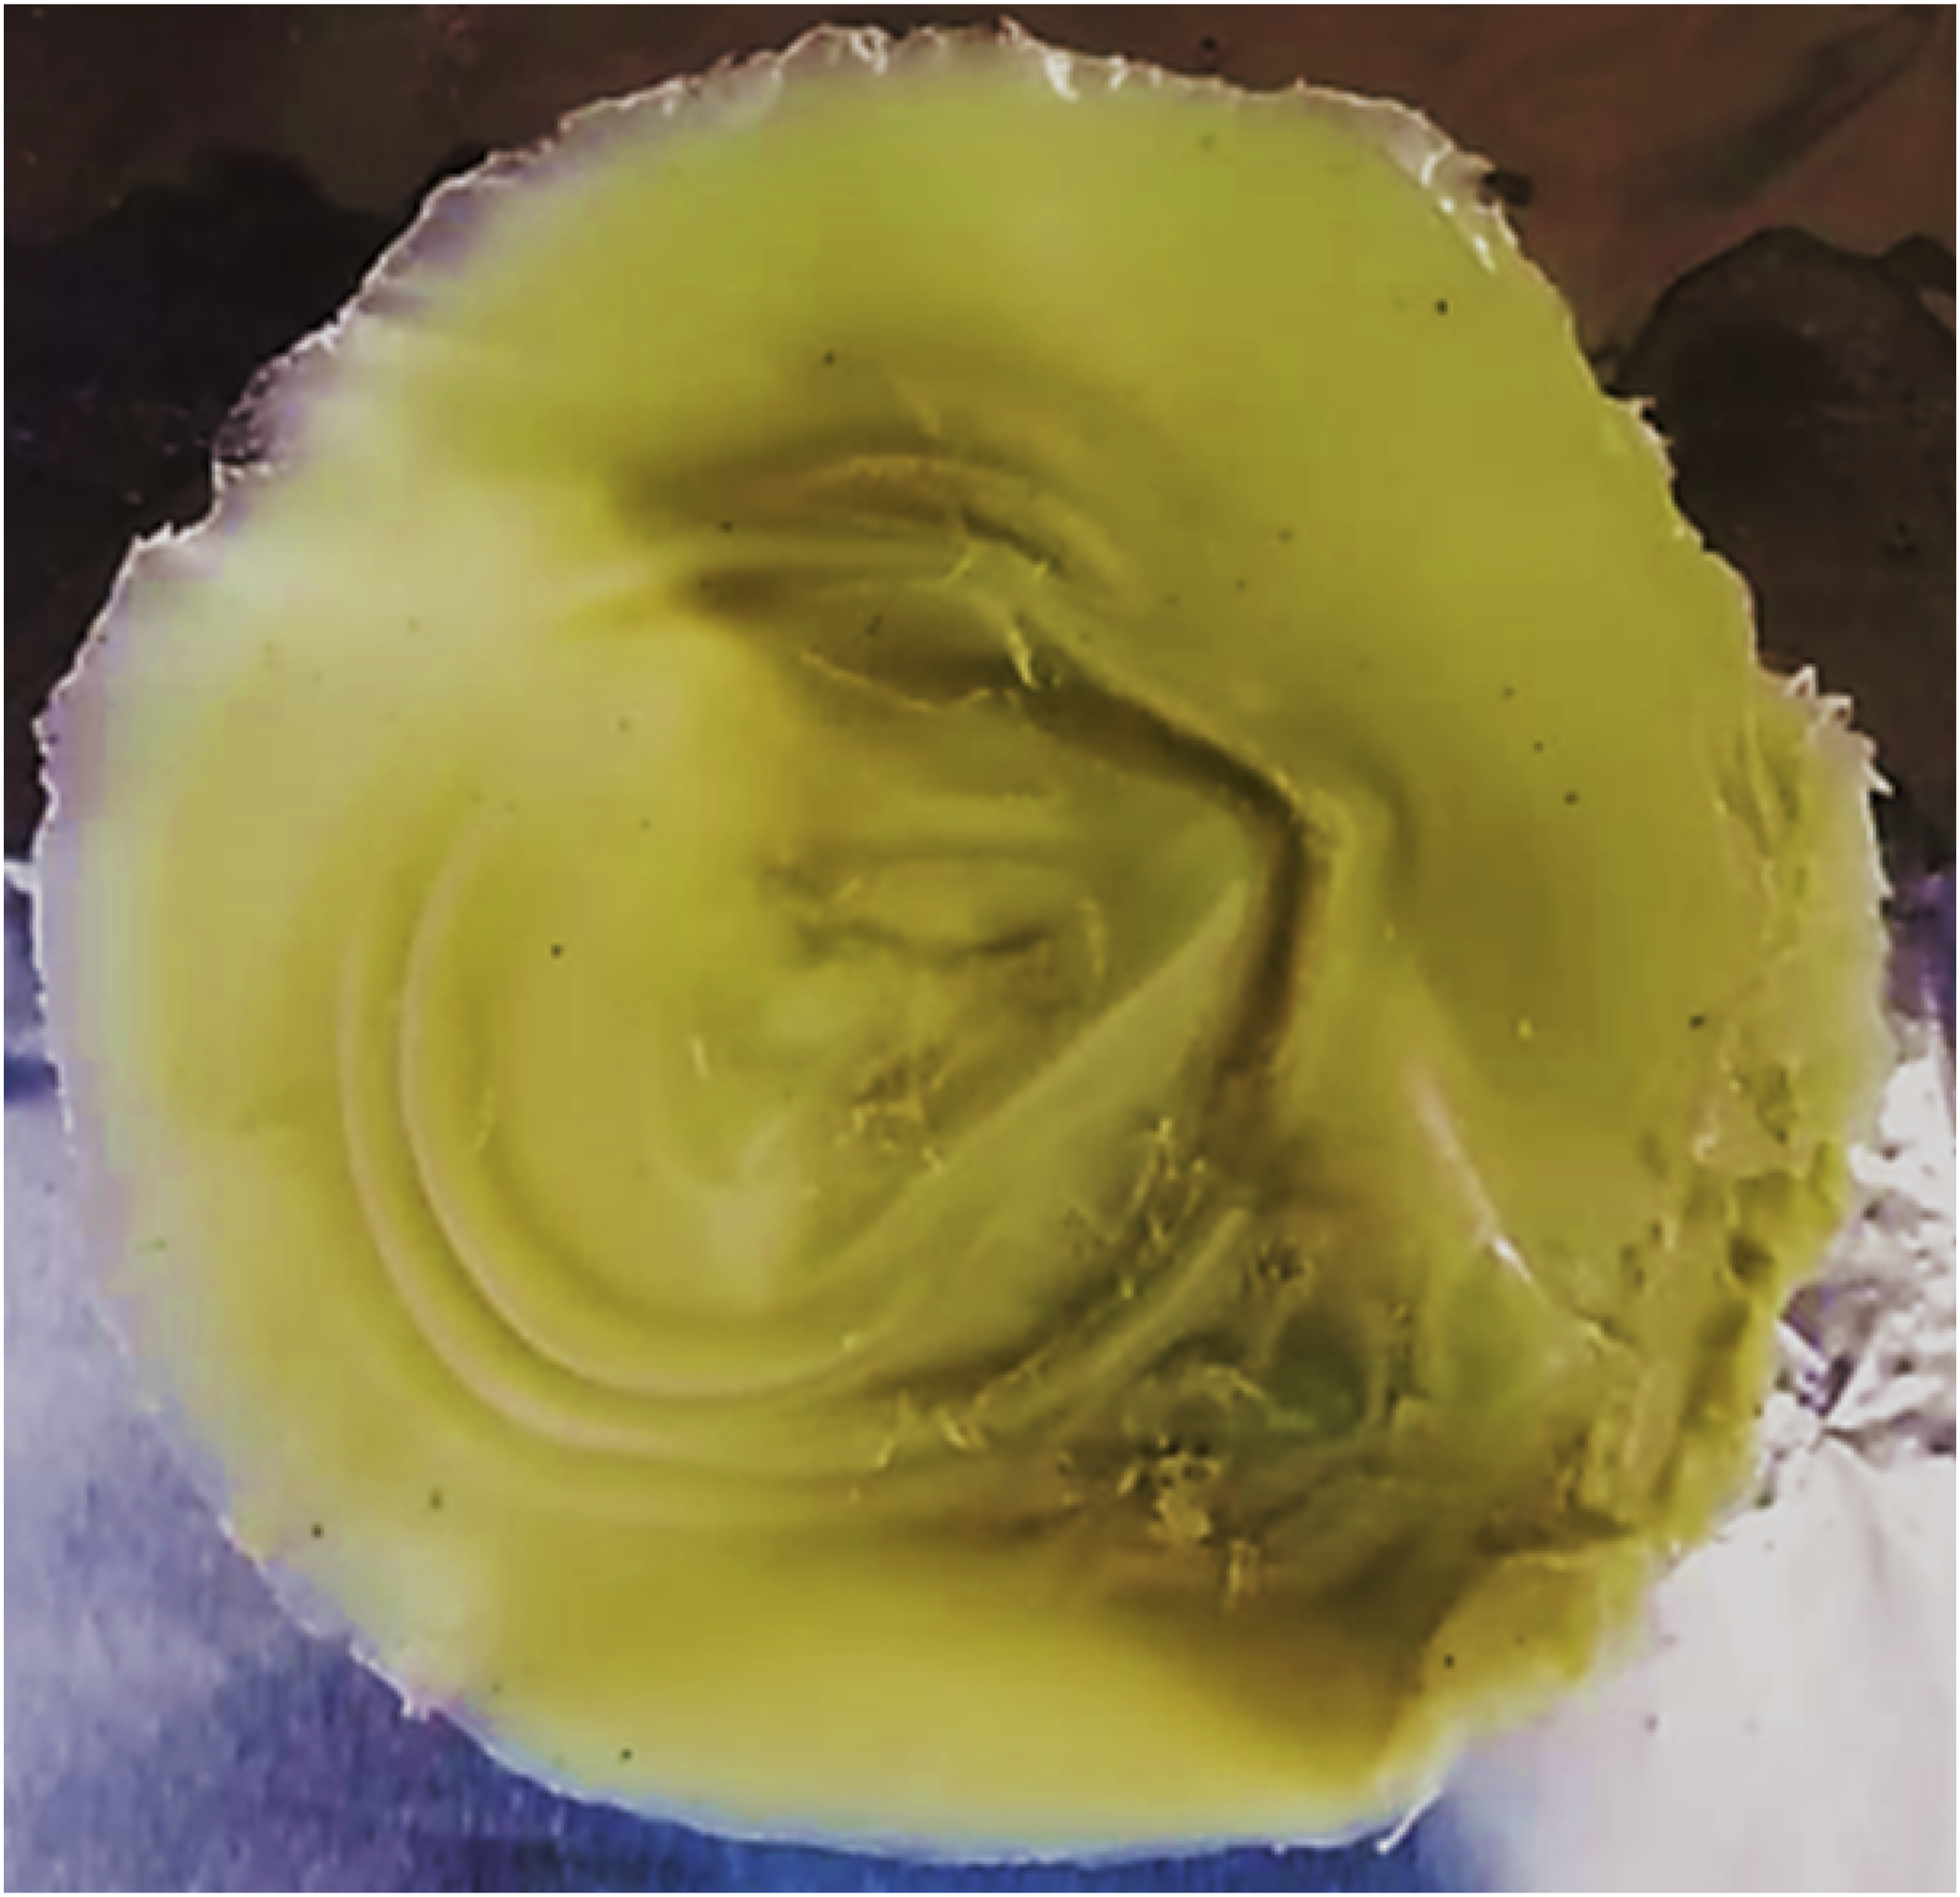
During cooling and solvent evaporation, the SG5 dye crystallizes, returning to its characteristic solid state, exhibiting its usual yellow-orange color, as observed in its commercial form.40,43 The aggregation of Pigment Green PG7 suggests that the remaining green hue in the mixture arises from this pigment, potentially indicating a significantly lower PG7 content relative to SG5. Aggregation refers to the formation of clusters of PG7 molecules, which may affect both coloration and dispersion within the PET matrix.
The SG5 dye exhibits fluorescence when in a plastic exposed to UV light.32–34 Fluorescence is a phenomenon in which a substance absorbs light at a specific wavelength and emits light at a longer wavelength. This phenomenon was confirmed in the green PET bottle, which showed a color change when exposed to sunlight. Fluorescence manifested itself as a shift towards greater green absorption, resulting in a much more yellow and less green, green-yellow product. This color change reinforces the hypothesis that one of the dyes present in G-PET-B is Solvent Green 5. The presence, although minimal, of Green Pigment PG7 ensures the green coloration of the PET bottle, regardless of the presence or absence of UV light, since this pigment does not exhibit fluorescence.
When comparing the color parameters of sample Z with the average values obtained from G-PET-B samples treated with different ACs (Table 6), a general whitening is observed, evidenced by an increase in luminosity (Δ L* = 5.63). An increase in the a* value is also observed (Δ a* = 6.05), implying a shift from a weak green color to a weak red color, and a slight decrease in the yellow coloration (Δ b* = −2.61). These changes in the color parameters explain the orange color observed in almost all the experimental samples (Figure 9). The final yellow-orange color is closer to that of Solvent Green SG5 in its commercially presented solid state,40,43 suggesting that this dye is the predominant component in the treated samples. The possible almost total adsorption of Green Pigment PG7 on the ACs also contributes to this result.
It is hypothesized that the joint action of the solvent and activated carbons contributed significantly to the coloration observed in the treated samples. Partial or complete adsorption of the PG7 pigment on the ACs is suggested, since the weak green coloration observed under the same conditions with solvents alone disappears completely after treatment with carbons. It is possible that the small amount of unadsorbed PG7 was masked by the whitening of the PET or by the predominant color of the orange Solvent Green 5 (SG5) dye in its crystallized form. Since the final color of the activated carbons is mostly black and the green coloration has disappeared from the dissolved and solidified PET-SG5 phase, it is likely that the amount of PG7 present in the green PET bottles is considerably lower than that of SG5.
Solubility parameters of solvents, PET and possible dyes of G-PET-B.
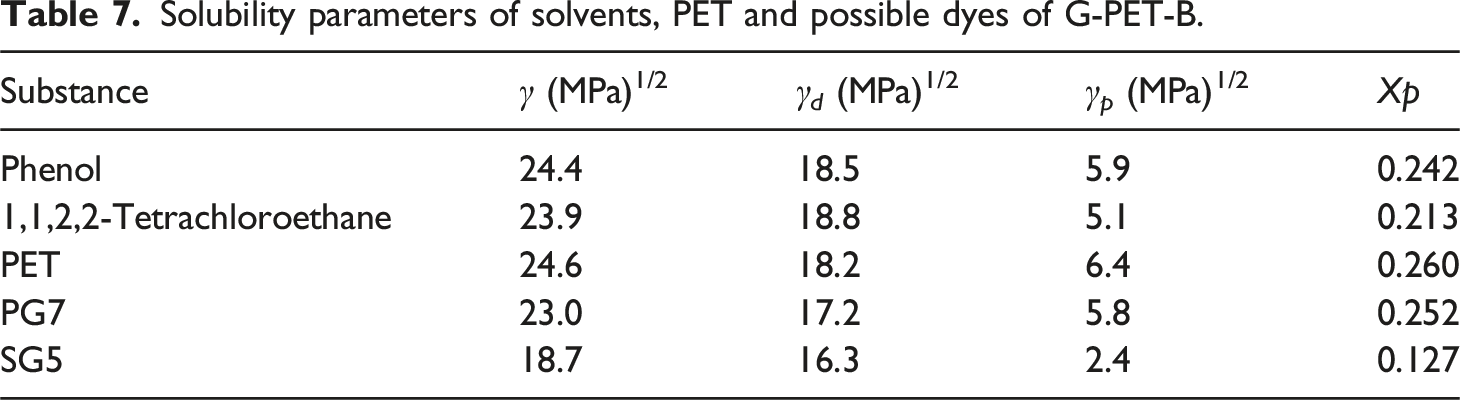
Regarding adsorption, the PG7 pigment, being more polar, shows a greater affinity to adsorb on the surface of the activated carbon QR, whose zero charge point (ZCP) is 2.37. The ZCP indicates that, in a neutral environment (pH six to 7), the carbon surface tends to have a positive charge, which favors the adsorption of molecules with anionic or polar character. The molecular structure of PG7, with polar functional groups such as tertiary carbons linked to chlorine and nitrogen atoms, facilitates this adsorption. The polarity of PG7, with a polar component of 5.8 in its solubility parameter, reinforces the hypothesis that this pigment has a greater affinity for positively charged surfaces, such as that of the ACQR.
On the other hand, activated carbons AC and MC, with charge points close to 8.0, have mostly apolar surfaces under neutral conditions, such as those predominating in the phenol/tetrachloroethane solvent mixture. This suggests that these carbons can adsorb some amount of Solvent Green 5 (SG5) dye, a less polar dye whose solubility is dominated by dispersive interactions. SG5, with a low polarity (2.4) and a predominantly apolar character (dispersiveness of 16.3), is more prone to be adsorbed by activated carbons MC and AC due to the apolar-apolar affinity between the carbon structures and the dye. The lower polarity of these carbons, compared to ACQR, makes them more selective towards apolar or slightly polar molecules such as SG5, interacting mainly through dispersive Van der Waals forces.
Finally, it is relevant to consider the possibility that some PET may have been adsorbed on the ACs. PET, due to its predominantly apolar nature, could interact with activated carbons MC and ME, which have more neutral or slightly negative surfaces (PZC close to 8.0). In these carbons, dispersive interactions between the apolar chains of PET and the surface of the ACs could initially facilitate the adsorption of low molecular weight chains, and as the concentration of activated carbon increases, adsorption of higher molecular weight chains could also occur. However, due to the larger molecular size of PET compared to the dyes, the adsorbed amount of PET is expected to be lower. In the case of ACQR, with a PZC of 2.37 and a predominantly positive surface at neutral pH, PET adsorption would be null or insignificant, since this carbon has a higher affinity for polar compounds such as PG7. Thus, low molecular weight PET chains (e.g., oligomers) could be preferentially adsorbed on activated carbons MC and ME carbons, where they would not significantly interfere with the adsorption of dyes, with SG5 being the main compound adsorbed on these carbons.
Statistical analysis
Statistical analysis of the results of the nine experimental runs reveals that the type and content of activated carbon, as well as the mixing time, play an active role in the interaction between PET and the dyes PG7 and SG5, present in the hot 60/40 phenol/tetrachloroethane solvent mixture. This analysis allows determining whether the observed effects are statistically significant or whether they could be explained by chance. Dissolution, adsorption-desorption, aggregation and crystallization phenomena are observed, which depend on the properties, quantities, temperature and mixing time of the elements involved. The complexity of these interactions results in a heterogeneous final distribution of the components. This heterogeneity, in turn, causes changes in the color parameters analyzed, where one or several of the independent variables of the study statistically affect the results.
The normalized color data reveal that the changes induced by the activated carbons are remarkably smaller compared to the effects of the solvents (Table 5). This suggests that the ACs adsorbed mainly PET dyes and oligomers. As a result, a slight average decrease in the original green (-a*) and yellow (b*) color parameters is observed, specifically by 14.5% and 19.8%, respectively. The adsorption of these compounds by the ACs reduces the intensity of the colors present in the sample, which explains the variation in luminosity observed in the treated samples. In this context, an average increase in luminosity of 9.6% is recorded, the magnitude of which depends on the type and amount of activated carbon used, as well as on the mixing time. These factors influence the amount of dyes and oligomers that are adsorbed by the ACs, which in turn affects the final luminosity of the sample.
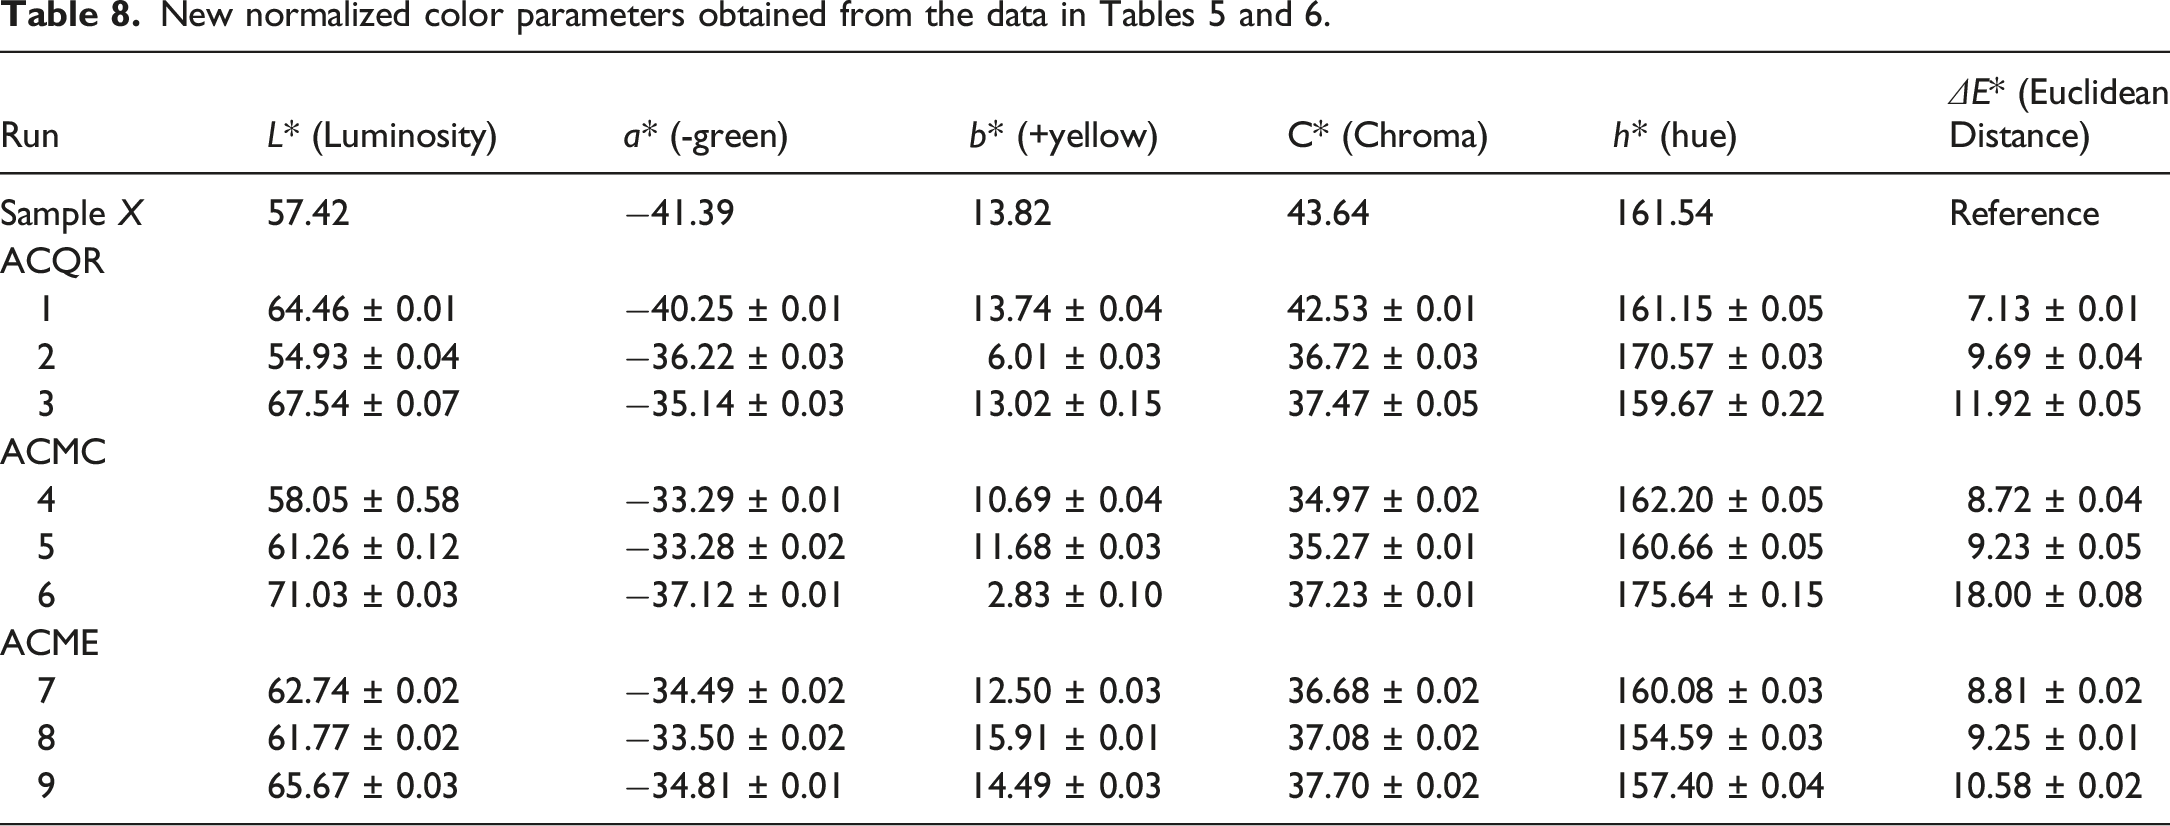
To evaluate the color change resulting from the treatments, the CIELAB color parameters (Table 8) were compared to those of the untreated green PET (G-PET-B, used as the reference sample, Table 5) by calculating the Euclidean distance (ΔE*). This value represents the total color difference between the original green PET and the treated samples and were interpreted based on established thresholds of human color perception: a ΔE* less than one indicates an imperceptible difference; values between one and 2, a just noticeable difference; values between 2 and 10, a small to medium perceptible difference; and values greater than 10, a large, clearly perceptible difference. For instance, at the shortest mixing time (2 min), the treatment with 2.5% activated carbon QR produced the lowest color change (ΔE* = 7.13), a perceptible difference, while the treatment with 10% activated carbon MC resulted in the highest color change (ΔE* = 18.00), a significantly different color (see Figure 9), highlighting the influence of both activated carbon type and concentration, highlighting the influence of both activated carbon type and concentration.
The results are presented in Figure 11(a), where it is observed that the only variable that statistically affected the change in ΔE* was the activated carbon content (56.15%). The increase in the AC content increases the Euclidean distance, suggesting that a higher amount of activated carbon causes a greater change in color. In contrast, the type of AC and the mixing time did not show statistically significant effects on this value. While the type of activated carbon suggests that ACMC was the one that showed the greatest change, the effect of the mixing time was not clear. Experimental run 6 (10% ACMC and 2 min of mixing) showed the largest change in ΔE* value, which is consistent with the hypothesis that ACMC has the highest adsorption capacity for PG7 dye. The higher adsorption of PG7 translates into a greater change in color, which is reflected in a higher ΔE* value. In contrast, experimental run 1 (2.5% ACQR and 2 min of mixing) produced the smallest change, suggesting a lower adsorption of PG7 in this case and a greater green hue. Experimental variables effect on: (a) Euclidean distance; (b) luminosity; (c) chroma; and, (d) hue; using Anova analysis.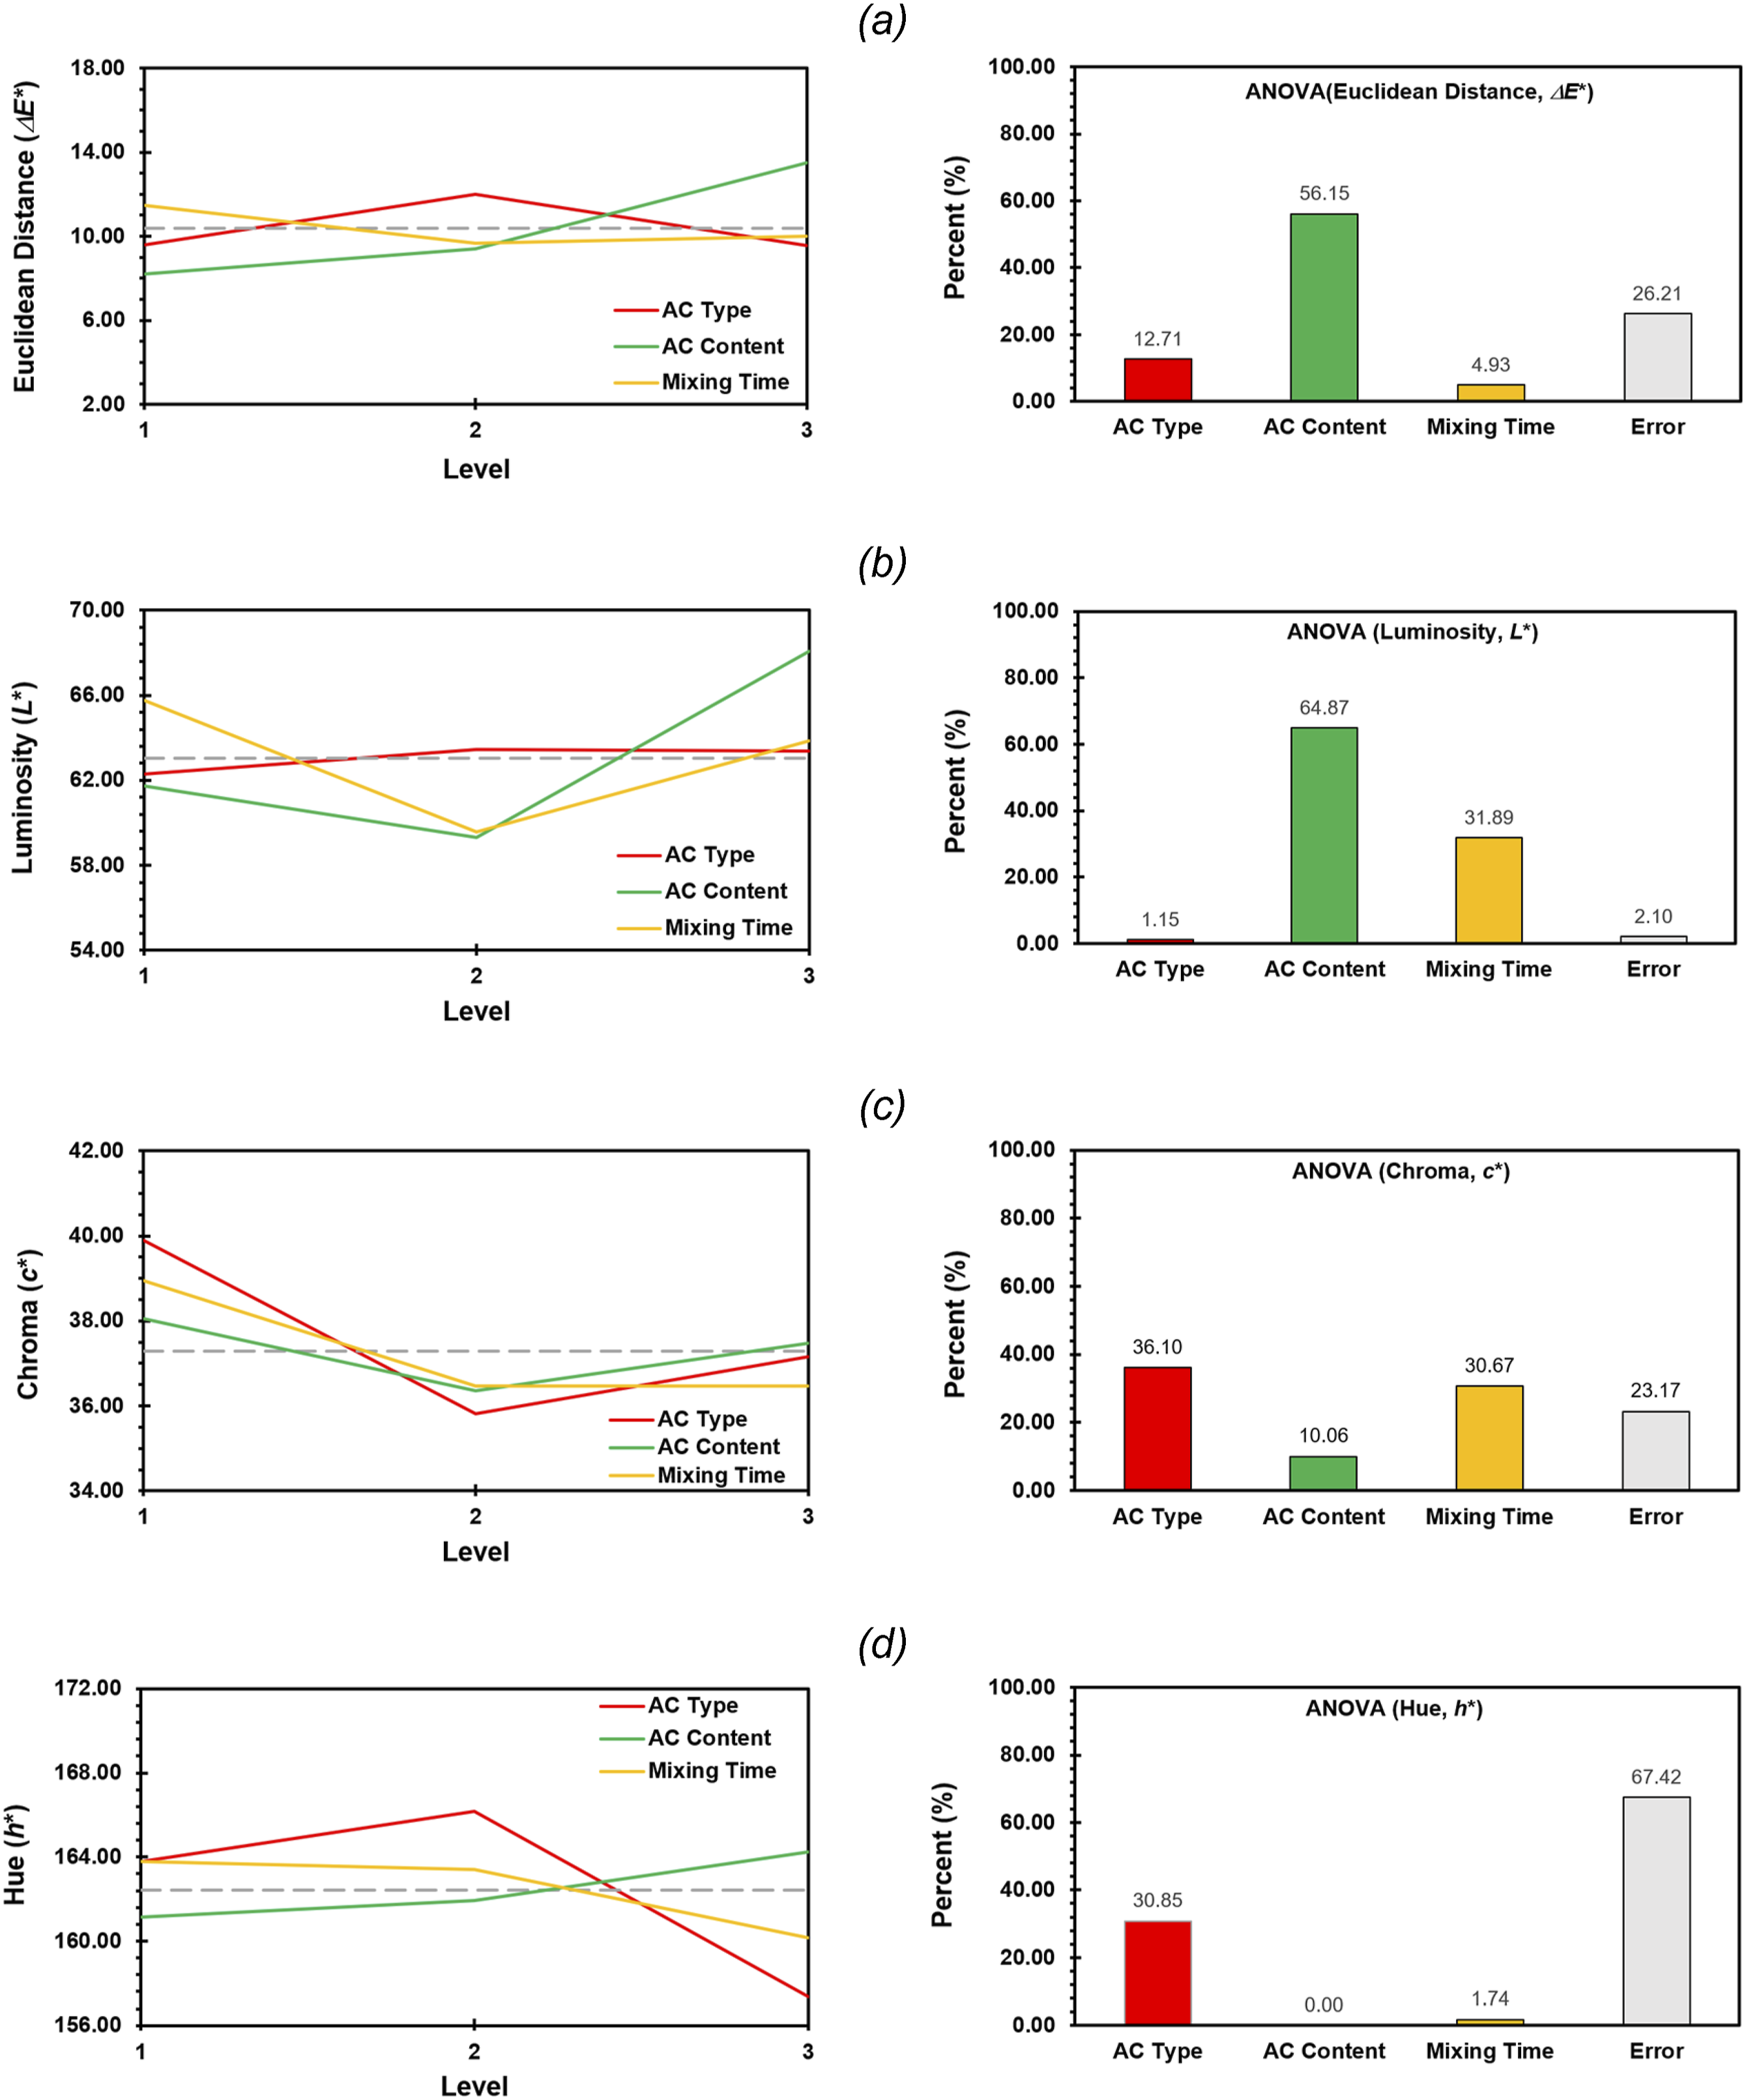
In terms of luminosity, an increase was observed statistically associated with increasing activated carbon content (64.87%) and reducing mixing time (31.89%), as shown in Figure 11(b). Higher AC content provides more adsorption sites for PET oligomers and dyes, resulting in higher adsorption and hence increased luminosity. Similarly, shorter mixing time may limit the adsorption of dyes, also contributing to higher luminosity. Individually, experimental run 6 (10% ACMC and 2 min mixing) showed the highest luminosity, suggesting a possible higher adsorption of pigment PG7. The higher luminosity in this experimental run indicates that ACMC is the most effective activated carbon for adsorbing pigment PG7. In contrast, experimental run 2 (5% ACQR and 4 min mixing) exhibited a decrease in luminosity compared to the reference value (G-PET-B), indicating a lower adsorption of the PG7 pigment in this case.
The color saturation c*, which represents the intensity or purity of the color, reveals that all the experimental treatments caused a decrease in saturation. This decrease is due to the adsorption of the PG7 and SG5 dyes by the ACs, which reduces the amount of dyes present in the sample and, therefore, decreases the color intensity. It was observed that the color saturation is only statistically affected by the type of AC (36.10%) and the mixing time (30.67%), in relation to an increase in the latter, as shown in Figure 11(c). Therefore, if the objective of the treatments was to decrease the color saturation, the activated carbon MC is the one that produces the greatest decrease, followed by the activated carbon ME. On average, the samples with an intermediate mixing time of 4 min were the ones that reached the lowest saturation. Experimental run 4 (2.5% ACMC at a time of 4 min) was the one that presented the lowest saturation. These results reinforce the hypothesis that ACMC is the activated carbon with the highest adsorption potential for the PG7 pigment, since it is the one that produces the greatest decrease in color saturation. The greater adsorption of PG7 frees the solvent SG5 dissolved in the filtrate, which is observable once crystallized in the PET, giving rise to the yellow-orange colors described above (see values of a* and b* in Table 6).
The h* hue, which represents the color angle in the Lch color space, did not show significant changes in relation to the reference sample (Table 8). This is reflected in the absence of a statistically significant effect of the variables studied on this parameter (Figure 11(d)). Nevertheless, a slight increase in the h* hue was observed in some samples treated with activated carbons QR and MC, specifically in experimental runs 2, 4 and 6. This shift towards a greener color hue suggests that certain fractions of adsorbed dye could contribute to the increase in luminosity observed in these samples. It is important to note that the highest increase in hue (8.74%) was again recorded in the samples corresponding to experimental run 6 (10% ACMC and 2 min of mixing), which reinforces the observation that this combination of AC and mixing time seems to have a particular effect on the color properties of the green recycled PET samples.
TGA of PET, G-PET-B and PET-SF
Figure 12 shows the thermograms for T-PET-B and G-PET-B. In the first region, extending to 200°C, a weight loss of between 8% and 10% is observed. This initial weight loss can be attributed to the presence of volatile compounds, such as moisture and residual solvents, which could have been trapped in the PET matrix during the treatment process with the solvent pair. Subsequently, a plateau is observed that is maintained until the onset of significant degradation, which occurs between 400°C and 500°C.
39
In this range, the greatest mass loss occurs, reaching a minimum of 60%, with a final residual weight between 16% and 18%. This process is related to the depolymerization of the material, during which chemical bonds in the PET chains are broken, generating monomers, oligomers and other volatile compounds, such as acetaldehyde, terephthalic acid, cyclic anhydrides and ethylene glycol. These volatile compounds evaporate or sublimate, contributing significantly to the mass loss observed in the TGA analysis. In addition, depolymerization produces organic compounds containing oxygen, which favors thermal-oxidative degradation at certain temperatures, generating small amounts of CO and CO2. From this temperature until the end of the test, at 650°C, the weight loss decreases considerably, ranging from 1% to 17%. TGA degradation curves of T-PETB and G-PETB samples.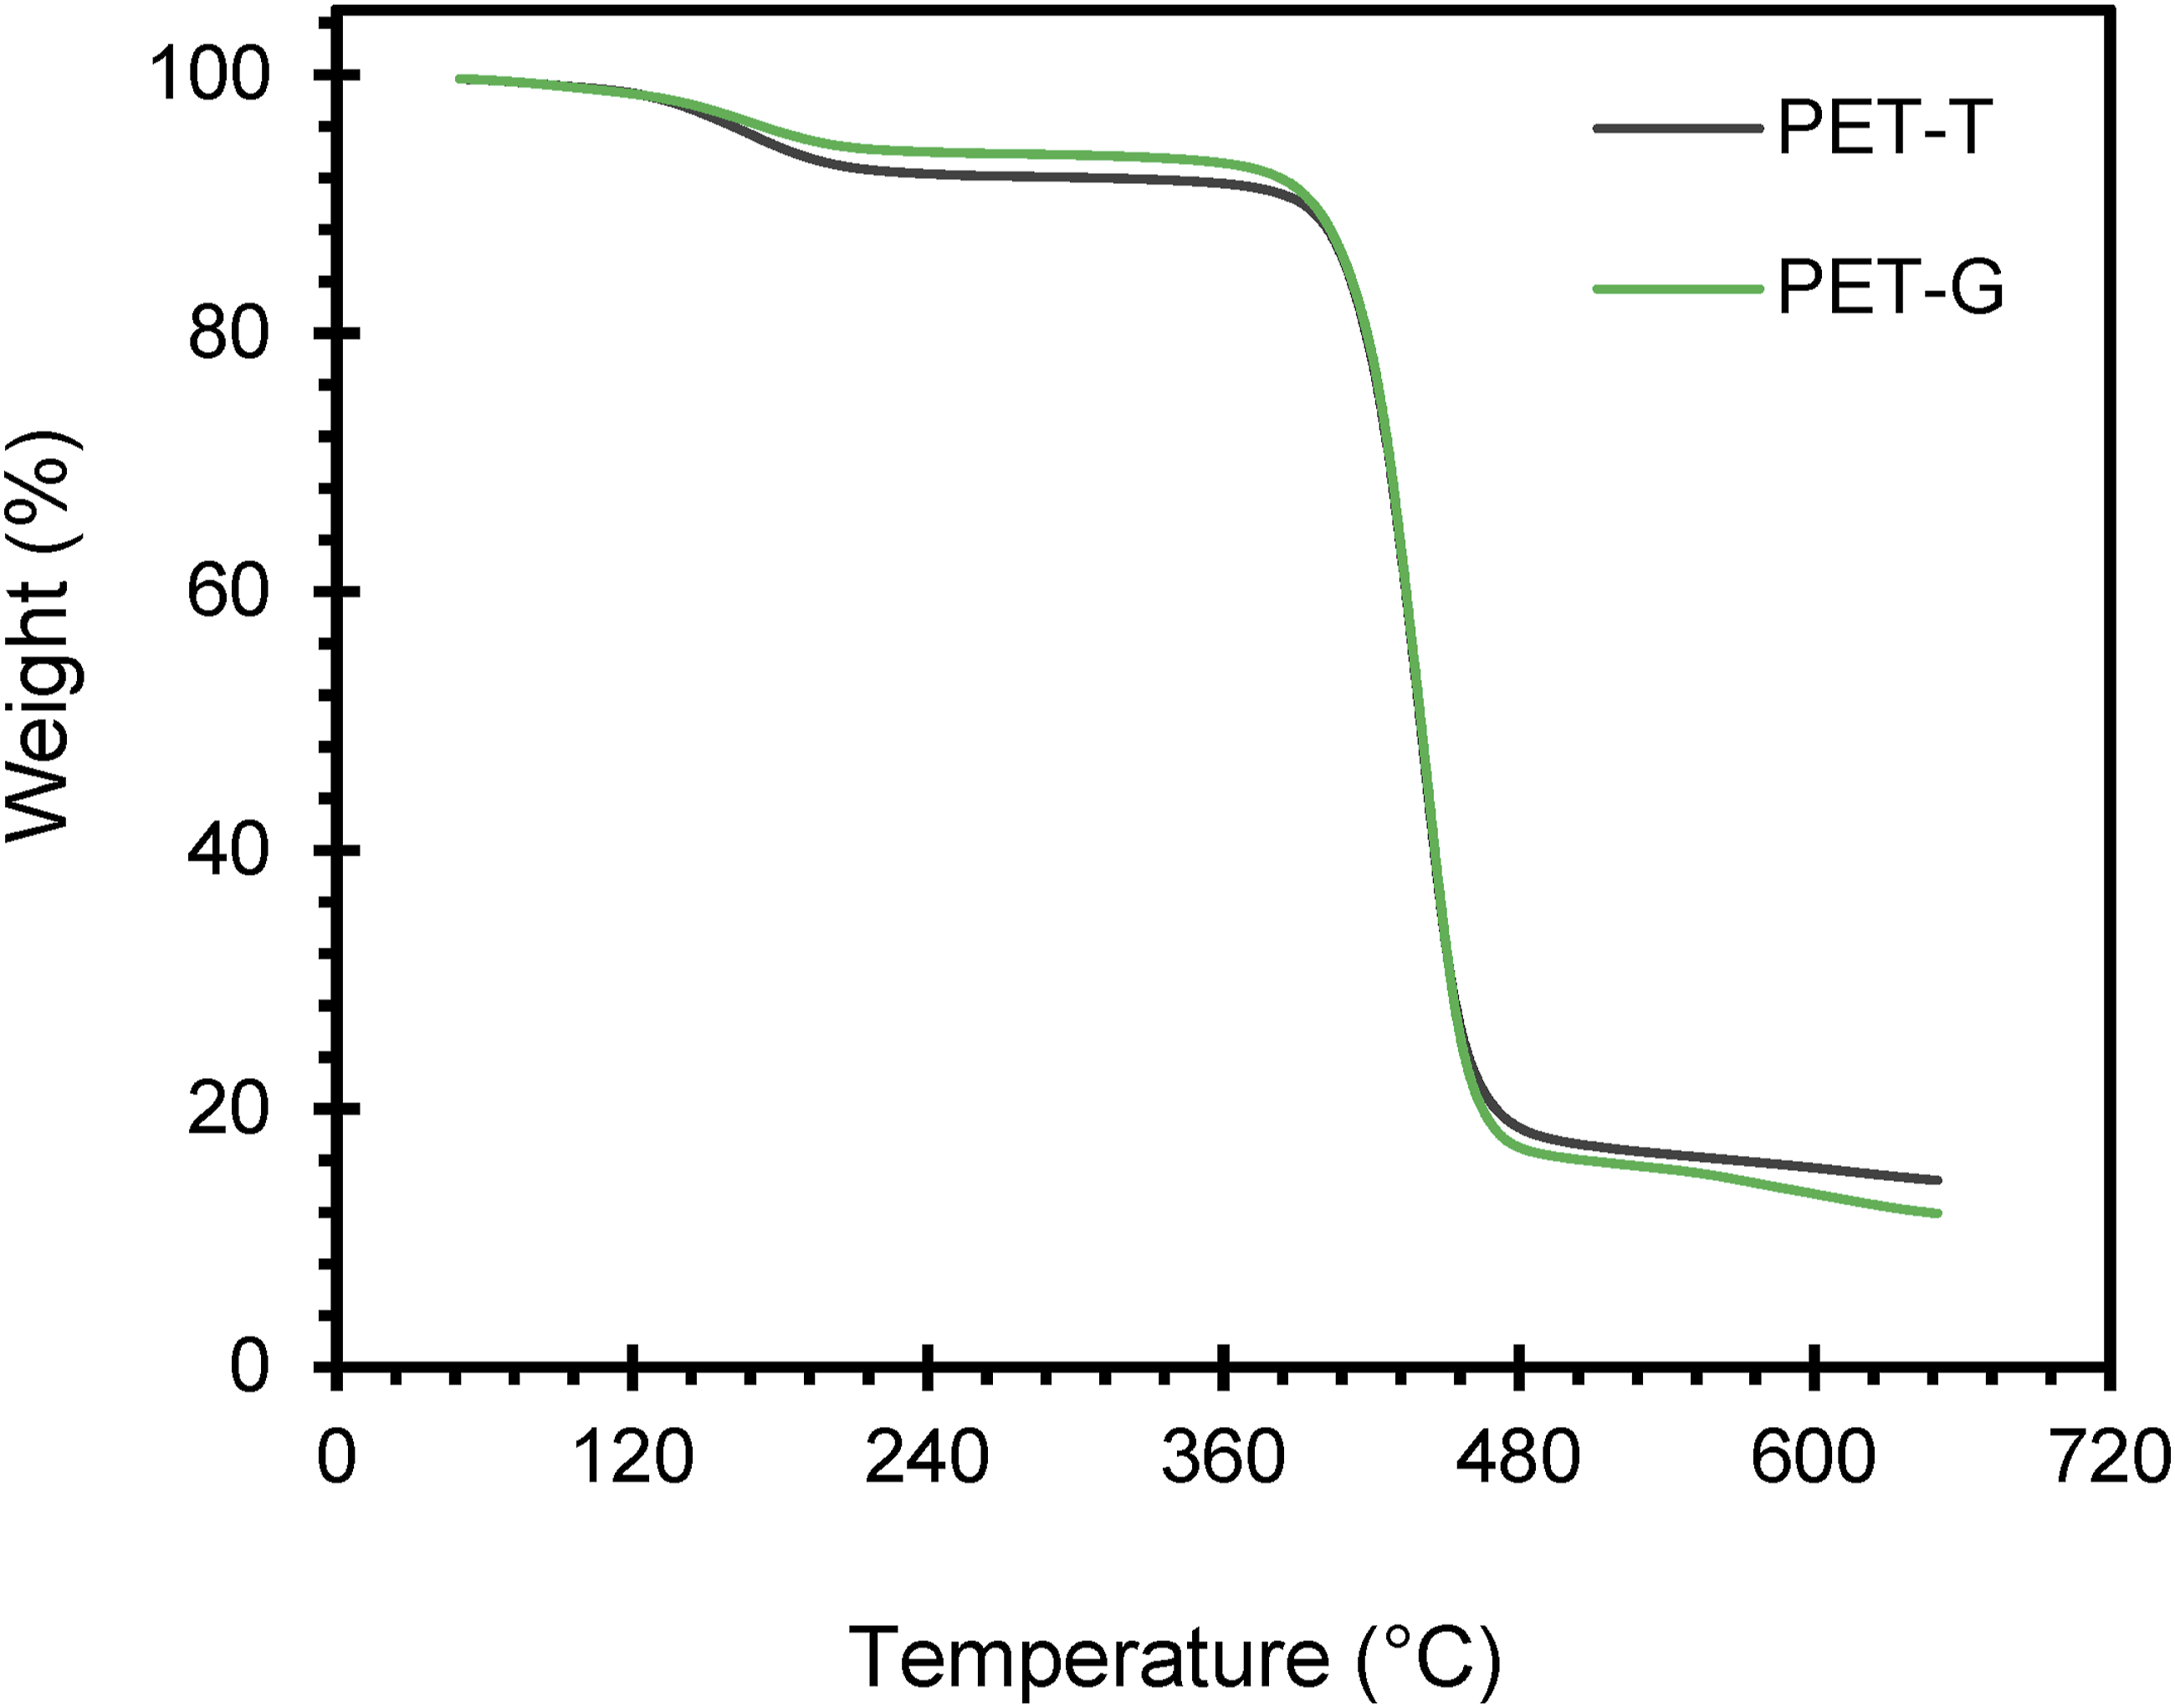
It is important to note that, in the range of 160-380°C, green PET exhibits a lower weight loss compared to transparent PET. This behavior could be due to the interactions induced by the dyes SG5 and PG7 with the PET chains, which could be affecting the volatility of certain compounds present in the sample. From 500°C onwards, G-PET-B shows a greater weight loss than T-PET-B in this region, which coincides with what has been reported in previous studies on the dye SG5, a perylene compound. This dye slightly reduces mass loss in PET at low temperatures, possibly due to interactions that stabilize the polymer matrix, although its effect is reversed at high temperatures, where mass loss increases. This behavior suggests that SG5 could be acting as a catalyst or promoter of PET degradation at high temperatures, due to the presence of oxygen in its molecule. This observation suggests that the SG5/PG7 dye blend present in green PET is mostly composed of SG5 (80%–90%), as previously proposed in early discussions on the subject. Even though PG7 might represent only 10%–20% of the blend, it contributes to increasing the resistance to thermal-oxidative degradation, thanks to the stability provided by the aromatic planar structure of chlorinated copper phthalocyanine. 31 This structure gives PG7 rigidity and higher thermal stability, which is transmitted to PET, increasing its resistance to degradation. In fact, the degradation temperature of green PET (441.93°C) was slightly higher than that of clear PET (440.77°C), suggesting that SG5 and PG7 dyes confer slightly higher thermal stability to the material.
Figure 13 presents the thermograms of the dry films obtained from the filtrates of the G-PET-SF/AC solution in phenol/tetrachloroethane (60/40), following the established experimental design. These films were obtained by cooling the filtered liquid, which contained the PET recovered after treatment with activated carbon and subsequently drying it to form films that were analyzed by TGA and colorimetry. Notable differences are observed in the thermograms of the G-PET films compared to the G-PET-B used as a reference. These differences are largely due to the action of the activated carbons (QR, MC and ME), which adsorbed different quantities of PET and dyes, depending on their specific properties, concentrations and interactions. The adsorption of these compounds by the ACs depends on the type and quantity of activated carbon, as well as the mixing time used. These factors influence the selectivity of adsorption, the competition for active sites and the possible formation of complexes between PET, dyes and ACs. TGA degradation curves of G-PET-B and G-PET-SF samples.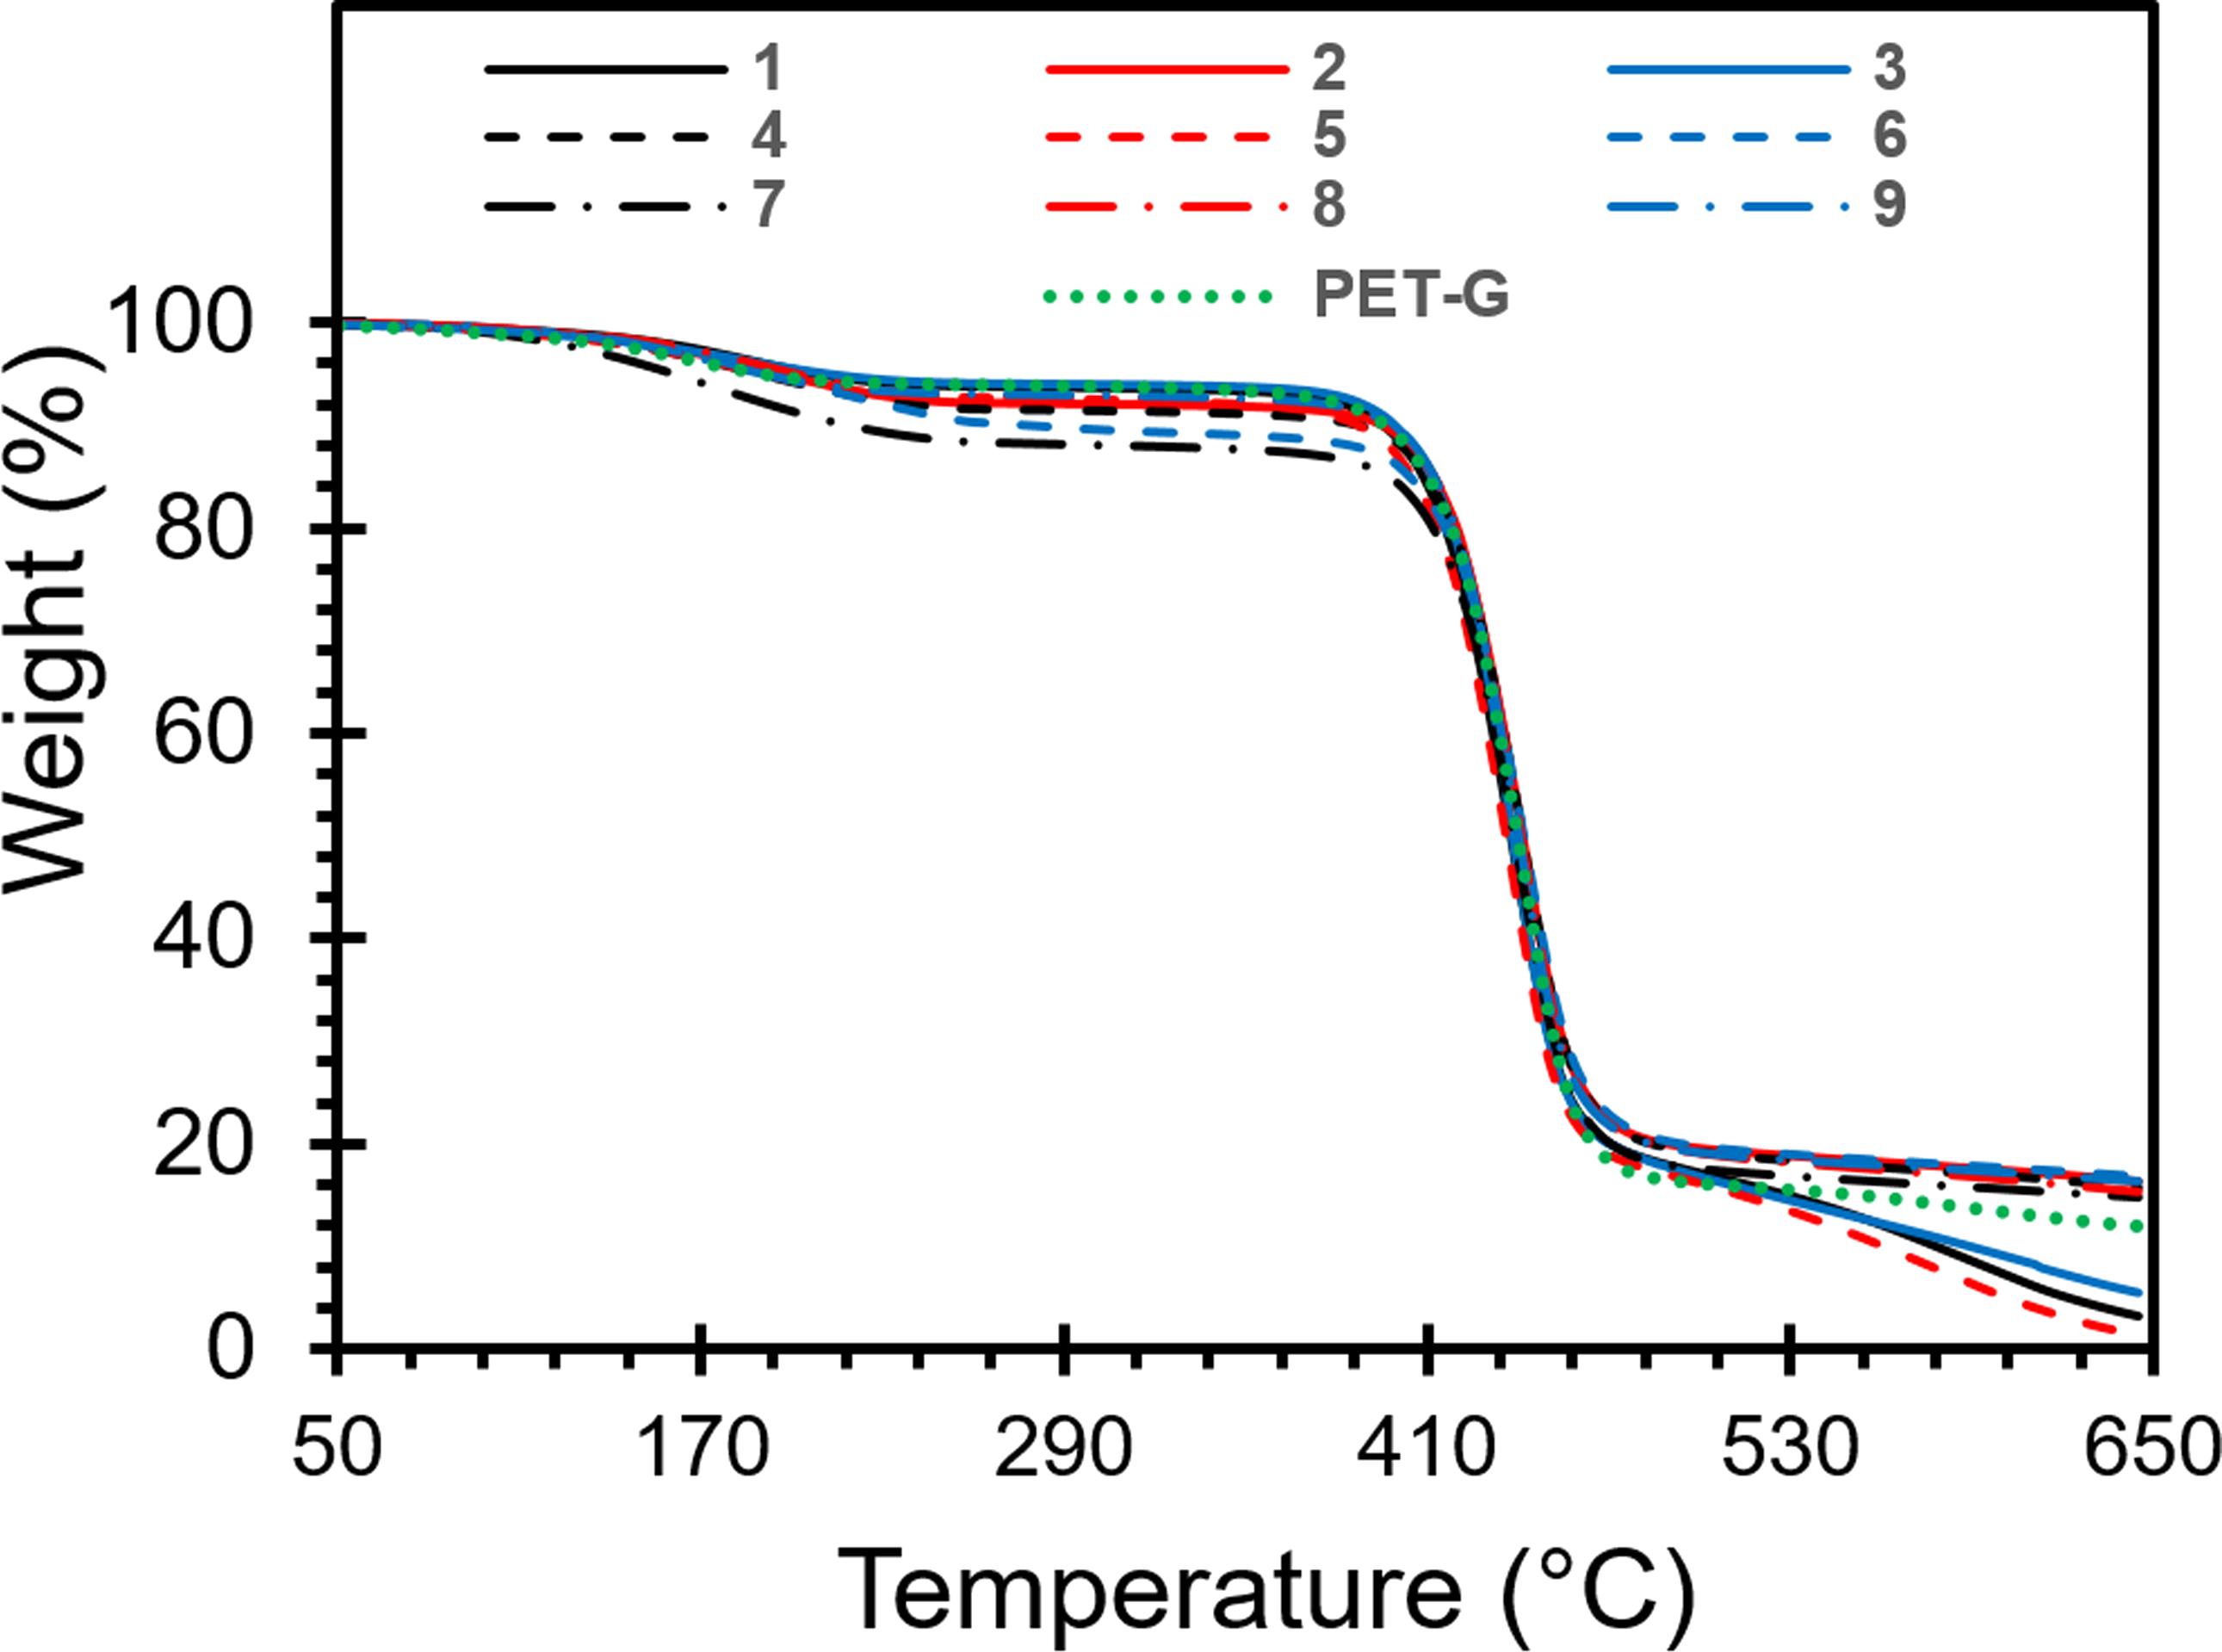
Temperatures and residual masses of degradation of G-PET-SF samples.
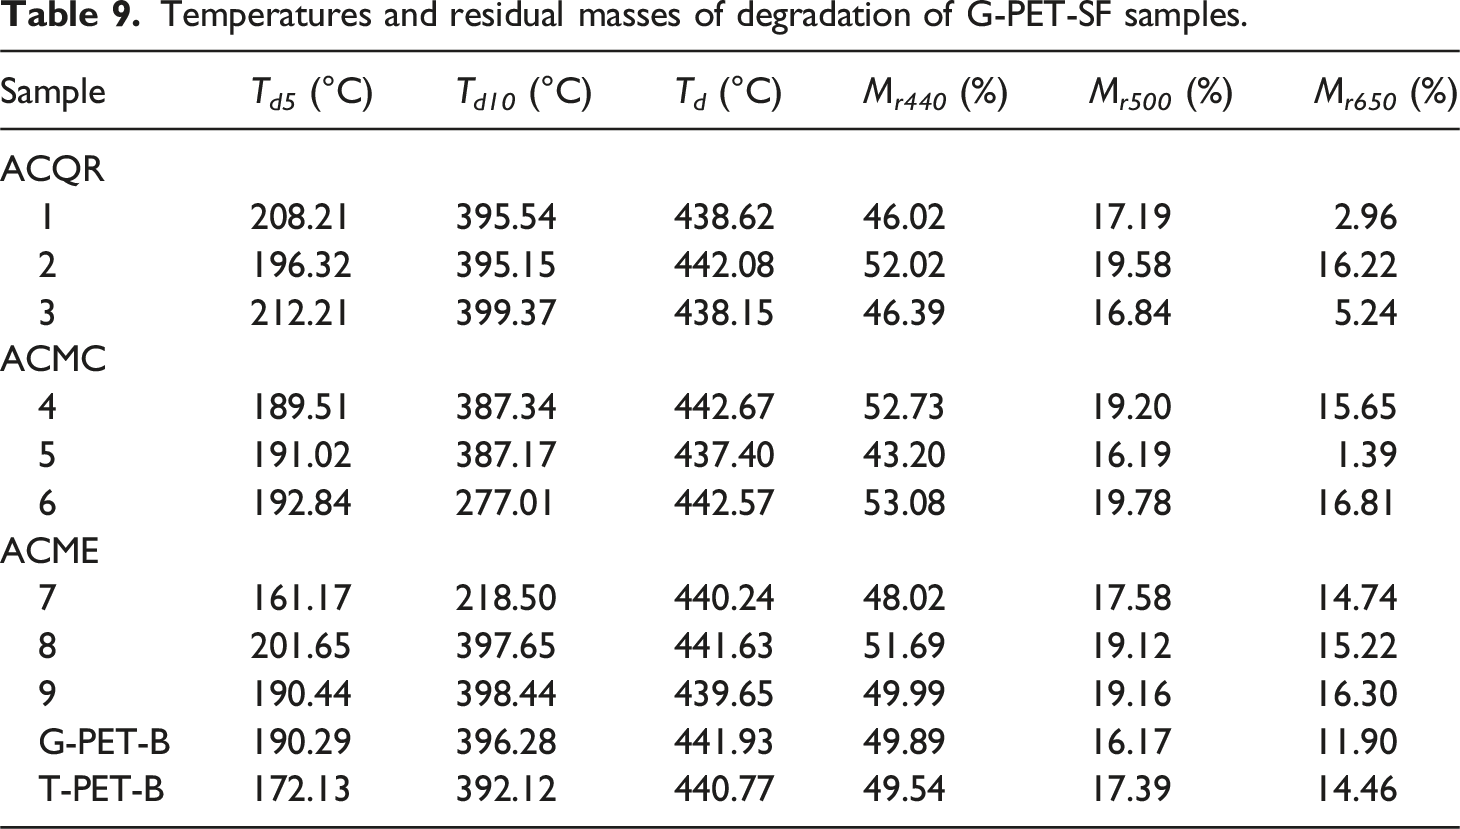
The degradation of dyes generates a series of chemical products, some of which are more reactive than others. SG5 presents two stages of degradation: a lower one between 150°C and 300°C, where the aliphatic chains attached to the dye molecule are detached, releasing volatile compounds such as alcohols and aldehydes; and a higher one between 300°C and 500°C, with an abrupt loss of mass due to the fragmentation of the aromatic rings that make up the perylene structure.47,48 On the other hand, PG7, being a chlorinated copper phthalocyanine, shows greater thermal stability due to its molecular structure that presents strong chemical bonds and resonant structures that give it resistance to degradation. Its degradation peak is observed between 500°C and 700°C, releasing aromatic compounds such as xylene, benzonitrile, benzene and their chlorinated compounds. These latter aromatic molecules, especially those with a higher number of chlorine atoms, require higher temperatures for their degradation,49,50 which contributes to the greater thermal stability of PG7 compared to SG5.
The thermograms of the green PET films treated with activated carbon reveal a higher adsorption of PG7 and variable amounts of SG5 in the ACQR, followed by ACMC, and finally ACME, which is the one with the lowest adsorption. This behavior suggests that the PG7/SG5 ratio is lower in the ACQR-treated samples and higher in the ACME-treated samples, which translates into a higher thermal stability in the latter. The higher proportion of SG5 in the ACME-treated samples, due to the lower adsorption of this dye, results in a higher thermal stability compared to the ACQR-treated samples, where the higher adsorption of SG5 reduces the proportion of this dye in the PET matrix. It should be noted that this phenomenon does not follow a direct relationship with the proportion of dyes, since the thermal-oxidative degradation also depends on the amount of PET polymer chains adsorbed on the ACs, preferably of low molecular weight. The presence of adsorbed PET chains can influence the availability of oxygen during degradation, affecting the rate of this process. This explains why the filtered PET shows an apparent increase in PET molecular weight in increasing order for the samples with activated carbons QR, MC and ME. The higher amount of low molecular weight PET chains adsorbed on the activated carbons MC and ME translates into a higher thermal resistance in the range of 500°C to 650°C for the samples derived from these carbons.
This degradation behavior of the green recycled PET films treated with activated carbons shows an interesting correlation with their normalized color parameters (Table 8). On average, the samples that exhibited the lowest residual mass after degradation also showed the lowest decrease in the intensity of the green (-a*) and yellow (-b*) colors. These samples correspond to those treated with the ACQR, which adsorbed a higher amount of PG7 pigment. The preferential adsorption of PG7 by ACQR results in a decrease in the PG7/SG5 ratio in the treated films, which in turn affects the changes in the color parameters less.
On the other hand, the samples that presented the highest residual mass after degradation also showed the greatest change in the intensity of the green (-a*) and yellow (-b*) colors. These samples correspond to those treated with the activated carbons MC and ME, which adsorbed a greater amount of the SG5 dye. However, subtle differences were observed between these two treatments. The samples treated with ACMC experienced a decrease in the intensity of the yellow color, while those treated with ACME showed an increase in this parameter.
This differential behavior suggests that the samples derived from ACME treatments adsorbed the highest amount of SG5, leaving a higher proportion of PG7 compared to the reference sample. In particular, the sample corresponding to run nine was the one that adsorbed the highest amount of SG5, which is reflected in the largest decrease in the intensity of the green color (a*) and even a slight increase in the intensity of the yellow color (-b*). In addition, this sample also exhibited a higher thermal-oxidative resistance compared to all other samples.
These results highlight the complexity of the adsorption process on activated carbons and how the presence of PET molecular chains and the dyes SG5 and PG7 can dynamically modify the surface of these materials. Figure 14 illustrates the complexity of this phenomenon, which presents great potential for future applications derived from this study. The ability of ACs to selectively adsorb different components of a complex mixture opens up a range of possibilities for the development of new materials and technologies. Proposed mechanism of absorption of dyes and PET polymer on activated carbon.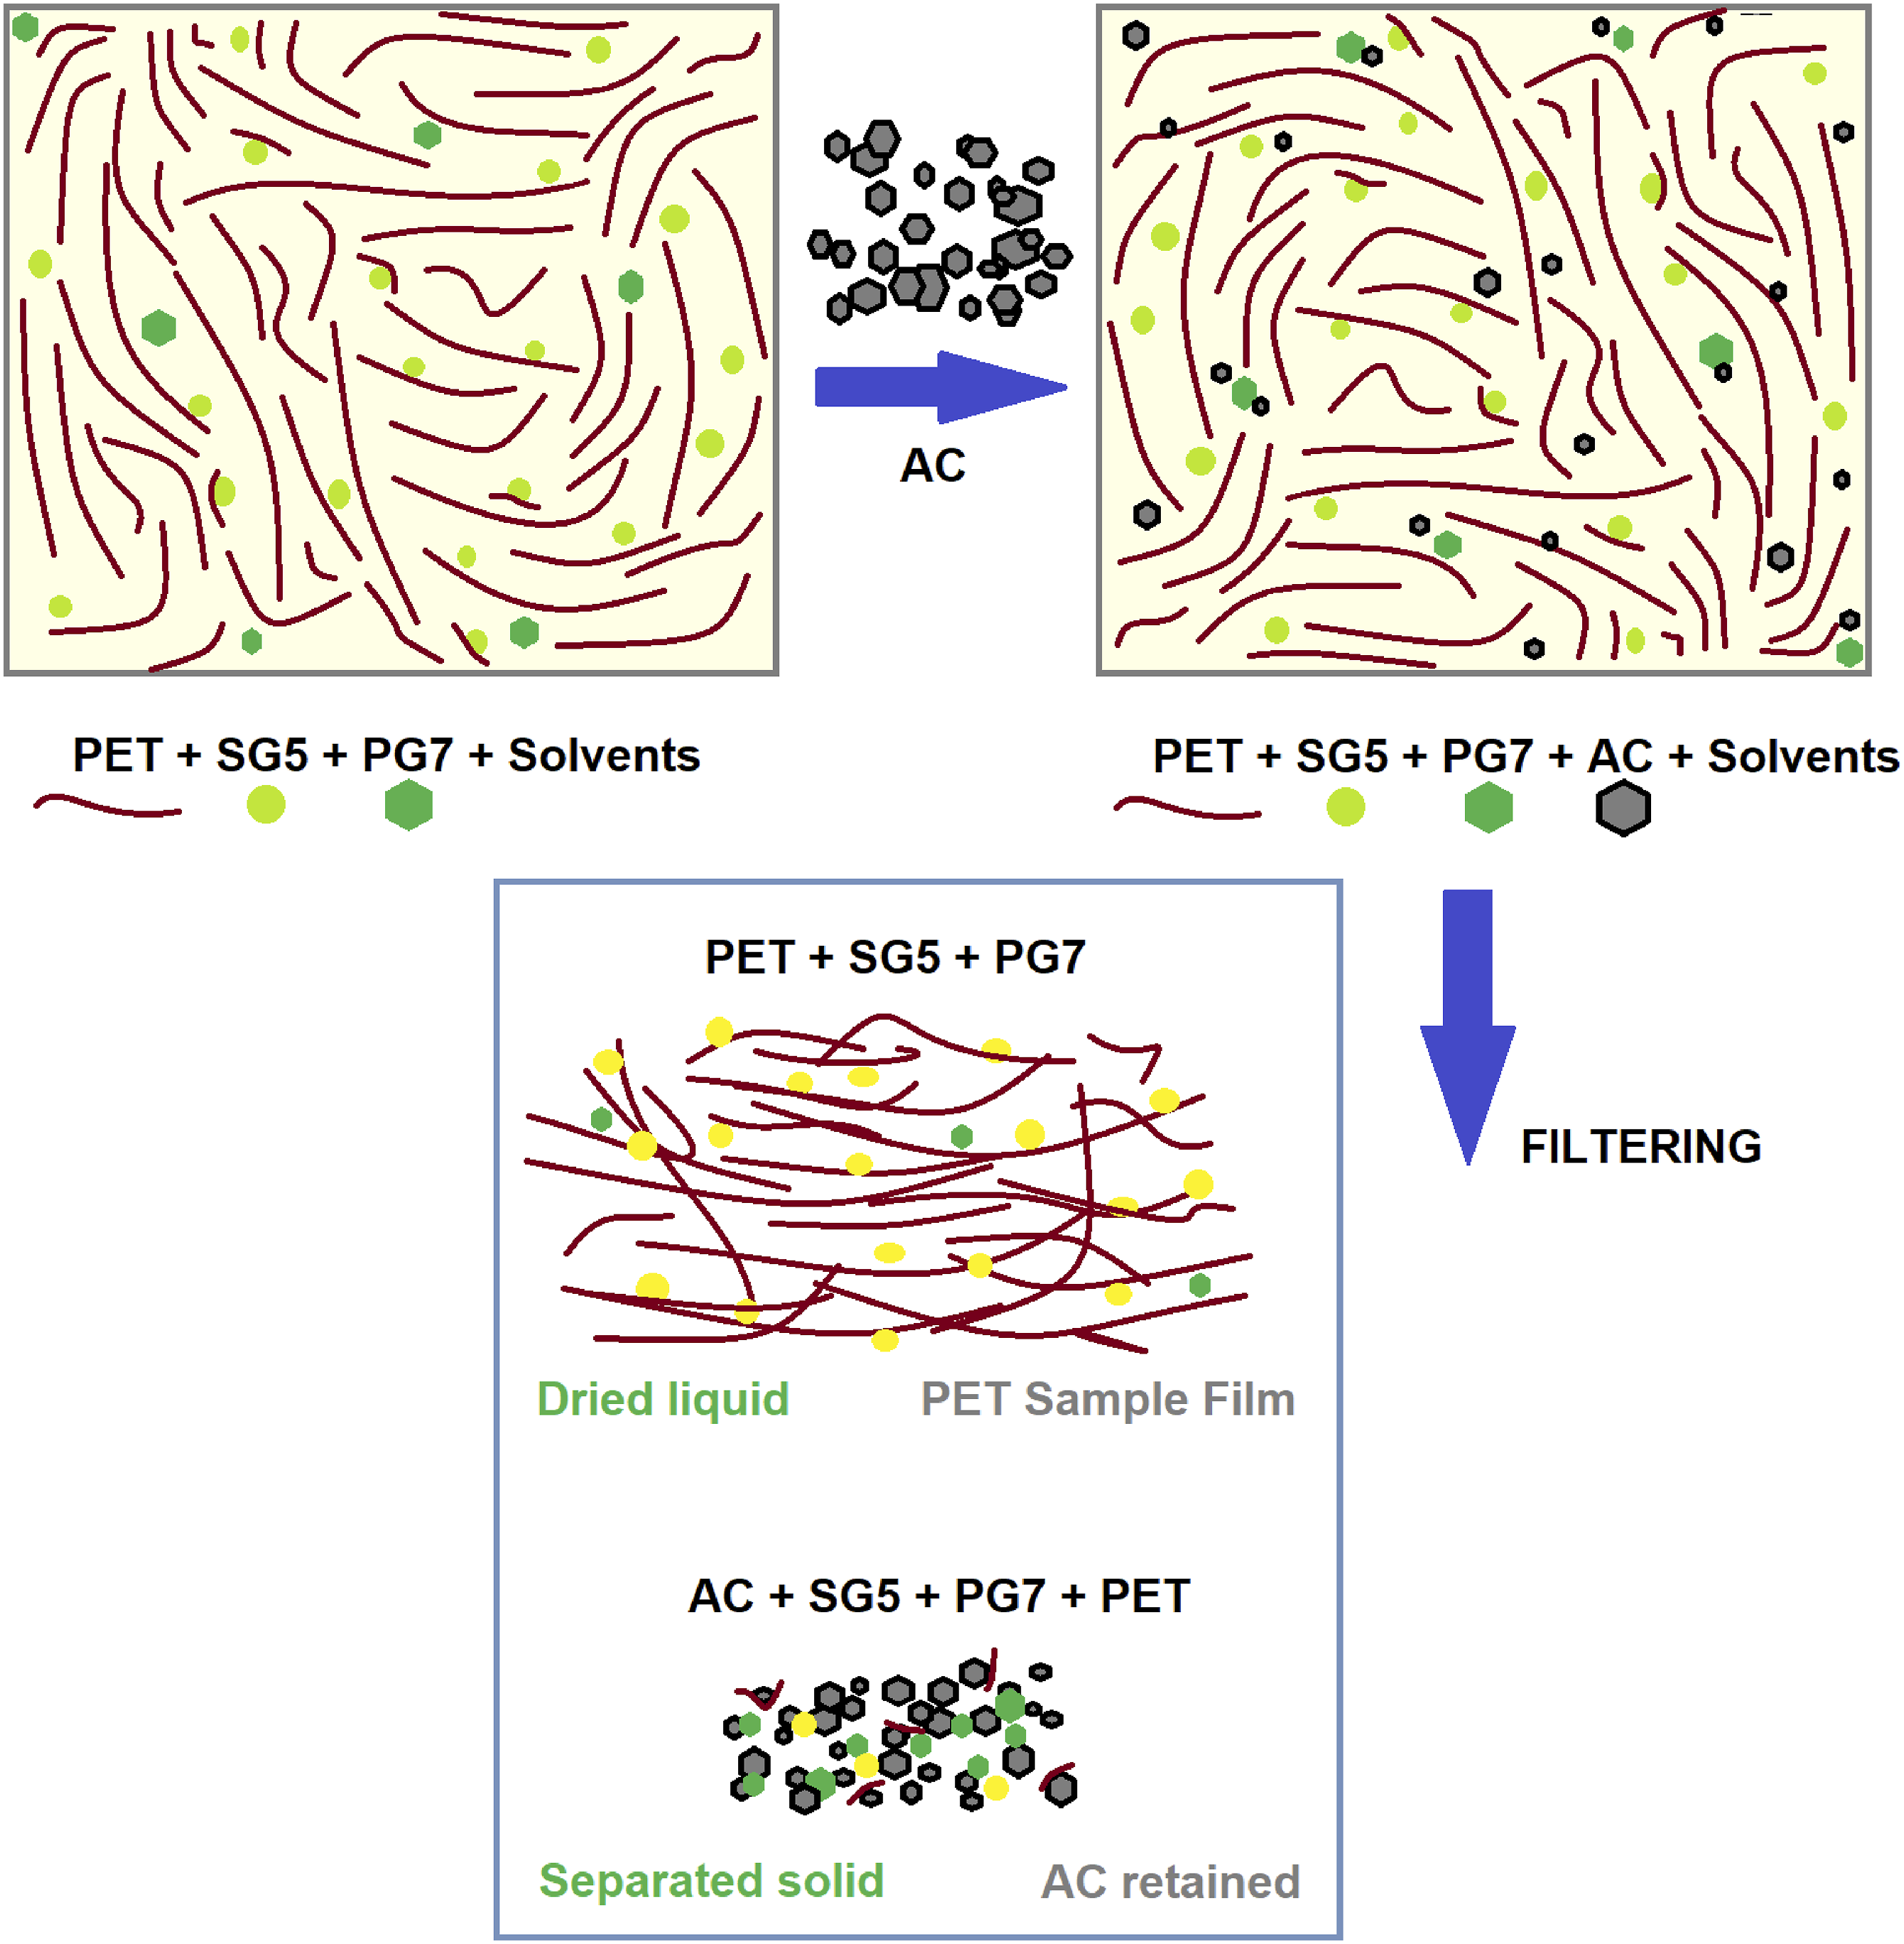
Conclusions
Research into the decolorization of recycled green PET using activated carbons reveals significant findings that contribute to the advancement of plastic recycling technologies. This study identifies the colorants present in green PET, establishes the effectiveness of a decolorization process, and determines the key variables that influence it. • Identification of dyes. The presence of Solvent Green 5 (SG5) and Pigment Green 7 (PG7) dyes in samples of green PET carbonated beverage bottles was confirmed by UV-Visible spectroscopy and XPS, in an approximate SG5:PG7 ratio of 4 to 1. These dyes are responsible for the characteristic green coloration of PET and affect its optical and thermal properties. • Efficiency of the decolorization process. Dissolution of green PET in a hot mixture (60/40%) of phenol/tetrachloroethane, followed by adsorption of the dyes with activated carbons, proved to be an effective method to produce some whitening in the samples. This was reflected in a reduction in the green coloration, evidenced by increases in luminosity (L) and adjustments in the color parameters a* and b*, indicating a tendency towards more orange tones, given the crystallization of the perylene dye SG5. • Key variables in decolorization. Activated carbon (AC) content emerged as the most influential variable in the decolorization process, significantly affecting the color distance ΔE* (56.15%) and luminosity (L). Higher AC content was correlated with higher decolorization efficacy. Activated carbon type was also shown to be an important factor, with ACMC standing out for its ability to decrease color saturation (c*). This property is attributed to its higher surface area and chemical affinity (PZC of 7.6) towards nonpolar dyes, such as SG5, while mixing time had a minor influence on color changes. • Selective adsorption of dyes. ACQR was found to have a remarkable capacity to adsorb PG7, which results in a lower reduction in the green coloration of PET. On the other hand, activated carbons with a more apolar character, such as activated carbons MC and ME, showed a higher affinity for SG5. In general, PET films treated with these last two activated carbons presented a yellow-orange hue. • Modified thermal stability. Thermogravimetric analysis (TGA) revealed that PET films derived from activated carbons MC and ME treatments exhibited lower mass loss in the range of 500°C to 650°C. This behavior is attributed to the preferential adsorption of SG5 and possible low molecular weight PET chains. • Process optimization. The results of this study suggest that it is possible to design an efficient green PET decolorization process by appropriate selection of activated carbon type and content, as well as precise control of mixing time. These parameters can be adjusted to optimize dye removal and improve the properties of recycled PET, contributing to sustainability in the plastics industry.
Footnotes
Acknowledgements
They also thank José de los Ángeles Rodríguez Laviada and María Verónica Moreno Chulim for their technical support in carrying out this research work, for their collaboration in characterization activities and the provision of laboratory material; Carlos Vidal Cupul Manzano for his assistance in the use and supply of equipment from the Processing Laboratory; and Santiago Duarte Aranda for performing the SEM micrographs.
Declaration of conflicting interests
The author(s) declared no potential conflicts of interest with respect to the research, authorship, and/or publication of this article.
Funding
The author(s) received no financial support for the research, authorship, and/or publication of this article.
Disclamier
The authors express their gratitude to the National Council of Science, Technology and Humanities for granting student scholarship 835268.