
Abstract
The increasing demand for sustainable and high-performance construction materials has driven the exploration of bio-based reinforcements in polymer composites. This study investigates the development of paving slab products using thermoplastic elastomer (TPE) composites reinforced with crab shell (CS) particles, aiming to enhance mechanical, thermal, and durability properties for outdoor applications. The research addresses the need for eco-friendly alternatives to conventional fillers by leveraging CS as a reinforcing agent in recycled high-density polyethylene (rHDPE) and natural rubber (NR) matrices. The TPE composites were fabricated using a twin-screw extruder and compression molding techniques, with varying NR and CS contents to optimize performance. Mechanical properties, including flexural strength, compressive modulus, and hardness, were evaluated alongside water absorption (WA), density, and thermal stability using thermogravimetric analysis (TGA) and differential scanning calorimetry (DSC). The results revealed that increasing CS content improved flexural strength and thermal resistance, while a slight reduction in melting temperature was observed due to increased heterogeneity and polymer network disruption. The highest compressive performance was achieved with 20 wt% CS content, whereas further increases led to particle agglomeration, negatively impacting mechanical integrity. Furthermore, CS fillers enhanced thermal stability by forming a heat-resistant barrier, delaying decomposition onset. WA increased with CS content due to its bio-organic nature, necessitating further optimization for outdoor applications. This study demonstrates the potential of CS-reinforced TPE composites as a sustainable alternative for paving slab production. Future research should focus on optimizing filler dispersion and long-term environmental performance to enhance durability in real-world conditions.
Introduction
Polymers are a type of material that have in many forms, both natural and synthetic. Among all of the polymer materials, there is a group of polymers that are made by mixing thermoplastics with rubber.1,2 This material is generally formed the copolymerization of soft segments with hard segments, forming a composite material called thermoplastic elastomers (TPEs) or thermoplastic rubbers in which composite material is playing an increasingly important role in many industries.3,4 The TPEs composites can be molded like many plastics, they have the properties of flexibility and softness similar to rubber, but TPEs have rubber-like properties only at certain temperatures (depending on the type of thermoplastic). 5 it usually means at room temperature (25°C), but when the temperature is higher, thermoplastic rubber becomes soft and flows like plastic, thus, the TPEs can be molded with an injection molding machine, blow molding machine, compression molding machine (hot-press), and extruder.6,7 Additionally, the outstanding properties of the TPEs material are high flexibility, heat resistance, water and solvent resistance, and high resistance to tearing and abrasion.8,9 Hence, the application of the TPEs materials is mainly to produce rubber pipes, rubber joints, cable sheaths, conveyor belts, rubber seals, gaskets, etc.3,10
Thermoplastics have the behavior of softening and melting when heated and hardening when cooled. The hardened plastic can be remelted with heat. The thermoplastics are therefore materials with properties suitable for forming various products using basic techniques such as injection, extrusion, or spinning into fibers.11,12 In addition, the re-melting and re-molding properties of thermoplastics allow the use of scrap or waste materials from production to be beneficial by grinding the plastic scrap or waste and mixing it with new resin.13,14 The thermoplastics widely used in industry include polypropylene (PP), polyethylene (PE), polystyrene (PS), and polyvinyl chloride (PVC).1,15,16 Among the thermoplastics used to produce TPEs composites, the high-density polyethylene (HDPE) is suitable because of their low melting point and high flexibility. 17 Fazli and Rodrigue 18 reported the use of recycled high-density polyethylene (rHDPE) and regenerated tire rubber blends modified with an elastomer. Also, they studied the TPEs based on rHDPE, ground tire rubber, and ethylene vinyl acetate on morphological and mechanical properties. 19
Natural rubber (NR) as biobased elastomers are considered as ideal candidates to toughen TPEs from the viewpoint of sustainable development of materials.20,21 The NR is an important ingredient in the production of TPEs materials.5,22 The NR is a polymer that has many outstanding properties, such as good mechanical properties, high elasticity, toughness, high abrasion resistance, and good adhesion to other materials such as metals and textiles, hence, it is widely used engineering material.7,23 The NR can be classified into several types. These are mainly determined by the amounts of impurities in the rubber and other variables such as ash content and plasticity retention index (PRI) may also be considered.6,24 Currently, the Thailand has a rubber standard called Standard Thai Rubber (STR). The STR 5L is widely used in many industries. In addition, this material has also obtained the attention of researchers and scholars. 25 According to Tanrattanakul and Bunkaew, 26 who reported the effect of different plasticizers on the properties of bio-based TPEs containing poly(lactic acid) (PLA) and NR. Additionally, Pongtanayuta et al., 3 who studied the effect of rubber on morphology, thermal properties and mechanical properties of PLA/NR and PLA/ENR blends.
In general, the use of reinforcing materials in plastics or TPEs is popularly made from natural fibers, whereas that industrial production often uses calcium carbonate (CaCO3).27,28 Thailand’s commercial calcium production has a total production capacity of 820,000 to 1,060,000 tons. 29 Previous industrial studies have shown that the CaCO3 in natural has decreased in number due to increased usage, hence, the use of natural materials to replace CaCO3 is an important matter to study.27,30 Crab shell (CS) is a type of natural material that contains about 35% of CaCO3. Also, it is the natural organic flours obtained from renewable natural resources are inexpensive fillers which are generated during different stages of seafood industry such as ready-made food and canned food.12,31 The CS have the potential to be used as biodegradable reinforcing materials because of their acceptable specific strength and modulus including the physical and thermal properties. 32 The advantages of this material are biodegradability, low density, low cost, good thermal insulation, absence of associated health hazards, easy filler surface modification, and the fact that they are renewable resources.33,34 As mentioned above, the use of CS as a reinforcing agent in TPEs to replace CaCO3 in industrial production processes is worthwhile and leading to a reduction in production costs.
Thus, the aim of this study was to investigate the TPEs composites manufactured from CS waste reinforced elastomer (rHDPE and NR). The experimental results were evaluated the effects of the rHDPE, NR, and CS contents on the mechanical, physical, and thermal properties. The ultraviolet stabilizer and paraffin wax as a lubricant (Lub) were chosen for further compatibilization studies with TPEs composites. The optimal condition in this work was used to manufacture the paving slab product and tested according to product usage standards.
Experimental and method
Materials
Recycled high-density polyethylene (rHDPE) was used as polymeric matrix with a melt flow index of 12 g/10 min, and a density of 0.93 g/cm3 supplied from Withaya Intertrade Co., Ltd (Samut Prakan, Thailand). Natural Rubber (NR) in type of STR 5L was used as an ingredient in elastomer composites, it was supplied from Geefin Rubber Tech Co., Ltd (Songkhla, Thailand). Before compounding, the NR was cut into smaller sizes, approximately 5 to 10 mm using a cutting mill. Crab shell (CS) as waste from consumption was collected from the Songkhla municipal solid waste landfill site (Songkhla, Thailand), it was the alternative waste materials used in this study. Prior mixing, the CS was milled and screened on a sieve to classify the particle size 80 mesh and then dried in an oven at a temperature of 110°C for 8 h to reduce the moisture content. 27 For the additives, the ultraviolet (UV) stabilizer with the trade name MEUV008, was supplied from TH Color Co., Ltd. (Samut Prakarn, Thailand). The paraffin wax as a lubricant (Lub) was also supplied from Nippon Seiro Company Ltd (Yamaguchi, Japan).
Manufacturing process of elastomer composites
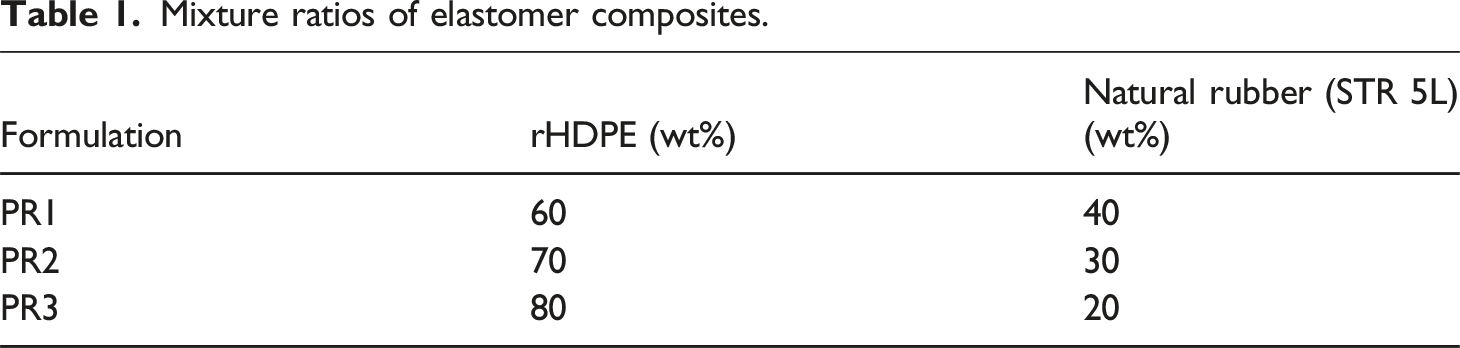
Mixture ratios of elastomer composites.
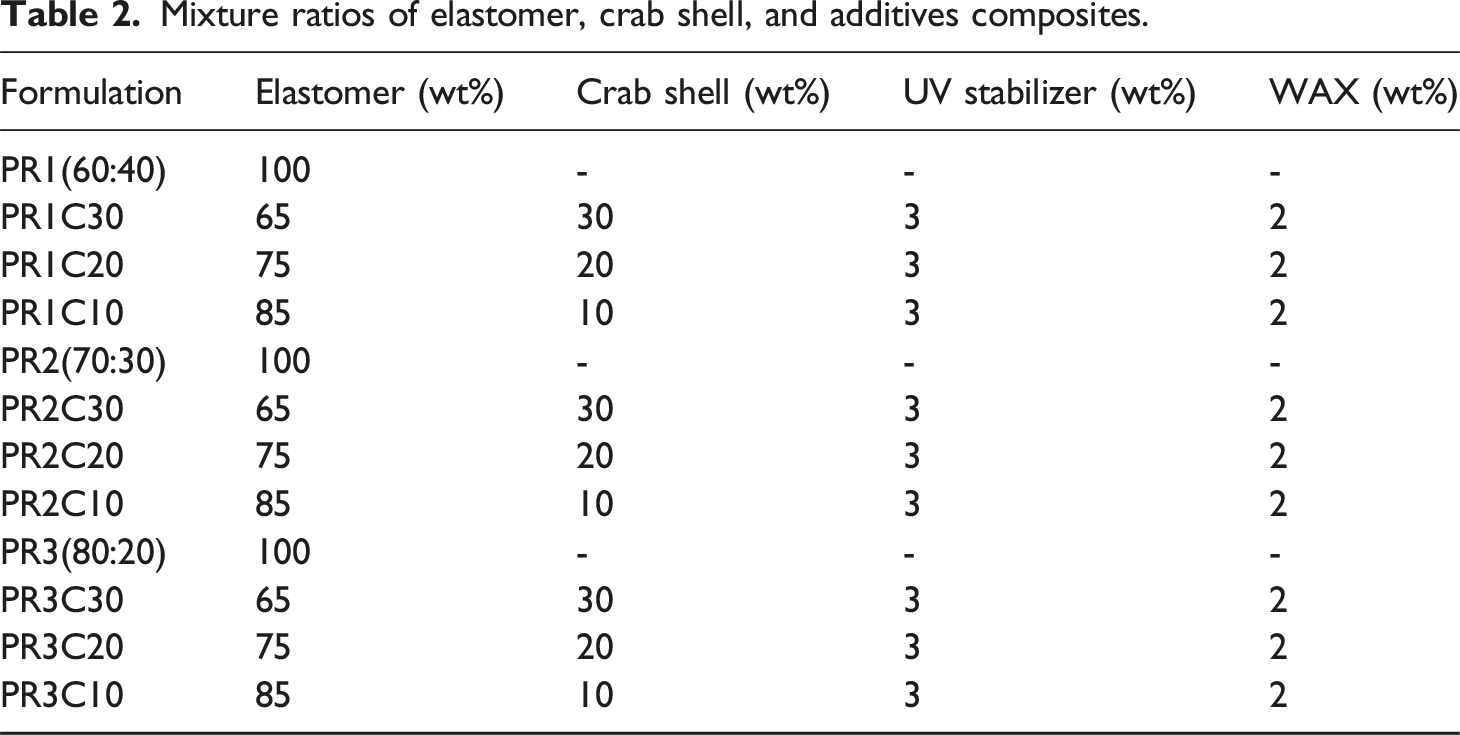
Mixture ratios of elastomer, crab shell, and additives composites.
Mechanical properties
Flexural test
Flexural property (modulus of rupture; MOR and modulus of elasticity; MOE) was performed on a Mechanical Universal Testing Machine, Model NRI-TS500-50 from Narin Instruments Co. Ltd. (Samutprakarn, Thailand). The composite samples were tested according to ASTM D790 standard. The TPEs composites testing was conditioned with crosshead speed of 2 mm/min and a span of 80 mm. The specimens were prepared with the nominal of 100 mm × 13 mm × 4.8 mm. The flexural testing of the samples was measured before and after outdoor exposure of 3 and 6 months. All mechanical tests were conducted at room temperature of 25°C with five replications for each exposing time. Modulus of rupture (MOR) can be calculated using the following equation (1):

Compressive test
Compressive property (compressive strength; CS and compressive modulus; CM) of the samples were carried out according to ASTM D6108 specifications using a Universal Testing Machine, Model NRI-TS500-50 from Narin Instruments Co. Ltd. (Samutprakarn, Thailand), the same as the flexural test. The constant displacement rate of cross-head speed was 0.5 mm/min. The five replications of specimens with nominal dimensions of 6 × 12 × 6 mm3 were tested at a room temperature of 25°C after exposure for 3 and months.
Hardness test
Hardness property of the TPEs composites both before exposure and after outdoor exposure for 3 and 6 months was measured using a mechanical Shore D Durometer, Model GS-702G from Teclock Corporation (Nagano, Japan). All of the samples were tested according to ASTM D2240 specification. The specimens with nominal dimensions of 30 mm × 30 mm × 4.8 mm were determined. Five replications of the samples were conducted at room temperature of 25°C for each composite formulation at each exposing time.
Physical properties
Water absorption and thickness swelling tests
Water absorption (WA) and thickness swelling (TS) of the composite samples was measured in accordance with ASTM D570 standard. The composite samples with nominal dimensions of 6 × 12 × 6 mm3 were cut from the composite panels. Five replications for each formulation were immersed in water for 3 and 6 months with a depth of immersion from the samples to the water surface of about 25.4 mm. The TPEs samples were weighed and measured before immersion in water conditions. Subsequently, the samples were periodically removed from the water, dried with tissue paper on the rubberwood surfaces, re-weighed and re-measured under a room temperature of 25°C, and put immediately back into the water. The WA and TS values of the composite samples were calculated according to the following equations (3) and (4):

Density test
Density of the composite samples was evaluated as the TPEs reinforced with different the crab shell (CS) contents. All of the results depend on the different mixing ratios (mass per volume) into elastomer composites. The composite specimens with dimensions of 6 × 6 × 6 mm3 were cut from the composite panels and then weighed under a room temperature (25°C). Five replications were measured from composites each formulation. Average density values of the elastomer composites were calculated according to equation (5):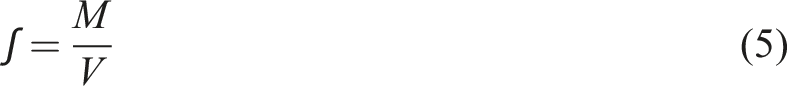
Where
Analytical techniques
Colorimetric analysis
Color measurements of the TPEs composites surfaces both before and after outdoor exposure were carried out with a CHECK 3 portable spectrophotometer (Datacolor, USA), according to the CIE L*a*b* color system. Three WPC specimens of each formulation and time condition were measured at three locations on each specimen. The L* represents the lightness and a larger L* value denotes an increment in lightening. While a* and b* are the chromaticity coordinates. The total change in color (ΔE) of the un-weathered and weathered WPC specimens was calculated using the following equation (6):
Thermal analysis
Thermogravimetric analysis (TGA) of the TPEs materials with different recycled plastic, rubber, and crab shell (CS) contents was carried out using a Perkin Elmer (TGA-7, USA) thermal analyzer. The temperature range was scanned from 50 to 1000°C at a heating rate of 10°C/min under nitrogen atmosphere. The equipment was accurately calibrated for these conditions, and the samples had approximately 6-7 mg in weight.
The effects of mixture ratios on melting temperature (Tm), crystallization temperature (Tc), enthalpy of fusion (∆h
f
), and crystallization (C
m
) of the elastomer composite samples were performed using differential scanning calorimetry (DSC), Model DSC-7, Perkin Elmer (Massachusetts, USA) at heating temperature ranging from 20 to 500°C with heating rate of 10°C/min. The percentage crystallinity (C
m
) from TPEs composites compounding between recycled polymer and CS was calculated in the following equation (7).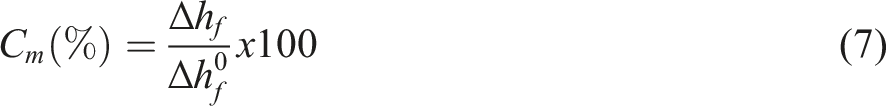
Morphological and visual surface analysis
Scanning Electron Microscope (SEM) with an FEI Apreo microscope, FEI Company (Oregon, USA) was used to observe the voids, cracks, dispersion, and interfacial bonding of the TPEs components reinforced with crab shell (CS) particle. Prior to the SEM observation, the specimen surface area was coated with gold to prevent electrical charging during imaging. The SEM images were taken at an accelerating voltage of 20 kV with a magnification of 50× and 500×. Also, the change of the composite surfaces the owing to decay under environment was observed using the optical microscopy, Model Zeiss Axioskop (Oberkochen, Germany). It was used to observe the surface characteristics on the TPEs samples with a magnification of 100×.
Statistical analysis
One-way analysis of variance (ANOVA) is used to determine whether there are any statistically significant differences between the means of three or more independent. Significant effects of the recycled plastic, polymer, and crab shell (CS) contents on the mechanical and physical properties of TPEs composite were evaluated by one-way ANOVA. The 5% significance level (α = 0.05) was used in all of the statistical analyses.
Results and discussion
Mechanical properties of the TPEs composites
Flexural analysis
The effect of the natural rubber (NR), and crab shell (CS) contents on the modulus of rupture (MOR) and modulus of elasticity (MOE) of thermoplastic elastomer (TPEs) are shown in Figure 1(a) and (b), respectively. From Figure 1(a), the results established that PR3 had the highest MOR (32.12 MPa) for all ratios, followed by PR2 (31.45 MPa) and PR1 (26.56 MPa), respectively. It is implied that adding a small amount of NR to TPEs composites results in a higher MOR. Likewise, the PR3 (20 wt% NR) facilitates better interfacial adhesion in the TPEs composites than a higher amount of NR. This result is consistent with Homkhiew et al.
35
who reported that the MOR of the composites produced from the latex sludge flour reduced continuously with an increase of the reinforcement contents from 30 to 70 wt%, whereas the MOE rose linearly with sludge loadings. The flexural properties of TPEs composites: (a) modulus of rupture (MOR) and (b) modulus of elasticity (MOE).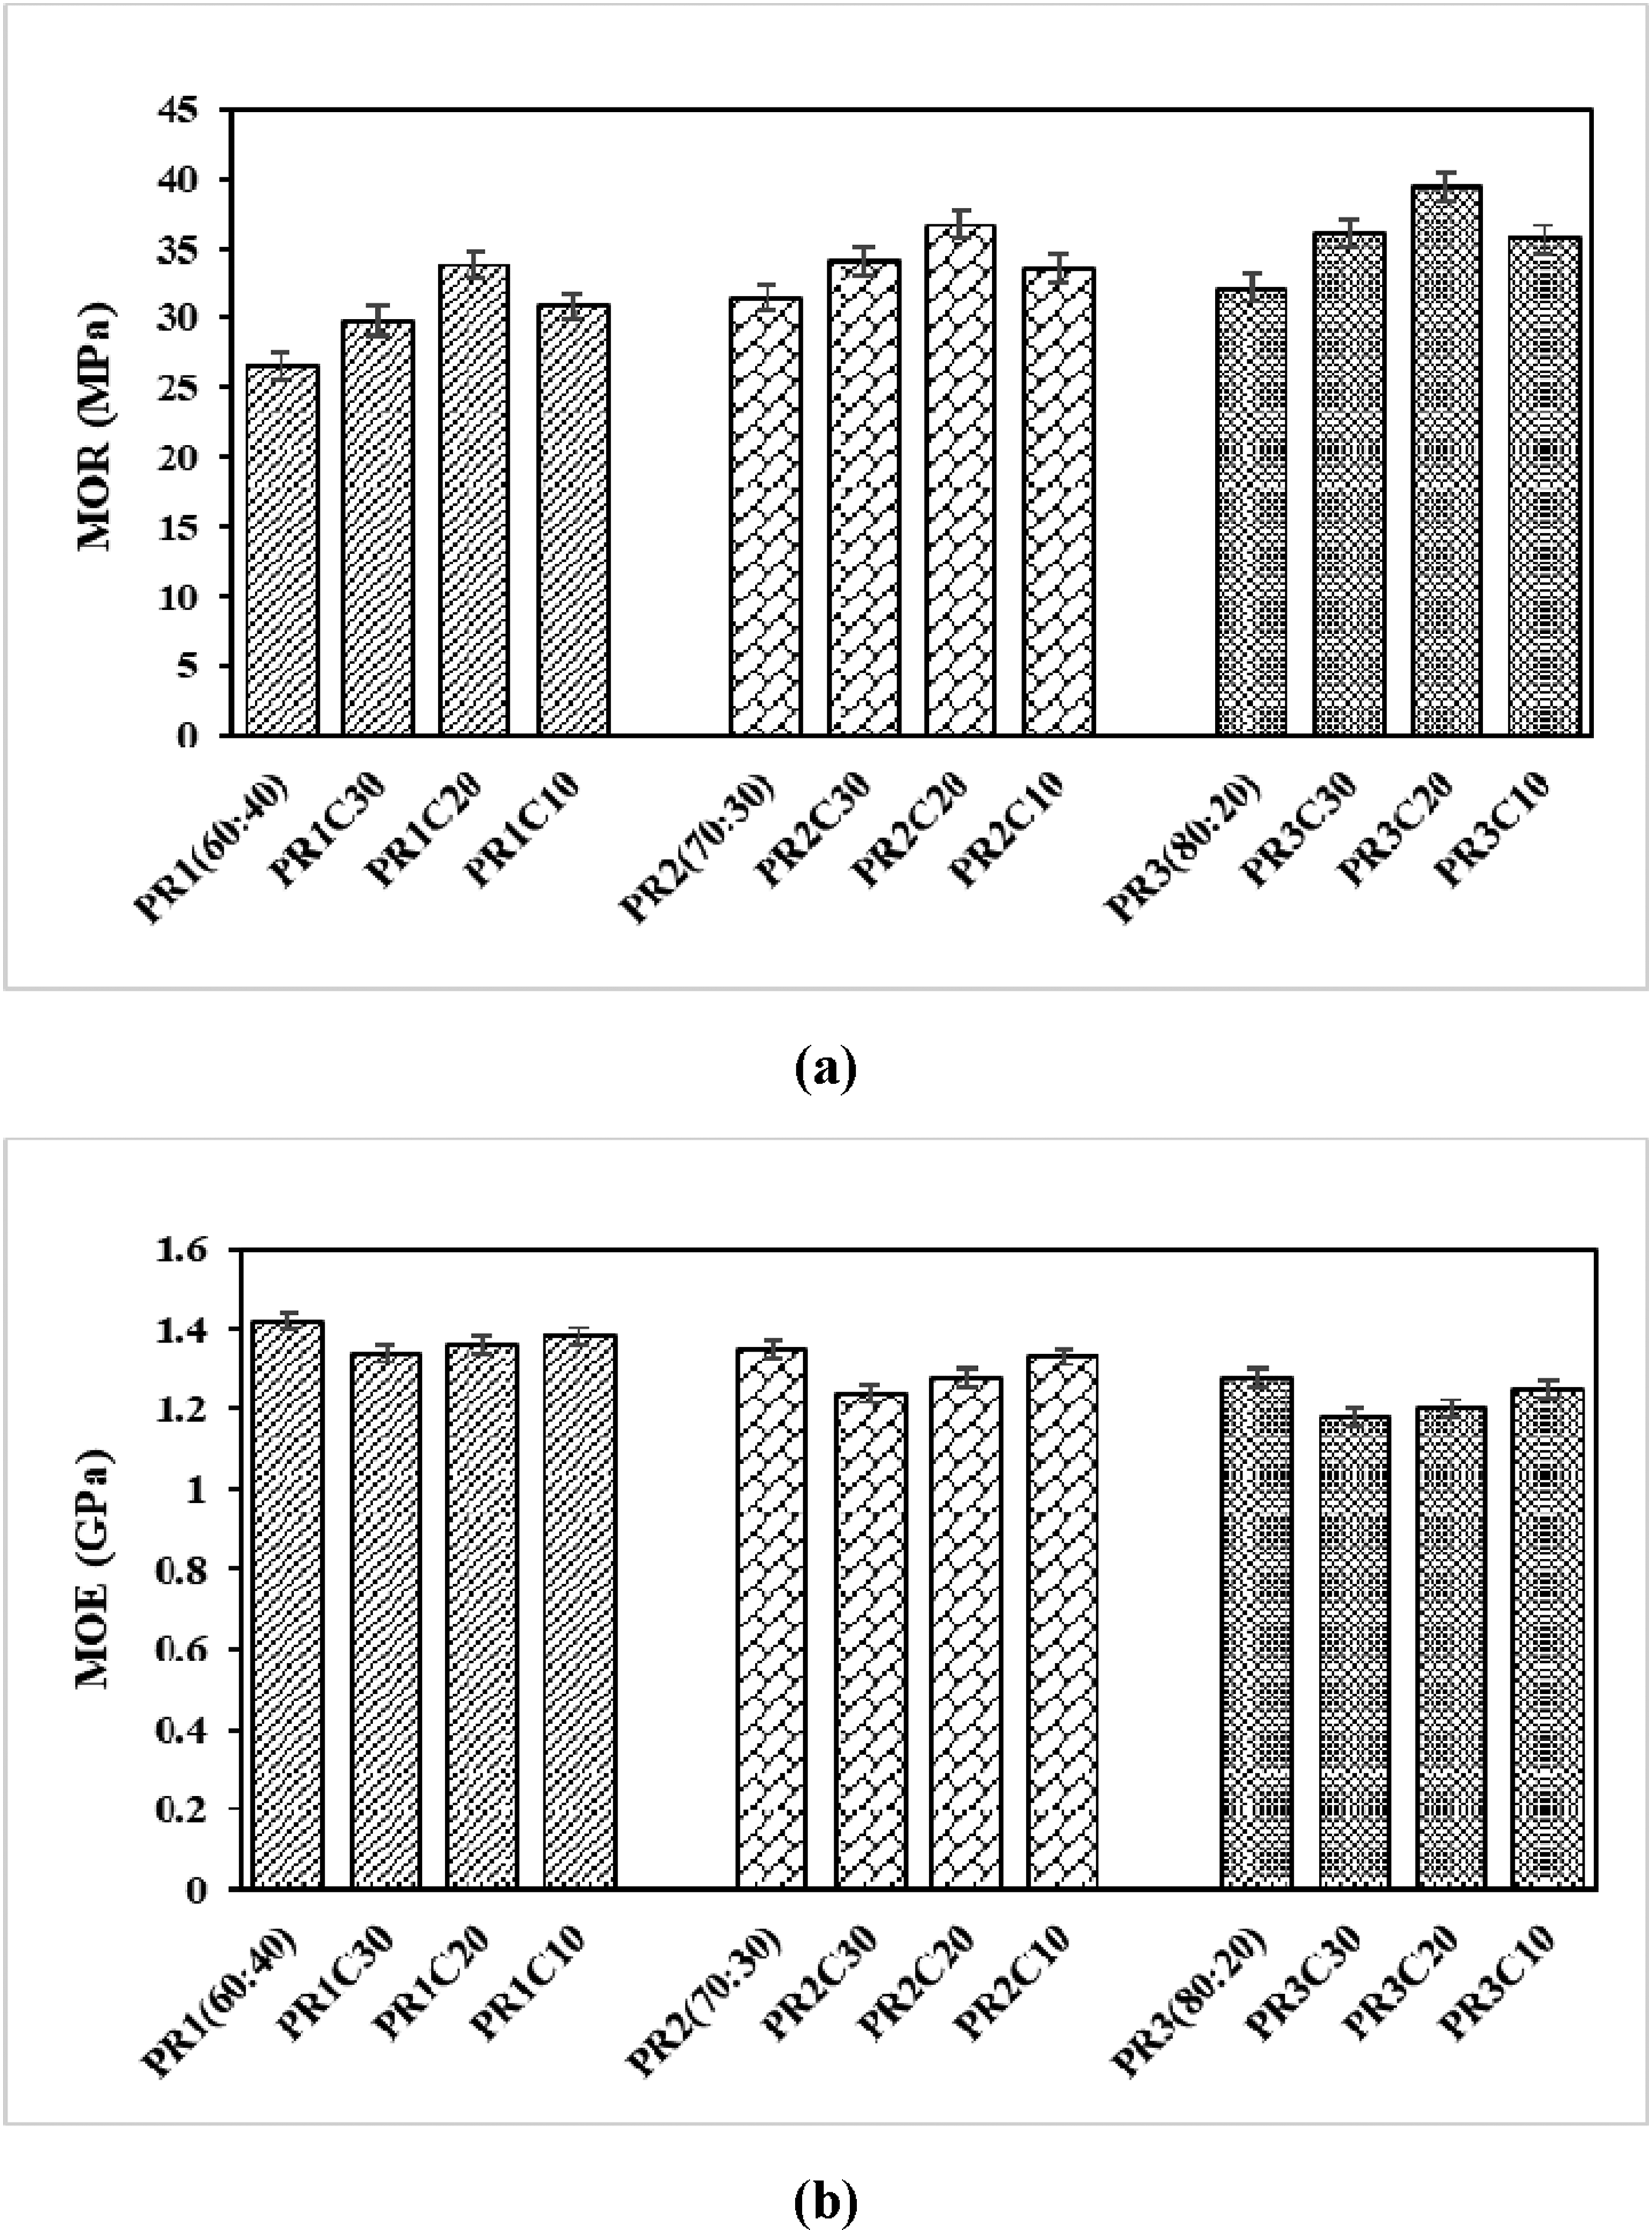
Moreover, the MOR increased by increasing the CS content from 10 to 20 wt%, while the MOR decreased when the CS content was 30 wt%. The decrease in the MOR results from agglomeration, inadequate dispersion and insufficient bonding of the latex sludge flour inside the PP matrix. 35 Therefore, PR3C20 showed the highest MOR. For example, the MOR of PR3C20 was higher than PR3C30 and PR3C10, which had MOR of 39.44 MPa, 36.10 MPa, and 35.67 MPa, respectively. It is agreement with Soundhar and Kandasamy 36 who reported that the flexural stress was enhanced with moderate inclusion of crab shell particles up to 4 wt.%. However, the addition of more than 4 wt.% of crab shell particles in the polymer composites shows decreasing properties, due to the agglomeration between matrix and fiber. Moreover, the composites have lower flexural strength, due to weak interfacial bonding between fiber and matrix. The presence of voids in the composite structure further leads to matrix damage during flexural loading, as evidenced by SEM images. Similarly, Vengadesan et al. 37 who concluded that adding graphite up to 10% improves flexural strength and modulus due to graphite enhances better mechanical interlocking and reduces voids in composites. On the other hand, excess graphite (15 and 20%) decreases the flexural properties due to weakened interfacial bonding from agglomeration.
Furthermore, the NR content effected on the MOE of TPEs composites which the MOE increased when the NR content increased from 20 to 40 wt% as shown in Figure 1(b). When comparing the MOE of TPEs composites with different ratio of NR content. The results showed that PR1 gave the highest MOE (1.42 GPa) of the TPEs, followed by PR2 (1.35 GPa), and PR3 (1.28 GPa), respectively. In addition, the MOE of TPEs composites decreased when the CS content was increased from 10 to 30 wt%. For example, the MOE of PR1 made from 10 wt% CS content was higher than that of TPEs composite made from 20 wt% and 30 wt%, which had the MOE of 1.38 GPa, 1.36 GPa, and 1.34 GPa, respectively.
Mechanical responses of the TPEs composites.
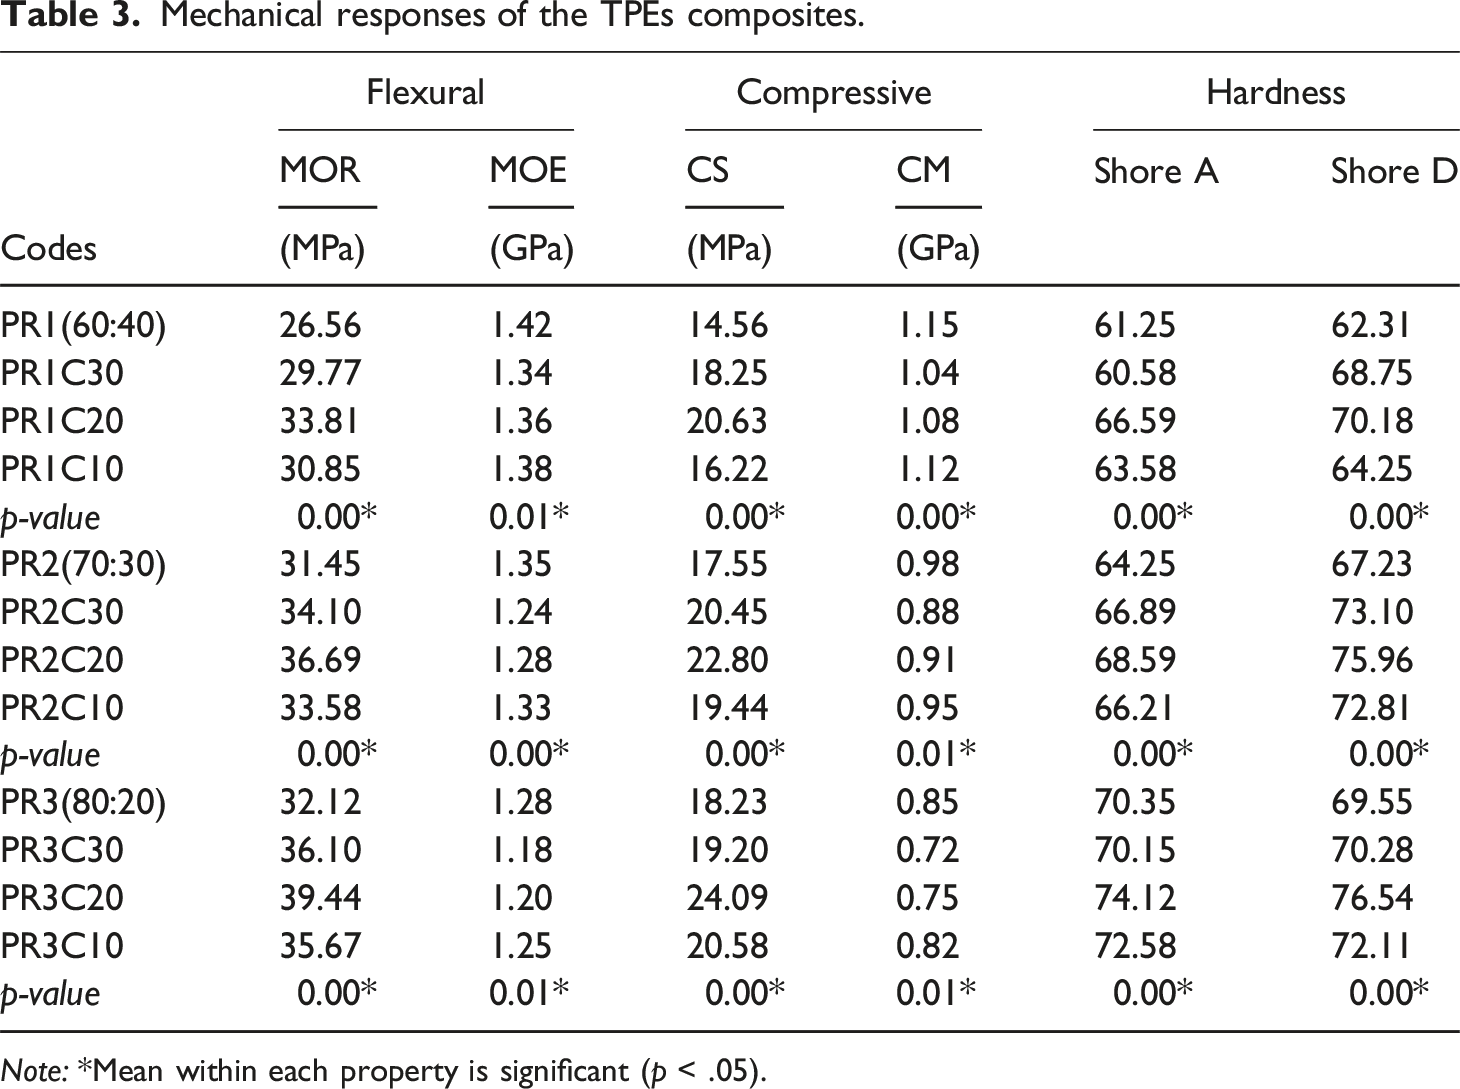
Note: *Mean within each property is significant (p < .05).
Compressive analysis
The compressive properties of thermoplastic elastomer (TPEs) composites are presented in Figure 2 and Table 3. It is observed that the addition of natural rubber (NR) to the recycled high-density polyethylene (rHDPE) resulted in a reduction in the compressive strength (CS) of TPEs composites as shown in Figure 2(a). The composites having the different composition of PR1 (40 wt% NR), PR2 (30 wt% NR) and PR3 (20 wt% NR) gave the CS of 14.56 MPa, 17.55 MPa, and 18.23 MPa, respectively. This observation is consistent with the fact that NR, being a flexible elastomer, reduces the stiffness of the composite. Conversely, composites with lower NR content show superior compressive performance, likely due to a higher proportion of thermoplastic phases, which contribute to increased structural rigidity.38,39 The compressive properties of TPEs composites: (a) compressive strength (CS) and (b) compressive modulus (CM).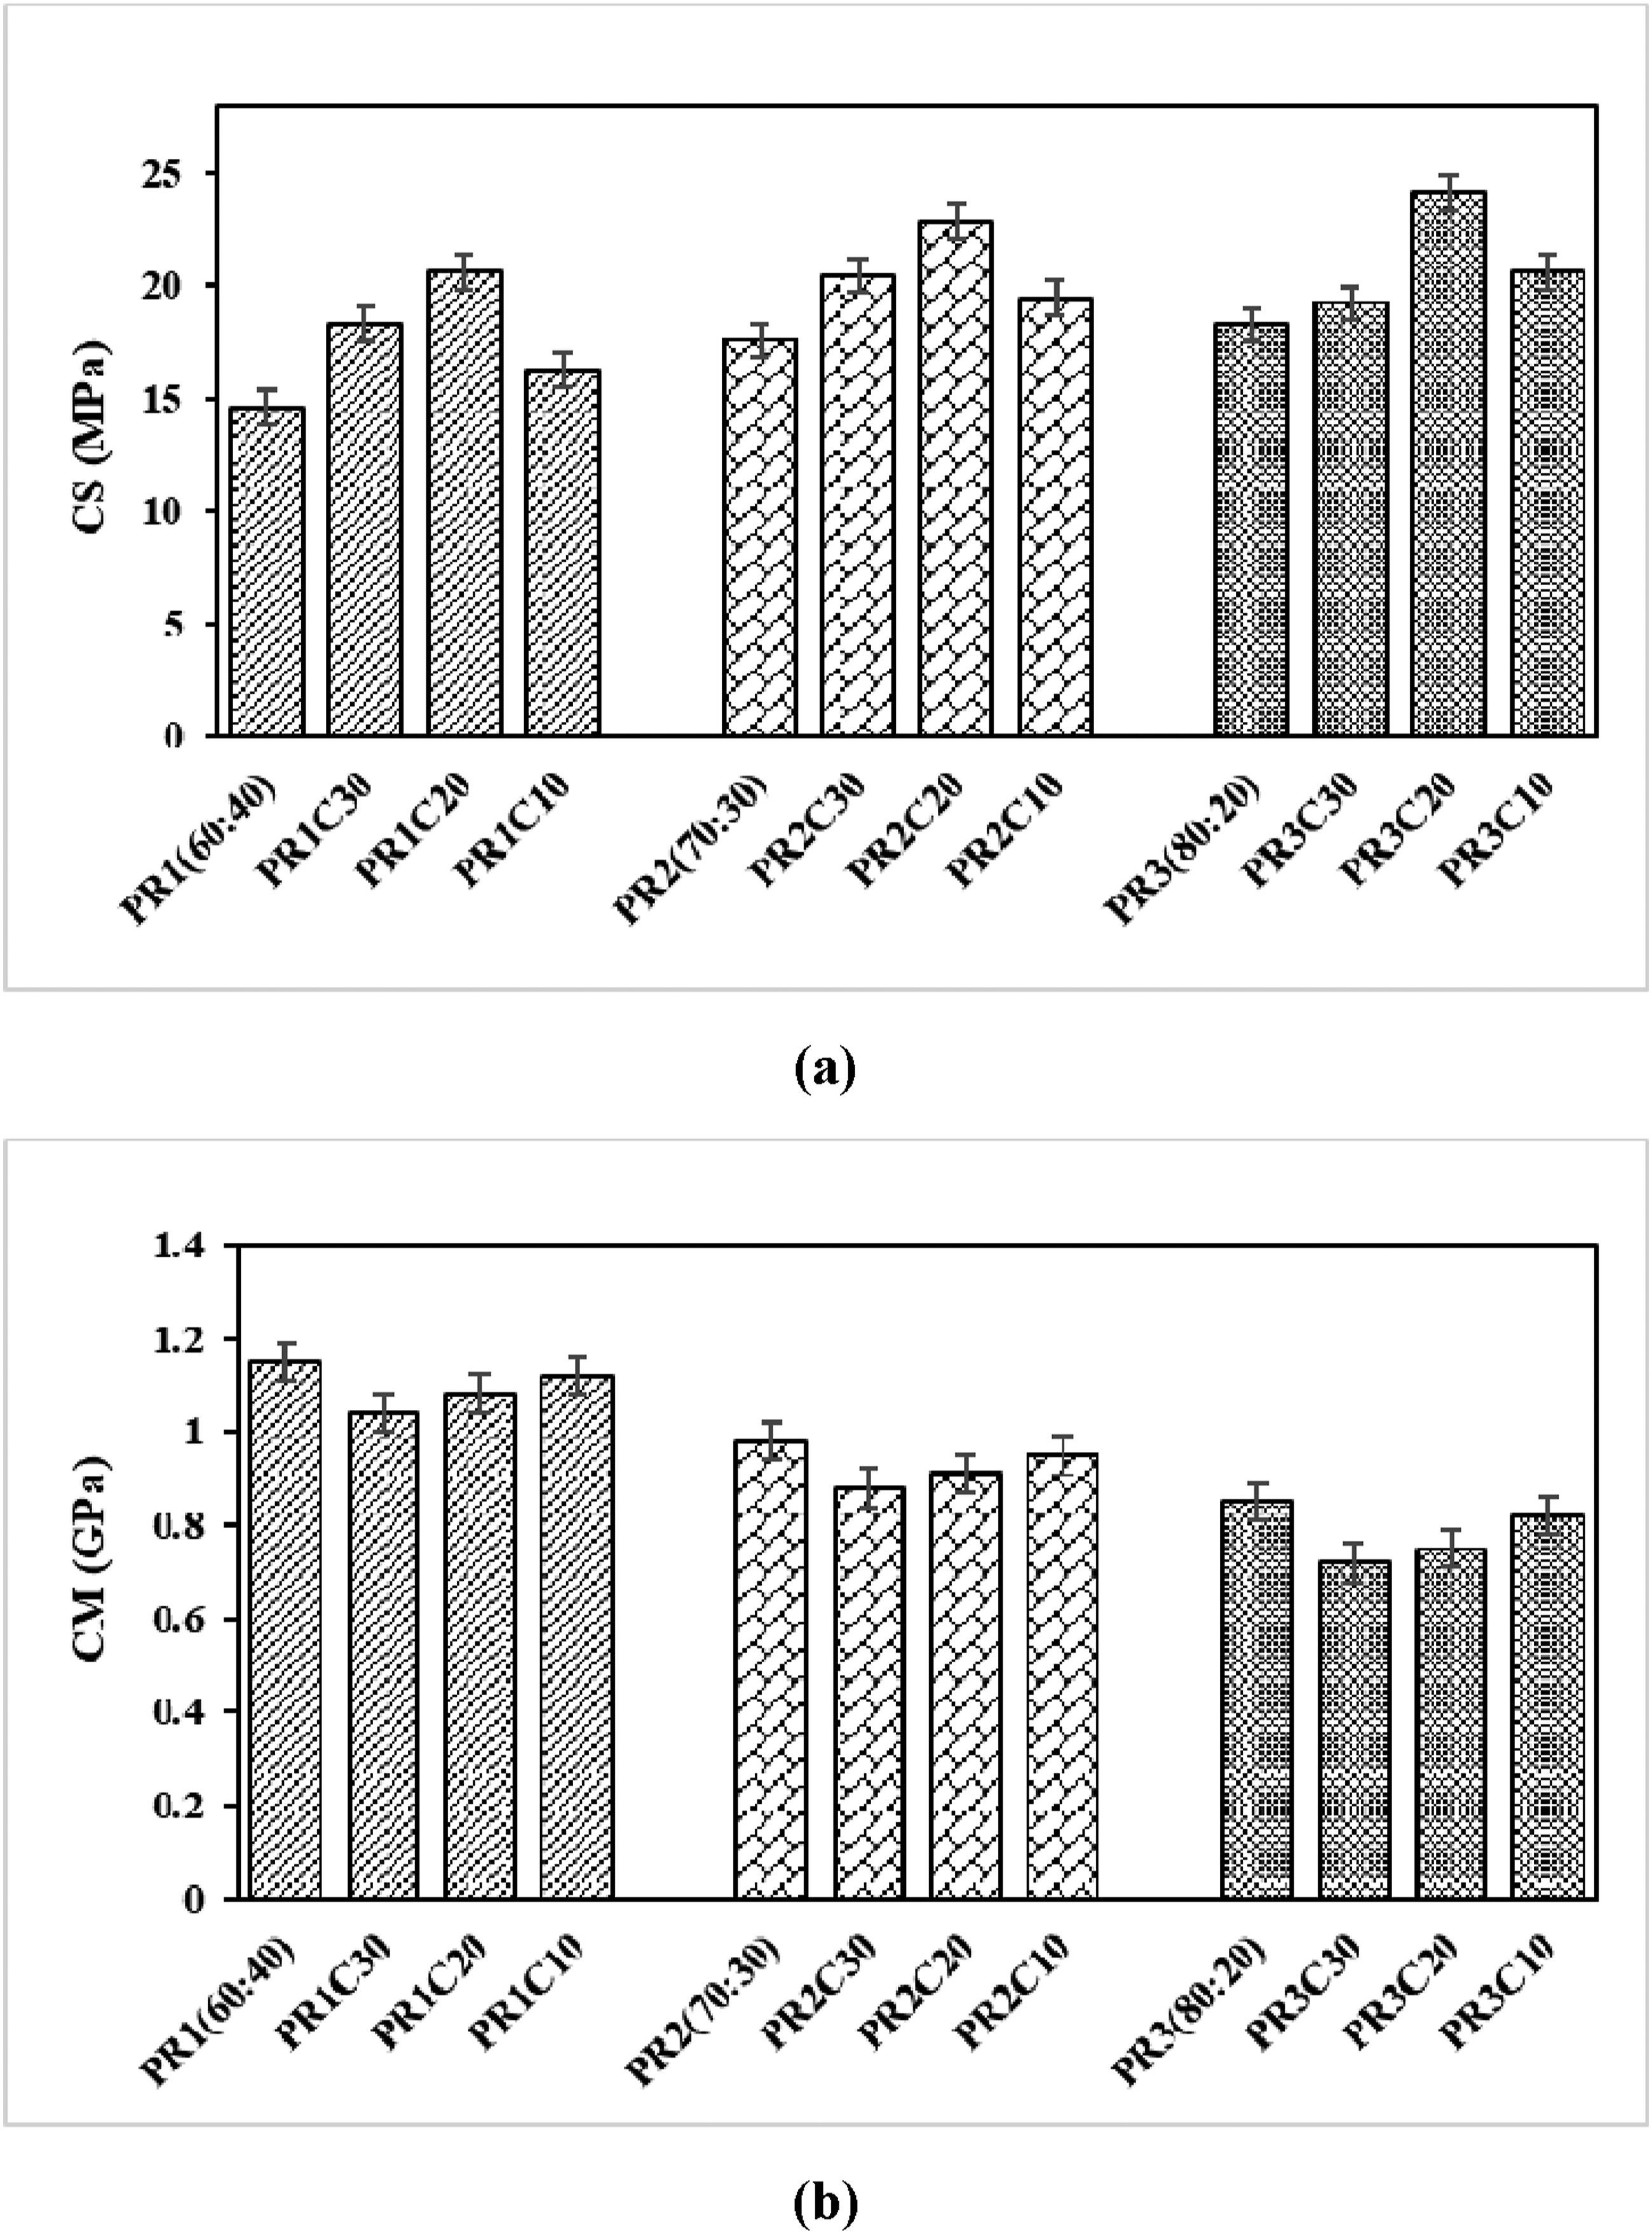
In addition, the crab content significantly affected the CS of composites as shown in Table 3. The results established that the TPEs composites with 20 wt% crab gave the highest CS, followed by 30 wt% crab and 10 wt% crab, respectively. For example, the TPEs with 30 wt% NR having the crab content of 20 wt%, 10 wt%, and 30 wt% gave the CS of 24.09 MPa, 20.58 MPa, and 19.20 MPa, respectively. Moreover, Landry et al. 40 found that composites reinforced with up to 20 wt% bio-fillers exhibited superior mechanical strength, while those exceeding this threshold showed diminishing returns due to aggregation effects. This finding is consistent with the present study, where composites containing 20 wt% CS exhibited the highest compressive strength, while those with 30 wt% experienced a decline.
On the other hand, increasing the NR content in the composites resulted in higher CM as shown in Figure 2(b). The highest CM was found to be the 40 wt% NR of TPEs composites, value of which was 1.15 GPa. This was followed by 30 wt% NR (0.98 GPa) and 20 wt% NR (0.85 GPa), respectively. This finding implies that when NR content is reduced, the elastomeric nature of the composite becomes more dominant, leading to increased flexibility and decreased stiffness. Furthermore, the addition of the crab had a significant (p < .05) effect on the CM of the TPEs as shown in Table. 3. The CM decreased when the crab content was increased from 10 to 30 wt% which p-value of 0.00, 0.01, and 0.01, respectively. When comparing the CM of TPEs composites with 40 wt% NR, the results showed that the composites with 10 wt% crab gave the highest CM (1.12 GPa), followed by 20 wt% crab (1.08 GPa), and 10 wt% crab (1.04 GPa), respectively. The decrease in modulus with increasing CS content suggests that higher filler loading may disrupt the polymer matrix, leading to weaker interfacial bonding and increased porosity, which negatively impacts stiffness. Similarly, Xu et al. 39 highlighted that chitin- and cellulose-based fillers in elastomeric composites exhibited an optimal reinforcement effect at 15-20 wt%, beyond which matrix discontinuities and weak interfacial adhesion contributed to reduced mechanical strength. Vengadesan et al. 37 who reported that the optimal graphite content for the hybrid composites is 10%, beyond which no significant improvement in compressive strength is observed. Anjum et al. 41 who concluded that the compressive strength is decreased for bio-filled gypsum composites due to the compatibility of bamboo and rice husk fillers with the gypsum matrix. While the increased modulus of the bio-filled gypsum composites is attributed to the inherent high load-bearing capacity of the particles and the increase in the compressive modulus of the composites, and it indicates a significant improvement due to the incorporation of bio-fillers.
Hardness analysis
The hardness properties of thermoplastic elastomer (TPE) composites composed of different natural rubber (NR) ratios and varying crab shell (CS) filler concentrations as shown in Figure 3. The results presented that the addition of CS filler significantly influenced the Shore A and Shore D hardness of the composites, with variations observed depending on the NR content as shown in Figure 3(a) and (b), respectively. For PR1 (40 wt% NR), the base material exhibited the lowest hardness, increasing with increasing CS content. PR1 recorded a Shore A hardness of 61.25 and Shore D hardness of 62.31, whereas PR1C20 exhibited the highest hardness, reaching 66.59 Shore A and 70.18 Shore D. Similarly, PR2 (30 wt% NR) and PR3 (20 wt% NR) demonstrated increasing hardness values with higher CS concentrations, with PR3C20 attaining the highest hardness value of 74.12 Shore A and 76.54 Shore D. The hardness properties (HN) of TPEs composites: (a) Shore A durometer test and (b) Shore D durometer test.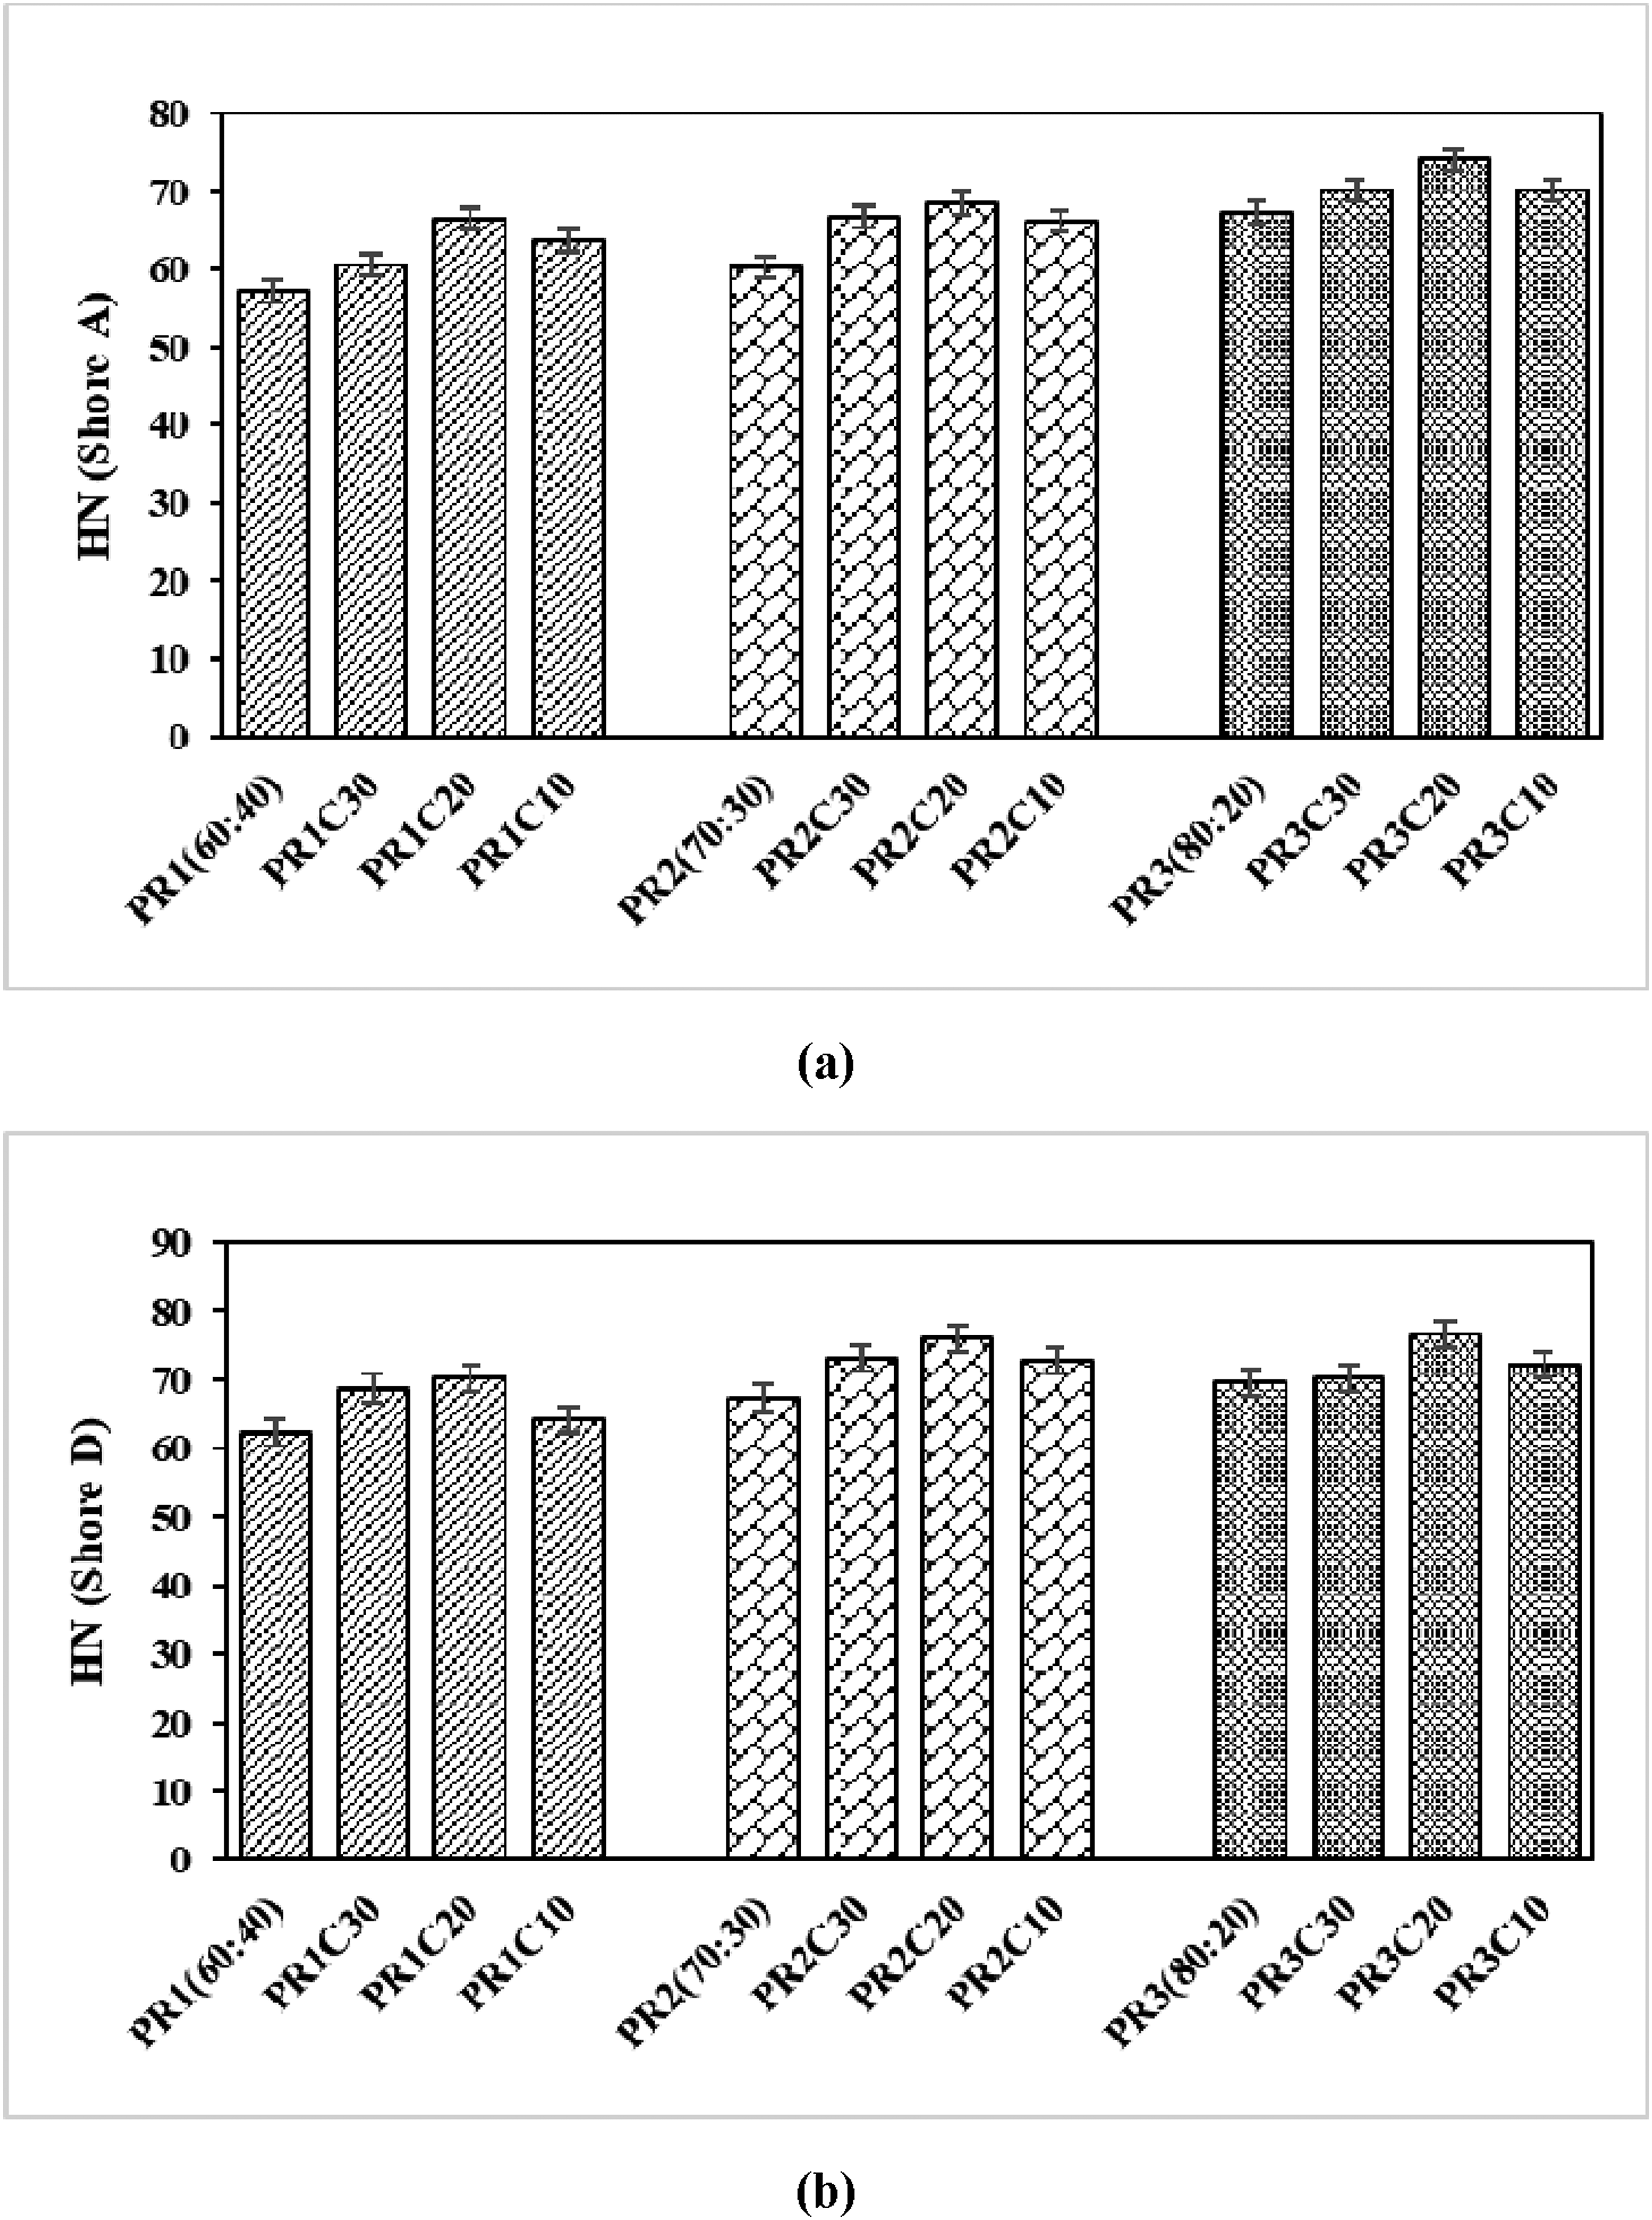
From Table 3, the statistically significant p-values (<0.05) confirm that the observed differences in hardness across all formulations are meaningful and dependent on composite composition. Moreover, the observed increase in hardness with higher CS content can be attributed to the rigid nature of the crab filler particles, which act as reinforcements within the NR matrix. The introduction of rigid fillers limits the mobility of polymer chains, thereby reducing material flexibility and leading to an overall increase in hardness. Additionally, the decrease in NR content (from PR1 to PR3) further contributes to higher composite stiffness. Since NR is inherently elastic and soft, reducing its proportion results in a stiffer composite structure, particularly when coupled with the reinforcing effect of crab filler. This is because NR has a lower hardness than plastic, resulting in a more flexibility of composites. 42
A notable trend in the Shore A and Shore D hardness values suggests that Shore D hardness increases at a greater rate with the incorporation of crab fillers compared to Shore A hardness. This indicates that crab fillers have a more pronounced effect on the resistance to indentation under higher applied forces, reinforcing their role in enhancing material rigidity. An interesting observation is the non-linear increase in hardness with increasing filler content. While PR3C20 (74.12 Shore A, 76.54 Shore D) demonstrates the highest hardness, the difference between PR3C30 (70.15 Shore A, 70.28 Shore D) and PR3C10 (72.58 Shore A, 72.11 Shore D) is relatively small. This suggests that beyond a certain threshold, additional filler content does not proportionally increase hardness, likely due to filler aggregation and diminishing dispersion efficiency within the polymer matrix. This is an agreement with Roy et al., 43 who investigated the effects of excessive natural filler content in hybrid polymer composites and found that at high concentrations, filler particles clustered together, creating stress concentration points that weakened mechanical performance. Ahmad et al., 44 who concluded that nanocomposites containing 0.25 wt% graphene nanoplatelets significant increase in hardness. Ahmad et al., 45 who reported that boron nitride nanoparticles (BNNP) improvements in hardness at low nanofiller concentrations, with BNNP outperforming other fillers (multiwalled carbon nanotubes, graphene nanoplatelets). This study offers insights into modifying material qualities according to the demands of high-performance additive manufacturing.
Physical properties of the TPEs composites
Water absorption and thickness swelling analysis
The effect of natural rubber (NR) and crab shell (CS) contents of thermoplastic elastomer (TPEs) composites on water absorption (WA) for 24 h and 3 months as shown in Figure 4(a) and (b), respectively. The results showed that PR3 had the least WA for 24 h and 3 months, which value of 0.98% and 4.56%, respectively. Moreover, the results indicate that the addition of CS filler significantly influenced both WA (24 h and 3 months), with variations observed depending on the NR content. For example, PR1 (NR 40%), the base material exhibited the lowest WA at 24 h (1.19%), which increased with increasing crab filler content, reaching 2.69% for PR1C30. The same trend was observed for 3 months WA, where PR1 showed an initial value of 8.59%, increasing to 11.06% for PR1C30. A similar trend was observed for PR2 (NR 30%) and PR3 (NR 20%), where higher crab filler concentrations resulted in increased WA over both time intervals. The water absorption properties (WA) of TPEs composites: (a) WA for 24 h. and (b) WA for 3 months.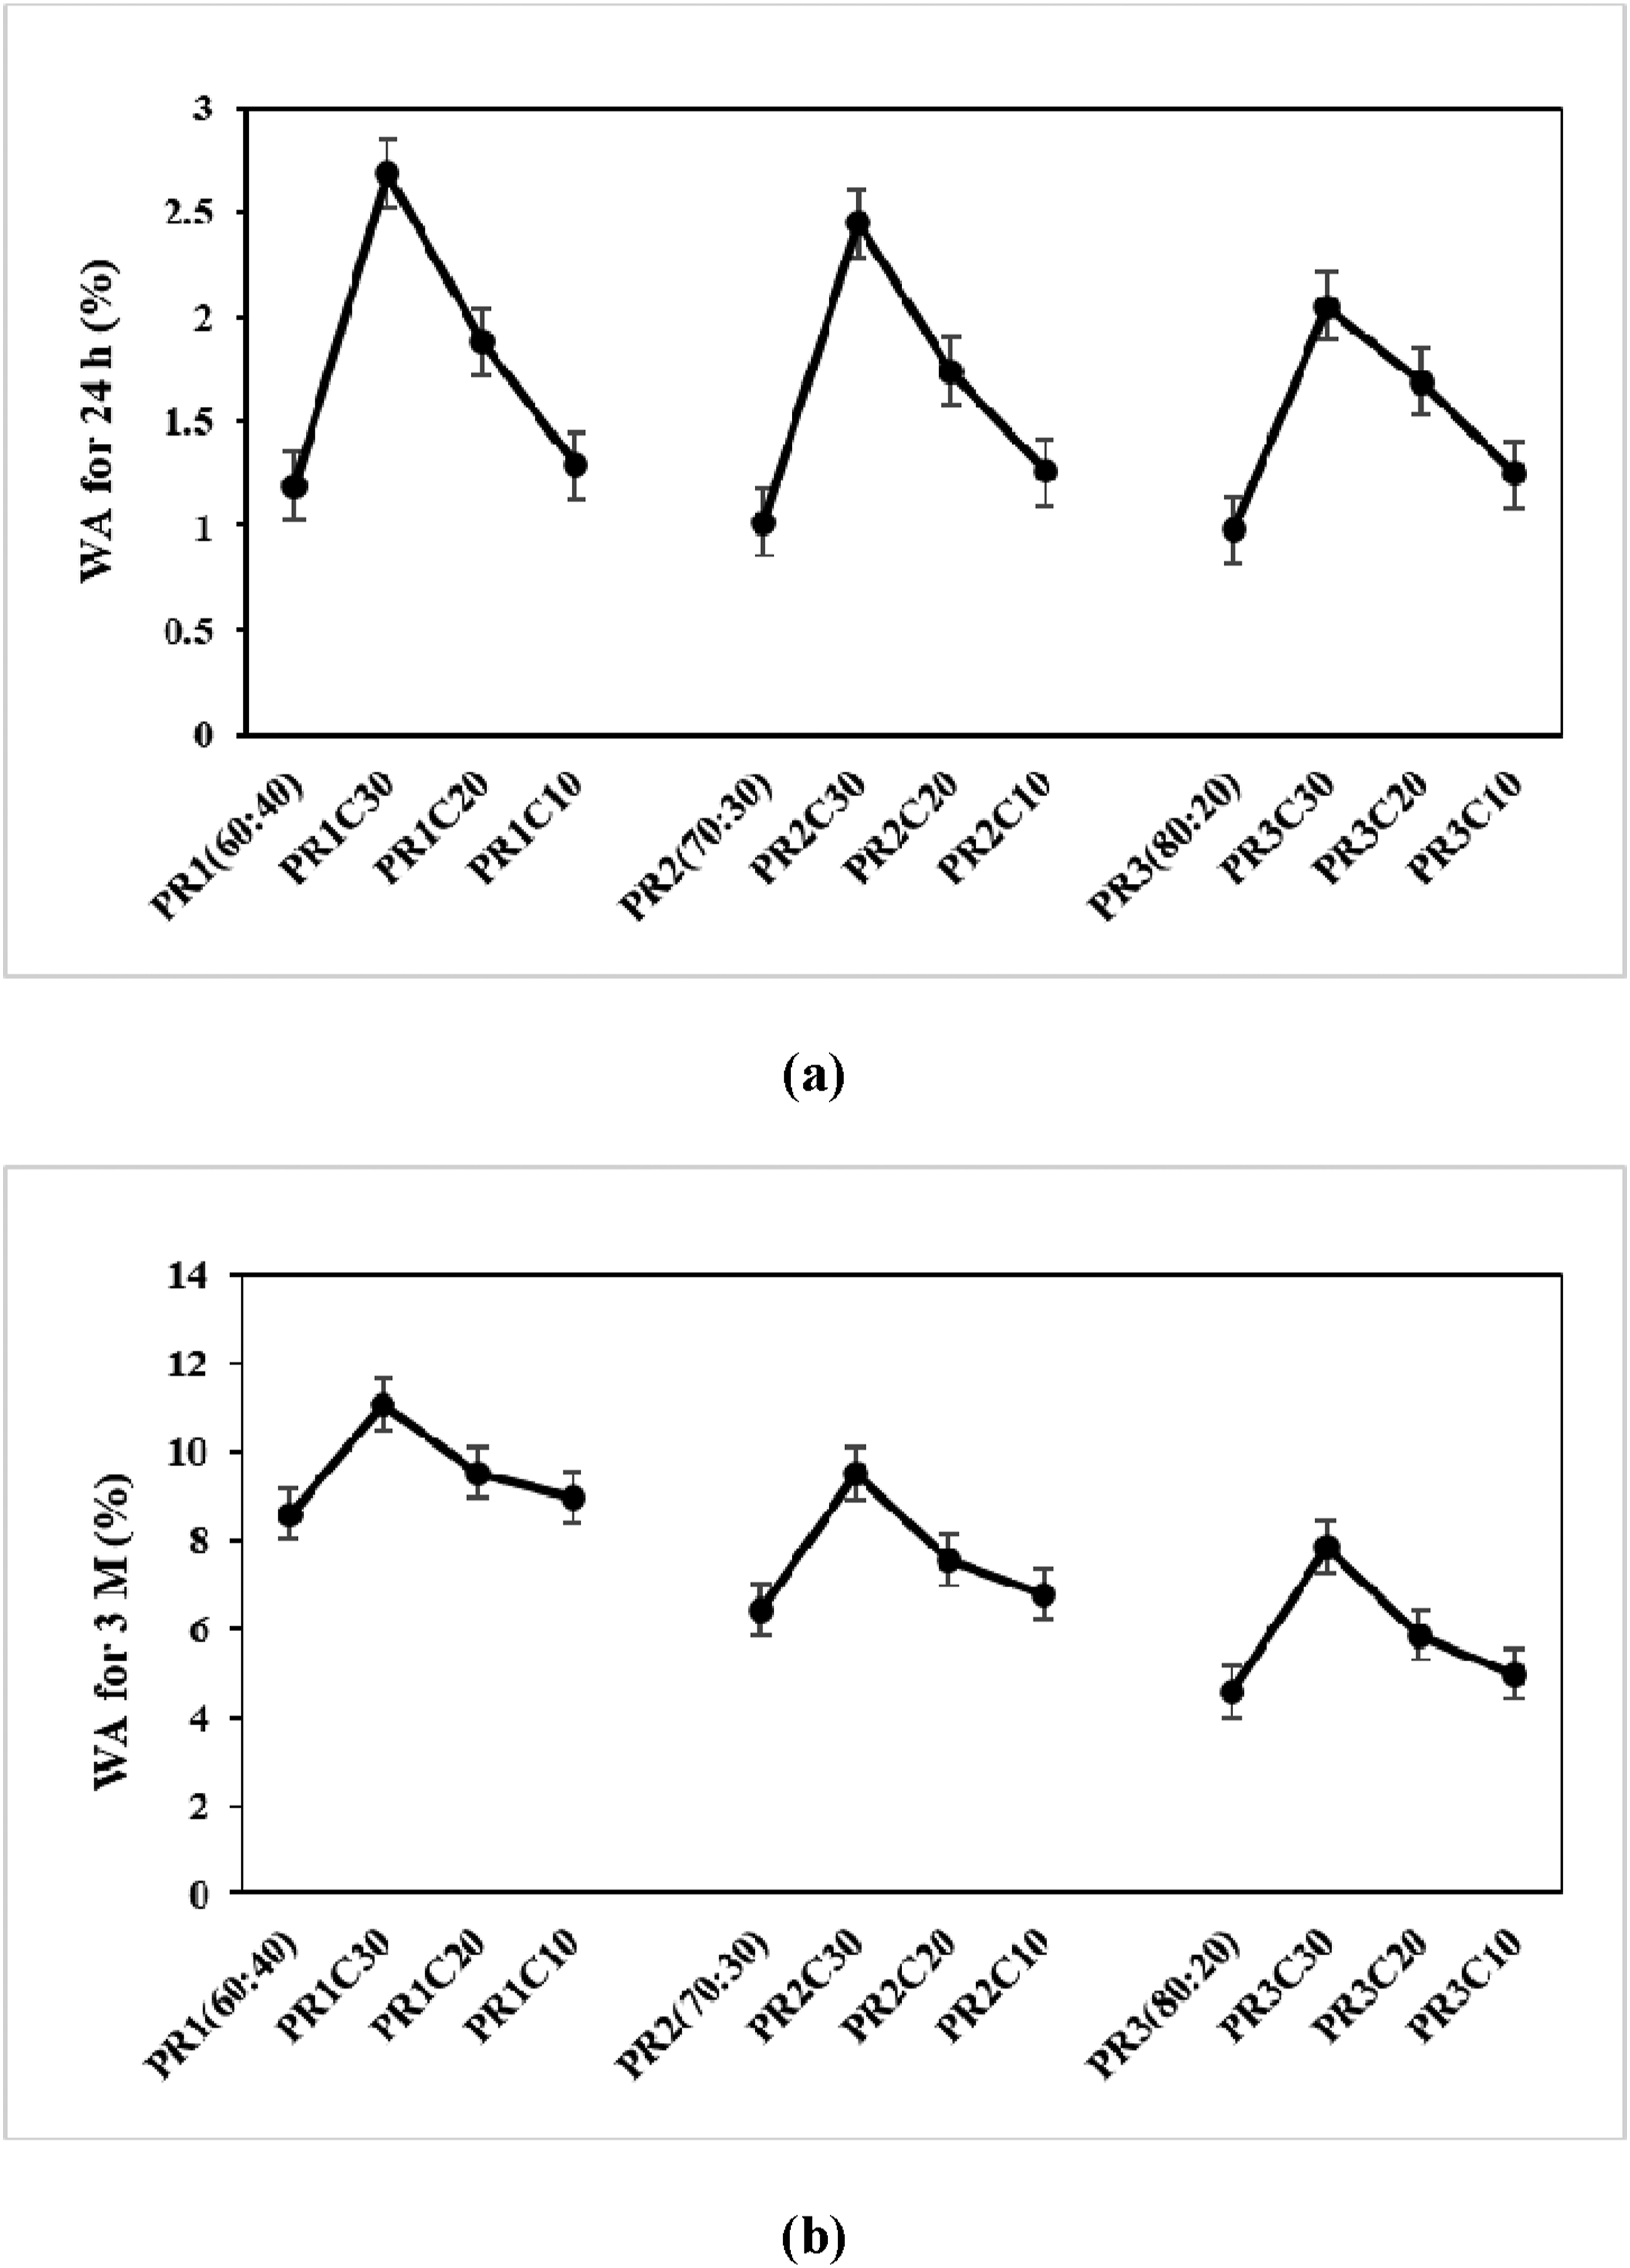
Furthermore, the WA responses of TPEs composites reinforced with CS fillers were analyzed through thickness swelling measurements over short-term (24 h) and long-term (3 months) immersion periods as shown in Figure 5(a) and (b), respectively. The results highlight the role of NR content in mitigating swelling effects. PR3 composites (20 wt% NR) consistently exhibited the lowest swelling values across all CS concentrations. The unreinforced PR3 sample recorded the least swelling (0.75% at 24 h, 4.10% after 3 months), while PR3C30, the most hydrophilic formulation, exhibited moderate swelling relative to PR1 and PR2 composites. This suggests that a higher NR content reduces filler percolation pathways, thereby limiting water uptake and enhancing composite durability. The thickness swelling properties (TS) of TPEs composites: (a) TS for 24 h. and (b) TS for 3 months.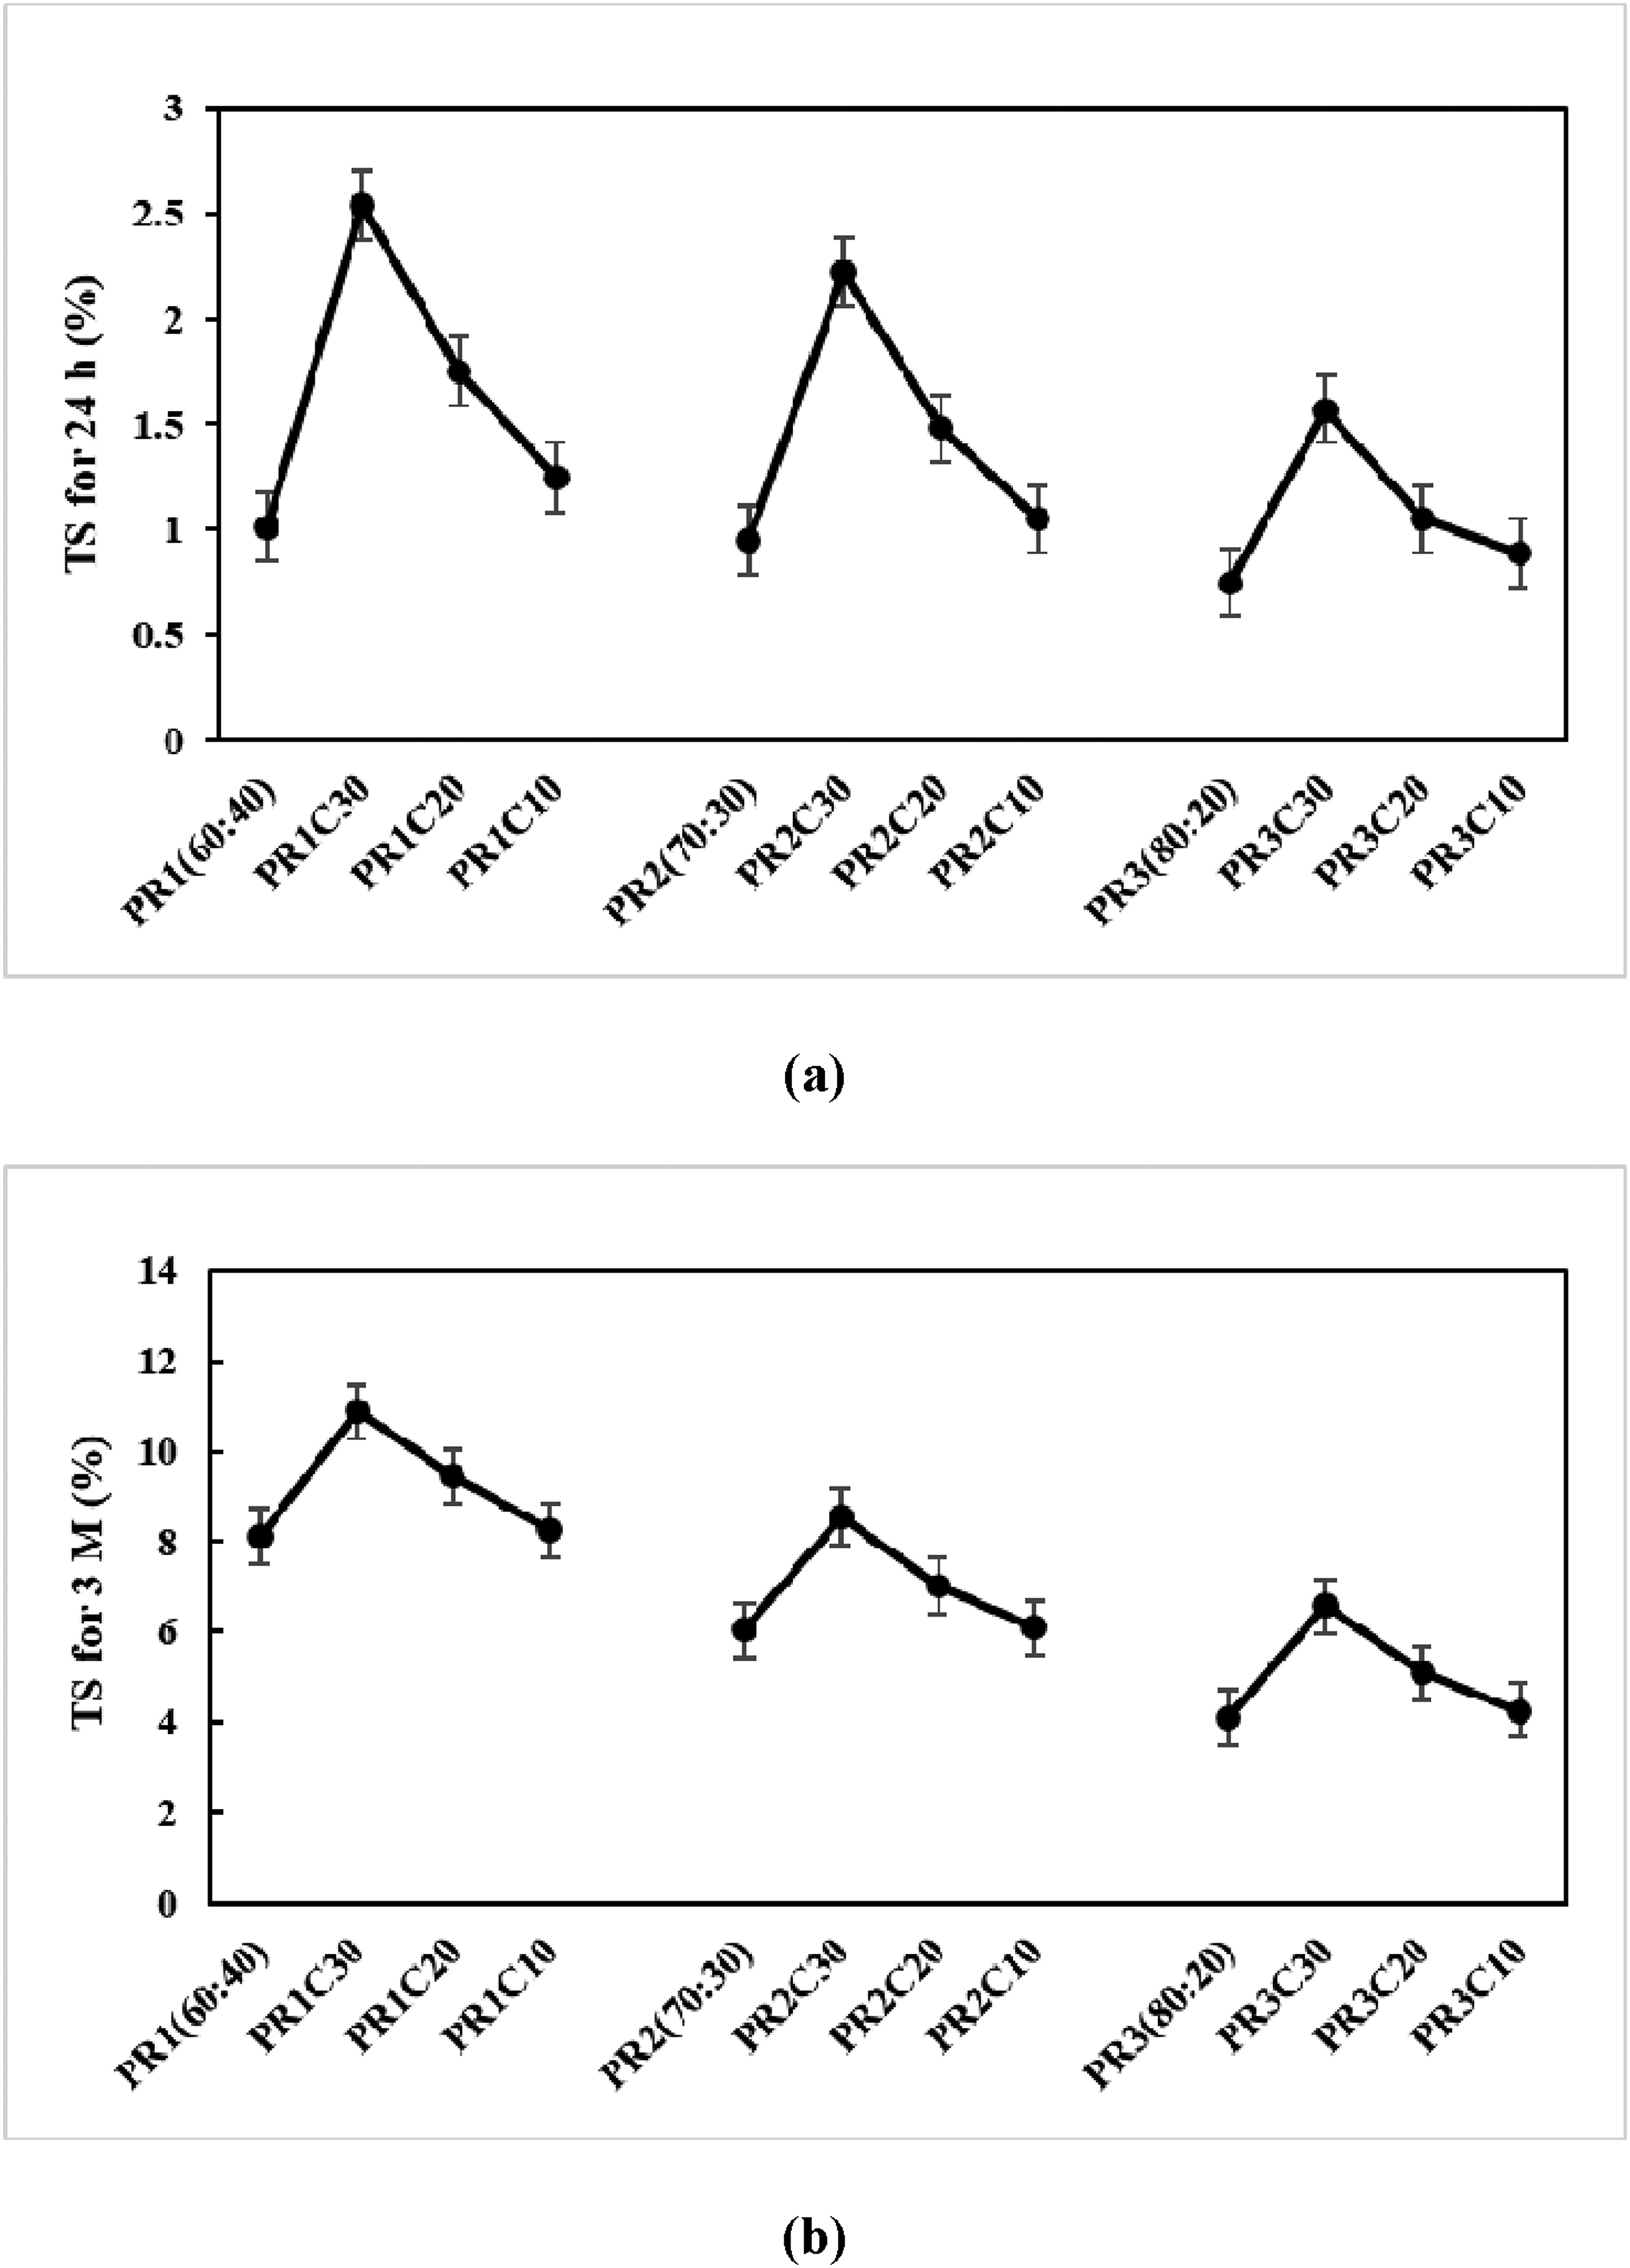
Across all NR formulations, TS increased with rising CS content. In PR1 composites (40 wt% NR), the highest swelling values were observed at 30 wt% CS (PR1C30), with a 24-hour swelling of 2.54% and a long-term swelling of 10.88%. This represents a substantial increase compared to the unreinforced PR1 sample, which exhibited swelling of 1.01% and 8.12% in 24 hours and 3 months, respectively. Similar trends were observed in PR2 (30 wt% NR) and PR3 (20 wt% NR) composites, with PR3C30 recording the highest swelling values (1.57% at 24 h and 6.58% after 3 months).
The changes in WA and TS can be attributed to the hydrophilic nature of CS filler and its interaction with the polymer matrix. This is due to the crab-based fillers contain bio-organic materials that are inherently more prone to moisture uptake, which explains why increasing the crab filler content results in higher WA and swelling values.
Physical responses of the TPEs composites.
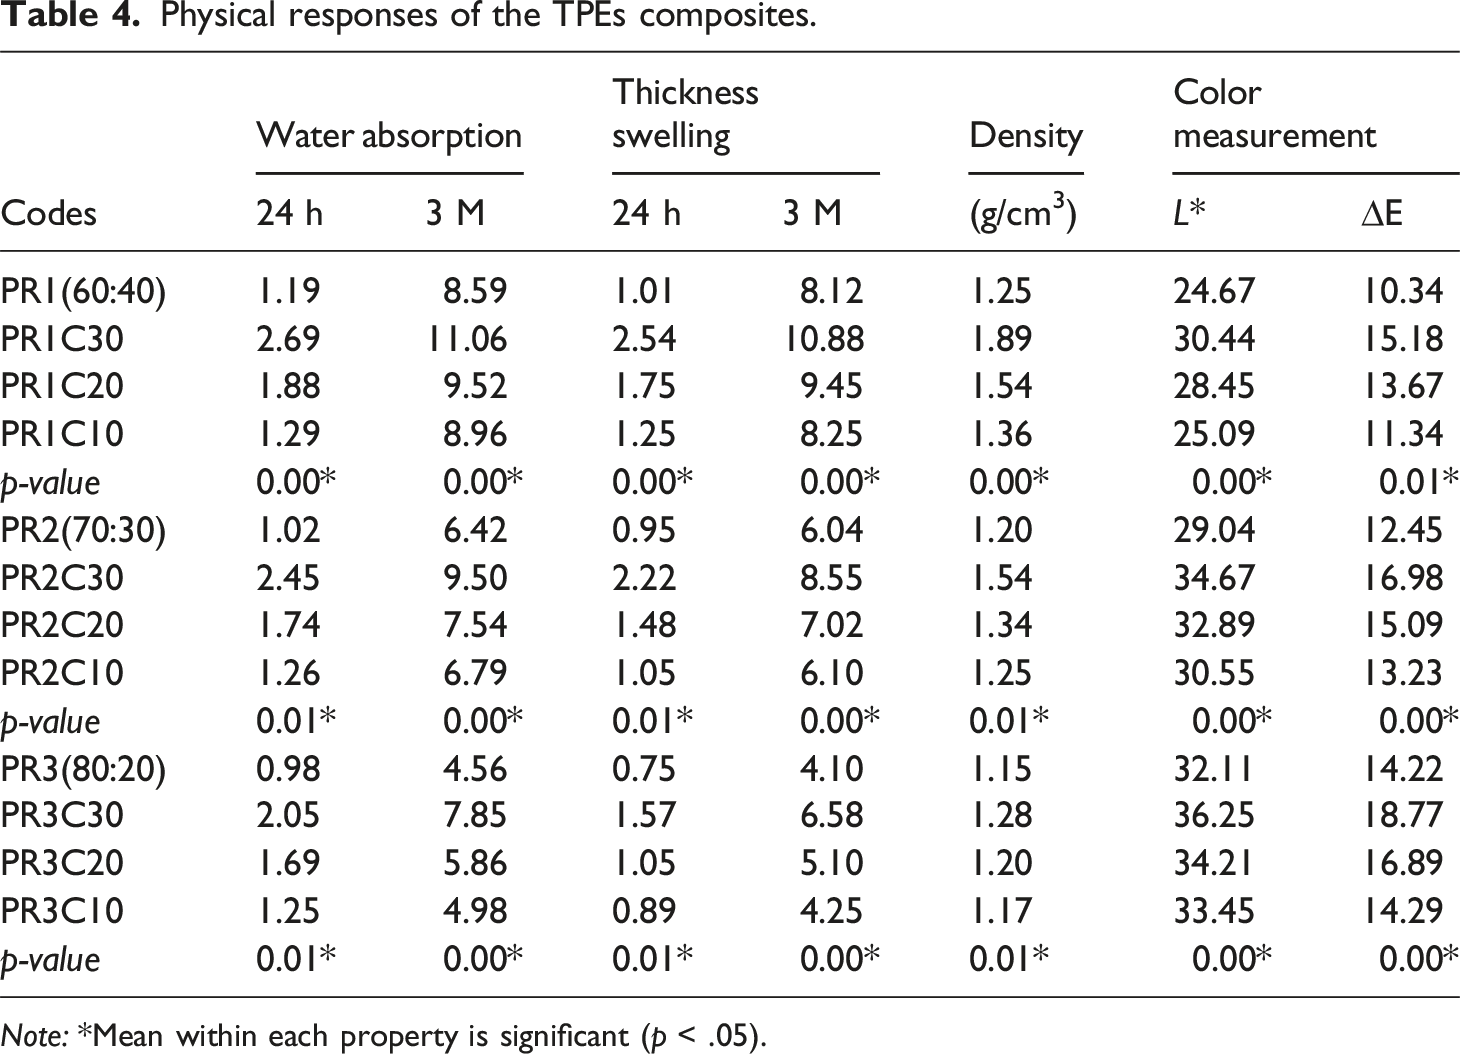
Note: *Mean within each property is significant (p < .05).
Density analysis
Density measurement becomes essential for determining the durability of WPCs due to oxidation process caused by oxygen penetration into the plastic matrix.
46
The density responses of thermoplastic elastomer (TPE) composites composed of different natural rubber (NR) ratios and varying crab shell (CS) filler concentrations as shown in Figure 6. The results presented in Table 4 indicate that the addition of CS fillers significantly influenced the density of the composites, with variations observed depending on the NR content. For PR1 (40 wt% NR), the base material exhibited a density of 1.25 g/cm3. When the addition of CS filler, the density increased, with PR1C30 reaching 1.89 g/cm3. Similarly, PR2 (30 wt% NR) and PR3 (20 wt% NR) showed an increasing trend in density with rising CS content, with PR2C30 and PR3C30 attaining densities of 1.54 g/cm3 and 1.28 g/cm3, respectively. The changes in density can be attributed to the dispersion and interaction of CS filler within the polymer matrix. CS fillers possess higher intrinsic densities compared to the elastomer matrix. Consequently, increasing the CS concentration results in an overall increase in the bulk density of the composites. This is in agreement with Homkhiew et al.,
12
who reported that the higher concentration of CS enhanced the density of the hybrid composites before and after immersion in distilled water and sea water. Landry et al.
40
reported that the incorporation of high-density bio-fillers led to measurable increases in composite density, aligning with the findings of Roy et al.,
43
who observed a similar trend in hybrid biopolymer composites reinforced with chitin-based materials. There is also research using bio fillers that reduce the density of the composite. Anjum et al.
41
who reported that the densities of the wood dust, bamboo powder, and rice husk powder-filled gypsum composites decreased by 8.77 %, 12.73 %, 6.45 % respectively due to the addition of 40 g filler compared to the density of the pure gypsum. So, the density of the composites is reduced with a high amount of filler in the composites. The density (DS) property with different compositions of TPEs composites.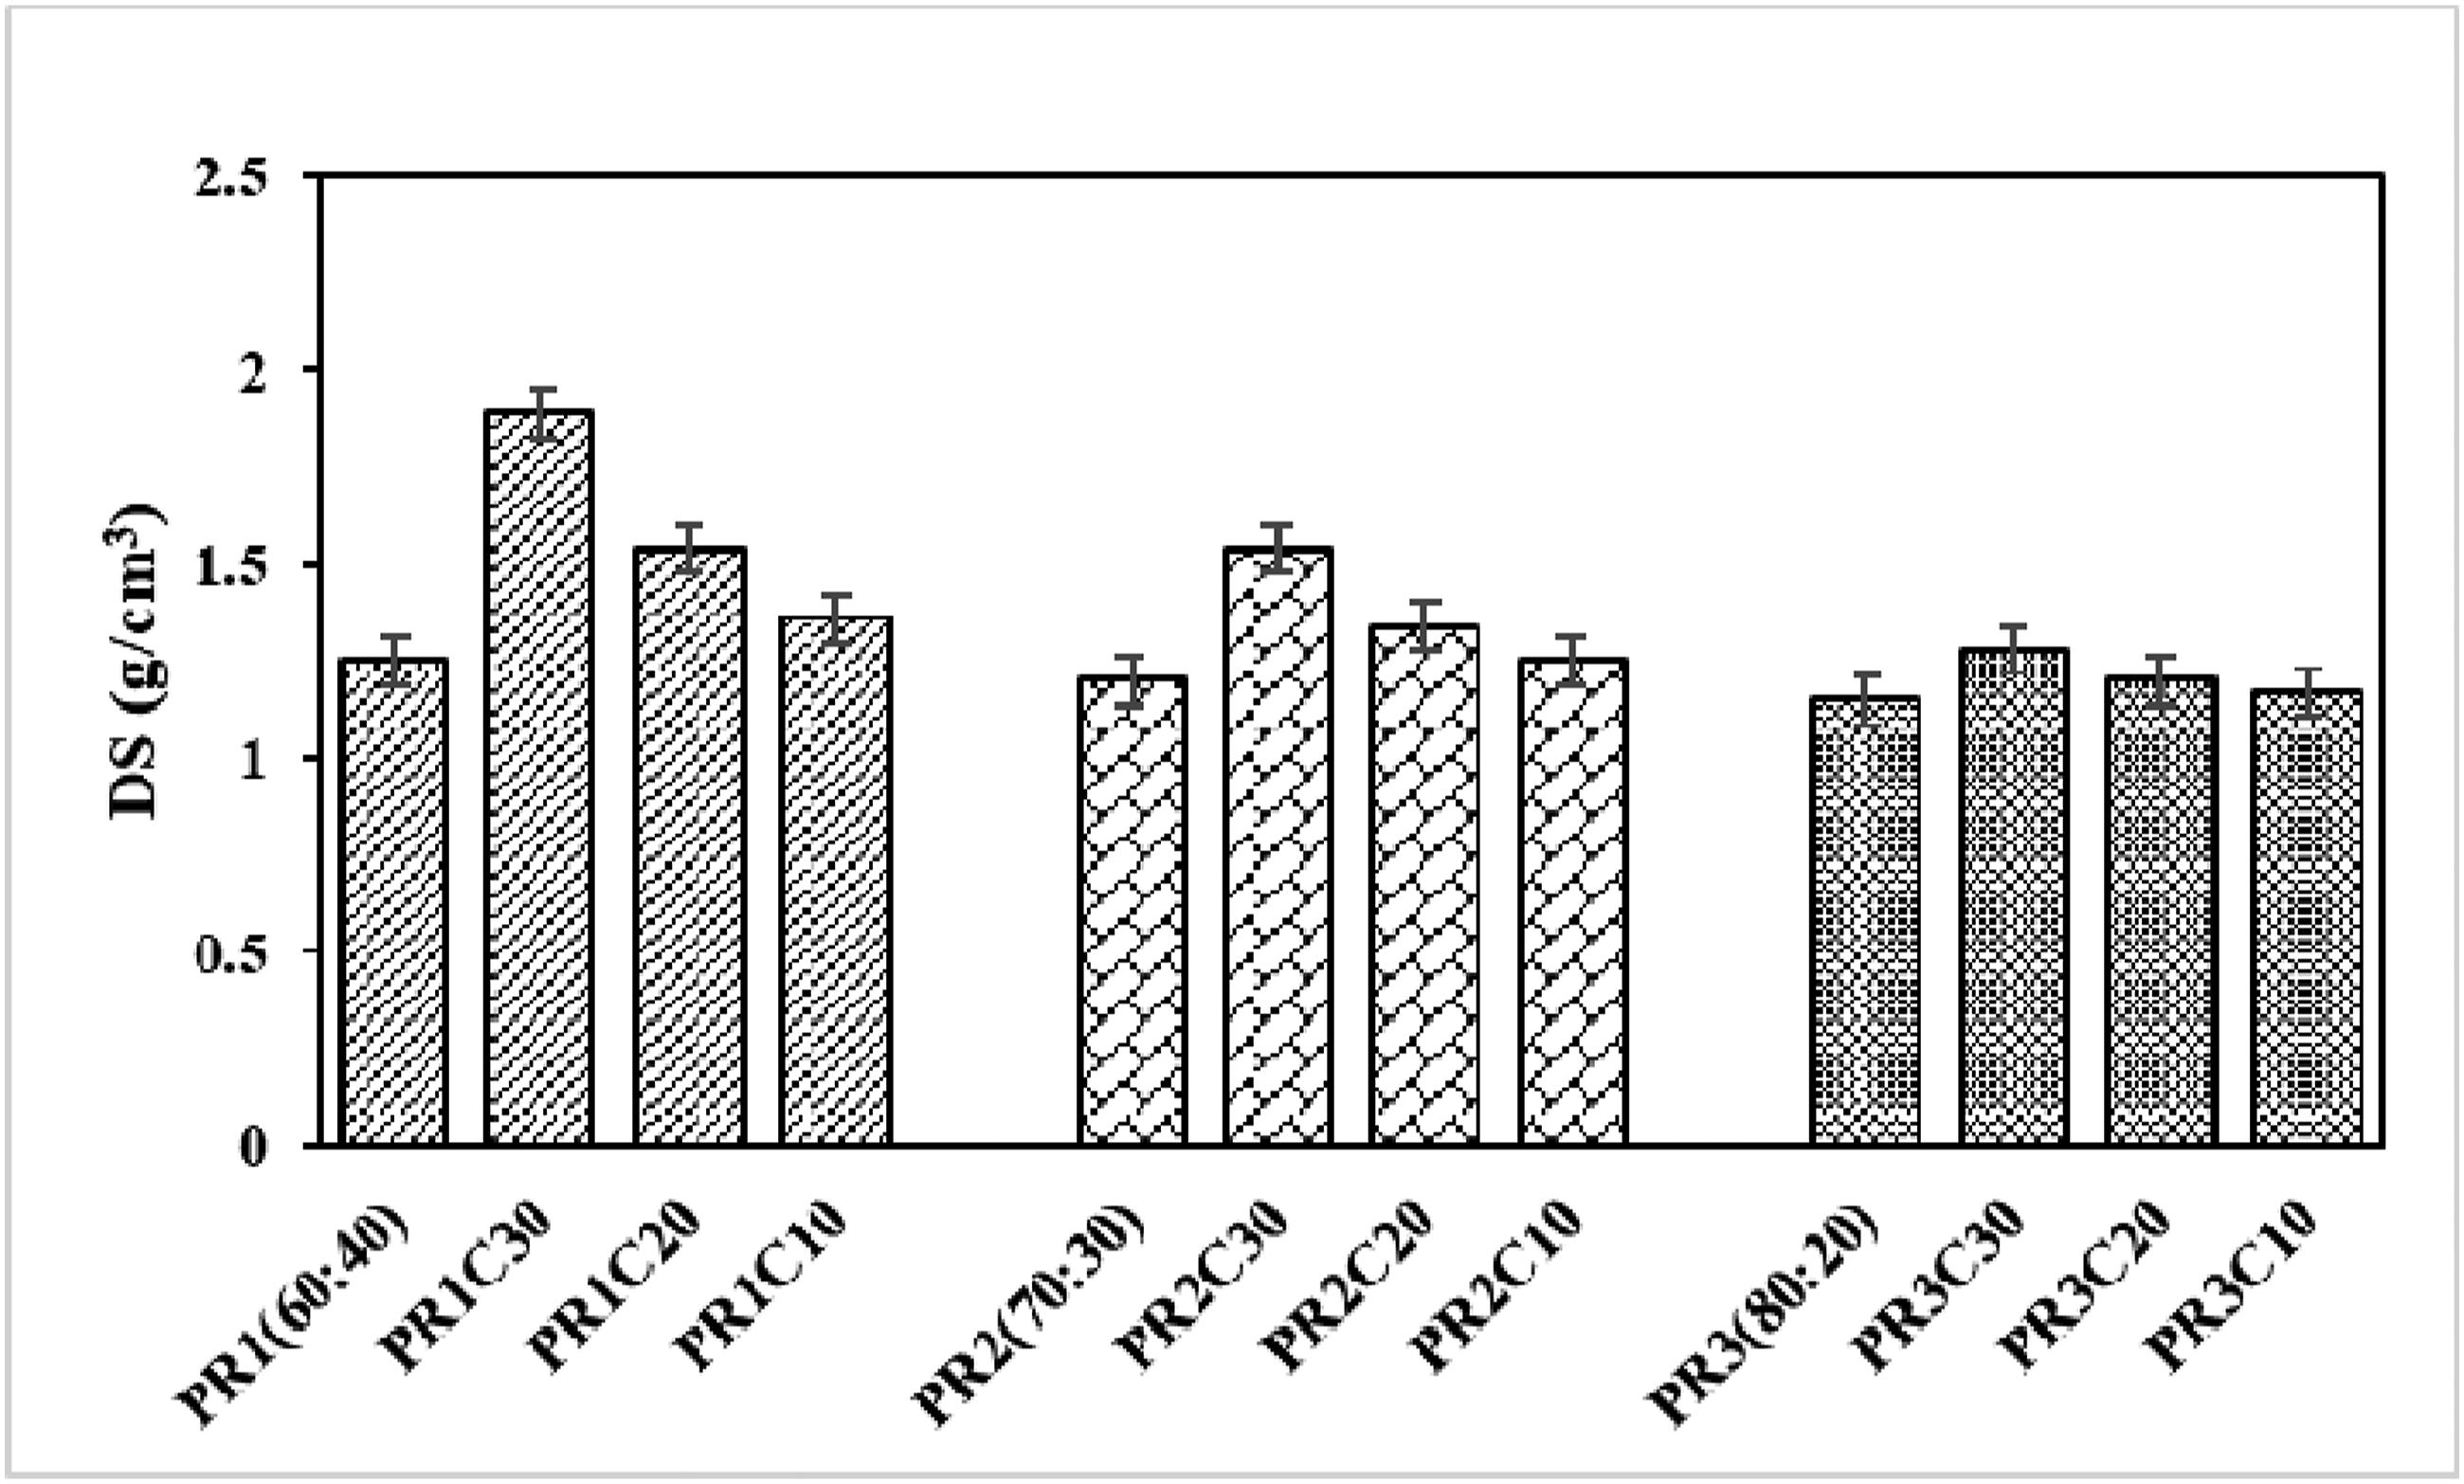
Furthermore, the degree of dispersion and filler-polymer interaction plays a crucial role. At higher NR content (PR1), the incorporation of CS resulted in a more significant density increase. This could be due to better interfacial adhesion and filler packing efficiency, leading to reduced void content and increased material compactness.
Color measurement analysis
The physical properties of TPE composites produced from recycled high-density polyethylene (rHDPE), natural (NR), and crab shell (CS) at different polymer blend ratios and filler concentrations were evaluated using display lightness (L*) and total color changes (△E) as shown in Table 4. The variations in NR content modulate these optical effects, influencing the final appearance and applicability of the material. The results showed that the TPEs composites with 40 wt% NR had the lowest the L* and △E which value of 24.67% and 10.34%, respectively. This result is in agreement with Roy et al., 43 who highlighted that polymer phase compatibility plays a crucial role in determining color stability, with higher NR concentrations leading to increased blending and reduced color variation in bio-filled composites.
Furthermore, the result presented that the addition of CS significantly influenced the display L* and ∆E of the composites, with variations observed depending on the NR content.
For PR1 (40 wt% NR), the base material exhibited the lowest L* value (24.67), indicating a relatively dark appearance. When the addition of CS, L* increased, with PR1C30 reaching 30.44. Similarly, ∆E values increased with CS content, suggesting a more noticeable color shift. A similar trend was observed for PR2 (30 wt% NR) and PR3 (20 wt% NR), where higher CS concentrations resulted in increased L* and ∆E values. Notably, PR3C30 exhibited the highest L* value (36.25), while PR1 showed the lowest overall range of ∆E values. The statistically significant p-values (<0.05) across all formulations confirm that the observed differences are meaningful.
The changes in L* and ∆E can be attributed to the dispersion and interaction of CS filler within the polymer matrix. CS fillers are known to influence optical properties by affecting light scattering and absorption. Higher CS content results in increased light reflection, leading to higher L* values. This effect is more pronounced in PR3 composites due to the lower NR content, which allows for improved filler dispersion and uniformity. The observed increase in ∆E with increasing carbon content suggests that the filler alters the overall color perception of the composites. This effect could be due to heterogeneous dispersion, which impacts uniformity in optical properties. 40 Additionally, the chemical composition and interaction between carbon and the polymer matrix likely contribute to the differences observed between PR1, PR2, and PR3 composites.
Morphology and visual surface observation analysis
The SEM images of PR3 composites with 30 wt% crab shell (CS) fillers, as presented in Figure 7, provide critical insights into the overall cross-section structure (50×) and the compatibility and distribution of CS fillers within the thermoplastic elastomer (TPE) matrix (500×). The micrographs reveal a highly uniform and well-dispersed filler distribution within the PR3C30 composite. The cross-section image (50×) shows minimal agglomeration and a continuous phase structure, while the higher magnification image (500×) highlights the strong interfacial bonding between the CS fillers and the TPE matrix. These observations suggest that the reduced NR content in PR3, coupled with the optimized CS concentration at 30 wt%, promotes better filler-matrix compatibility and dispersion. This is implied that the lower NR content (20%) in PR3 reduces the matrix’s elasticity, facilitating stronger interactions with the rigid CS fillers. This results in improved filler dispersion and better interfacial bonding. The strong interfacial bonding observed in the 500× image indicates effective stress transfer between the matrix and the fillers, contributing to the enhanced mechanical properties observed in Table 3. The uniform filler distribution and strong interfacial bonding observed in PR3C30 are consistent with the higher mechanical properties and lower WA reported in Tables 3 and 4, respectively. This suggests that improved microstructural integrity directly translates to better composite performance. Similarly, Khamtree et al.
14
reported that an improvement in mechanical strength is the results of excellent dispersion and the proportion of filler that composites include determines their enhanced mechanical properties. Moreover, the size and shape of the filler significantly affect the reinforcing of composites and interfacial interaction between filler and polymer.
48
Even though the larger particle size promotes pullout in the mix compared to the smaller particle size, the interaction imparted by the filler dominated and boosted the blend’s mechanical characteristics when compared to the blend without filler.
49
The stronger adhesion between the polymer and wood filler, surface treatment of natural wood partials is necessary. This can be done by corona plasma, alkaline, silane acetylation or maleated coupling.
50
The SEM images of composites with CS at 30 wt%: (a) overall of the cross-section area (50×) and (b) compatibility and distribution of CS in the TPEs (500×).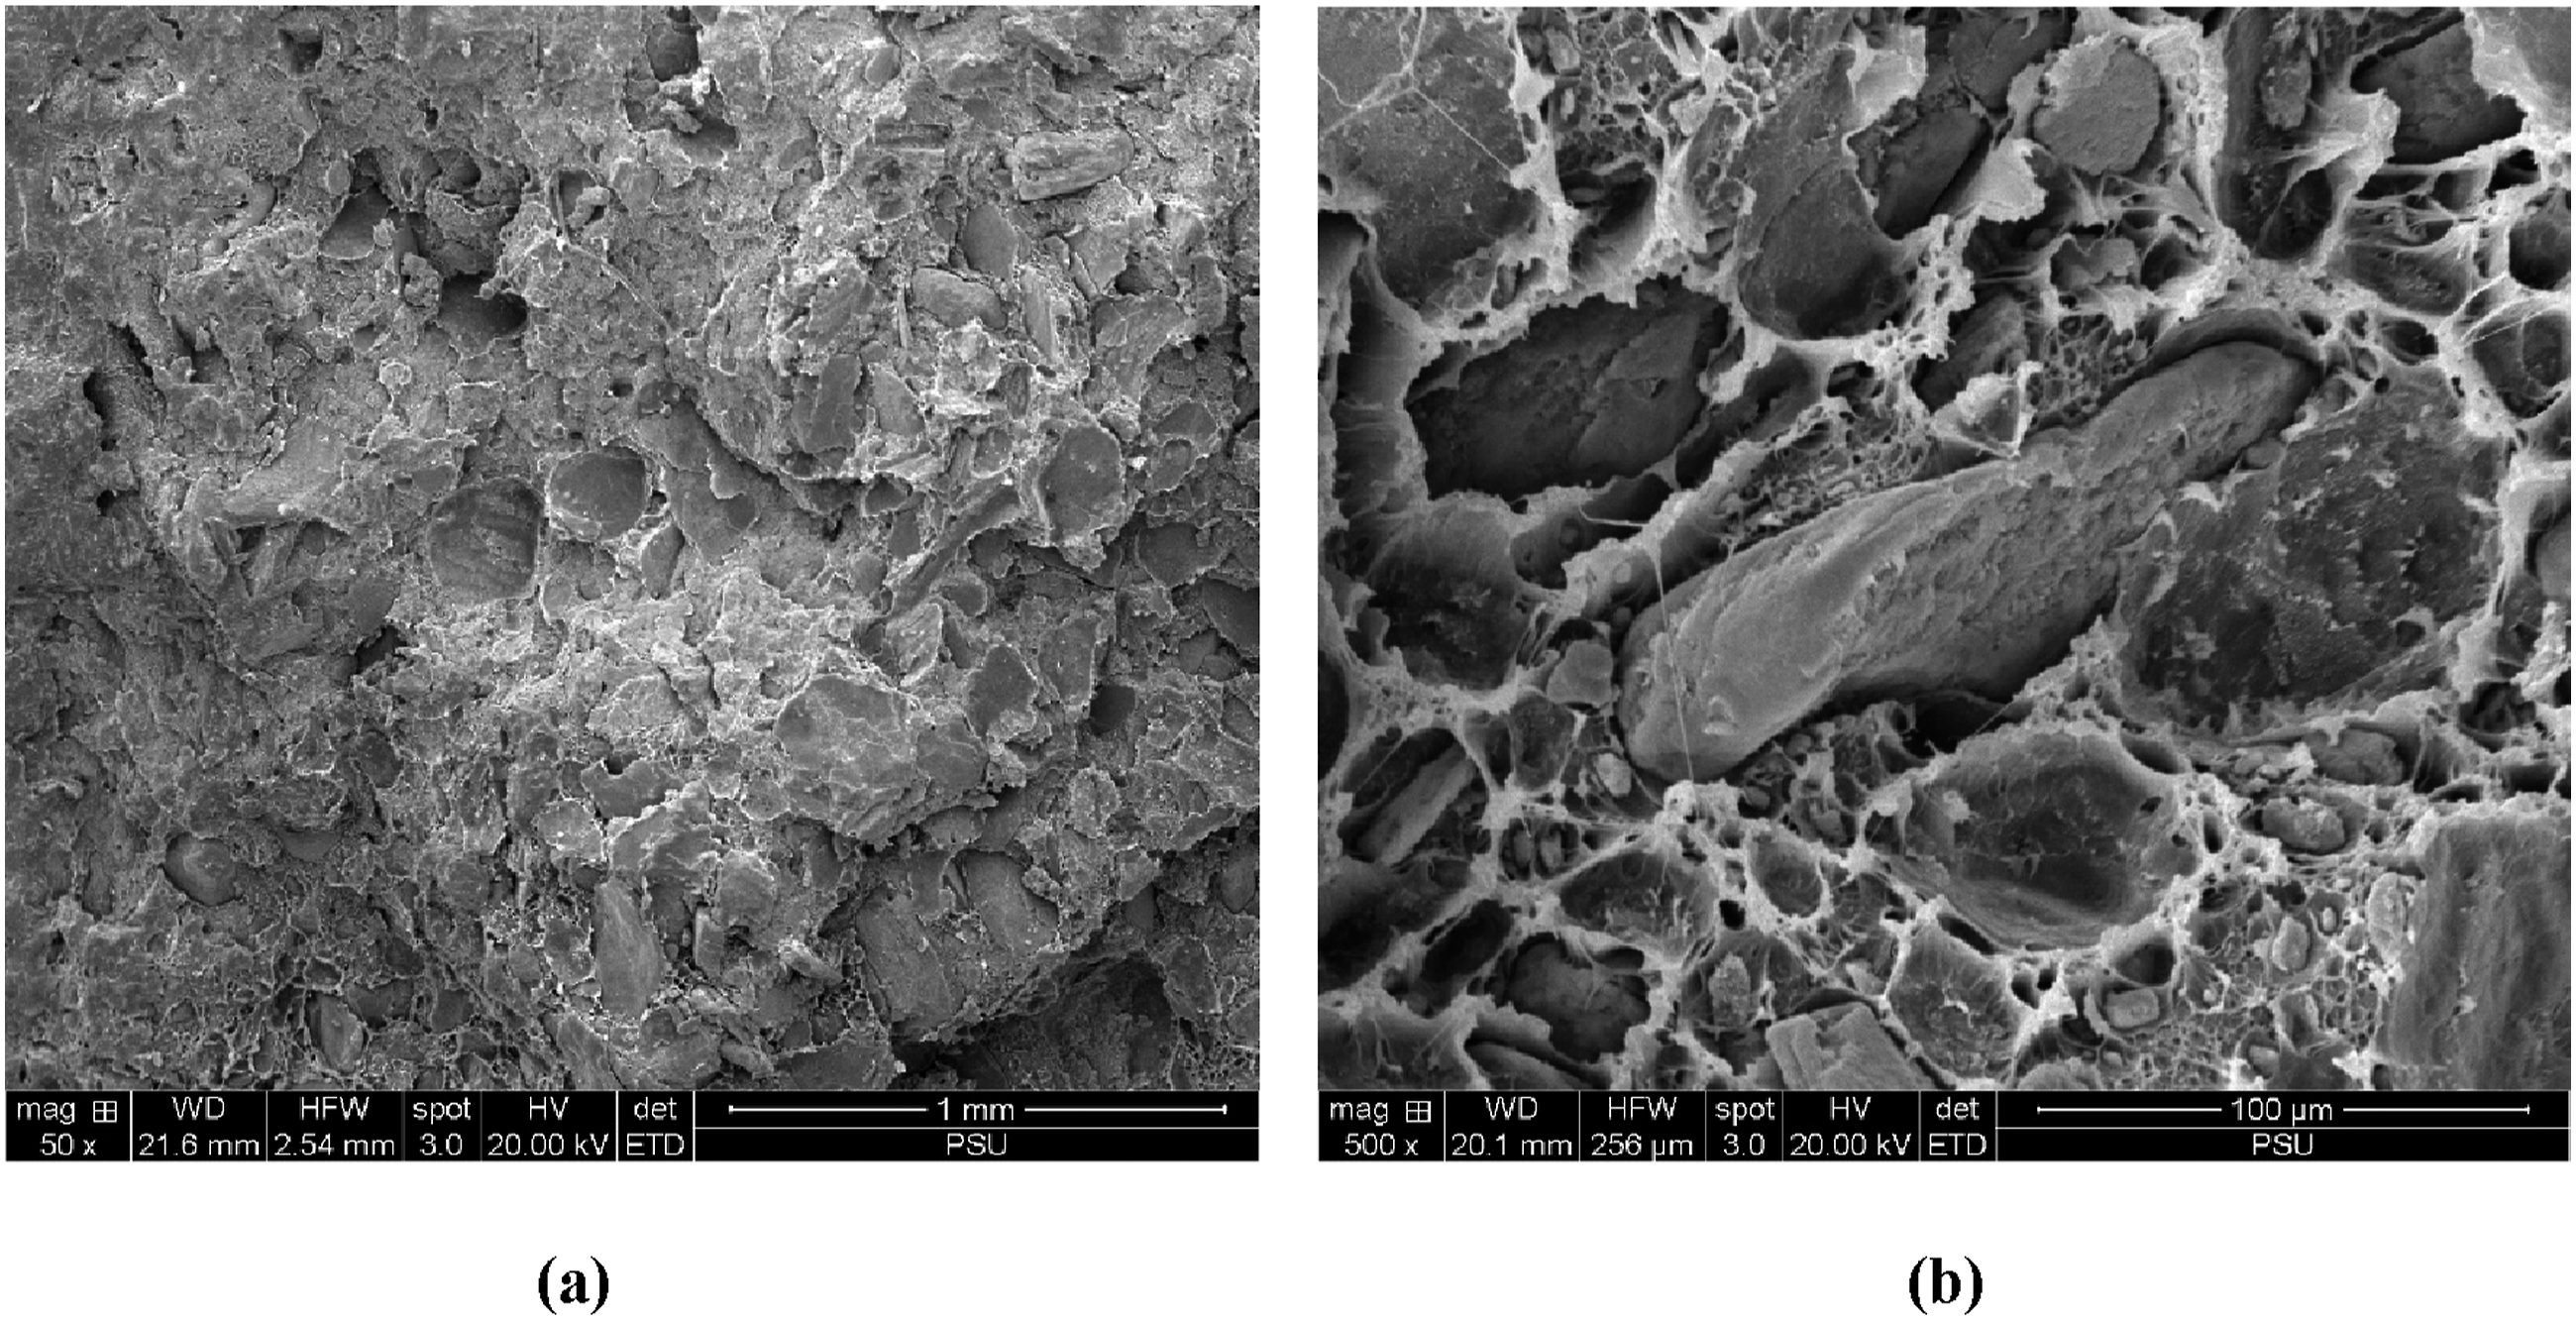
Optical microscopy images of the elastomer reinforced with crab shell composites.
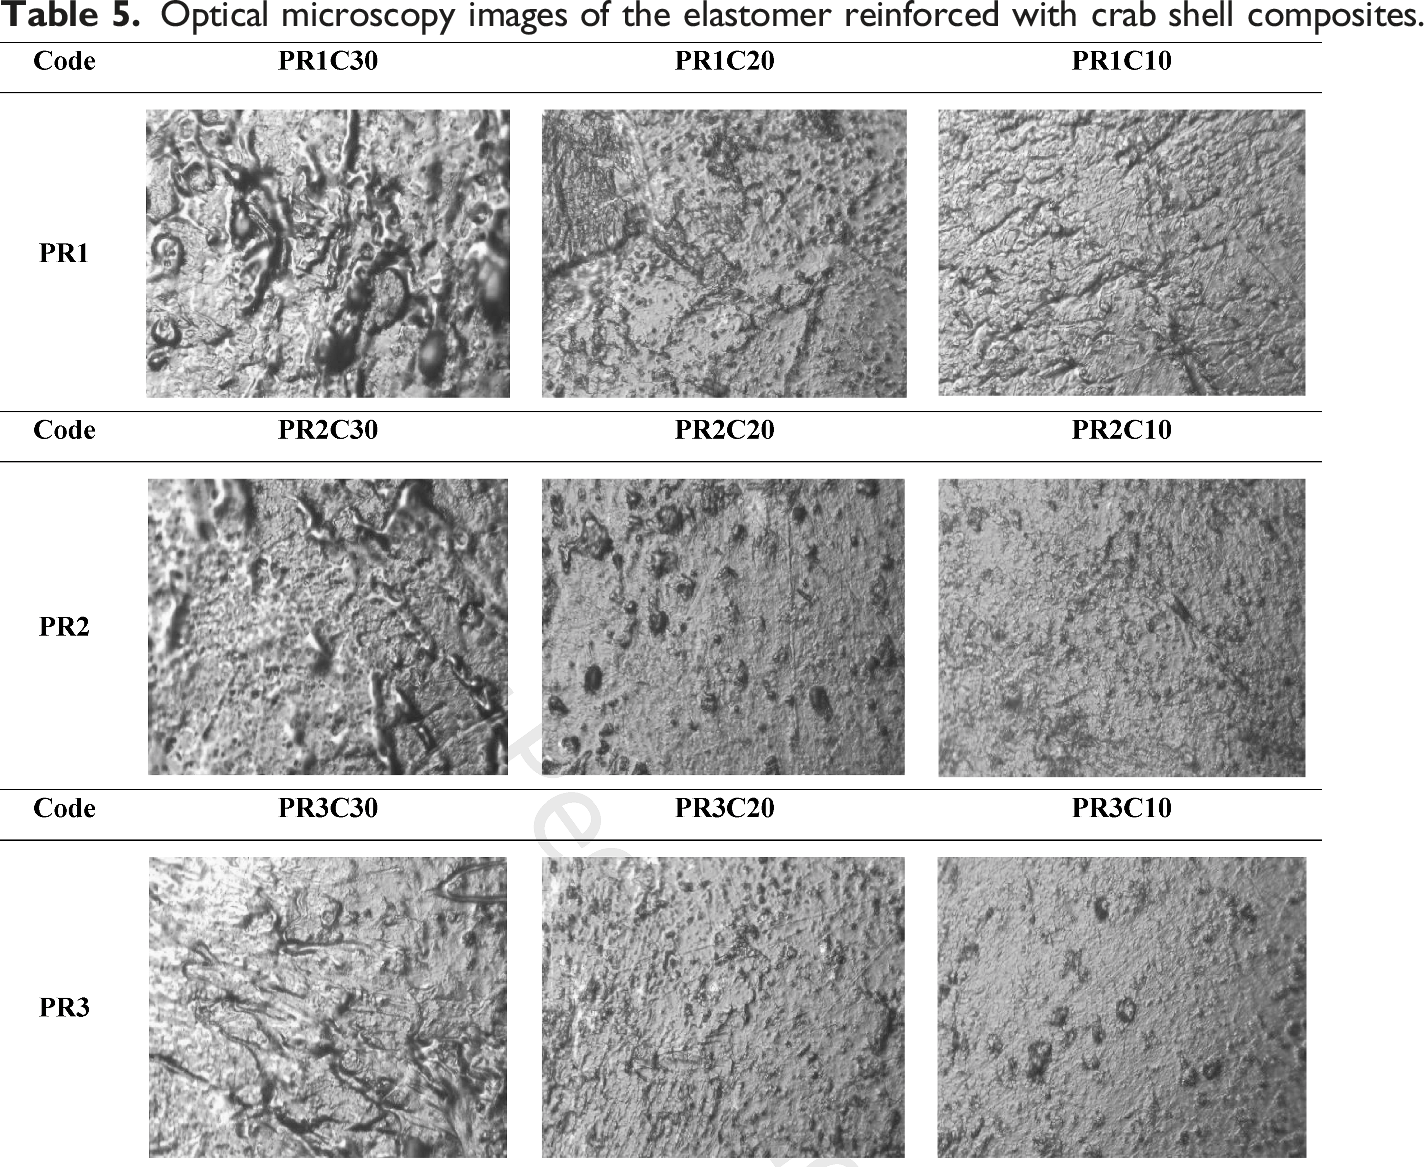
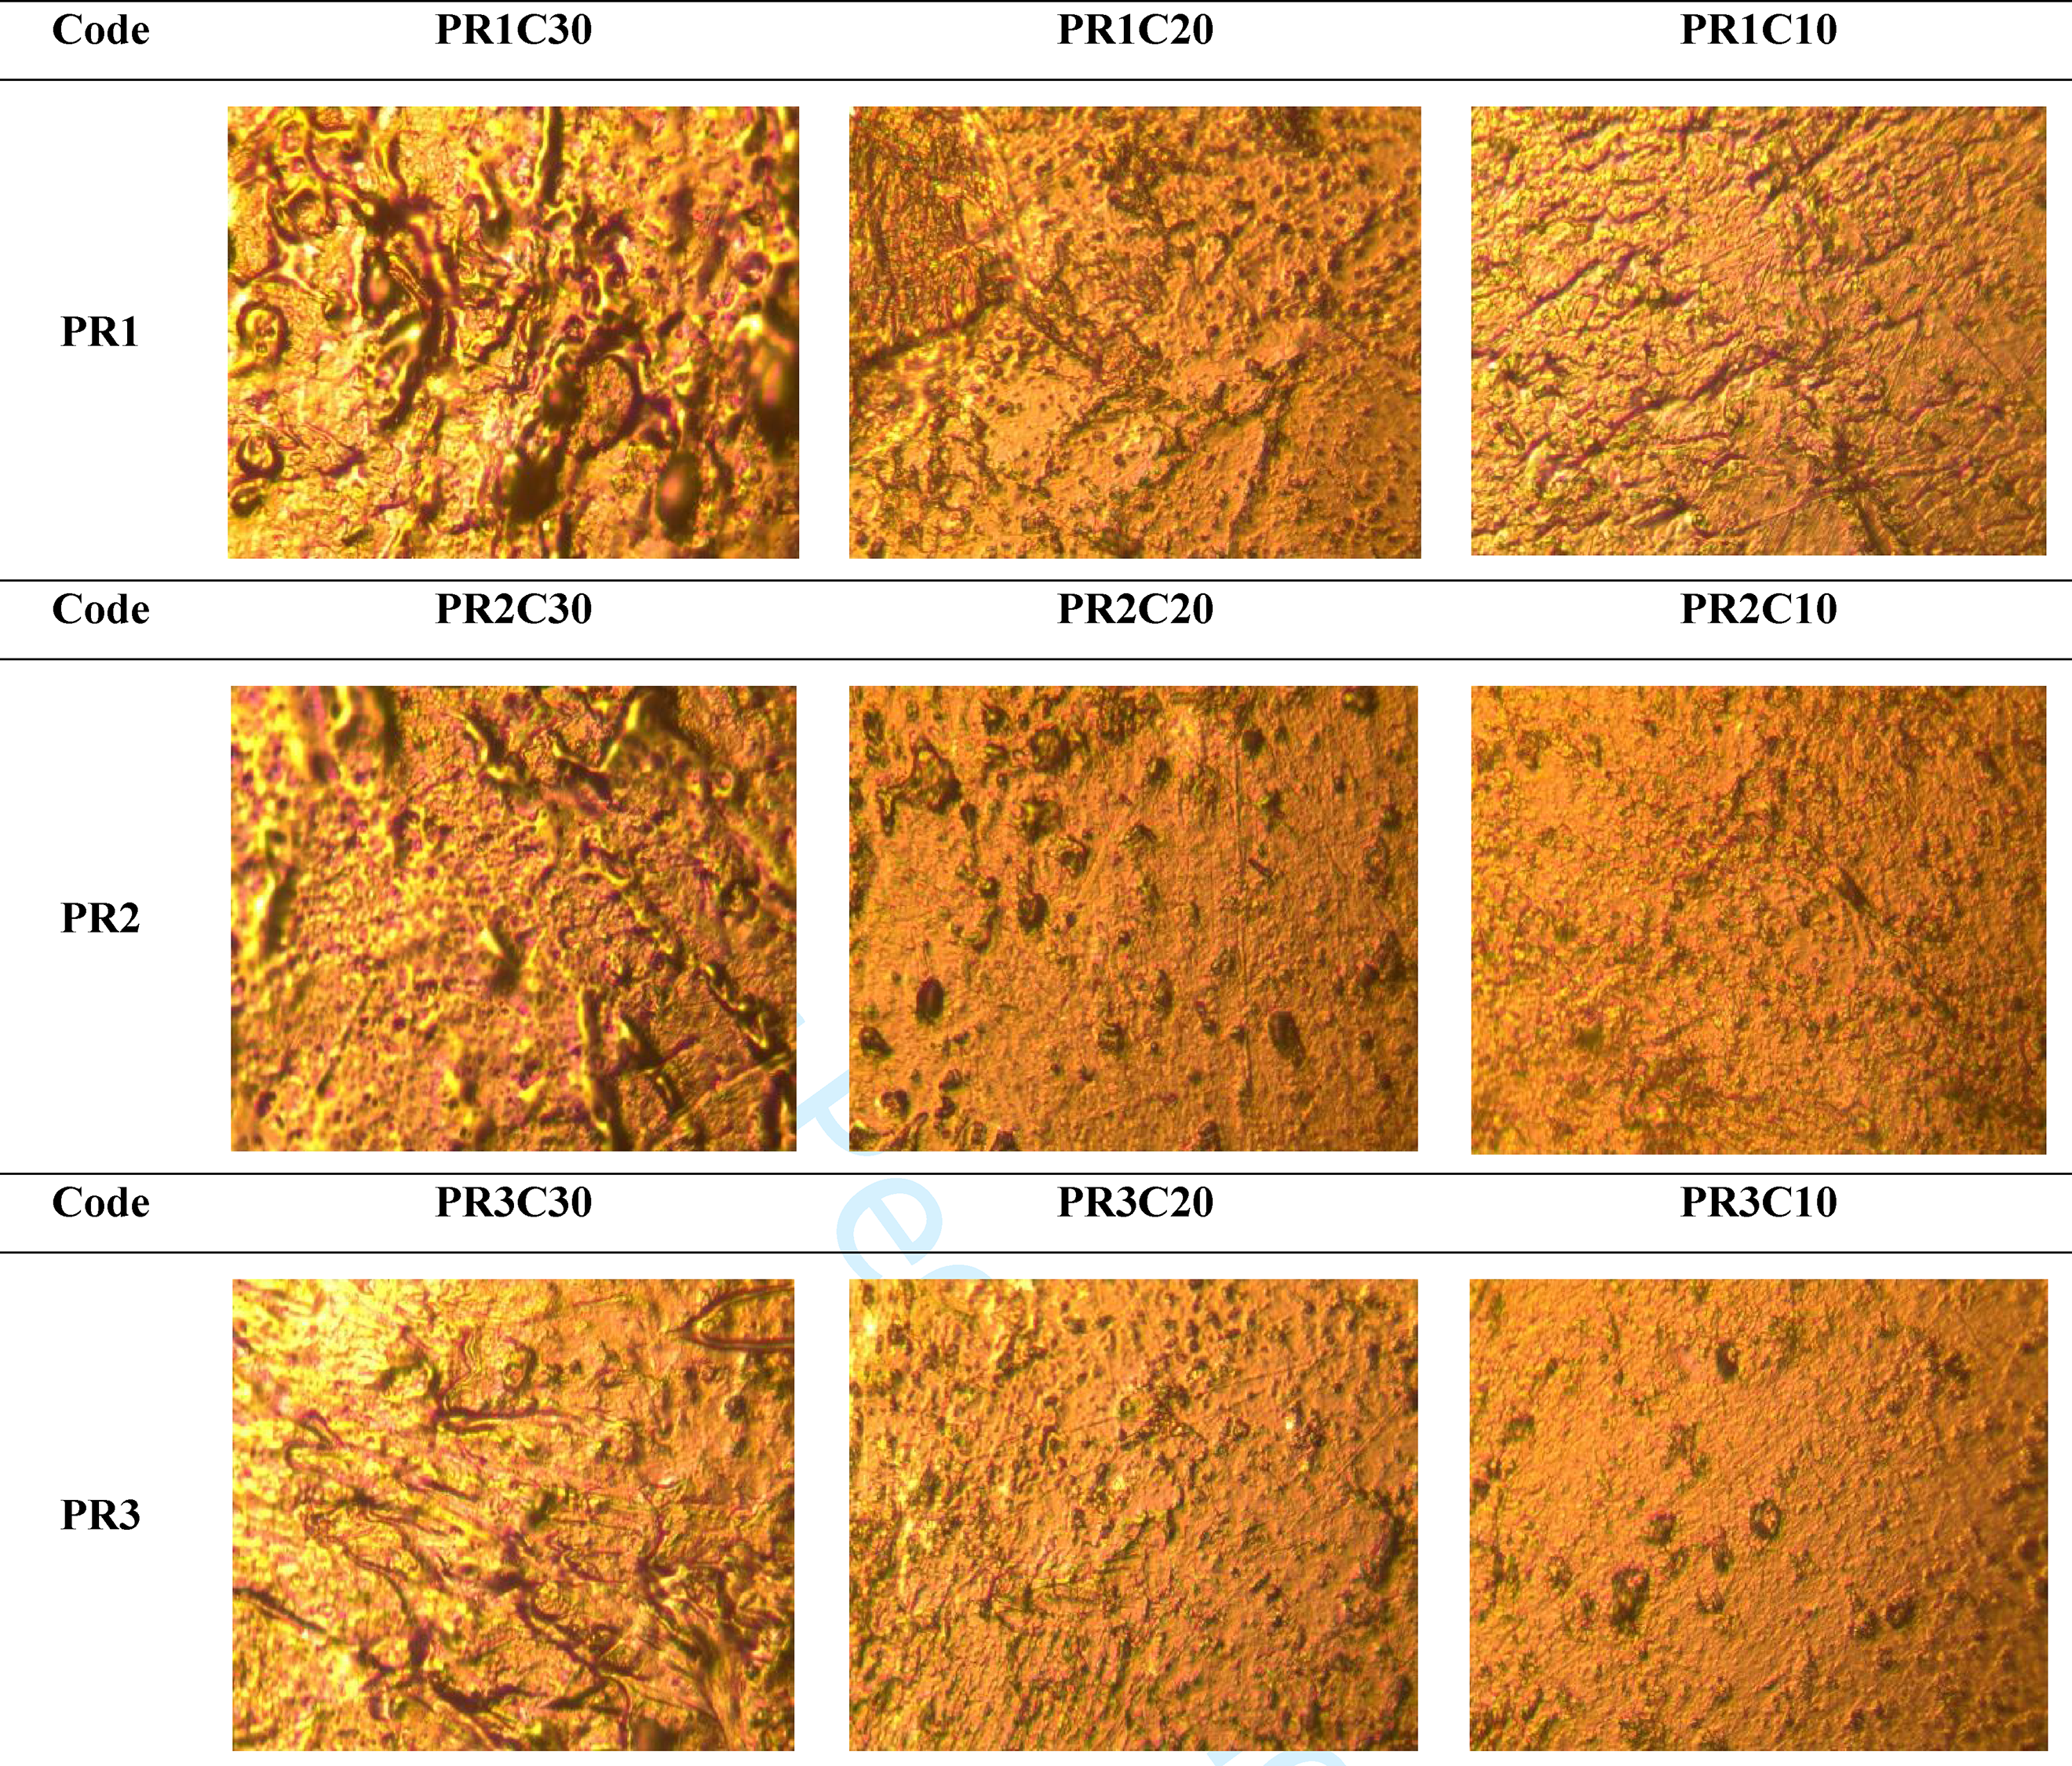
Moreover, higher CS filler concentrations (C30) tend to promote agglomeration due to particle clustering, especially in PR1 composites. The elastic nature of the NR matrix at high concentrations limits efficient dispersion of fillers. The PR3 composites displayed the most uniform filler distribution at all concentrations. This can be explained by the lower NR content, which reduces polymer chain mobility, allowing for more efficient packing and bonding of the CS fillers. The improved filler distribution observed in PR3 composites aligns with the enhanced mechanical properties and reduced WA reported in Tables 3 and 4, respectively. Better filler dispersion contributes to increased material stiffness and reduced moisture pathways.
The optical microscopy analysis revealed that CS filler concentration and NR content significantly influence the microstructure of elastomer composites. Lower NR content (PR3) facilitates better filler dispersion, while higher filler concentrations (C30) increase the risk of agglomeration. These findings provide valuable insights for optimizing composite formulations and open new avenues for research into bio-filler-reinforced elastomers. Additionally, studies by Samal and Blanco 51 emphasized that bio-filler integration alters the phase morphology of elastomeric composites, leading to variations in particle dispersion and interfacial adhesion. Moreover, the finding suggests that while low-to-moderate CS concentrations improve microstructural stability, higher filler content disrupts the matrix continuity, contributing to crack initiation and propagation under mechanical stress.
Thermal properties of the TPEs composites
Thermogravimetric analysis
Thermogravimetric analysis (TGA) of elastomer, and elastomer reinforced with crab shell composites.
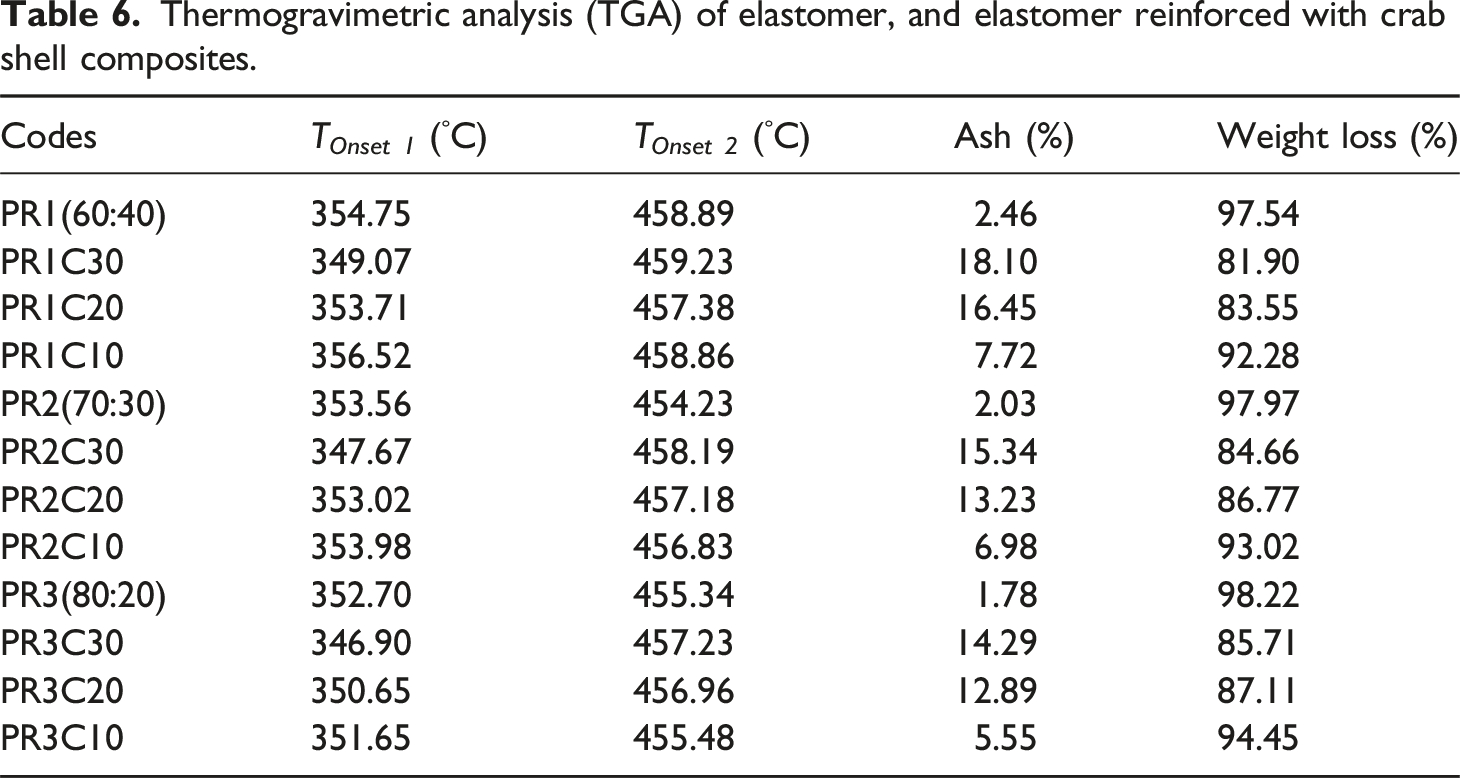
The TGA curve of TPEs composites reinforced with different CS content (Figure 8(a)) reveals that all samples exhibit a two-step degradation process. The first degradation stage occurs at temperatures ranging between 250 and 300°C, corresponding to the thermal decomposition of NR and other volatile components. The second and more significant degradation step, occurring between 400 and 500°C, is primarily associated with the degradation of the polymeric matrix. PR3 without reinforcement shows the highest weight loss in this temperature range, indicating lower thermal stability compared to the reinforced composites. When reinforcing the TPEs with CS, an increase in thermal stability is observed. PR3C10, PR3C20, and PR3C30 exhibit a shift in degradation onset toward higher temperatures, suggesting an enhancement in thermal resistance. This improvement can be attributed to the chitin and calcium carbonate content of CS, which act as thermal barriers, reducing polymer decomposition rates.
53
This is agreement with Malafeev et al.
54
who reported that chitin content has influenced the crystallization temperature, which is slightly increased decomposed temperature. The curves of TPEs composites reinforced with different CS contents: (a) TGA curves and (b) DTG curves showing melting point and thermal degradation.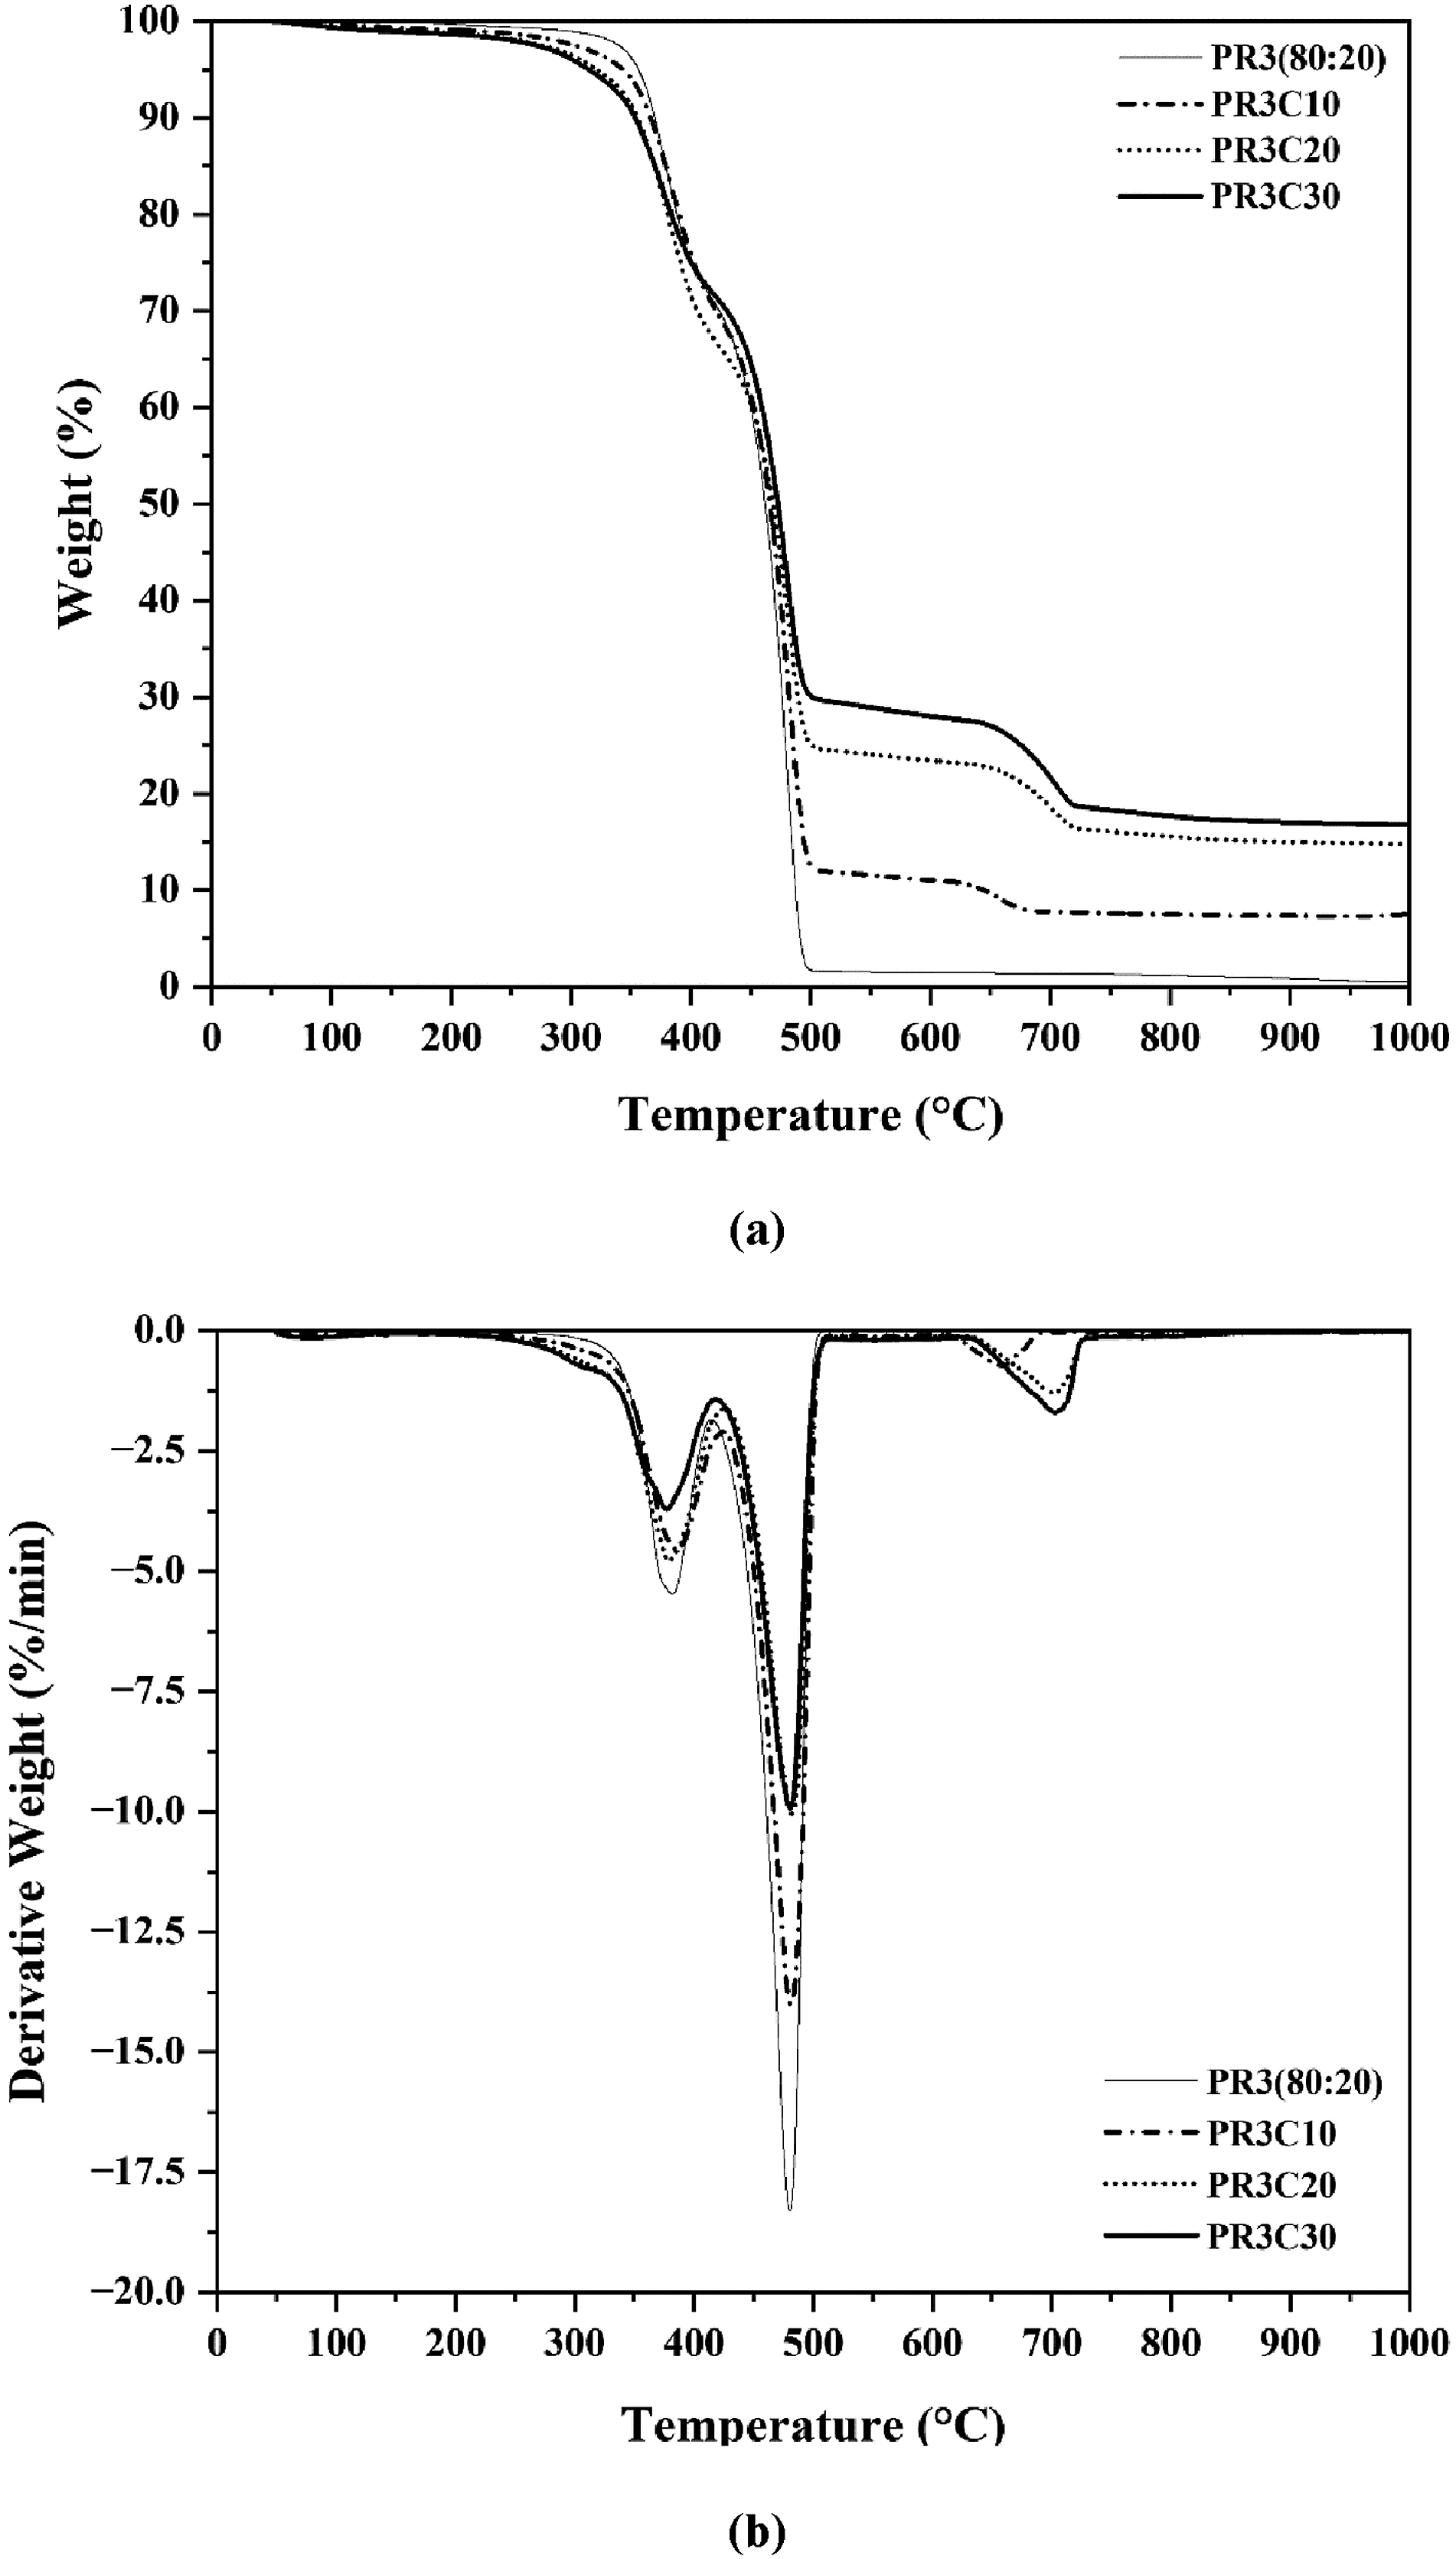
The DTG curve of TPEs composites reinforced with different CS content (Figure 8(b)) provides further confirmation of the enhanced thermal stability observed in the TGA curves. The maximum degradation rate for PR3 occurs at approximately 450°C, whereas CS-reinforced samples display a shift towards higher temperatures, with PR3C30 exhibiting the most delayed peak degradation temperature. This trend suggests that increasing CS content effectively delays the onset of thermal degradation, likely due to the strong interfacial bonding between the CS particles and the polymer matrix, which restricts chain mobility and enhances thermal endurance. 55 Furthermore, thermal degradation are common problems during polymer recycling due to thermal and hydrolytic degradation that leads to the reduction of its molecular weight thus reduce the mechanical properties. 56
Differential scanning calorimetry analysis
Differential scanning calorimetry (DSC) of elastomer, and elastomer reinforced with crab shell composites.
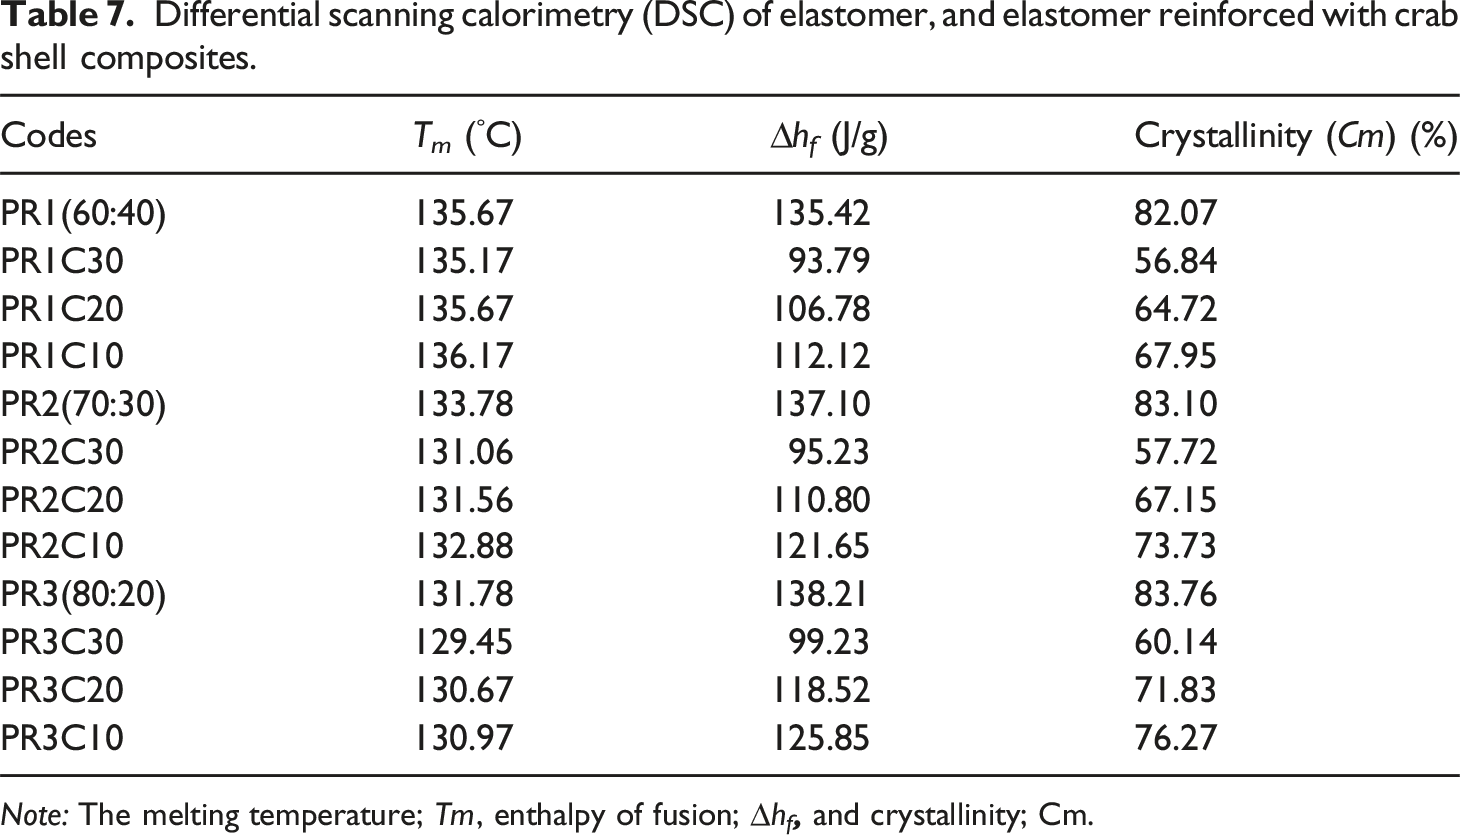
Note: The melting temperature; Tm, enthalpy of fusion; ∆h
f
The enthalpy of fusion (∆h f ) values indicates a significant reduction when CS reinforcement. PR1, PR2, and PR3 without reinforcement exhibit the highest ∆h f values (135.42 J/g, 137.10 J/g, and 138.21 J/g, respectively), signifying a well-ordered crystalline structure. However, when reinforcement, the ∆hf values decrease, with PR1C30, PR2C30, and PR3C30 displaying the lowest values of 93.79 J/g, 95.23 J/g, and 99.23 J/g, respectively. The decreasing ∆hf suggests a reduction in the crystalline order of the elastomer matrix due to the incorporation of CS particles, which are likely to act as physical barriers disrupting molecular packing and restricting crystallite formation. 22
The crystallinity (C m ) results further support the disruption of crystalline order when CS reinforcement. PR1, PR2, and PR3 initially exhibit high crystallinity values (82.07%, 83.10%, and 83.76%, respectively). However, when reinforcement with CS, crystallinity progressively decreases, particularly at higher CS loadings. PR3C30, for instance, shows a reduced crystallinity of 60.14%. The decrease in crystallinity aligns with expectations, as the addition of CS fillers introduces heterogeneous nucleation sites, leading to irregular crystalline growth and reduced overall crystallinity. 57 Interestingly, PR3C10 (with 10% CS) retains a relatively high crystallinity of 76.27%, indicating that lower CS contents allow for some degree of crystalline ordering, potentially due to the presence of reinforcing interactions at moderate filler concentrations. The DSC analysis confirms that CS reinforcement significantly alters the thermal behavior of elastomer composites. The reduction in melting temperature, enthalpy of fusion, and crystallinity with increasing CS content highlights the impact of filler-matrix interactions on thermal transitions.
Moreover, the unreinforced PR3 sample exhibits a peak melting temperature of 135.67°C, whereas PR3C10, PR3C20, and PR3C30 display melting temperatures of 136.17°C, 135.67°C, and 135.17°C, respectively as shown in Figure 9. These minor fluctuations suggest that the presence of CS does not drastically alter the melting behavior of the matrix but slightly influences the molecular packing of the elastomer. Interestingly, the PR3C10 has the highest melting temperature at 136.17°C, which could be attributed to enhanced interaction between the polymer matrix and the filler at lower CS content, leading to improved crystallization. However, at higher CS content (PR3C30), a slight reduction in melting temperature is observed, which may be due to increased heterogeneity and disruption of the polymeric network.
38
The curves of DSC for TPEs composites reinforced with different CS contents at 10, 20, 30 wt% showing melting point, fusion peak, and thermal degradation.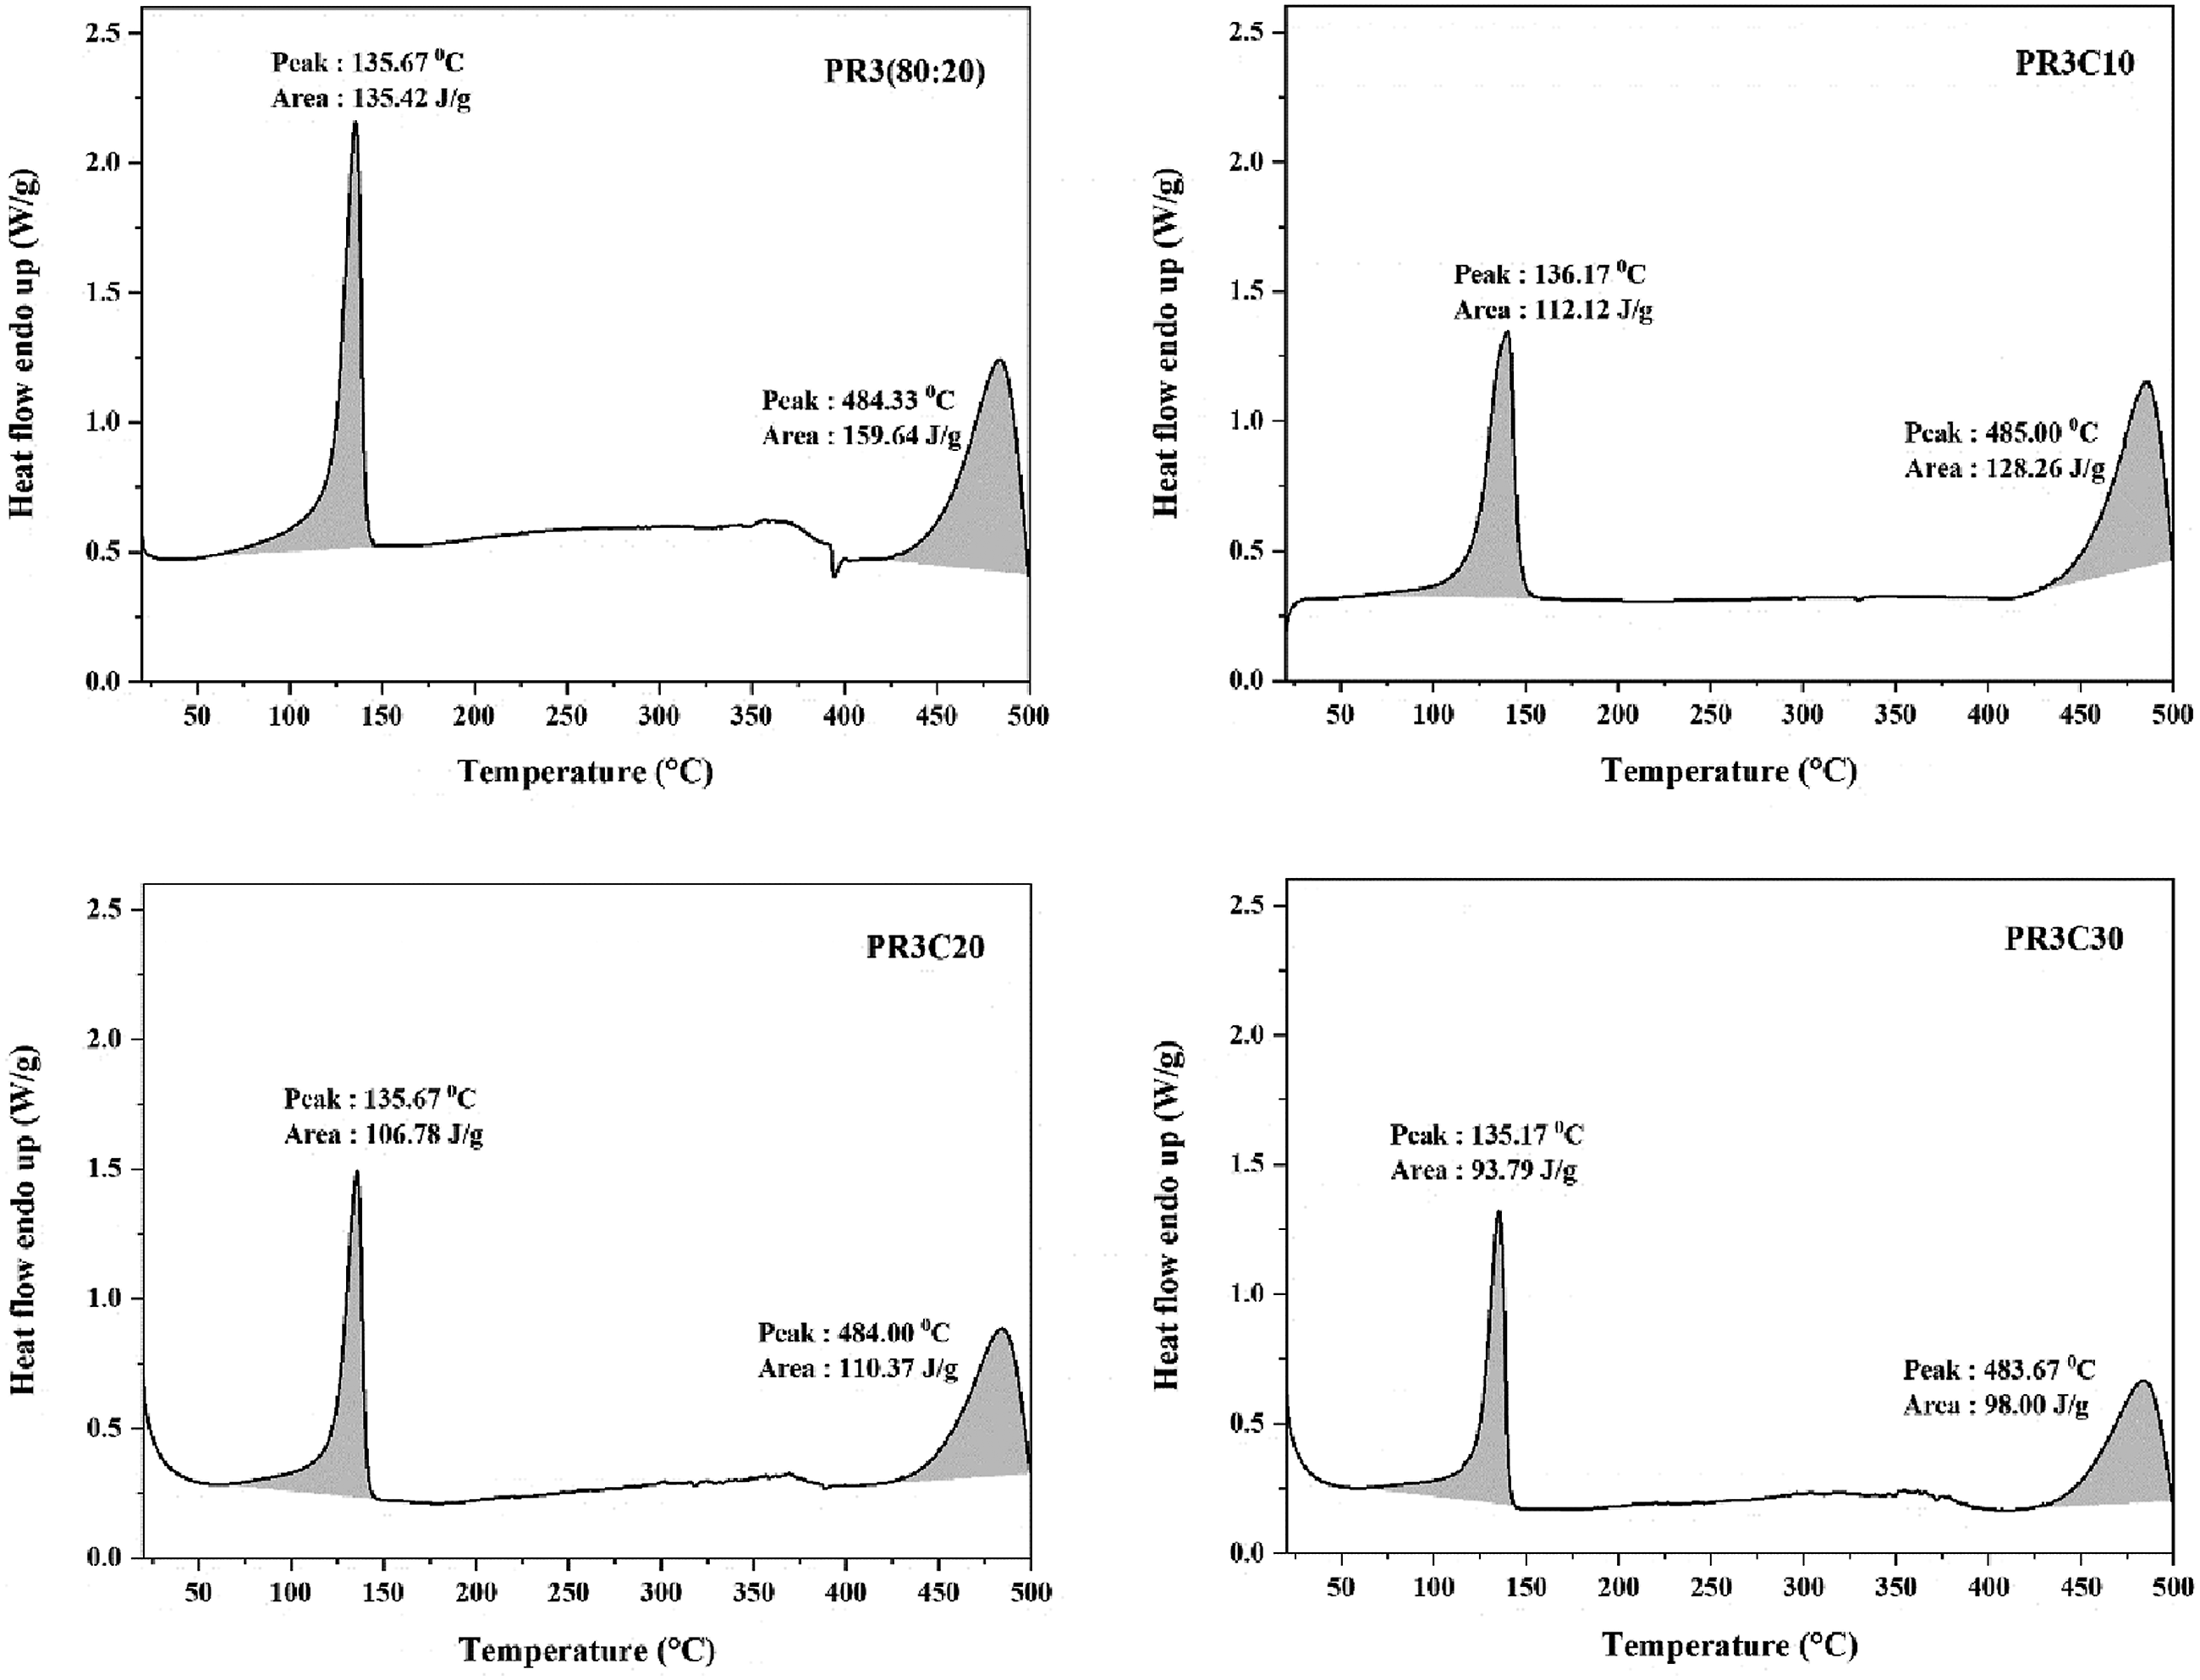
The fusion peak area (enthalpy of fusion, ∆hf) provides insights into the crystalline fraction of the composites. PR3 has an enthalpy of fusion of 135.42 J/g, whereas PR3C10, PR3C20, and PR3C30 exhibit decreasing values of 112.12 J/g, 106.78 J/g, and 93.79 J/g, respectively. This decline in ∆hf suggests a progressive reduction in crystallinity with increasing CS content, which is likely due to the formation of a more amorphous phase as CS particles interfere with the polymer chains’ ability to crystallize.
The thermal degradation peaks provide further insights into the thermal stability of the composites. PR3 exhibits a primary degradation peak at 484.33°C, with an enthalpy of 159.64 J/g. When reinforcement with CS, the degradation peaks slightly shift, with PR3C10, PR3C20, and PR3C30 showing degradation temperatures of 485°C, 484°C, and 483.67°C, respectively. The minor variations in degradation temperatures suggest that CS reinforcement does not significantly impact the thermal degradation onset of the composite. However, the enthalpy of degradation follows a decreasing trend, with PR3C10, PR3C20, and PR3C30 displaying values of 128.26 J/g, 110.37 J/g, and 98.00 J/g, respectively. This trend indicates that while CS-reinforced composites retain thermal stability, they experience lower energy release when degradation due to reduced crystallinity and a more amorphous polymeric structure. 58
Application of the TPEs composites
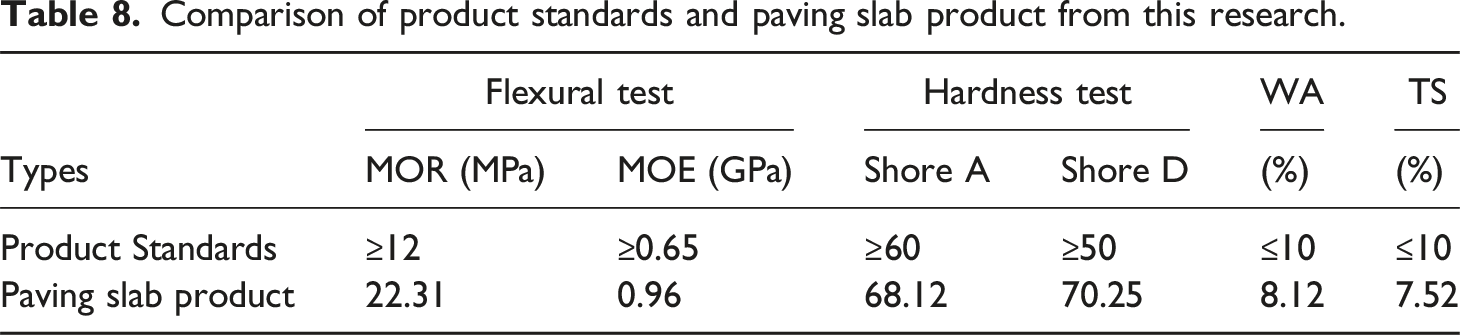
Comparison of product standards and paving slab product from this research.
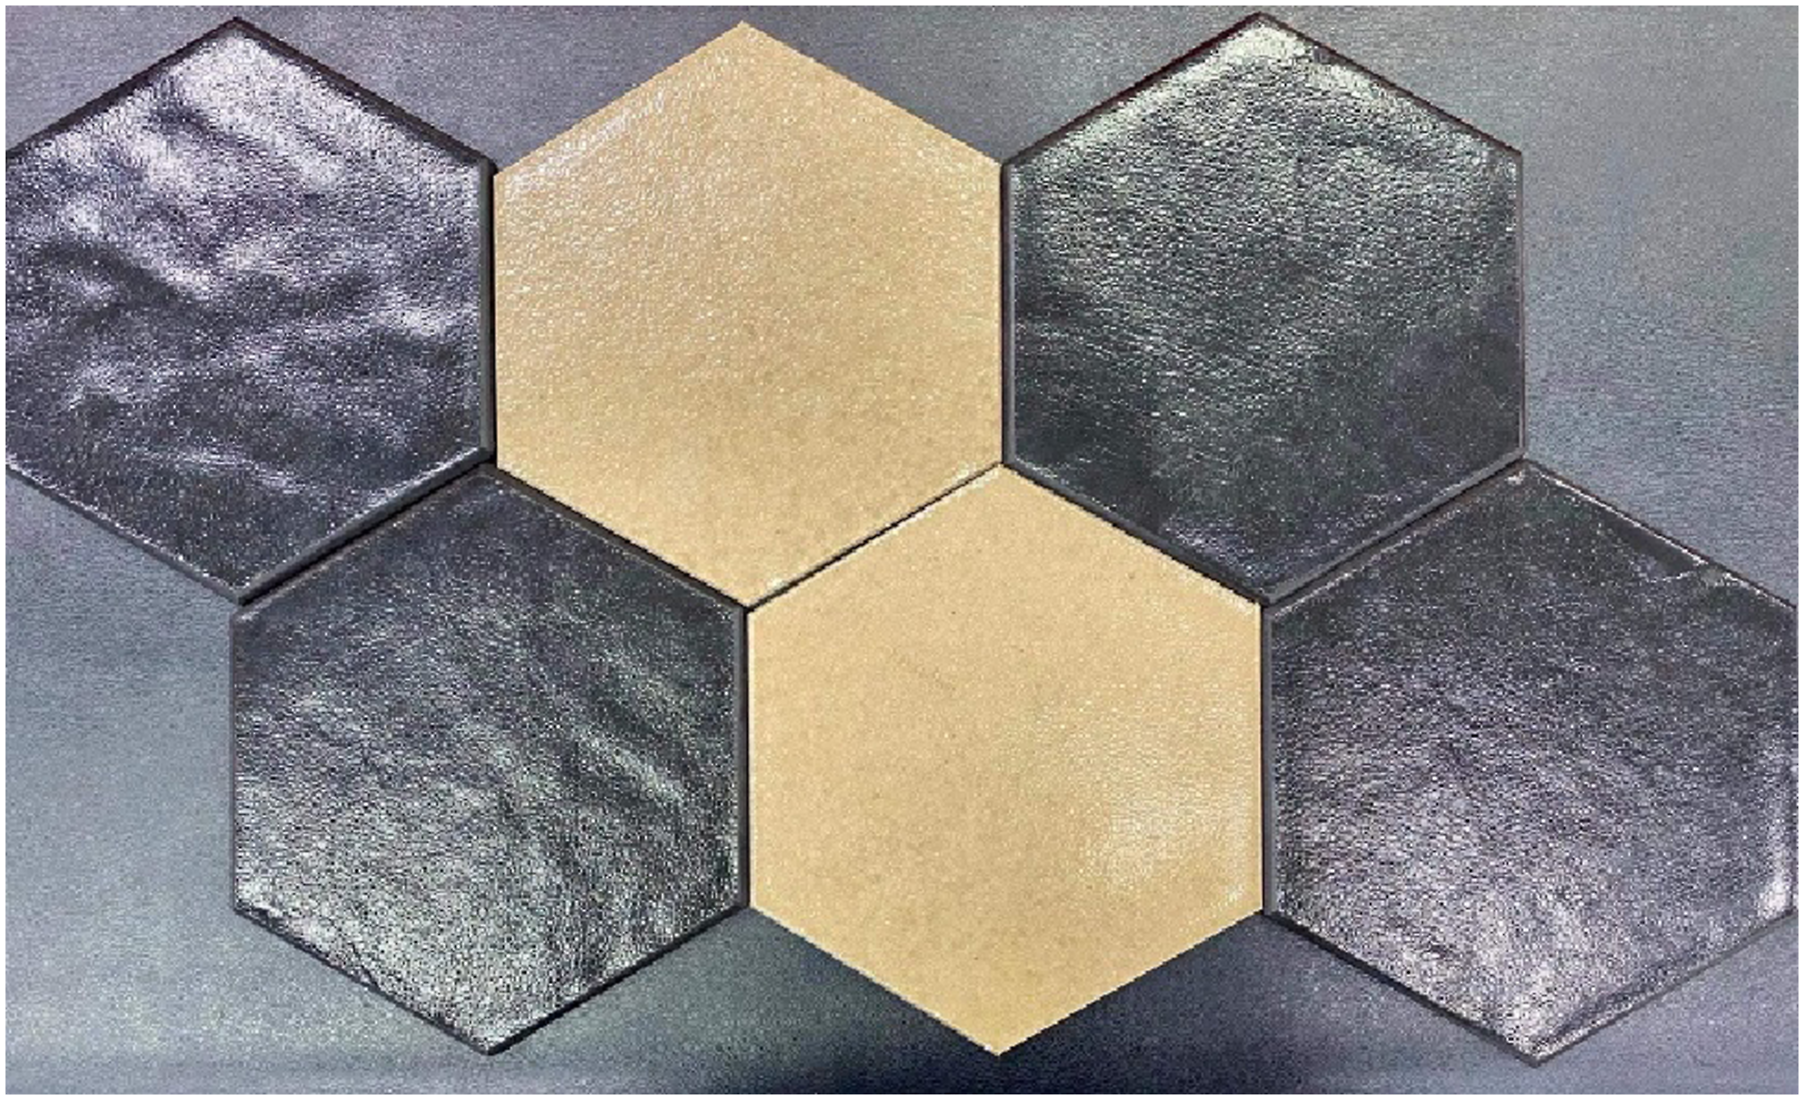
The paving slab product manufactured from TPEs composites reinforced with CS materials.
The hardness of the paving slab product was assessed using Shore A and Shore D scales, yielding values of 68.12 and 70.25, respectively. These values exceed the minimum standard of 60 (Shore A) and 50 (Shore D), indicating a well-structured composite with improved resistance to indentation and wear. The increased hardness can be attributed to the rigid nature of the CS reinforcement, which effectively distributes stress across the matrix and enhances durability.
The WA and TS properties are critical for evaluating the long-term durability of paving slabs exposed to outdoor environments. The WA of the paving slab product was measured at 8.12%, while the TS was recorded at 7.52%, both of which fell below the maximum standard limit of 10%. These results indicate that the composite exhibits low moisture uptake and dimensional stability, which can be attributed to the hydrophobic characteristics of TPEs and the compact structure provided by CS reinforcement. Reduced WA enhances the resistance to degradation, preventing deterioration due to environmental exposure.
The results confirm that the paving slab product manufactured from TPE composites reinforced with CS materials exhibits excellent mechanical properties, surpassing standard requirements for MOR, MOE, and hardness. The low WA and TS values indicate good moisture resistance, ensuring long-term durability. Moreover, CS offer competitive raw material costs, particularly when sourced as a byproduct of the seafood industry, making it both economical and sustainable. Processing costs for CS are higher than CaCO3 due to cleaning, grinding, and drying steps. In contrast, CaCO3 is highly available and inexpensive, though it lacks the environmental sustainability of CS. These findings support the economic viability of CS composites for construction applications, especially where sustainability is prioritized. Integration into low-cost, eco-friendly infrastructure (e.g., paving slabs, non-load-bearing components) aligns with circular economic goals. This analysis confirms that CS-reinforced composites deliver mechanical and thermal benefits comparable to or exceeding those of traditional and bio-based fillers. The cost-performance balance makes CS a compelling alternative to conventional fillers like CaCO3 in construction and outdoor applications.
Conclusions
This study successfully developed paving slab products from thermoplastic elastomer (TPE) composites reinforced with crab shell (CS) particles, demonstrating significant improvements in mechanical, physical, and thermal properties. The research addressed the growing need for sustainable materials in construction applications by integrating bio-based fillers into elastomer matrices, thereby reducing reliance on synthetic reinforcements and mitigating environmental impact.
The study investigated the influence of varying natural rubber (NR) and CS contents on the structural and functional properties of TPE composites. The research gap concerning the optimal balance between flexibility and strength in bio-filled elastomer composites was addressed through extensive experimental analysis. By evaluating mechanical, thermal, and durability aspects, this study provided insights into the feasibility of using CS as a cost-effective and sustainable alternative to conventional fillers. A comprehensive experimental methodology was employed, incorporating mechanical testing, physical assessments, and thermal evaluations. The results indicated that increasing CS content enhanced composite density while improving MOR and MOE, particularly at moderate filler concentrations (20 wt%). However, excessive CS loading (30 wt%) led to particle agglomeration, negatively impacting mechanical properties. Similarly, WA and swelling increased with higher CS content, attributed to the hydrophilic nature of bio-fillers. Thermal analysis confirmed that CS fillers acted as heat-resistant barriers, delaying thermal degradation and contributing to the composite’s stability under high-temperature conditions.
The findings demonstrated that the optimal formulation (PR3C20) exhibited the highest mechanical performance while maintaining acceptable physical and thermal stability. The incorporation of CS fillers not only enhanced the stiffness of the composites but also contributed to sustainable material development by utilizing waste-derived fillers. The paving slab products met industry standards, confirming their potential for outdoor applications. Future research should explore advanced surface treatments to enhance filler-matrix compatibility, minimizing the negative effects of excessive filler loading. Additionally, long-term durability assessments under real-world environmental conditions are necessary to validate the practical viability of these composites. Investigations into hybrid reinforcement strategies combining CS with other bio-based fillers may further optimize performance, paving the way for broader applications in sustainable material engineering.
Footnotes
Acknowledgements
The authors gratefully acknowledge the financial support from the Thailand Science Research and Innovation (Research Grant Code: 67A171000040) and the Rajamangala University of Technology Srivijaya (RMUTSV), Thailand. We would also like to thank Mr. Sumat Chaitada and Mr. Rujipas Sothong for supporting this work.
Declaration of conflicting interests
The author(s) declared no potential conflicts of interest with respect to the research, authorship, and/or publication of this article.
Funding
The author(s) disclosed receipt of the following financial support for the research, authorship, and/or publication of this article: This work was supported by the Thailand Science Research and Innovation (Research Grant Code: 67A171000040) and the Rajamangala University of Technology Srivijaya (RMUTSV), Thailand.