
Abstract
Herein, CdSe nanoparticles NPs were synthesized via hydrothermal technique. Then, various weight percentages of CdSe NPs (0, 1, 2, and 3 wt.%) were dispersed into PVC matrix via solution casting. This study was explored the effect of various weight percentages of CdSe NPs (0, 1, 2, and 3 wt.%) on the structure, linear/nonlinear optical, optoelectronics features of PVC/CdSe nanocomposite films. The XRD profile revealed that the CdSe NPs have a hexagonal phase with a crystallite size of 22 nm. The Raman investigations of the PVC/CdSe nanocomposite film were conducted. The optical band gap energy declined from 5.25 eV to 4.92 eV with increasing CdSe NPs concentrations. Besides, the band tail value of the PVC film is 0.49 eV. The PVC/CdSe-1, PVC/CdSe-2, and PVC/CdSe-3 films demonstrate an increase in EU energy to 1.22, 1.84, and 1.89 eV, respectively. Additionally, the effect of CdSe NPs on the dispersion energy Ed (2.96-5.71 eV) and the oscillation energy Eo (3.07-3.76 eV) was exhibited. Furthermore, the oscillation frequency (ω P ) and the relaxation time values (τ) of PVC-CdSe nanocomposite films are determined. Moreover, the nonlinear optical values of χ(1), χ(3), and n2 increase as the CdSe NPs concentrations increase. The linear and nonlinear optical results revealed that PVC/CdSe films are suitable candidate materials for optoelectronic devices.
Introduction
Polymers have gained an advantageous role in various aspects of life in recent years as a result of their unique characteristics in comparison to other products. In addition to their capacity to be changed into various shapes, the distinction is rooted in their distinctive structural, optical, thermal, electronic, and mechanical features. Their efficacy as host materials for the majority of semiconductors rendered them the preferred substances for applications that showed potential. 1 The introduction of metal nanoparticles into a transparent polymer matrix has resulted in the interest of researchers in polymeric nanocomposites as advanced technological materials due to their distinctive optical, electronic, mechanical, and structural properties. 2 In the hybrid system, the properties of both the polymer and metal nanoparticles can be synergistically combined or enhanced. The flexible, lightweight, greater mechanical strengths, renewability, and simplicity of manufacture are among the remarkable characteristics of polymer nanocomposites. 3 Consequently, the flexible polymer composite electronics sector is a rapidly expanding discipline that has the potential to create new commercial products, including biomedical sensors, solar cells, and displays.4–11 Polymer nanocomposites exhibit a diverse array of intriguing optical characteristics, such as a high/low refractive index, tailored absorption/emission spectra, and robust optical nonlinearities. 12 The potential for applications in biomedicine, energy storage, sensors, and catalysis is increased by stimuli-responsive and biocompatible polymers, which activate by environment or biological factors.13,14 Polymers are frequently acknowledged as the primary host material for inorganic nanoparticles (NPs). In particular, Poly (vinyl chloride) (PVC) has garnered significant attention as a result of its exceptional chemical and physical characteristics and its numerous applications. Some of these characteristics include its hydrophobicity, formulation versatility, low cost, and non-flammability.15–18 PVC is also a common thermoplastic polymer due to its numerous beneficial attributes, such as its low flammability, and chemical resistance. 19 Additionally, PVC, a synthetic polymer, is utilized in a variety of industries, including cable insulation, consumer products, and blood bags.20,21 Additionally, PVC is one of the most adaptable polymers, as its transparency in the visible domain renders it appropriate for the harboring of inorganic semiconductor nanoparticles with optical activity in the visible range. 22 In this instance, the optical properties of the modified PVC surface were enhanced as a result of the organic compounds’ reactivity with the PVC chain, which increased the absorption of incident light through the surface coating. 22 Some recent works have been dedicated to the PVC-inorganic hybrid optoelectronics using NPs. Elbasiony et al., 23 have reported the optical properties of PVC-Zn ferrite (ZnFe2O4) films for optoelectronics. Cadmium selenide (CdSe), a low band gap semiconductor with an energy band gap of 1.75 eV at 300 K, is a significant II-IV semiconductor extensively used in numerous fields. 24 The incorporation of CdSe into the polymer produces optically functional materials that boost the photoconductivity of host polymers via charge and energy transfer, therefore altering their refractive index, among other attributes. They possess novel and potential applications across several domains, including mechanical engineering, optoelectronics, catalytic activity, and biological science. 25 CdSe is a semiconductor material that is extremely interesting attributable to its optoelectronic, electrical, photocatalytic, and antibacterial characteristics. The potent oxidation potential, advantageous band gap, energy levels that are in a position for activation, excellent optical versatility, and outstanding stability in photochemical reactions, and ecologically friendly features of CdSe have all contributed to its significant interest in the field of photodegradation. CdSe has emerged as a leading material in applications that involve photocatalysis and antibacterial functions due to its direct band gap and significant absorption coefficient. 26 Polymer/CdSe nanocomposites are significant in applications including light-emitting devices, solar cells, sensors, nano-catalysts, eco-friendly memory, and tissue engineering, and are favored for their stability in synthesis protocols as a nanomaterial. 27 Nouh et al., have studied the structural and optical characteristics of PVA/CdSe nanocomposites. 28 The solution casting method offers several benefits, such as the ability to regulate the thickness of films and its simplicity at the laboratory scale. In contrast, this technique suffers by many obstacles that hinder large-scale production, including a high consumption of organic solvents, a lengthy manufacturing time, and the nonuniform distribution of fillers within the polymer matrix as a result of gravity sedimentation of filler particles during the procedure of drying. 29
Herein, we have synthesized CdSe NPs via hydrothermal technique. Then, various weight percentages of CdSe NPs (0, 1, 2, and 3 wt.%) were dispersed into PVC matrix via solution casting. This study was explored the effect of various weight percentages of CdSe NPs (0, 1, 2, and 3 wt.%) on the structure, linear/nonlinear optical, optoelectronics features of PVC/CdSe nanocomposites films.
Experimental
The polymer PVC was synthesized by dissolving polyvinyl chloride (PVC, Sigma-Aldrich) 8% in 100 mL of tetrahydrofuran (THF) using a magnetic stirrer for 4 h at ambient temperature, followed by casting. CdSe NPs were produced by the hydrothermal technique. Aqueous solutions of CdSO4·8H2O and Na2SeO3 were used as precursors. A certain quantity of surfactant (CTAB) was incorporated into the aforementioned solution while stirring. The completed solution was placed into a stainless steel autoclave lined with Teflon. The autoclave has been closed and kept at 160°C for 8 h. The completed product was subjected to filtration and washed many times with ethanol and water, thereafter dried at 60°C for 4 h. For PVC/CdSe films with different concentrations (0, 1, 2, and 3 wt.%), the synthesis method was described in details in 23. The films were labeled as PVC, PVC/CdSe-1, PVC/CdSe-2, and PVC/CdSe-3 films.
Results and discussions
Structure studies
XRD analysis can effectively characterize the structural properties of a sample. The XRD profile of the CdSe nanoparticles was depicted in Figure 1. The peaks indexed by the CdSe structure indicated a crystalline behavior (JCPDS file No: 00-002-0330). Previous investigations yielded comparable outcomes.30–33 The XRD profile of the CdSe nanoparticles.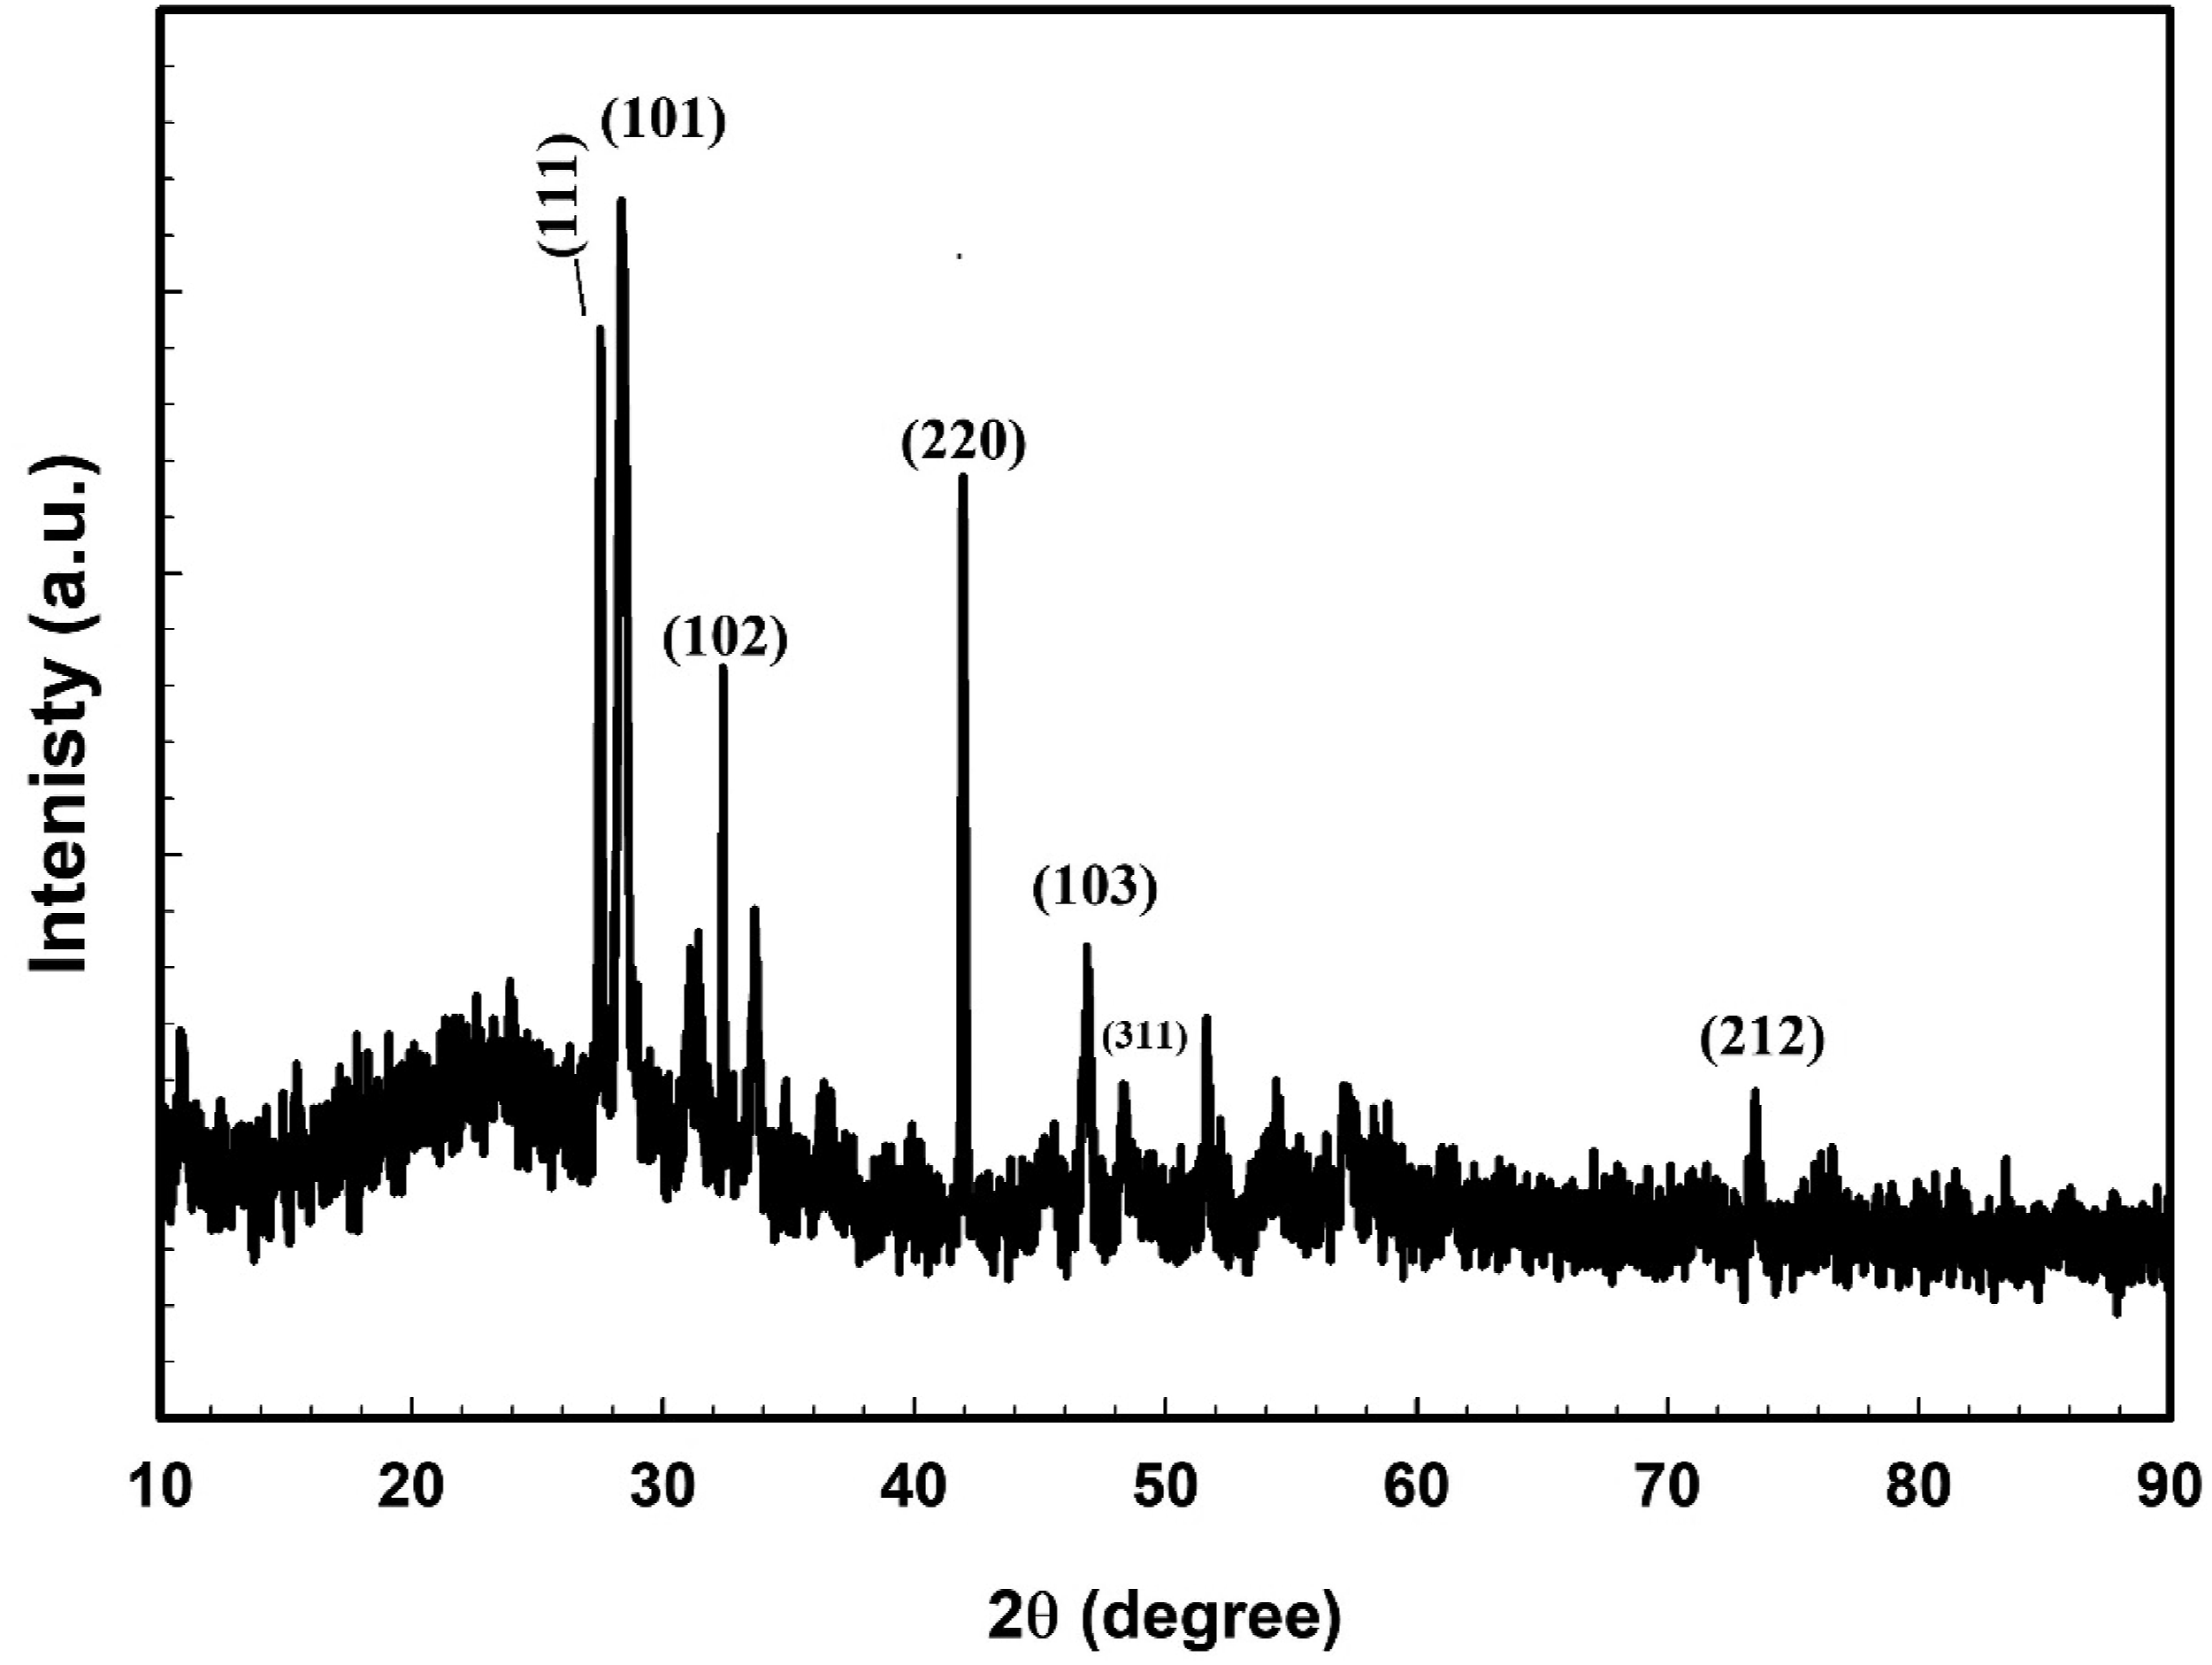
With the Scherrer equation, the crystallite size of CdSe nanoparticles was determined
34
:
In the aforementioned expression, D represents the size of the crystallites, k is 0.9, the particle shape factor, the X-ray wavelength is 0.1542 nm, and
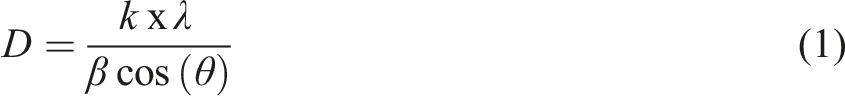
Figure 2(a) and (b) shows SEM images of CdSe powder and EDX spectra of CdSe powder. The surface of the nanoflakes is also visible in SEM images, with a few degrees of aggregation of CdSe. Energy dispersive X-ray (EDX) spectra revealed the purity of CdSe NPs and indicated that stoichiometric CdSe was formed, as evidenced by the elemental composition of the CdSe NPs ((Figure 2(c)). (a) and (b) SEM images and (c) EDX spectra of CdSe NPs.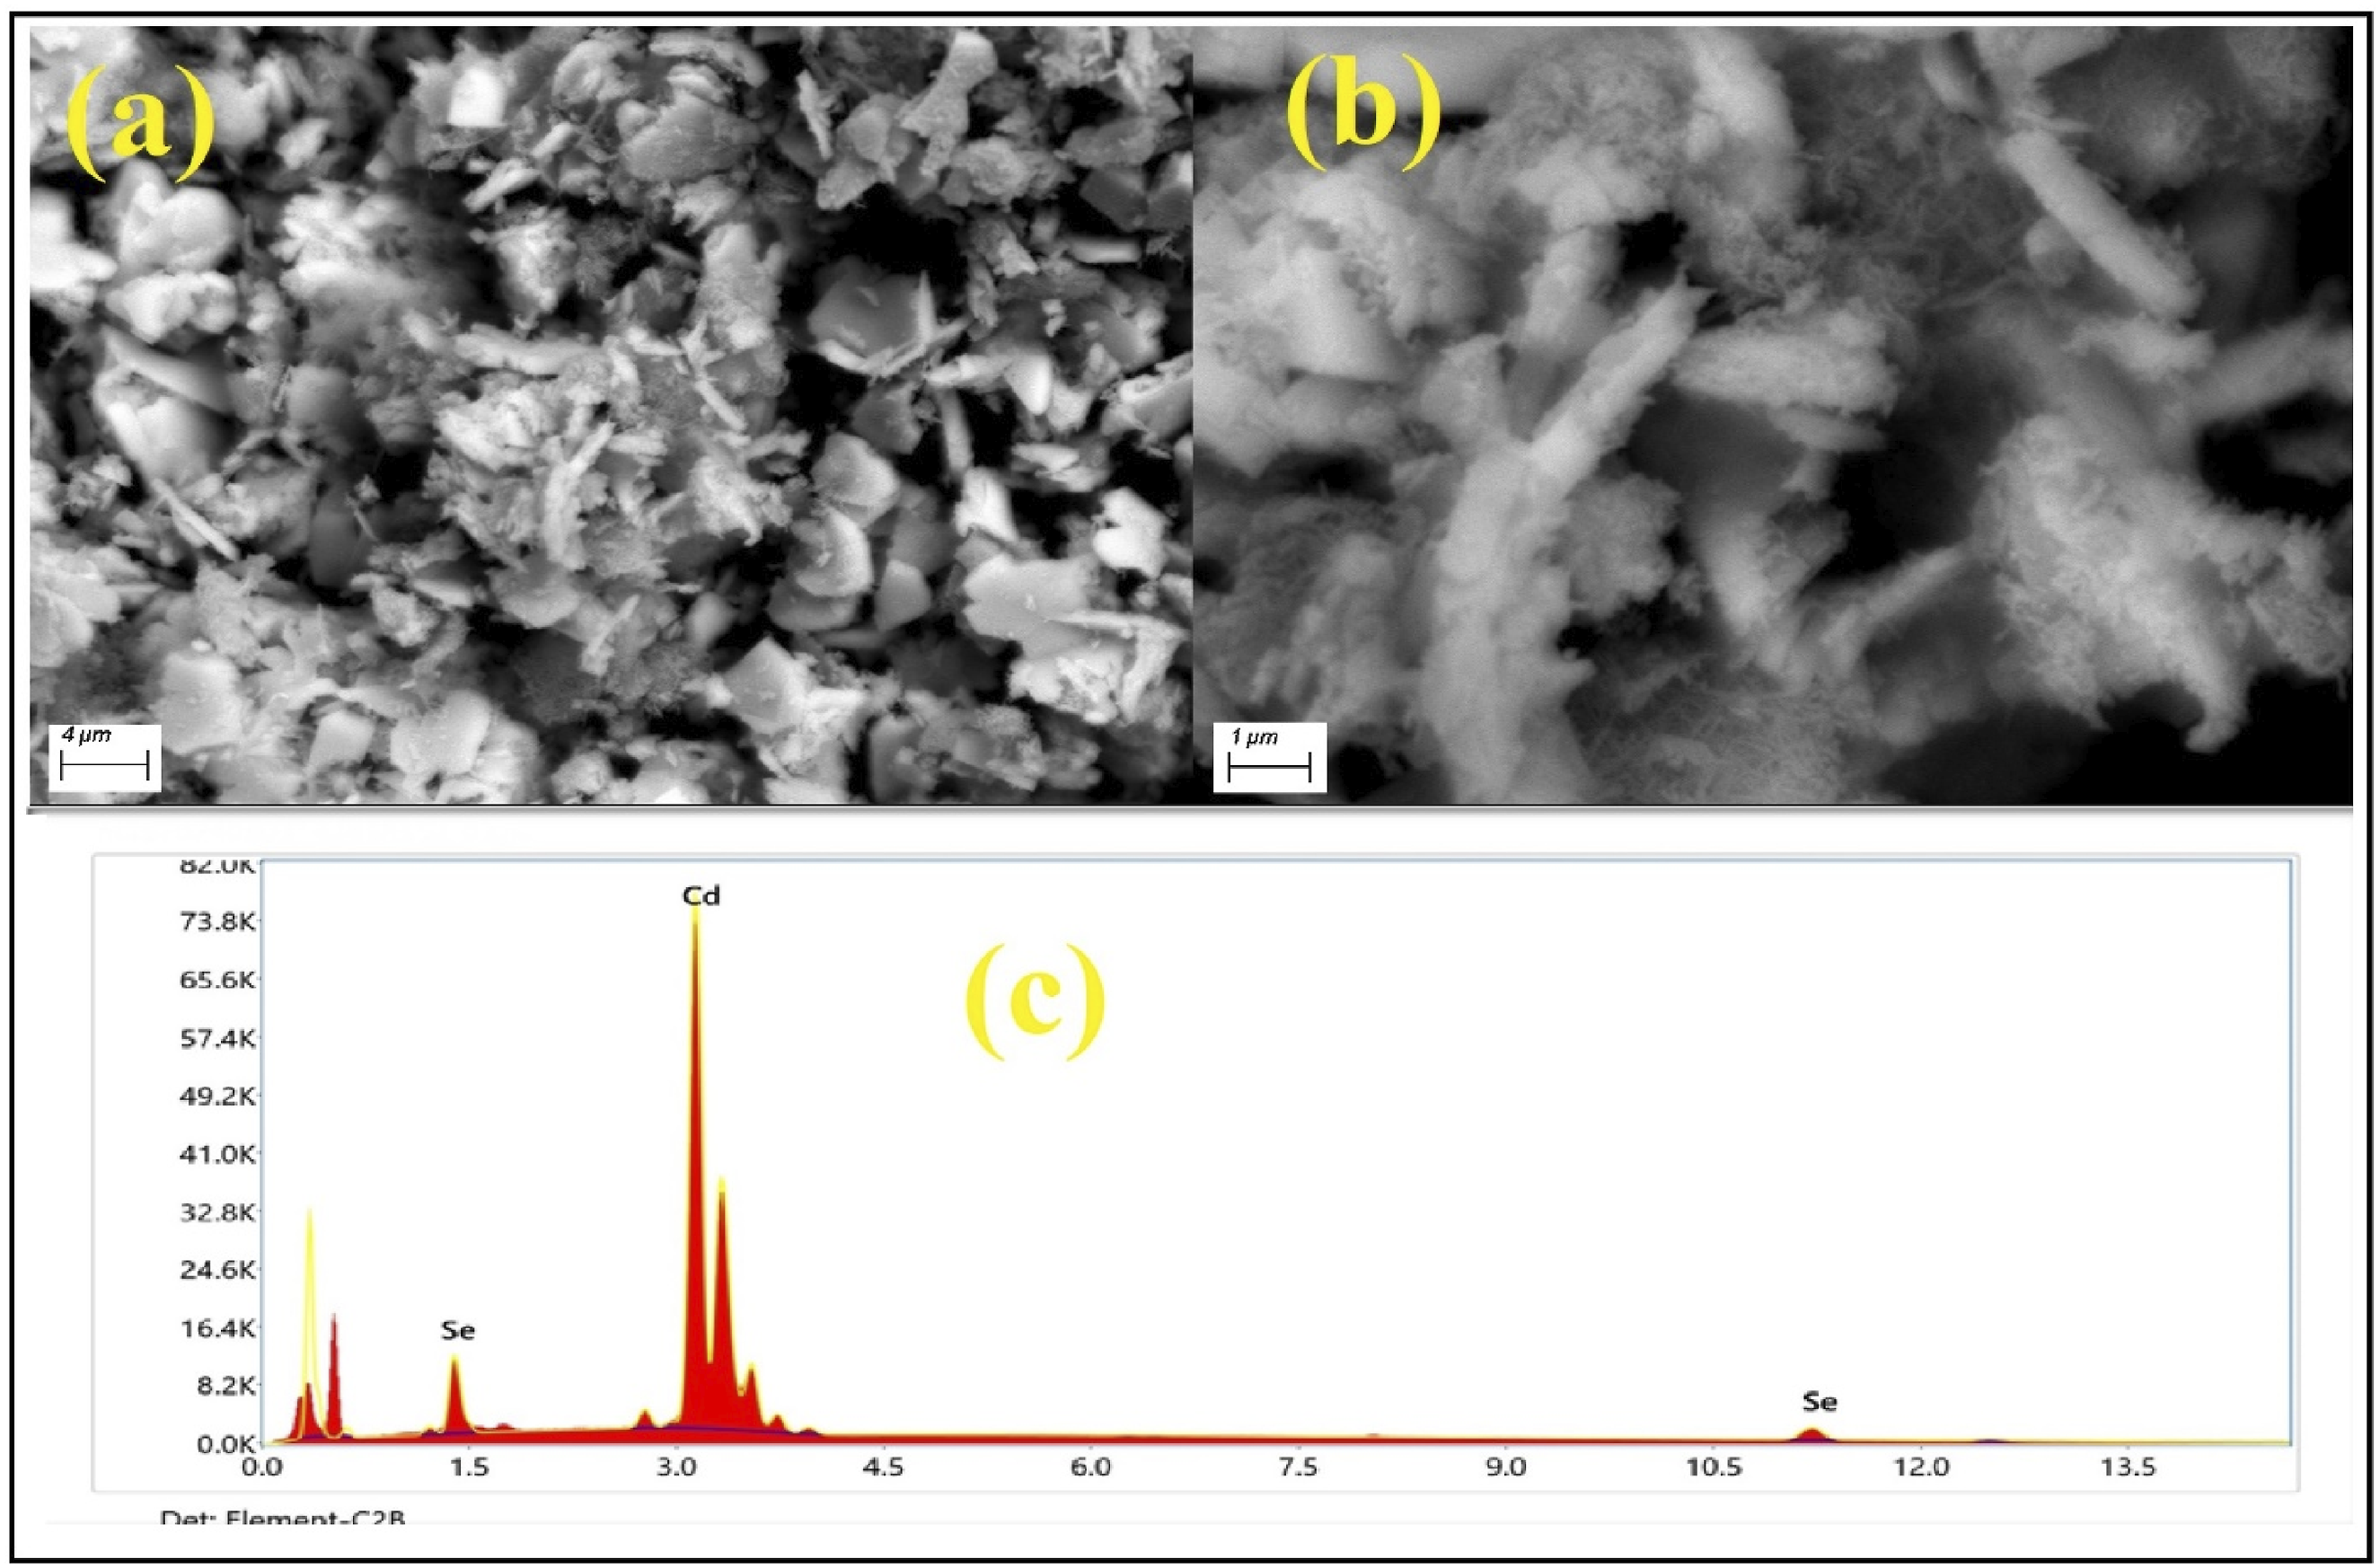
In Figure 3, XRD patterns of nanocomposites consisting of PVC and PVC/CdSe are illustrated. The pattern identified of pure-PVC provides evidence that the PVC is amorphous, which is an appropriate characteristic.
35
Additionally, the intensity of the CdSe NPs peaks increases gradually as the concentration of CdSe NPs in the PVC matrix increases, accompanied by a reduction in the hump of the XRD for PVC. This figure validated the effective synthesis of PVC/CdSe nanocomposites. XRD patterns of PVC and PVC/CdSe nanocomposites.
The Raman investigations of the PVC/CdSe-2 nanocomposite film were conducted to further verify the presence of CdSe NPs within the PVC ploymer, as illustrated in Figure 4. This spectrum revealed five highly prominent vibrational Raman active peaks of the CdSe NPs at 145 cm−1, 391 cm−1, 428 cm−1, 517 cm−1, and 649 cm−1.36,37 The second-order longitudinal-optical (2LO) and third-order (3LO) phonons of CdSe could be attributed to the peaks at 428 cm−1 and 649 cm−1, respectively.
38
However, the PVC also exhibits distinct peaks at 830 cm−1, 1036 cm−1, 1272 cm−1, 1344 cm−1, and 1438 cm−1. These peaks may be attributed to the C–H bond in the C–H structure, the C–C bond, the (C–H) out plane bending in the CH–Cl grouping, the C–H or C–C single bond, and the C=C cumulated double bond.39–41 In addition, the stretching vibrations of C-Cl bonds were recorded, with a peak at 740 cm−1. Furthermore, the (C–H) stretching mode is represented by the bands at 2915 and 31 cm−1.
42
The successful preparation of the PVC/CdSe nanocomposite film was demonstrated by these results. The Raman investigations of the PVC/CdSe-2 nanocomposite film.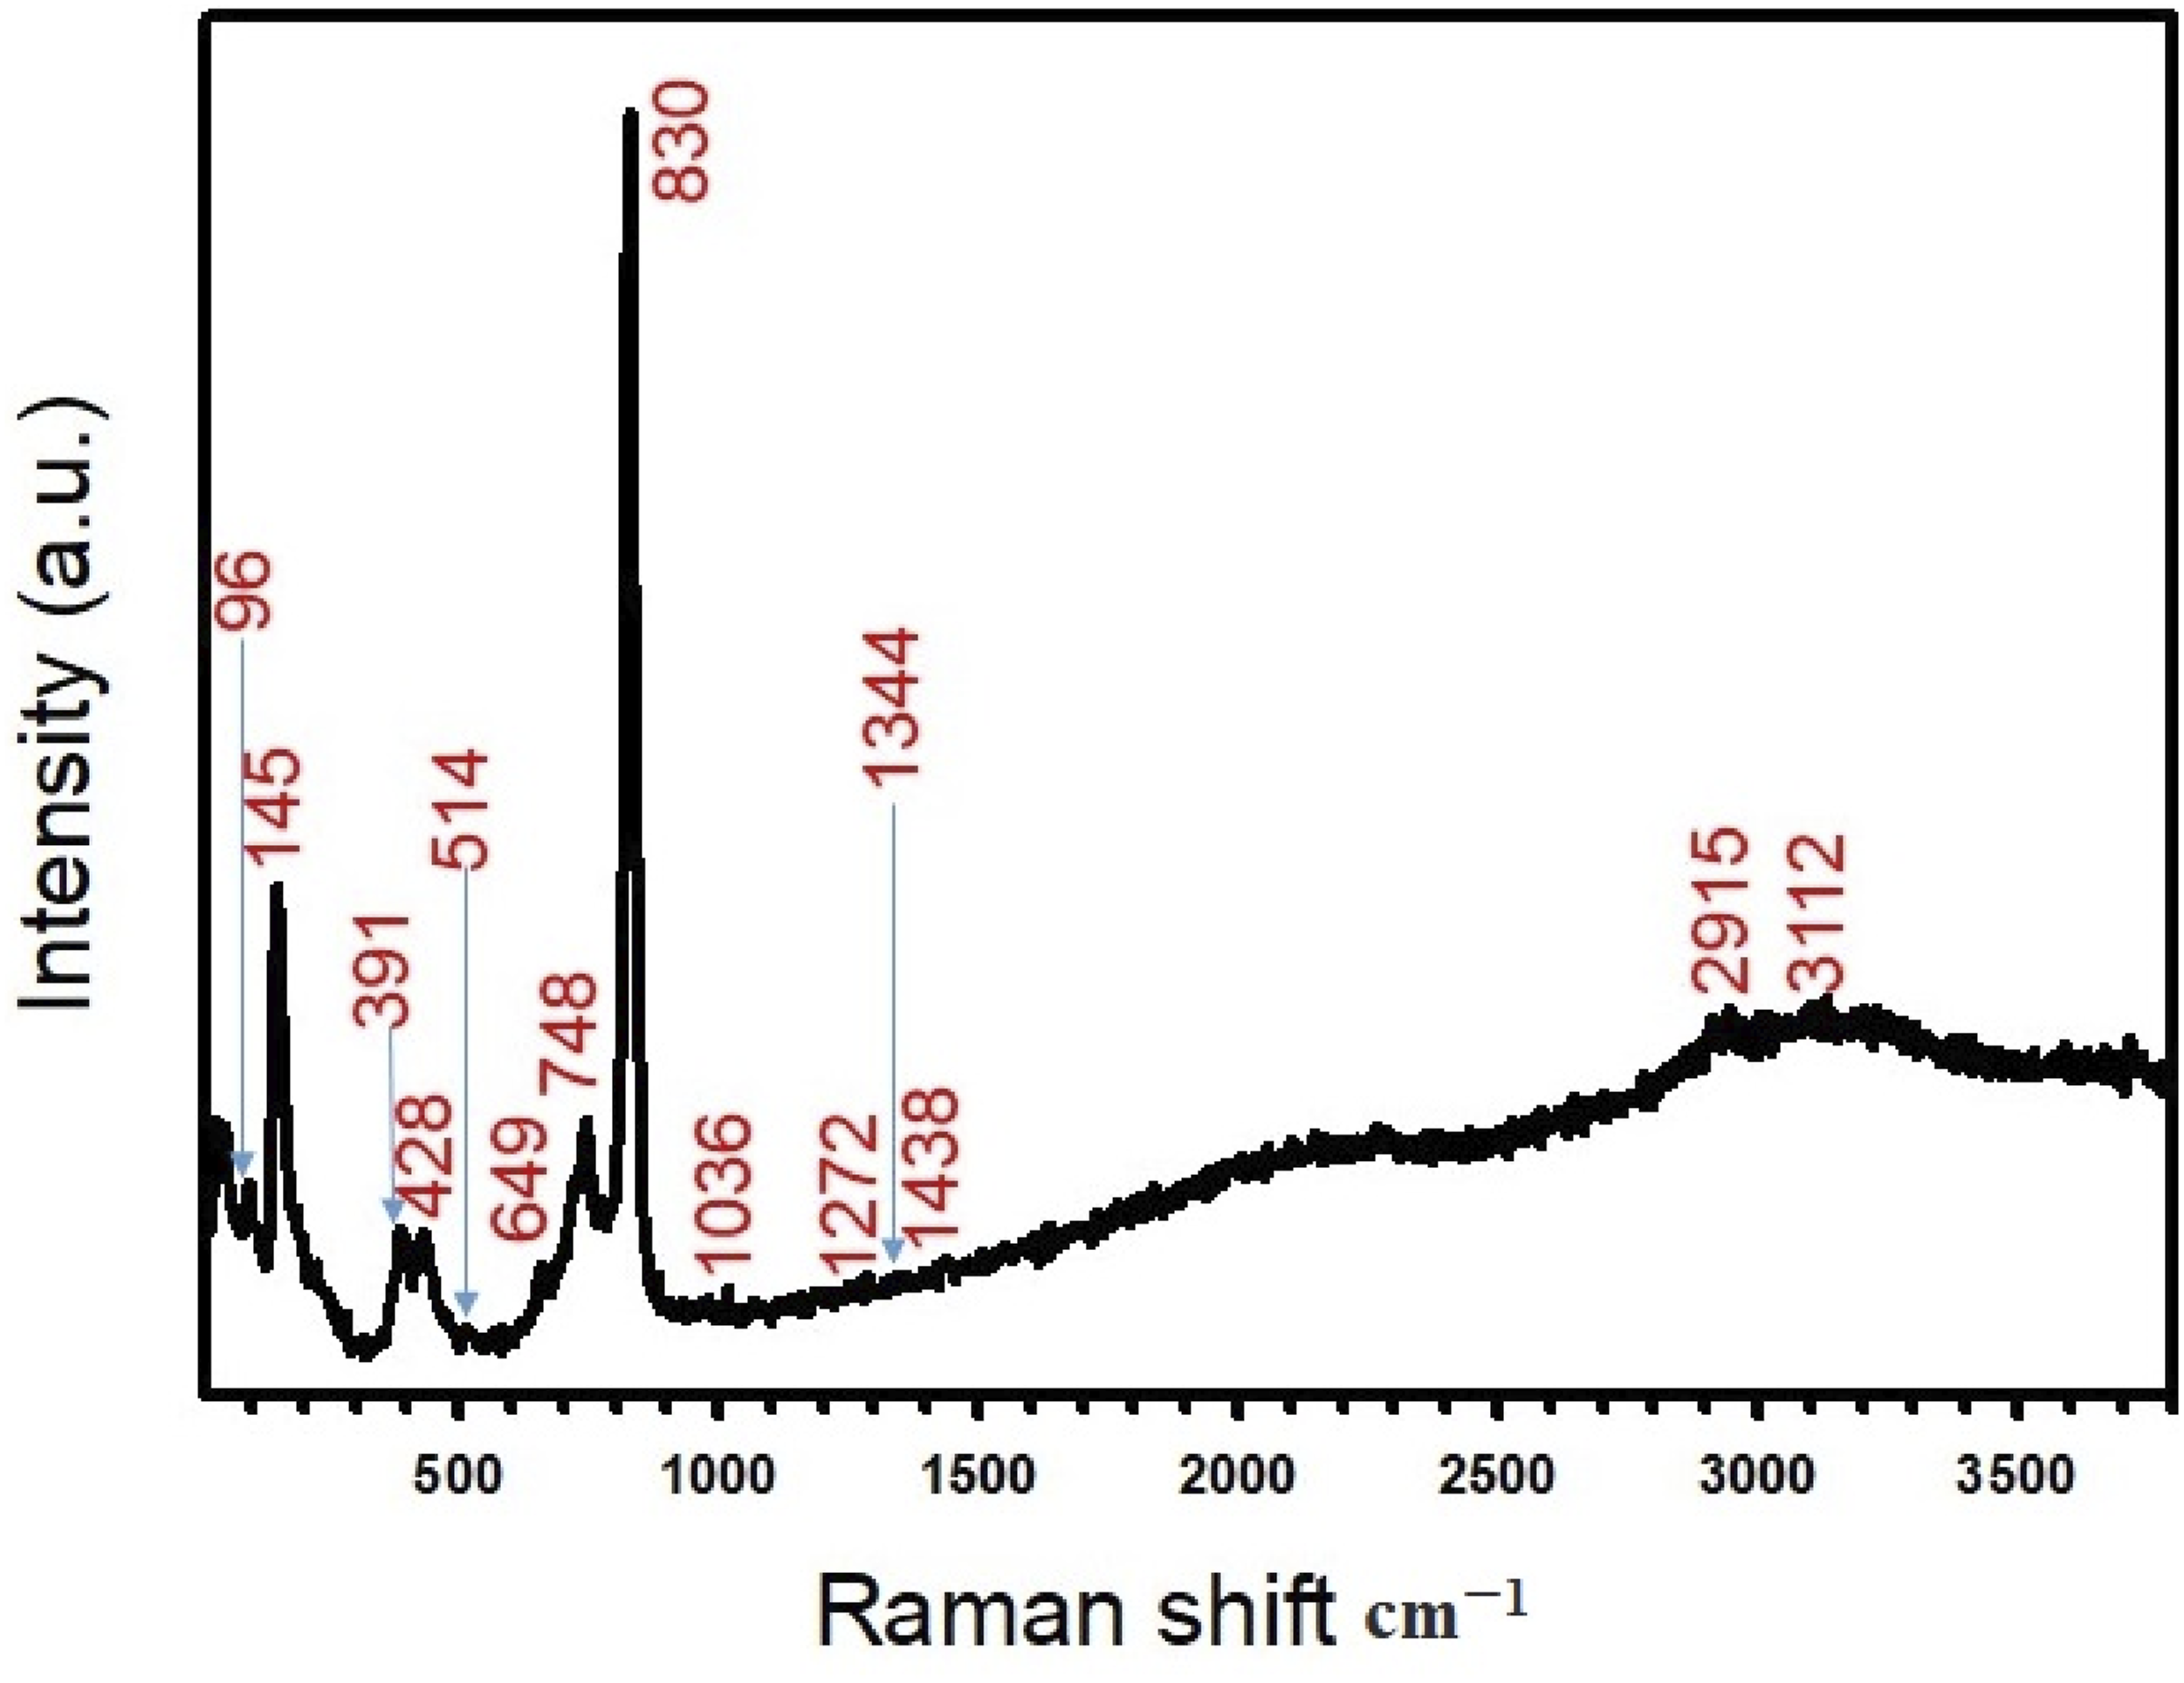
Optical behavior
The absorbance (A) spectra of PVC and PVC/CdSe nanocomposites with various percentages of CdSe NPs (0, 1, 2, 3 wt.%) was illustrated in Figure 5. The PVC has a peaks at around 216 and 280 nm, attributed to the electron transitions from π to π* and n to π* resulting from the unsaturated (C=C) bonds and the C–Cl bond, respectively.43,44 Furthermore, with PVC doped with varying concentrations of CdSe NPs (0, 1, 2, 3 wt.%), the peaks at 286 nm exhibited a shift towards lower photon energy (redshift), indicating a decrease in the band gap upon the incorporation of CdSe NPs and the complexation between the PVC polymer and CdSe NPs.
45
Hydrogen bonding may have occurred between the PVC chains and the surface of CdSe NPs.
23
The absorbance (A) spectra of PVC and PVC/CdSe nanocomposites with various percentages of CdSe NPs (0, 1, 2, 3 wt.%).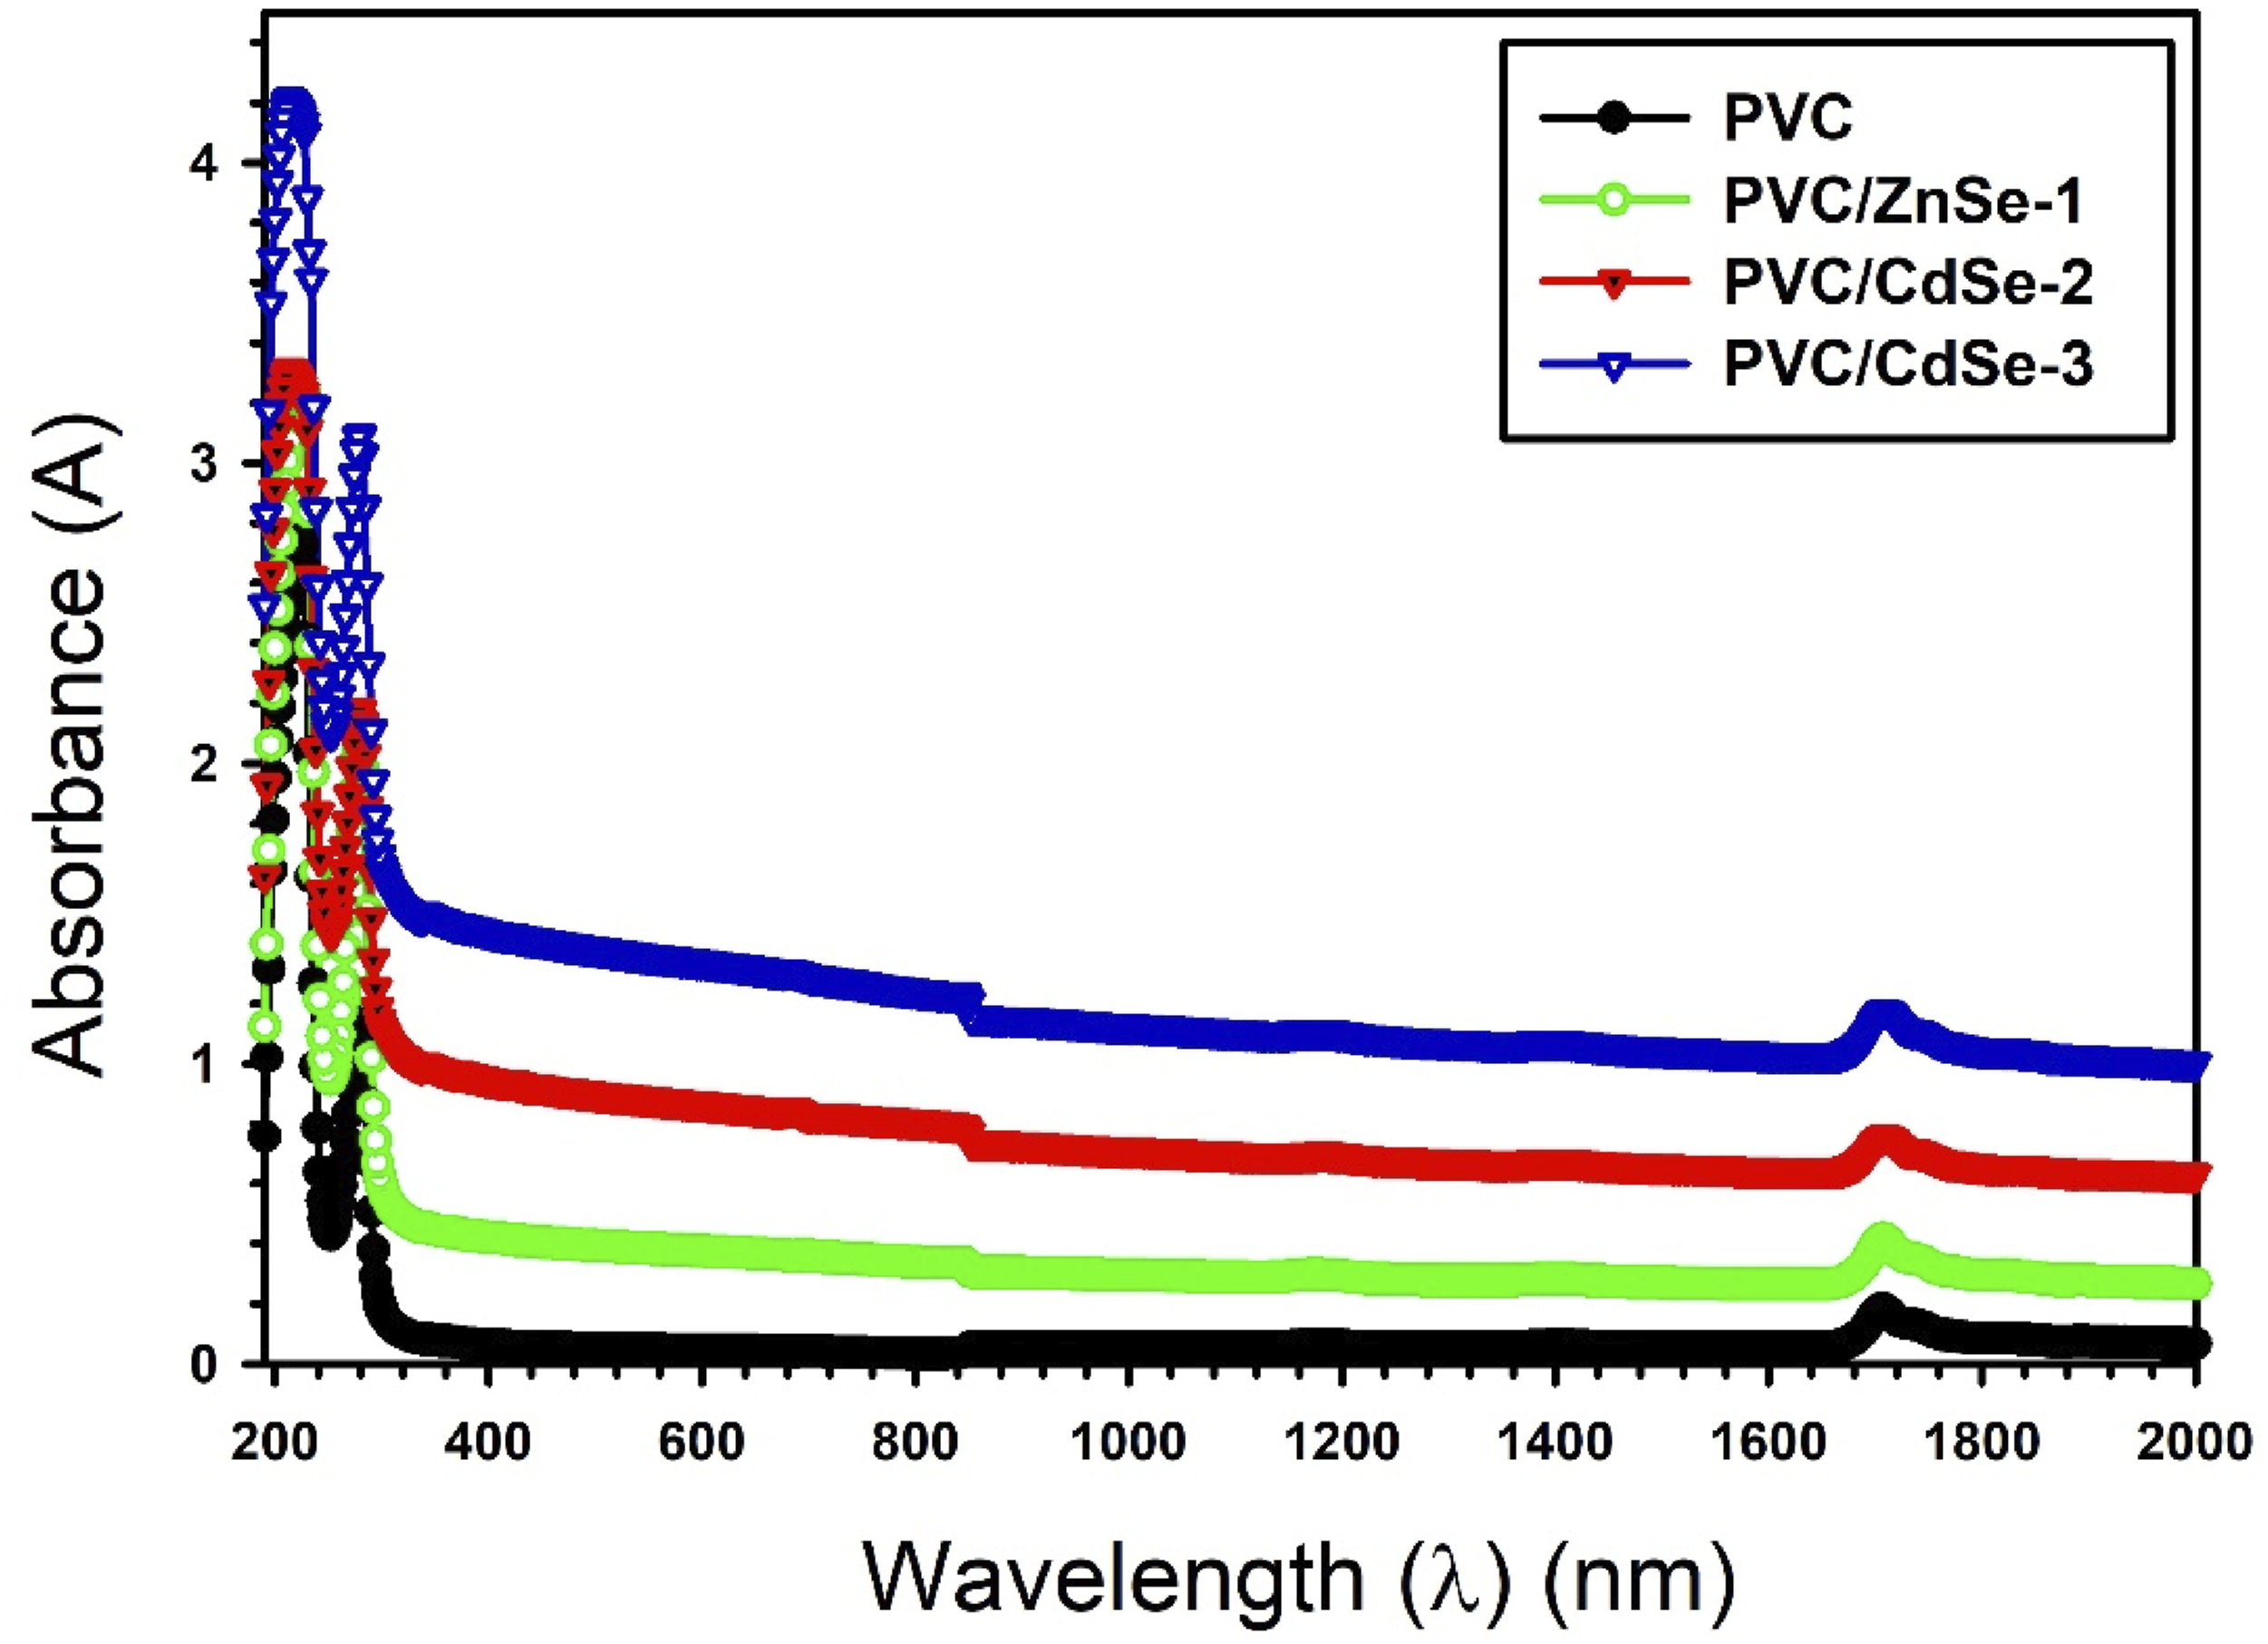
Figure 6 shows the absorbance coefficient α, (α = 2.303 × A × d−1) d denotes the thickness, versus the photon energy for the PVC-CdSe films. The absorbance coefficient exhibited a shift to lower photon energy as the CdSe NPs contents increased. This behavior can attributed to the decline of the absorbance edge energy Egd as a consequence of the changes of absorbance. The absorbance edge energy Egd decline from 5.13 eV for PVC to 4.73 eV for PVC/CdSe-3 nanocomposite film. The absorbance coefficient α versus the photon energy for the PVC-CdSe films.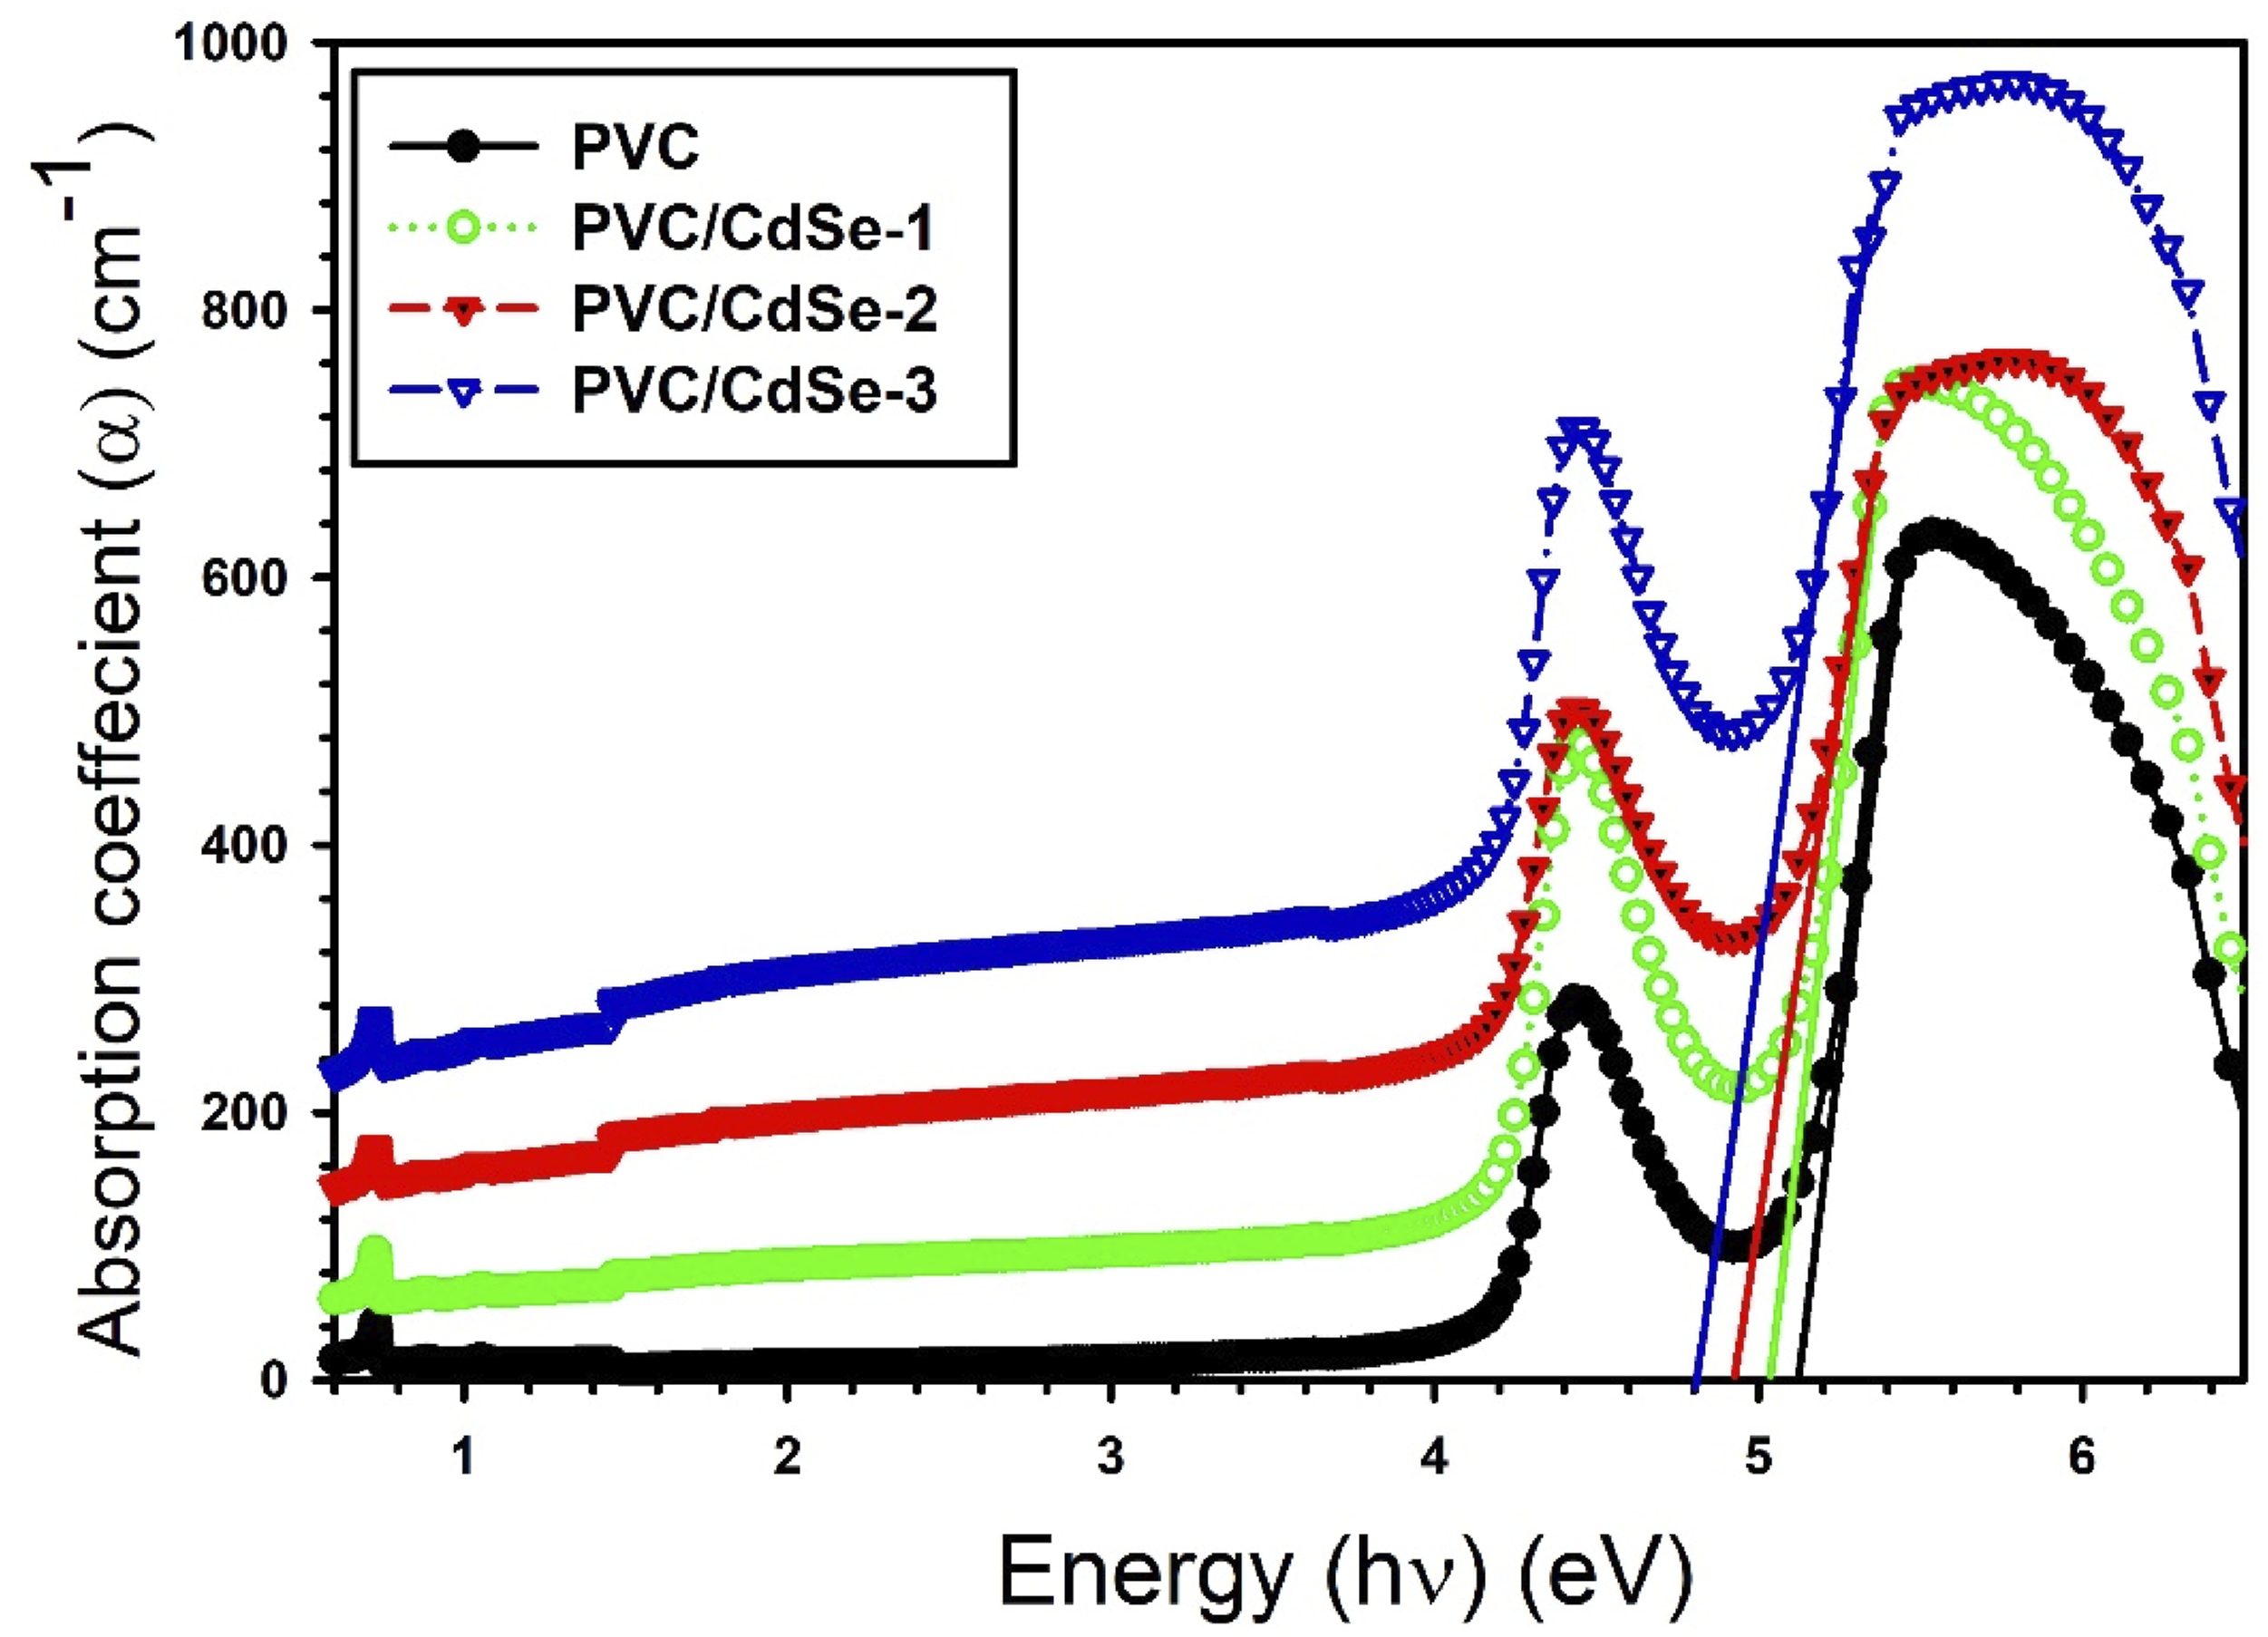
The direct optical band gap energy (Eg) for both pure and CdSe-loaded PVC films has been ascertained using Tauc’s method [
The s represents electronic transition index, constant donated by A, and photon energy is hυ.
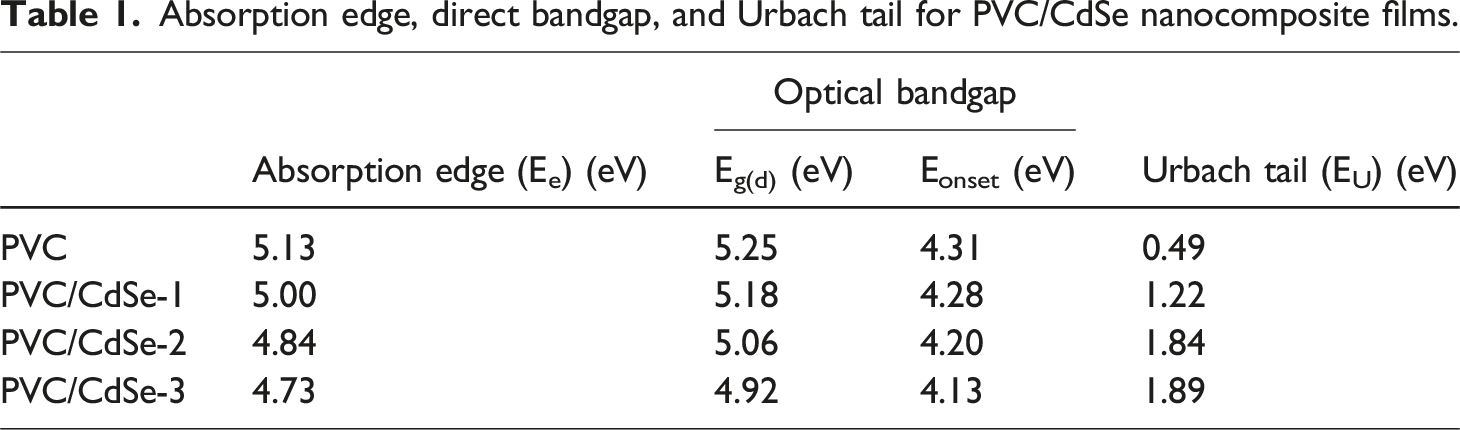
By extending the linear segment of the (αhυ)2 against hυ plots to hυ = 0, as seen in Figure 7. The acquired Eg values for the PVC-CdSe films are shown in Table 1. The optical band gap energy of pure PVC was 5.25 eV. This band diminished as the concentration of CdSe varied. The minimum direct optical band gap, measuring 4.92 eV, are achieved when the CdSe concentration reaches 3%. Comparable outcomes were obtained in the PVC polymer filled with Al2O3 NPs.
49
The incorporation of CdSe nanofillers facilitates the formation of molecular complexes between the PVC matrix and the CdSe. This interaction induces changes in the PVC’s electronic structure, resulting in a reduction of the energy gap. The incorporation of CdSe nanofillers into the PVC polymer matrix induces a development of localized electronic states, which function as trapping and recombination centers, hence altering the optical band gap. This shift may also be ascribed to a sudden rise in disorder resulting from modifications in the polymer structure.46,50,51 (αhυ)2 against hυ plots for both pure and CdSe-loaded PVC films. Absorption edge, direct bandgap, and Urbach tail for PVC/CdSe nanocomposite films.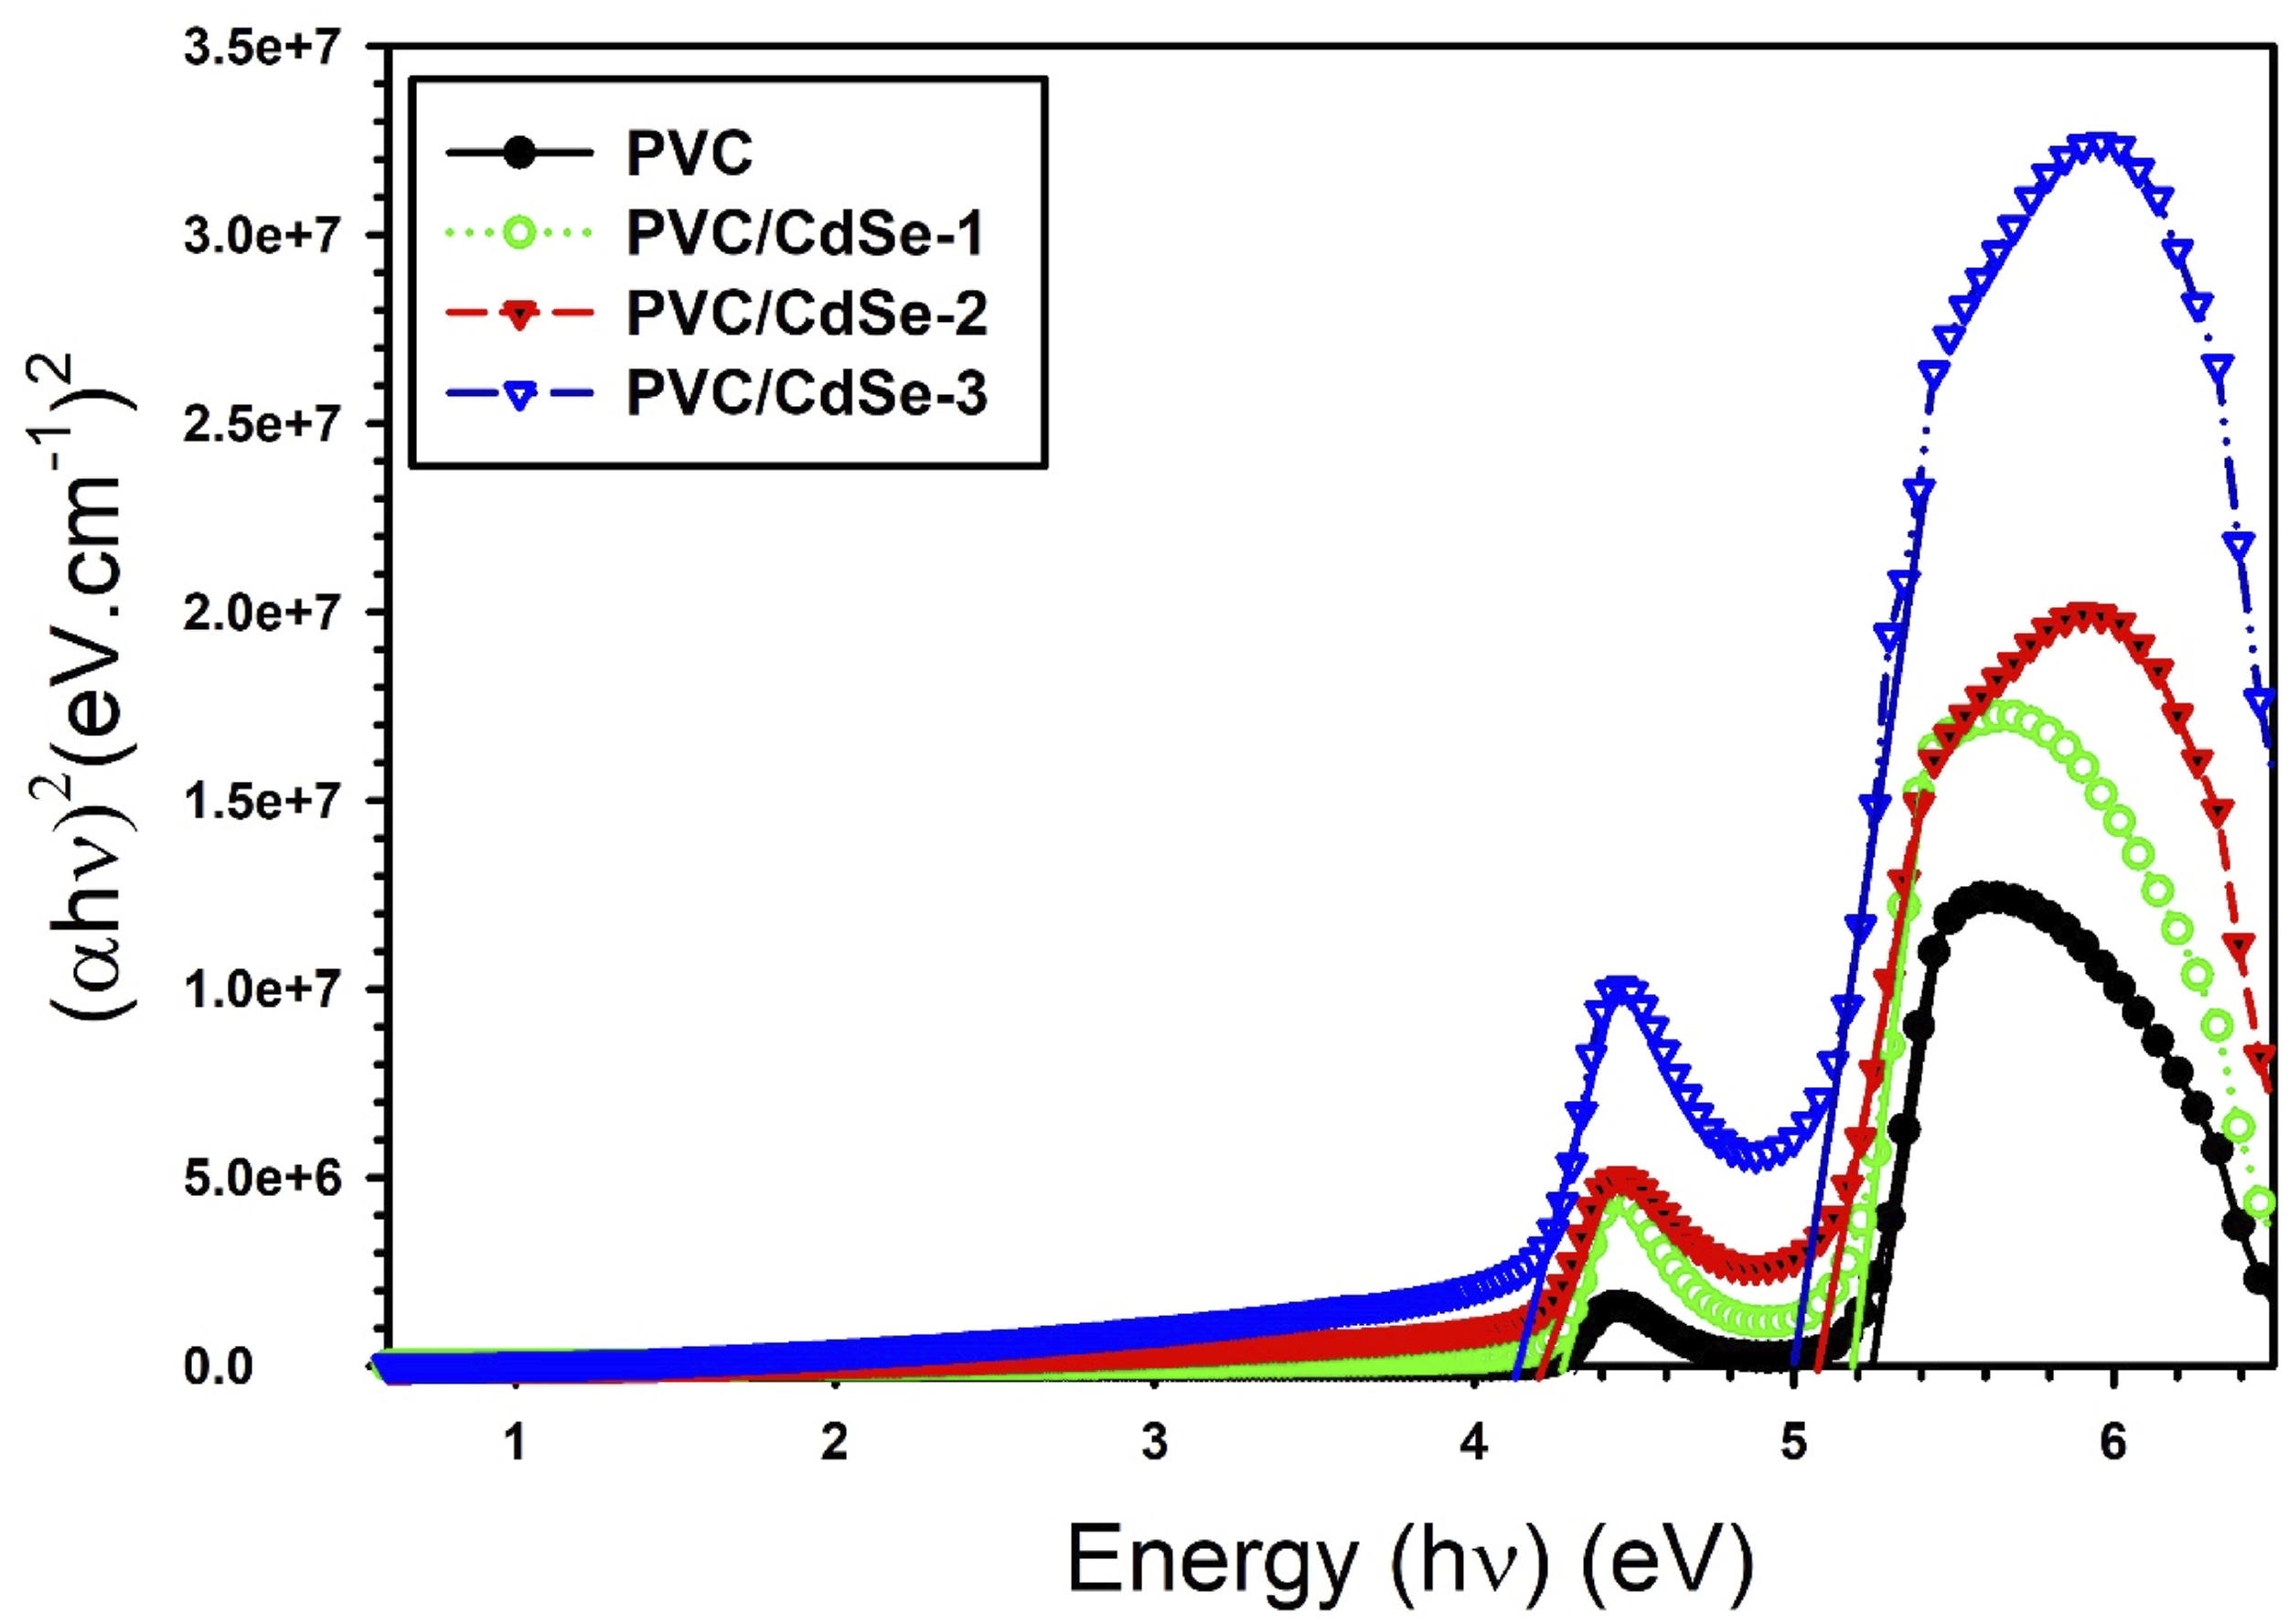
An exponential relationship is seen between the absorption coefficient and frequency for transitions from localized to extended states, as well as for localized transitions, characterized by an exponential decrease of the density of states of the localized states into the gap52,53:
In this context, EU refers to “Urbach energy,” which characterizes the wide of the tail of localized states inside the forbidden band gap, associated with the amorphous characteristics of the materials,
54
whereas
The Urbach energy may be ascertained by graphing the logarithm of the absorption coefficient versus photon energy and calculating the inverse of the slope of the linear segment seen in Figure 8. The Urbach energy values rise with the rising amount of CdSe NPs in PVC films (refer to Table 1). Broader band tails indicate the emergence of disorder and defects in the band structure of the composites, attributed to the presence of CdSe NPs, which promotes the production of additional localized states inside the forbidden energy gap. The band tail value of the PVC film is 0.49 eV. The PVC/CdSe-1, PVC/CdSe-2, and PVC/CdSe-3 films demonstrate an increase in EU energy to 1.22, 1.84, and 1.89 eV, respectively. These findings substantiate the significant induced influence on the energy states subsequent to the incorporation of the CdSe NPs and illustrate the emergence of additional defect states inside the PVC host.54–56 Plots of logarithm of the absorption coefficient versus photon energy for both pure and CdSe-loaded PVC films.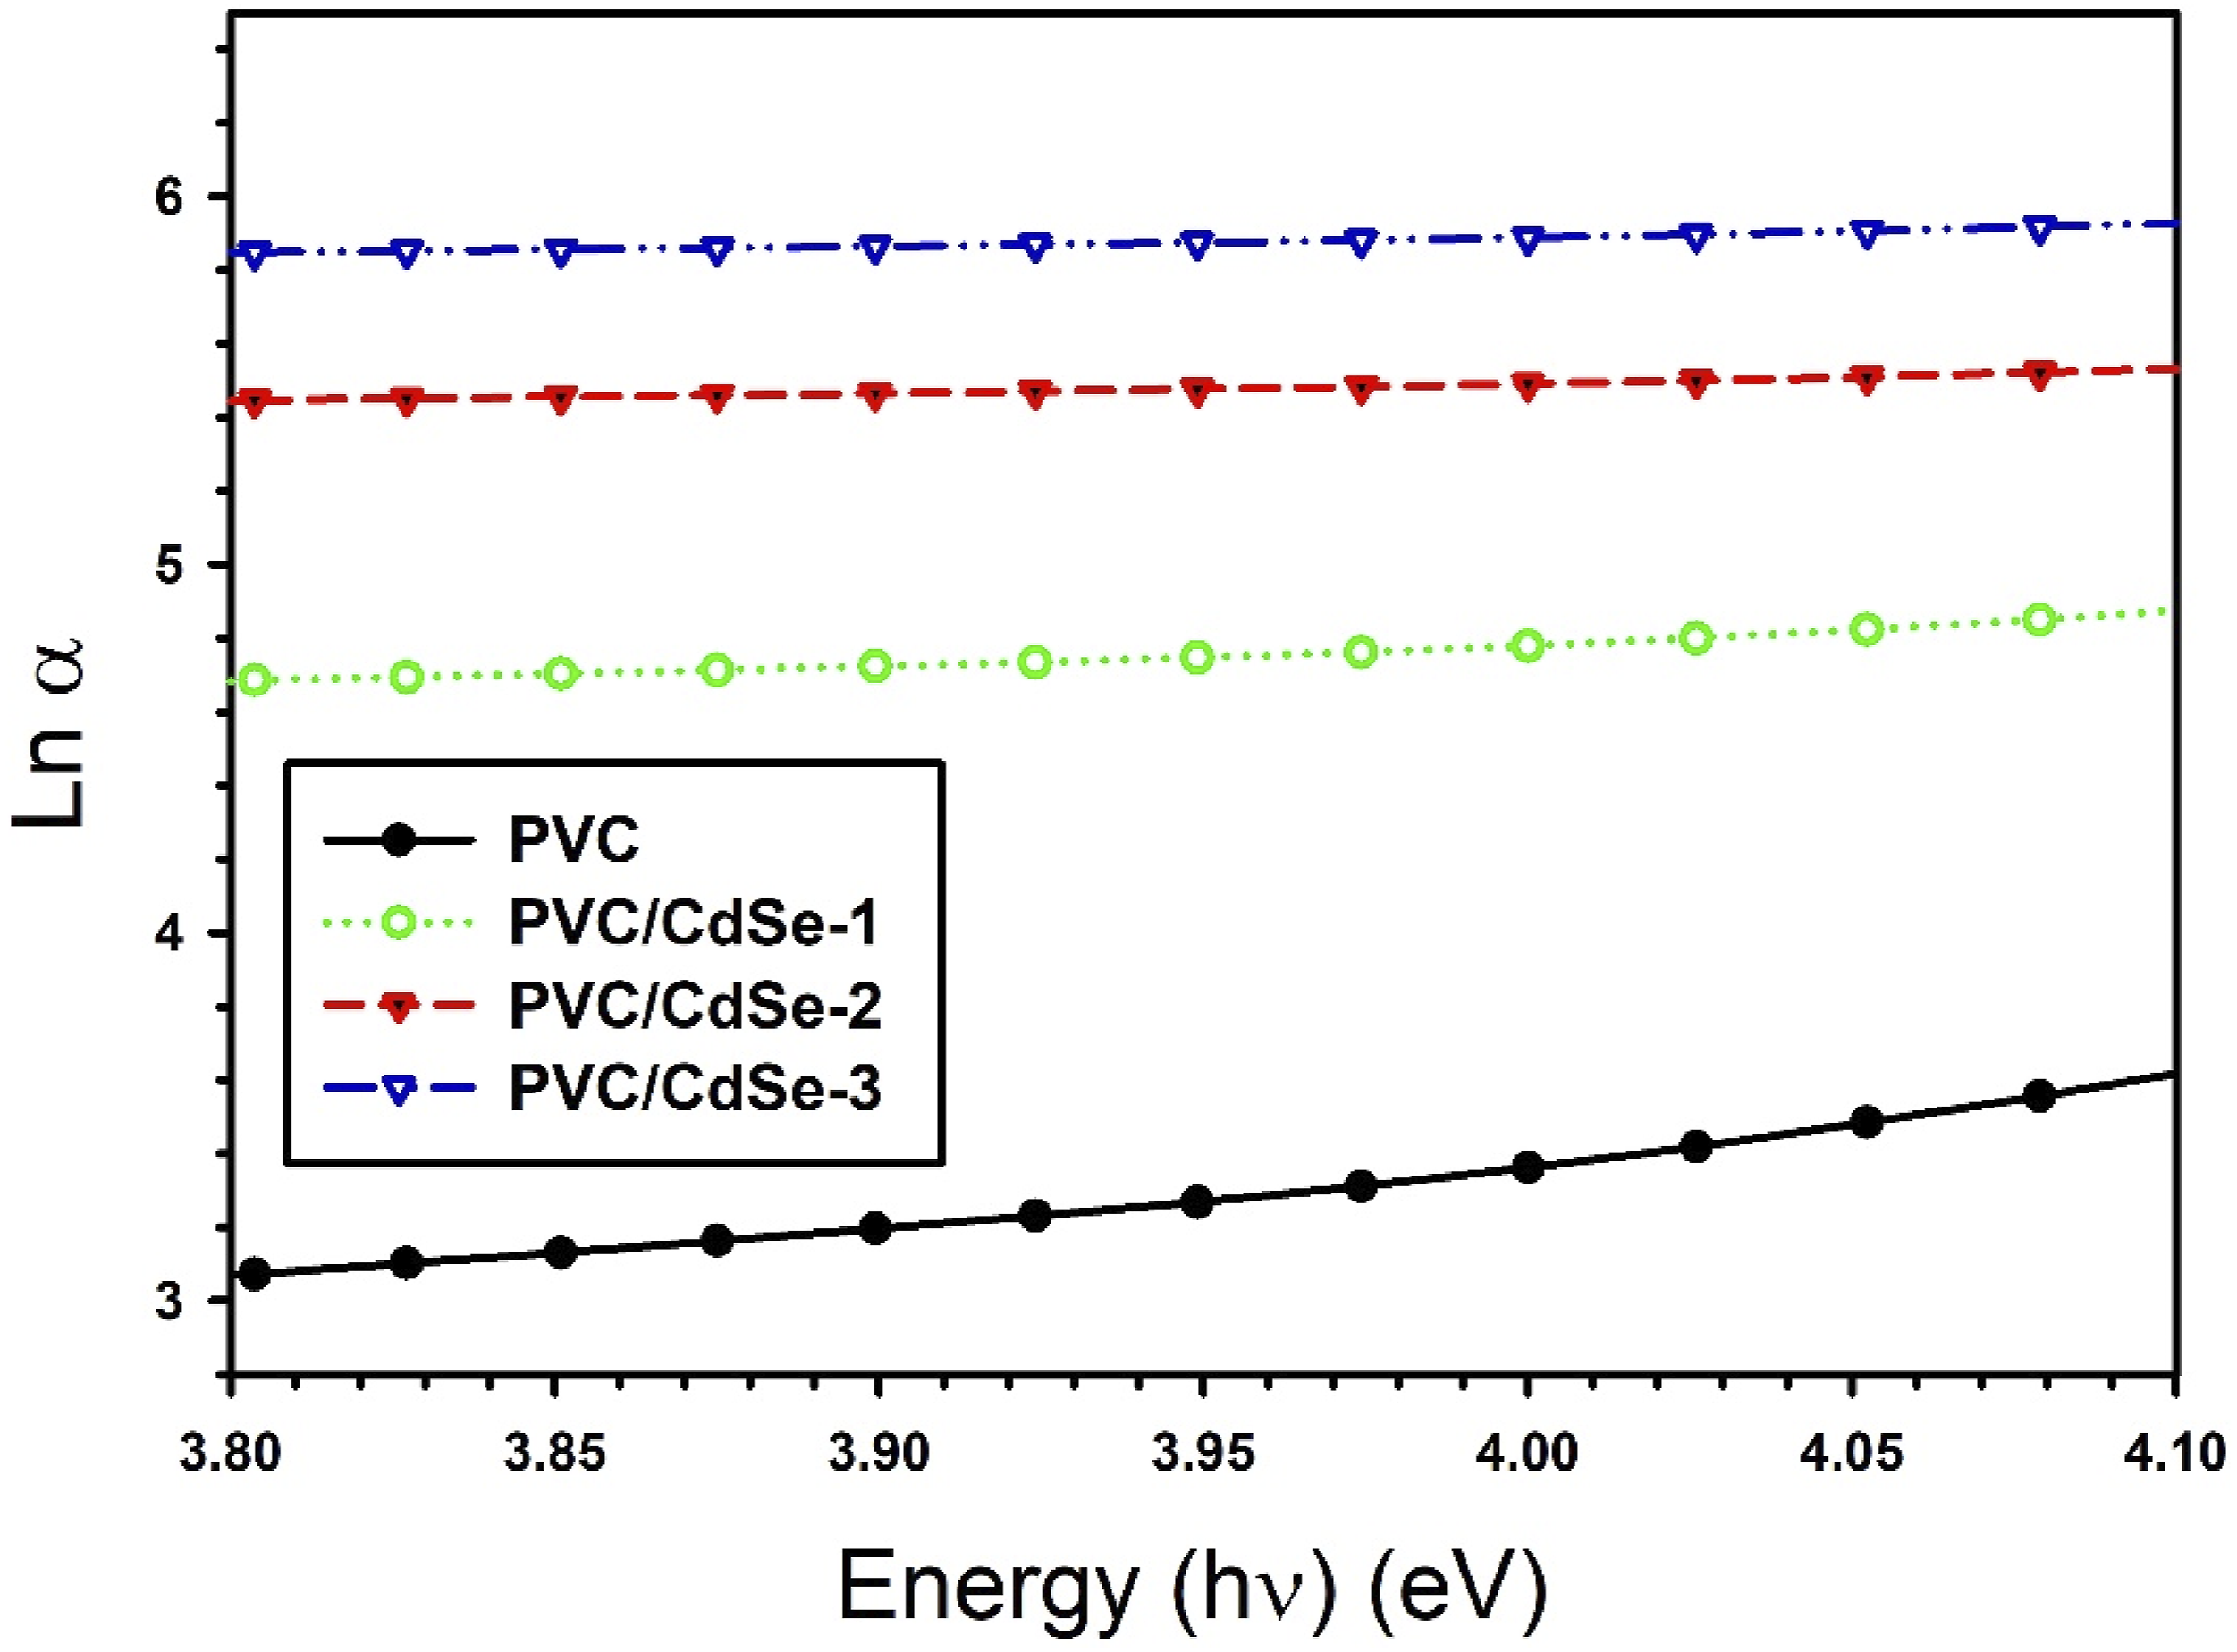
Examining the refractive index of CdSe-loaded PVC films has many positive aspects. The optical and electrical properties of high refractive index polymer films have been examined in optoelectronic applications. The refractive index of a film is affected by molecular structure, dopants, film thickness, and flexing.
46
Reflectance quantifies the quantity of light reflected from a surface. Figure 9(a) illustrates the fluctuation in reflectance as a function of wavelength for CdSe-loaded PVC films. The relationship between reflectance (R) and refractive index (n) may be ascertained using the following equation
57
: Variations of (a) R, (b) n, and (c) spectra for CdSe-loaded PVC films.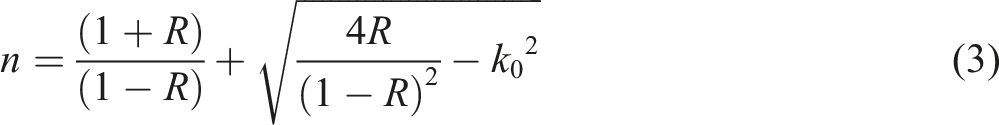
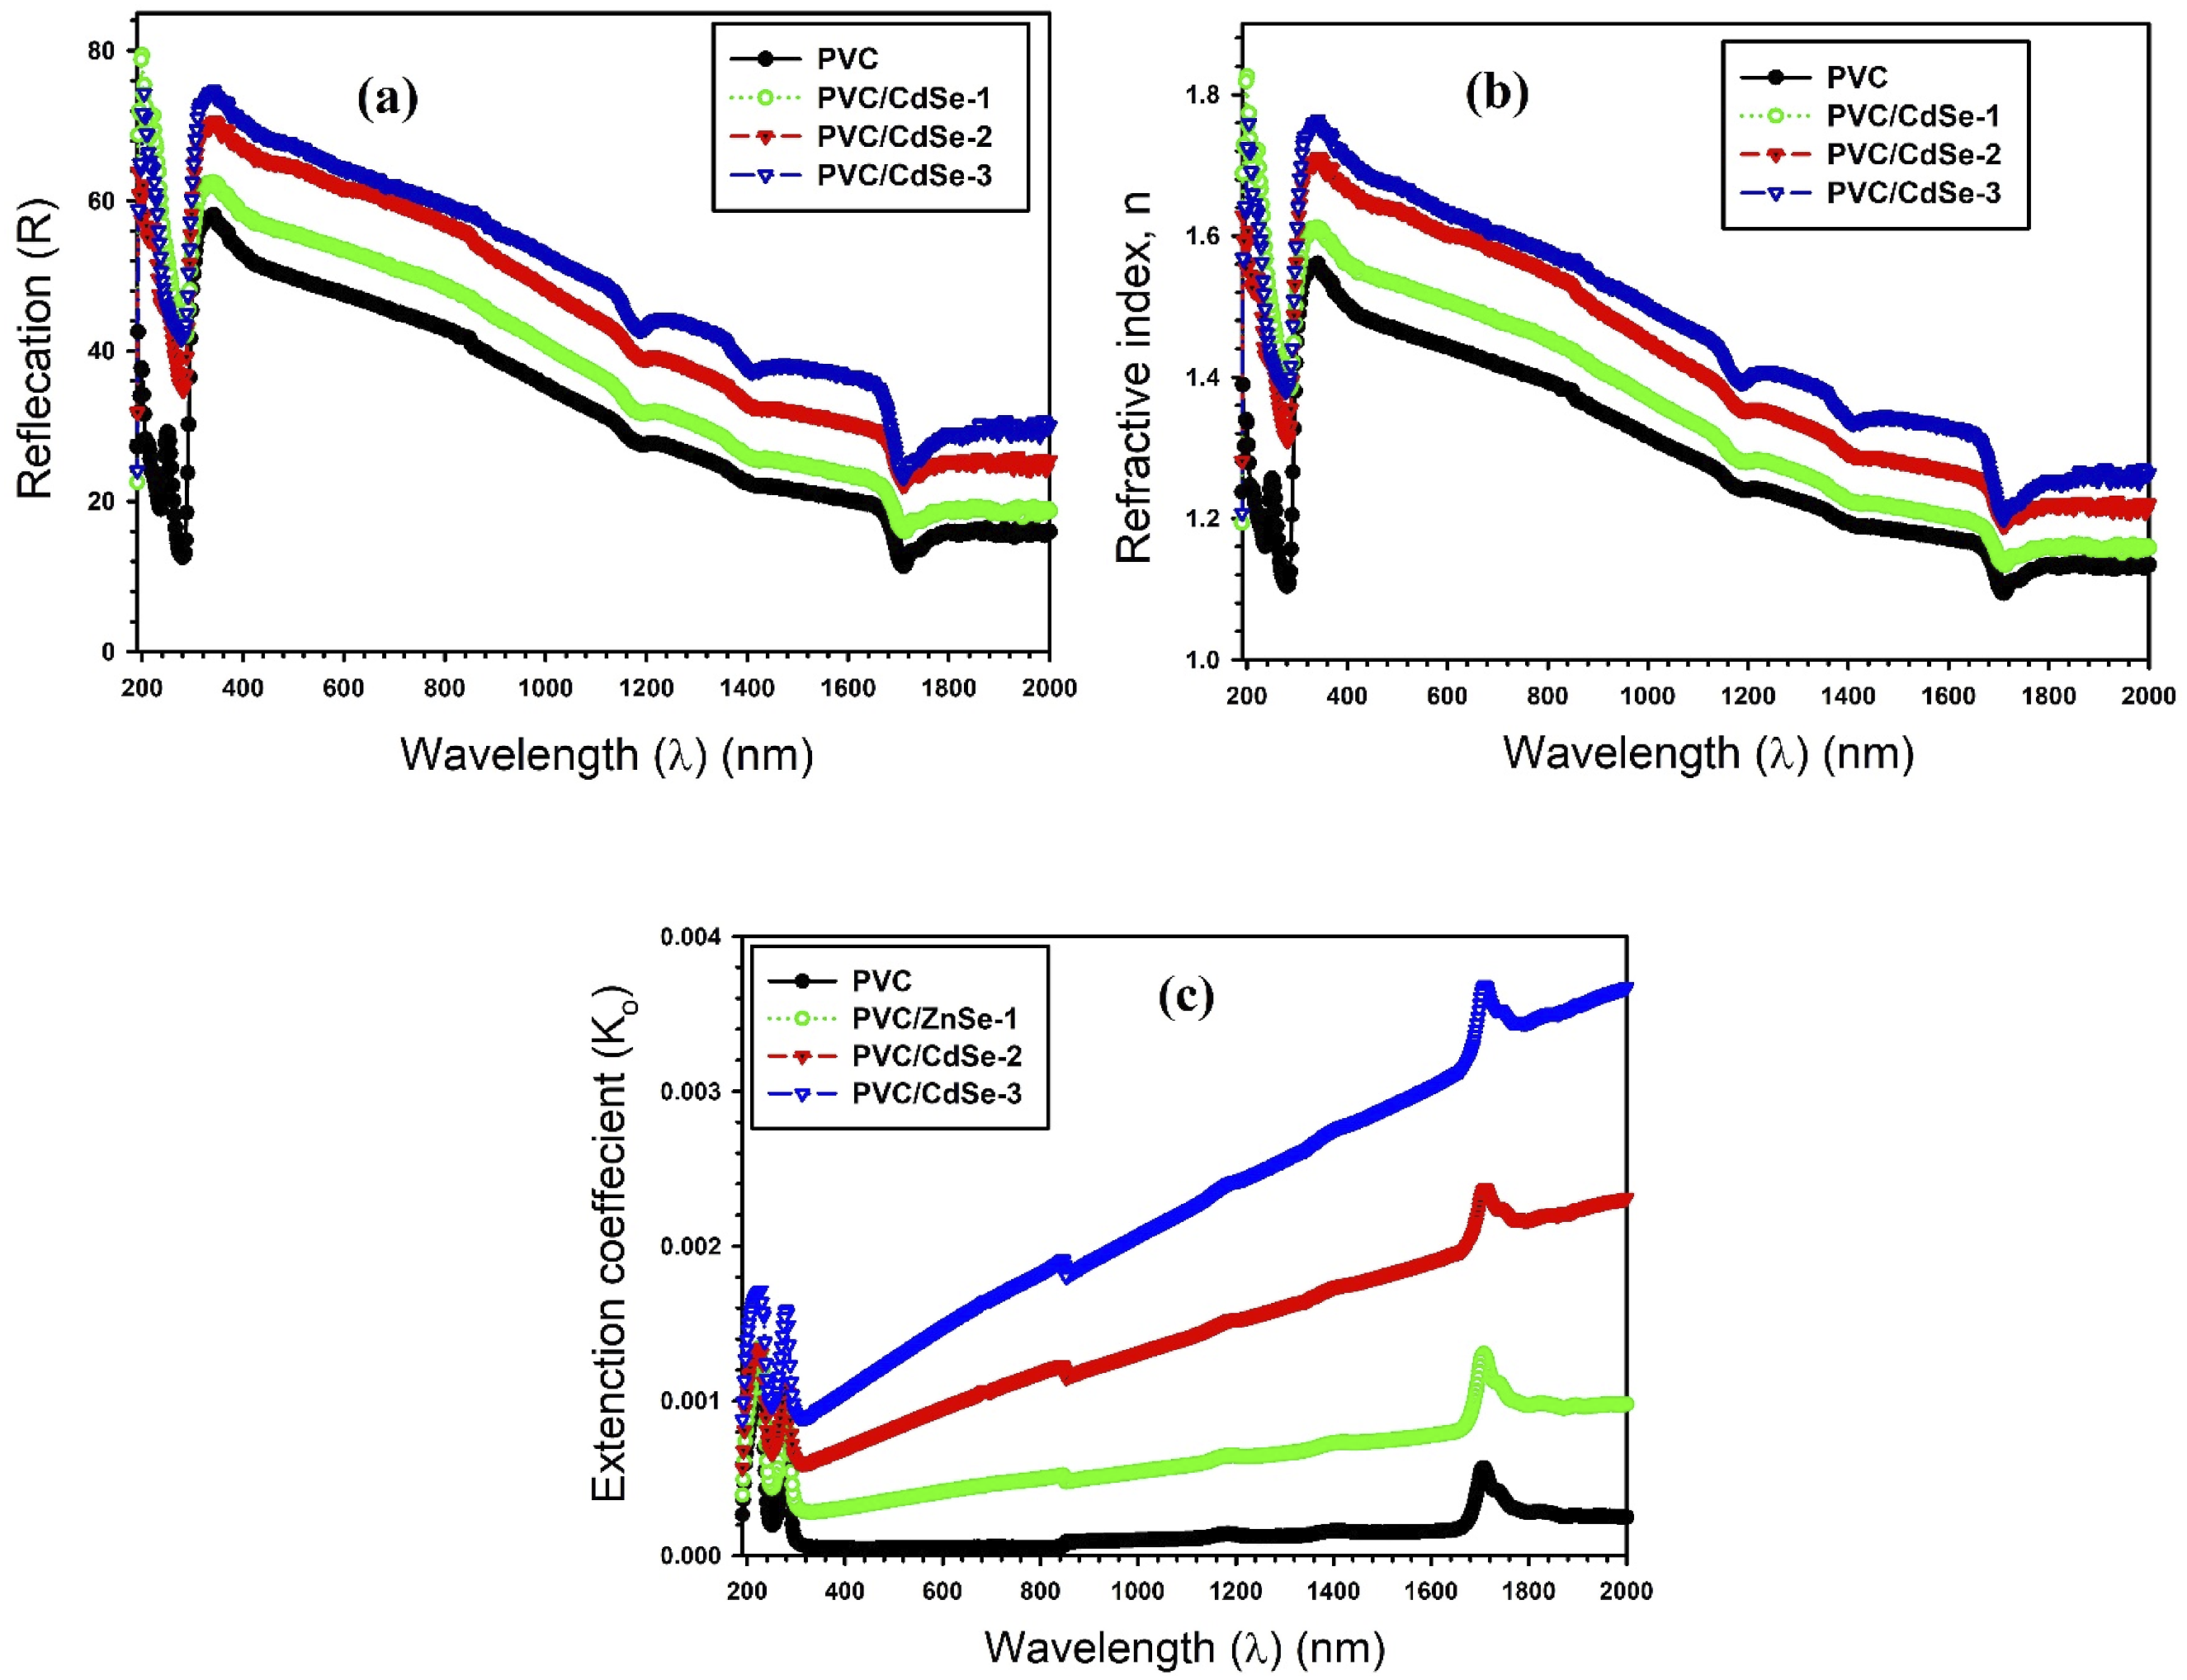
The extinction coefficient for CdSe-loaded PVC films is shown in Figure 9(c) as a function of the incident photon wavelength. The spectral graphs of (k0) appear to be analogous to the absorbance graphs. As the concentration of CdSe NPs grows from 1 to 3 weight percent, the gradual rise in (k0) values is a confirmation of the decline in the number of hydrogen bonds within the PVC chains that is a result of an elevation in the number of defects levels. This reduction is a consequence of the elevated levels of defects. Following this, there is a rise in the quantity of free electrons that are accountable for the absorption of incoming light. 1 The changes in extinction coefficient values, comparable to ours, were observed in doped PVA/CMC/MWCNTs composites as a result of (Zn0.9Ni0.1S) concentrations. 1
The dielectric constant of the polymers is estimated and adjusted to assess their suitability for electrical and optoelectronic applications. Characterizing optical contacts within a polymer matrix necessitates measuring the dielectric constant. The real part (εr), or the first variable of the dielectric constant, is a characteristic that is accountable for the process of dispersion that occurs via the medium. It is a measure of the variation in the speed of incident photons as a result of the polarization state of the molecules in the medium. In contrast, the second term is an imaginary term of the dielectric constant (εi), a parameter that hat is accountable for the loss of electromagnetic wave energy that is impinge upon the medium. This term represents the medium’s resistance to the incident energy.
The refractive index (n) and extinction coefficient (k0) were used for estimating the dielectric constants (εr and εi)58,59:

Figure 10(a) and (b) illustrate the relationship between the wavelength and both εr and εi. It is possible to observe a noticeable decrease in values of εr and εi as the wavelength increases. This behavior is consistent across undoped PCV and CdSe-loaded PVC films. The role of CdSe NPs in the production of additional defect centers through the PVC film is reflected in the progressive rise in εr values during the doping of CdSe. The formation of multiple dispersive centers, which appear as induced localized states, is a consequence of these defect centers, which are accountable for their creation. As a result, the structure of the mixture is altered, which in turn makes the dispersion process more effective. The concentration of CdSe NPs increases in comparison to PVC, resulting in rising in the number of dispersive centers.1,60 Figure 10(b) illustrates that the wavelength increases, resulting in a rise in the εi spectra. This behavior is consistent across undoped PCV and CdSe-loaded PVC. This suggests that the PVC structure is less likely to dissipate higher energy electromagnetic wave. The increase in εi values with adding CdSe NPs is observed, indicating that highly CdSe-loaded PVC films develop into increasingly resistant against the electromagnetic wave energy.
1
Variations of (a) εr and (b) εi spectra versus the wavelength for CdSe-loaded PVC films.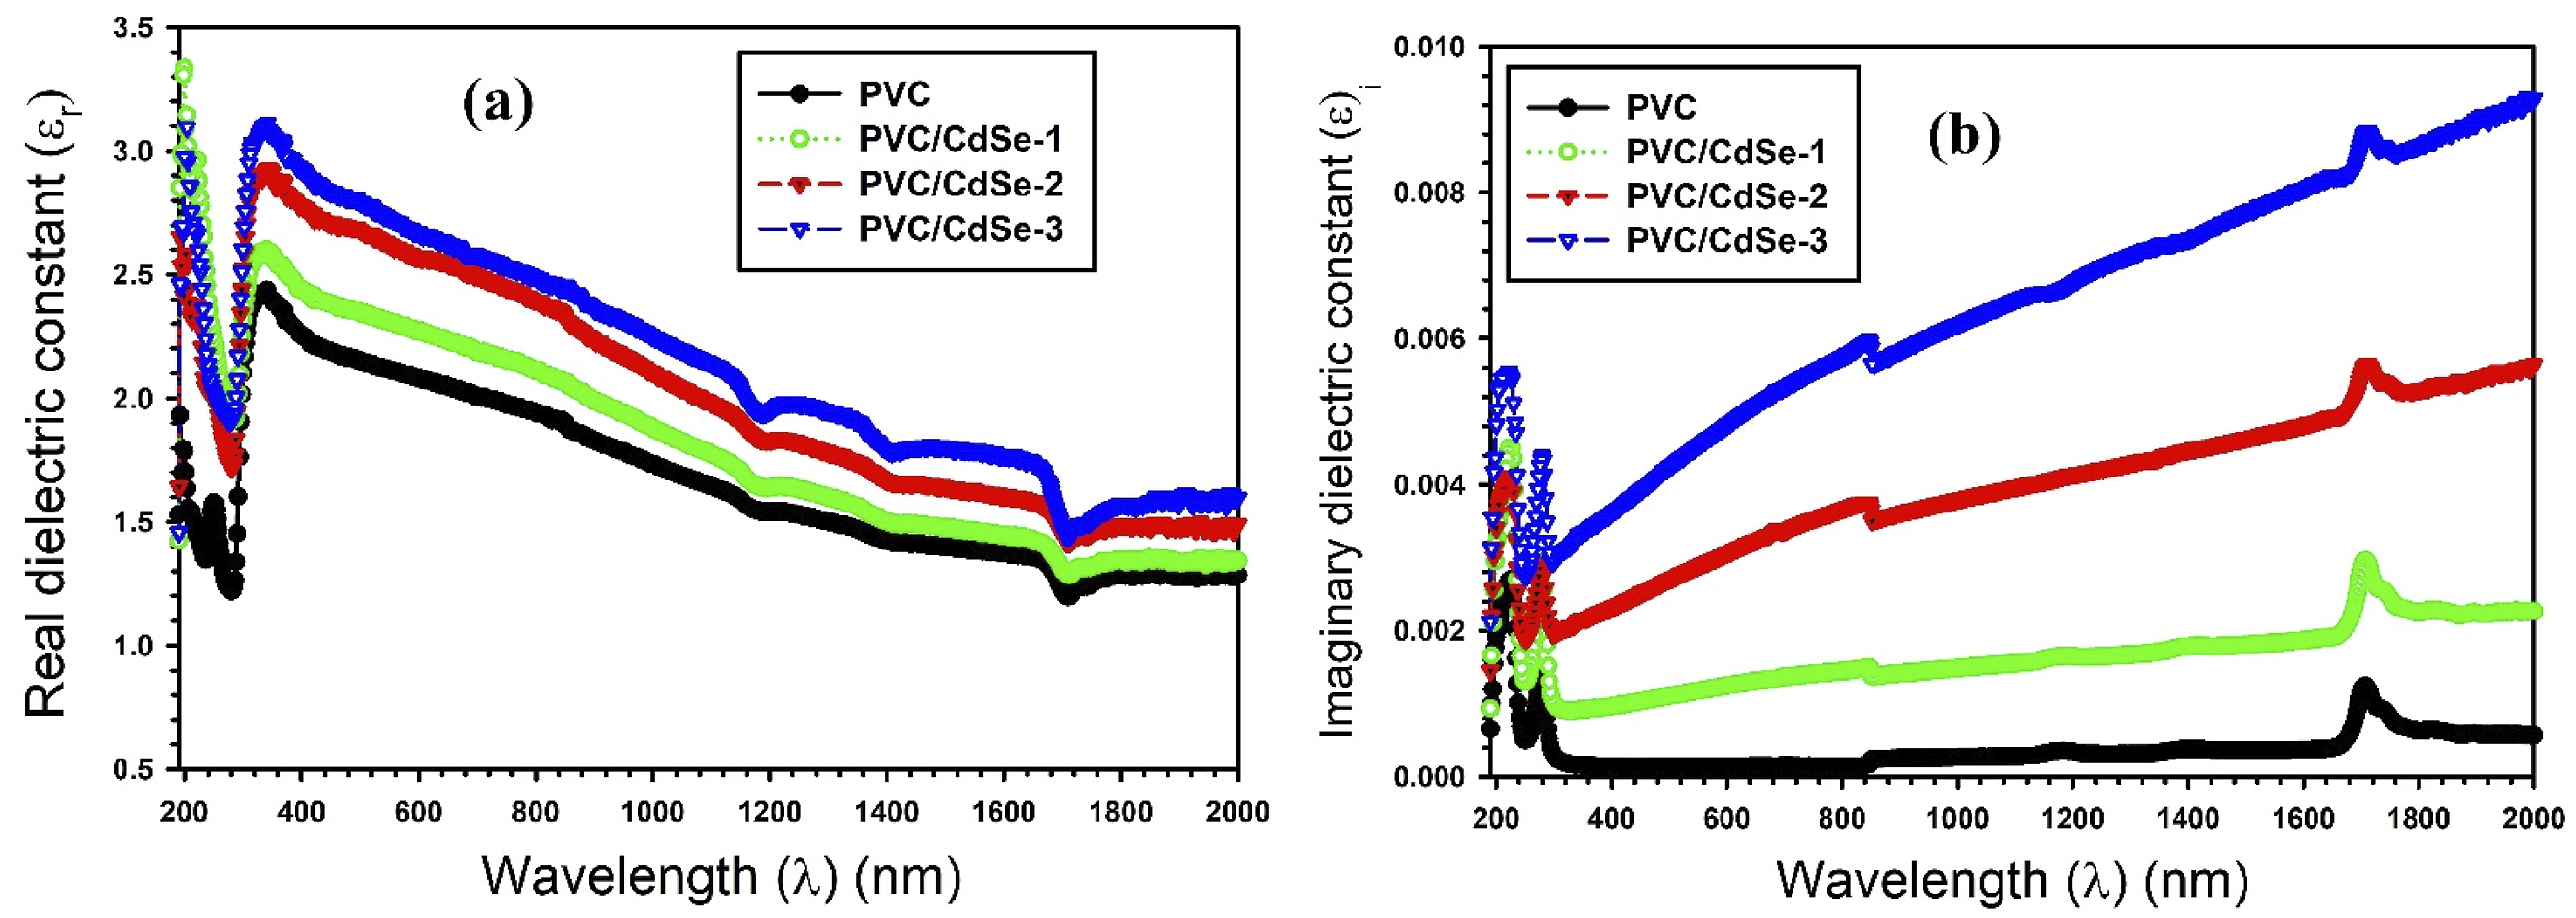
Wemple and DiDomenico’s single oscillator model is capable of analyzing dispersion results below the interband absorption edge. Additionally, the dispersion energy, or Ed, assesses the intensity of interband optical transitions and provides insights into changes in structure throughout solid materials. It is not influenced by the energy gap. For instance, it can be determined by the substance’s coordination number, valence number, and ionic character.
61
The excitation energy required for interband transitions is measured by Eo, which is also known as the effective-oscillator resonance energy or the single-oscillator energy.
1
The Wemple and DiDomenico relation is used to relate the refractive index to the energy dispersion parameters, such as Ed and Eo
62
:
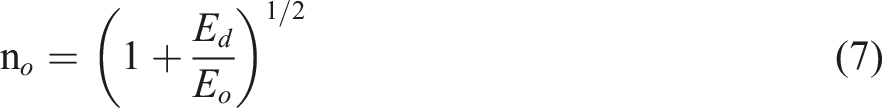
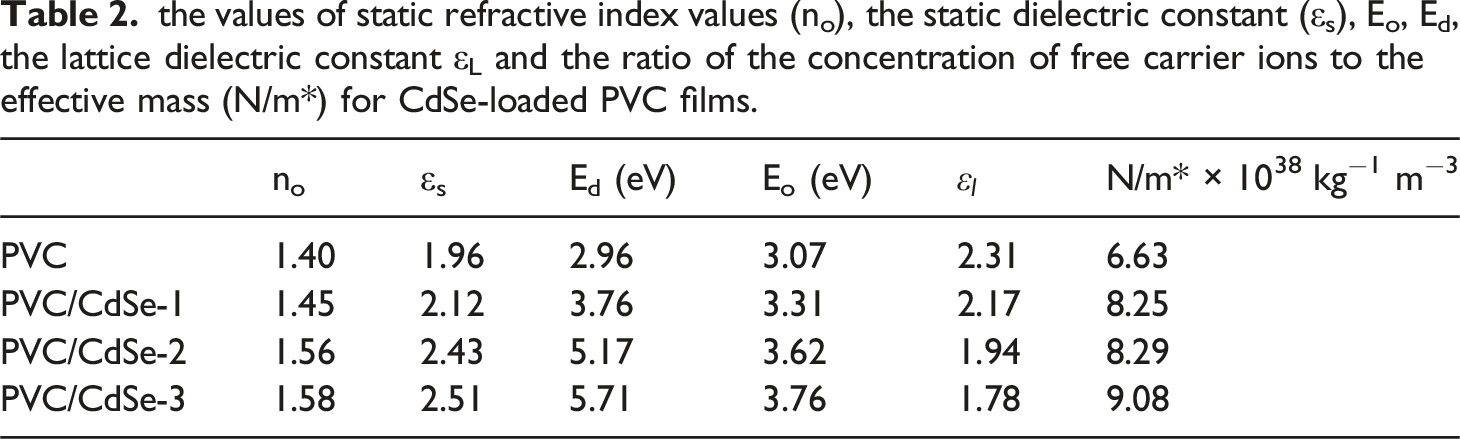
the values of static refractive index values (no), the static dielectric constant (εs), Eo, Ed, the lattice dielectric constant εL and the ratio of the concentration of free carrier ions to the effective mass (N/m*) for CdSe-loaded PVC films.
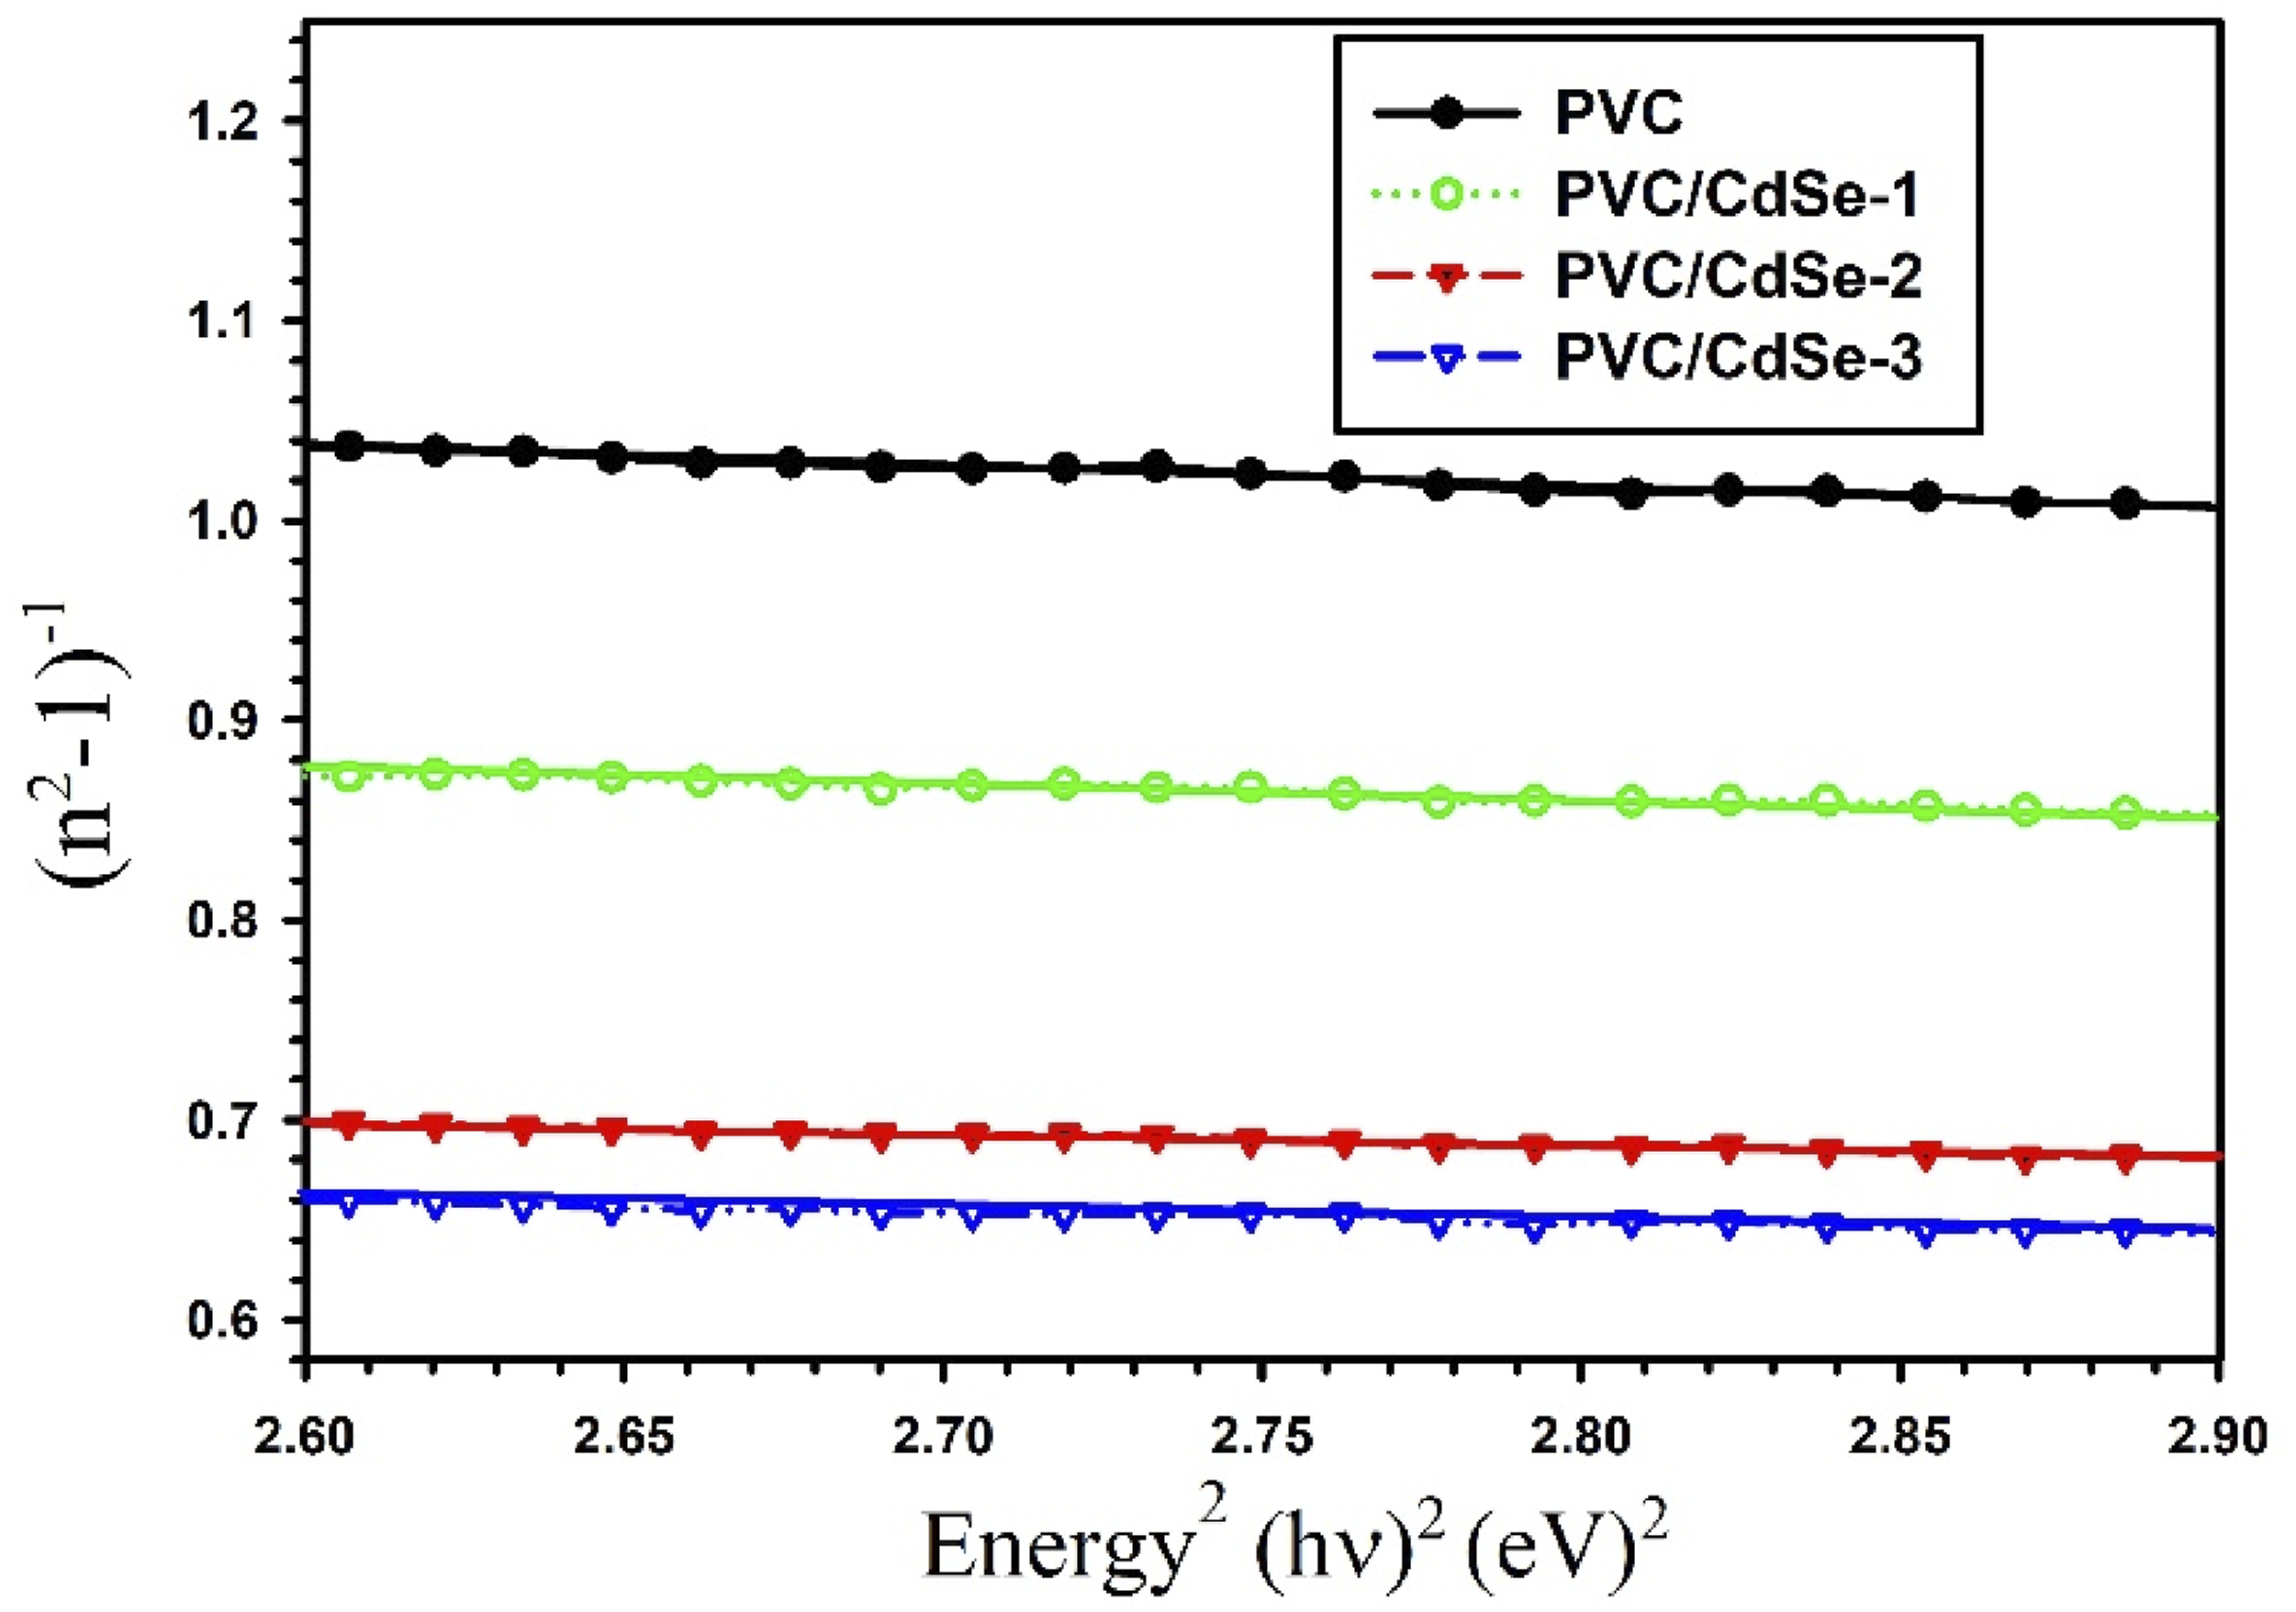
The relationship between (n2 − 1)−1 and (hυ)2 for CdSe-loaded PVC films.
Significant increases in the values of no are seen with increasing ratios of CdSe NPs. A rise from 1.40 for PVC to 1.45 for PVC/CdSe-1, 1.56 for PVC/CdSe-2, and 1.58 for PVC/CdSe-3 films is observed. It is possible to obtain the static dielectric constant by using the static refractive index, which is denoted as εs = no2. 64 According to Table 2, the static dielectric constant rose from 1.96 to 2.51 as the percentage of CdSe NPs grew from 0% to 3%.
The following equation illustrates the relationship between the lattice dielectric constant ɛL, the dielectric constant ɛr, and the linear refractive index n follows
65
:
As shown in Figure 12, the lattice dielectric constant εL and the ratio of the concentration of free carrier ions to the effective mass (N/m*) for CdSe-loaded PVC films may be estimated by calculating the intercept and slope of the linear portion in the plots of εr versus λ2. With an increase in the amount of CdSe NPs present in PVC, the lattice dielectric constant εL decreased from 2.31 to 1.78. For undoped PVC, the N/m* value is 6.63× 1038 kg−1 m−3. However, for PVC/CdSe-1, PVC/CdSe-2, and PVC/CdSe-3 films, the N/m* value rises to 8.25 × 1038, 8.29 × 1038, and 9.08× 1038 kg−1 m−3, respectively (Table 2). The plots of εr versus λ2 for CdSe-loaded PVC films.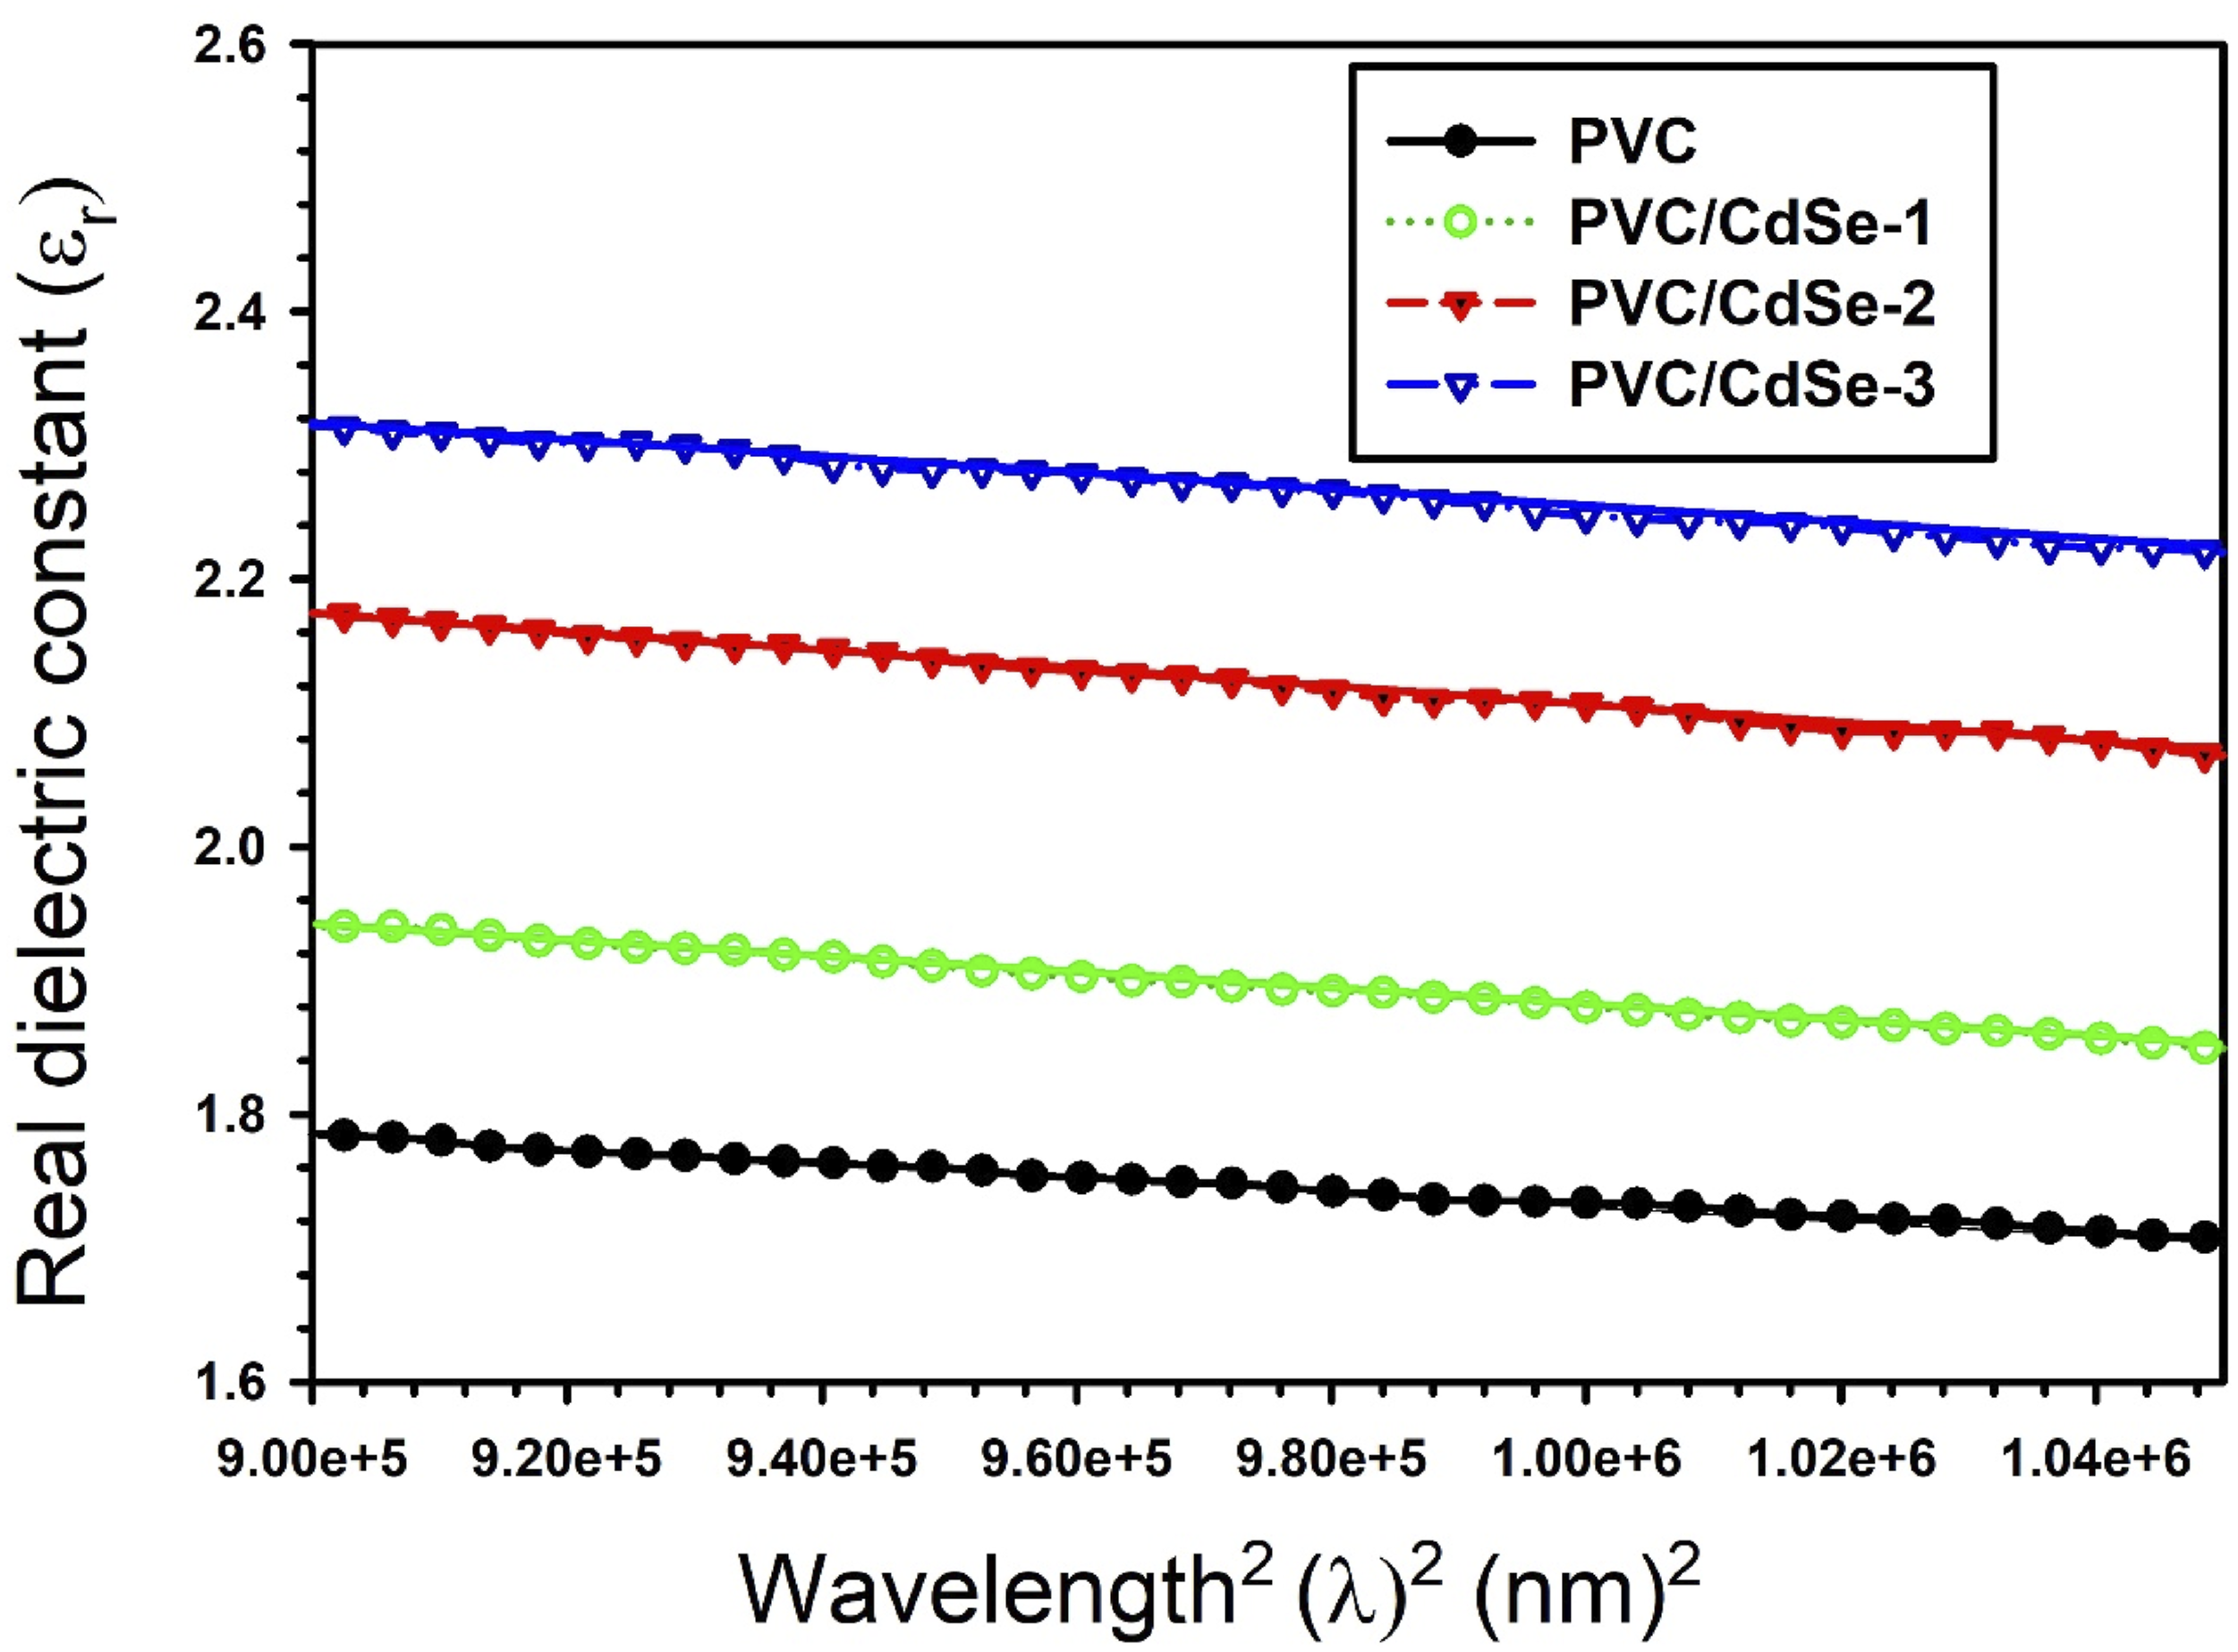
In the single-oscillator model, the following relation may be used to estimate the long wavelength refractive index (n∞), the average dipole oscillator strength (S0), and the average oscillator wavelength (λ0) for both undoped and CdSe-loaded PVC
66
: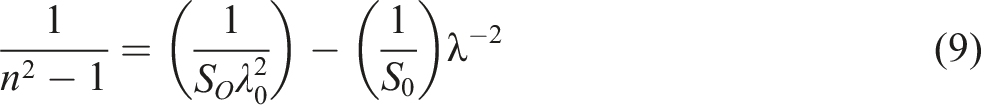

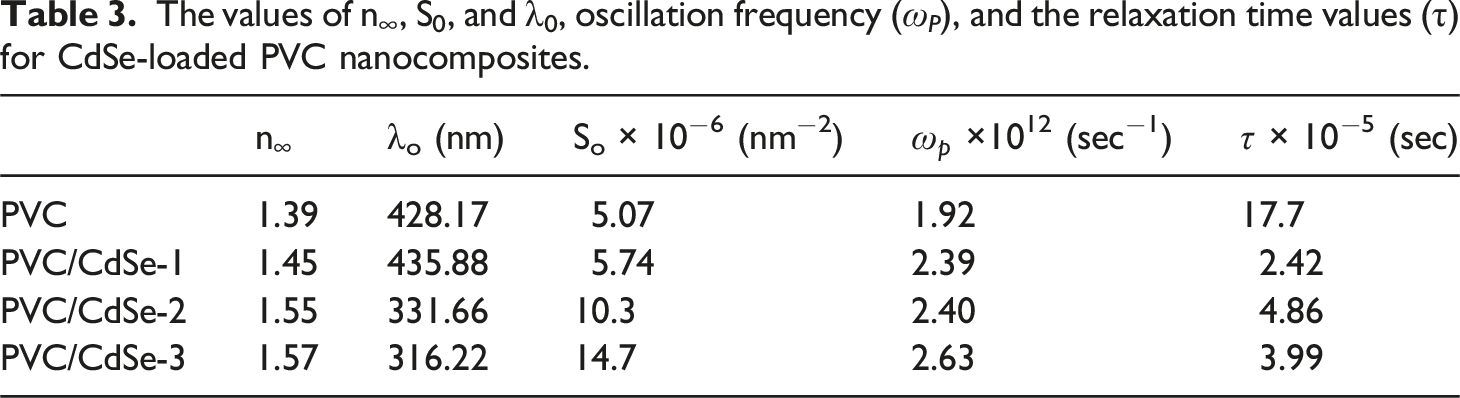
According to the relationship between 1/(n2 − 1) and λ−2, which is shown in Figure 13, it is possible to determine the values of n∞, S0, and λ0. The values of n∞, S0, and λ0 for PVC are 1.39, 5.07 × 10⁻⁶ (nm)−2 and 424.3 nm, respectively, whereas the values for PVC/CdSe-3 film are 1.57, 14.7 × 10⁻⁶ (nm)−2 and 316.22 nm, respectively (Table 3). The induced alterations that occurred within the PVC matrix as a result of the interaction between various concentrations of CdSe NPs and the polymer are confirmed by the variance in n∞, S0, and λ0. The result of this is an increase in the medium density, which is caused by an increase in the number of defects, which in turn results in a changes in the amount of stress relaxation.
1
The relationship between 1/(n2 − 1) and λ−2 for CdSe-loaded PVC nanocomposites. The values of n∞, S0, and λ0, oscillation frequency (ω
P
), and the relaxation time values (τ) for CdSe-loaded PVC nanocomposites.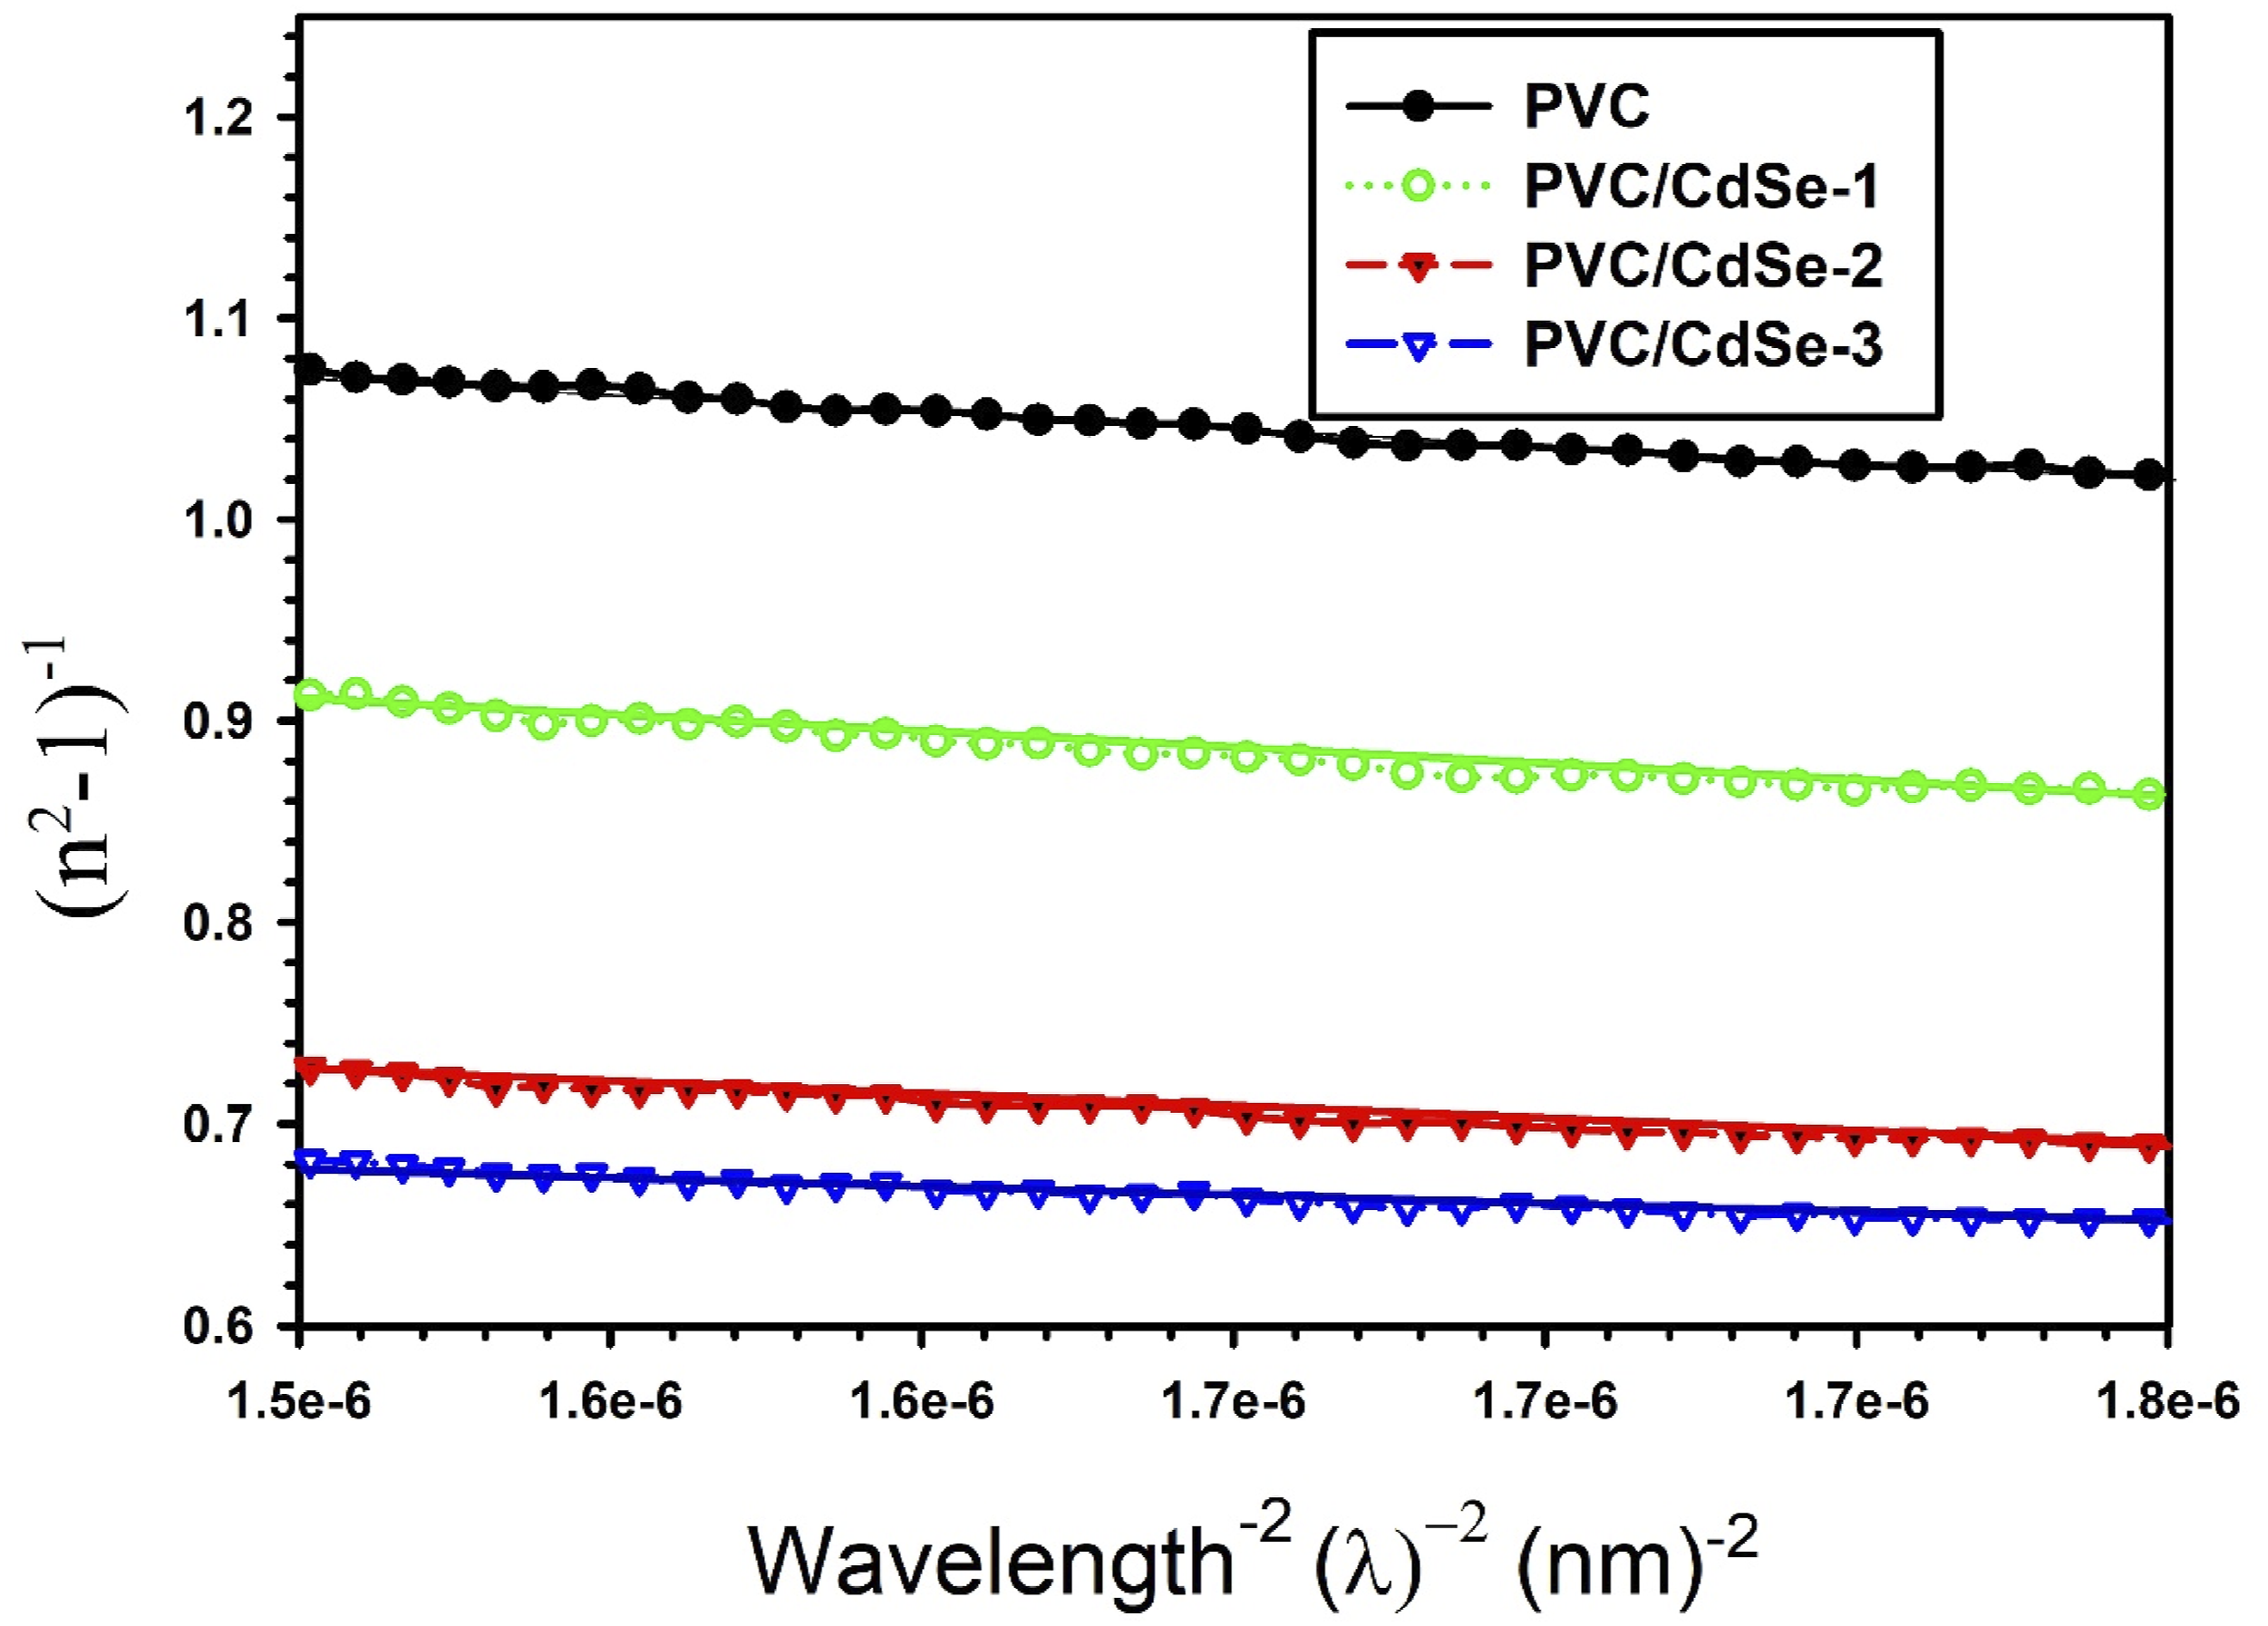
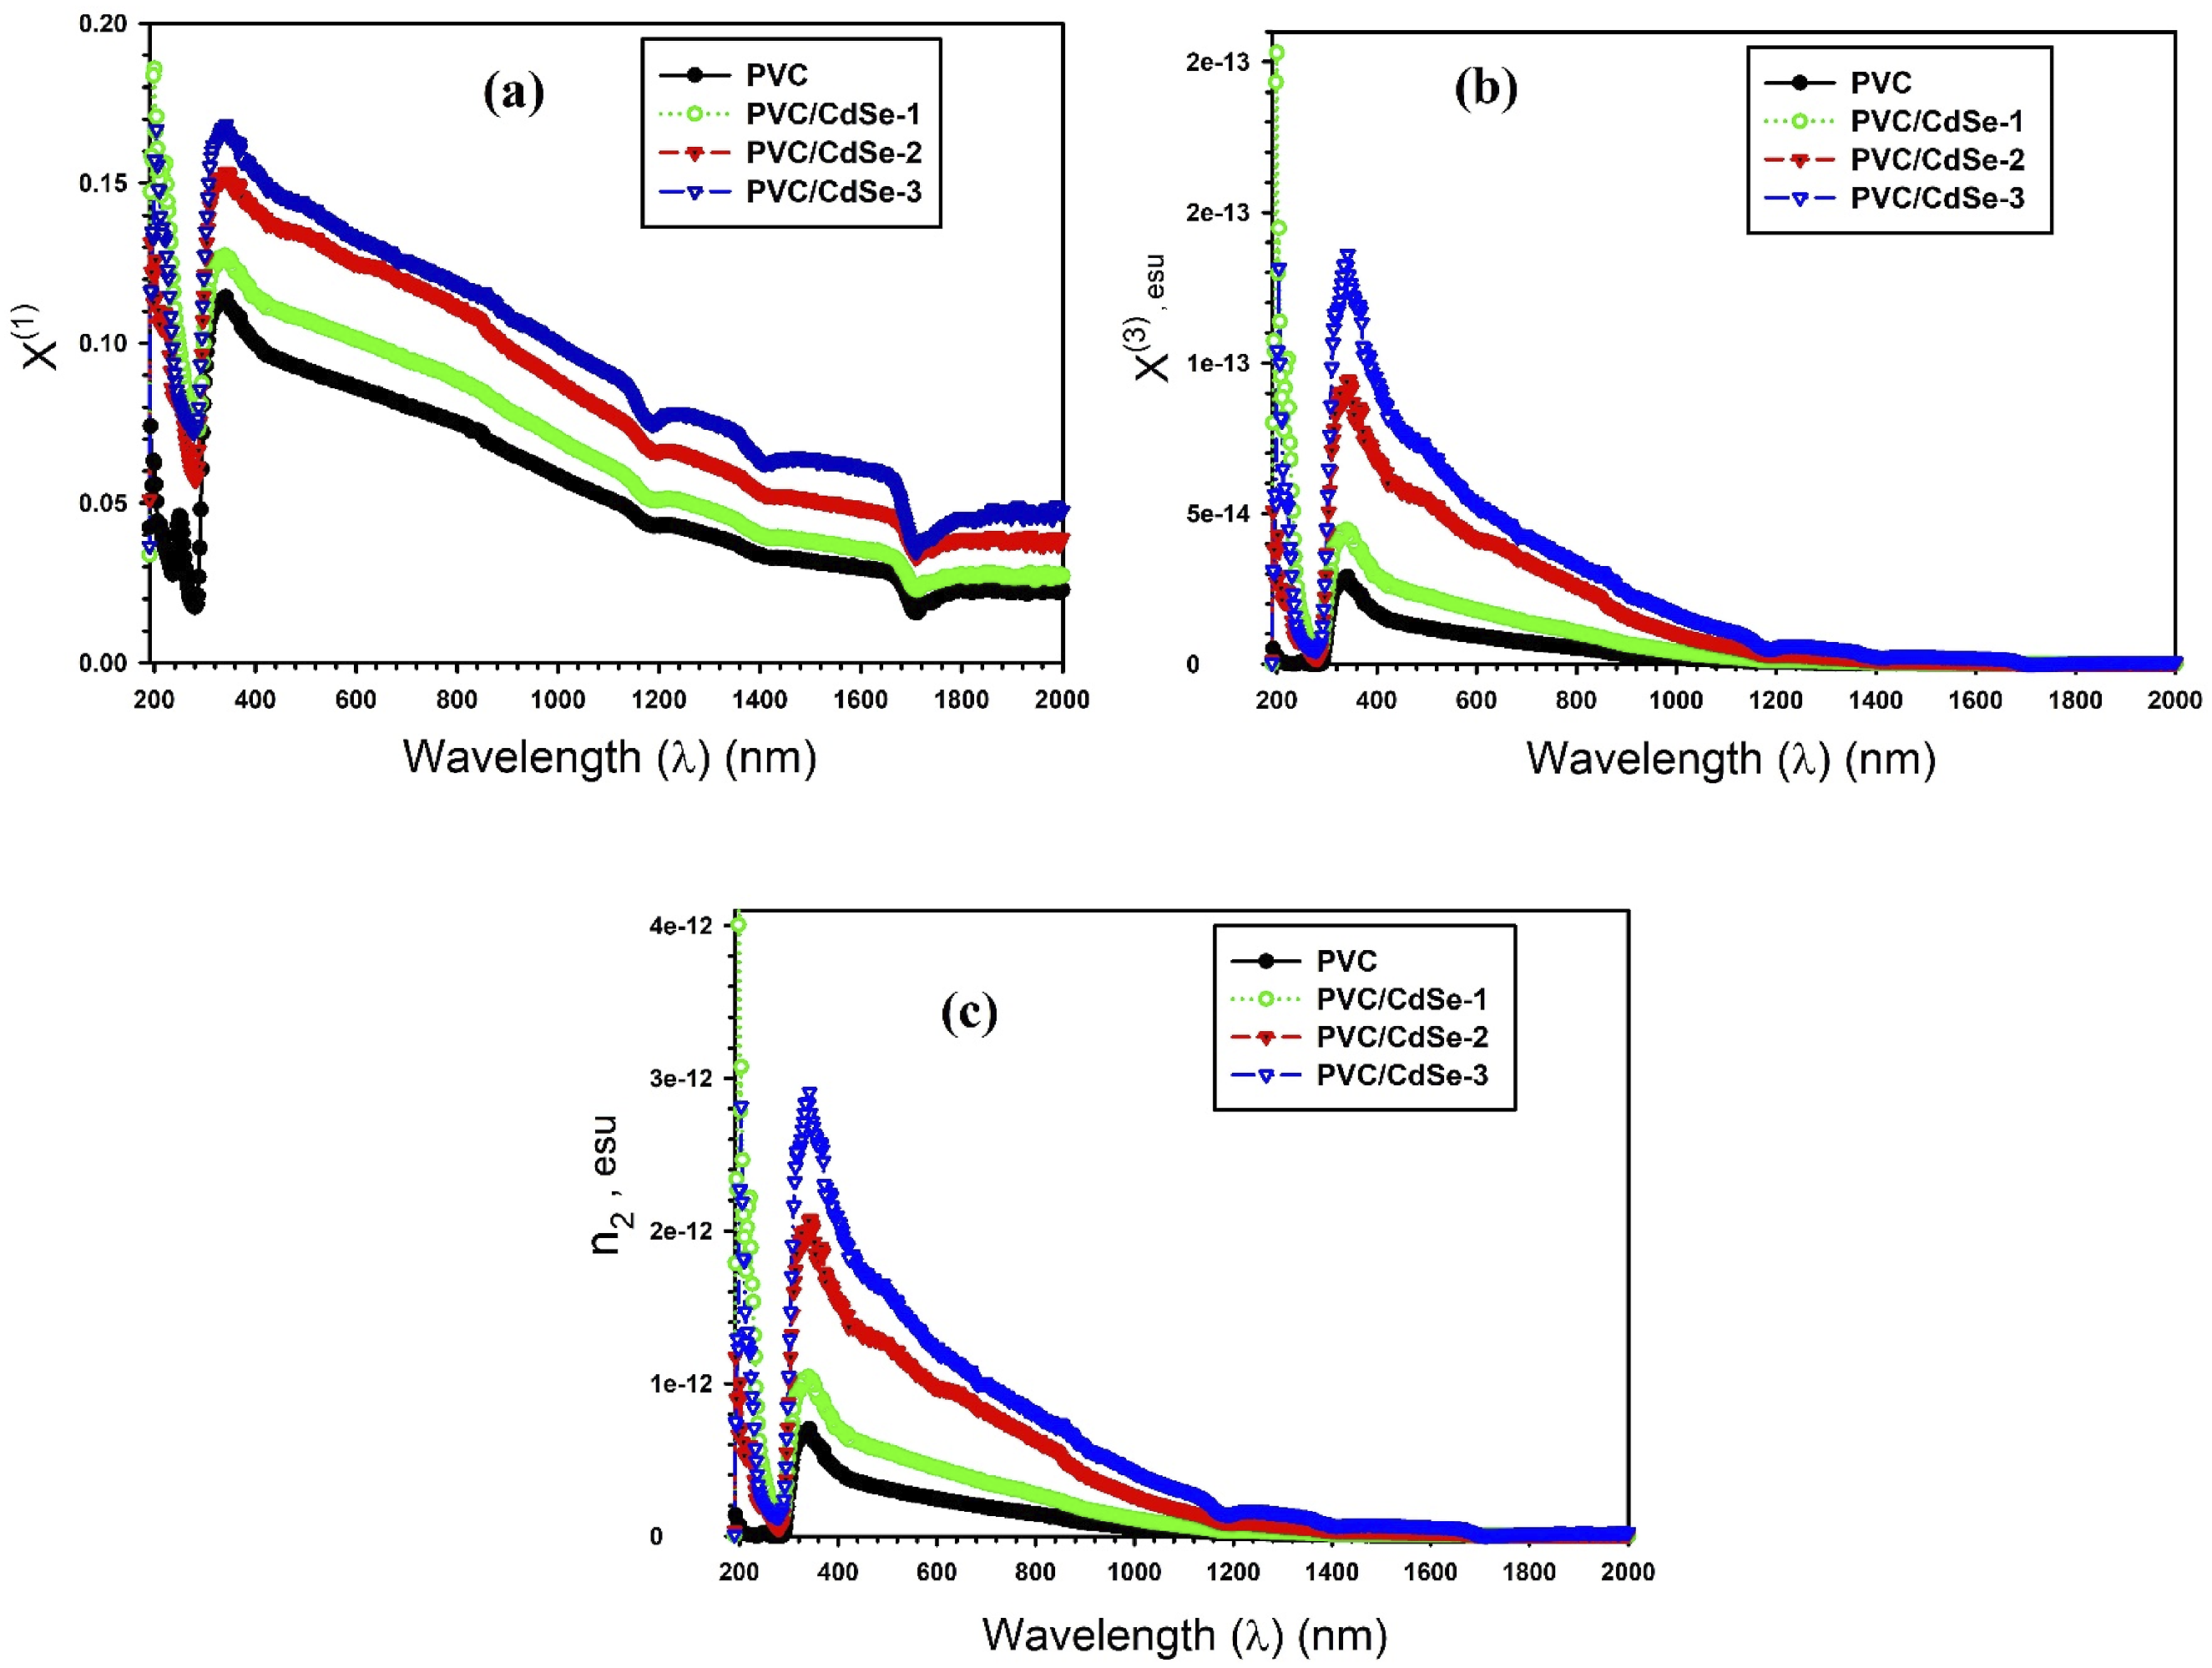
Future prospective applications in nonlinear optoelectronic devices have been examined through investigating the nonlinear characteristics of PVC nanocomposite films doped with CdSe concentrations. Materials that are distinguished by their nonlinearity characteristics are indispensable in optical telecommunications applications, frequency converters, and laser switching. 67
One of the optical parameters that is required for the calculation of the third order nonlinear susceptibility χ(3) is the well-known linear susceptibility χ(1). The nonlinear refractive index (n2) is a critical nonlinear parameter in the designation process of high-power lasers and optoelectronic systems. It is possible to determine the value of χ(1), χ(3), and n2 for PVC-CdSe nanocomposite films in accordance with the following relations68,69: The relationship between the wavelength λ and the optical parameters χ(1), χ(3), and n2 for PVC-CdSe nanocomposite films.


A correlation between the oscillation frequency (ω
P
) and the real component of the dielectric constant (εr) is established for PVC-CdSe nanocomposite films using the next formula72,73: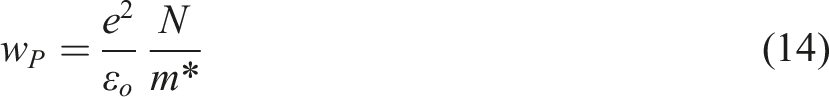
After the CdSe -NPs were introduced, a rise in ω P was seen (Table 3). The ω P values increased from 1.92 × 10¹² to 2.63 × 10¹² sec−1 with increasing the CdSe NPs.
In the Drude model, the next relationship may be used to get the imaginary component of the dielectric constant (εi)
74
:
Consequently, the relaxation time values (τ) of PVC-CdSe nanocomposite films are determined by examining the relationship between εi and λ3 for PVC-CdSe nanocomposite films, as illustrated in Figure 15. The relaxation time is observed to drop following the addition of CdSe-NPs (Table 3). A similar data was detected by A. Atta et al.,
73
after adding NiO to PPy films. The relationship between εi and λ3 for PVC-CdSe nanocomposite films.
Additionally, the optical response can be used to ascertain variations in the optical conductivity (σopt) and electrical conductivity (σelec) spectra, and the Lorentz–Drude model can be used for estimating the electronic states within the band gap of the thin coatings, as shown in Eqs.59,71,75–77:

The symbol “c” represents the velocity of light in a vacuum.
Representing the velocity of light in a vacuum, the symbol “c” is used.
The correlation between σopt and σelec versus λ for PVC-CdSe nanocomposite films is illustrated in Figure 16(a) and (b). The concentration of CdSe increased, resulting in an increase in σopt and σelec. The outcome is due to the reduction of the bandgap for PVC-CdSe nanocomposite films by adding CdSe NPs, which enhances conductivity by allowing electrons to rapidly transit from the valence band to the conduction band.
78
The σopt and σelec reached 2.3 × 10¹² s/cm2 and 2.9 × 10¹⁵ s/cm2 for PVC/CdSe-3 nanocomposite film, respectively. The correlation between σopt and σelec versus λ for PVC-CdSe nanocomposite films.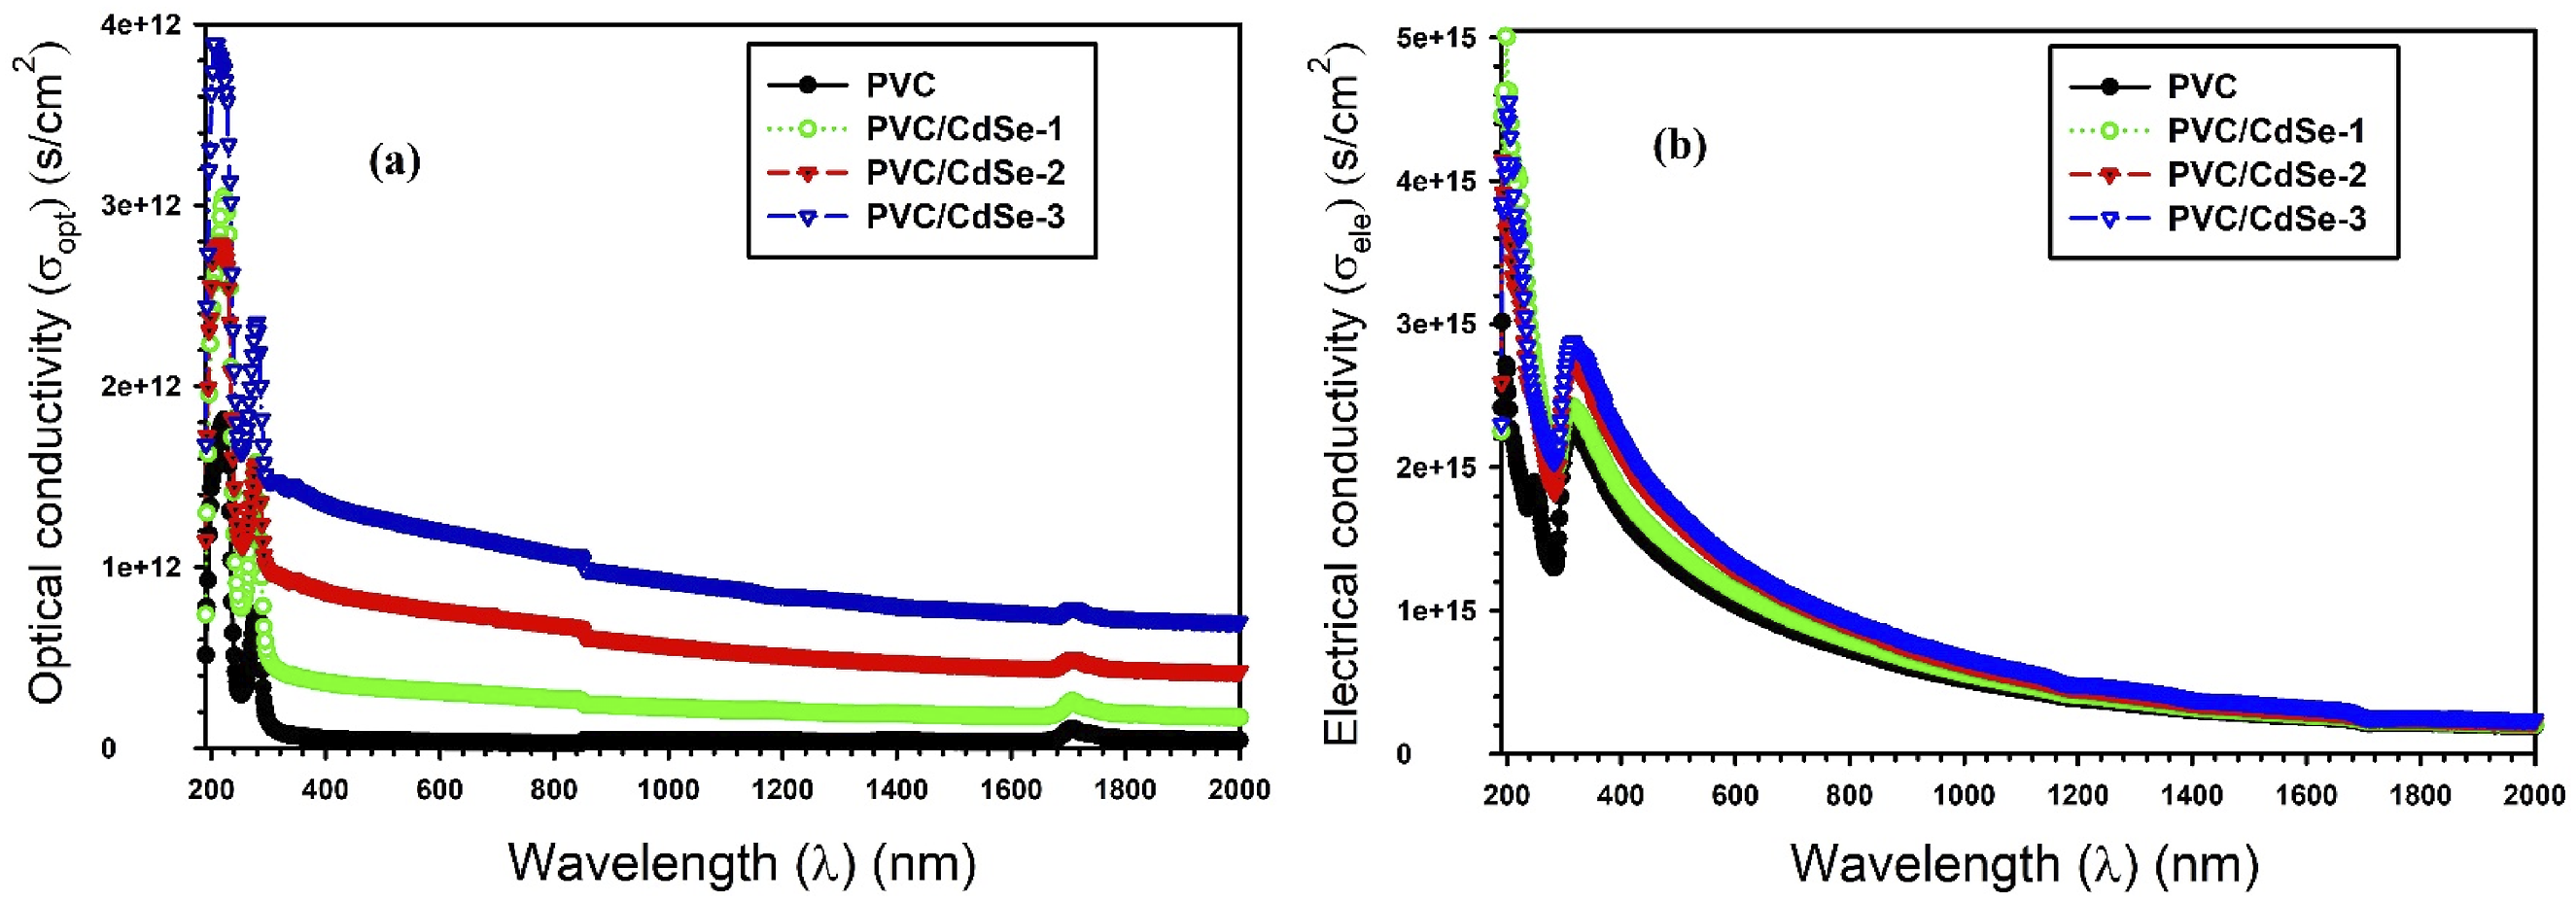
Conclusions
In this study, the impact of varying weight percentages of CdSe NPs (0, 1, 2, and 3 wt.%) on the structure, linear/nonlinear optical, and optoelectronic properties of PVC/CdSe nanocomposite films was investigated. XRD, SEM, EDX, and Raman analyses were used to characterize CdSe NPs and PVC/CdSe nanocomposite films. The optical band gap and band tail were determined as a function of CdSe NPs concentrations. The relationship between the wavelength and both εr and εi was illustrated. The N/m* value is 6.63 × 1038 kg−1 m−3. However, for PVC/CdSe-1, PVC/CdSe-2, and PVC/CdSe-3 films, the N/m* value rises to 8.25 × 1038, 8.29 × 1038, and 9.08 × 1038 kg−1 m−3, respectively. The nonlinear optical properties of PVC/CdSe nanocomposites were studied. The linear and nonlinear optical results showed that PVC/CdSe films are suitable candidate materials for optoelectronic devices.
Footnotes
Declaration of conflicting interests
The authors declared no potential conflicts of interest with respect to the research, authorship, and/or publication of this article.
Funding
The authors disclosed receipt of the following financial support for the research, authorship, and/or publication of this article: The authors extend their appreciation to the Deanship of Scientific Research at Northern Border University, Arar, KSA for funding this research work through the project number “NBU-FFR-2025-1072-05”.
Data Availability Statement
All data generated or analyzed during this study are included in this published article.