
Abstract
Infrared heating is one of the most prevalent heat sources utilized in automated fiber placement (AFP), particularly in the context of thermoset composites and the preheating of thermoplastic composites. Traditional infrared heaters often struggle to achieve concentrated heating in these applications. This paper employs a line-focused infrared heater (LIRH) in AFP. A dynamic finite element model was developed using ANSYS to investigate heat transfer during the layup process, and the interrelationship between temperature, laying speed, and LIRH power. The impact of tooling temperature on the cooling rate during layup was also analyzed, and an online measurement system for the temperature field was established. AFP is experimentally performed to analyze the heating performance of the LIRH to determine its relevant parameters. The results of both experiments and simulations indicate the prepreg bundle can achieve temperatures exceeding 400°C at a laying speed of 30 mm/s, with an infrared power setting of 1400 W and a tooling temperature of 50°C. The heat primarily emanates from the focused area of the LIRH, although a minor heating effect is observed from the unfocused infrared light. This research demonstrates the feasibility of employing LIRH for automated placement, particularly from the standpoint of temperature field.
Introduction
Fiber-reinforced resin matrix composites have excellent properties such as high-temperature stability, chemical resistance, fatigue endurance, and high specific strength and stiffness, which make them ideal materials for aerospace structural components.1–6 Carbon fiber-reinforced structures have been found to have excellent thermodynamic properties and a role in lightweighting in aircraft structural applications.7–9 However, the manufacture of fiber-reinforced plastic-formed components is usually complex, and suitable processing techniques are required to ensure good product performance. In recent years, considerable research has been devoted to developing promising automated manufacturing techniques for thermoplastic composites, such as fiber winding and AFP. 10
Currently, AFP for thermoset composites has been successfully commercialized, but AFP for thermoplastic composites still needs to be sufficiently mature. According to the resin matrix material, fiber-reinforced resin matrix composites are classified as thermoset and thermoplastic composites. Due to the long curing cycle, thermoset composite components can only be manufactured with autoclave curing technology, leading to an increase in manufacturing costs and being limited by the size of the components and the processing site. These shortcomings have limited the application of thermoset composites. Compared with thermoset resins, the molecular chain of thermoplastic resins does not contain any groups that can be chemically reacted within the chains but rather undergo a physical change process of softening by heating and hardening by cooling, which results in a shorter forming cycle and higher production efficiency of thermoplastic composites. 11
When used with thermoplastic prepregs, the in situ consolidation is achieved by melting the prepregs and applying pressure. The primary sources of heat commonly used for AFP are hot gas torches,12–15 infrared,16–19 lasers,20–26 and so forth. Compared with other heat sources, the energy utilization rate of hot gas torches is low, and the heat loss is severe. 27 Laser heat sources have high energy utilization and density but are physically large, require high cost, and must be placed in a sealed environment. IR lamps are relatively inexpensive and easy to control, allowing the melt zone temperature to be carefully regulated. When used for carbon-based materials, they are a very efficient heat source because the energy is almost completely absorbed. 28 Conventional infrared heaters do not provide concentrated energy, leading to heating unwanted materials and areas. 1 In contrast, LIRH can concentrate energy in a single line and increase the energy density several times. Therefore, focused infrared heaters have the potential to become one of the primary heaters for AFP of thermoplastic composites.
For hot gas torches in AFP, the heat load is applied in the form of forced convection. Kim et al. 29 developed a finite element code for heat transfer simulation during the layup of nitrogen torch-heated thermoplastic composite tapes, in agreement with experimental data. Cao et al. 12 developed a mathematical heat transfer model during the automated placement of thermoplastic composites and explored the effect of hot gas torch process parameters on the temperature field. Li et al. 14 established a dynamic finite element model of the transient temperature field and compared it with a transient heat transfer model. They explore the temperature field of thermoplastic composite based on the hot gas torches. For laser in AFP, Suemasu 30 proposed a thermal history analysis method for evaluating the thermal history of thermoplastic composites during in situ consolidation by an automated layup technique. Kollmansberger 31 was mainly concerned with modeling the heat transfer into the composite with a laser heat source, the thermal properties of the tape, and the resulting heat distribution in the tooling and compaction roller. Francesco 23 explored laser heater power control for multi-material, variable speed. In addition, Danezis et al. 32 established a two-dimensional heat transfer model, which is capable of analyzing the temperature field variations in the time scale of short, high-energy pulses. Although laser and flashlamp heating provide high laying efficiency, their cost is hard to estimate. Lower deposition rates can enable out-of-autoclave manufacturing of medium-sized composite structures for other markets. Therefore, the infrared heater in the middle of the laser and hot air gun is a better choice.
For infrared heaters in AFP, Zhao et al. 4 established a finite element temperature field model for tooling heating, infrared lamp preheating, and hot air torch heating in the automated layup process. They carried out automated layup experiments to determine the heating performance of the infrared lamp and hot air torch. Wang et al. 18 presented a heater structure-based heating strategy to achieve constant temperature control in a variable speed layup process for thermoset composites. P. Hörmann et al. 19 investigated the effect of the radiation distribution of infrared heaters on neighboring paths. The above authors mainly apply infrared heaters to the heating of thermoset composites and the preheating of thermoplastic composites. Venkatesan is one of the few authors to have applied infrared heaters as primary heaters for the automated layup of thermoplastic composites. However, in his study,33,34 the thermoplastic composite material CF/PA6 with a melting point of 220°C was selected, and at 40% IR power (100W), it was optimized for a laying speed of just 5.94 mm/s.
From this, more scholars determine the boundary conditions based on the heating method and environment, and most of the heat sources for temperature field analysis come from lasers and hot gas torches. In contrast, most infrared heating temperature field analysis is used in the automated placement process of thermoset composites or preheating of thermoplastic composites. Analysis of the temperature field of the LIRH in the automated placement of CF/PEEK has not been reported in the literature. The temperature field in AFP needs further study based on this heating method.
This paper focuses on the temperature field analysis during the automated layup for carbon fiber-reinforced thermoplastic composites based on the heating method of the LIRH. The fundamental principles of LIRH are presented. The temperature field heat transfer model is developed, and boundary conditions are determined using CF/PEEK as the research object. A two-dimensional transient thermal model of the temperature field is established to analyze the heating and cooling effects of line-focused infrared heating at different tooling temperatures, the temperature gradient between the layers, and the peak temperature at different process parameters. The heating performance of the LIRH is evaluated by experimentally measuring the temperature field. The feasibility of the LIRH for automated placement processes in thermoplastic composites is analyzed.
Thermal model of thermoplastic fiber placement based on LIRH
Radiation theory of infrared lamps
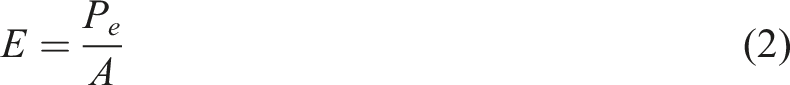
LIRH is the primary heat source in AFP. LIRH means that the near-infrared light emitted from the halogen lamp is focused on the line through specially designed elliptical mirrors with special gold plating for extremely high reflective efficiency. The principle of the LIRH is shown in Figure 1. Compared with the traditional infrared heater, the focused infrared heater can achieve a better heating effect in a short time, which is suitable for the heating of thermoplastic composites in an automated layup. Due to the focused light, the heating area becomes smaller, and the exchange of heat is high. So, LIRH has a higher heat flux. Assuming that all objects are gray bodies, the intensity of radiation from an infrared lamp filament can be obtained according to Stephen Boltzmann’s law: Schematic diagram of LIRH.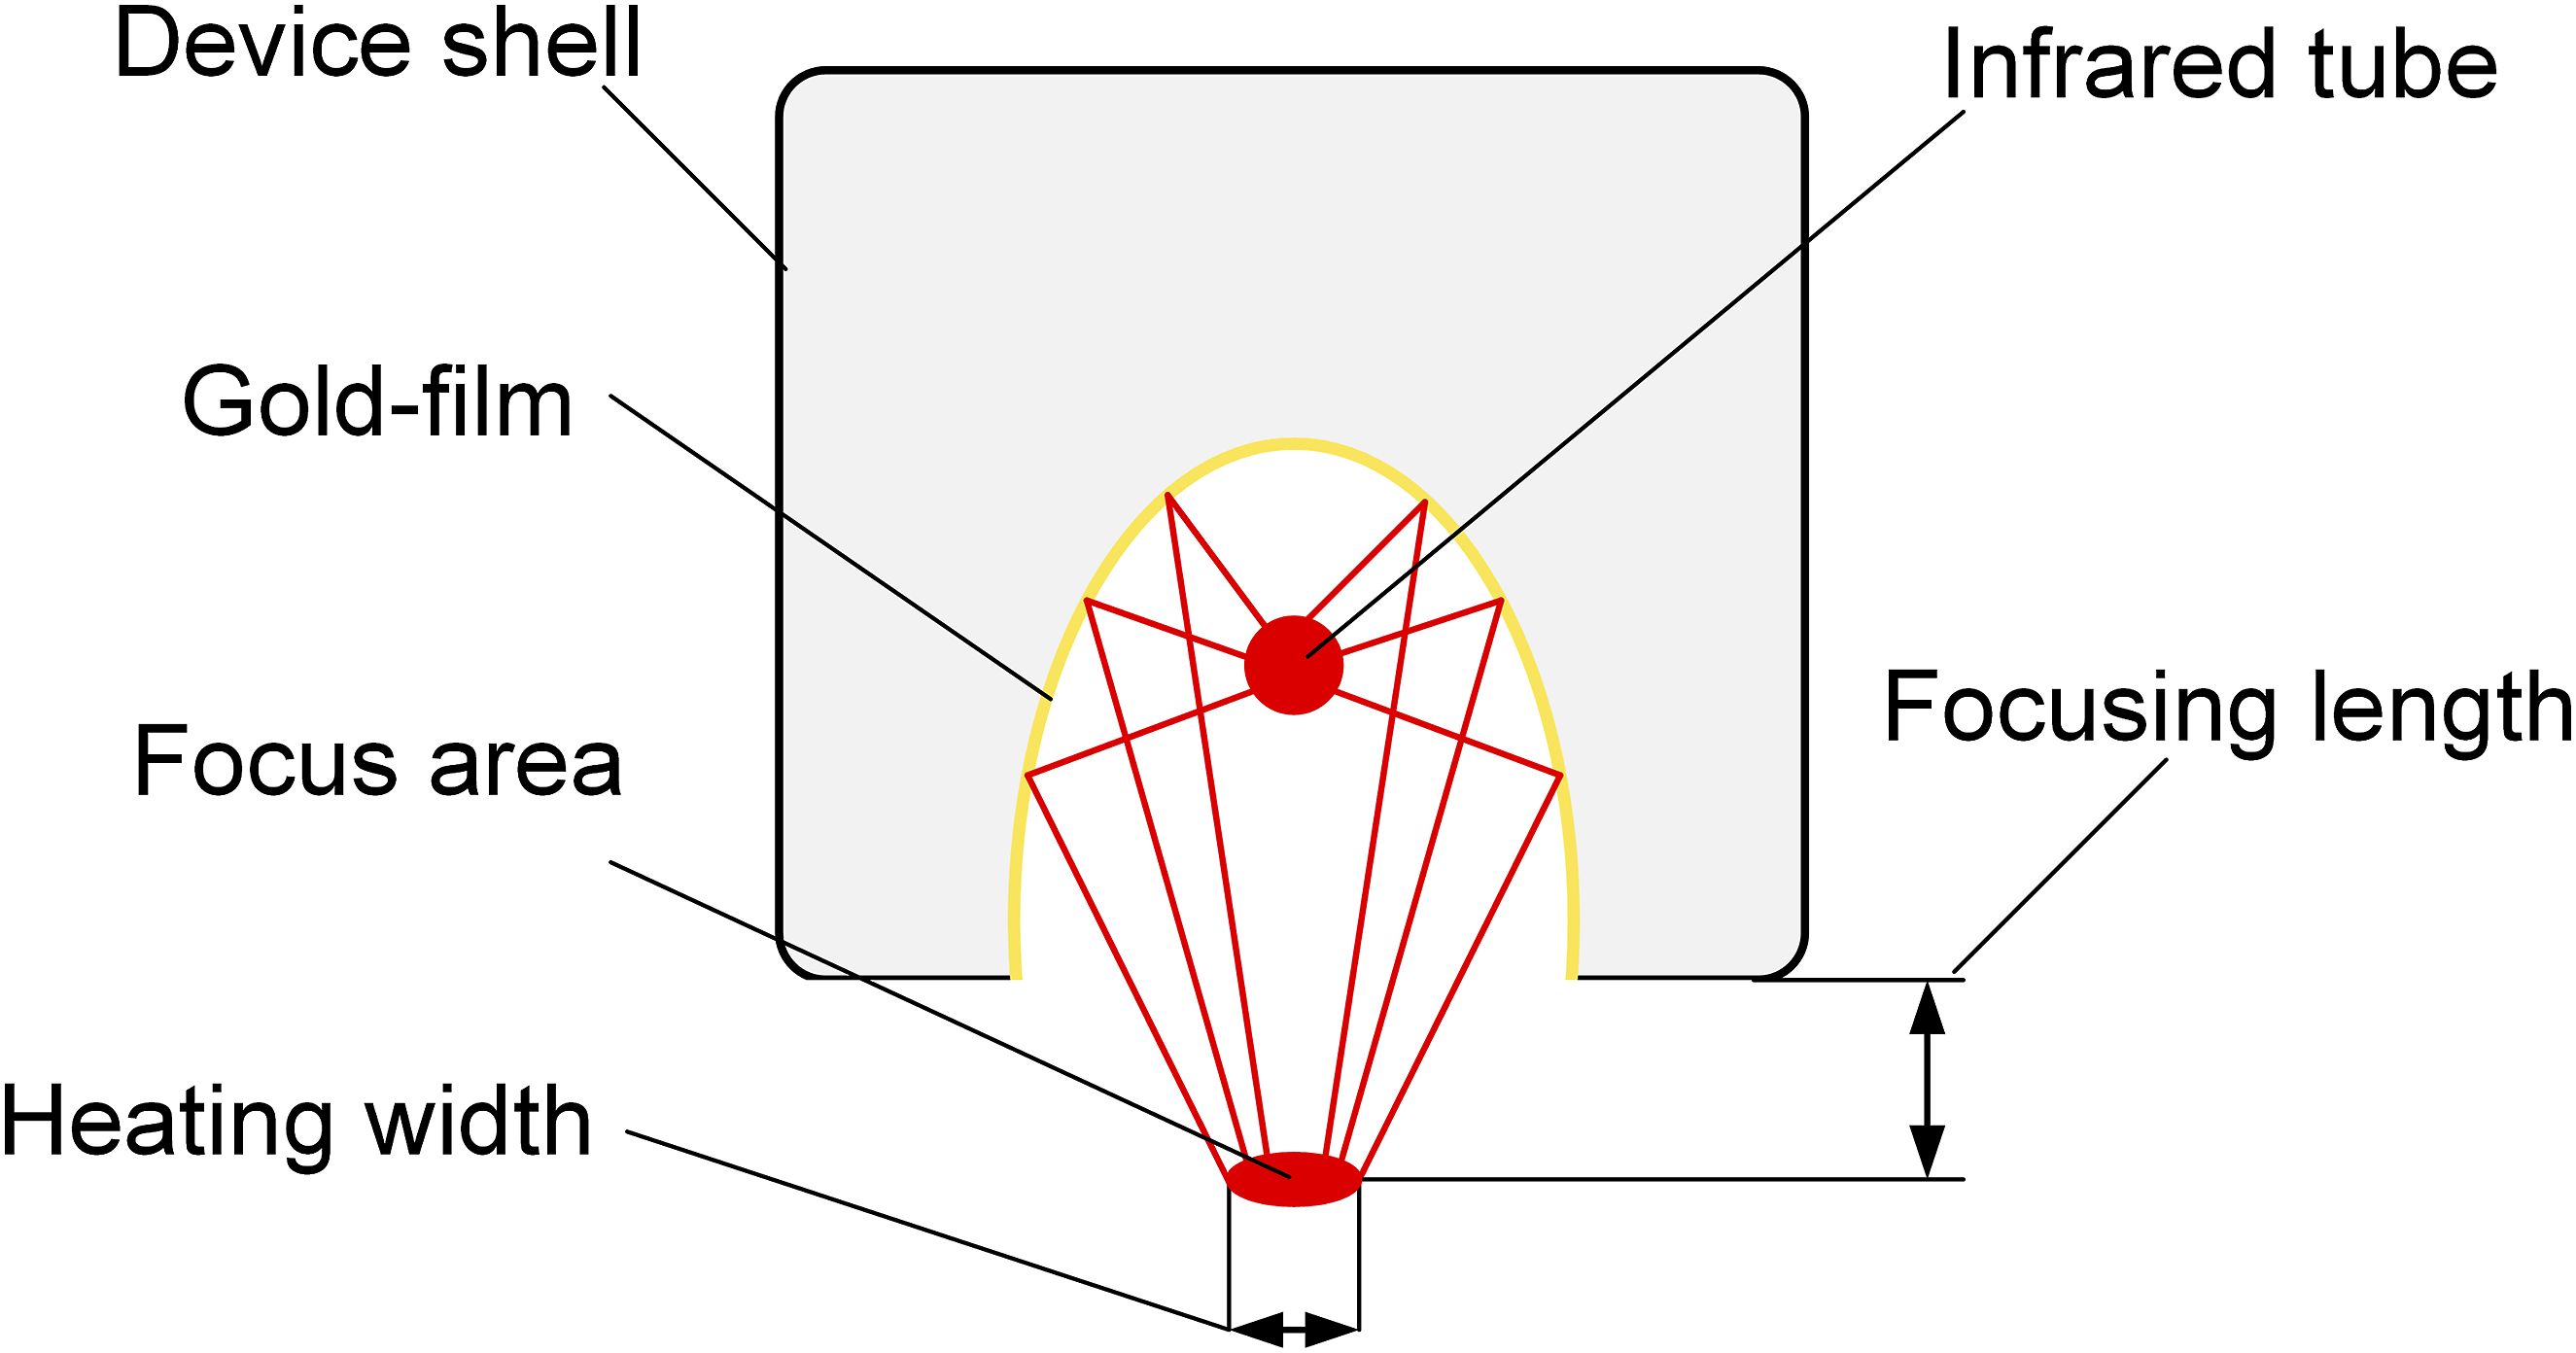

Where E is the intensity of radiation emitted by infrared lamps.
Where

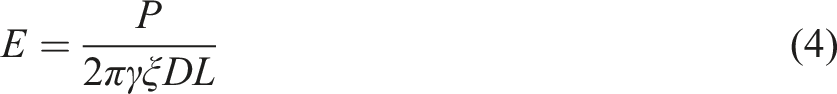
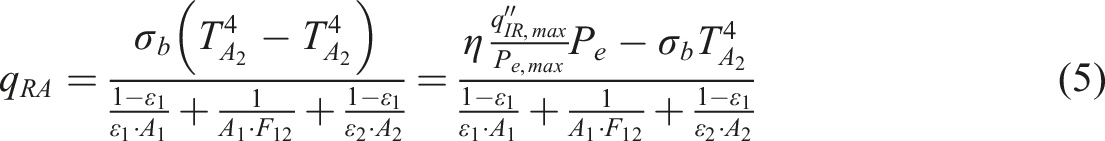
The radiative heat flow
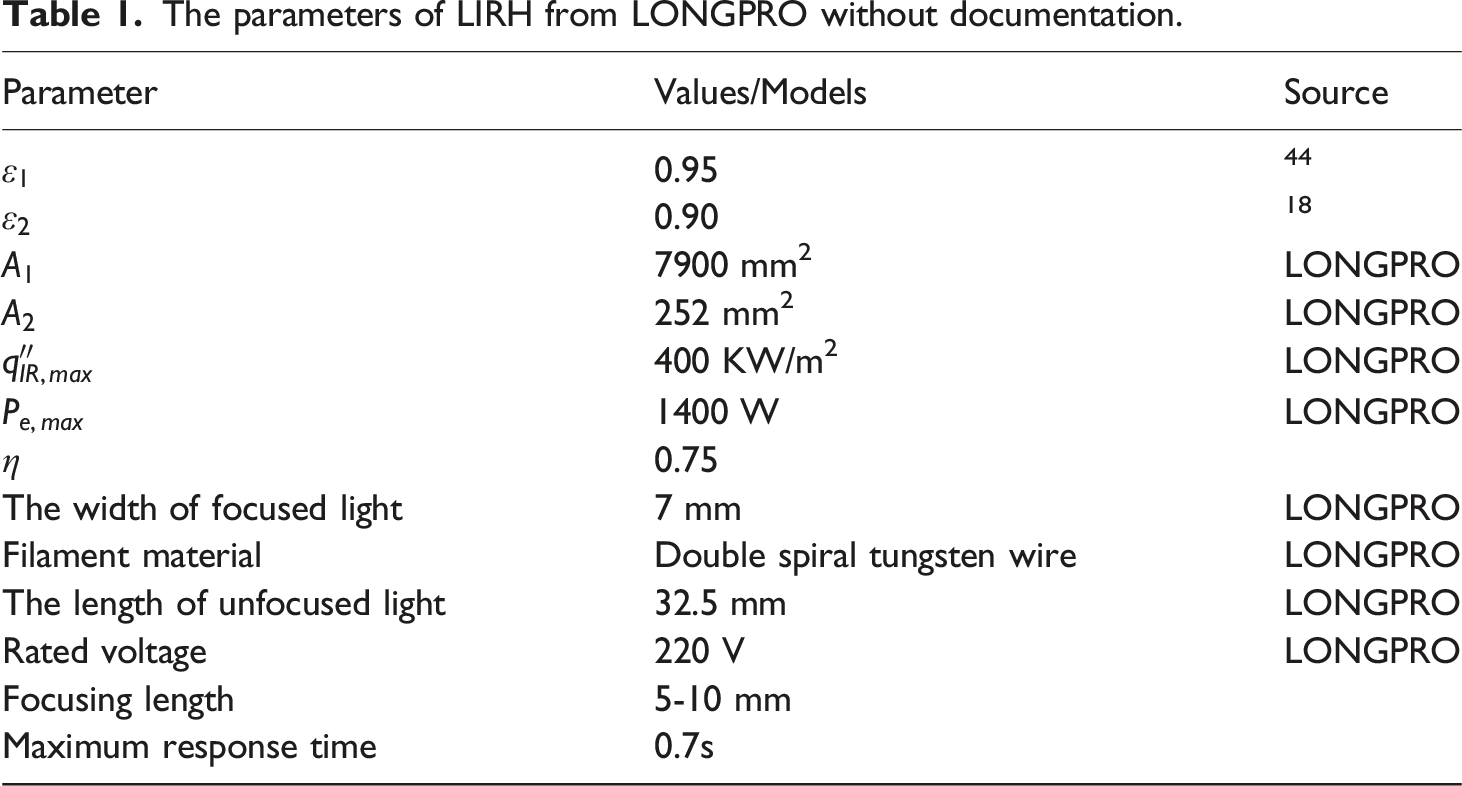
The parameters of LIRH from LONGPRO without documentation.
Heat transfer process during layup
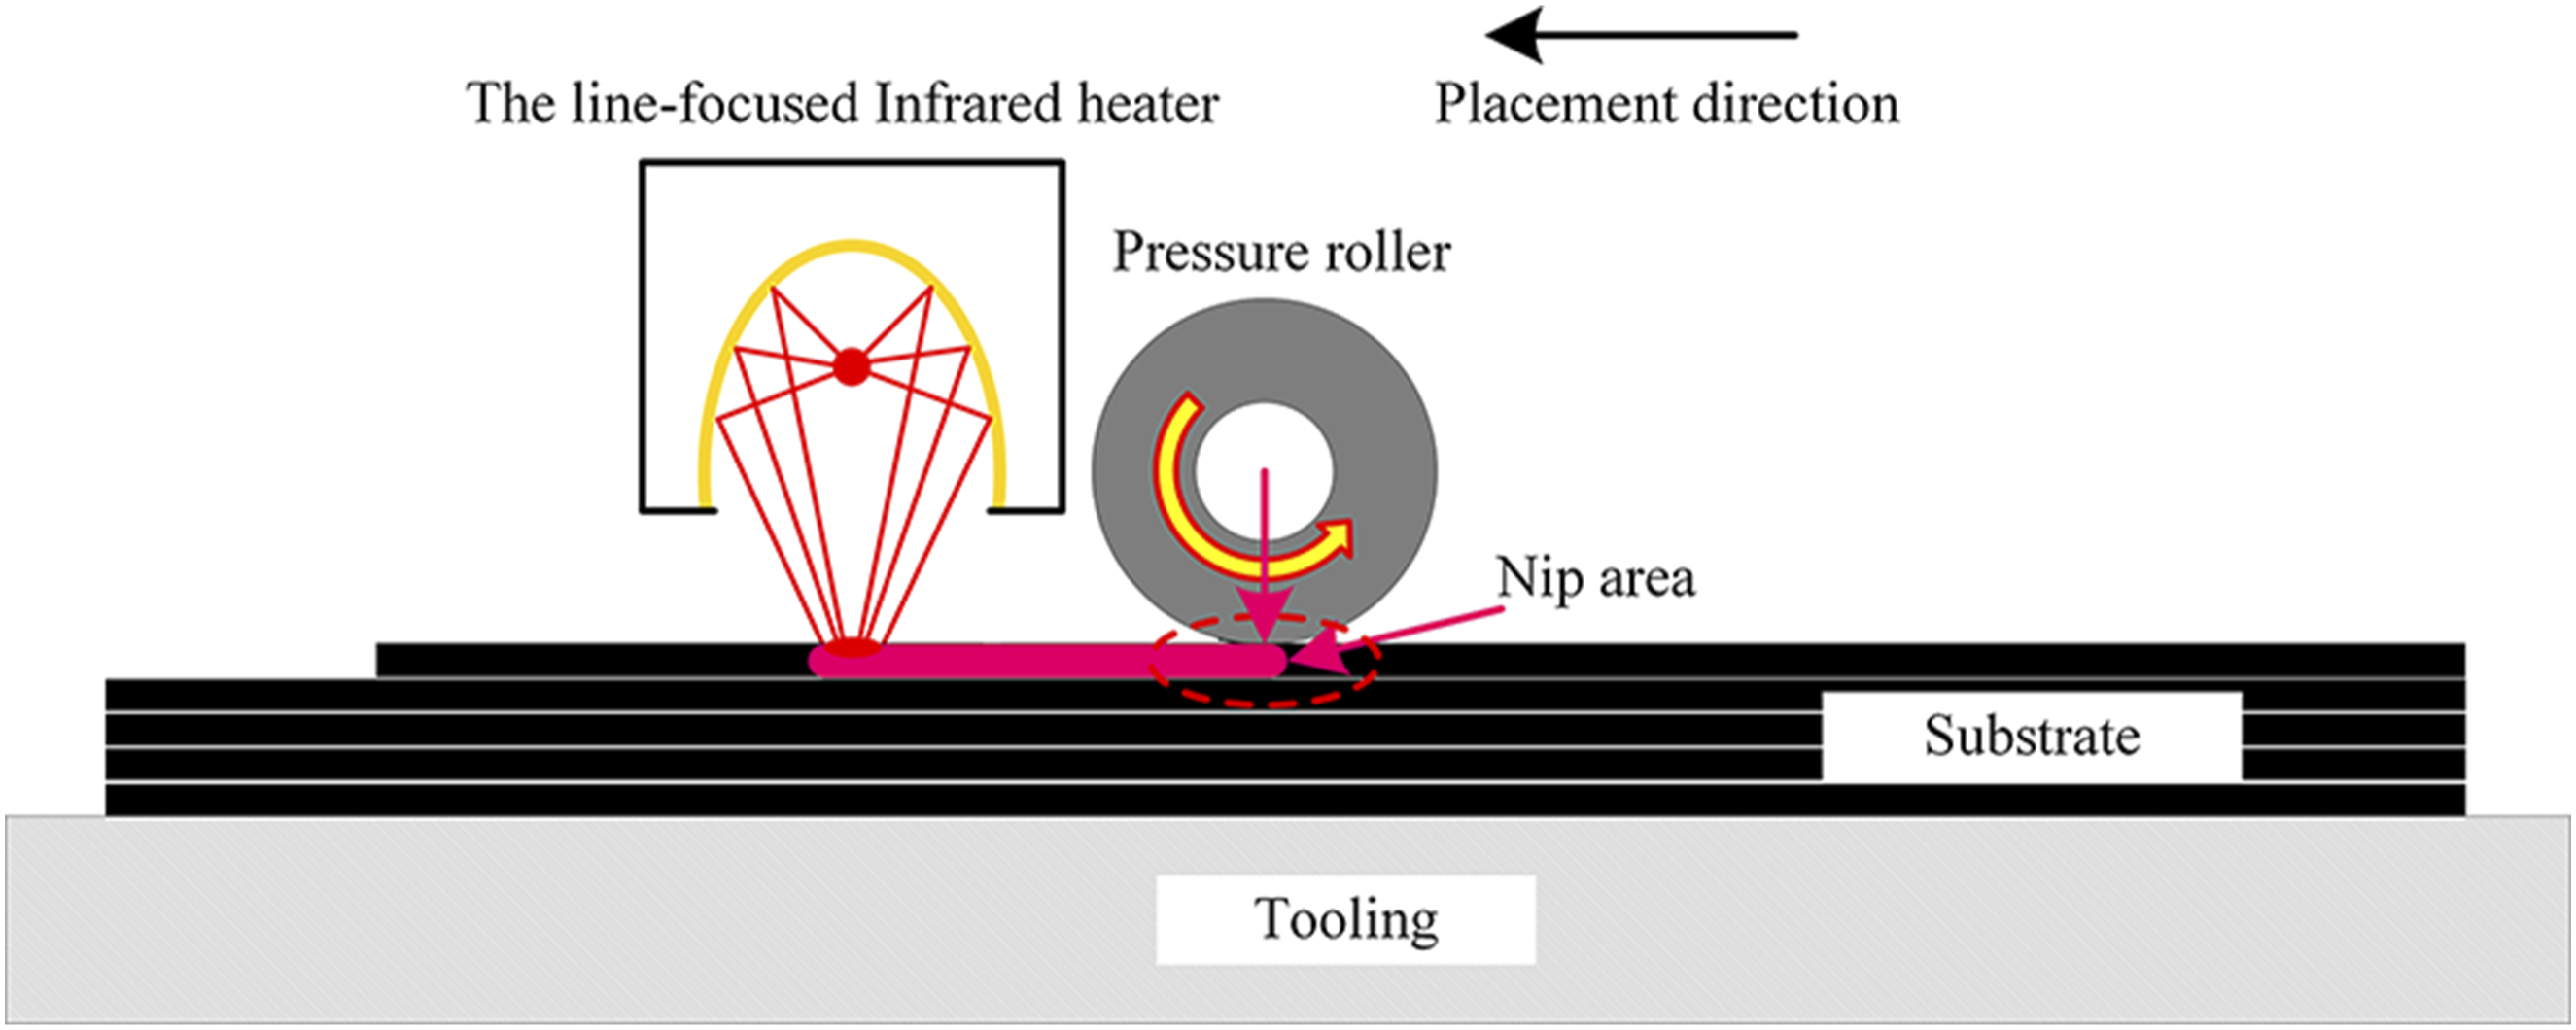
In the thermoplastic composite layup process, the resin in the prepreg tow is heated and melted by the LIRH, and pressure is applied by a pressure roller to make the resin flow, thus realizing the layup forming of prepreg tows. The LIRH-assisted automated layup process of thermoplastic composites is shown in Figure 2. Therefore, whether its temperature can reach the melting point is the key to ensuring the fluidity of the resin. Infrared radiation mainly acts on the upper surface of the paving layer, and the temperature change of each layer mainly relies on the heat transfer process between the layers. During the analysis, the following assumptions were made to simplify the model: (1) The heat loss by radiation is ignored because the effect of thermal radiation is negligible compared to heat convection and heat conduction. (2) The deformation in the direction of the thickness is neglected. Each pavement is considered a plate. (3) It is assumed that the speed is constant throughout the layup so that the heating time is equal at any position of the layup. (4) The heating width of the LIRH is greater than the width of the prepreg strand, so it is assumed that the prepreg is heated uniformly in the width direction. (5) The heat flux describes the boundary conditions of the heated region. This discussion specifically refers to Section 4.2.1. Schematic diagram of the LIRH-assisted AFP.
Based on the above assumptions, a semi-infinite solid model is used to simulate the heat transfer in the layup process. This model can be described as an infinite extension of the surface in the depth direction, which only considers the heat transfer in the thickness and length directions. The two-dimensional surface values represent the values in the depth direction. The variation in the temperature in the focusing heating region of the materials and the peak temperature of each layer are of interest. The equation for two-dimensional heat conduction is
36
: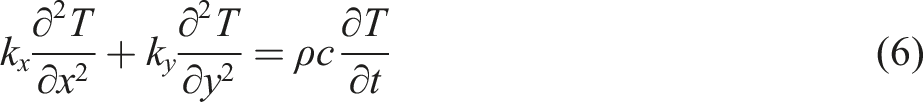
Where 
Geometry model and boundary conditions
Temperature is one of the most important process parameters in the thermoplastic composite layup, which is used to predict the reduction of voids, the degree of intimate contact and healing of interfaces between the tapes during the consolidation process, and the crystallization of AS4/PEEK composites.37–40 From the material perspective, temperature is an important factor affecting the crystallization of thermoplastic resins. Controlling the temperature change is conducive to obtaining a higher degree of crystallinity. The increase in temperature causes the thermoplastic resin to change from the glassy state to the rubbery state, and when the temperature continues to rise above the melting point, the thermoplastic resin changes from the rubbery state to the viscous state. According to the manufacturer’s recommendations, 380 °C–400 °C is the appropriate forming temperature range. From the perspective of the layup process, we need to control the heater’s power so that the resin can melt and flow at a certain laying speed and then apply enough pressure to bond the layers. Therefore, it is essential to establish an accurate geometric heat transfer model to analyze the temperature field during the automated layup process.
The variation of the temperature field during the automated placement process is time-dependent. The geometric model of the automated placement process of thermoplastic composites and the corresponding positional relationships and boundary conditions are shown in Figure 3. This coordinate system is located on the bottom surface of the tooling. It does not change with material deposition throughout the layup process. The prepreg tow is laid horizontally to the left, and the speed is set to Geometric model of LIRH-assisted automated thermoplastic fiber placement.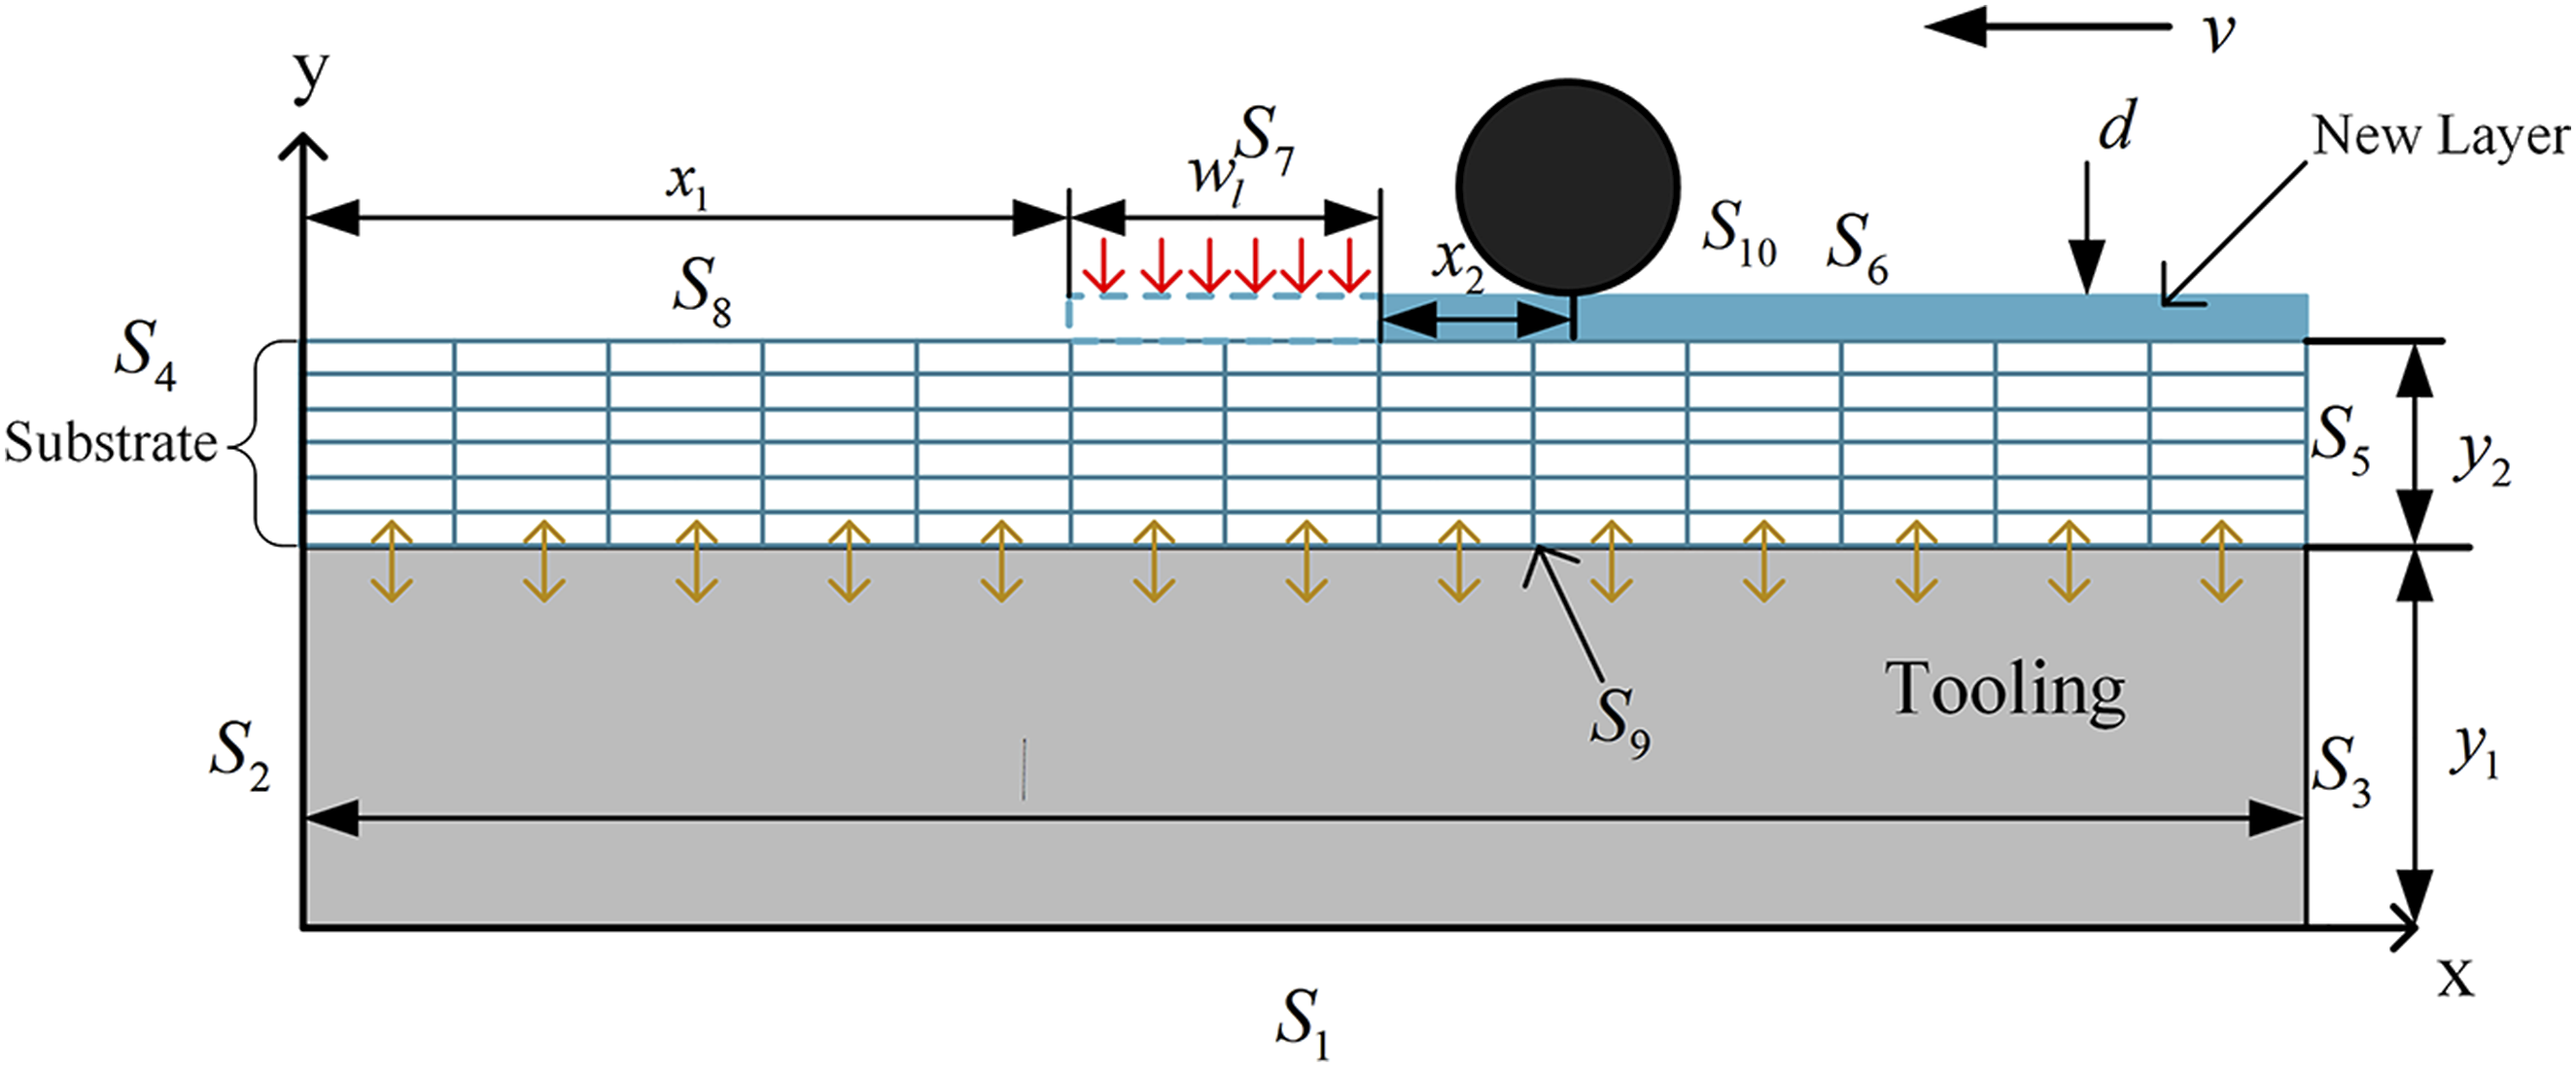
Based on the LIRH-assisted AFP, the boundary conditions of the temperature field are determined. Before the start of layup, assume that the surface temperature of the prepreg and the tooling are
The initial temperature of the surface
In the automated layup process, the boundary conditions for heat transfer according to Fourier’s law and Newton’s cooling equation are described as follows: the bottom surface 
Where n denotes the normal direction of the heat transfer surface. h1 is the surface heat transfer coefficient of the tooling under natural convection conditions. T is the ambient temperature. kn is the thermal conductivity of the prepreg wire bundle along the normal direction.
On
In the geometrical model, natural convection heat transfer with air takes place on the left 
Where h2 is the surface heat transfer coefficient of the prepreg under natural convection conditions.
On
In AFP, the rollers are made of steel. At the beginning, the initial temperature of the rollers is the same as that of the lower surface of the prepreg tows. The heat transfer coefficient of steel is much higher than that of the prepreg tows, so the rollers usually act as a cooling source and continuously absorb heat. The boundary conditions can be described as
On
At the contact surface 
On
In the geometric model, 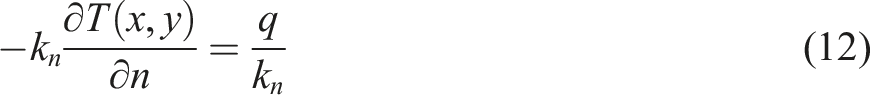
Thermal convection under natural conditions
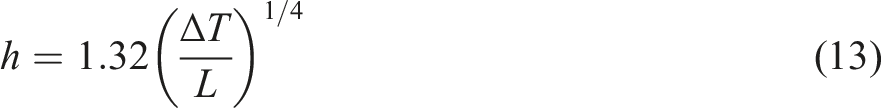
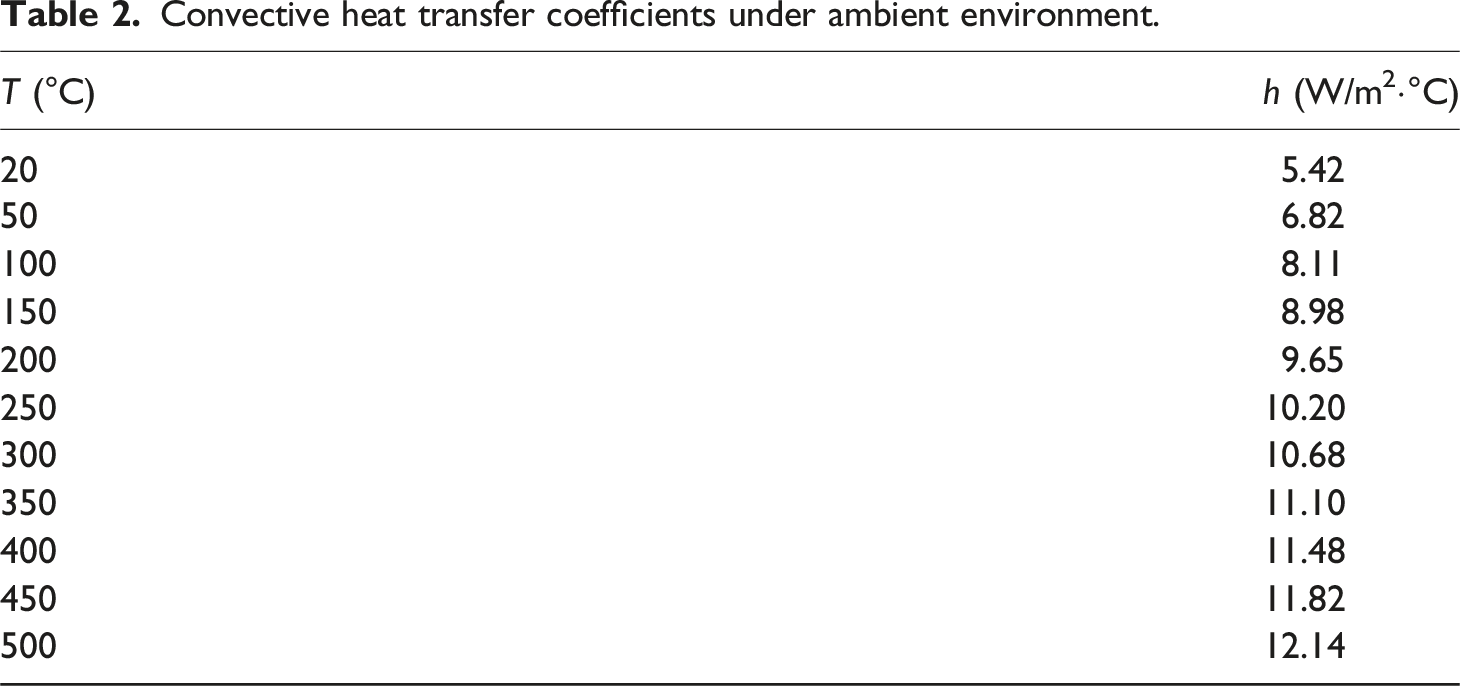
Convection loads should be applied to all surfaces exposed to the ambient environment. The convective heat transfer coefficient under natural conditions increases as the surface temperature increases, and the following empirical equations apply to that condition
35
:
Convective heat transfer coefficients under ambient environment.
Finite element simulation based on ANSYS
Finite element heat transfer modeling and solution
In the automated layup process, the infrared heater predominantly focuses its emitted light on the upper surface of the prepreg tow being laid down. During this process, the prepreg transitions into a molten state, enabling it to bond together under the pressure of the roller. Throughout the layup, both the heater and pressure roller continuously move alongside the layup head, while the prepreg tow is deposited onto the substrate. Consequently, the temperatures of the prepreg bundles and the layups vary continuously with both time and position, aligning well with transient heat transfer analysis. The temperature of the prepreg bundles directly influences the temperature of the substrate, and given that PEEK has a melting temperature of 343°C, it is particularly sensitive to temperature variations. To understand the impact of temperature on the substrate and prepreg bundles during the infrared-assisted heating layup, it is essential to analyze the temperature changes occurring in each layer throughout the process. This study employed the ANSYS Workbench platform in conjunction with a parametric language to address the thermal field during thermoplastic automated placement. Additionally, cyclic loading and birth-death element strategies were utilized to simulate the continuous movement of the laying head and the material deposition process. The procedural steps for analyzing the transient temperature field during the automated placement of thermoplastic composites are illustrated in Figure 4. Flow chart for parametric language design.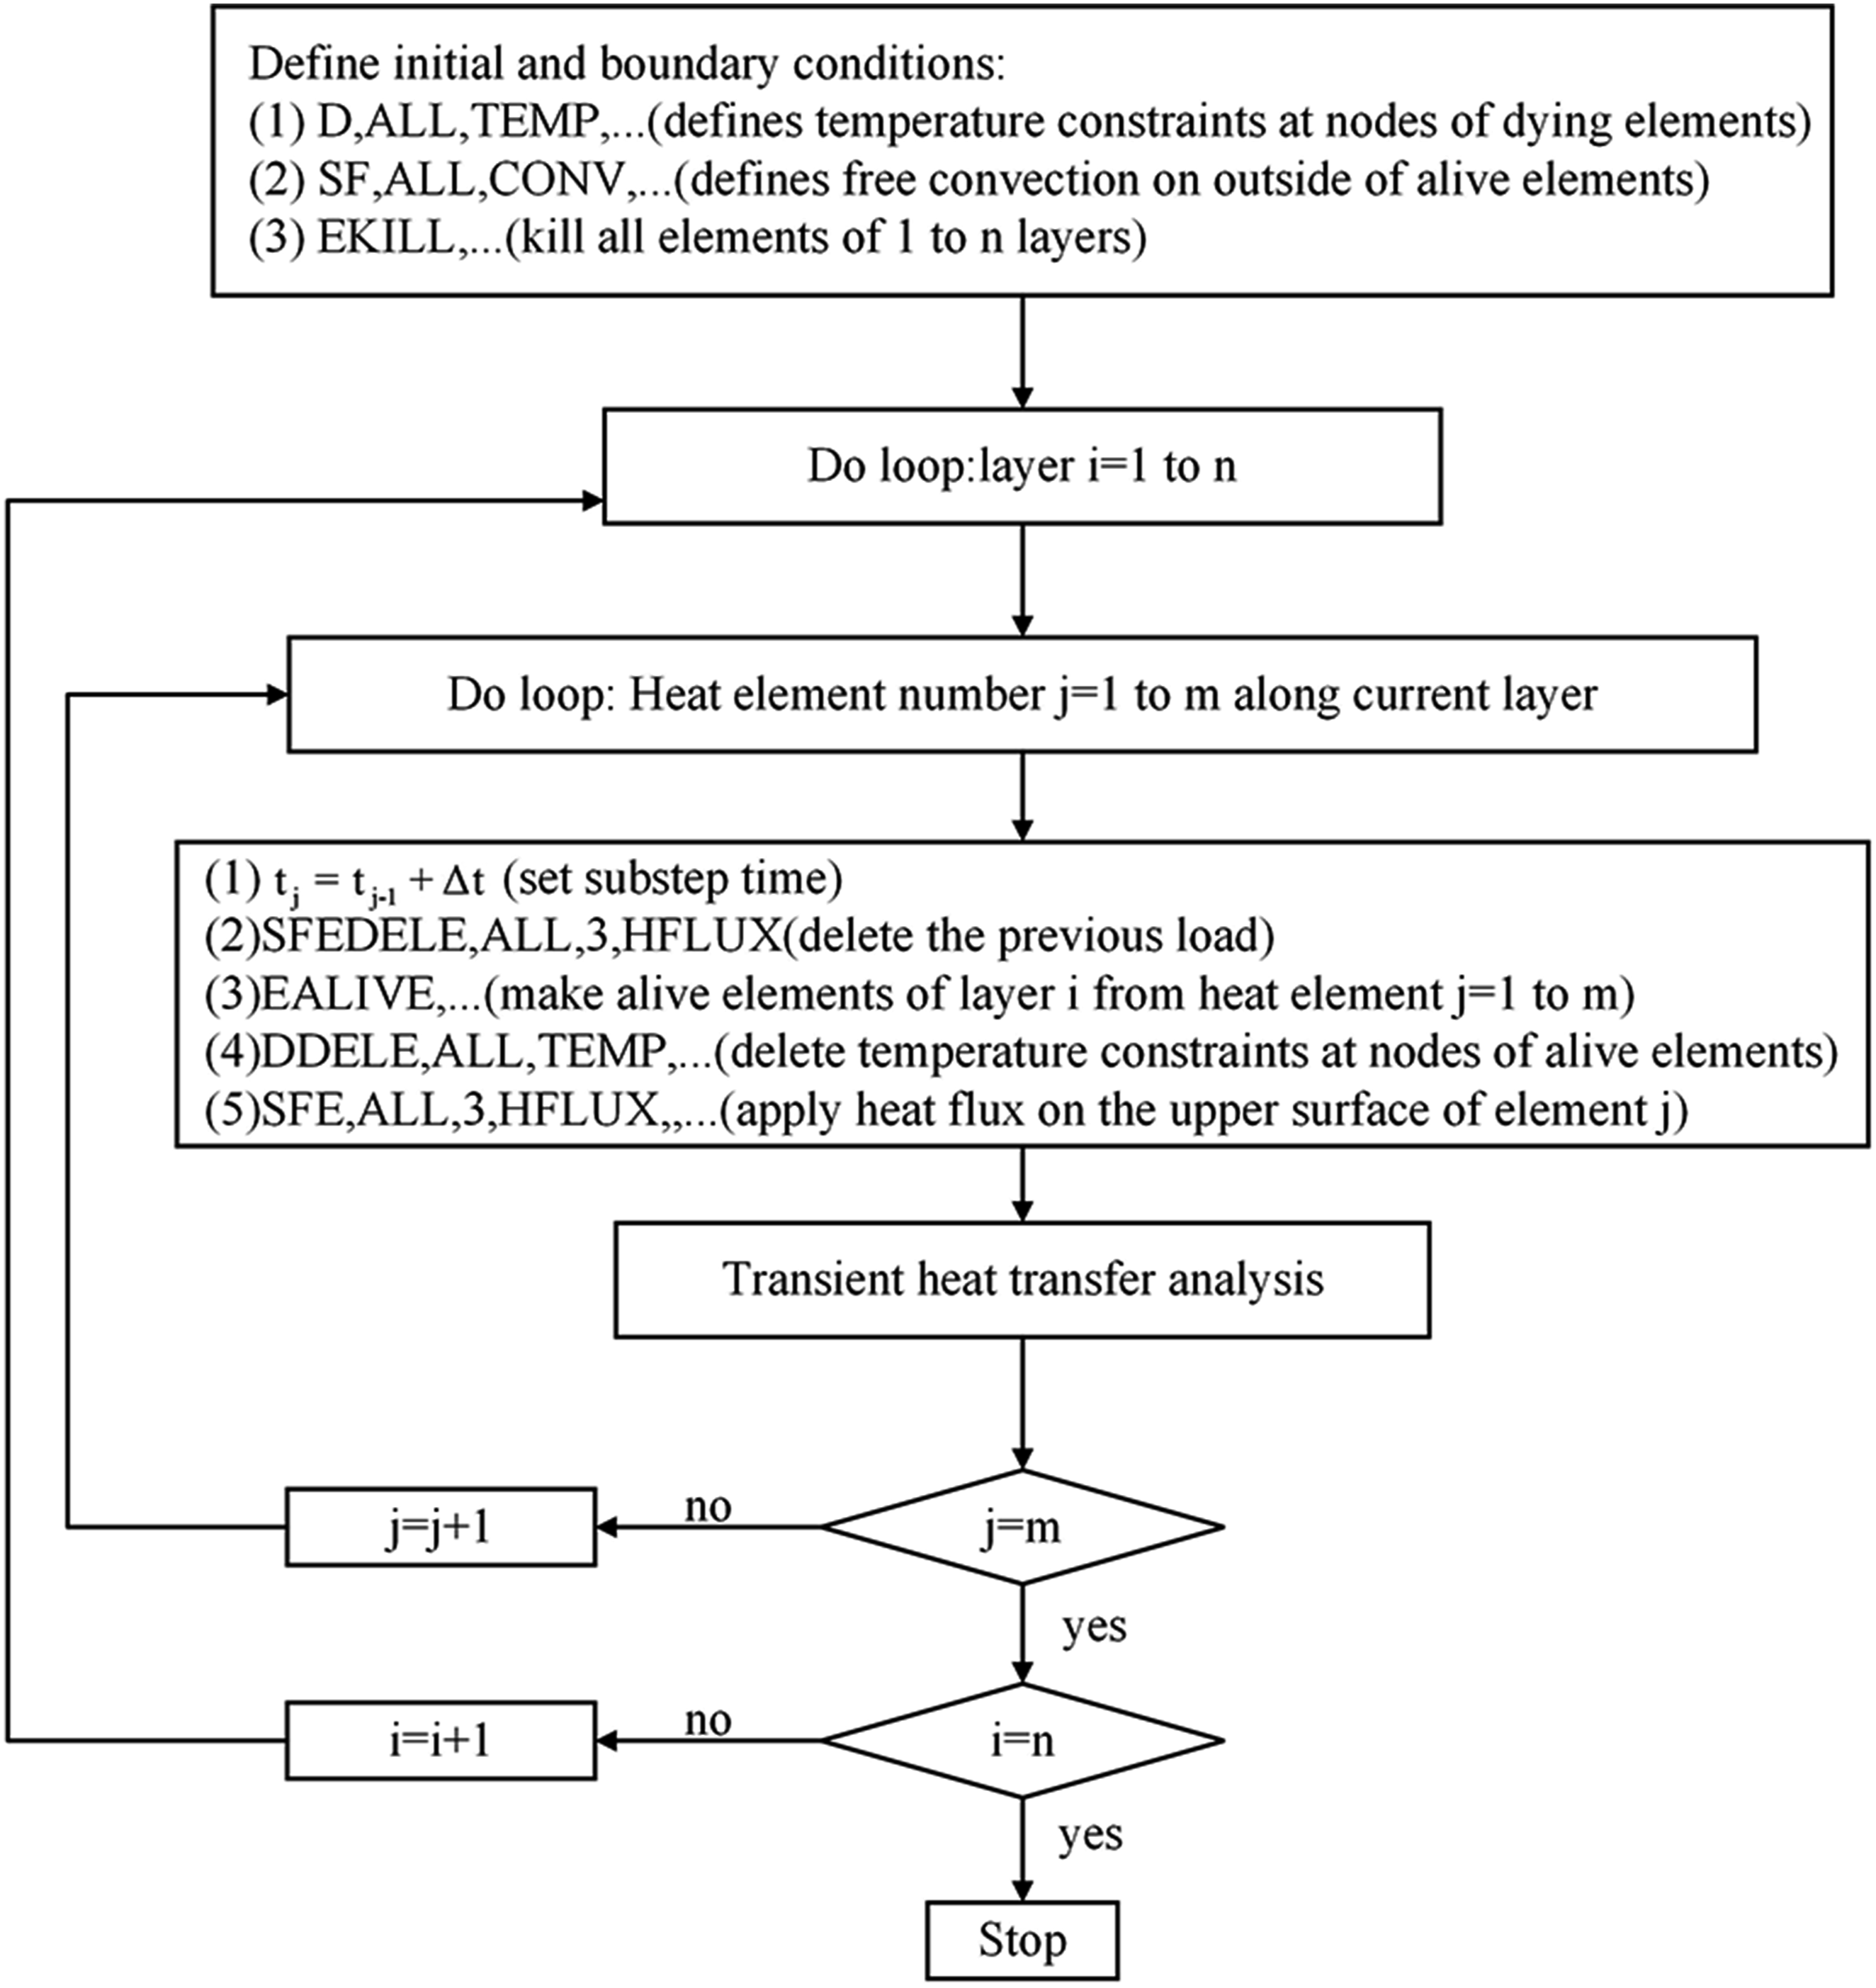
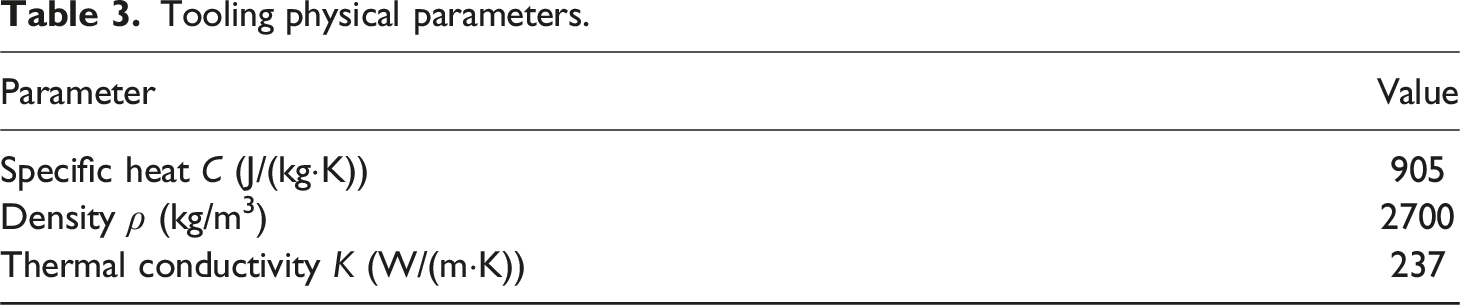
Tooling physical parameters.
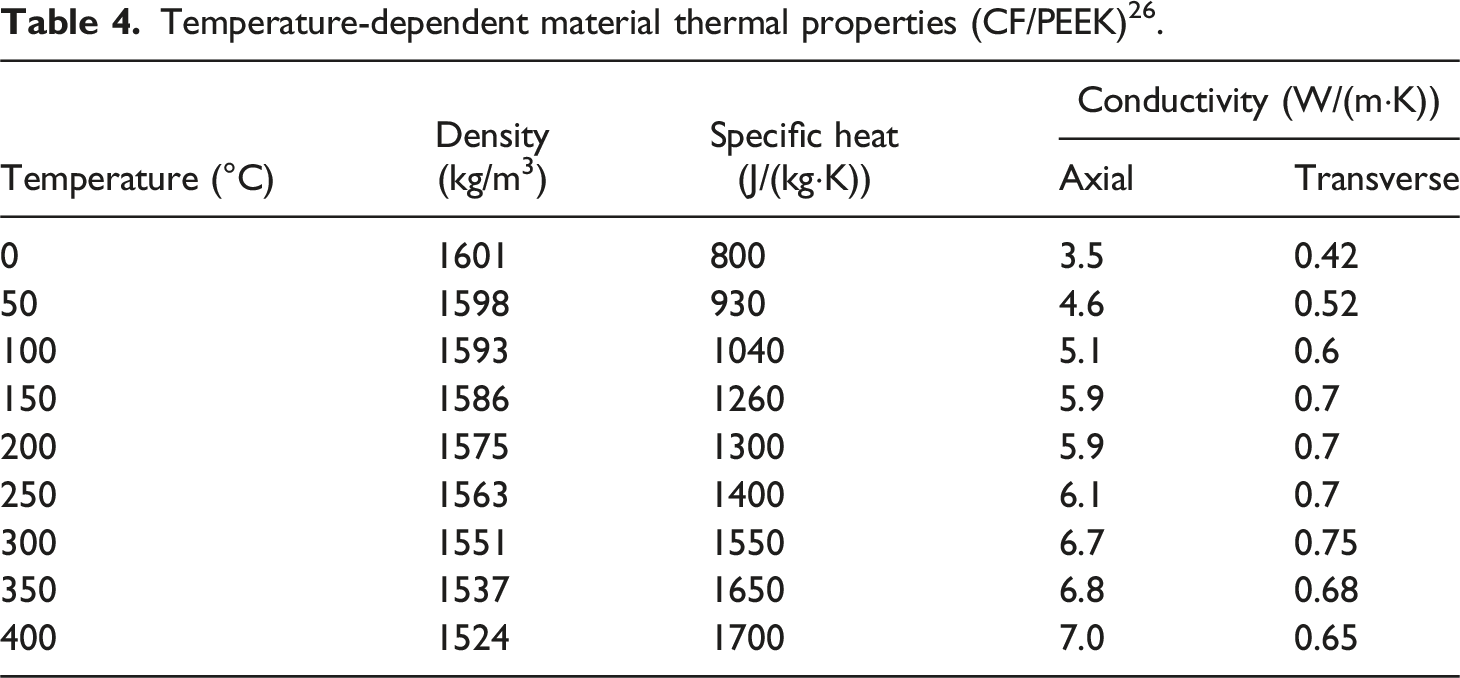
Temperature-dependent material thermal properties (CF/PEEK) 26 .
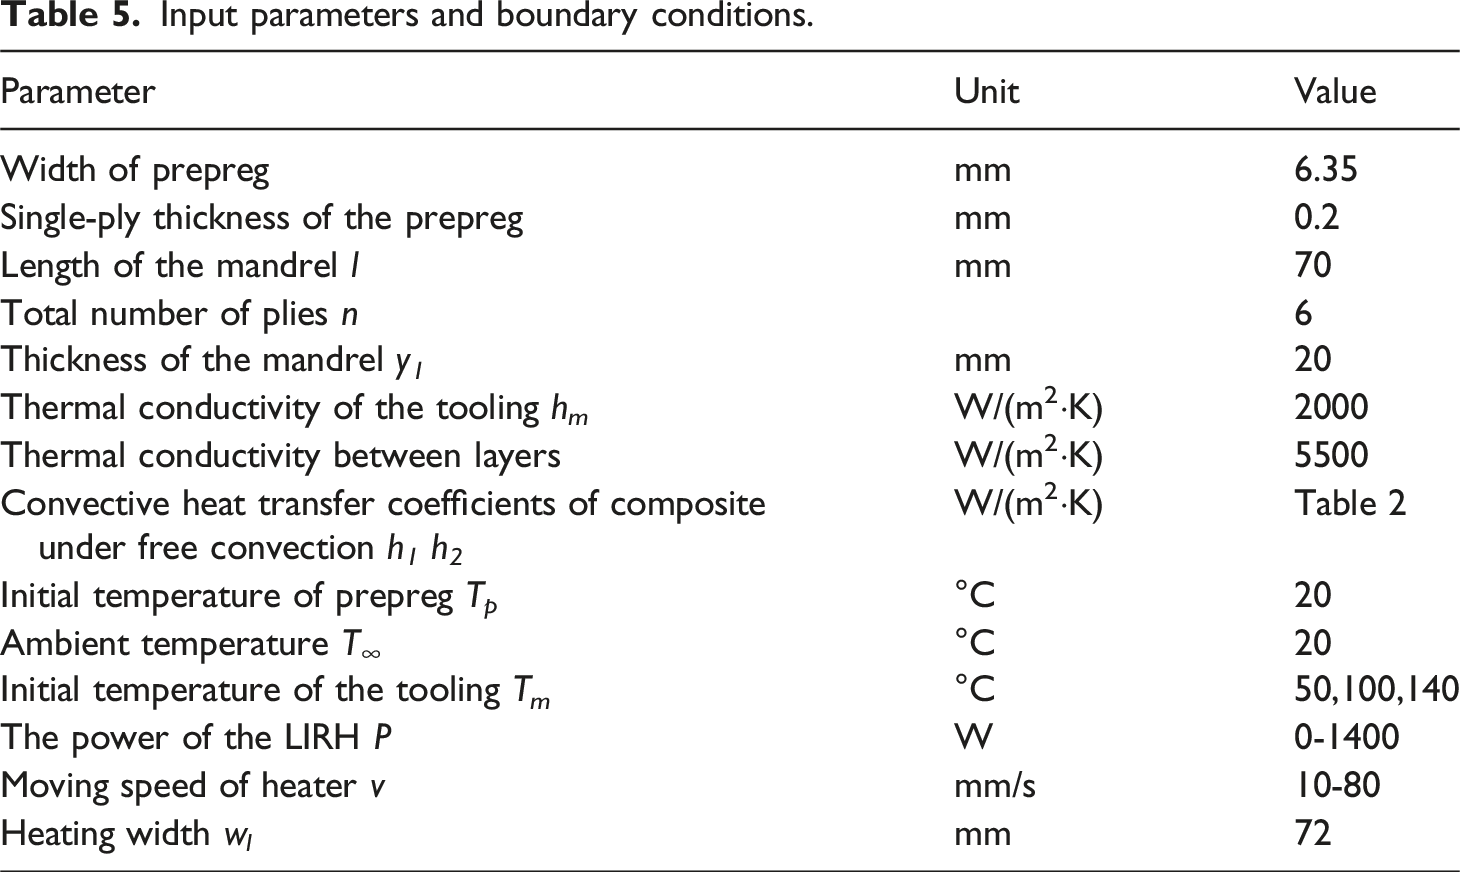
Input parameters and boundary conditions.
In the automated layup process, the heat source continuously moved in the layup direction. The moving heat source needed to be discretized into a specified time step in the finite element model. Assuming that the length of the pavement is 70 mm, the LIRH moved at 30 mm/s, and the total time for the pavement of a single layer was 2.1 s. The heating width was 72 mm and the width of focused light was 7 mm. The length of the single layer prepreg tows was divided into 100 elements, and the size of single element was 0.7 mm. The red and circle shown in Figure 5 was the heating region. In the finite element model, the dead element that was about to be heated was activated, and the heat source moved one node for each additional time step. The time taken by the moving heat source to move two neighboring nodes was the distance between the nodes divided by the speed of movement (Δt = 0.7 mm/30 mm/s = 0.023s). This meant that the current residence time in the heated area was 0.023 s. The results of the calculations in step 1 were applied as initial conditions in step 2, and each node advanced by the moving heat source was considered to cycle through the calculations until the end of the cycle of n calculations to the single-layer placement (step 4). Schematic diagram of the process of heat transfer analysis of a moving heat source in Workbench using ANSYS Parametric Design Language.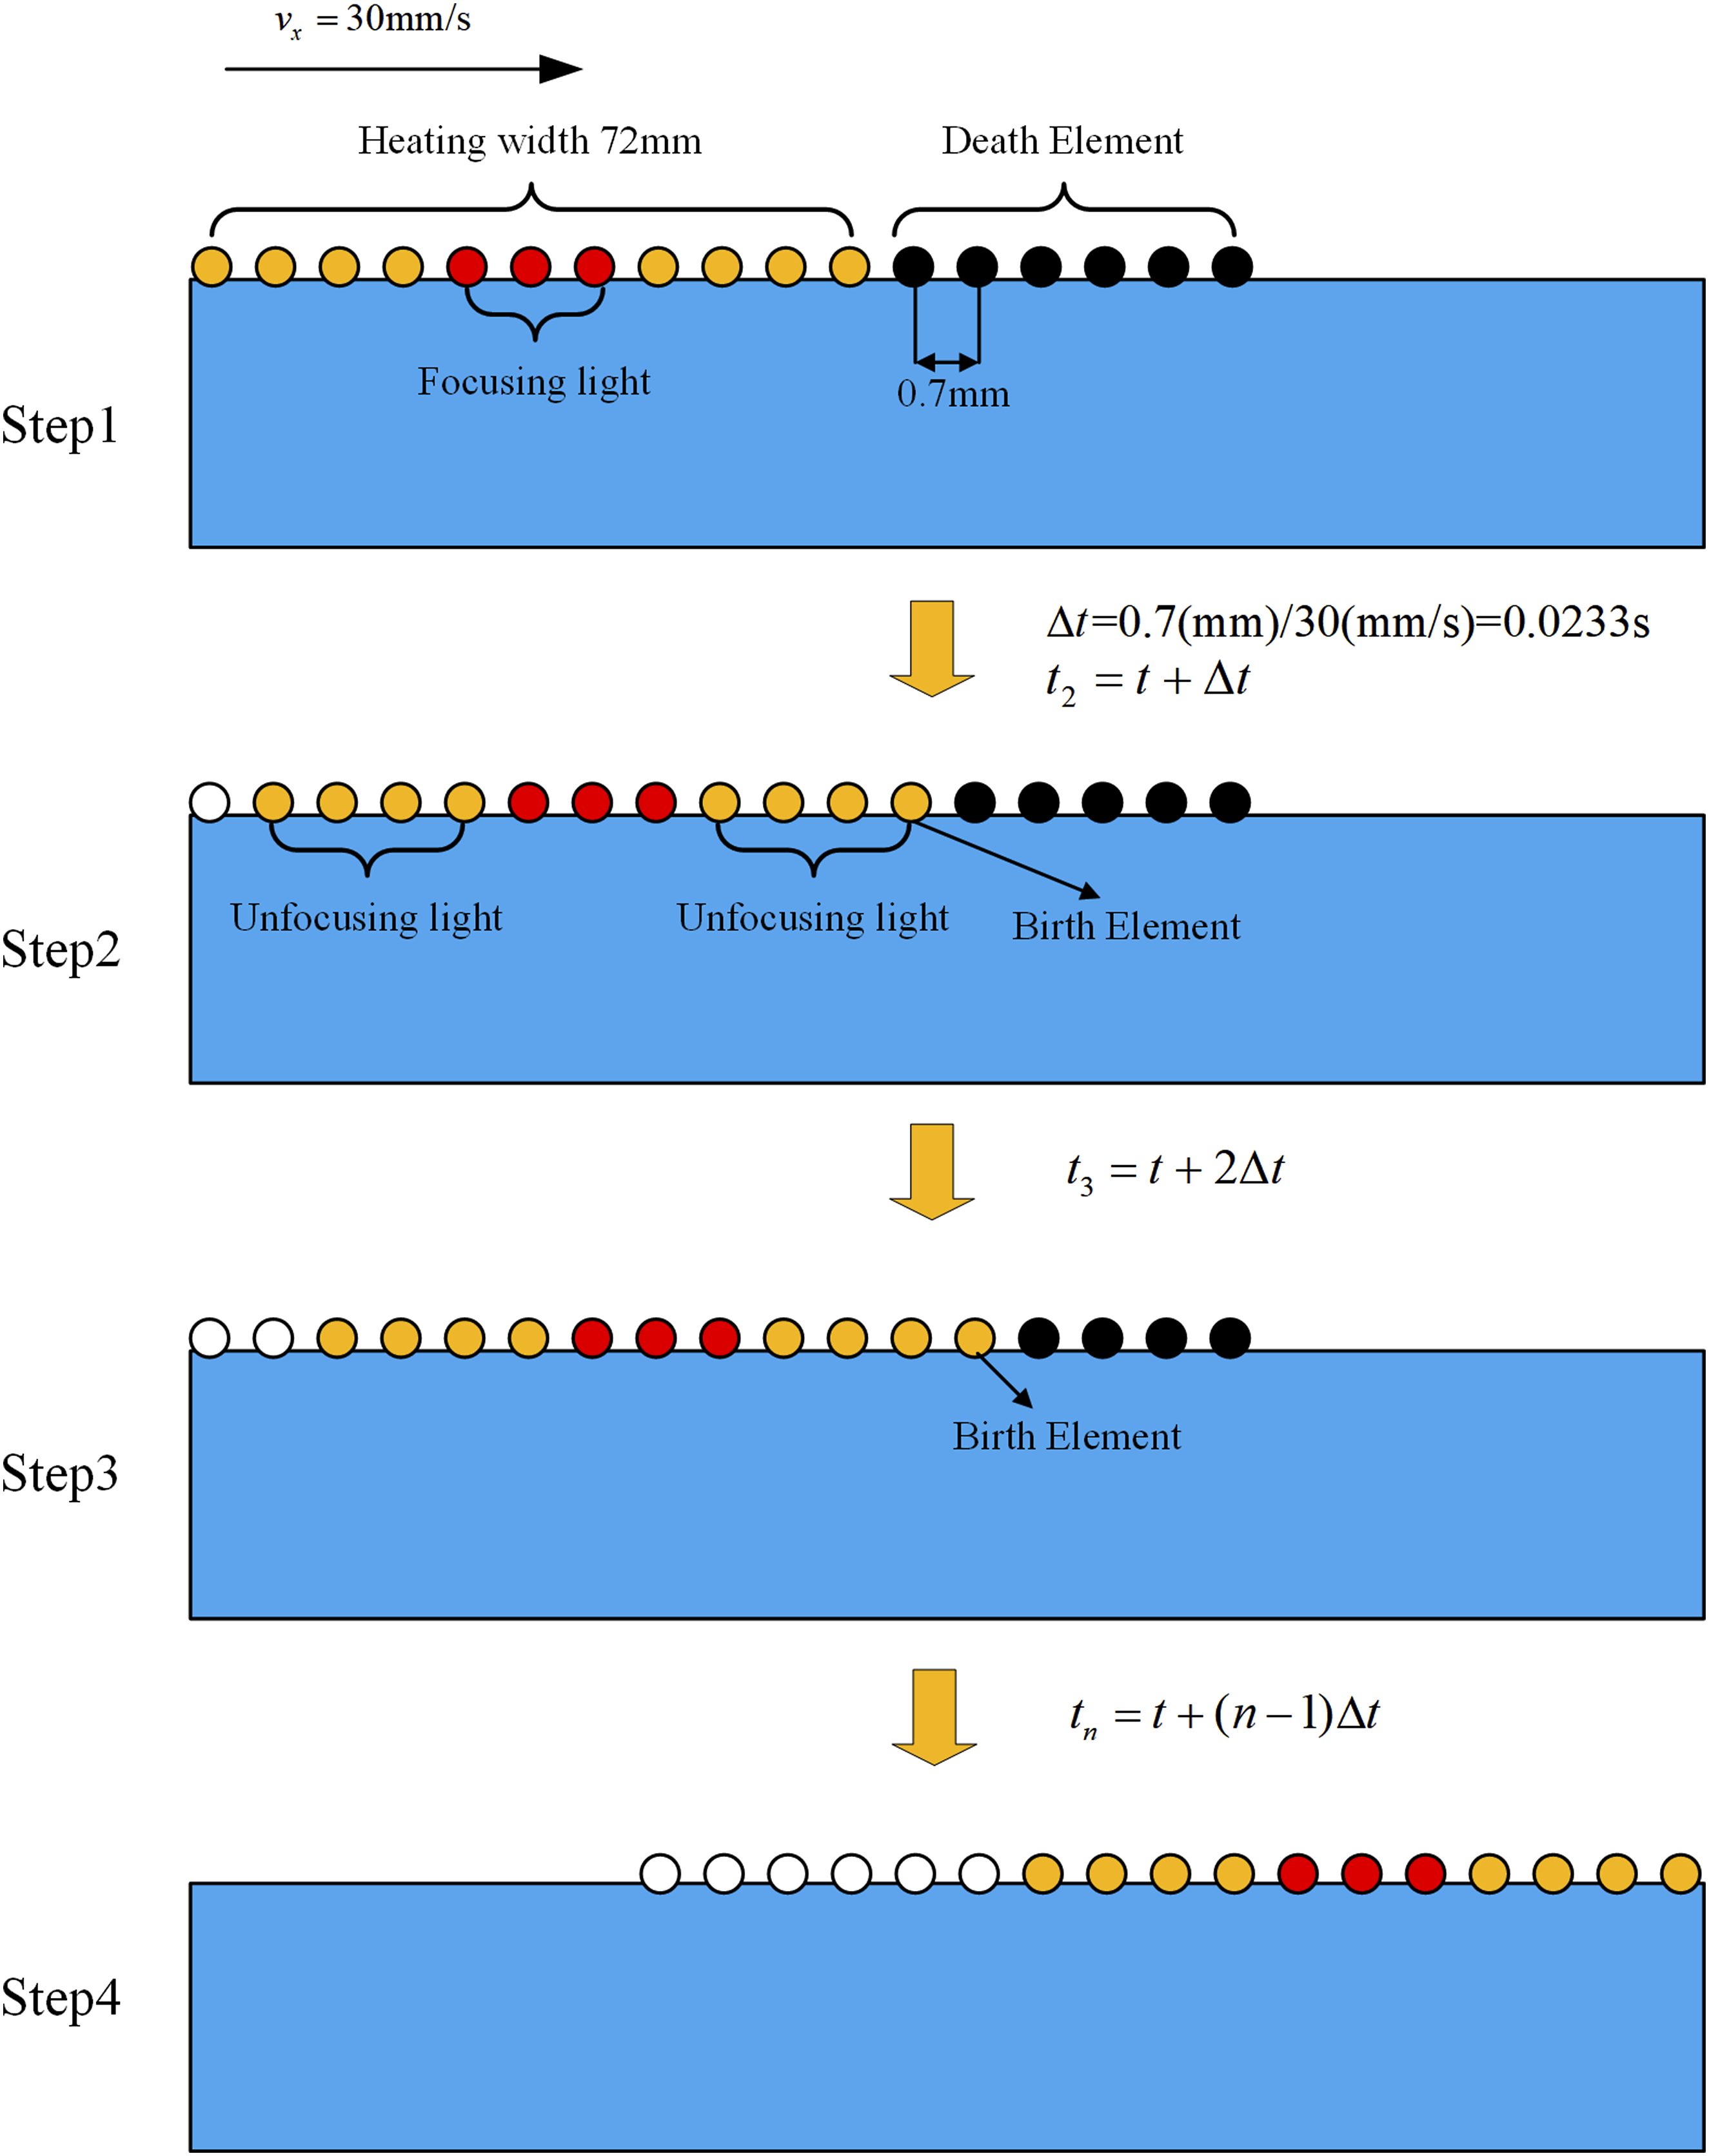
Simulation results of the temperature field
Variation of the temperature field in the layers
Figure 6 illustrates the 2D temperature distribution contours for selected locations in the third and sixth layers, under conditions of a tooling temperature of 50°C, a laying speed of 30 mm/s, and an infrared power of 1400 W. To enhance clarity in distinguishing between active and inactive elements, the elements that had not yet been activated are omitted from the figure. Temperature distribution contours in the third and sixth layers at 30 mm/s and an infrared power of 1400W.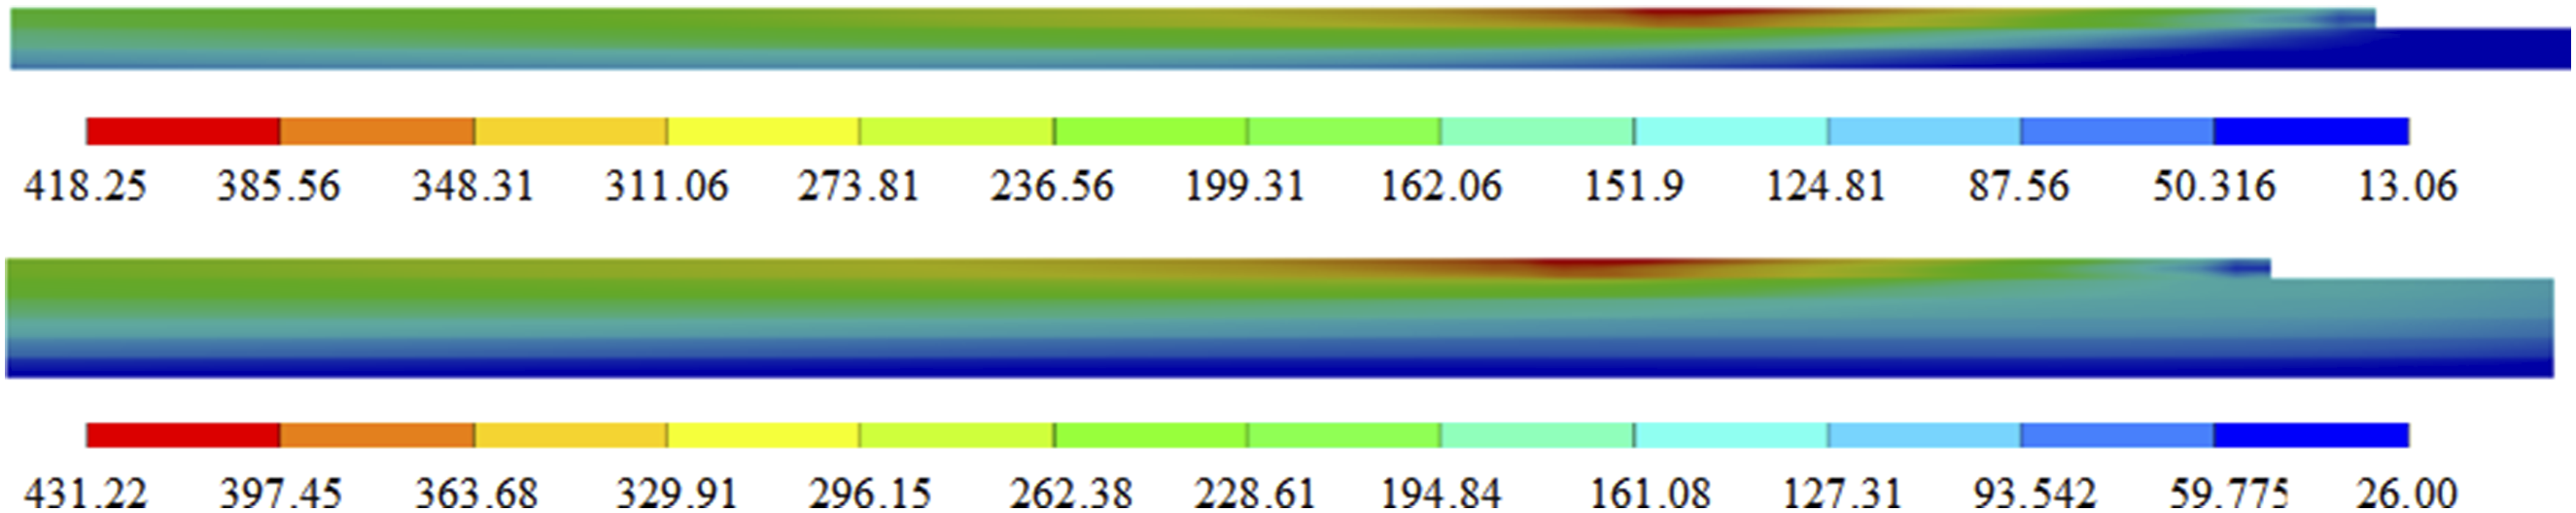
The temperature distribution history throughout the AFP process, encompassing both heating and cooling phases, had been elucidated through numerical simulations. Figure 7 displayed the temperature histories recorded at six distinct points during the entire laying process. Six temperature probes designated TP1 to TP6, were positioned on the upper surfaces of layers 1 to 6, with each probe located 35 mm from the left end of the model. The thermal conductivity between the tooling and the first layer was set at 2000 W/(m2·K), while the thermal conductivity between subsequent layers was defined as 5500 W/(m2·K).
18
A rapid temperature rise was observed as the focused light reached the area directly above each temperature probe, followed by a swift decrease in temperature as the moving heat source passed beyond the probes. This effect diminished with increasing distance from the heated surface, indicating that the surface layer experienced heating and cooling at a significantly faster rate than the layers below it. Temperature histories of points at TP1-TP6 on the top surfaces of the 1-st to 6-th tows.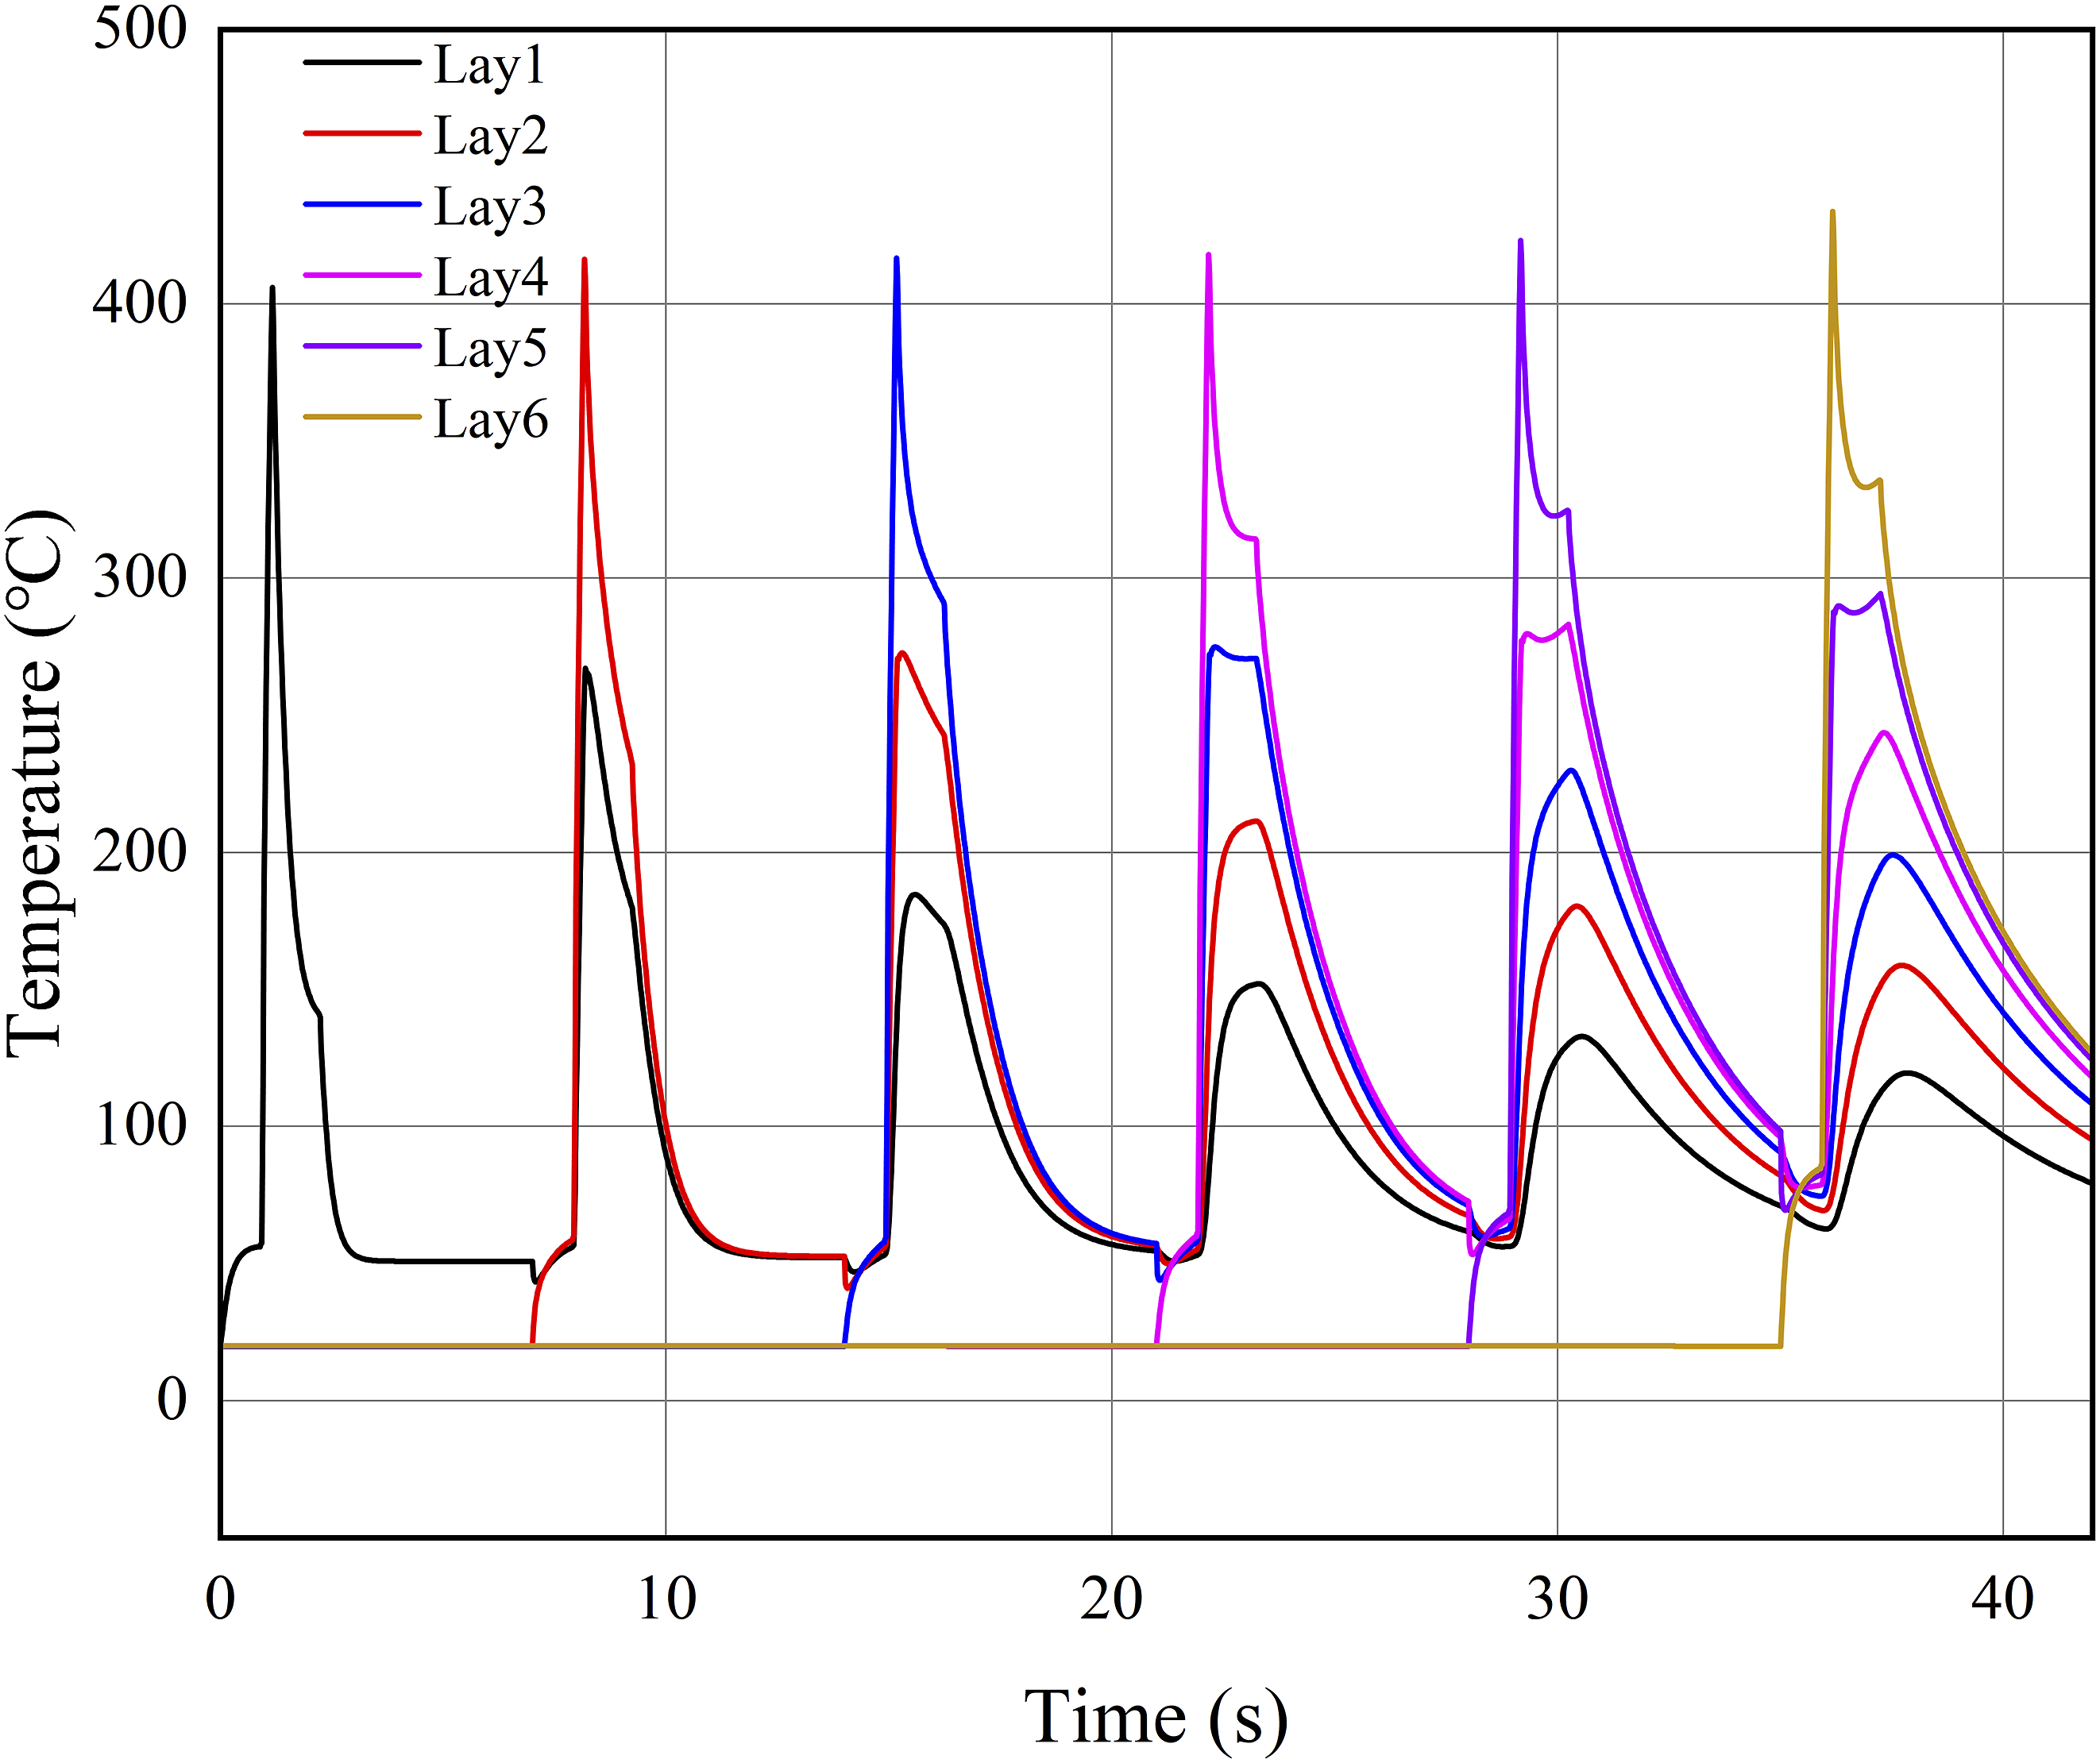
A gradual flattening of the temperature wave peaks was observed as the distance from the heated surface to the substrate increased. By the time the heater passed over the fourth layer, the temperature of the first layer had already dropped below the glass transition temperature, indicating that the maximum number of layers that could be cooled to below the glass transition temperature was three. Although there was sufficient time for the first two layers to cool completely, heat accumulation occurred. This heat accumulation resulted in four layers remaining above the glass transition temperature when the moving heat source passed over the sixth layer. This observation suggests that the number of layers exceeding the glass transition temperature increased with the deposition of additional layers due to the effects of heat accumulation.
Effect of tooling temperature on cooling rate
The literature has reported that the cooling rate significantly influences the crystallinity of thermoplastic composites.
41
Accurate calculation of the cooling rate during lay-up is crucial for studying crystallization kinetics under non-isothermal conditions.
37
This section investigates the effect of tooling temperature on the cooling rate during the layup process. Figure 8 illustrates the heating and cooling profiles of the peak temperature for the first layer at tooling temperatures of 50°C, 100°C, and 140°C. The heating and cooling intervals were determined by tracking the movement of the nodes. Initially, the unfocused light provided weak heating to the material. Subsequently, the temperature rose rapidly when the focused light reached temperature probe TP1. Following this, the influence of unfocused light introduced an inflection point in the cooling period, indicating that unfocused light can effectively slow down the cooling process. Effect of the boundary condition of the tooling on temperature histories of the first layer when the speed is 30 mm/s, and the power is 1400W.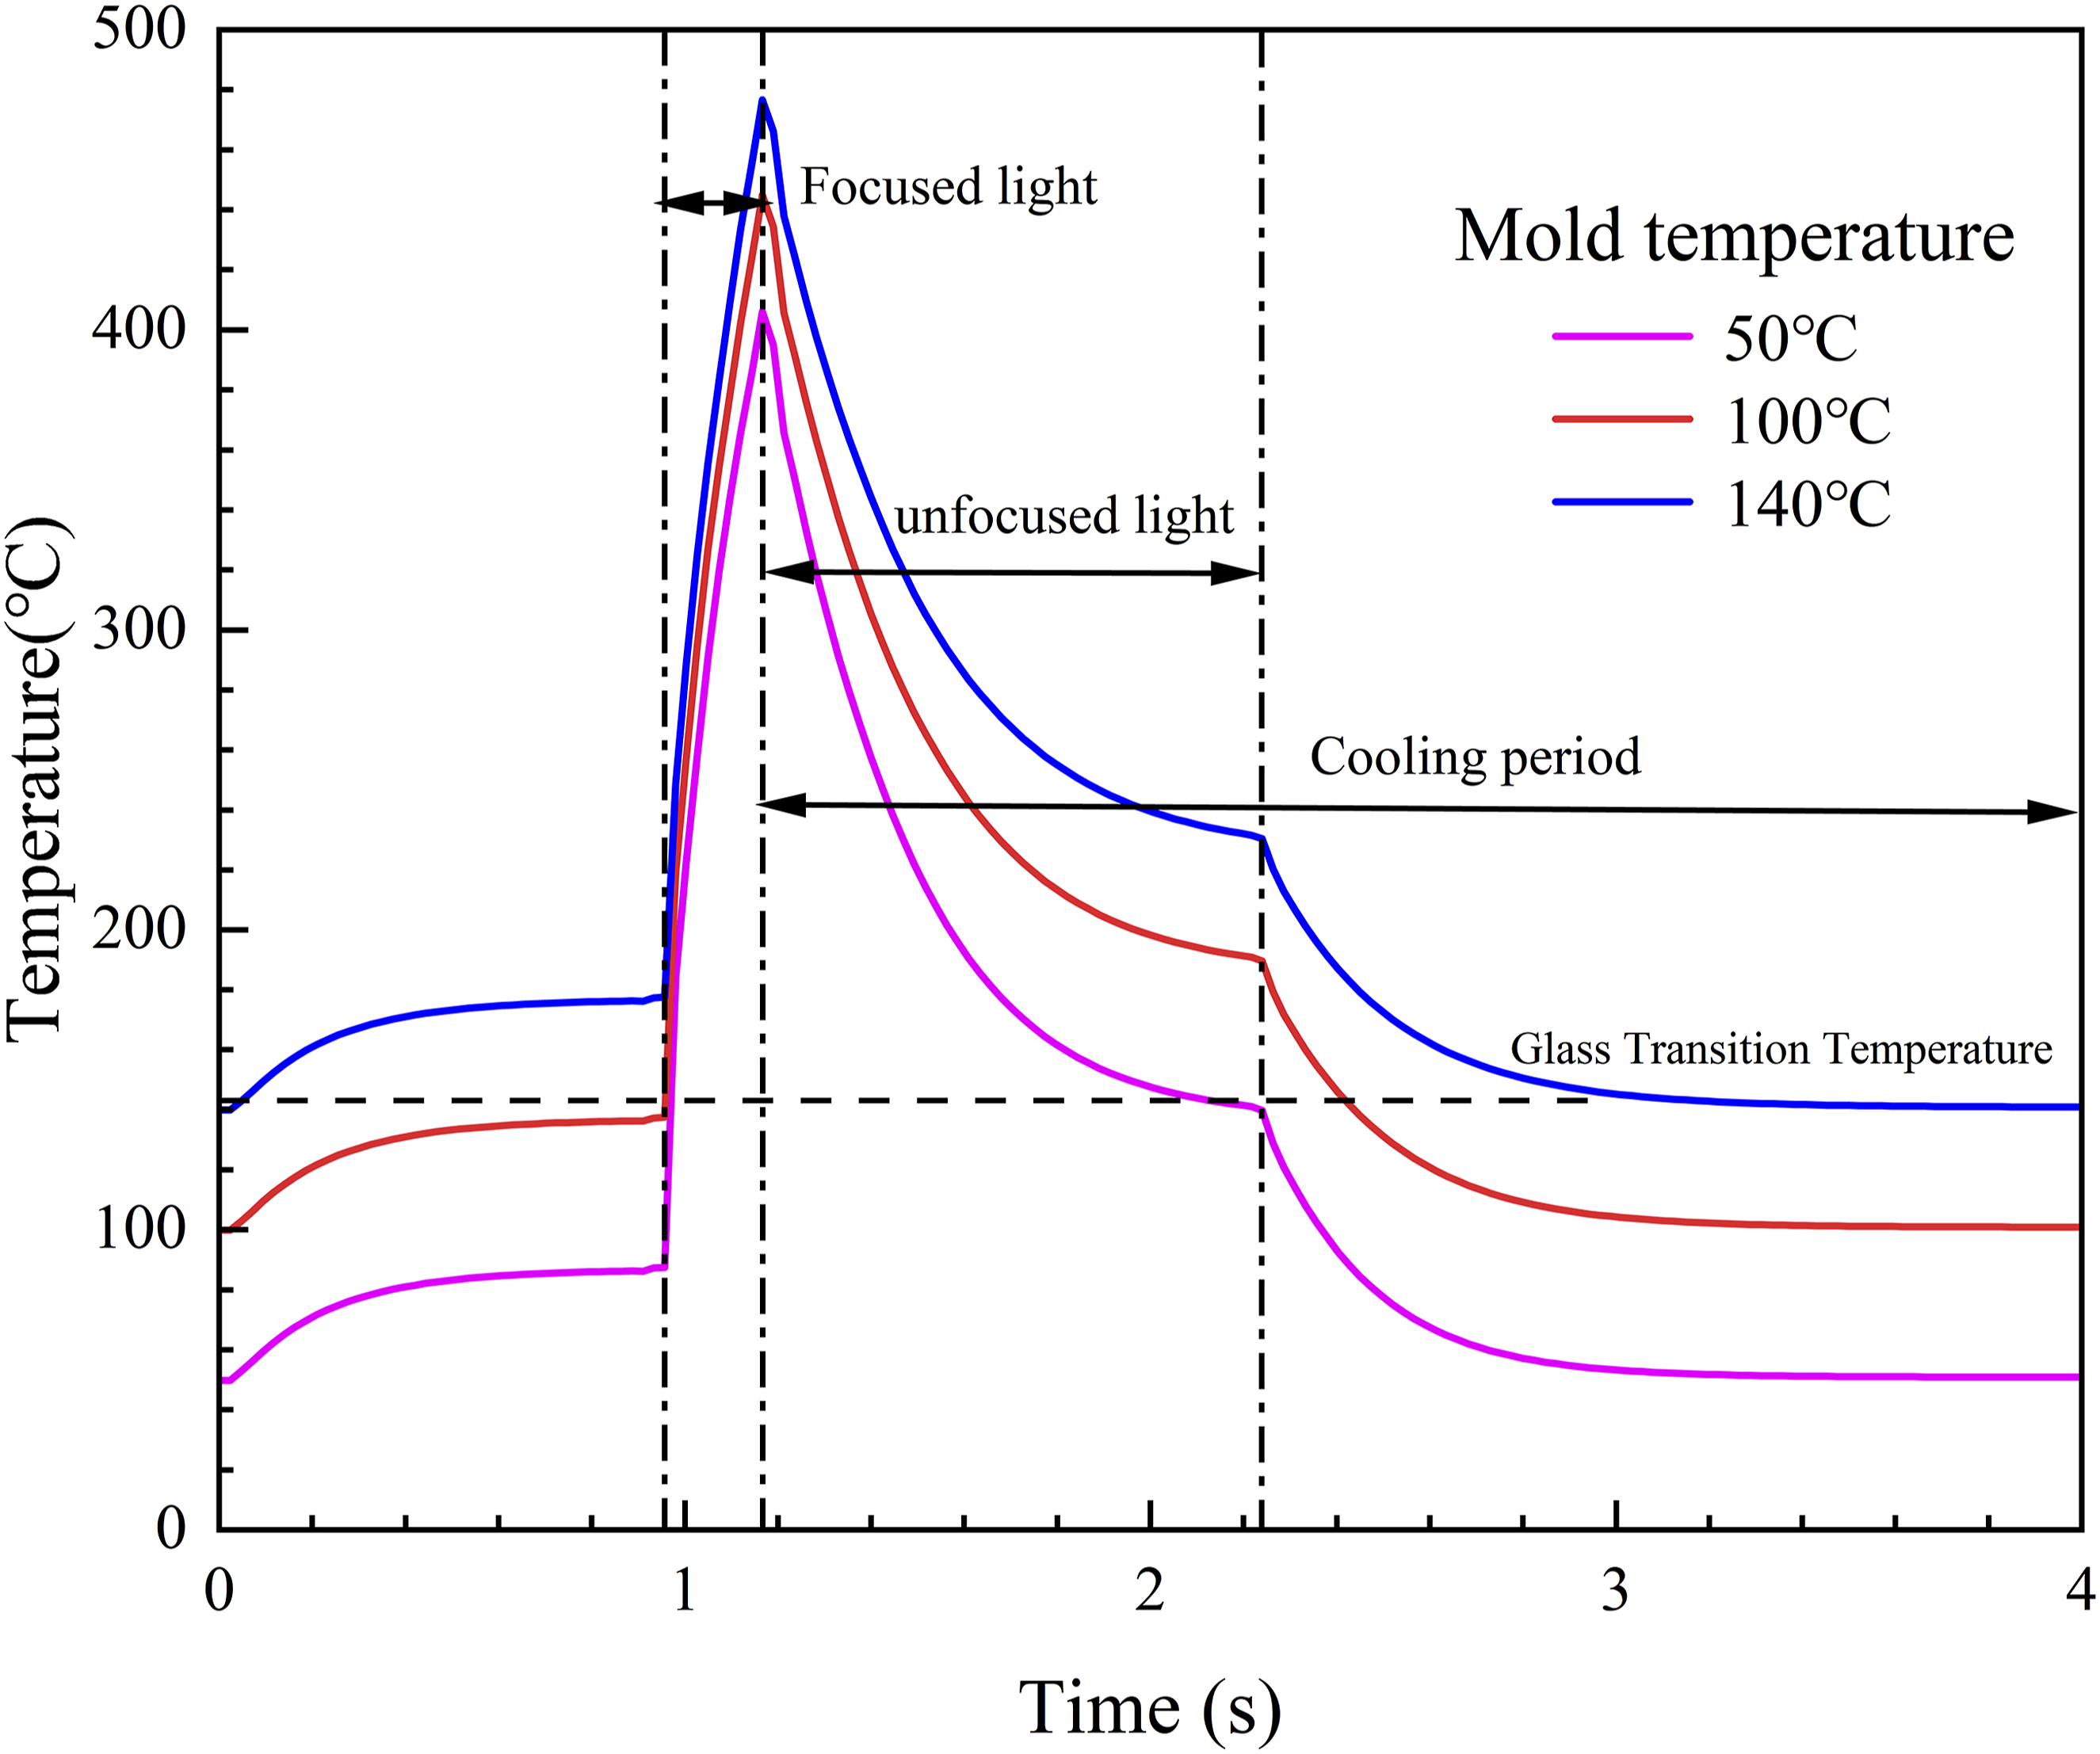
The interval between the glass transition temperature and the peak temperature was selected to calculate the cooling rate at temperature probe TP1. As the tooling temperature increased, it was observed that the cooling rate from the peak temperature to the glass transition temperature decreased. Specifically, when the tooling temperature was set at 50°C, the calculated cooling rate was 289°C/s, whereas this rate slowed to 168°C/s when the tooling temperature was raised to 140°C Furthermore when the tooling temperature exceeded 143°C, isothermal crystallization of the substrate occurred. This isothermal crystallization, sustained for a certain duration, enhanced the degree of crystallinity. This analysis highlighted the critical role that tooling temperature plays in modulating the cooling rate, which in turn affects the thermal properties and crystallinity of the thermoplastic composite layers.
Effect of laying speed and focused lamp power
LIRH power and laying speed are the two primary parameters of the automated laying process that directly influence the temperature field. To achieve optimal laying quality, it is essential to maintain the material temperature at a constant value during the layup process. The relationship between material temperature, laying speed, and LIRH power was established through finite element simulations. This section conducted a series of comprehensive simulation tests to investigate these interrelationships. Specifically, a tooling temperature of 50°C was used, while laying speeds of 10, 20, 25, 30, 35, 40, 45, 50, 60, and 80 mm/s were combined with LIRH powers of 140, 280, 420, 560, 700 ,840, 980, 1120, 1260, and 1400 W. A total of 100 simulation tests were performed to explore these dynamics, with the resulting relationships depicted in Figure 9. The correlation between material temperature, laying speed, and focused lamp power when the tooling temperature is 50°C.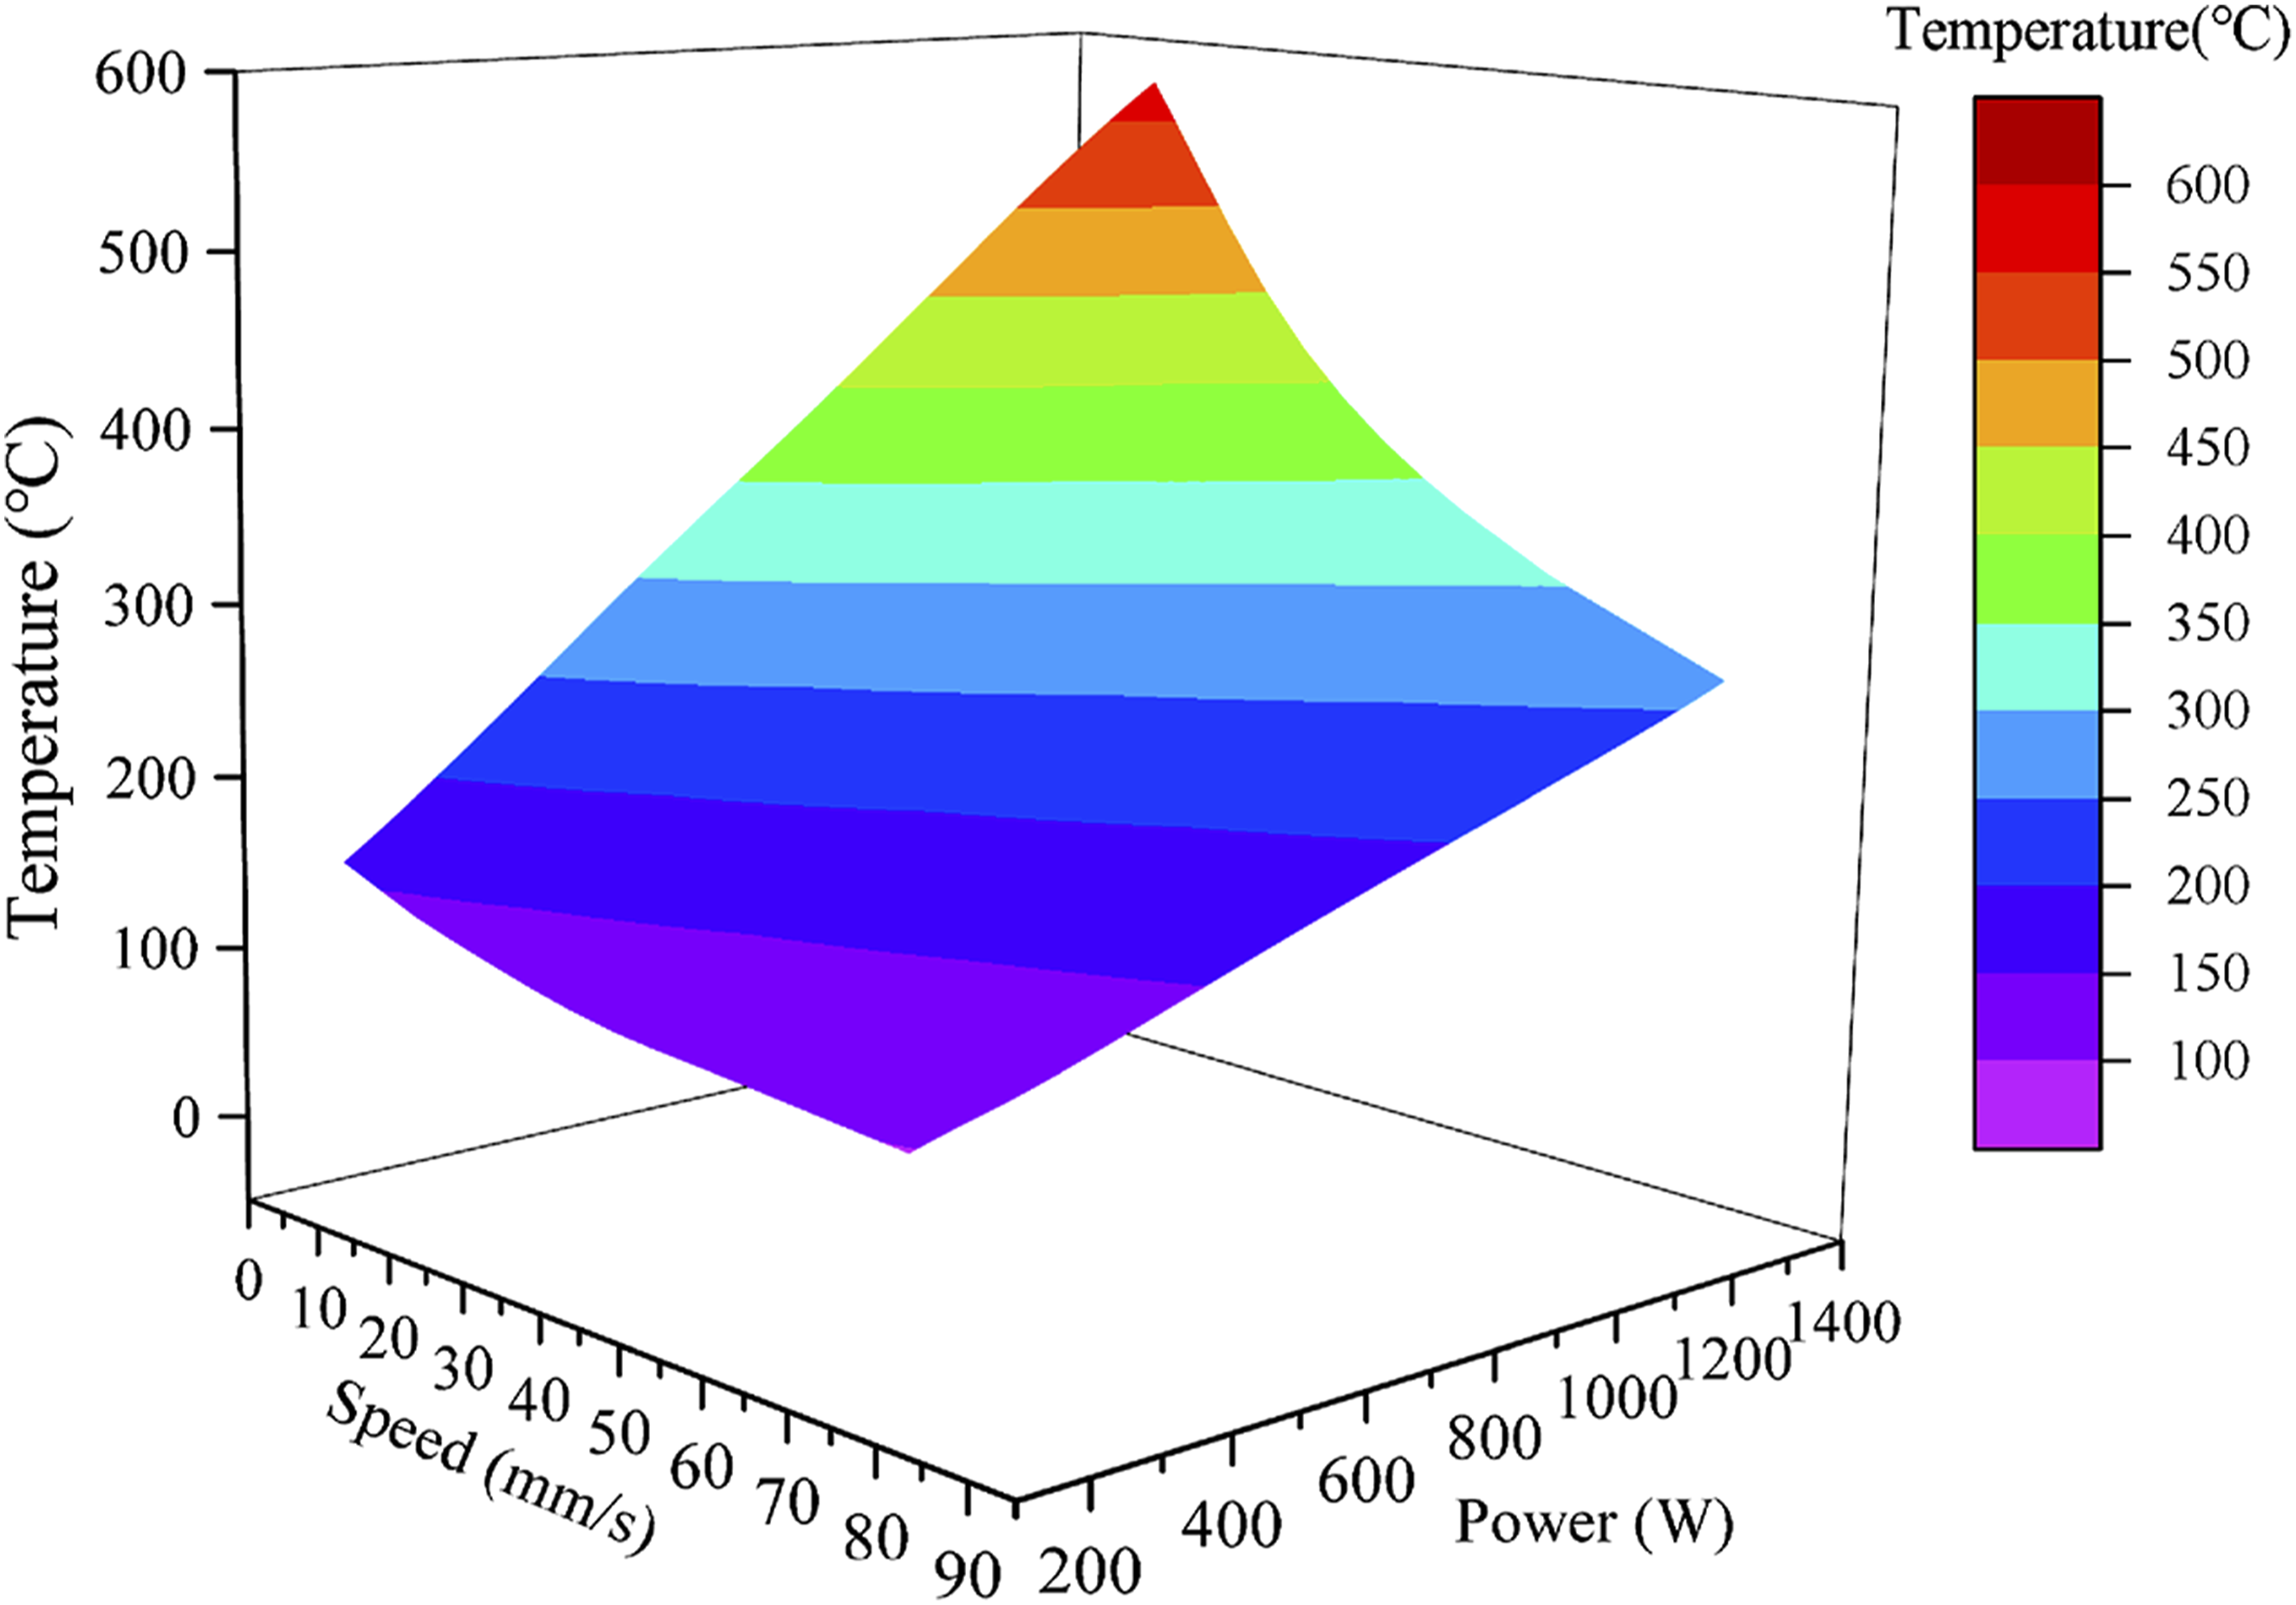
As the laying speed increased, the influence of LIRH power gradually diminished. At a laying speed of 10 mm/s, the temperature difference resulting from varying LIRH power was 400°C. In contrast, at a higher laying speed of 80 mm/s, this temperature difference decreased to only 150°C. At lower laying speeds, the prepreg had sufficient time to absorb heat, allowing for greater temperature variation with changes in LIRH power. From the finite element simulations, we concluded that when the focused lamp was operated at its maximum power of 1400 W, a laying speed of 40 mm/s was barely adequate to achieve the melting temperature of PEEK, but it did not reach the higher forming temperature necessary for optimal processing. Conversely, a laying speed of 30 mm/s was found to attain a more suitable forming temperature for the material.
Experimental verification of the temperature field
Experimental setup
An online temperature field measurement platform was developed to assess the changes in the temperature field during the placement of thermoplastic composite fibers with the assistance of LIRH. The temperature measurement platform consisted of a temperature sensor and an intelligent paperless recorder. The paperless recorder efficiently processes signals and stores relevant data for analysis. The temperature sensor utilized was a sheet-type K thermocouple, with the front end secured to the pavement using high-temperature tape, while the other end was connected to the paperless recorder. The experimental setup associated with the temperature field measurements is depicted in Figure 10. The Type K thermocouples (Model PB-HH-K-24) featured leads made of fiberglass and a metal shielding net. The diameter of the wire was 0.5 mm, while the outer diameter was 2.1*2.9 mm. The wire material was a nickel-chromium alloy, and the thickness of the sheet thermocouple was 0.15 mm. The temperature range of the paperless recorder (Model KPS04A0R) was −200 to 2400°C, with an acquisition time set at 0.1 seconds. Physical diagram of the online temperature field measurement system.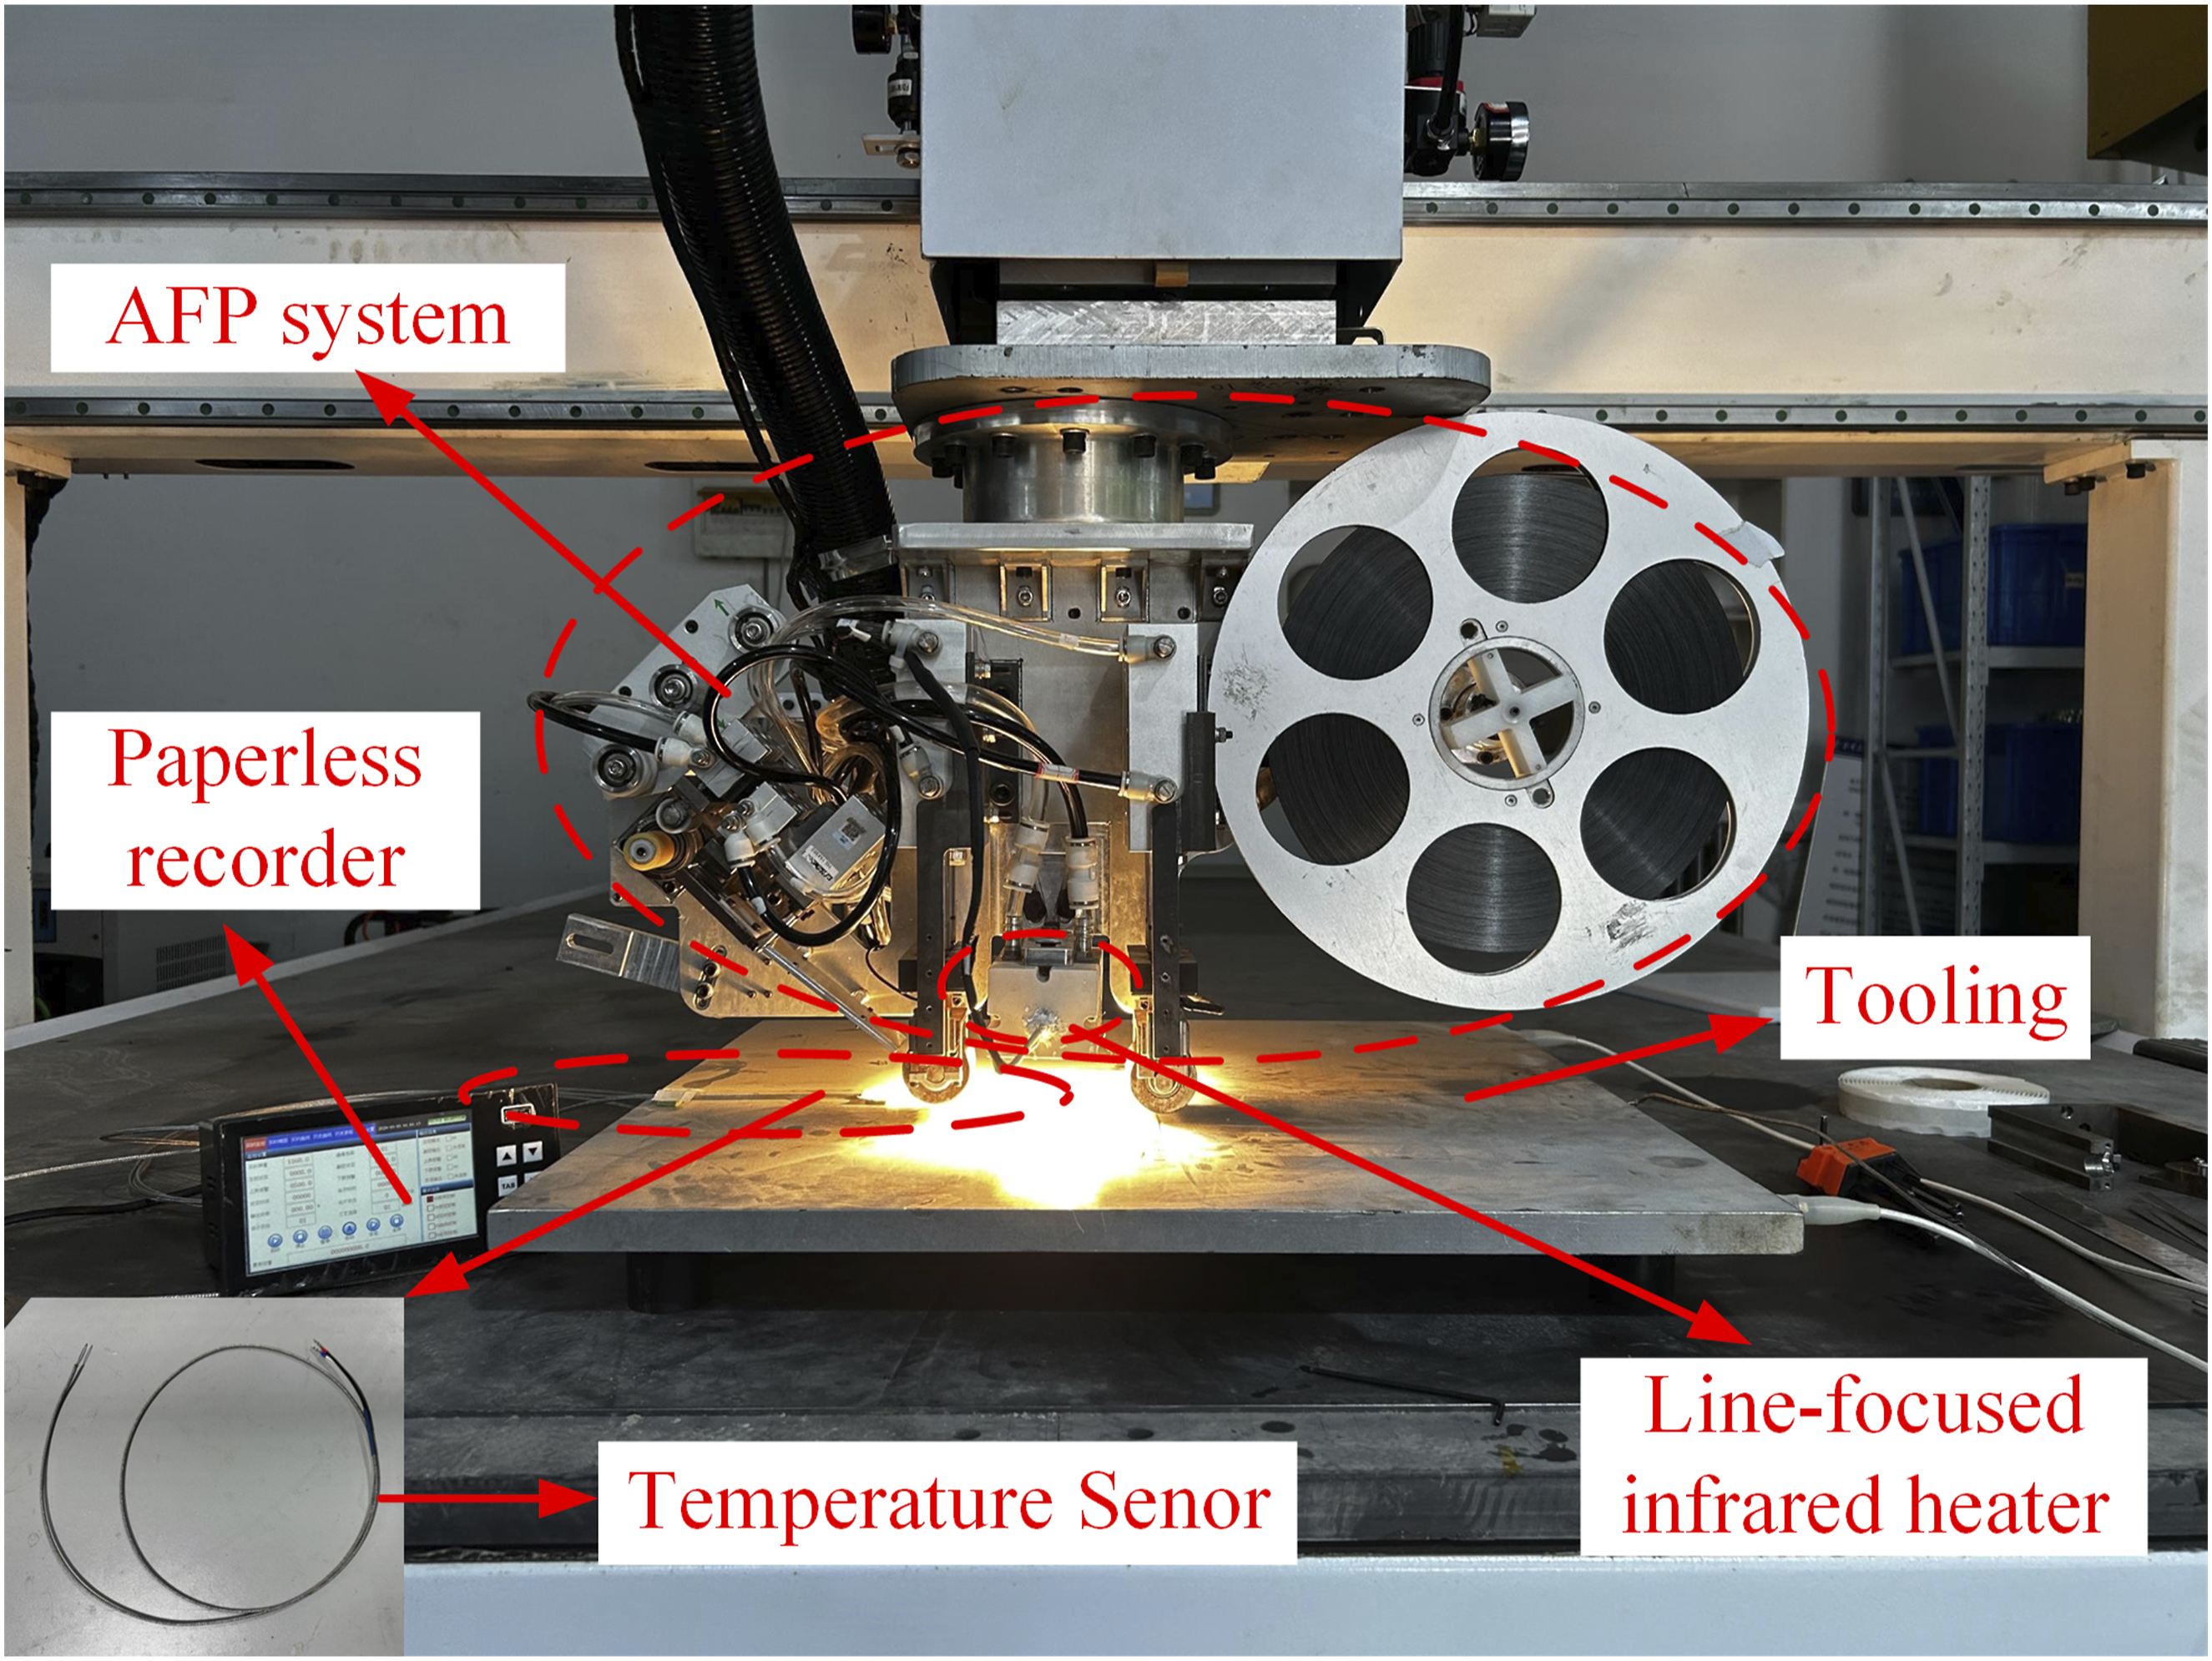
In this study, thermocouples were employed to measure the temperature field at various locations on the same pavement and on the upper surface of the first pavement layer during the layup of six layers. The investigation focused on the peak temperature under different laying speeds and infrared power settings, reflecting the unique characteristics of the LIRH system. Additionally, the effects of focused and unfocused light on the temperature field were explored. The material used in the experiments was CF/PEEK prepreg produced by Heng Bo Composites, which had a resin mass fraction of 34% ± 3%. Detailed parameters associated with the LIRH system are described in Section 2.
Results of the experiment
Thermal effects of unfocused light
The images captured by the focusing effect camera for the LIRH at focusing lengths of 5, 10, 15, and 20 mm are shown Figure 11. At a focusing length of 5 mm, the focused area was smaller, resulting in a stronger focusing effect. With a focusing length of 10 mm, the linear focusing effect became more pronounced; however, the heat flux at the focal point was slightly diminished. At a focusing length of 15 mm, the focusing effect began to deteriorate, leading to an increase in the extent of unfocused light. Finally, at a focusing length of 20 mm, the focusing effect was nearly imperceptible. Camera picture of focusing effect at focusing lengths of 5 mm(a),10 mm(b),15 mm(c),20 mm(d).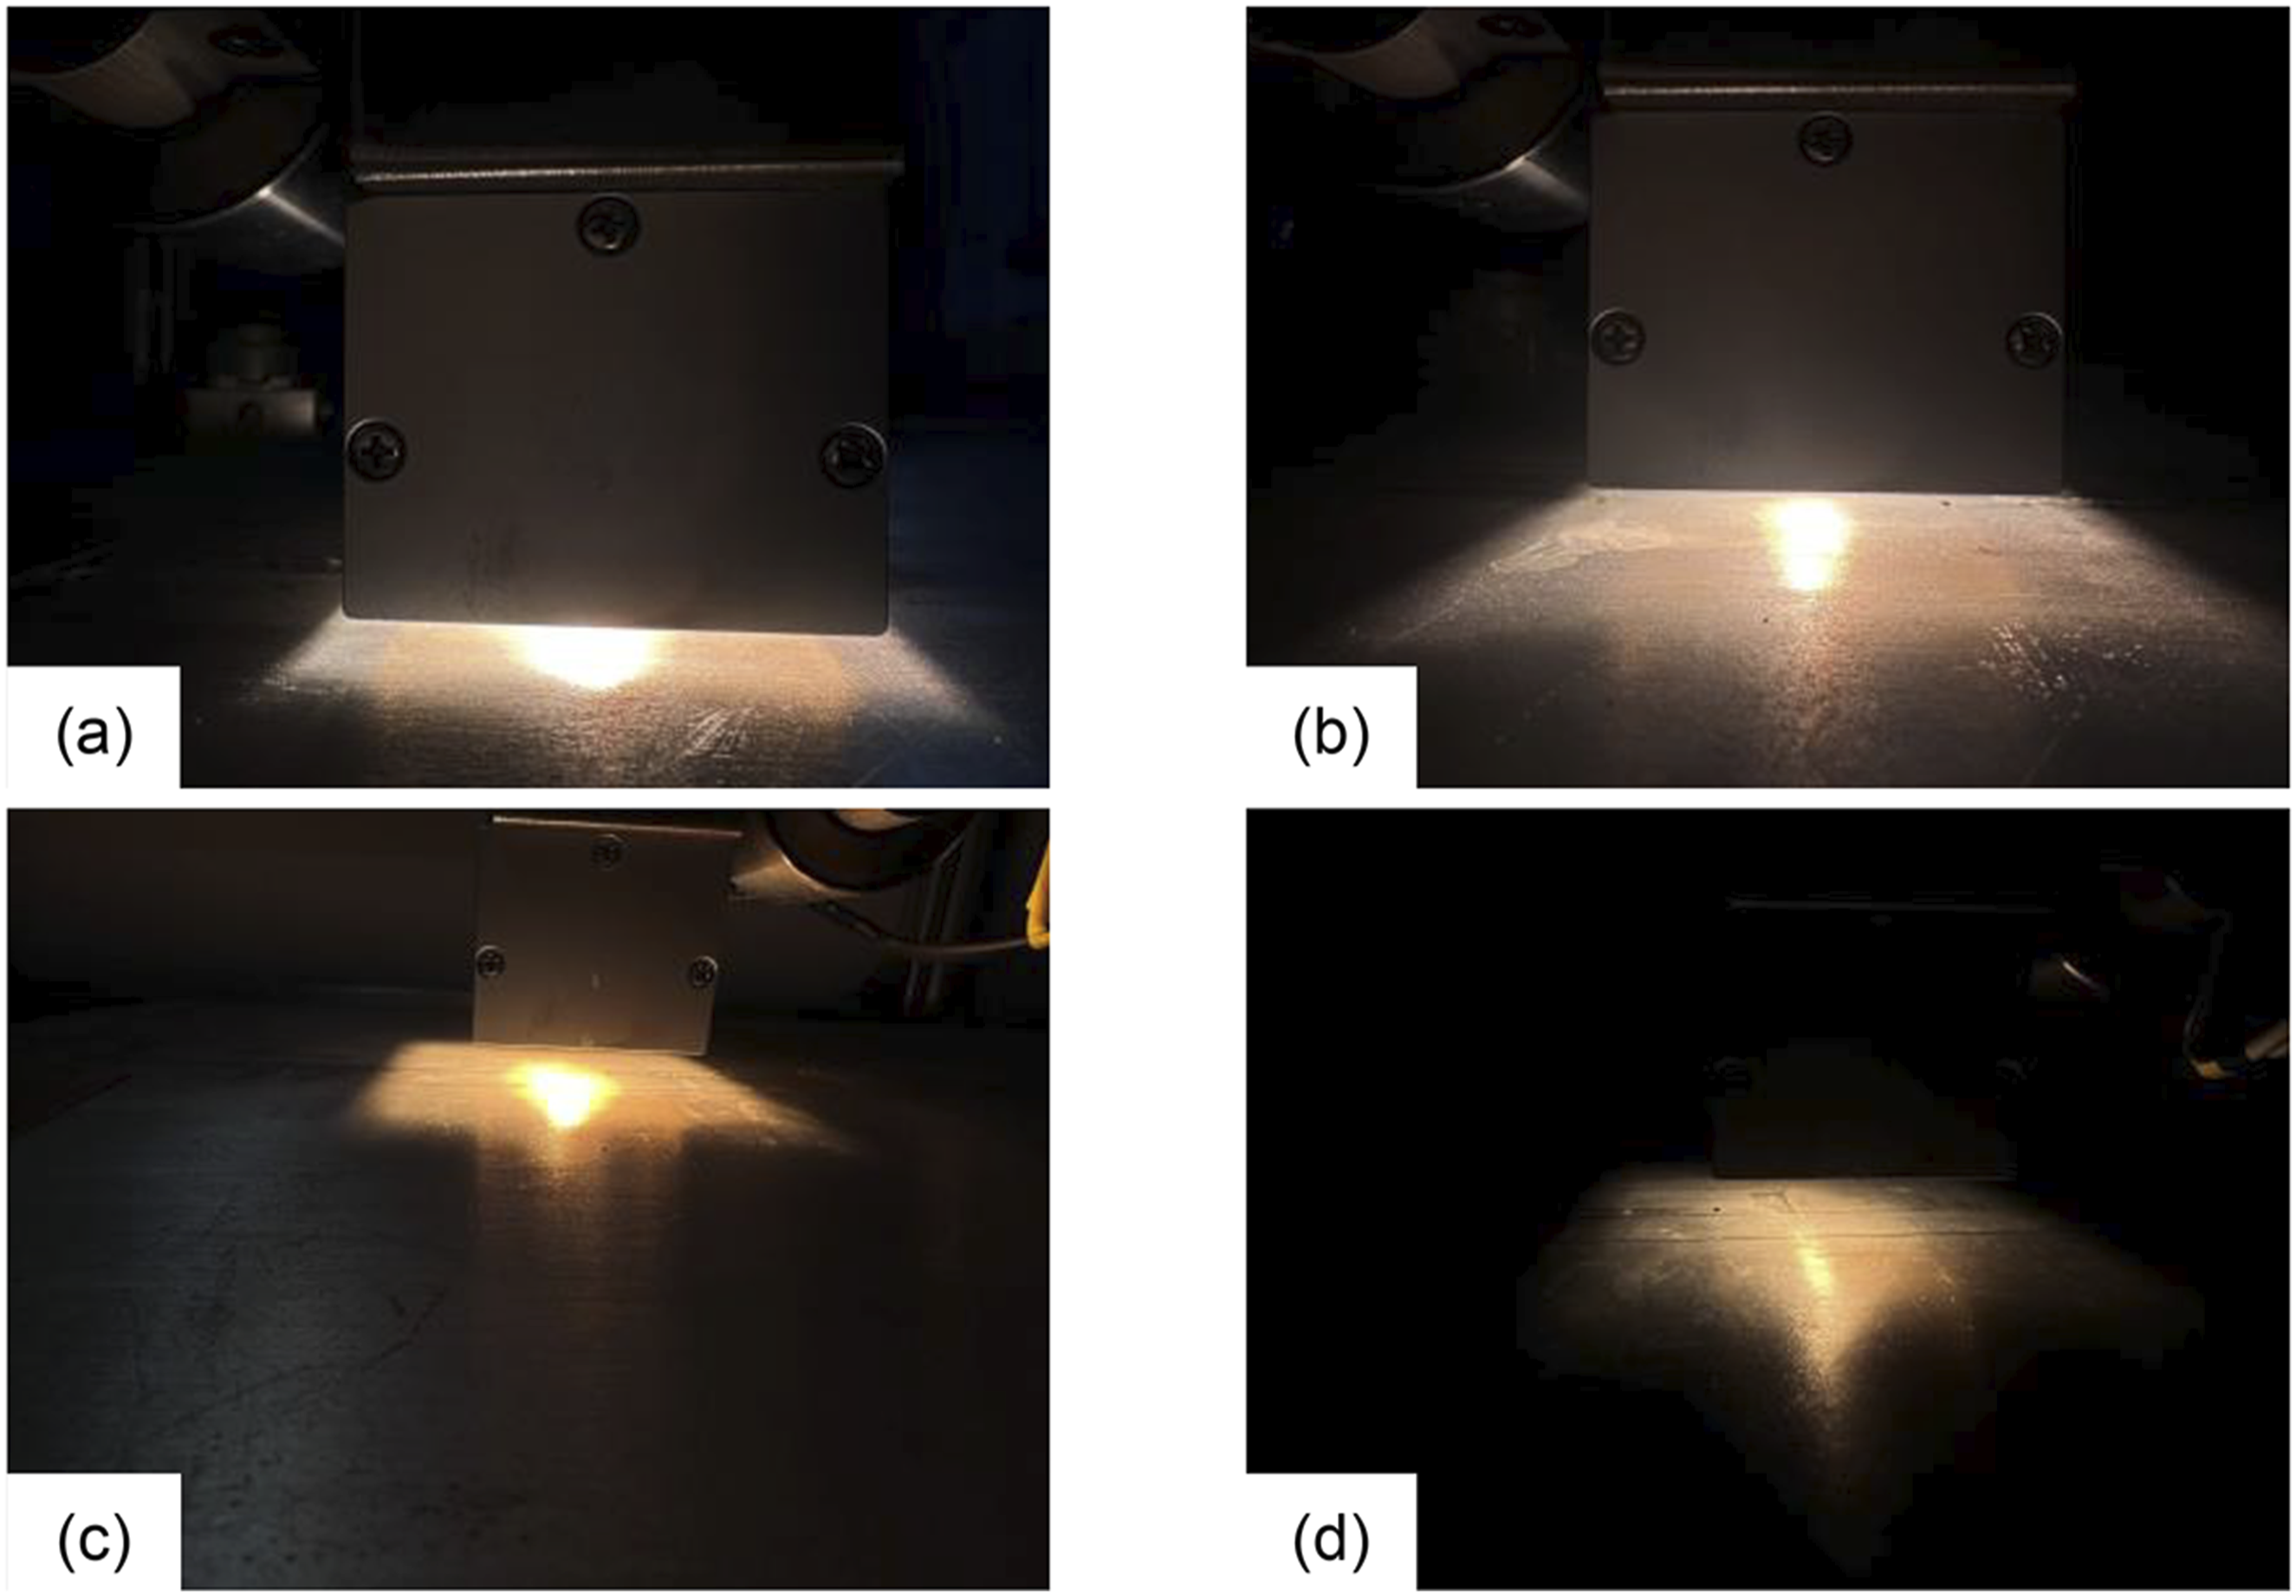
Figure 11 illustrates that the heating area of the LIRH was not limited to focused light; unfocused light also had the potential to affect the temperature field. To analyze the impact of unfocused light on the temperature field, thirteen sets of Type K thermocouples were arranged on the pavement with a spacing of 6 mm. The configuration of the temperature measurement devices is depicted in Figure 12. To ensure that the increased temperatures recorded by thermocouples TC1 through TC13 were due to unfocused light and not attributable to heat conduction from the prepreg tow in the focal area, each experimental trial measured the temperature at a single location. Layout of the focused infrared lamp.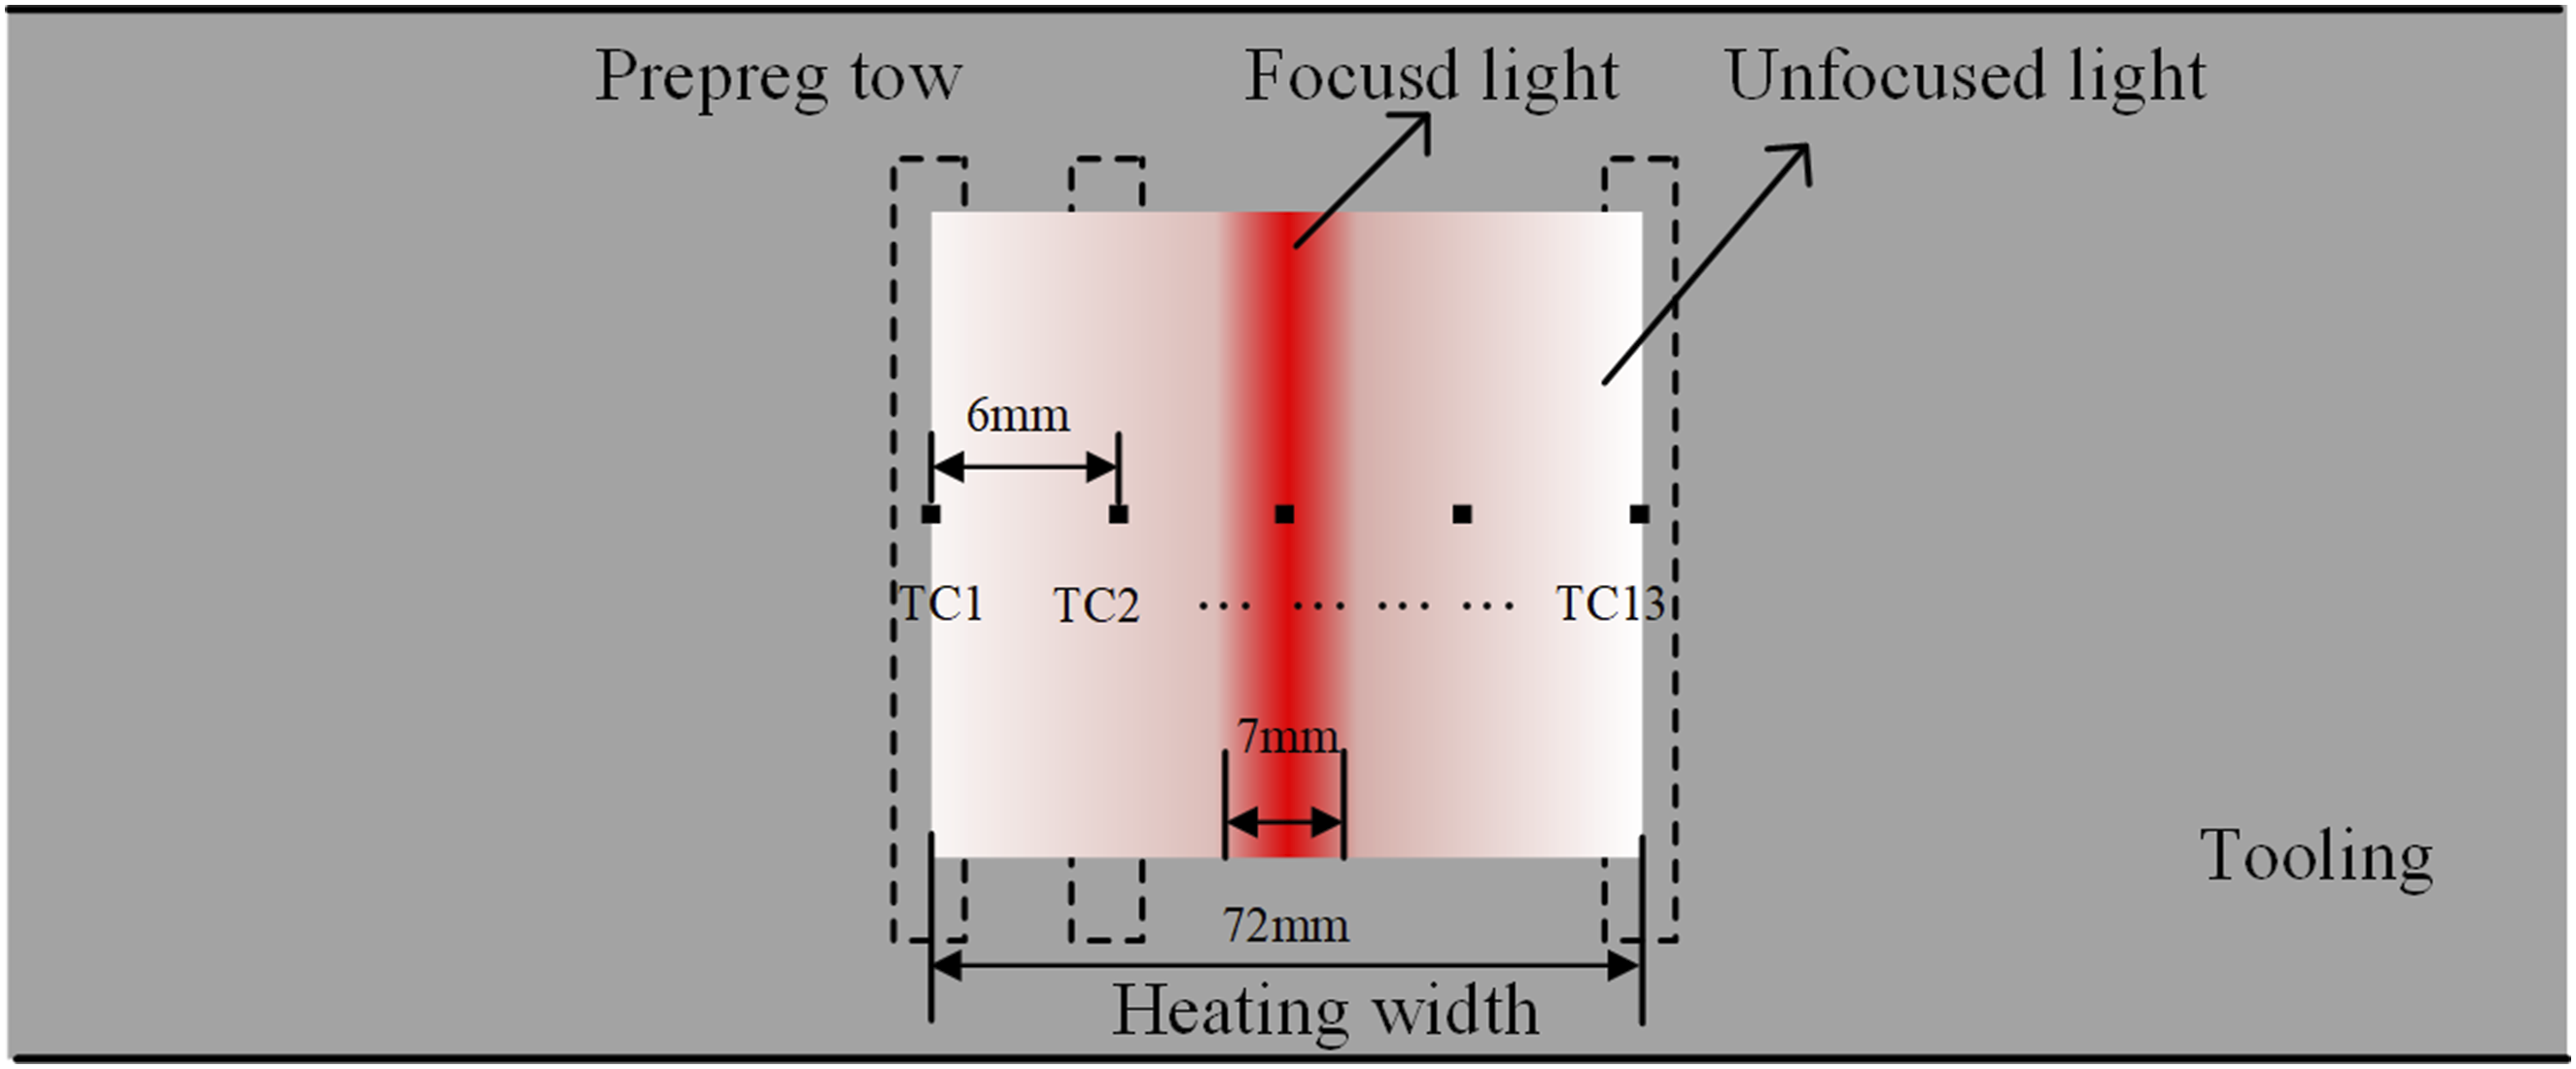
Figure 13 presents the experimental results of the LIRH at a focusing length of 10 mm. It is evident from the figure that the experimental results align with the characteristics of the LIRH system. The temperature in the focused area reached 416°C, while the temperatures in the unfocused area ranged from 50°C to 110°C. This indicates that the primary heating effect originated from the focused light, with a weaker heating effect resulting from the unfocused light. As the unfocused light moved away from the center of the focus, its heating effect diminished. These findings can serve as a reference for determining the numerical values of heat flux in simulations. Temperature distribution on prepreg tow at the focusing length of 10 mm.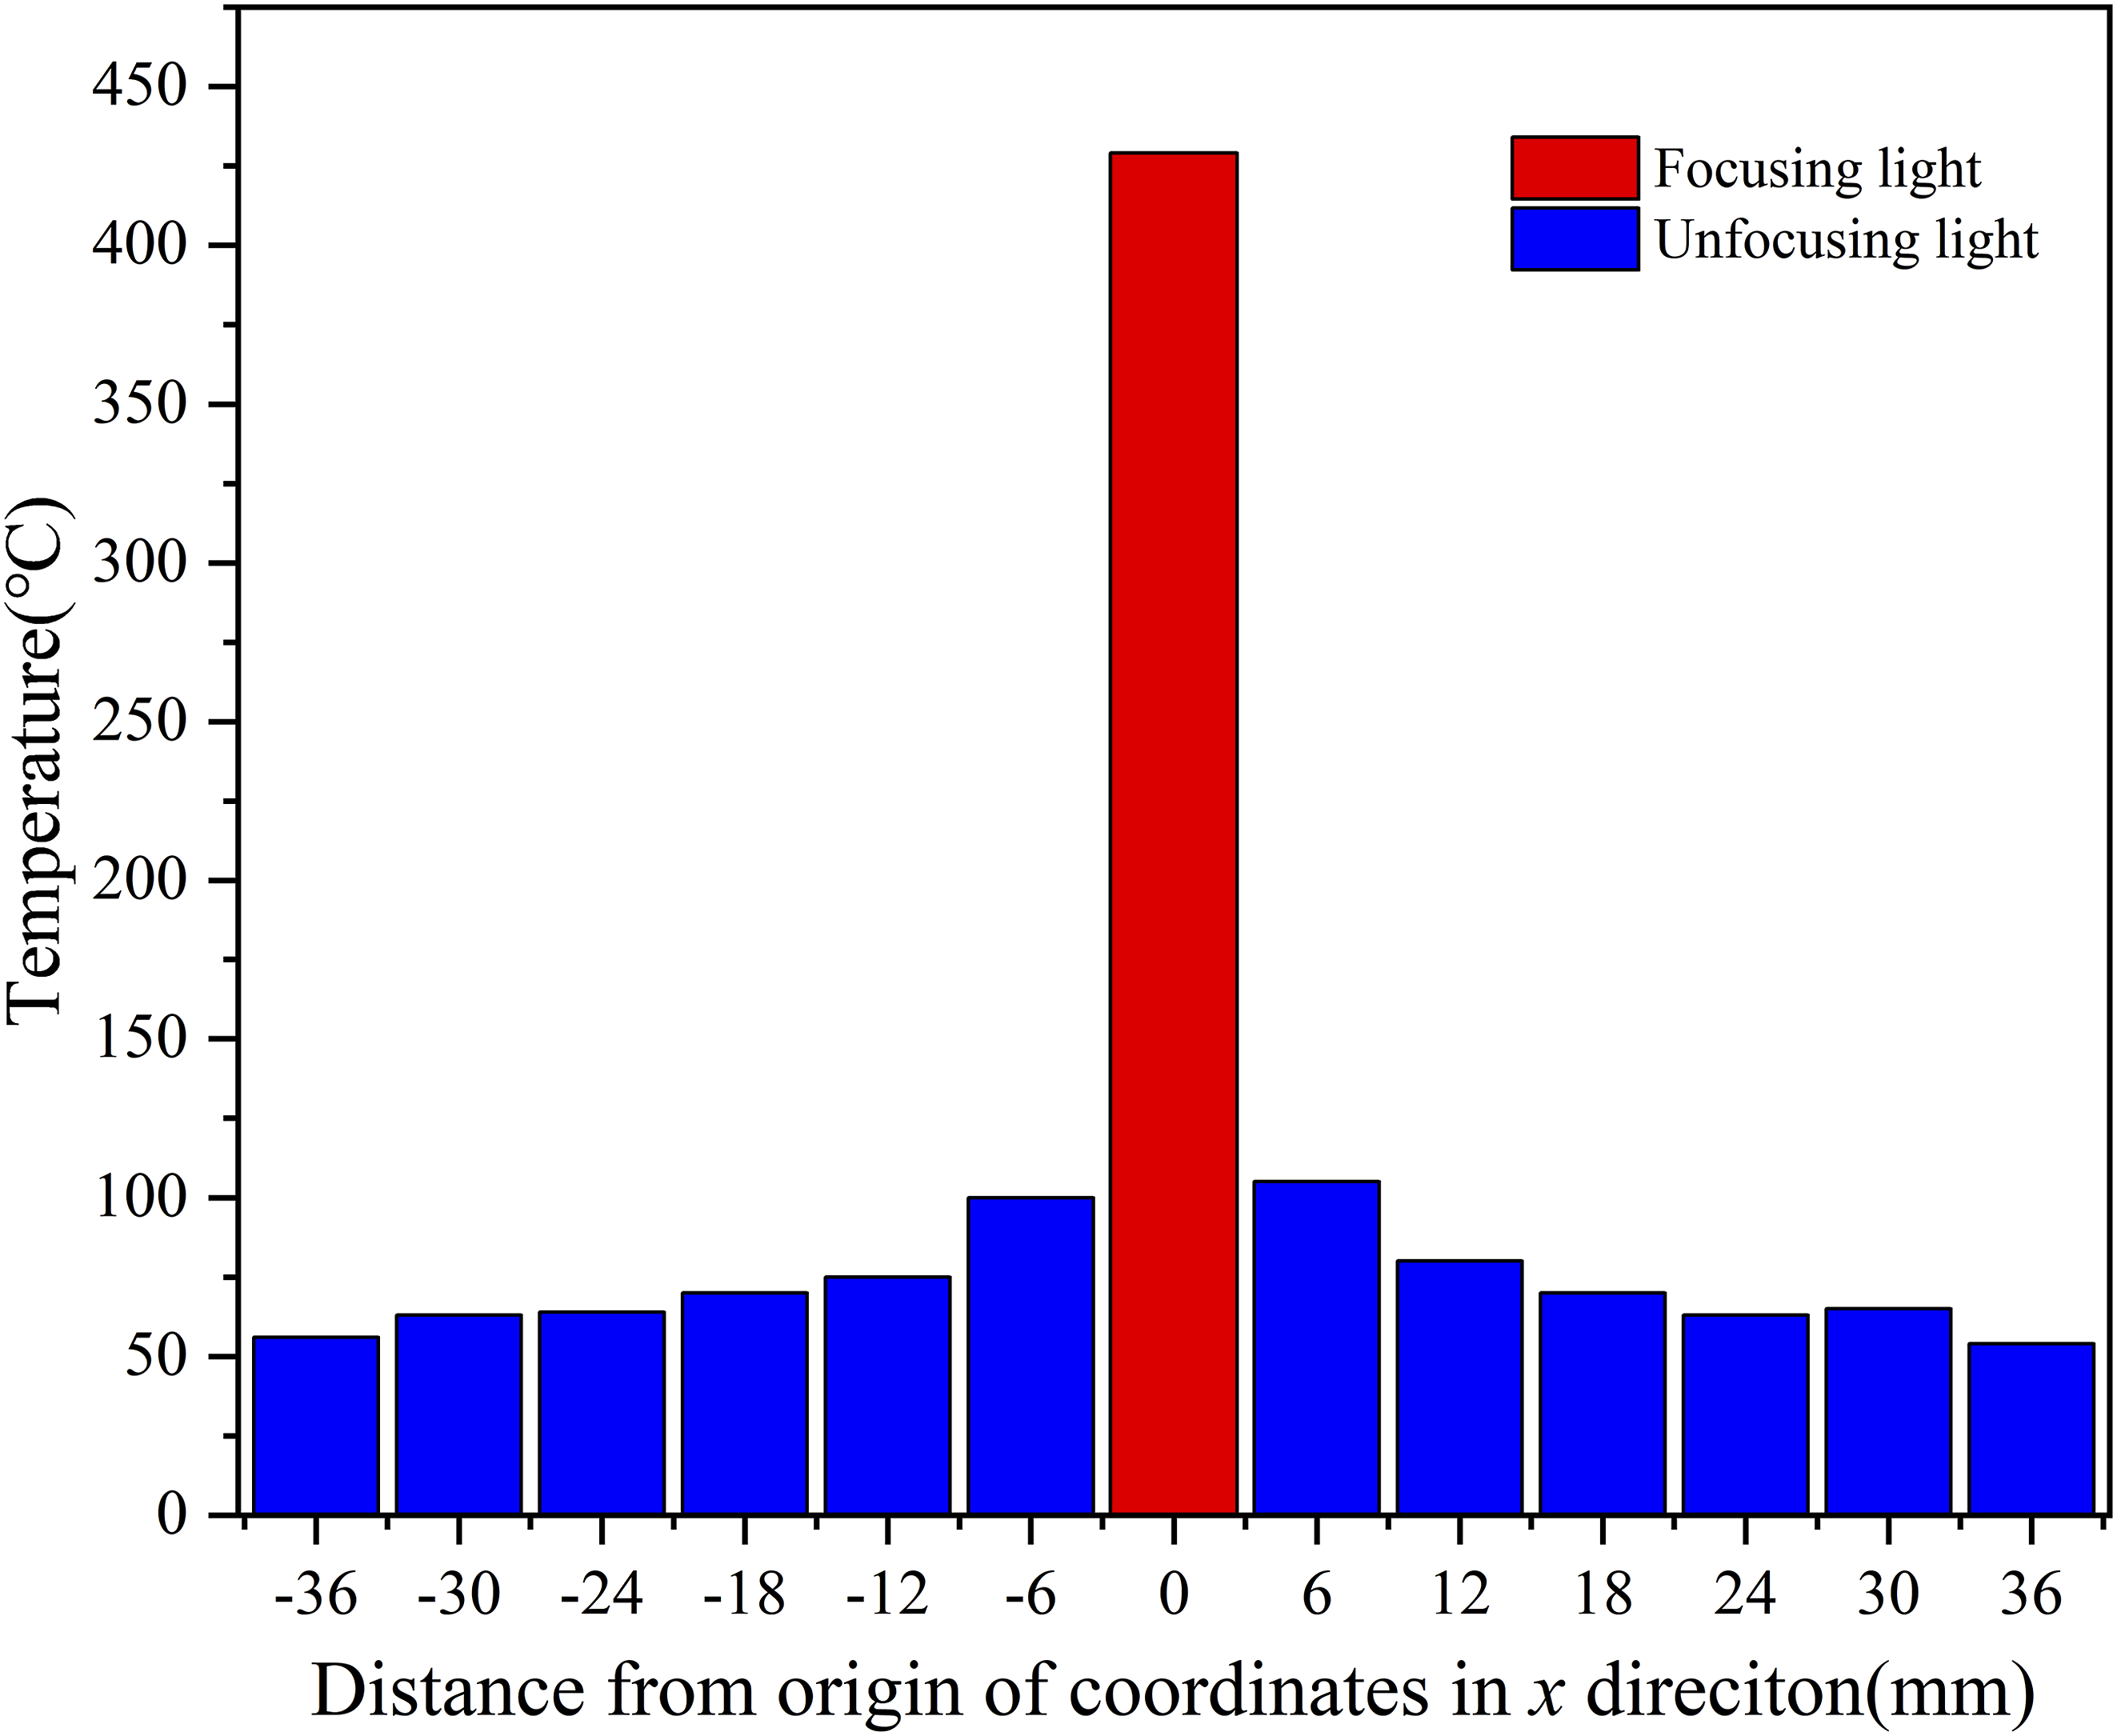
Rapid response is essential for temperature control during variations in speed. 42 When the power of the IR heater is increased from 0 W to 1400 W, the thermocouple records a temperature of 416°C in 0.9 seconds. Once the IR heater stabilizes its output at 1400 W, a temperature of 400°C is reached in 0.2 seconds. A rough estimate of the maximum response time of the line-focused IR heater is approximately 0.7 seconds. This response time accommodates the low-speed variations encountered during layup.
Effect of laying speed and lirh power on the temperature field
Considering laying speeds ranging from 20 mm/s to 80 mm/s, with the maximum LIRH power set at 1400 W and tooling temperature maintained at 50°C, the relationship between peak temperature of the second layer and laying speed was analyzed. As illustrated in Figure 14(a), it can be concluded that the peak temperature of the pavement decreases as the laying speed increases. In the simulation, an increase in laying speed from 20 mm/s to 30 mm/s resulted in a significant reduction in peak temperature of approximately 90°C. Conversely, when the laying speed increased from 70 mm/s to 80 mm/s, the peak temperature of the pavement only decreased by about 20°C. However, the experimental data did not exhibit the same clarity of trend as the simulation results. Notably, the experimental measurements were consistently lower than the simulated values, particularly at higher laying speeds. This discrepancy may be attributed to several factors. The thermocouples may exhibit hysteresis, and data were sampled at relatively large intervals. At higher laydown speeds, the duration of exposure to the focused light at the thermocouple collection points was reduced, leading to a lag in the thermocouples’ response to temperature changes. Additionally, the paperless recorder encountered difficulties recording the instantaneous fluctuations in thermocouple temperature. These factors likely contributed to the observed lower experimental values compared to the simulation predictions at elevated laying speeds. The influence of infrared power and speed on the peak temperature of the second layer. (a)Comparison of the peak temperature under different speeds. (b) Comparison of the peak temperature under different LIRH power.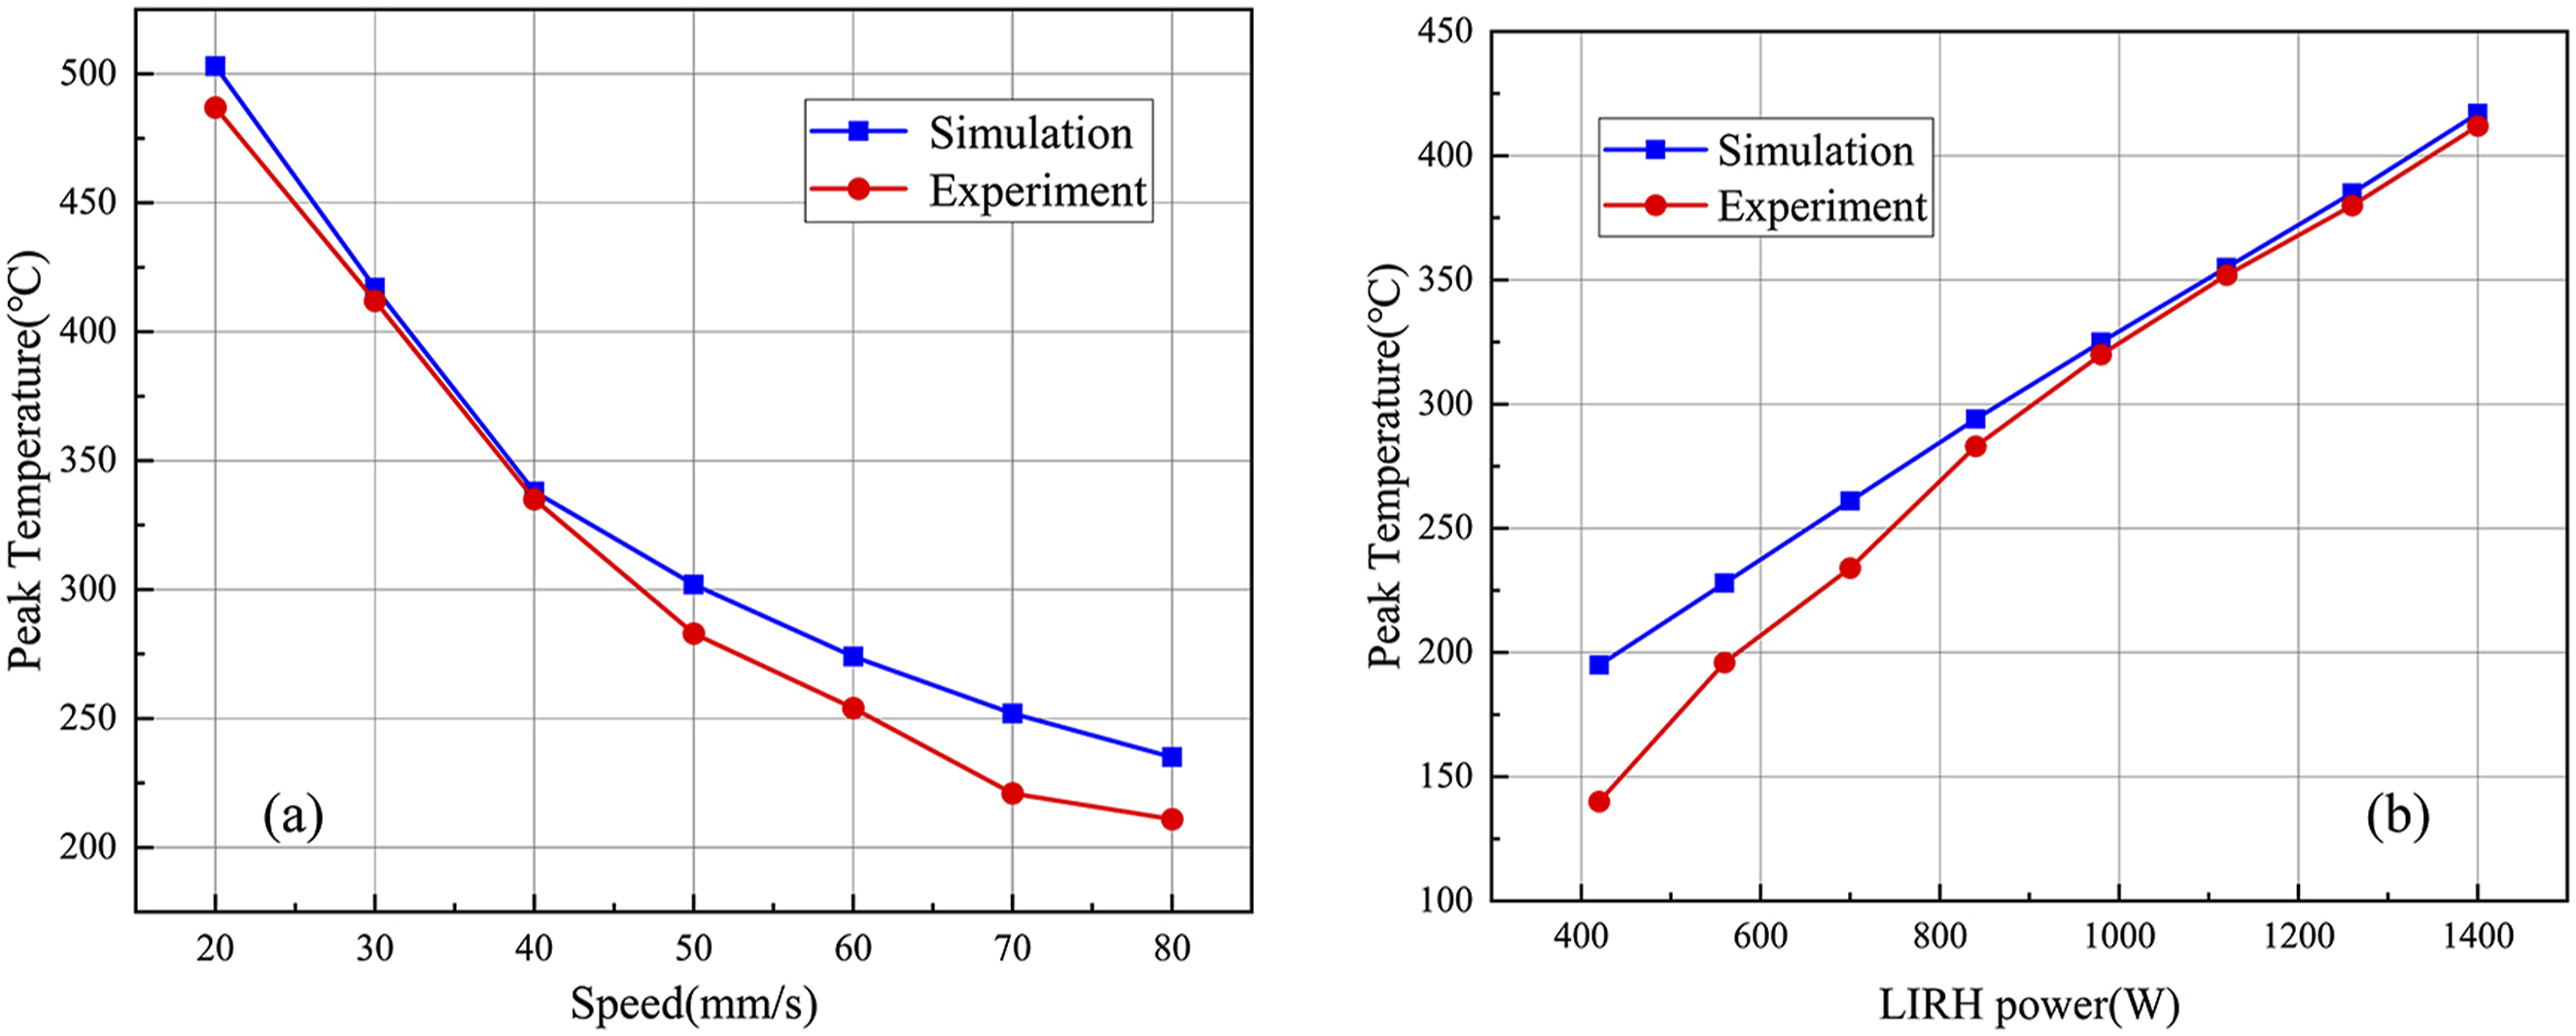
In the case of LIRH power ranging from 420 W to 1400 W, with a consistent speed of 30 mm/s and a tooling temperature maintained at 50°C, the relationship between peak temperature of the second layer and LIRH power was illustrated Figure 14(b). At higher power levels, the experimental measurements aligned well with the simulation results. However, discrepancies were observed at lower LIRH power levels. A significant factor contributing to this mismatch was the variable resistance of the tungsten filaments in line-focused infrared heaters, which changed with increasing temperature. This variation led to a nonlinear relationship between heating power and temperature peaks, particularly affecting the accuracy of predictions at lower power settings. Understanding this nonlinearity was crucial for improving the correlation between experimental data and simulation outcomes across the range of LIRH power.
Heat transfer between layers
Setting the LIRH power to 1400 W, with a speed of 30 mm/s and a tooling temperature of 50°C, we compared the simulation results of the temperature field of the first layer throughout the laying process with the experimental measurements. Figure 15(a) illustrates the temperature history of the bottom surface as the heater passes over the first layer. As observed in the figure, the heating phase of the experimental results aligns well with the simulation data. Notably, the cooling rate significantly slowed down as the experimental temperature decreased from the peak to 100°C, which corresponds with the trend observed in the simulation results. However, discrepancies were noted between simulation and experimental data. Several factors may have contributed to these differences. First, the focusing distance of the LIRH influenced the heat flux distribution; even minor errors could result in inaccurate heat flux assessments. Second, the thermocouple sampling interval of 0.1 seconds posed challenges in accurately capturing the temperature values during the rapid heating and cooling phases. Consequently, the thermocouple may not have adequately tracked the instantaneous changes in temperature, thereby affecting the measurement of heating and cooling rates. Third, while the simulation incorporated interlayer thermal resistance based on existing literature, the actual contact thermal resistance is influenced by the degree of surface contact, surface roughness, and transverse thermal conductivity.
43
An inaccurate setting of contact thermal resistance can also result in errors. (a) The heating and cooling history in the first layer (b) The peak temperature of the first layer from the first to sixth layer under different interlaminar contact conditions. (c) Temperature history of the 1st layer during automated fiber placement (d) Temperature history of the 2nd layer during automated fiber placement.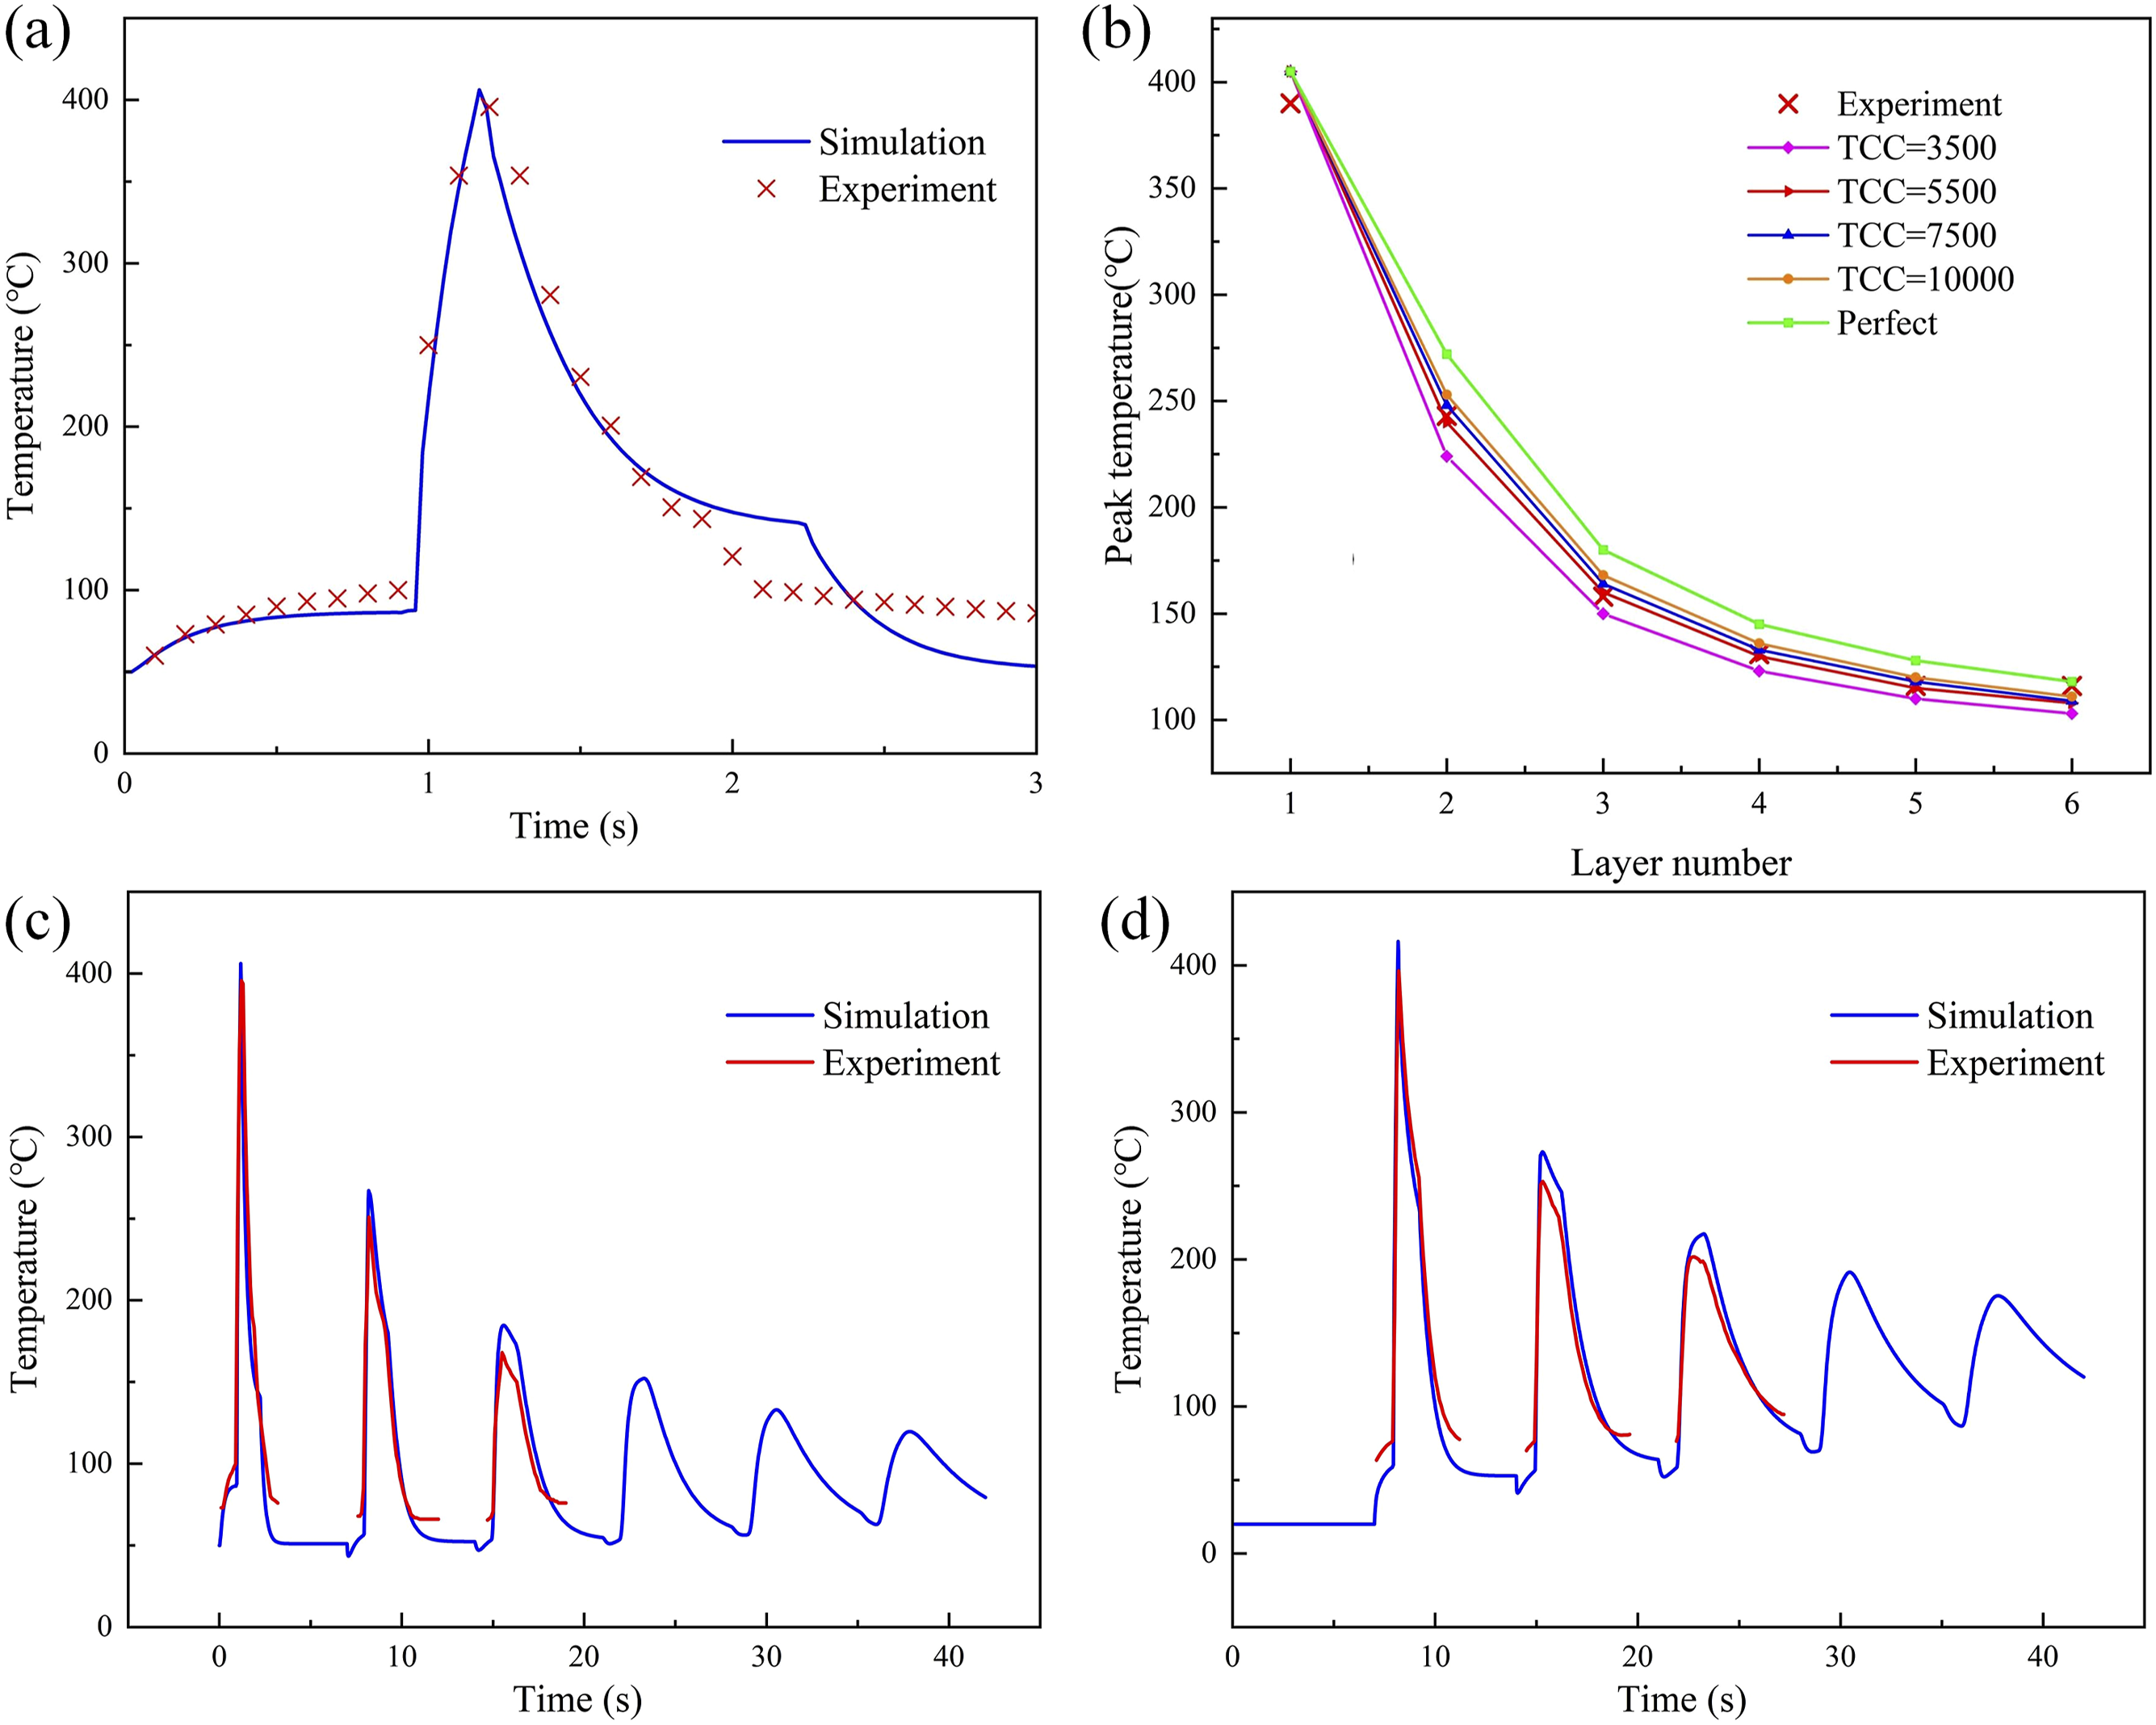
In the present study, thermal conductivity coefficients (TCC) of 3500, 5500, 7500, 10000 W/(m2·K) and perfect contact are considered. Figure 15(b) displays the peak temperature of the first layer as the heater moves through the first to sixth layers under varying interlaminar contact conditions. A high contact heat transfer coefficient results in a higher temperature in the first layer. It is evident that contact thermal resistance hinders heat transfer in the thickness direction, resulting in a reduction in peak temperature. Contact thermal resistance is a critical factor influencing interlayer heat transfer and is significantly affected by the degree of intimate contact. 38 In future work, intimate contact will be considered in automated placement, with a focus on simultaneously solving for heat transfer and the evolution of intimate contact.
Figure 15(c) and (d) illustrate the temperature profiles of the first and second layers of prepreg tows throughout the layup process. As shown in the figures, the simulated and experimental temperature histories exhibit similar trends. However, the post-cooling temperature values in the experiments gradually increase with the number of layup layers. This phenomenon can be attributed to the continuous heating of the surrounding air by infrared radiation and the tool, which reduces the temperature difference between the tows and the ambient environment. Additionally, the exothermic crystallization of the matrix also affects the cooling rate and the ambient temperature of the surrounding environment. The current model does not account for these factors, leading to certain discrepancies in the results.
Conclusion
In this study, the variations in the temperature field during fiber placement were investigated using the LIRH with CF/PEEK as the primary material of interest. The influence of various process parameters on the transient temperature field was thoroughly analyzed. A two-dimensional heat transfer model of the automated layup process was developed, with its boundary conditions established based on heat transfer theory. A continuous dynamic finite element analysis of the layup model was conducted using ANSYS to examine the temperature distribution under the specified heating parameters of the LIRH and to derive a range of temperature values corresponding to different process settings. Through both experimental and finite element method simulations, the following conclusions can be drawn: (1) Material temperatures of CF/PEEK can reach up to 400°C, achieved by utilizing an infrared heater with a laying speed of 30 mm/s, an infrared power of 1400W, and a tooling temperature of 50°C. (2) The finite element analysis revealed that an increase in tooling temperature leads to a reduction in the cooling rate, while unfocused light can also contribute to a decrease in the cooling rate. (3) Experimental results demonstrate that focused light significantly elevates the surface temperature of the material, whereas unfocused light exhibits a minimal heating effect.
This work highlights the feasibility of using LIRH as a primary heating method for applications in AFP from the perspective of the temperature field. Future research will aim to provide a comprehensive and integrated characterization of the properties of the resulting products based on this heating method.
Footnotes
Author contribution
All authors contributed to the study conception and design, all authors commented on previous versions of the manuscript, and all authors read and approved the final manuscript.
Declaration of conflicting interests
The author(s) declared no potential conflicts of interest with respect to the research, authorship, and/or publication of this article.
Funding
The author(s) disclosed receipt of the following financial support for the research, authorship, and/or publication of this article: This work was supported by the National Natural Science Foundation of China [grant number 52075361]; Shanxi Province Science and Technology Major Project [grant number 20201102003]; Shanxi-Zheda Institute of Advanced Materials and Chemical Engineering [grant number 2022SX-TD021]; Lvliang Science and Technology Guidance Special Key R\&D Project [grant number 2022XDHZ08].
Data Availability Statement
Date will be made available on request.