
Abstract
Long fibre thermoplastic (LFT) materials are employed in a diverse group of engineering applications, and this usage makes it critical to understand how various loading and environmental settings affect the mechanical properties of LFT materials. In this study, the tensile properties of direct-compounded, compression-moulded glass/PA6 with 30% and 45% fibre content and carbon fibre-reinforced thermoplastic (LFT-D) materials were investigated, along with shear properties for glass fibre-reinforced LFTs. Additionally, the tensile and shear properties of glass/PA6 in four different material directions of 0°, 45°, −45°, and 90° were also examined. The results of this study revealed that carbon/PA66(40%) exhibited 67% and 45% higher tensile strength compared to glass/PA6(30%) and glass/PA6(45%), respectively. The behaviour of the glass/PA6 material shifted from brittle to ductile under tension and shear loads when exposed to moisture, regardless of the percentage of fibre content. Notably, the tensile toughness of the glass/PA6 material exhibited a significant increase of up to 230% in specific material configurations from dried to undried samples. The findings of this study will assist in the selection of the optimal LFT material for use in desired loading and environmental conditions and can serve as input for the numerical modelling of these composite materials.
Introduction
In the ever-changing world of modern industry, advancements demand the need for innovative materials that offer enhanced properties and affordability. Composite materials offer cost-effective production advantages stemming from enhanced material efficiency, reduced waste generation, lower transportation expenses, automated manufacturing processes, and extended operational lifespan.1–5 These synthetic materials are used across various fields, including civil construction for buildings and bridges, the automotive industry for vehicle components, aerospace engineering for wings and thermal panels, marine engineering for ships and boats, and the biomedical and healthcare sectors for prosthetic devices.6–11
Fibres play a vital role in composites, functioning in either continuous or discontinuous forms to improve the material’s mechanical properties. Made from high-performance materials like glass, carbon, or natural fibres, these constituents resist external forces and contribute to the composite’s strength. Key factors like fibre orientation, type, diameter, and volume fraction influence the composite’s properties, requiring specific application consideration.12–16 Directionality is essential for both continuous and discontinuous composites.
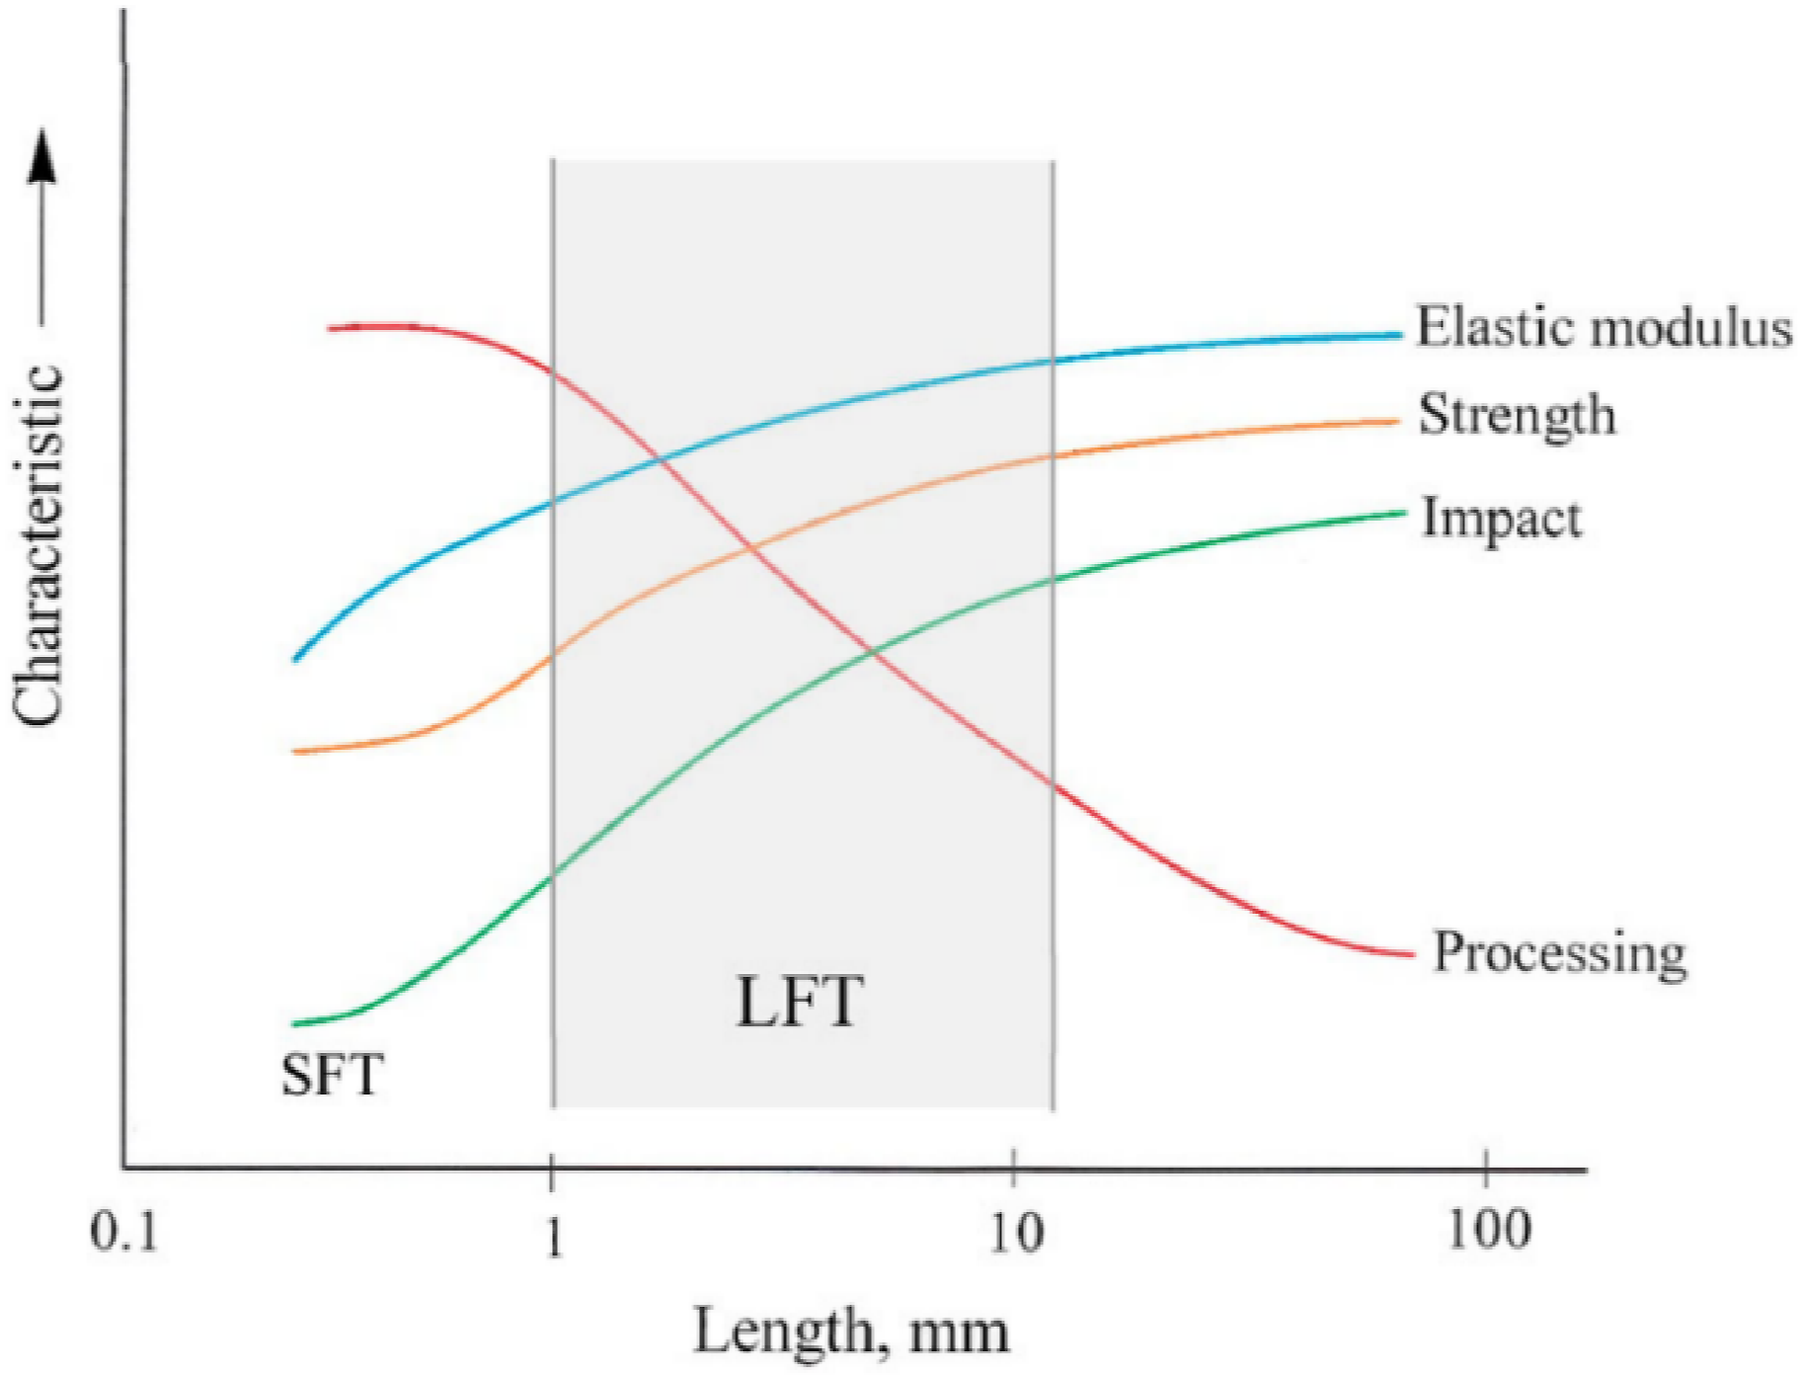
Based on the fibre length used in discontinuous fibre-reinforced thermoplastic composites, they can be classified as short and long fibre-reinforced thermoplastics. The fibre length also plays a key role in defining the characteristics and manufacturability of LFT composites.
17
As the fibre length increases, properties like strength, modulus, impact resistance,18–21 and wear resistance improve.
22
However, longer fibres can make the composite processing more challenging, as depicted in Figure 1. In LFT reinforcement systems, the fibres have a length-to-diameter ratio between 100 and 2000, with geometric properties of the fibre exceeding the critical aspect ratio as defined in equation (1).
23
Enhanced fibre alignment leads to mechanical properties reaching a plateau akin to continuous fibre properties.
23
Illustration of the influence of fibre length on the mechanical characteristics and processability.
17
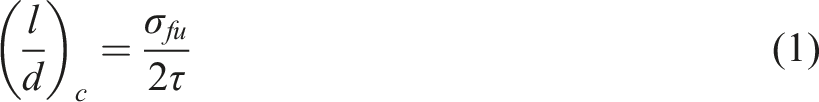
In equation (1),
Injection moulding and compression moulding are cost-effective thermoplastic manufacturing methods ideal for large-scale LFT material production in the automotive sector. The newer direct-inline compounding process offers benefits such as inline compounding of raw materials, longer fibre lengths, of approximately 20 mm, higher fibre content, reduced fibre breakage and warpage, enhanced mechanical properties, and suitability for complex designs.23,29–31
Few studies have examined compression-moulded LFT materials, as most research focuses on injection-moulded LFTs. Limited investigations have explored PA66/carbon compression-moulded LFT materials under varying load conditions.32,33 Due to the scarcity of documented studies on LFT composites and their mechanical behaviour, further research is needed to quantify their mechanical properties for analytical and numerical engineering design.
Bondy et al. 34 studied compression-moulded carbon fibre LFT-D PA6 with fibre weight fractions of 9% to 25% and orientations of 0°, ±45°, and 90°. They found that tensile stiffness, tensile strength, and flexural stiffness were higher in the −45° orientation compared to +45°, with 18% lower engineering strain at failure in the −45° direction. Mechanical properties improved with higher fibre concentrations. Christ et al. 35 investigated carbon long-fibre reinforced PA6 using quasi-static tensile tests under high temperatures and humidity, observing a swelling contraction effect at the fibre-matrix interface, leading to crack formation. Wet specimens exhibited poor fibre-matrix bonding, resulting in reduced tensile strength and elongation at break. Mouhmid et al. 36 demonstrated that the mechanical properties of compression-moulded glass fibre-reinforced PA66 are influenced by factors such as strain rate, temperature, and fibre volume fraction.
In this research, a thorough investigation was carried out to assess the mechanical properties of LFT glass/PA6 and carbon/PA66 composites produced using direct-inline compounding moulding. This research sought to address existing gaps in knowledge about how the type of fibre, its weight percentage, and moisture levels impact the mechanical behaviour of LFT-D across different strain rates. To accomplish this goal, advanced testing techniques like the V-Notch Beam shear (Iosipescu) and uniaxial tensile test, supported by MTS video extensometer optical measurement and Digital Image Correlation (DIC) analysis, were utilised to evaluate the material’s shear and tensile characteristics. Since moisture significantly affects the PA6 matrix, this study explored how varying moisture levels impact the mechanical properties of glass/PA6 LFT material under different test conditions, comparing these results with LFTs containing lower fibre percentages. The microstructures of the glass/PA6(30%) LFT material were examined using scanning electron microscopy (SEM) imaging. Additionally, the material’s complete anisotropic response in four directions (0°, +45°, −45°, and 90°) relative to flow orientation was evaluated under both shear and tensile loading conditions. To understand how pressure during the moulding process influences material properties in LFT structures produced through compression moulding, different regions of the moulded structure namely flow and charge, were assessed.
Materials and methods
LFT-D Process, materials and fabrication
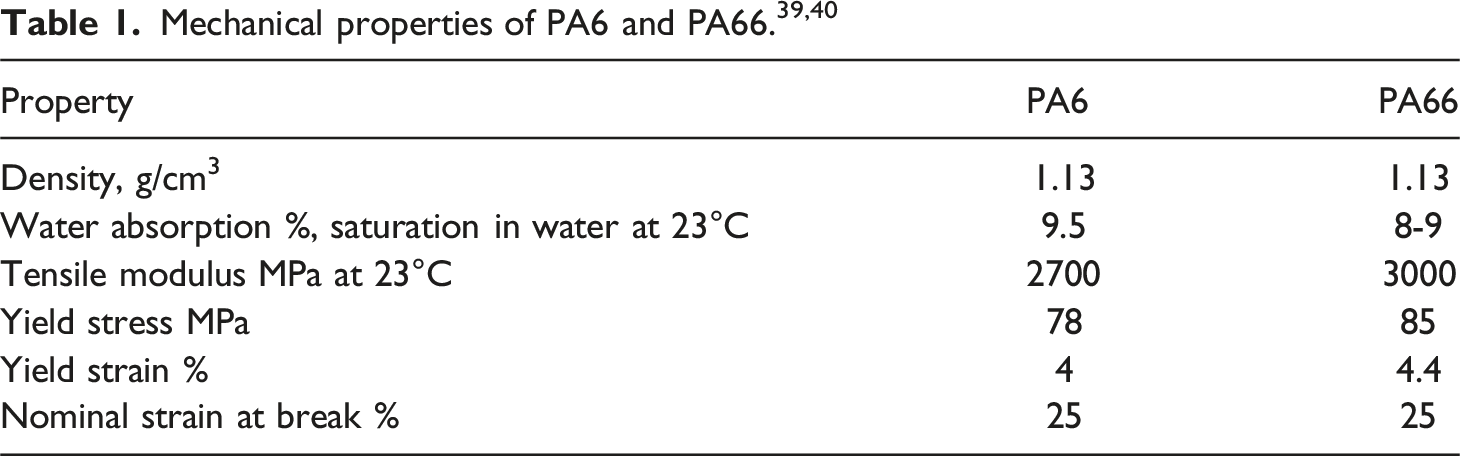
A method in material processing that has garnered significant interest is the direct long fibre-reinforced thermoplastic (LFT-D) process, known for its capability to swiftly and effectively produce high strength-to-weight ratio structures. Polyamides (PA6/PA66) are a suitable option for the polymer matrix in the LFT-D process due to their notable durability across various temperature ranges, effective impact and abrasion resistance, lubrication properties, and resilience to organic solvents.44,45
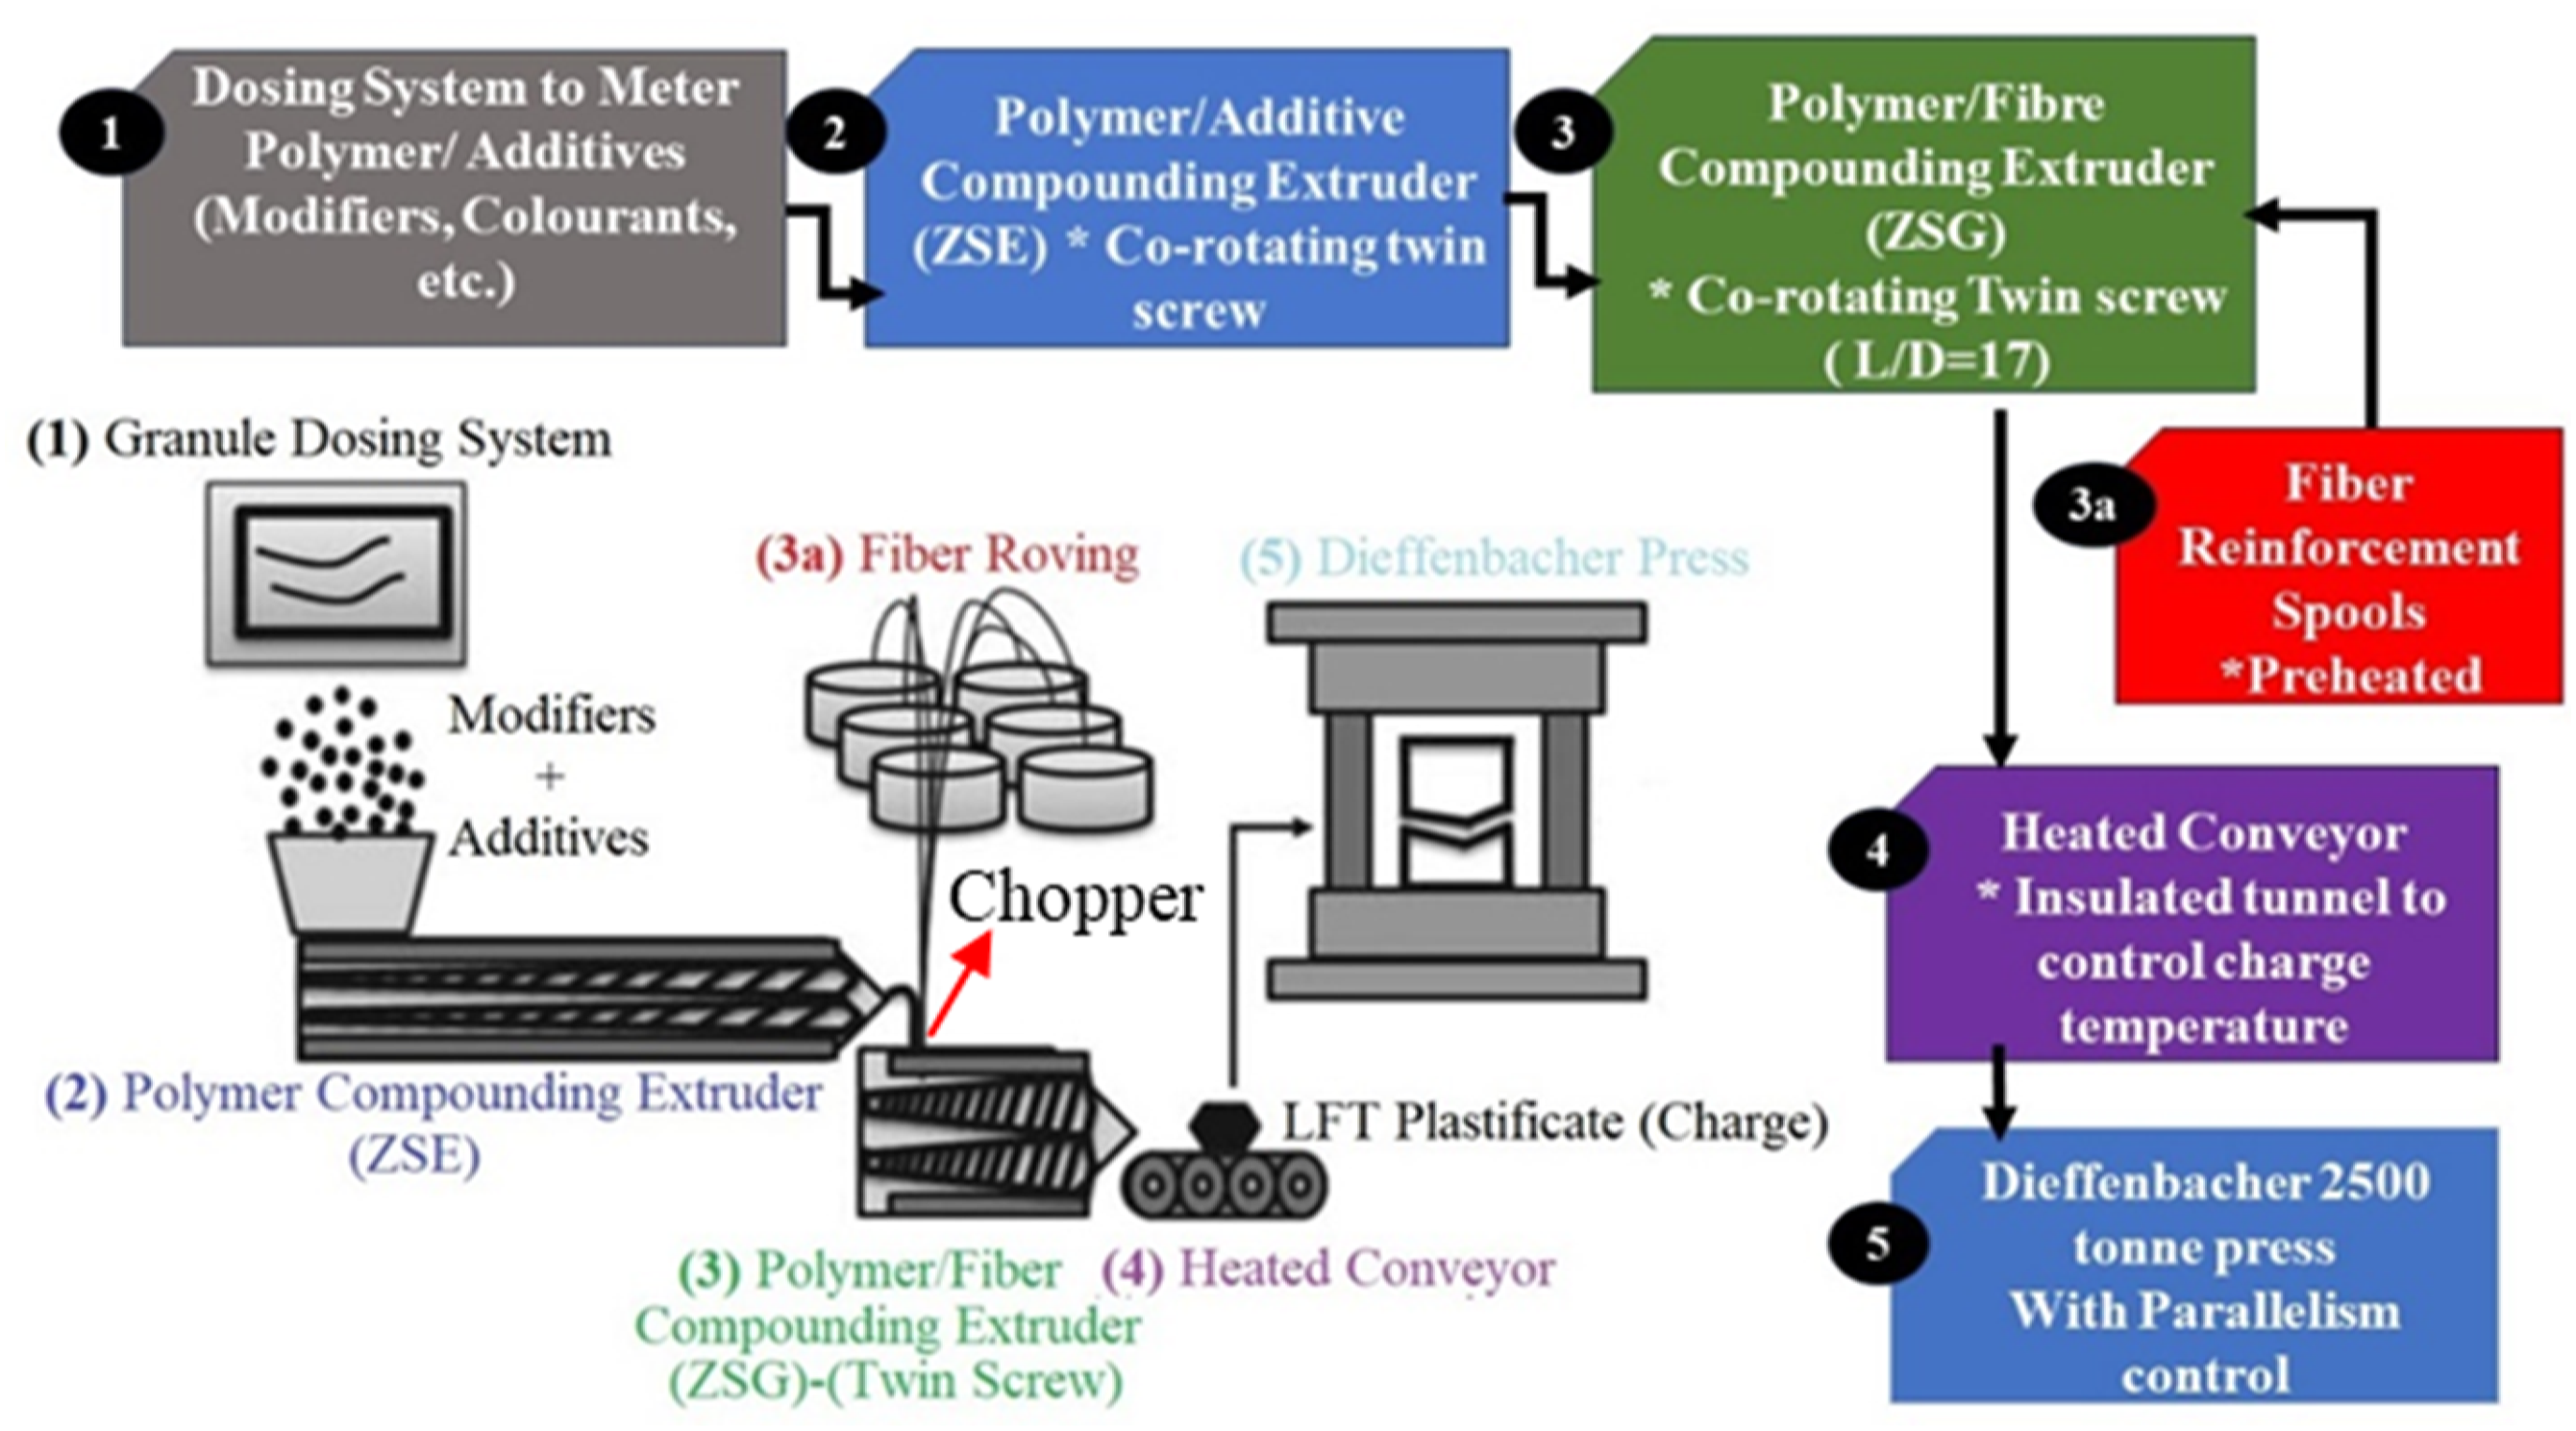
The LFT-D process comprises two primary stages, namely, compounding and moulding. In the compounding stage, various machine functions are employed to generate molten LFT charges. Once the charges reach a specified length, they are manually transferred to the press, where they are moulded into their final structures. This sequential process of compounding and moulding ensures high-quality, precisely formed components in LFT-D manufacturing. Specimens for this study were produced on the LFT-D production line at the Fraunhofer Innovation Platform for Composites Research in London, Ontario. A schematic of the manufacturing process is shown in Figure 2. LFT-D-ILC process schematic and flowchart with direct inline compounding.
48
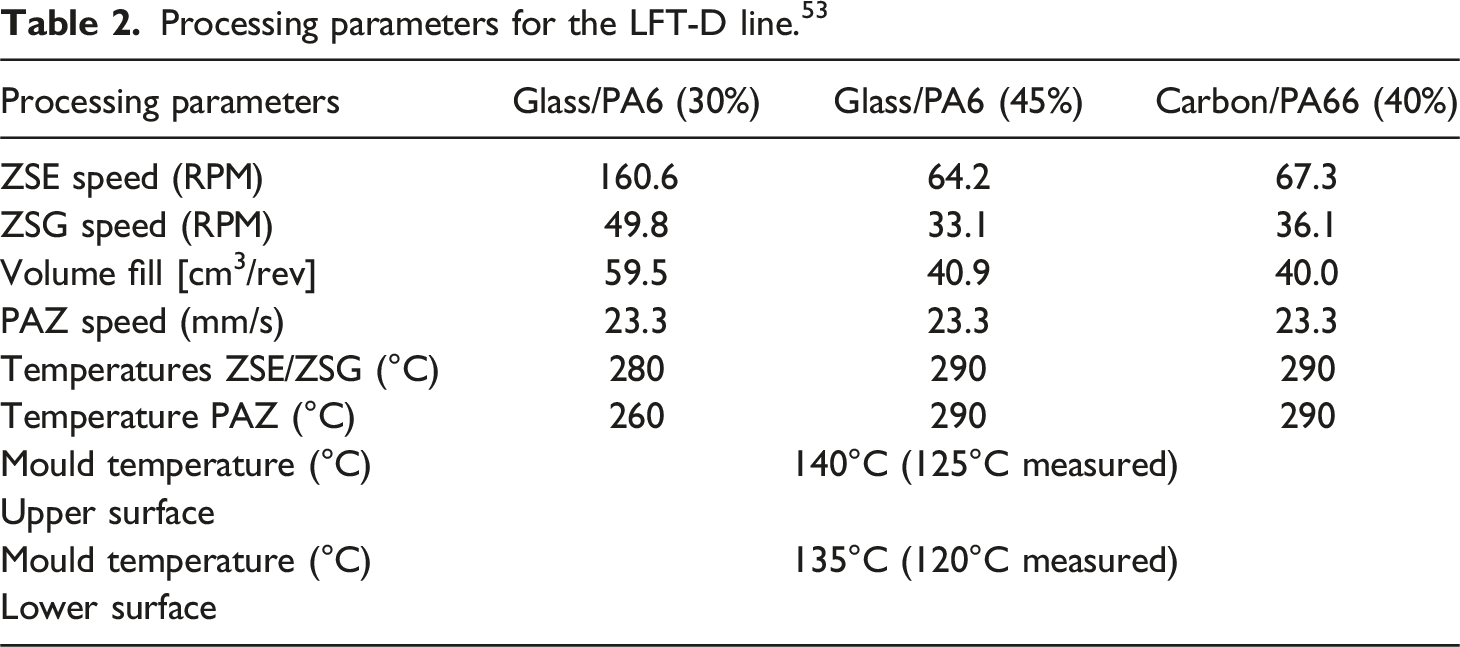
Processing parameters for the LFT-D line. 53
Material parameters for the LFT-D line. 53
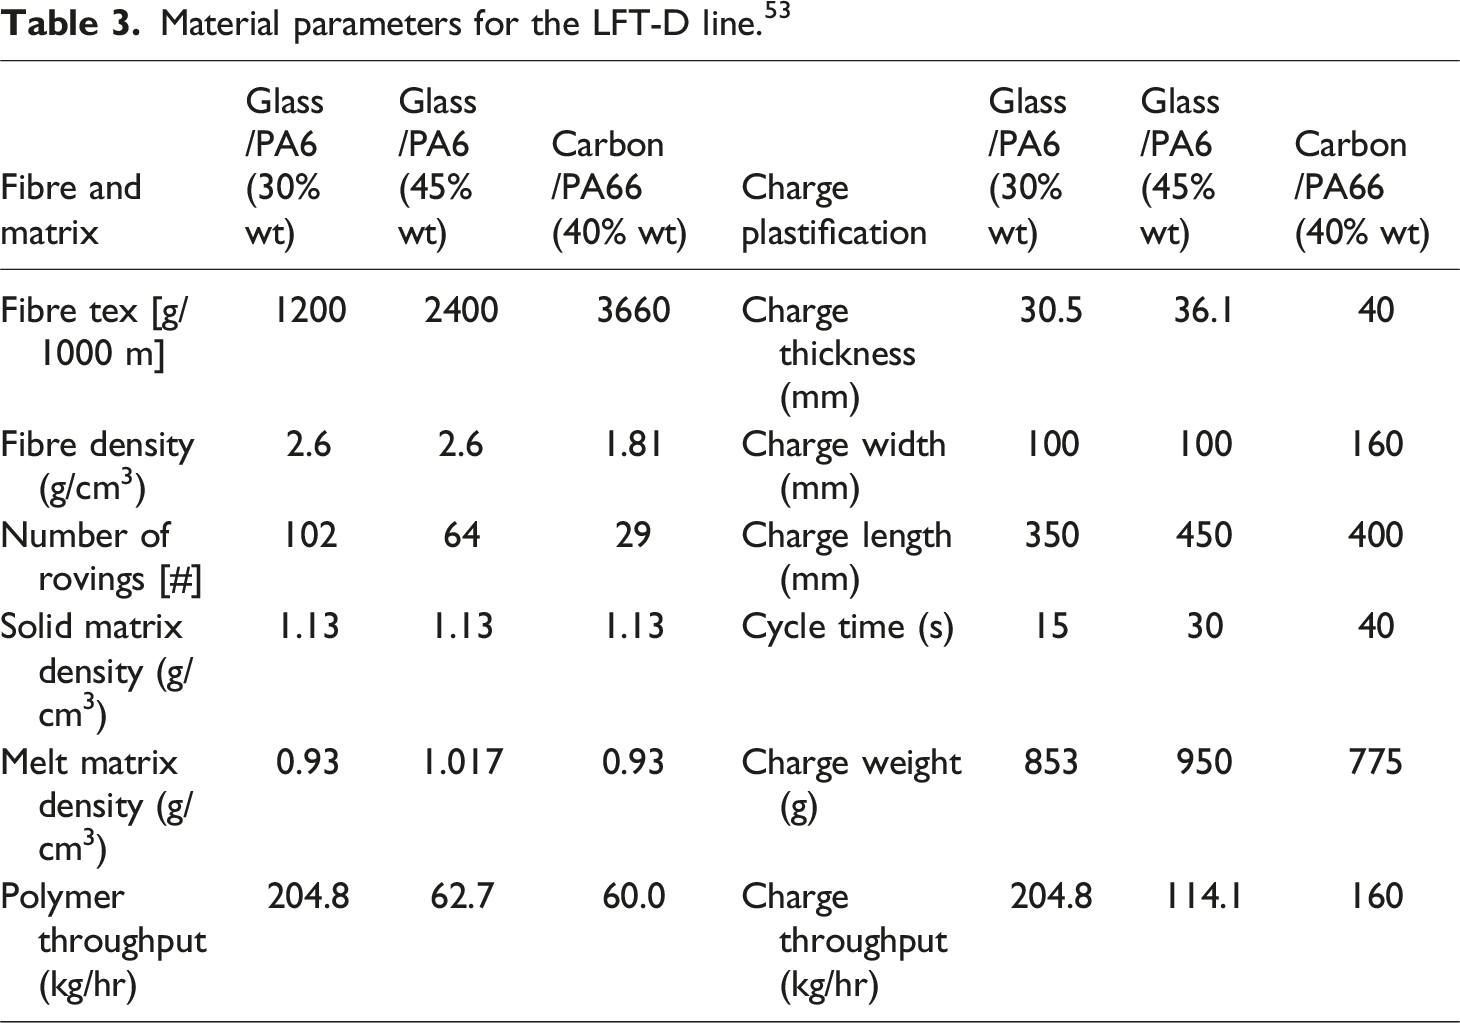
For glass fibre-reinforced LFTs, the composite matrix incorporated Ultramid 8202 HS from BASF, a low-viscosity heat-stabilized PA6, the heat stabilization enables higher processing temperatures. The reinforcement consisted of StarRov 886 RXN glass fibres (E-Glass) from Johns Manville, featuring a filament diameter of 16 µm, manufactured as direct roving aiming for fibre weight contents of 30% and 45%. The StarRov 886 RXN fibres provided by Johns Manville utilise anionic polymerisation of caprolactam, a PA6 precursor which promotes covalent bonding between the fibres and the polymer matrix, thus enhancing the interfacial properties of fibres.46,47
In the case of carbon-reinforced LFTs, BASF Ultramid® A3W polyamide 66 served as the polymer matrix. The carbon fibre employed was Zoltek Panex 35-62, with a desired fibre weight content of 40%. Fibre orientation and length distribution studies were conducted to assess how the manufacturing process influences these parameters. The results show that in the flow region, most fibres align with the flow direction, exhibiting a slight bias toward the −45° material direction. This bias accounts for the asymmetry observed between the +45° and −45° orientations. 34 Additionally, the fibre length analysis revealed that increasing fibre content leads to a reduction in the mean fibre length with the fibre lengths ranging from 20 µm to 5000 µm, featuring a fibre diameter of 7.2 µm. 34
During the moulding process, LFT charges were conveyed from the extruder, transported along a heated conveyor, and manually positioned within the press equipped with a 457.2 mm by 457.2 mm flat plaque tool. Employing a Dieffenbacher DCP-U 2500/2200 press exerting 5000 kN force on glass and carbon fibre-reinforced LFT flat plaques for durations exceeding 30 and 40 seconds, respectively, moulds were compressed to allow polymer solidification for PA6 and PA66. Moulding parameters are detailed in Table 2. Comprehensive press force 5000 kN and displacement profiles with 80 mm/s fast closing and 5 mm/s slow closing were used for the glass/PA6 and carbon/PA66 which determined the thickness of the plaques.47,48 Thermal management, using oil cooling, maintained the upper and lower mould parts at 140°C and 135°C, respectively. Following the compression of charge material processed in the LFT-D line, LFT plaques with a nominal thickness of 3 mm were produced.
Sample preparation and conditioning
The ambient conditions of temperature and humidity in the storage room for LFT material plaques were monitored using a ThermoPro 260FT digital hygrometer/thermometer (accuracy: ±0.2°C, ±2% RH). Room temperature and humidity were recorded every 12 hours, averaging 20.7°C (SD: 0.2°C) and 28.6% humidity (SD: 9.2%). For glass/PA6(45%), tensile and shear tests were completed within 15 days, mitigating any significant storage period.
After utilising a water jet cutting machine to extract samples from the flat plaques, half of the samples from each plaque underwent desorption, a drying process using the “Dry as Moulded” method, within a vacuum oven set at 80°C and 70 kPa pressure for 9 days, following the recommended procedure detailed in reference.
49
Subsequently, the dried samples were stored in desiccator bags to preserve their moisture content consistency until the testing phase. The weights of the specimens were documented before, during, and after drying to monitor a decrease in mass, indicative of moisture release. The fraction of released moisture was determined using equation (2).
50

In equation (2), Moisture-releasing process utilising a vacuum oven at 80°C and vacuum pressure of 70 kPa for 9 days.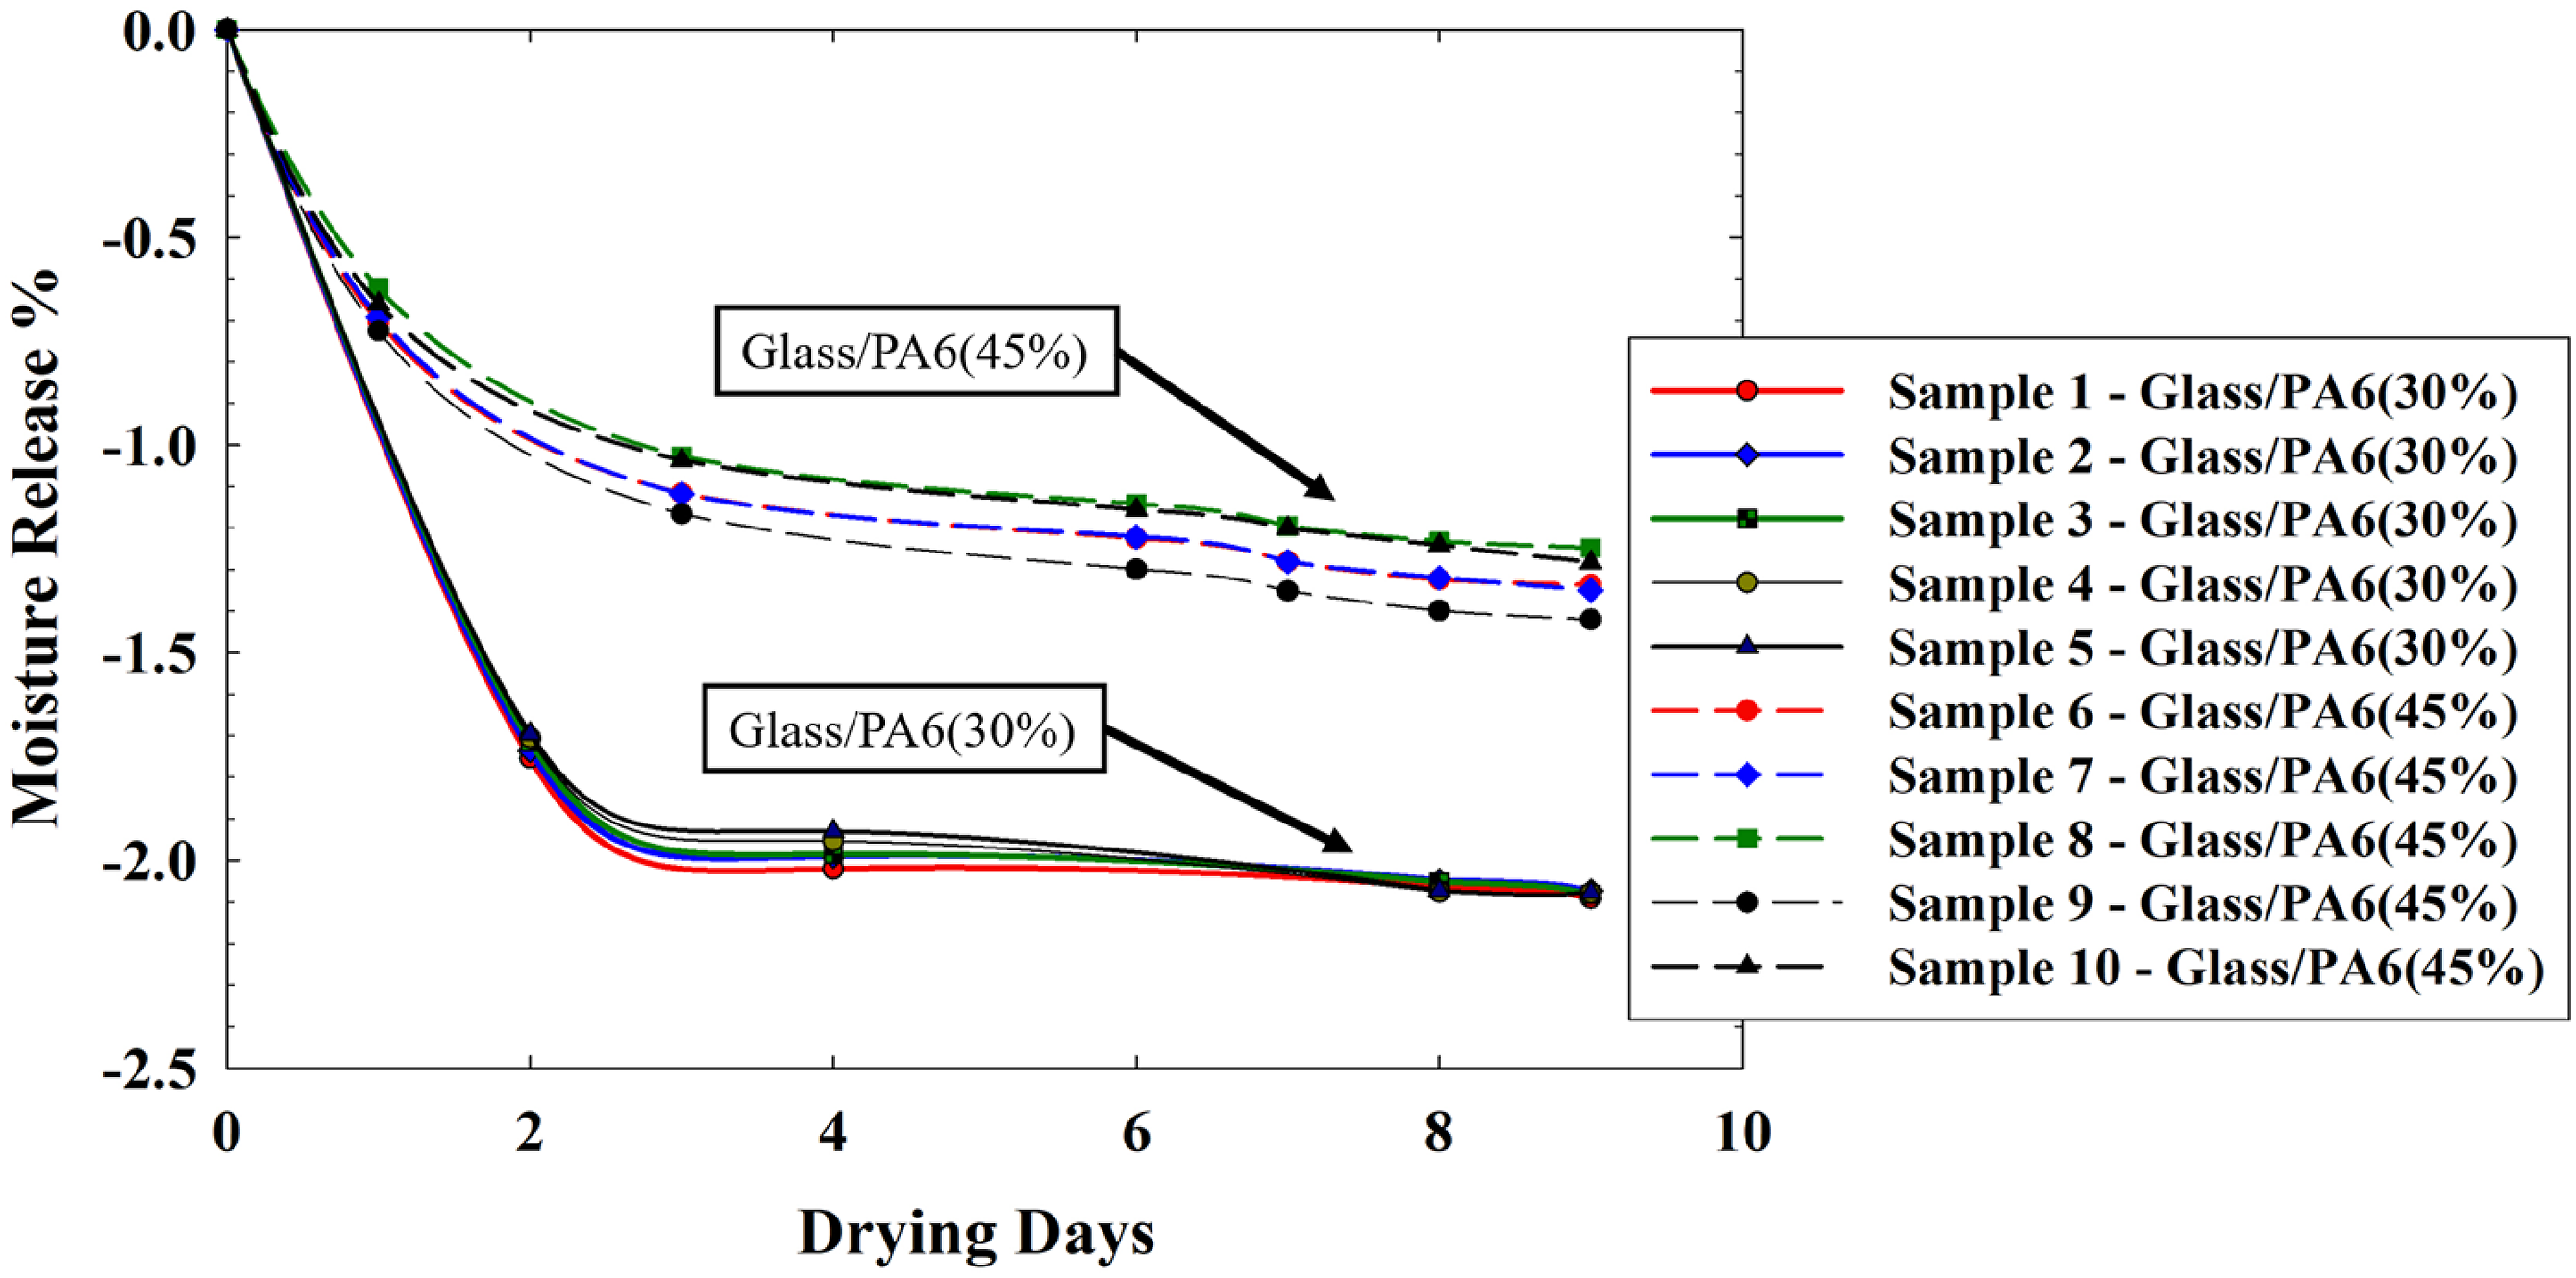
Experimental methods
Quasi-static uniaxial tensile testing
In the case of glass fibre-reinforced LFTs, quasi-static tensile tests were performed using an MTS electromechanical universal compression/tensile testing machine. Strain within the gauge was monitored with an MTS video extensometer equipped with a Nano-M1450 camera (1088 × 1456 pixels). Both load and video data were captured at a rate of 5 Hz. To achieve an approximate strain rate of 0.0001 s−1, the crosshead speed was set at 0.5 mm/min. The tests used ASTM D638 Type V specimen geometry. The schematics of the plaque, as illustrated in Figure 4, depict two regions, charge and flow, and four material directions: 0°, +45°, −45°, and 90°, where 0° corresponds to the material flow direction within the mould. To ensure a consistent material response, at least three but no more than five samples were tested for each condition. Schematics of the plaque depicting flow and charge region along with flow direction and material direction.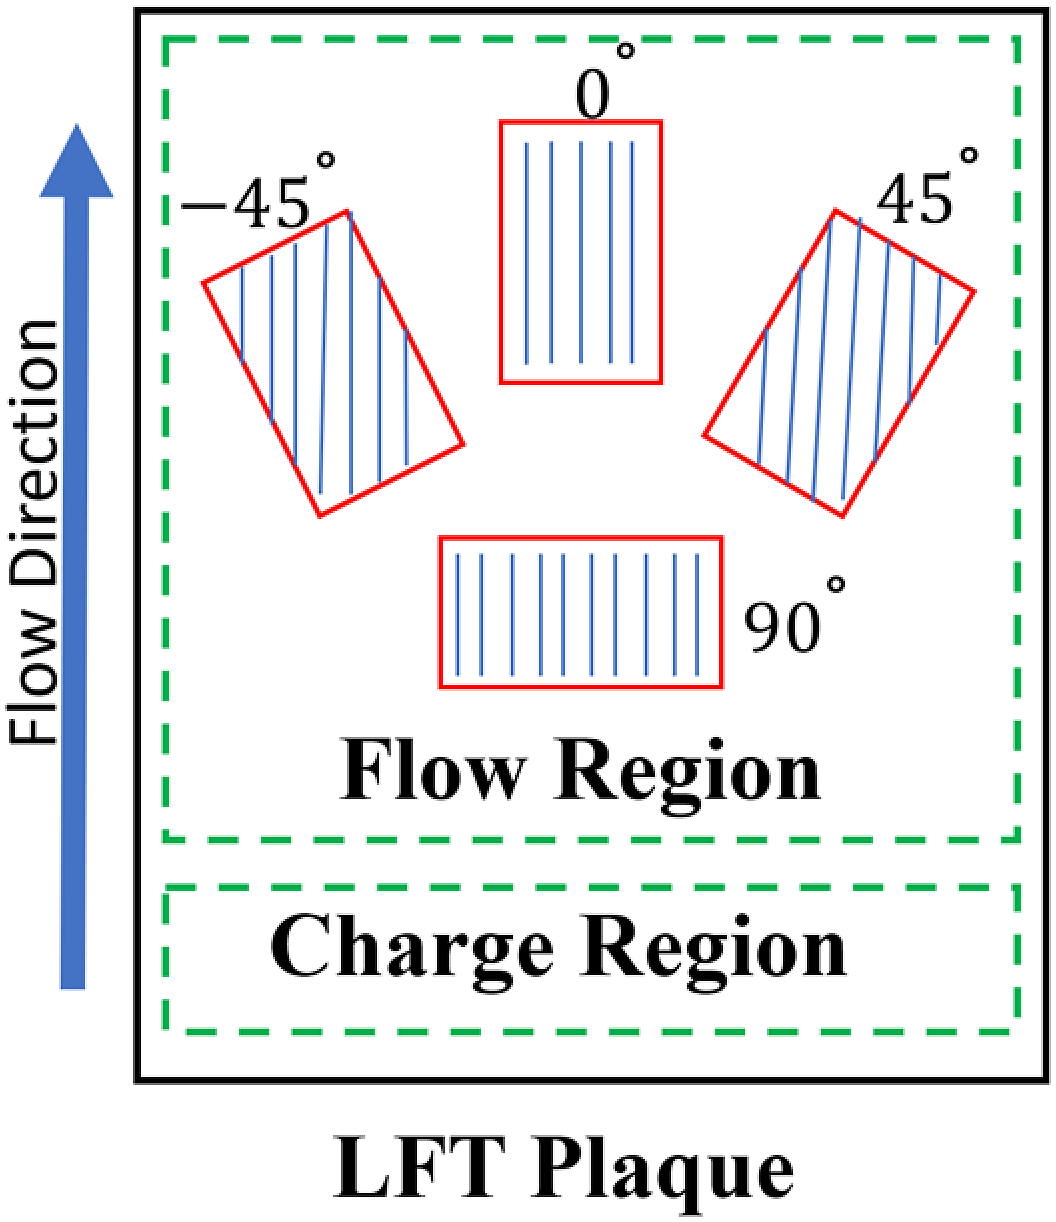
For carbon fibre LFT, baseline quasi-static tensile tests were conducted at 0° and 90° orientations relative to the flow direction, at strain rates between 10−5 s−1 and 10−4 s−1. These tests utilised an MTS electromechanical load frame with both a 25 mm mechanical extensometer and an MTS video extensometer equipped with a 1.3 MP Allied Vision monochrome camera. The crosshead speed was set to 1 mm/min, resulting in strain rates within the gauge region between 10−5 s−1 and 10−4 s−1. The specimen geometry followed ASTM D638 Type III standards, with a 19 mm gauge width, 57 mm gauge length, and an average thickness of 3.06 mm (ranging from 2.9 mm to 3.2 mm). Additional specimens with reduced gauge lengths were tested at quasi-static strain rates from 10−5 s−1 to 10−4 s−1 to evaluate the impact of specimen size on material properties. 34 This study aimed to determine if smaller gauge lengths could accurately capture material responses considering the fibre length distribution. Quasi-static tensile testing of reduced gauge length specimens limited non-optical strain measurements due to the extensometer’s gauge length. Consequently, the strain was measured optically for all carbon fibre-reinforced specimens, with a mechanical extensometer used for validation in specimens where the gauge length exceeded 25 mm.
Shear experiments
To perform the shear tests for the glass-reinforced LFTs, the V-Notched Beam shear testing apparatus (also known as Iosipescu) derived from the ASTM D5379 standard was utilised, employing the same material labelling as in the tensile tests.
51
Figure 5 illustrates the V-Notch Beam shear testing apparatus. Engineering shear strain and effective strain data within the notch region were acquired using MTS video extensometers, following a method similar to mechanical strain gauges outlined in the ASTM D5379 standard but employing an optical approach.
52
Post-processing utilised Correlated Solutions® VIC-2D DIC software, with speckled samples. The strain measurements obtained from video extensometers and DIC software were employed to validate the measurement methods. The V-Notch shear beam test apparatus.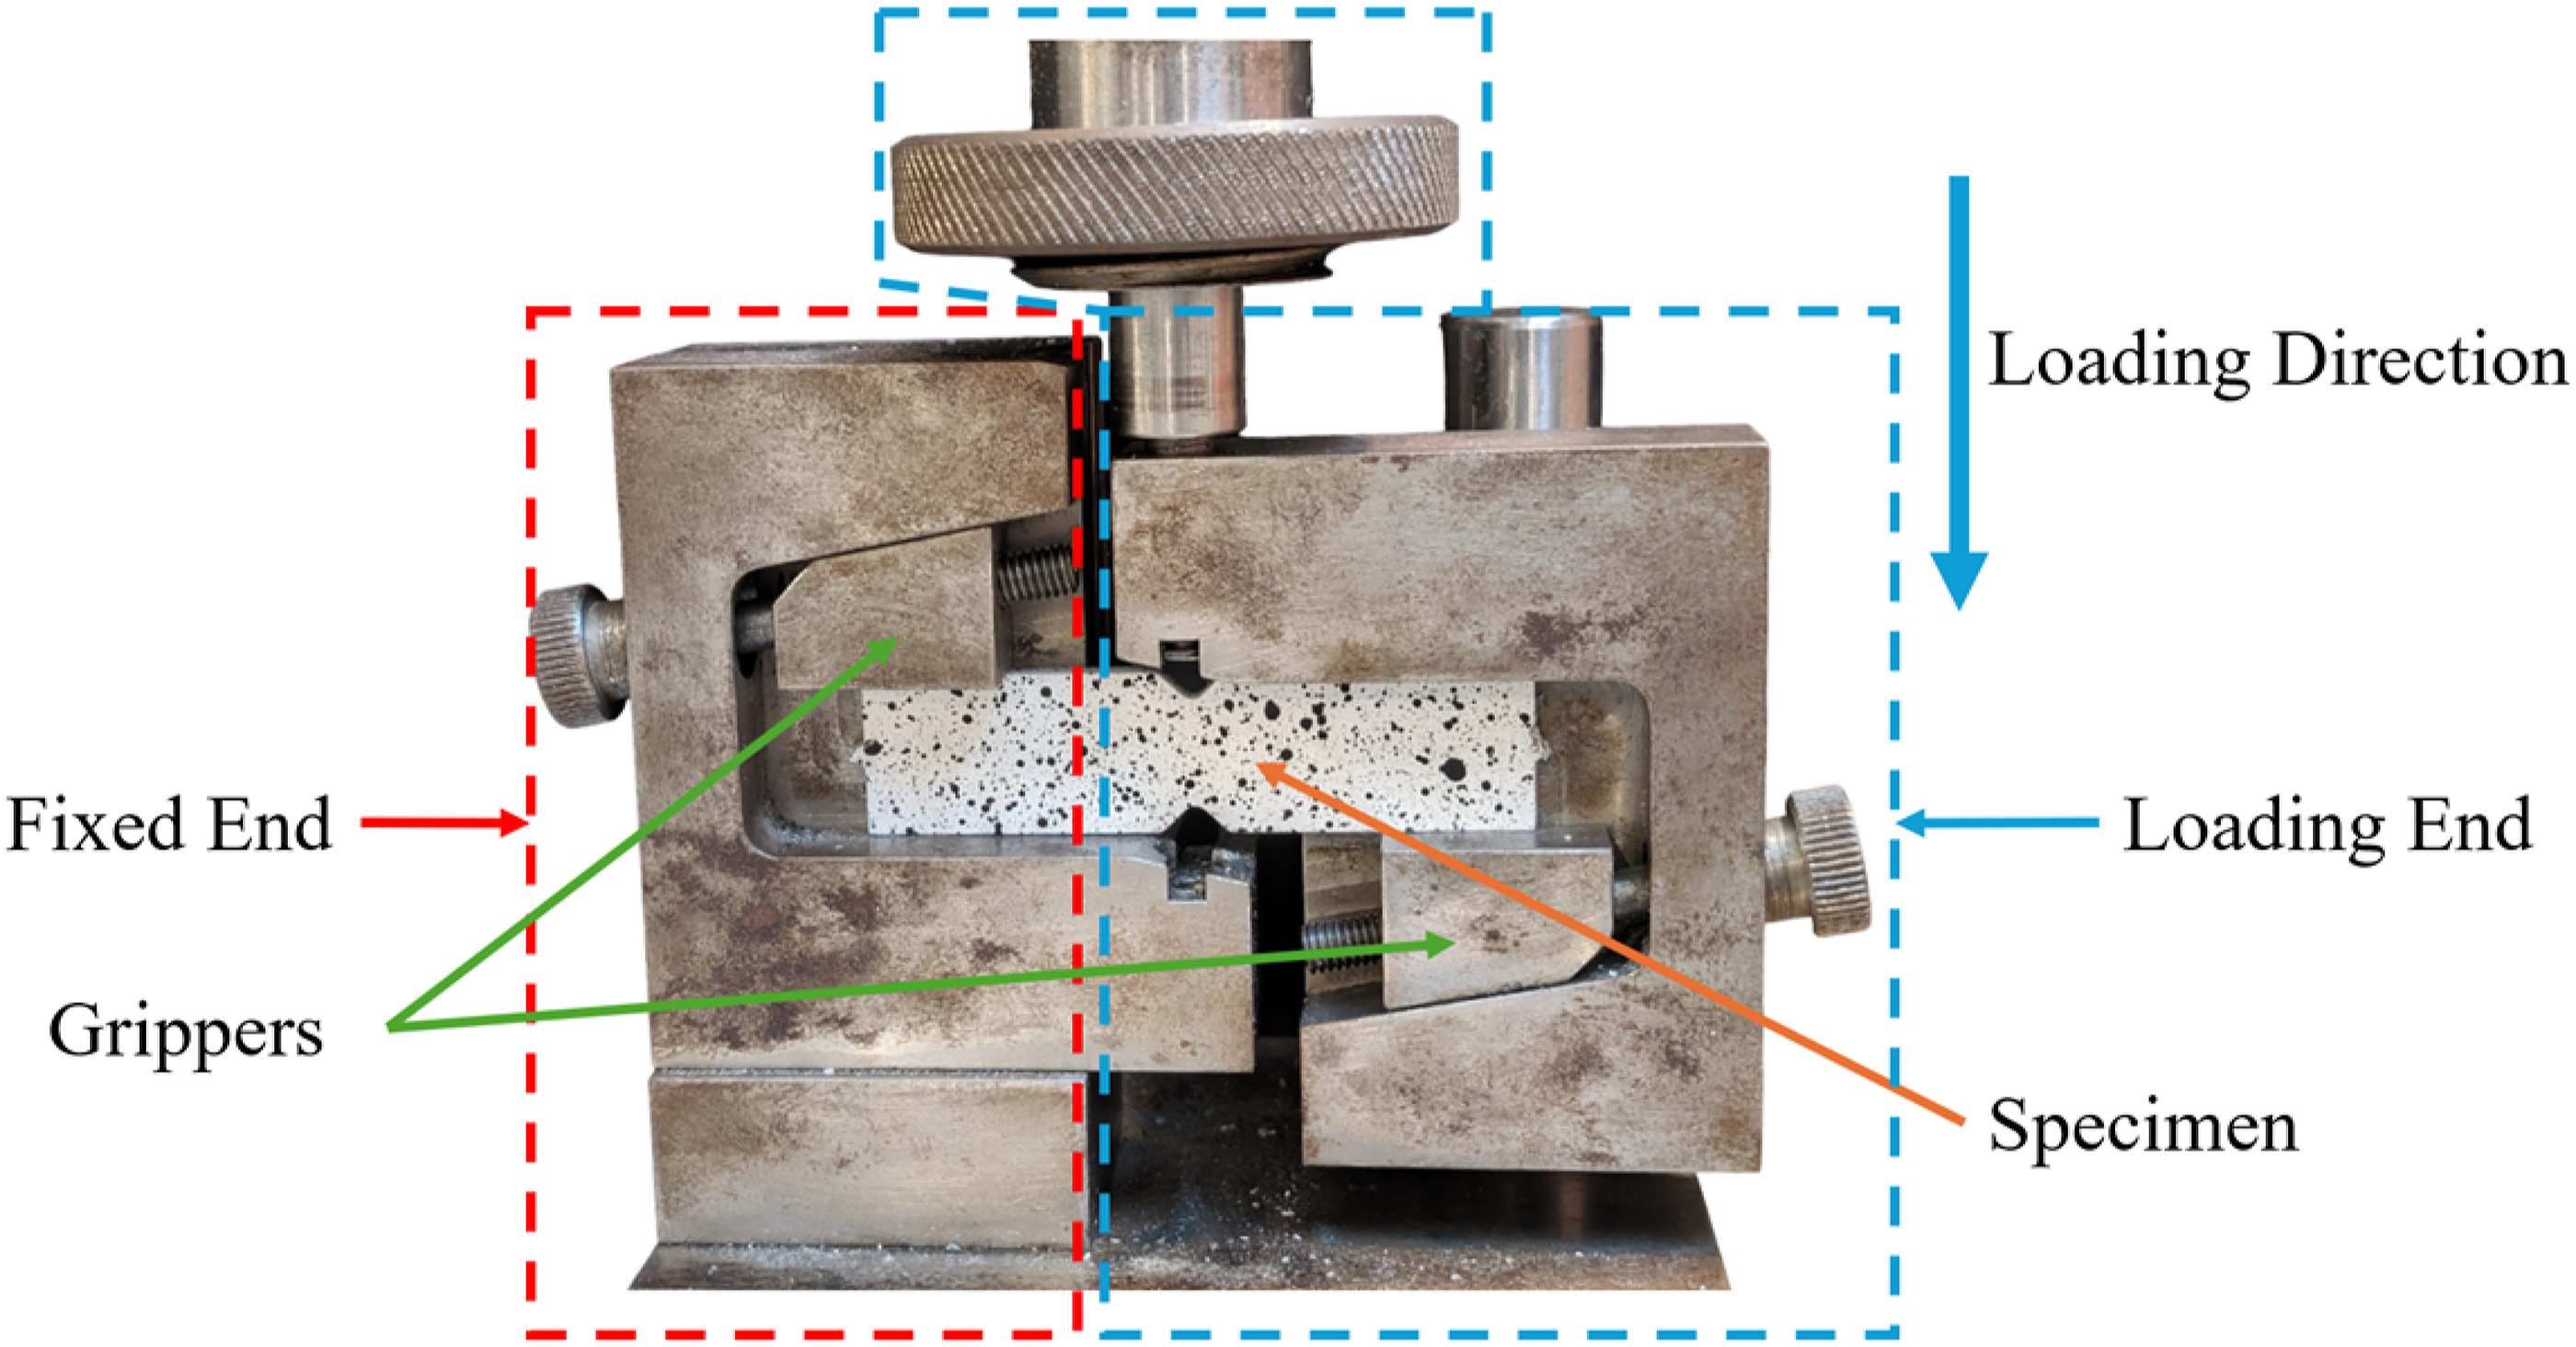
The utilisation of mechanical strain gauges presents various drawbacks and difficulties, including inaccuracies during sample twisting and tool detachment during plastic deformation. These challenges can be mitigated by employing optical strain measurements. Another advantage of the optical approach is its capability to measure strain during dynamic loadings and tests involving ductile materials. As per ASTM D5379, the engineering shear strain within the gauge region is computed using equation (3):
Here,
SEM analysis
The fracture surfaces of LFT specimens, subjected to testing at different material directions and moisture levels, underwent analysis using an FEI Quanta 200 field emission gun environmental Scanning Electron Microscope (SEM) operating in low vacuum mode, with a pressure of 70 Pa and a beam voltage of 10 kV. Furthermore, cross-sectional micromechanical images of various regions of polished and mounted LFT samples were examined using SEM to assess the impact of the compression moulding process on the material, particularly within the charge region.
Results and discussions
Influence of fibre type, orientation and fibre content
Uniaxial tensile tests were conducted on dried samples of carbon/PA66 (40% fibre content), glass/PA6 (30%), and glass/PA6 (45%), all produced via compression moulding. The mechanical properties of these LFT materials, particularly strength and elongation, depend on the fibre orientation, which was analysed for the 0° and 90° material directions for carbon/PA66 and 0°, +45°, −45°, and 90° for both fibre contents of glass/PA6. Figure 6(a) and (b) display the engineering stress/strain responses for these materials under tensile loading. For brevity a single representative stress/strain response is shown in the figures. Mean and standard deviation values, calculated to illustrate data variation, are represented in bar graphs, with error bars indicating the standard deviation. Engineering stress/strain responses of (a) 0° and (b) 90° material direction for different LFT materials.
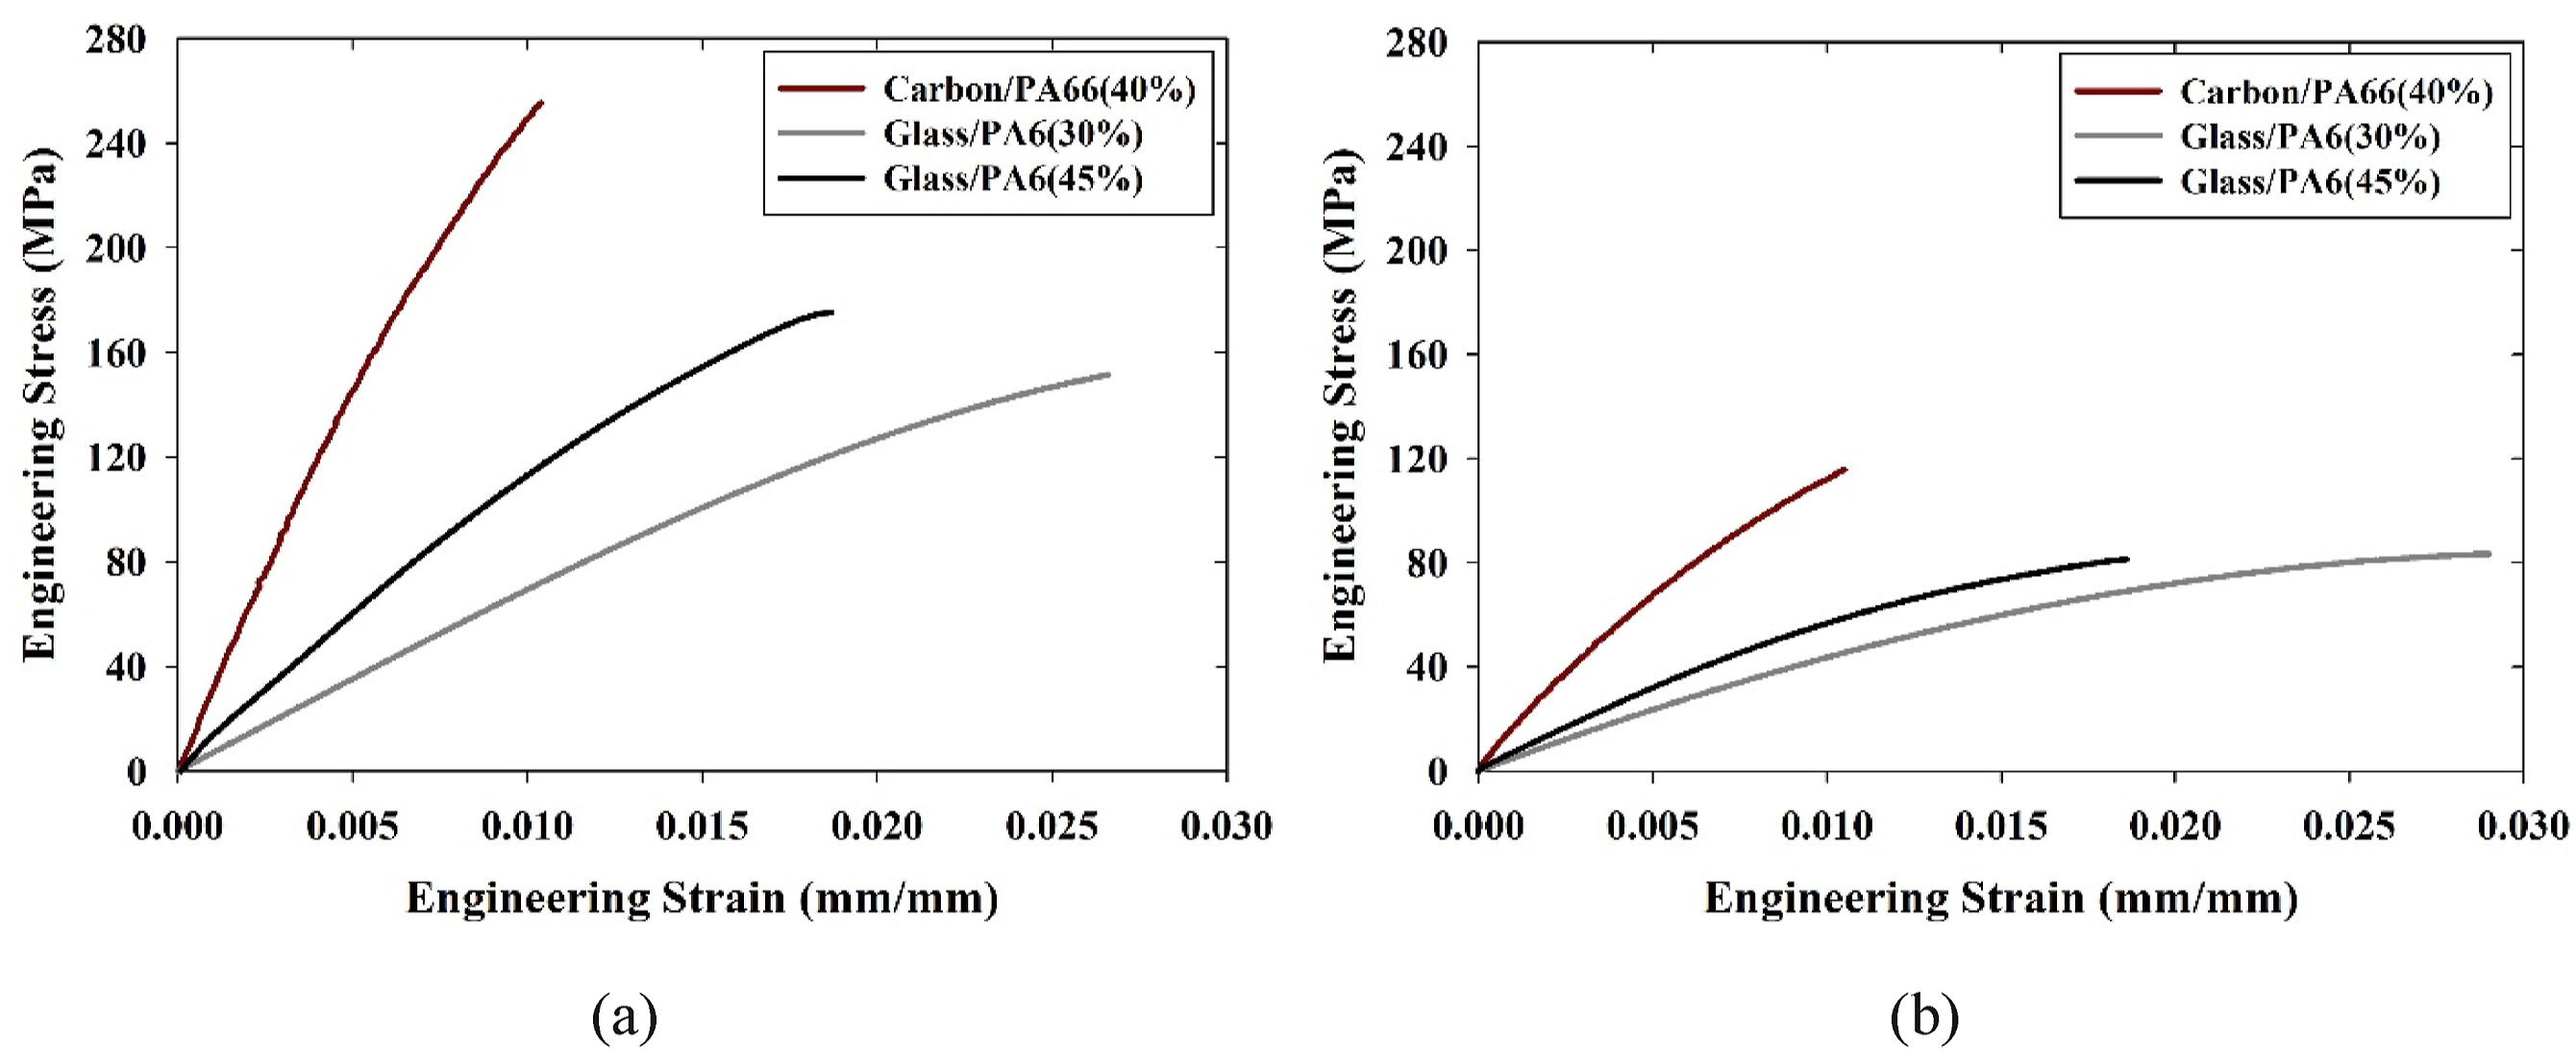
Equation (4) calculates percentage changes in mechanical properties by comparing a baseline value 'A' to a different material or configuration 'B'. Carbon fibre-reinforced LFT materials showed significantly higher strength than glass/PA6 at both 30% and 45% fibre content, particularly in the 0° direction where fibres dominate the response. Although direct comparisons are limited by differing fibre weight percentages, carbon/PA66 exhibited a 45% higher tensile strength than glass/PA6(45%), despite the latter having 5% more fibre content. Ultimate tensile strengths for carbon/PA66 were 255.2 MPa 0° material direction and 115.6 MPa 90° material direction, compared to 175.3 MPa and 81.3 MPa for glass/PA6(45%) and 151.3 MPa and 83.3 MPa for glass/PA6(30%). While increasing fibre content in glass/PA6 from 30% to 45% improved mechanical properties in the 0° material direction, only minor changes occurred in the 90° material direction, where the matrix dominates. Higher carbon fibre stiffness reduces its elongation before failure compared to glass/PA6. Increasing fibre content in glass/PA6 from 30% to 45% reduces elongation, with strain to failure decreasing from 0.0266 mm/mm to 0.0187 mm/mm.
Composites are anisotropic, meaning their mechanical properties depend on the direction. To examine this in glass/PA6 with 30% and 45% fibre content, uniaxial tension and shear tests were conducted in four directions: 0°, +45°, −45°, and 90°. Figure 7(a) and (b) show the effect of fibre orientation and content on the stress/strain response for dried glass/PA6 samples. Only one representative response is presented for brevity. Engineering stress/strain response in (a) tensile and (b) shear loading of dried samples of glass/PA6 with 45% and 30% fibre content for different material directions.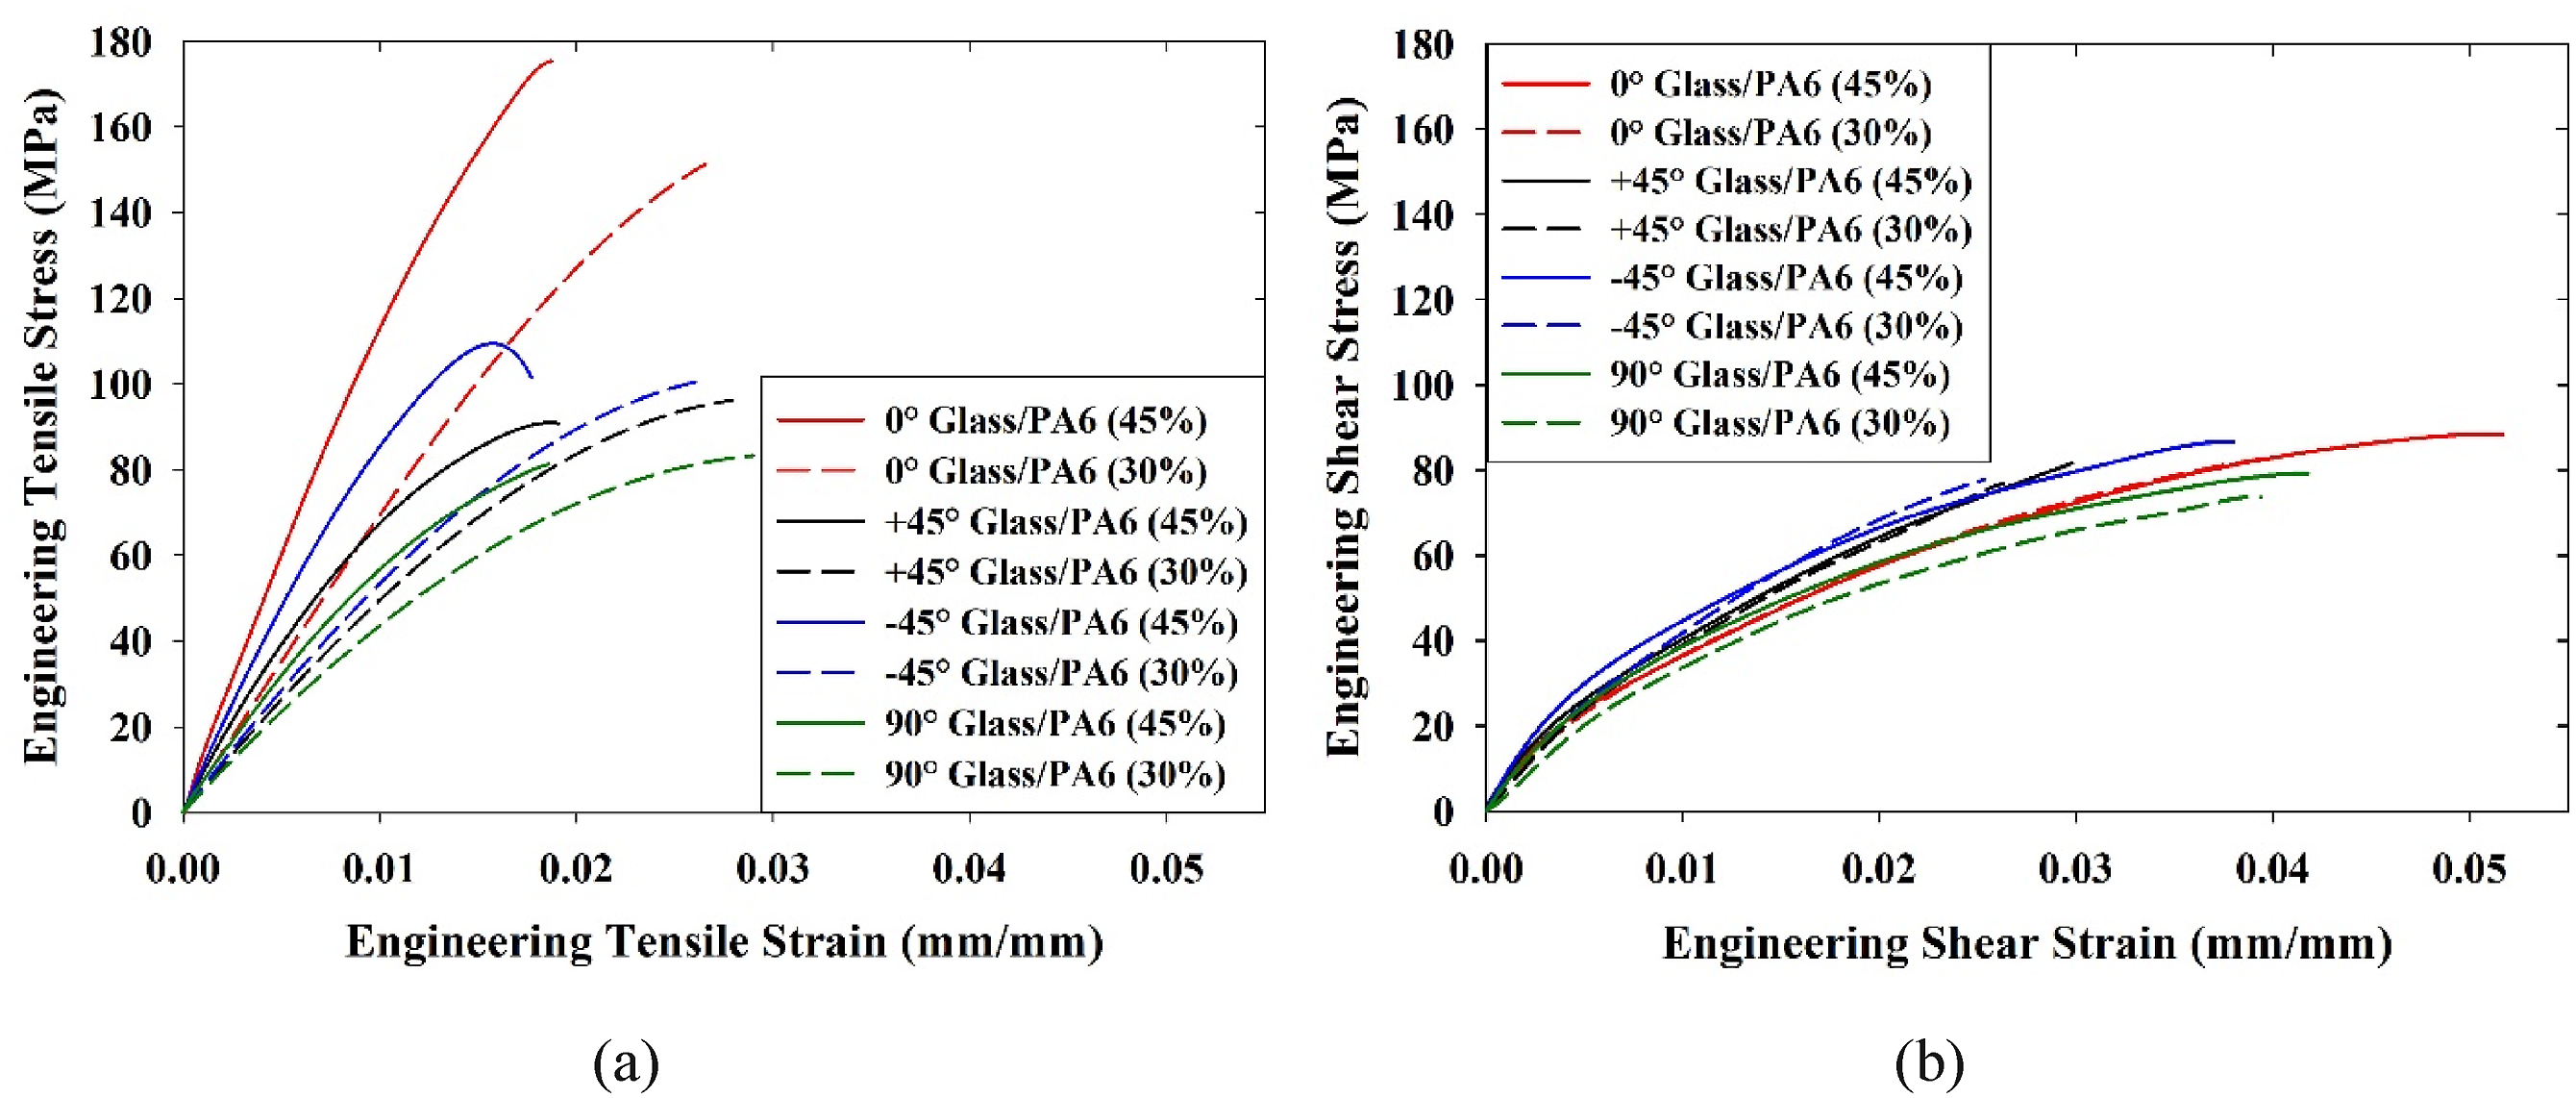
For both 45% and 30% fibre content material, the engineering stress/strain responses for tensile loading are as anticipated, with the 0° material direction exhibiting a higher strength of 175.3 MPa and 151.3 MPa than the 81.3 MPa and 83.3 MPa of the 90° material direction for glass/PA6(45%) and glass/PA6(30%), respectively. In the case of the former, the load was supported by the fibres, however, in the 90°configuration, the majority of the load was supported by the matrix, which is significantly weaker than the reinforcing fibres. For both the +45° and −45° material directions, the corresponding stress/strain responses were observed to fall between the 0° and 90° material direction observations. The 15% increase in fibre content of the glass/PA6(45%) resulted in a slight enhancement in ultimate tensile strength for 0°, +45° and 90° material directions, but a significant increase in the stiffness of the material was observed with increase of the fibre content for all material directions. The glass/PA6(45%) material experienced much lower elongation before failure than the glass/PA6(30%) material for all material directions.
In Figure 7(b), the shear stress/strain responses showed no significant difference across material directions. Fibre content and orientation had little impact on shear loading. The +45° and −45° directions exhibited slightly higher strength than the 0° and 90° directions, with 90° showing the lowest strength. Strain to failure was similar across all configurations, regardless of fibre content or orientation. For both glass/PA6(30%) and glass/PA6(45%), tensile strength was higher than shear strength in all directions, except 90°, which also showed higher elongation in shear loading.
Figure 8(a) and (b) display the influence of fibre orientation and fibre content on the ultimate tensile and shear strengths of glass/PA6. The 0° material direction, with fibres aligned along the loading direction, exhibited a mean ultimate tensile strength of 160 MPa and ultimate shear strength of 90 MPa for glass/PA6(45%), the highest among all the material directions studied. The +45° material direction noticed a significant reduction of 21% in ultimate tensile strength for glass/PA6(45%) and a 36% decrease for glass/PA6(30%), calculated using equation (4) considering the 0° material direction as the baseline value, while little to no change was observed for the ultimate shear strength. The degraded performance of the +45° material direction compared to the 0° material direction is due to the misalignment of the fibres with respect to the direction of tensile loading. Higher ultimate tensile strength was observed for the −45° material direction compared to the +45° material direction. This increase highlights the influence of the manufacturing process, where fibre flow from the charge region predominantly favours the −45° orientation during compression moulding. Previous studies suggest this effect results from the corotating twin-screw extruder.34,53 Bondy et al.
34
conducted a fibre orientation distribution analysis using microCT, confirming increased stiffness in the −45° direction. Furthermore, a through-thickness evaluation reveals a significant variation in fibre alignment, with fibres progressively aligning with the flow direction as the distance from the surface increases. In the case of the 90° material direction, the majority of the load was borne by the matrix as the fibres are aligned perpendicular to the loading direction, leading to a significant drop in mean ultimate tensile strength compared to the 0° material direction, specifically from 160 MPa to 78 MPa for glass/PA6(45%) and from 153 MPa to 81 MPa for lower fibre content glass/PA6(30%). An abnormality was observed in the trends of the ultimate tensile strength, where the strength dropped significantly when comparing samples from the flow region to the charge region for all the material directions except the 90° material direction, where the mean ultimate tensile strength increased from 78.4 MPa to 141 MPa. This behaviour can be attributed to the manufacturing process where, initially, in the charge region, the fibres are oriented perpendicular to the 0° material direction before the compression moulding occurs. As the flow of the charge is not optimal within the charge region, some of the fibres retain their orientation, thus aligning the fibres along the loading direction for the 90° material direction. Our findings show that this causes a significant increase in the tensile strength of the 90° material direction in the charge region compared to the flow region. No significant changes were observed for the ultimate shear strength, neither with respect to the fibre orientation nor the fibre content. It is evident that matrix material was the driving factor for the shear strength of the material. Ultimate strength in (a) tensile and (b) shear loading of dried samples of glass/PA6 with 45% and 30% fibre content for different material directions.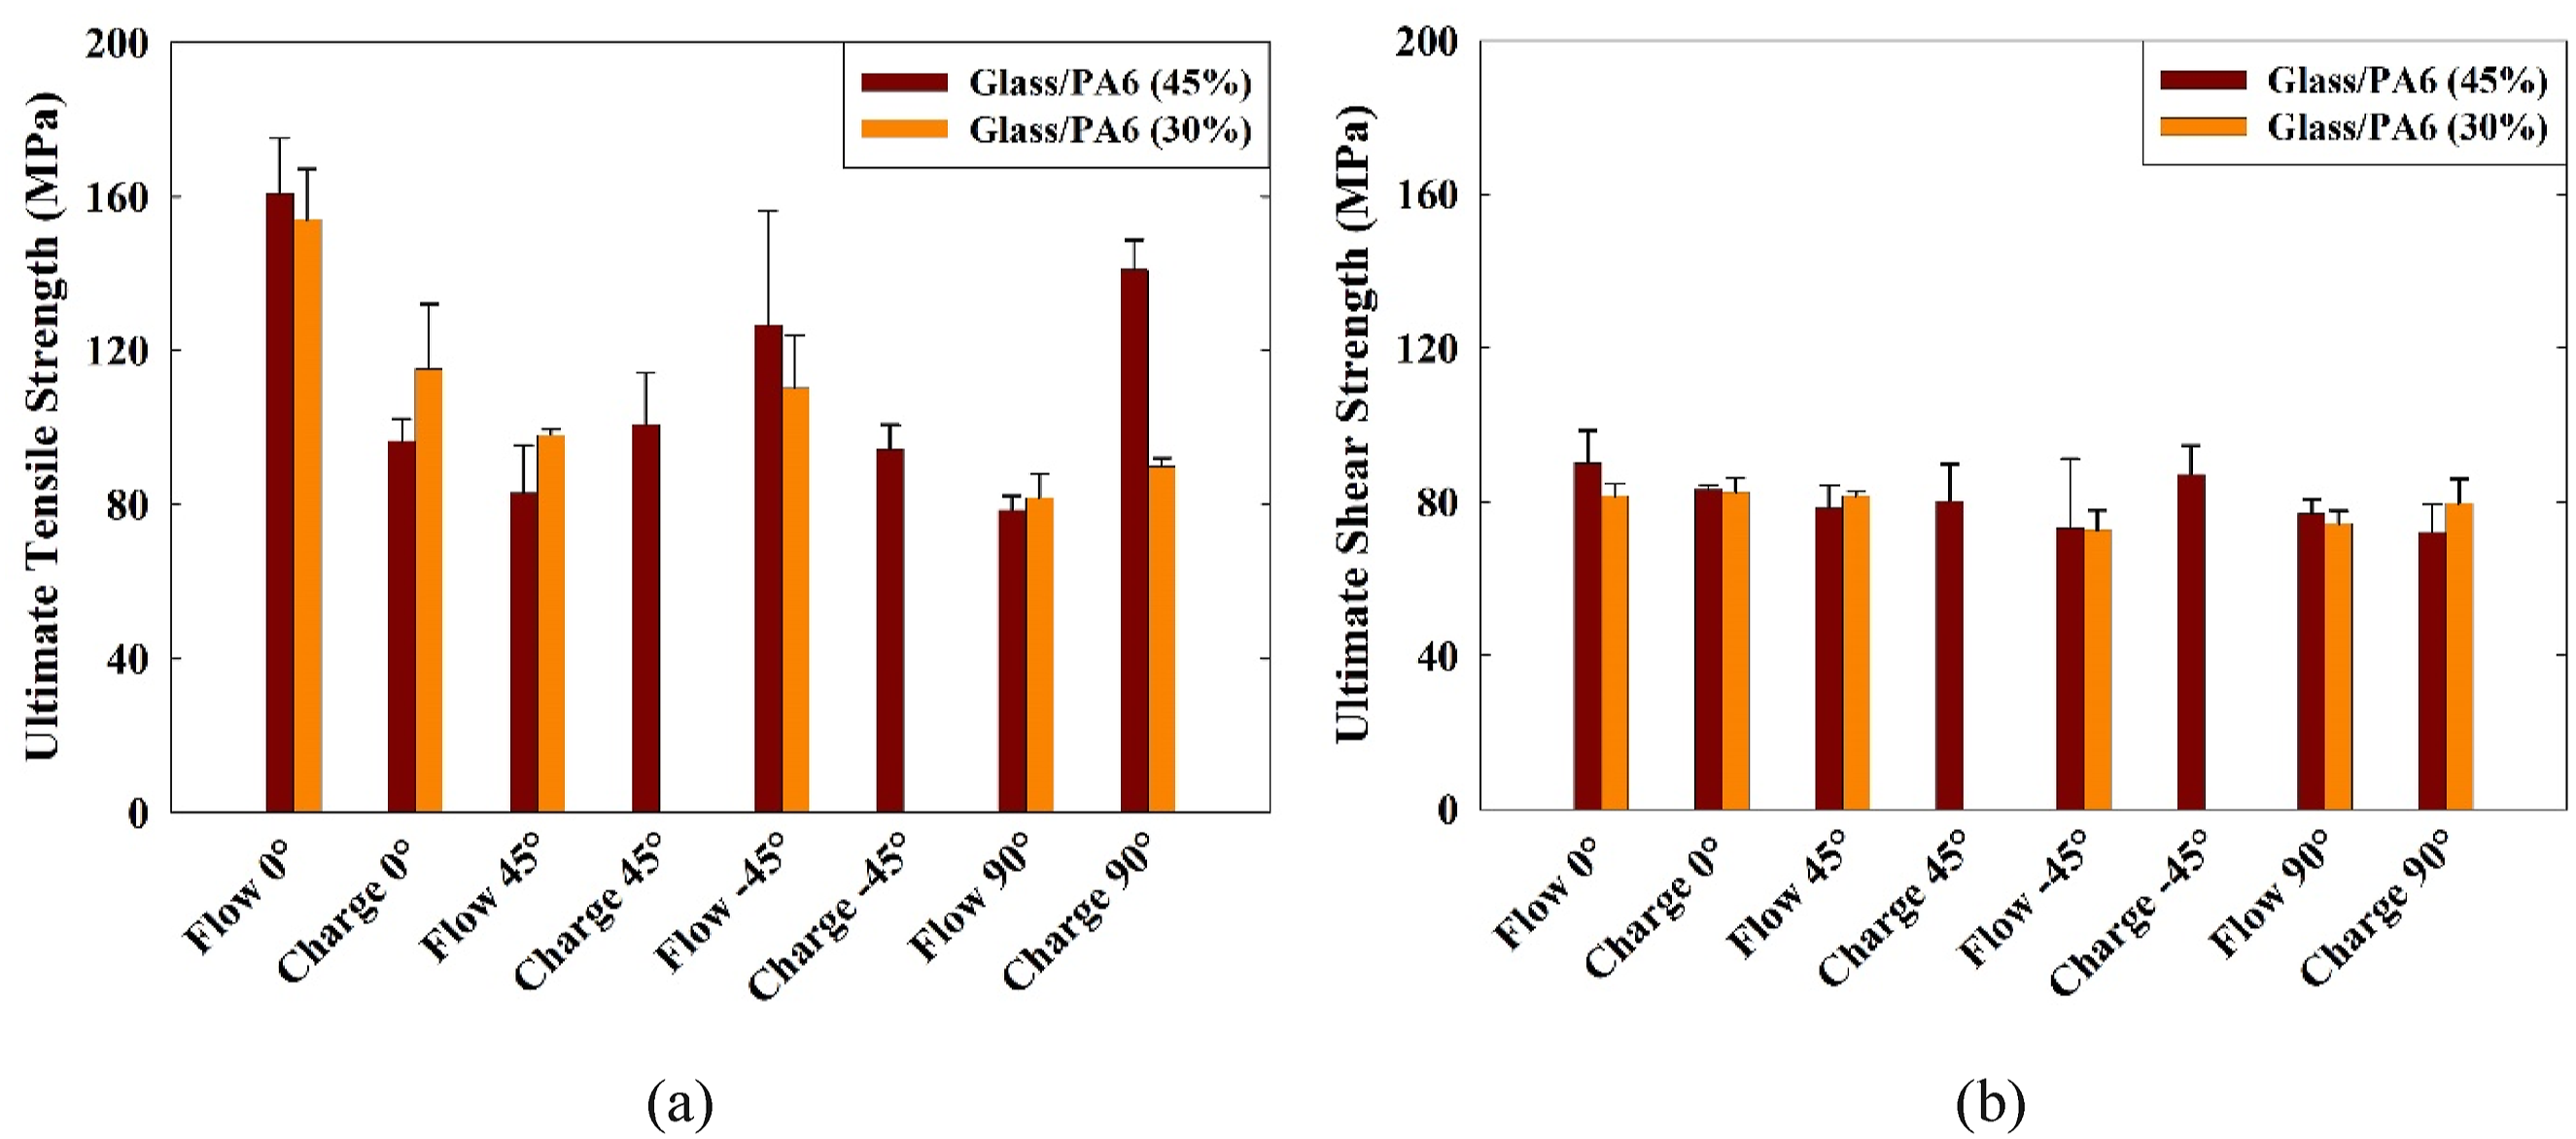
With glass fibre being significantly stiffer than the matrix material, the higher fibre content in glass/PA6(45%) noticeably enhanced material stiffness compared to glass/PA6(30%) across all the material directions for both tensile and shear loading. Figure 9(a) and (b) show the influence of fibre content and orientation on the tensile Young’s modulus and the shear modulus of dried glass/PA6 samples from the flow region. The elastic modulus was computed as the slope of a straight line fitted to all data up to 0.005 engineering strain for tensile and shear loading. Glass/PA6(30%) with lower fibre content depicted a tensile Young’s modulus of 7.1 GPa for the 0° material direction. For the same material direction, the material with 15% higher fibre content (i.e. glass/PA6(45%)) exhibited a percentage change of +59% in the modulus value (stiffness). A similar trend was observed for the +45° material direction with an increase of +40% in stiffness with the additional fibre content. It was found that the increase in tensile modulus diminishes for the −45° and 90° material directions. For glass/PA6(30%), the influence of the orientation of the fibre was relatively minor. However, in the case of glass/PA6(45%), a significant reduction was observed, with the modulus value dropping from 11 GPa to approximately 6.5 GPa for the −45° and 90° material directions. In the case of the shear modulus, the difference between the two materials was evident. The increased fibre content enhanced the shear stiffness of the material across all material directions with an increase of 82%, 55%, 27% and 47% for 0°, 45°, −45° and 90° material directions, respectively, taking glass/PA6(30%) as the baseline utilising equation (4). The difference in the shear modulus was observed to be minimal in between the material directions for individual material compositions. Elastic modulus in (a) tensile and (b) shear loading of dried samples of glass/PA6 with 45% and 30% fibre content for different material directions.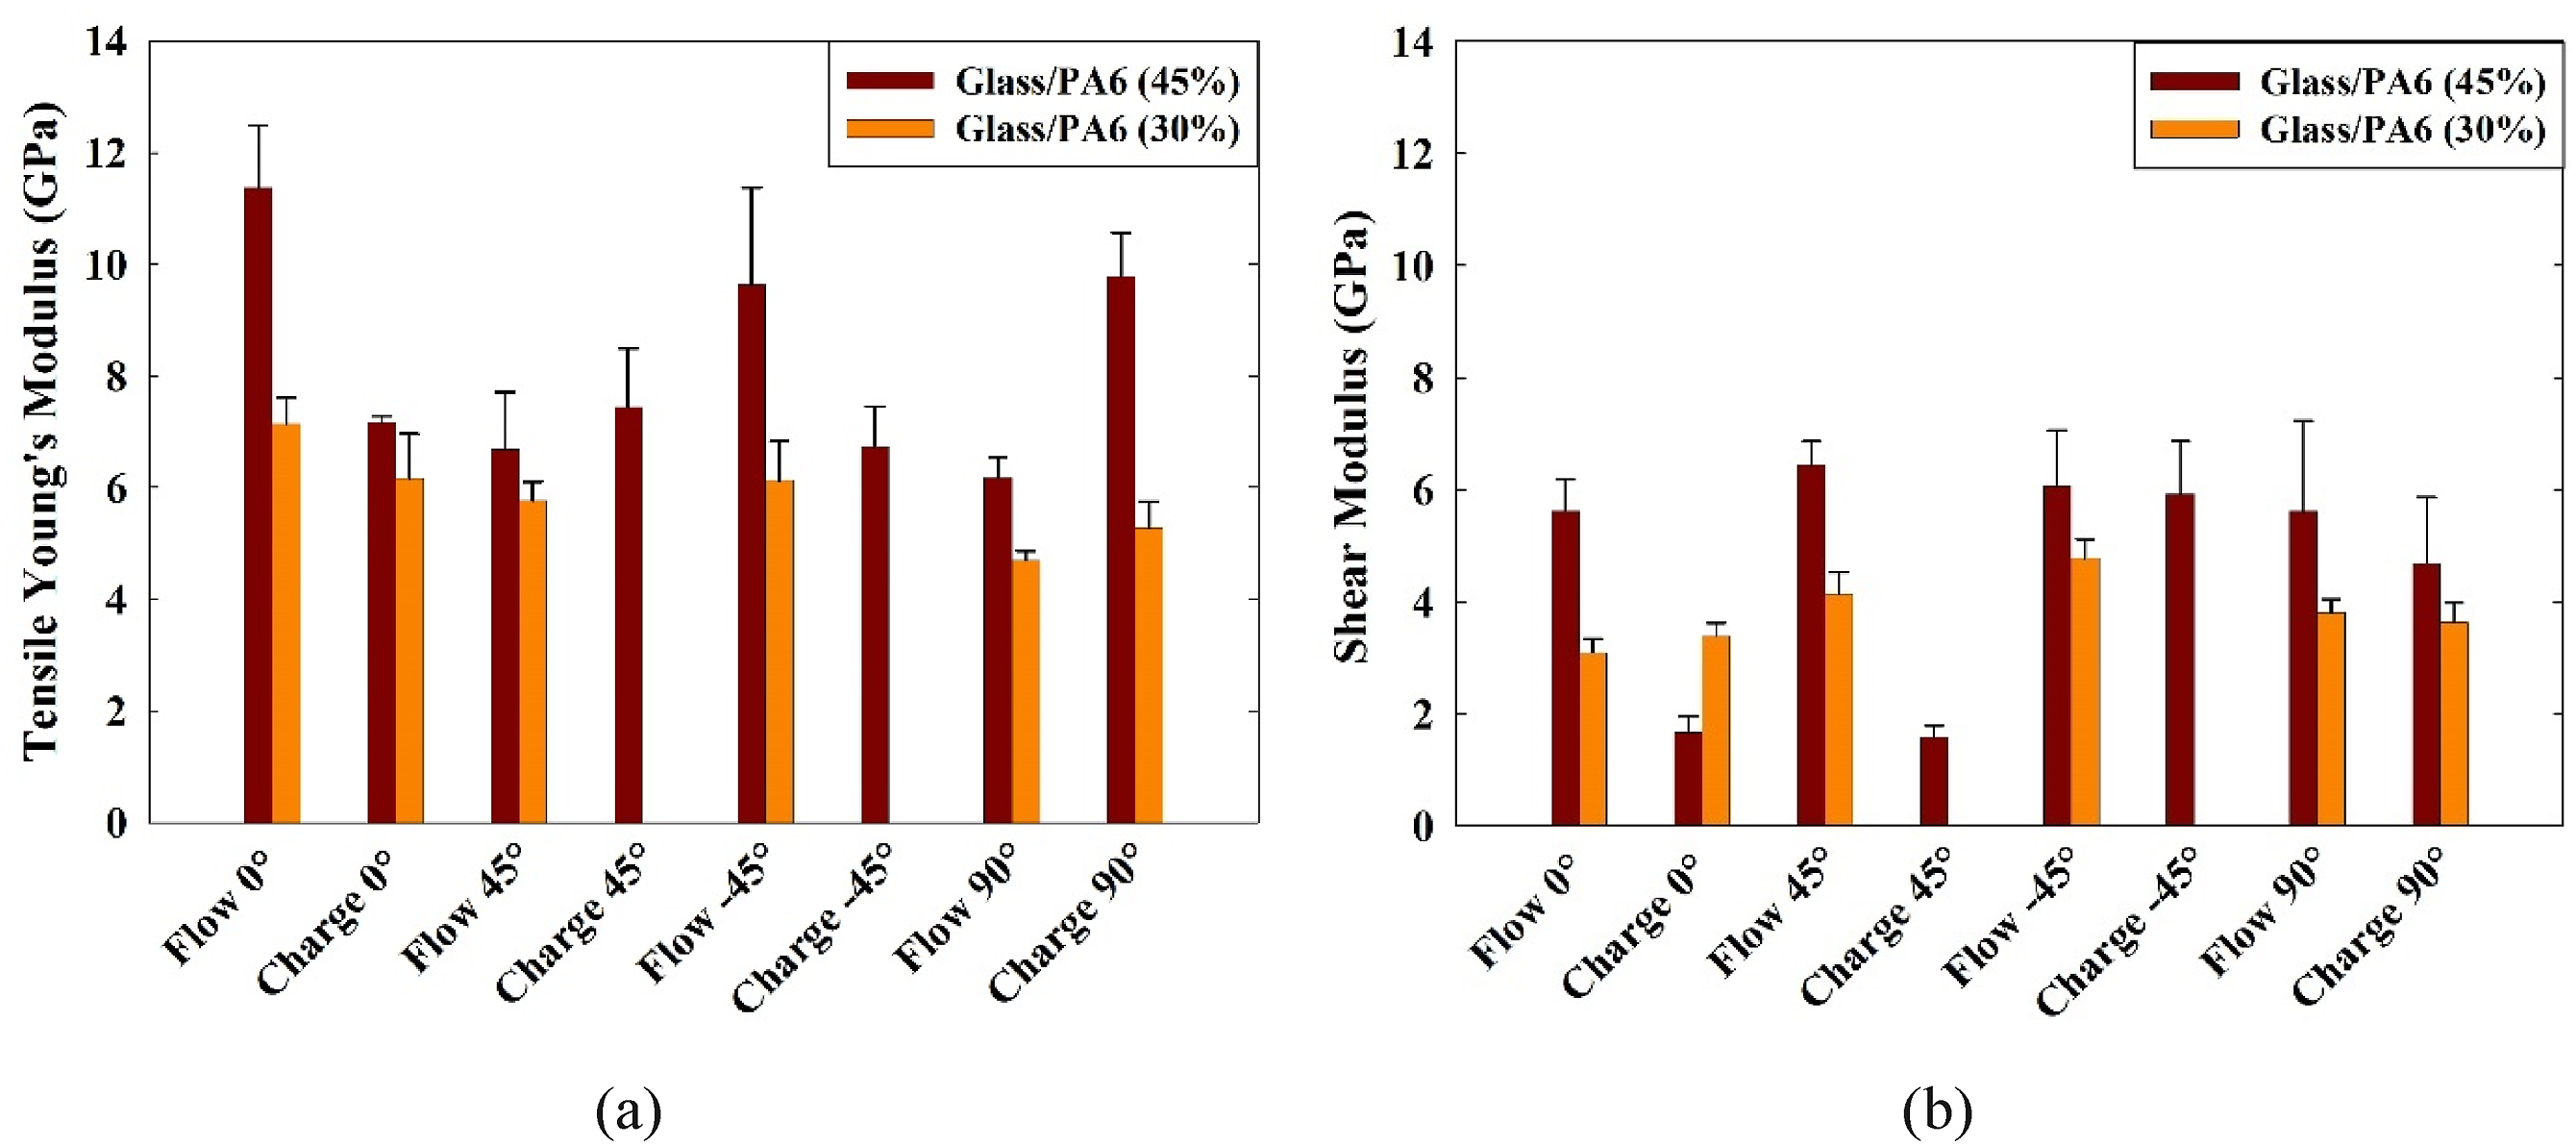
Influence of moisture
Moisture dramatically alters the mechanical properties of compression‐moulded glass/PA6 LFTs (30% and 45%) due to PA6’s high moisture absorption. Figures 10 and 11 depict the difference between the engineering stress/strain responses of the dried and undried samples from both materials. Glass/PA6(45%), with a higher fibre content than glass/PA6(30%), absorbed lower moisture of around 1.36% when compared to 2.09% of the latter. This can be attributed to the higher matrix content in glass/PA6(30%), which is responsible for the absorption of moisture. Tensile engineering stress/strain responses of (a) glass/PA6(45%) and (b) glass/PA6(30%) for dried and undried samples at different material directions. Engineering shear stress/strain responses of (a) glass/PA6(45%) and (b) glass/PA6(30%) for dried and undried samples at different material directions.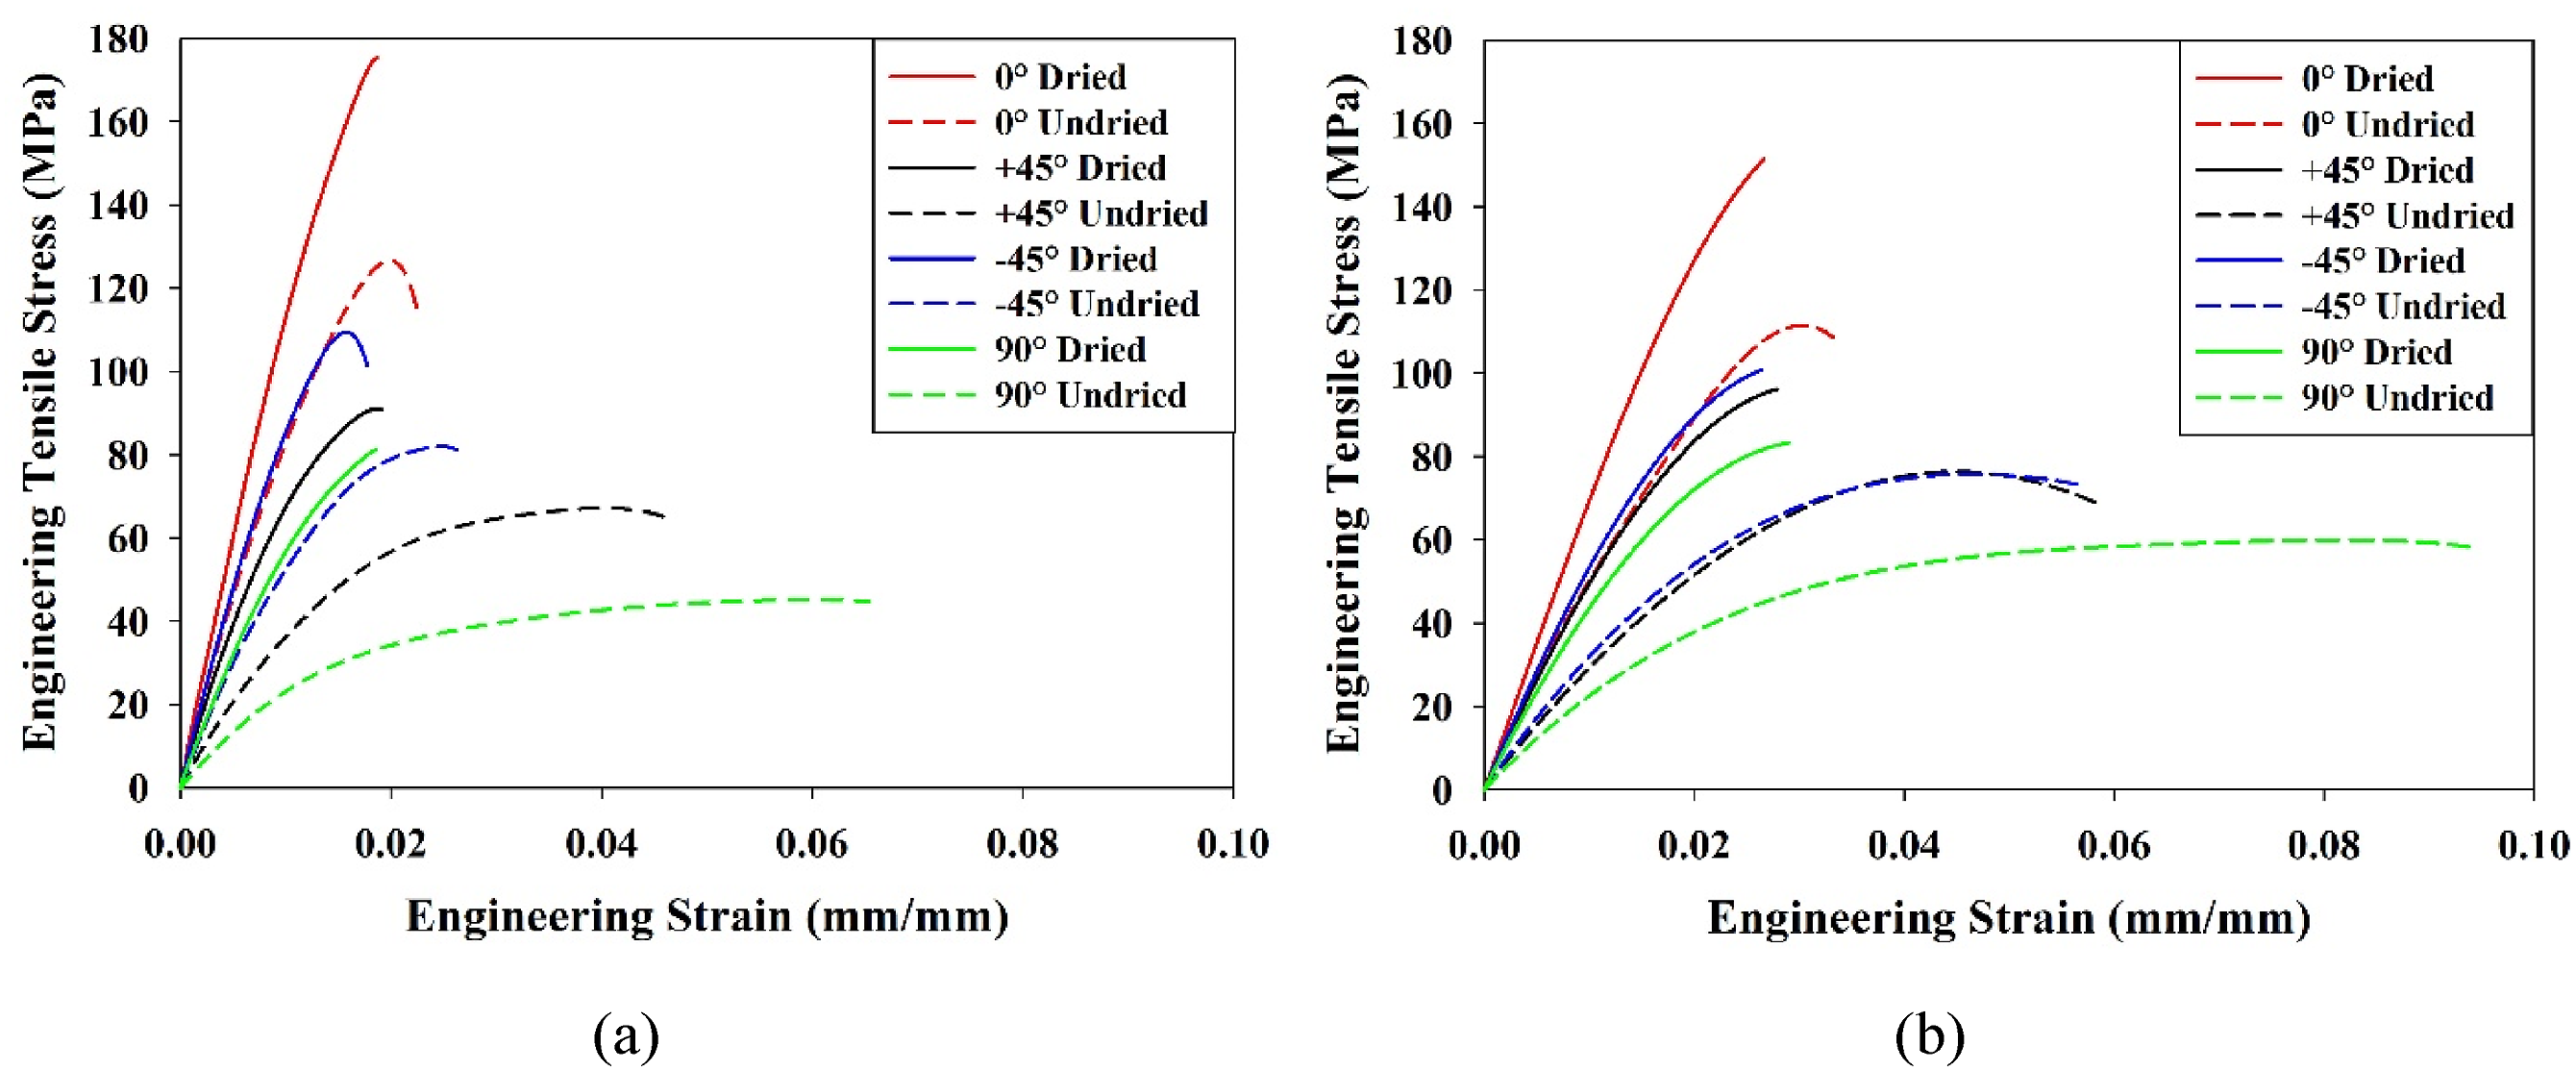
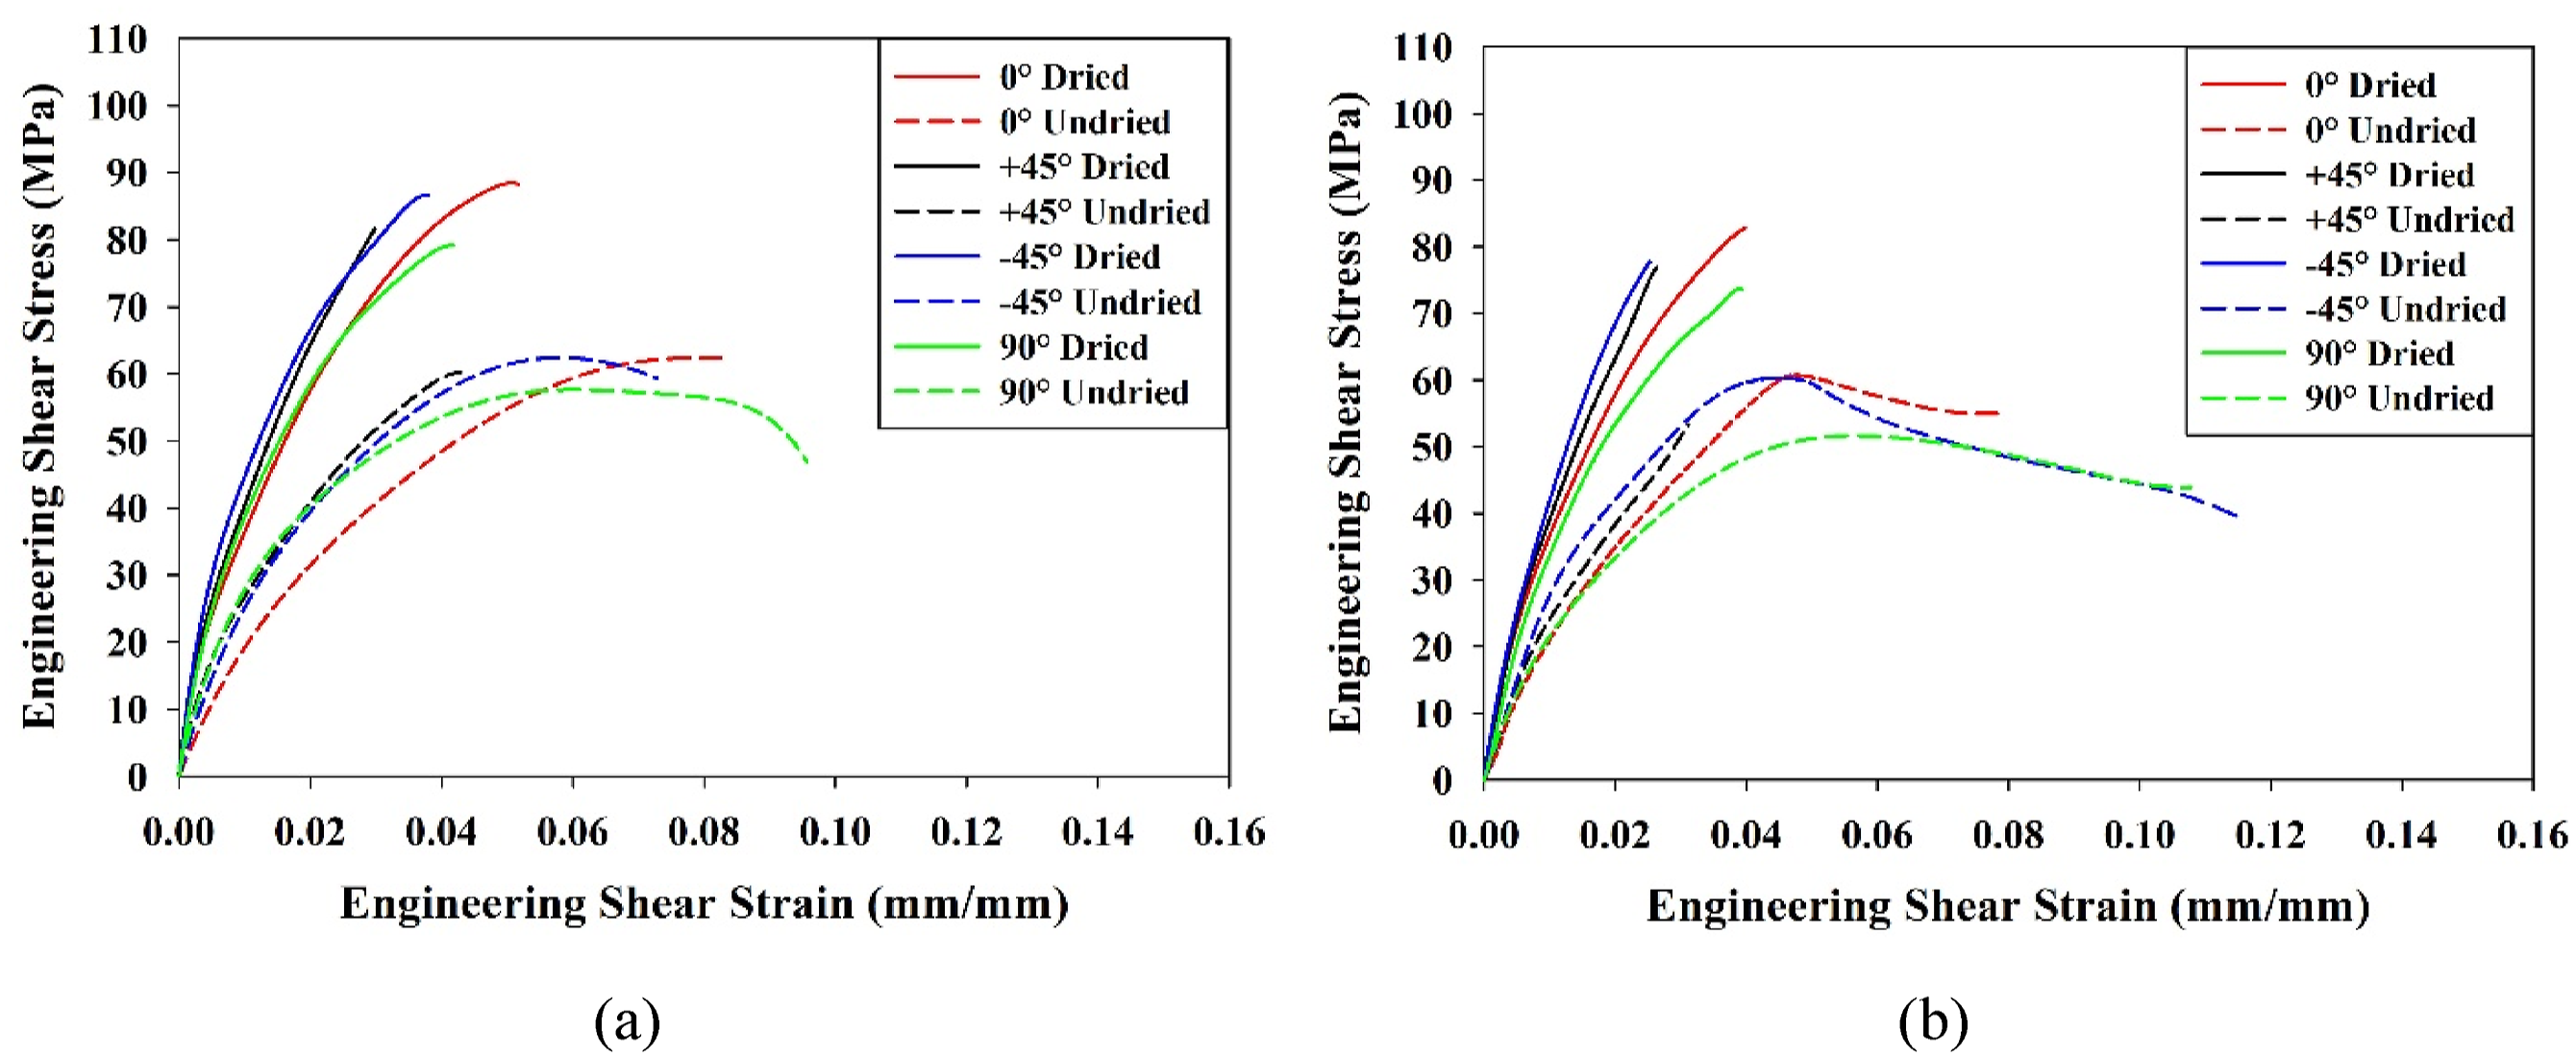
Moisture presence significantly impacts both tensile and shear properties across all material directions. Undried samples showed ductile fracture behaviour with higher elongation and progressive crack propagation, while dried samples exhibited brittle behaviour with lower strain to failure. Moisture drastically reduced the strength of the LFT material, with undried samples being much weaker than dried ones. In undried samples, a strain softening effect was observed due to fibre breakage, crack propagation, and debonding, leading to higher energy absorption and greater toughness before failure.
According to Figure 12(a) and (b), moisture content reduced the ultimate tensile and shear strength in samples from both the flow and charge regions. The undried 0° material direction experienced a reduction of around 26% in the case of glass/PA6(45%) and 29% for glass/PA6(30%) in ultimate tensile strength compared to the baseline dried material, along with 33% and 27%, respectively, in ultimate shear strength. The shear strength results are significantly higher than those of virgin PA6, which has a shear strength of approximately 66 MPa in a dried condition. This strength can further decrease by 20% to 50% depending on the moisture level of virgin PA6. Similar trends were observed for the other material directions, with undried samples having significantly lower ultimate tensile and shear strength compared to their dried counterparts. It should be noted that there are few exceptions to this trend, especially in samples from the charge region. For example, in the case of the 0° material direction, the ultimate tensile strength was nearly identical for both dried and undried samples from the charge region for glass/PA6(45%). Additionally, the dried samples for 90° material direction from the charge region of glass/PA6(45%) saw an exceptionally high tensile strength, with an increase from 55.8 MPa to 141 MPa in mean ultimate strength, compared to the undried samples. Ultimate strength in (a) tensile and (b) shear loading of dried and undried samples for glass/PA6 with 45% and 30% fibre content for different material directions.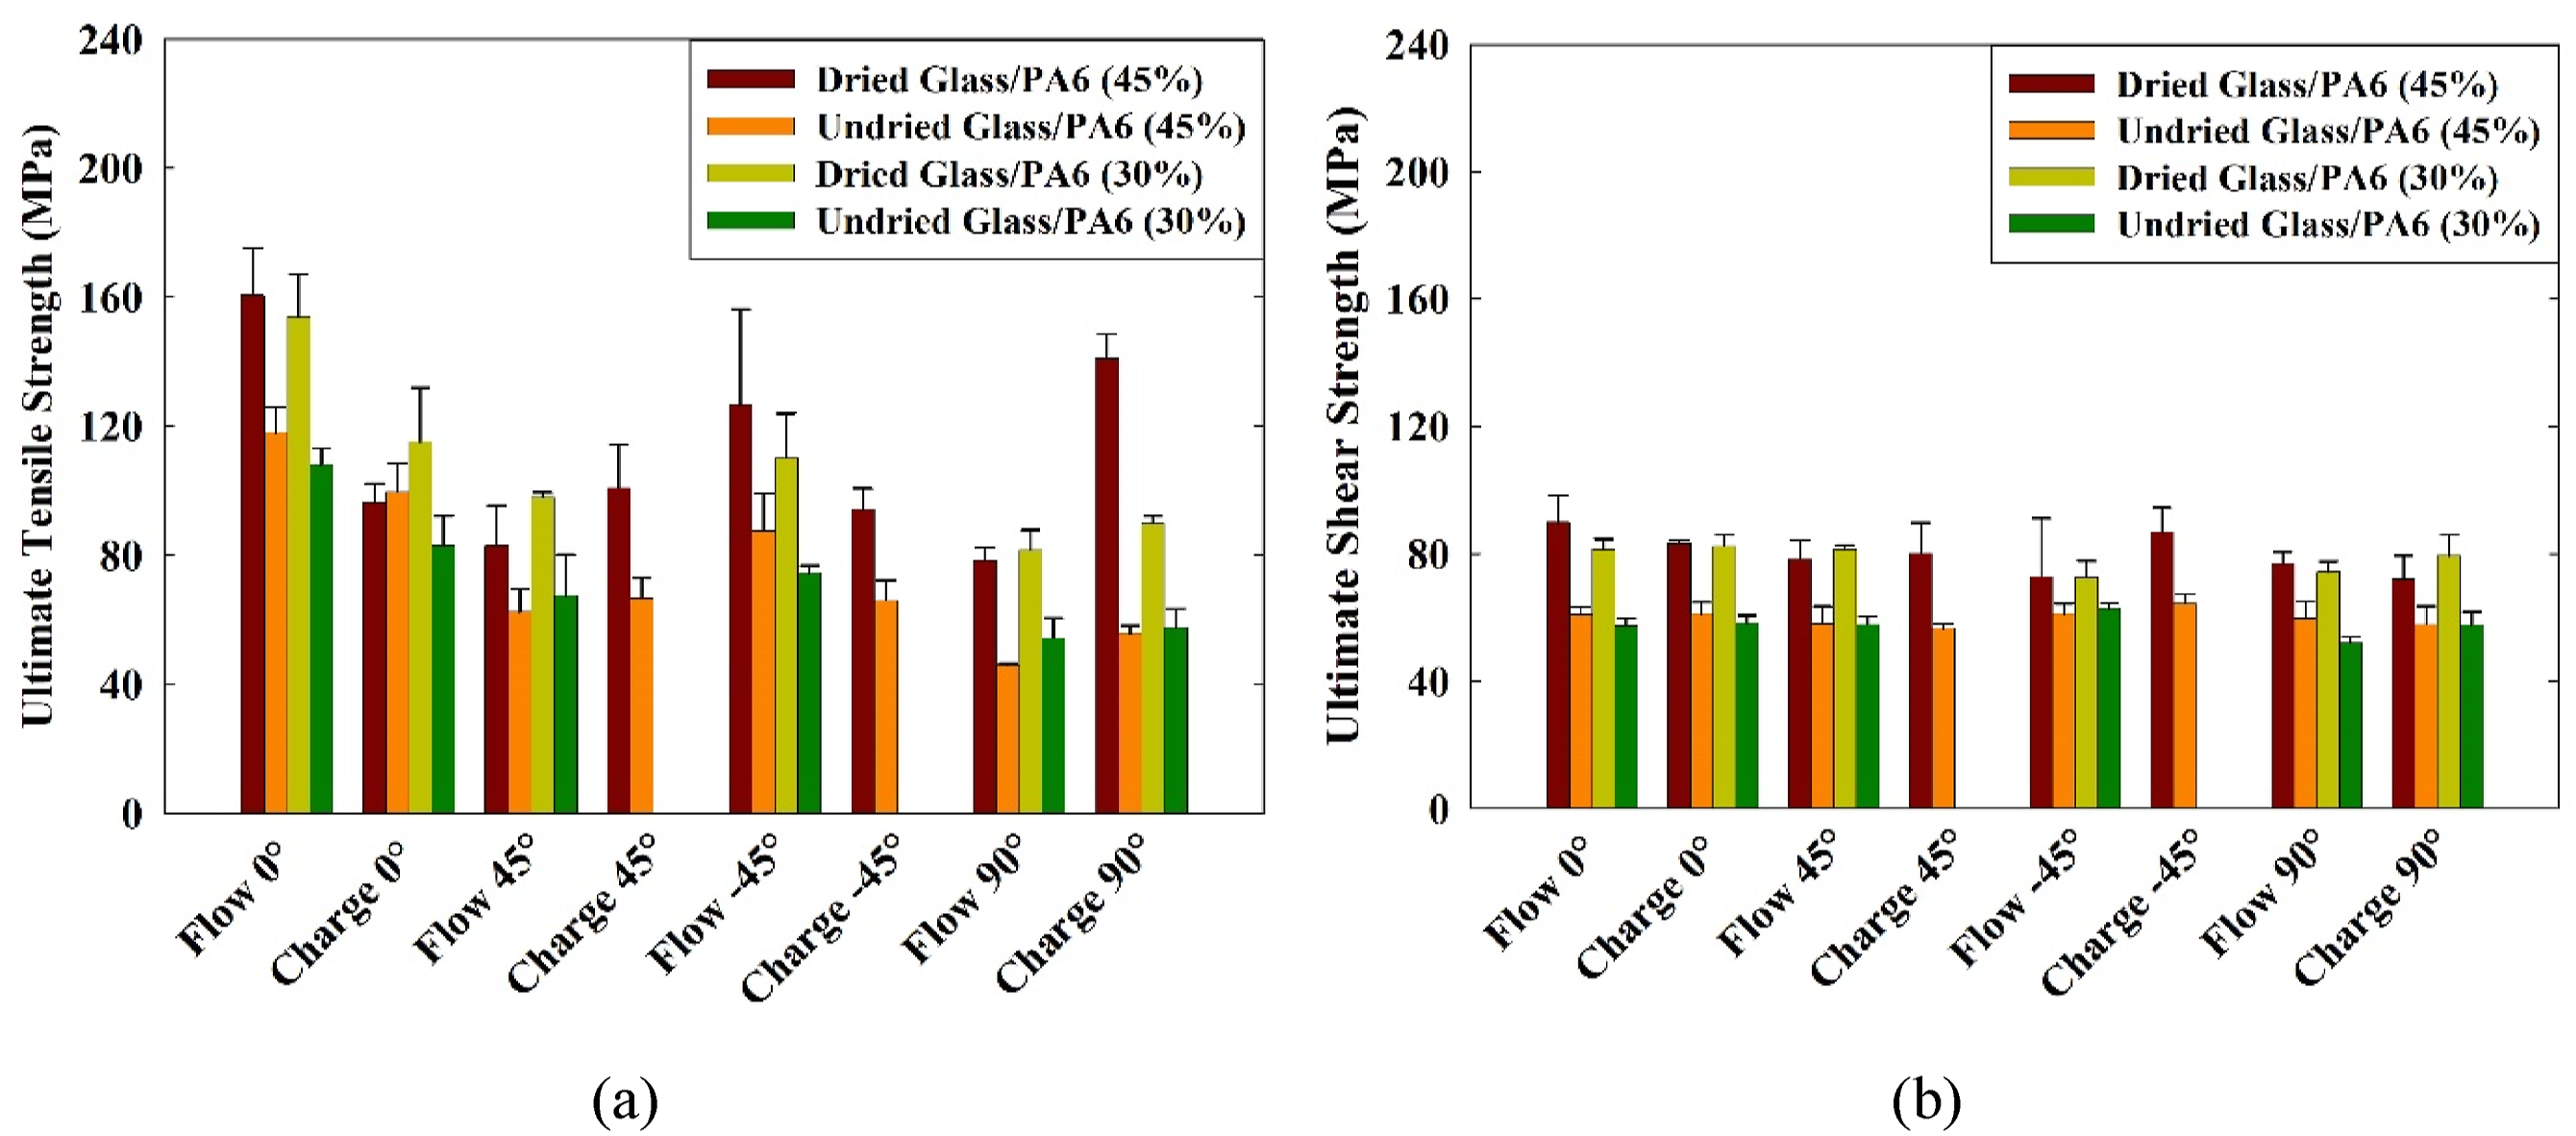
Dried samples were significantly more brittle than undried samples for both fibre content levels. Figure 13(a) shows that, in tensile loading, the change in elongation to failure was more pronounced in the 30% fibre content material, which absorbed more moisture than the 45% fibre material. The 0° material direction showed minimal moisture effect due to fibre influence, while other directions had notably higher elongation in undried conditions. For glass/PA6(30%), strain to failure increased from 0.026 mm/mm to 0.089 mm/mm when dried to undried. Excluding the 0° direction, strain-to-failure increased by 170% for glass/PA6(30%) and 118% for glass/PA6(45%) in undried samples. Samples from the charge region were more sensitive to moisture than those from the flow region. (a) Engineering tensile strain at failure and (b) Tensile toughness of dried and undried samples for glass/PA6 with 45% and 30% fibre content for different material directions.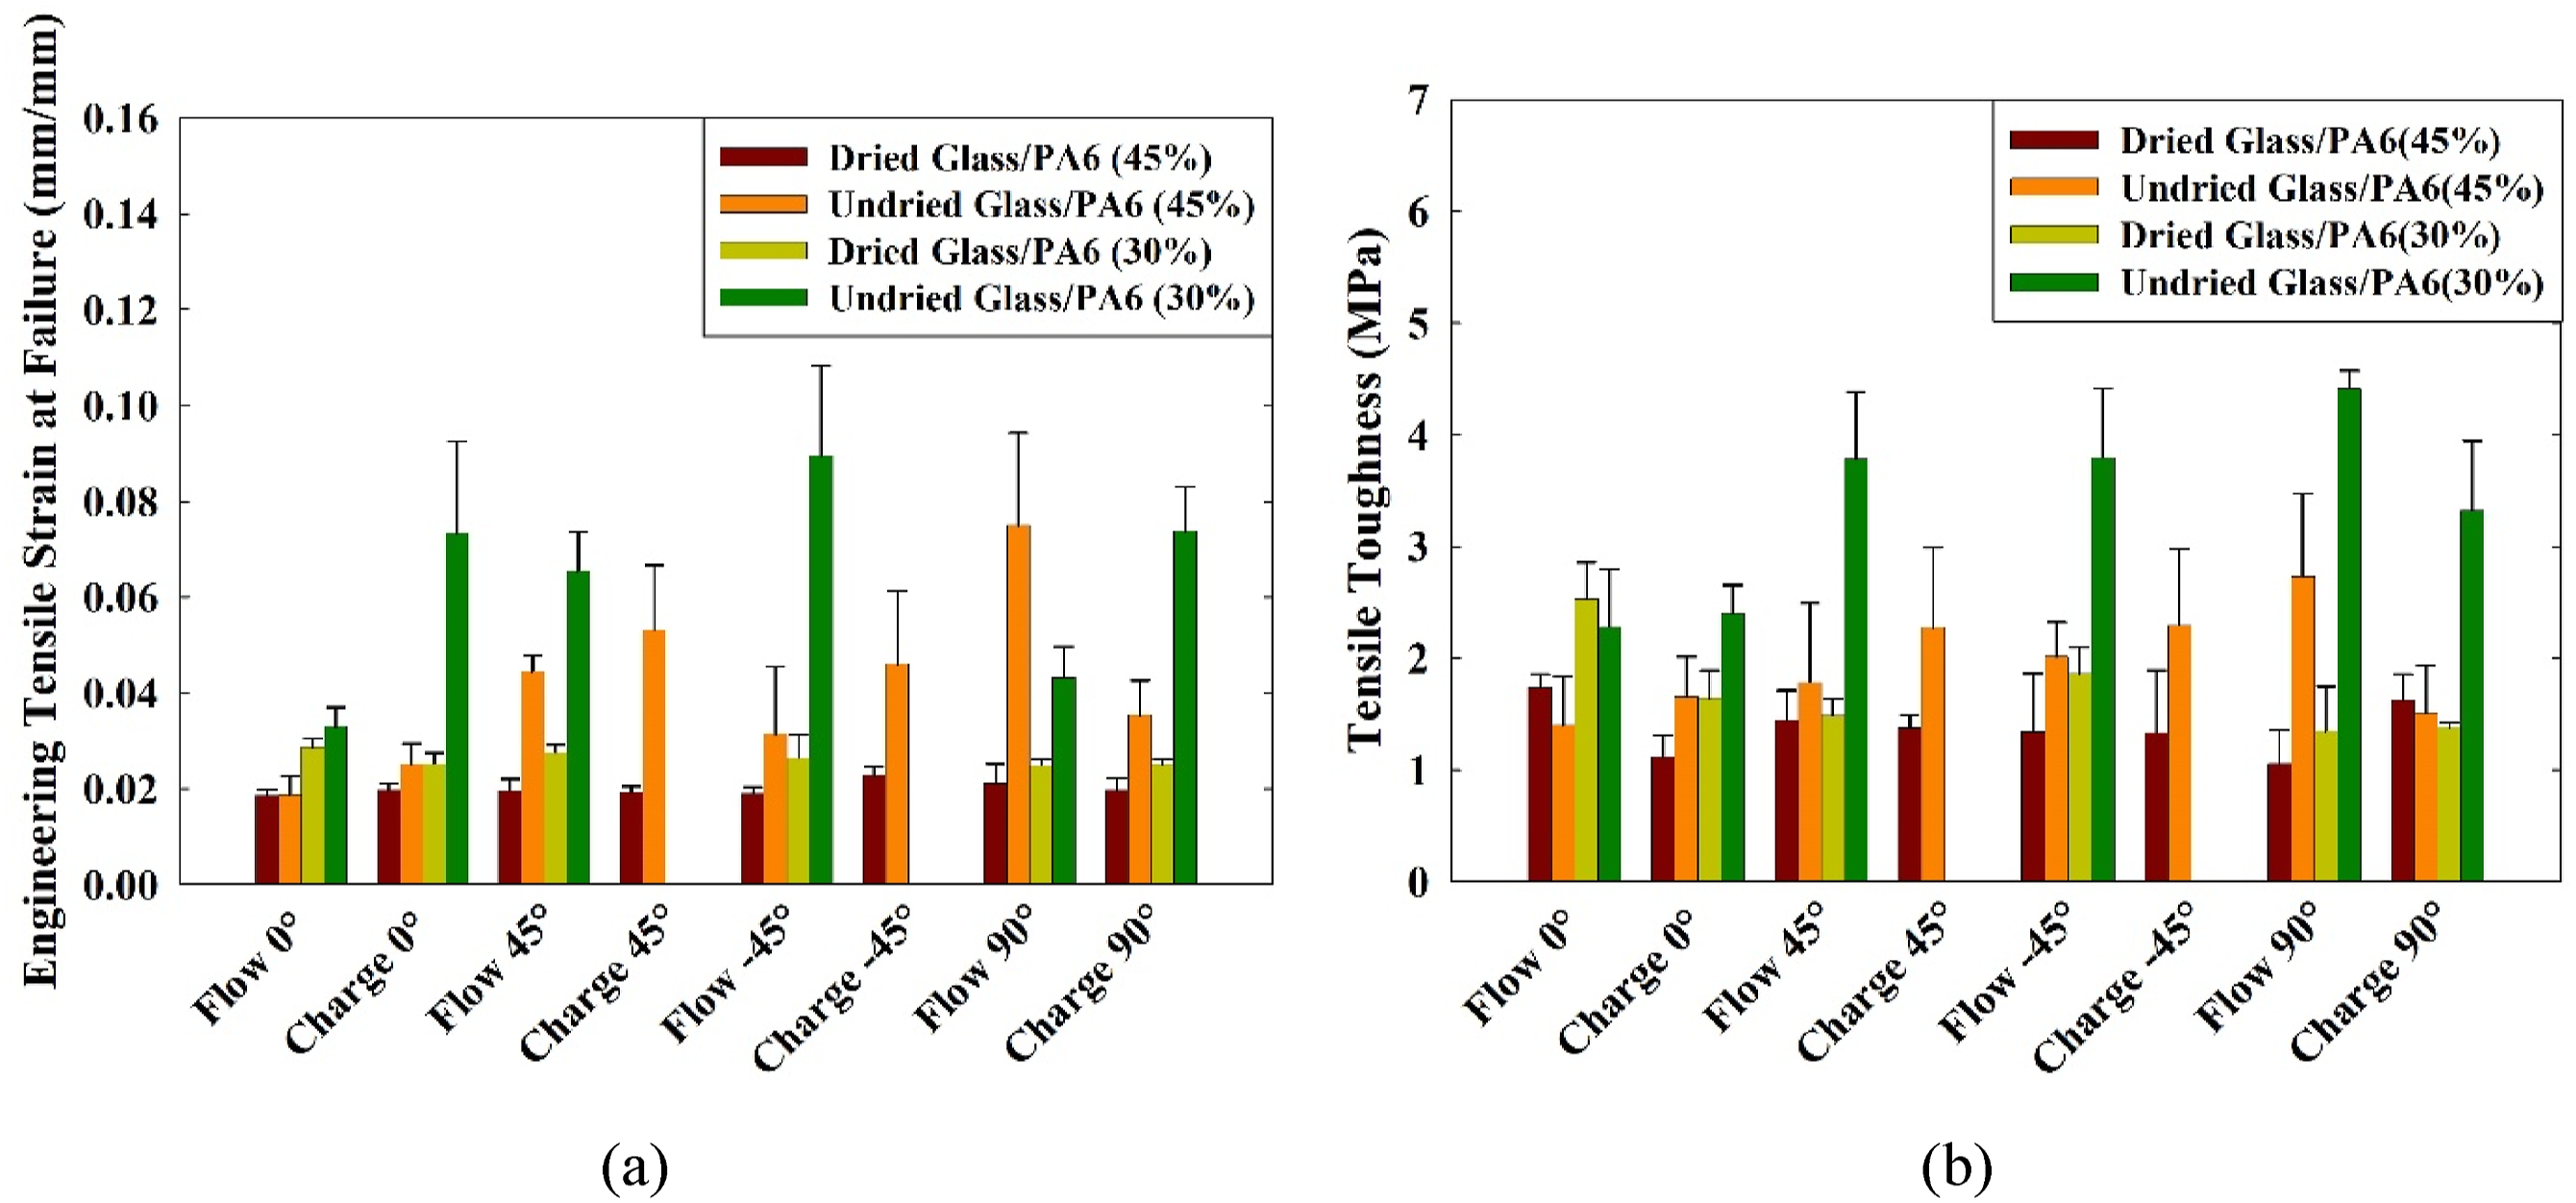
Figure 13(b) shows that moisture and fibre content significantly affect the toughness of LFT materials in different directions. Undried samples exhibited greater tensile toughness than dried samples, except for the 0° direction, indicating higher plastic behaviour and energy absorption. Moisture had a greater impact on samples from the charge region than the flow region, except in the 90° direction. The higher fibre content in glass/PA6(45%) reduced moisture absorption, leading to less variation between dried and undried conditions. Glass/PA6(30%) with lower fibre content showed higher toughness, with a +230% increase in toughness for undried samples in the 90° direction, compared to the dried samples. Similar trends were seen in other directions, with toughness increases ranging from 46% to 230%. Glass/PA6(45%) also showed increased toughness, but the change from dried to undried was smaller than in glass/PA6(30%).
Failure crack pattern in shear loading
In shear testing, dried and undried samples showed different cracking behaviours upon failure, more so in glass/PA6(30%) than in glass/PA6(45%). Although no clear influence of fibre content or orientation was observed for ultimate shear strength, however, crack pattern and propagation of cracks were influenced by these parameters, which is evident from Figures 14 and 15. Figures 14 and 15 illustrate failure images for samples in various flow directions. In Figures 14 and 15, the rear side refers to the speckled or dotted patterned side of the sample, while the front side in Figure 14 denotes the non-painted side. The non-painted side was showcased in order to clearly represent the failure pattern because a total failure was not observed for the undried samples due to the limitation of the apparatus. Yang et al.
54
explained the colour variations (light and dark), seen in Figure 15, in the samples from their study on glass/PA6 direct compounded LFT materials. The cracking patterns of failed shear specimens, both dried (observed from the rear side) and undried, (observed from the front side) in various loading orientations. The cracking patterns of failed shear specimens, both dried and undried, observed from the rear side in various loading orientations.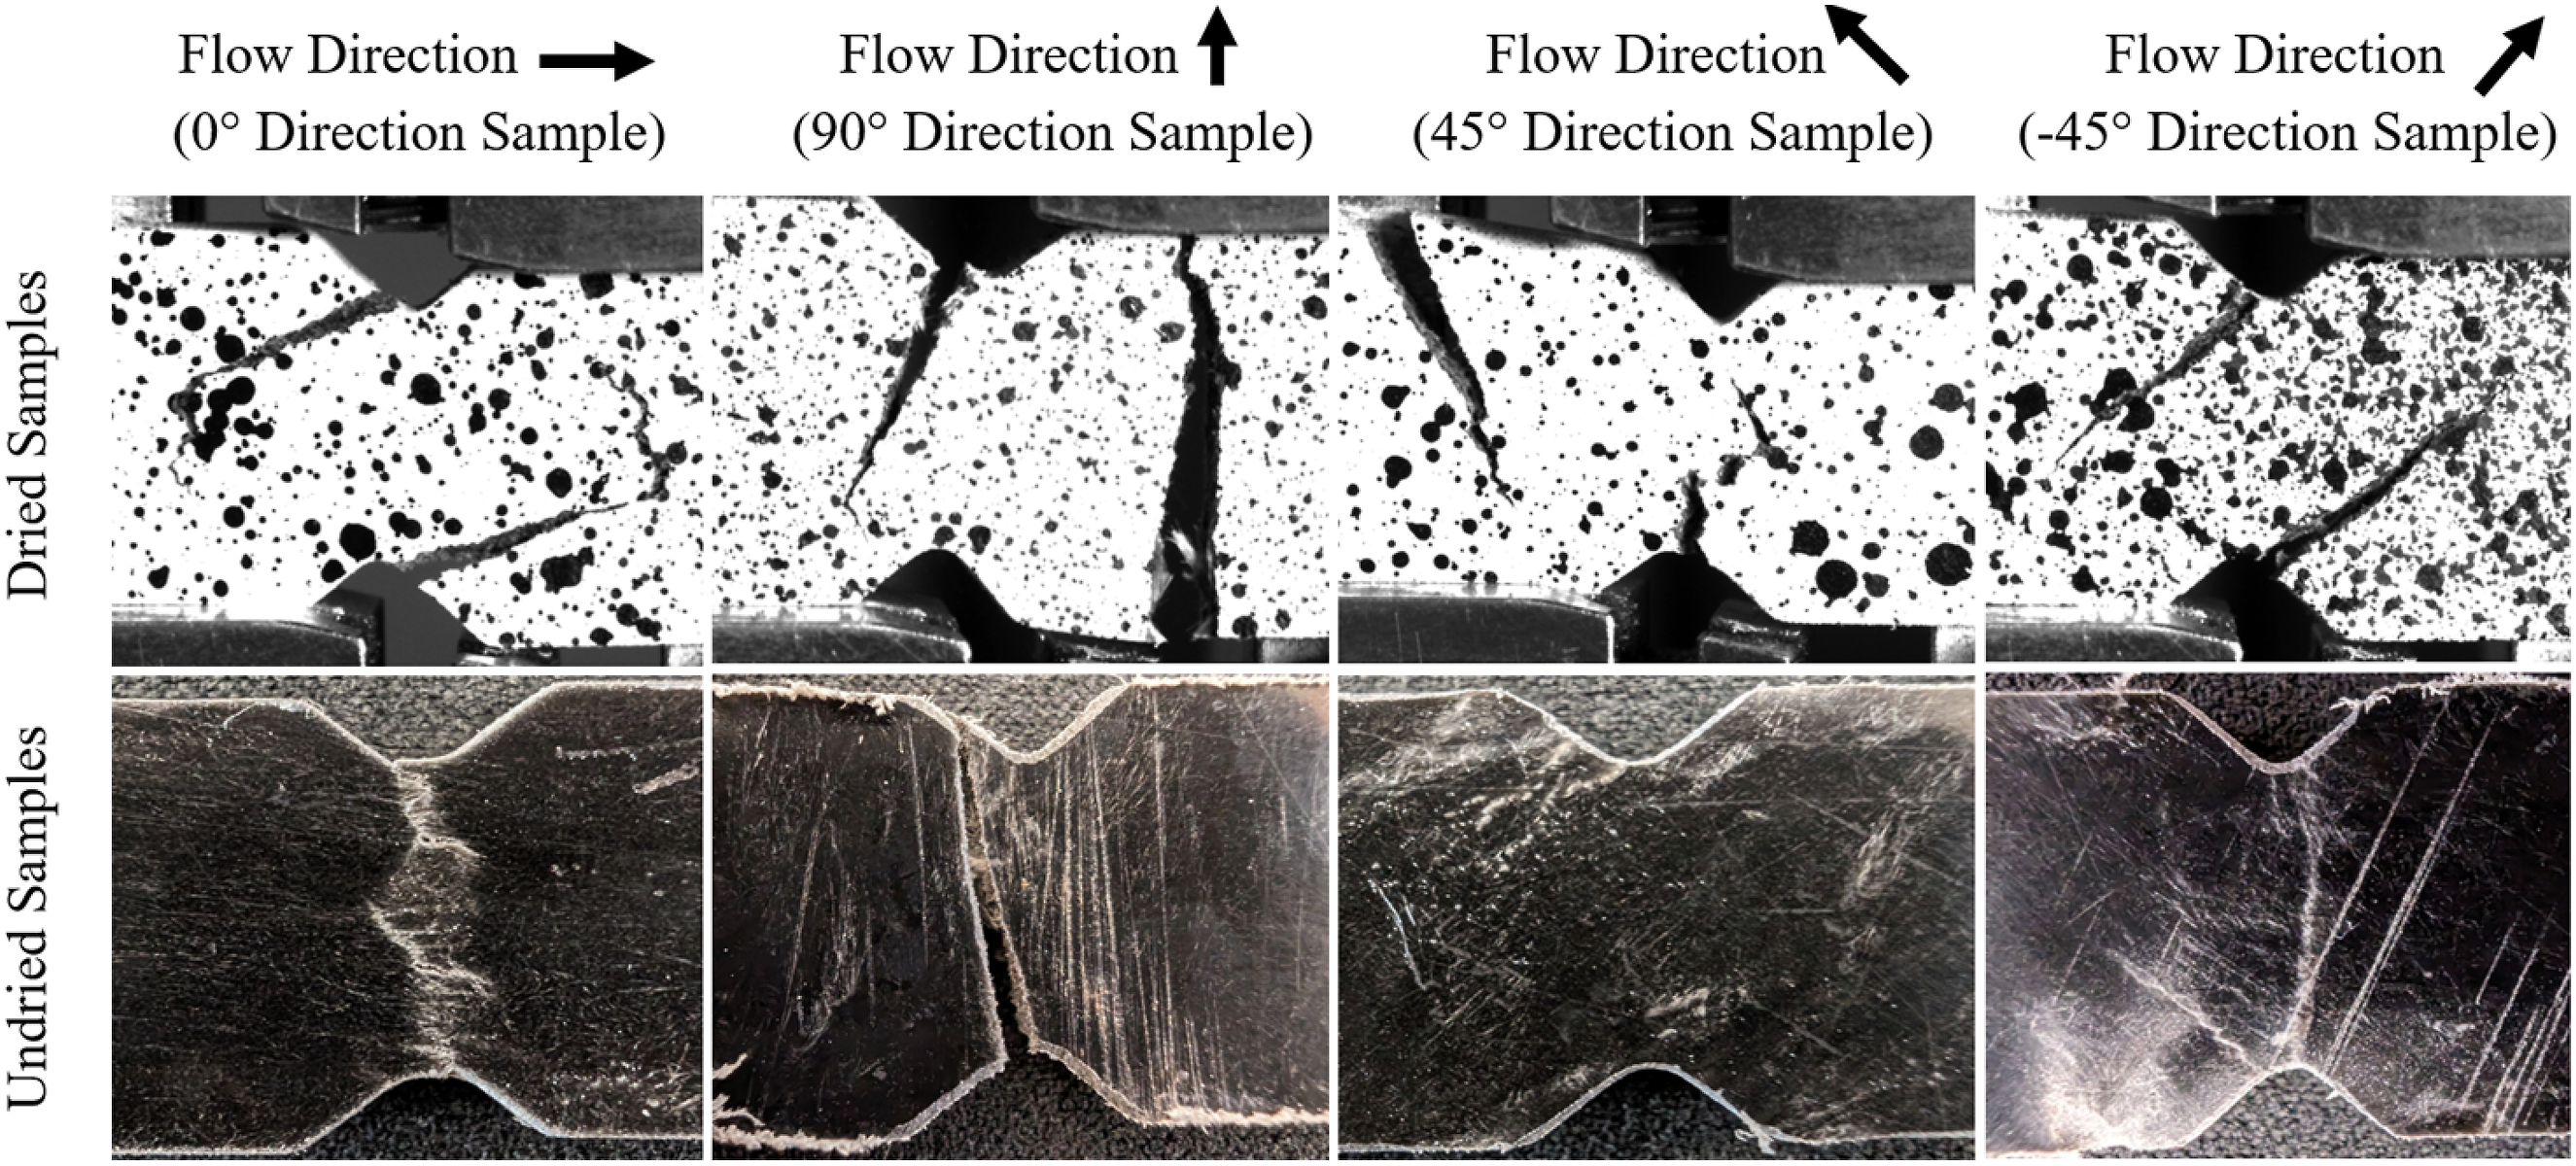
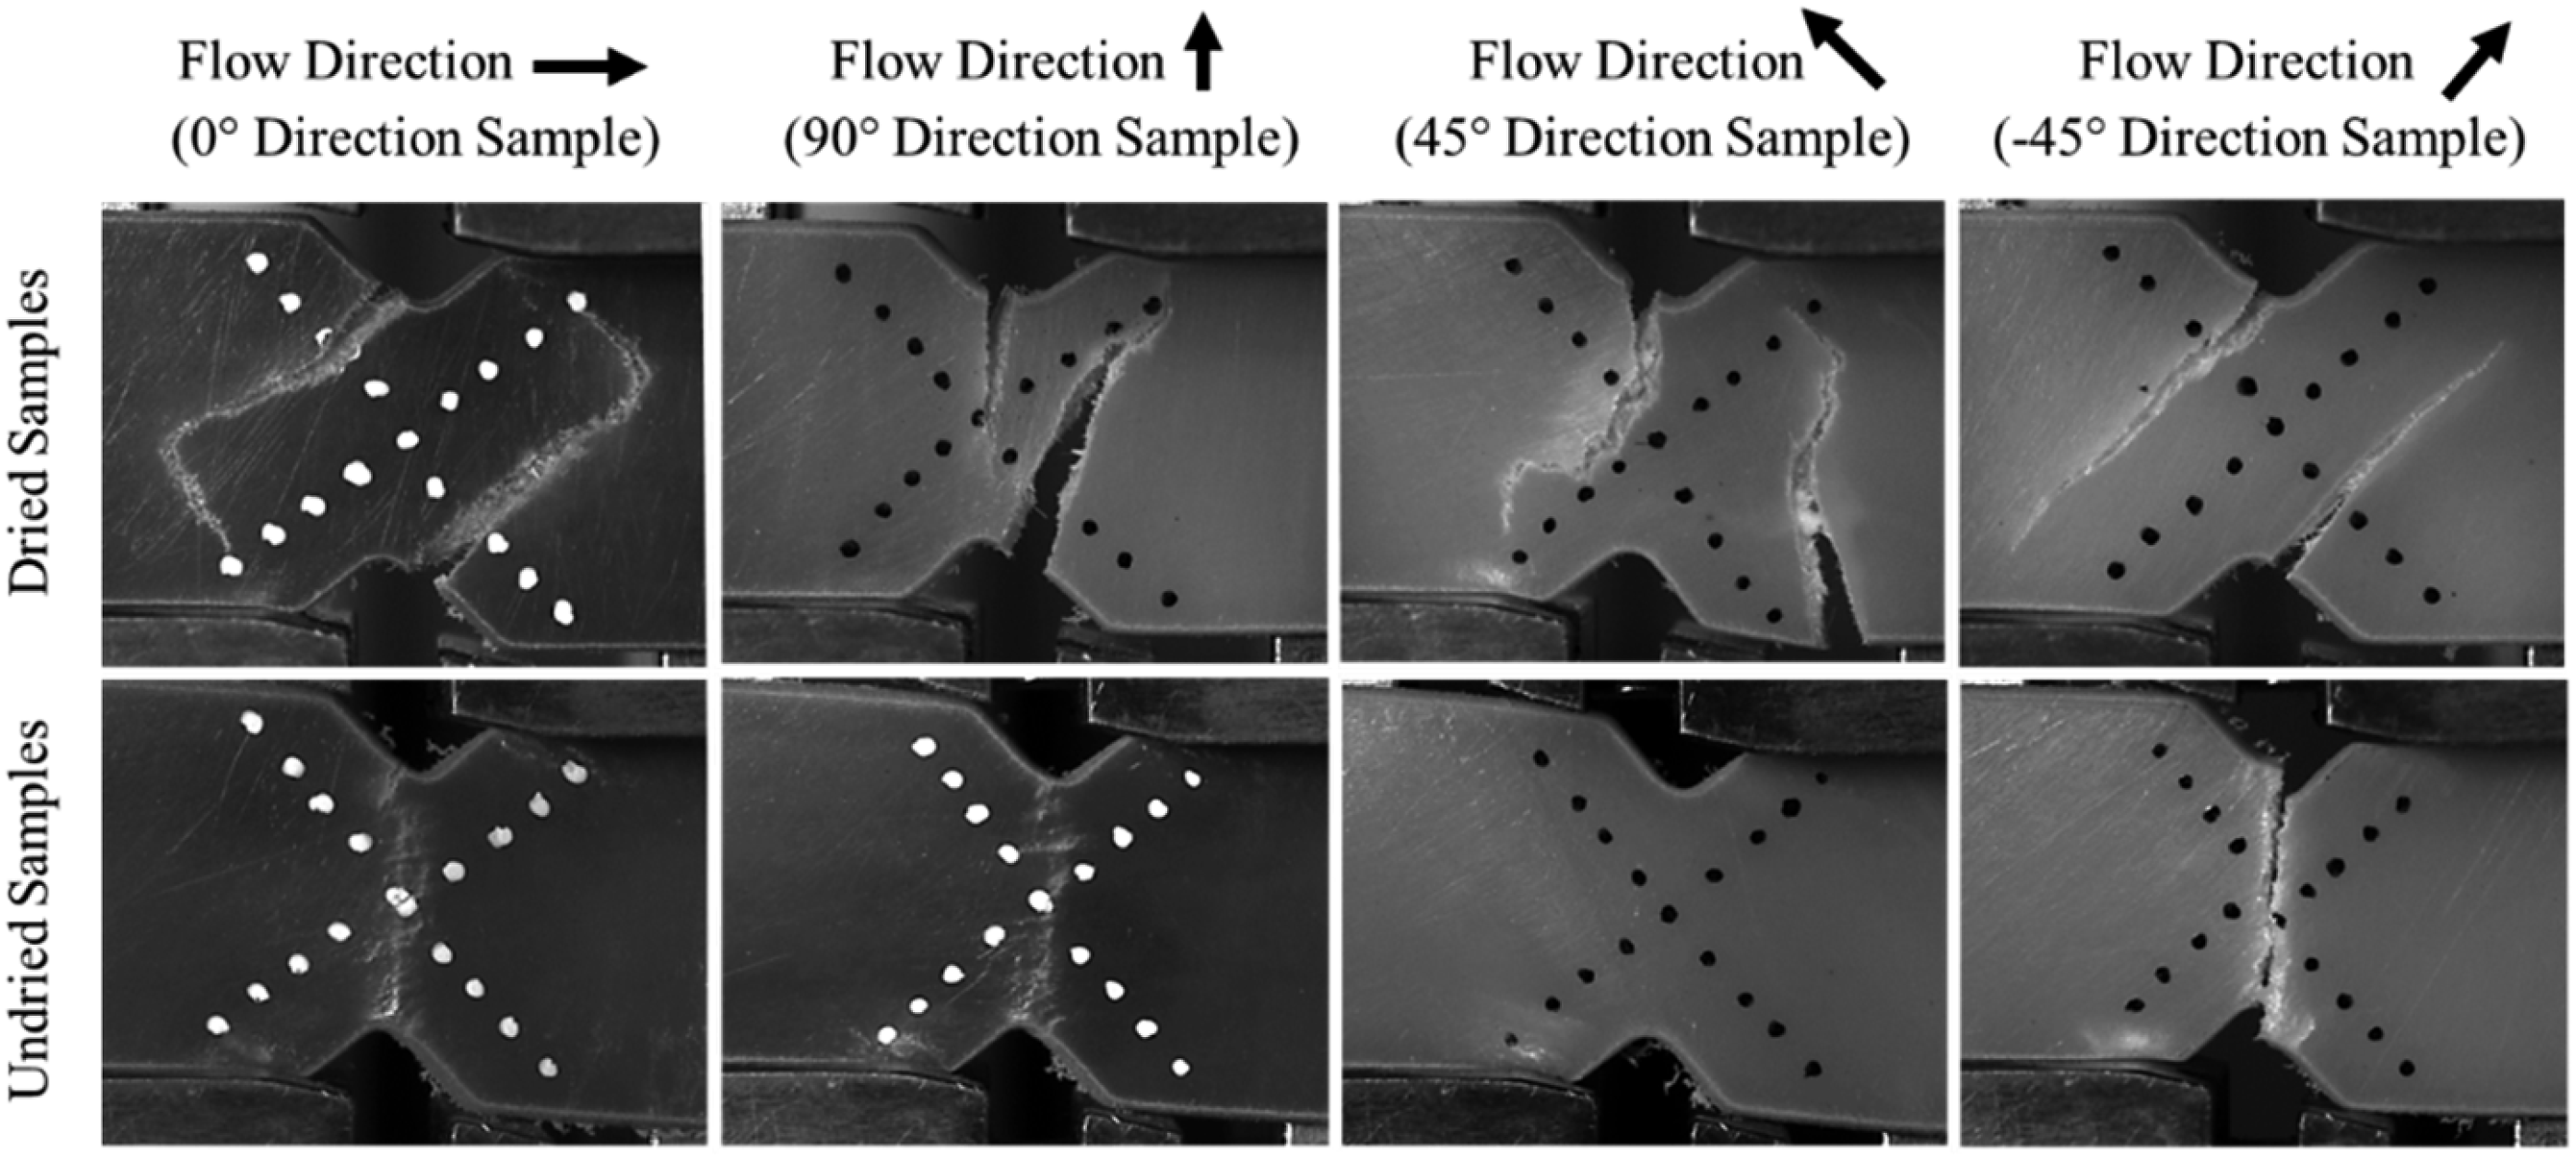
Dried samples exhibited brittle failure, while undried samples experienced ductile failure. Apart from the undried 45° material direction samples, undried samples typically failed at the centre of the notch region. The strain responses in the 45° samples were affected by excessive plastic deformation at the lower left edge of the notch due to the test apparatus and fibre orientation. Dried samples at the −45° material direction displayed a linear failure pattern, indicating good alignment of fibres with the crack pattern. This study highlights the importance of fibre/matrix bonding in V-notch beam shear test outcomes. A stark difference was observed in the crack pattern for the different material directions for both the glass/PA6 materials in the dried samples from the flow region. The cracks initiate at the notch region and propagate through the samples in different directions depending on the material direction. In the −45° material direction, the cracks develop along the direction of fibres, thus indicating failure of the matrix along the length of the fibres. A similar mechanism is observed for the 0° material direction where the propagation of the crack is initially along the fibre length, after which a sudden change of 90° can be observed. This may be due to the sufficient leverage offered by the initial cracking, which resulted in the crack propagation towards the direction of the load.
DIC analysis
To verify the strain data and document the strain distribution during shear loading, a Digital Image Correlation (DIC) analysis was performed for glass/PA6(30%). For this analysis, samples were speckled with random patterns of paint. Figure 16 displays the varied DIC fringe patterns of von Mises effective strain observed during the shear loading of the dried 0° material direction. Figure 16 shows von Mises effective strain at different crosshead displacements, focusing on three specific locations on the shear sample before failure: the bottom left, top right, and middle of the notch region. The edges of the test showed severe deformation in the areas in contact with the apparatus. Before failure, areas outside the notch region remained undeformed. Although dried 0° shear samples did not fail exactly at the notch due to their brittle characteristics, the effective strain was primarily focused at the centre, suggesting a nearly pure shear deformation pattern. (a) Speckled flow region of dried material oriented at 0° before and after undergoing a shear test, (b) DIC fringed images showing von Mises effective strain from 0.5 mm to 2.6 mm of crosshead displacement.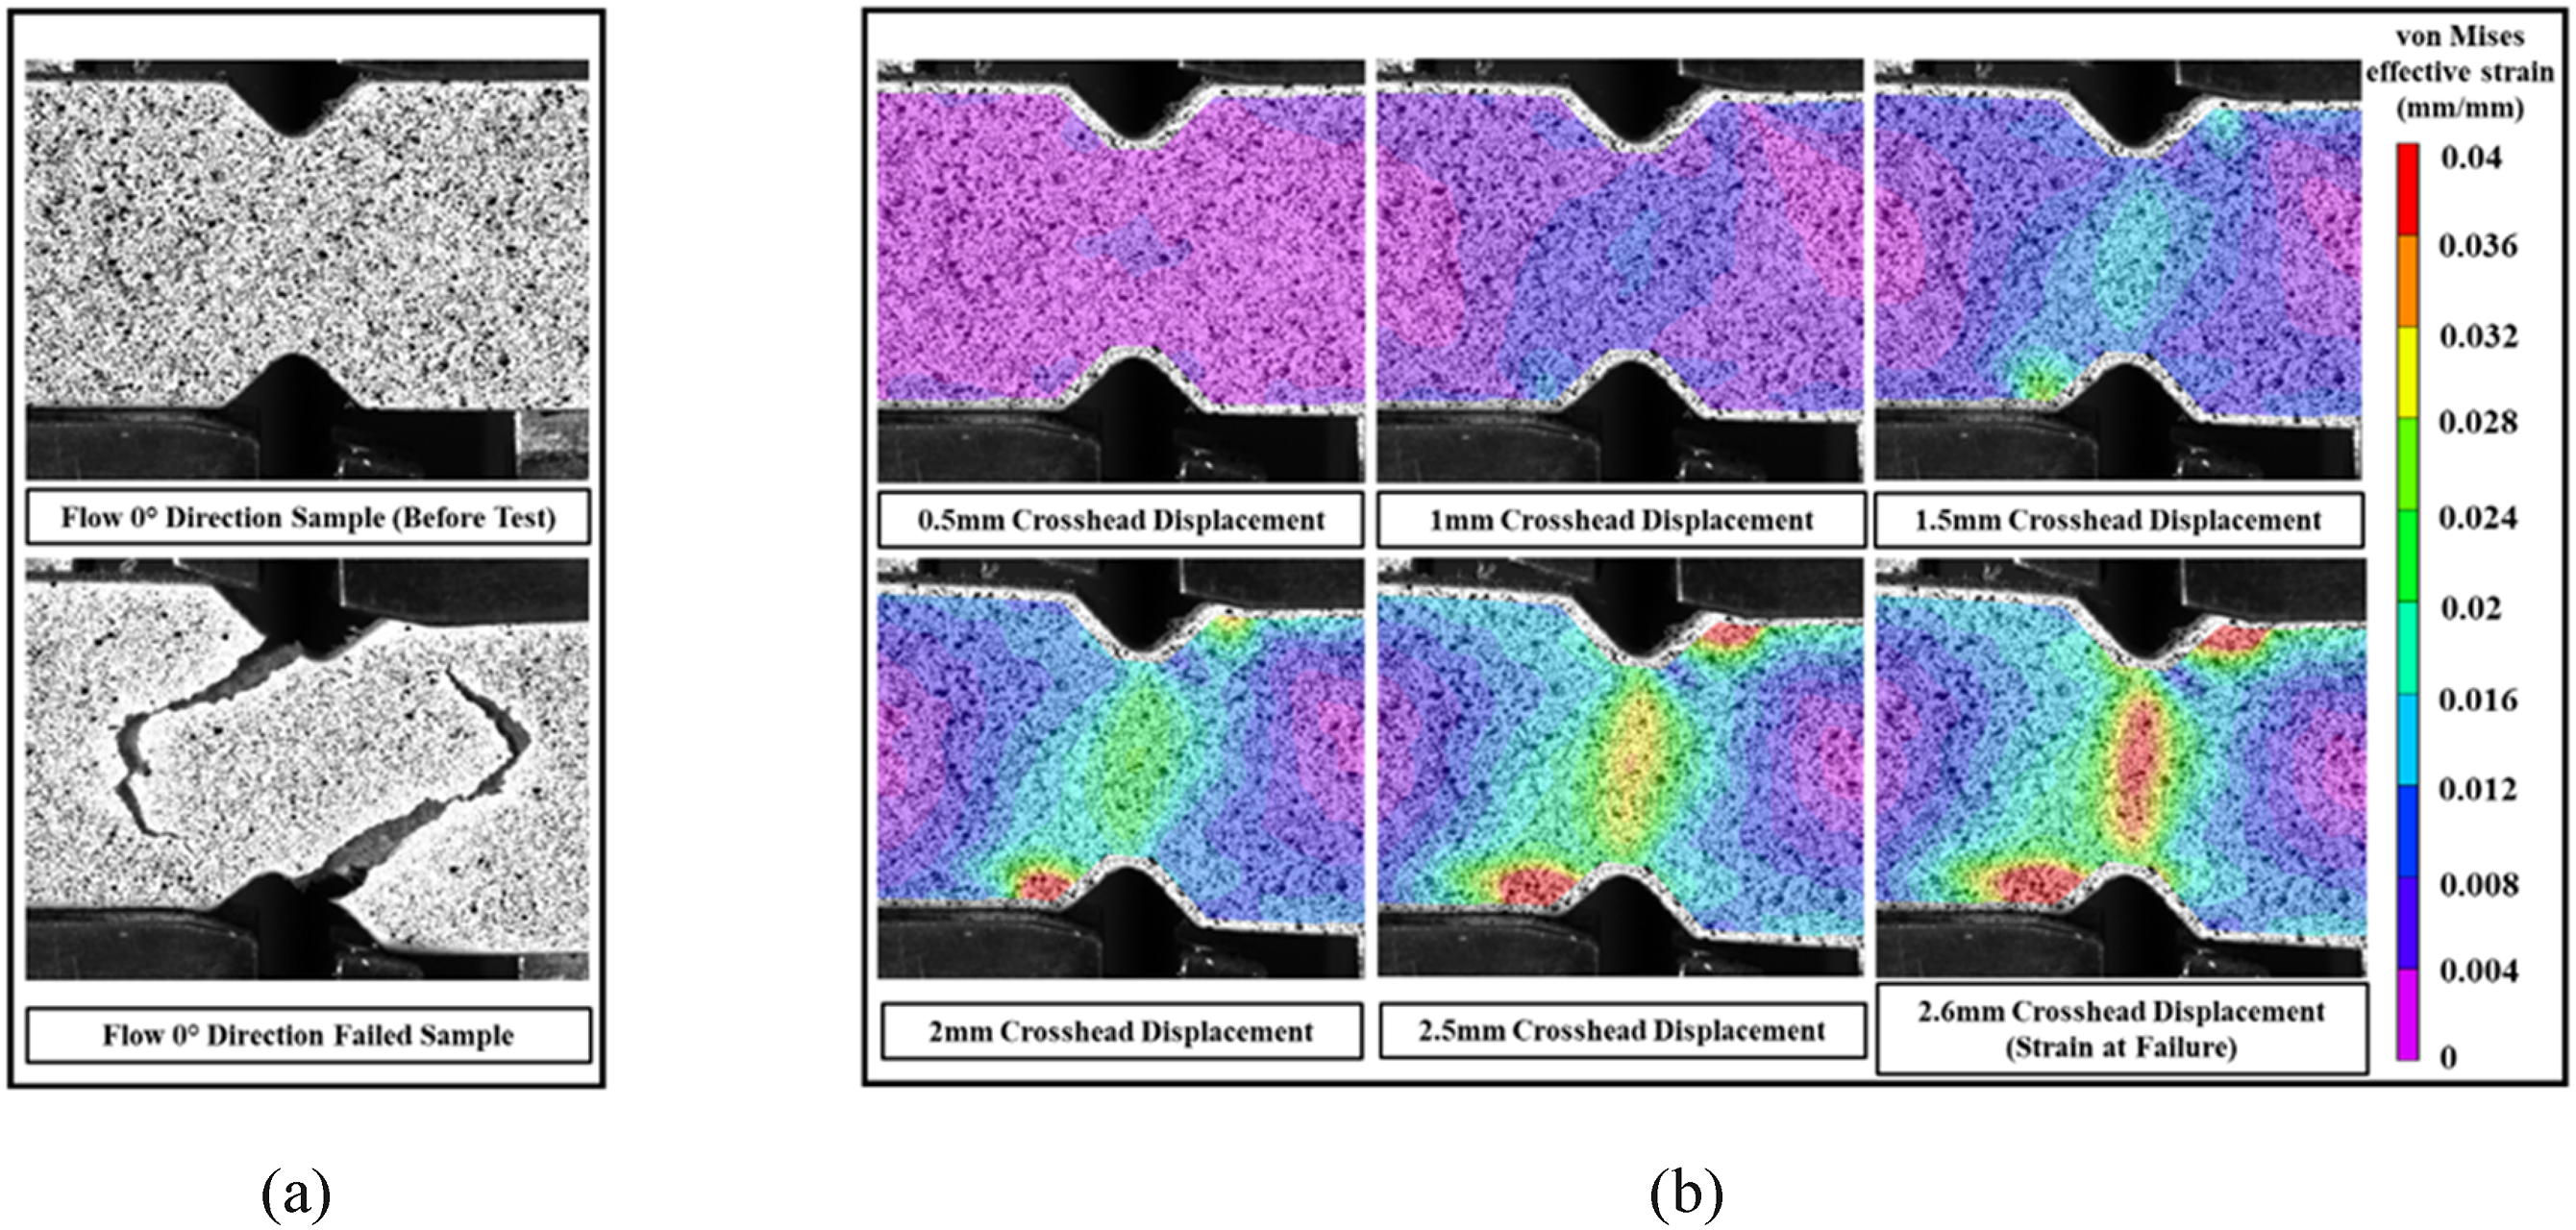
A von Mises effective strain value of 0.037 mm/mm was captured through DIC analysis before failure, while an engineering strain failure value of 0.039 mm/mm was recorded using the MTS video extensometer. Extensometer measurements were performed using 2D DIC software, adhering to ASTM D5379 methodology. The precision of the DIC method was evaluated by comparing shear stress/engineering shear strain data from the DIC to those from the MTS video extensometer responses, following the ASTM D5379 standard and using a validation metric specified in equation (5).
55

In this context,
Fracture surface microstructure analysis
SEM analysis of glass/PA6 long fibre thermoplastics compared tensile fracture surfaces of dried and undried samples in 0° and 90° orientations. Figures 17 and 18 show fracture surfaces in flow regions for both conditions in glass/PA6(30%) LFT material. SEM images of glass/PA6 flow region 0° direction of tensile loading; (a–c) undried, (d–f) dried fracture surfaces. SEM images of glass/PA6 flow region 90° direction of tensile loading; (a–c) undried, (d–f) dried fracture surfaces.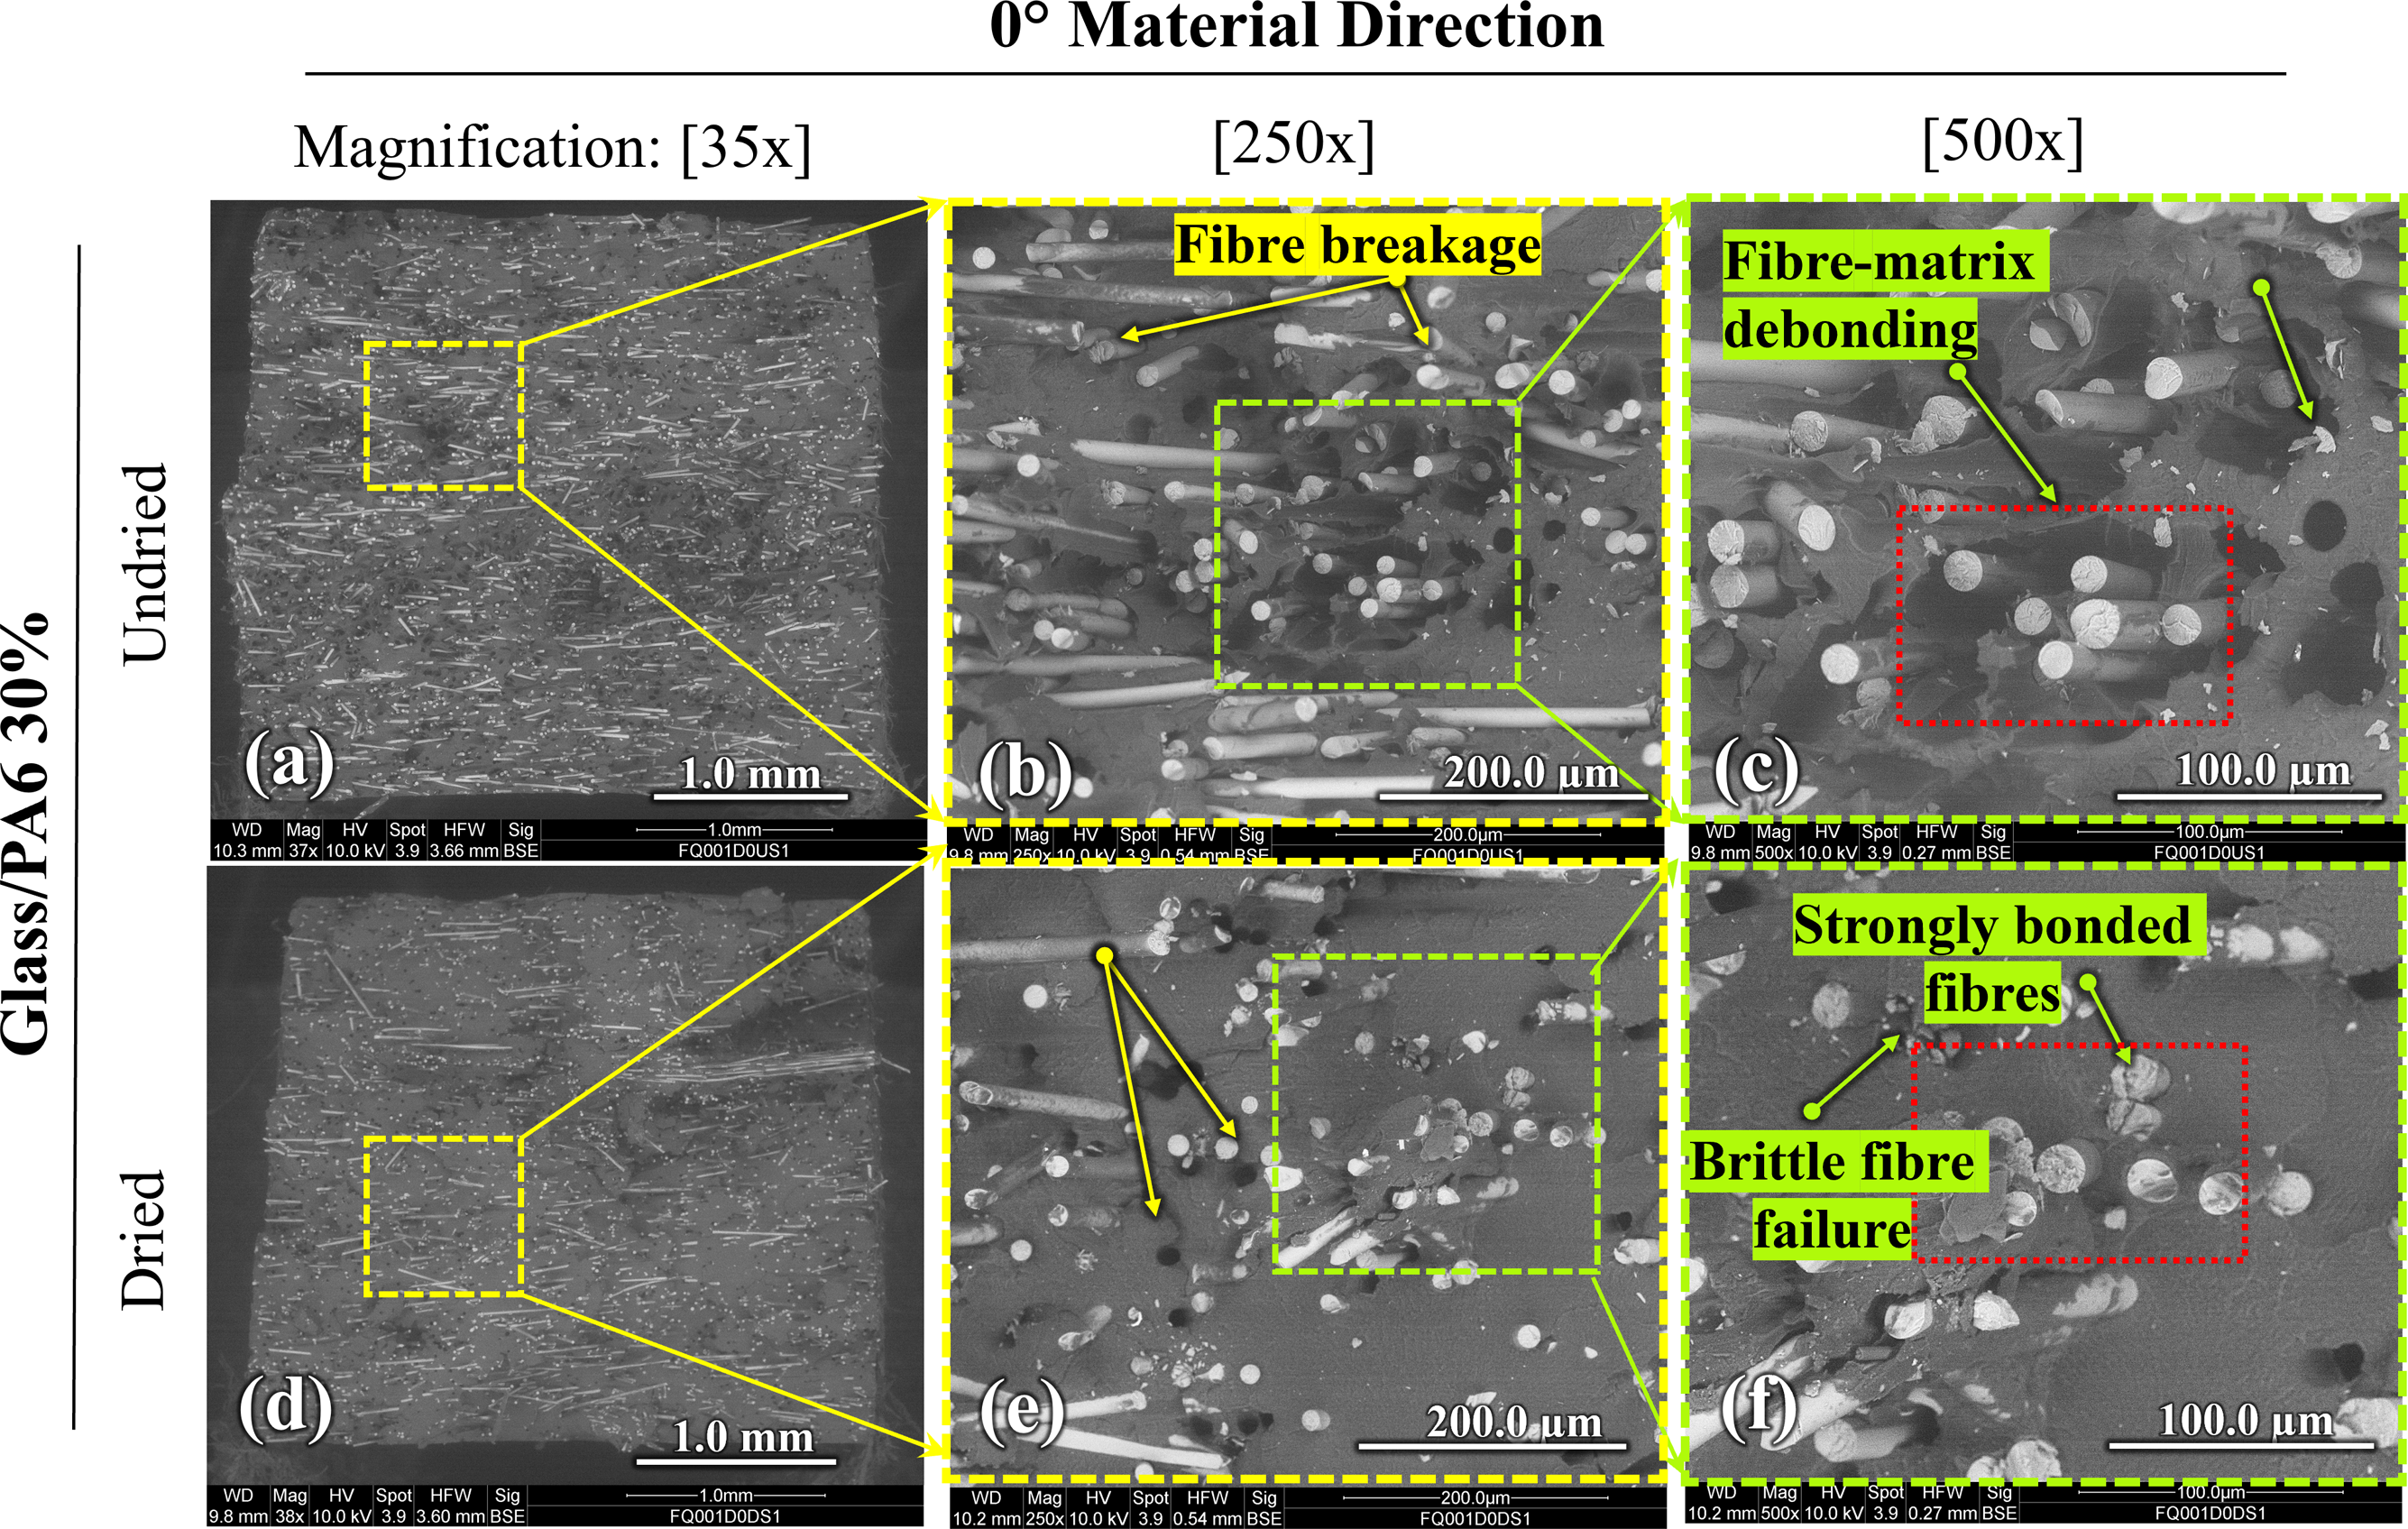
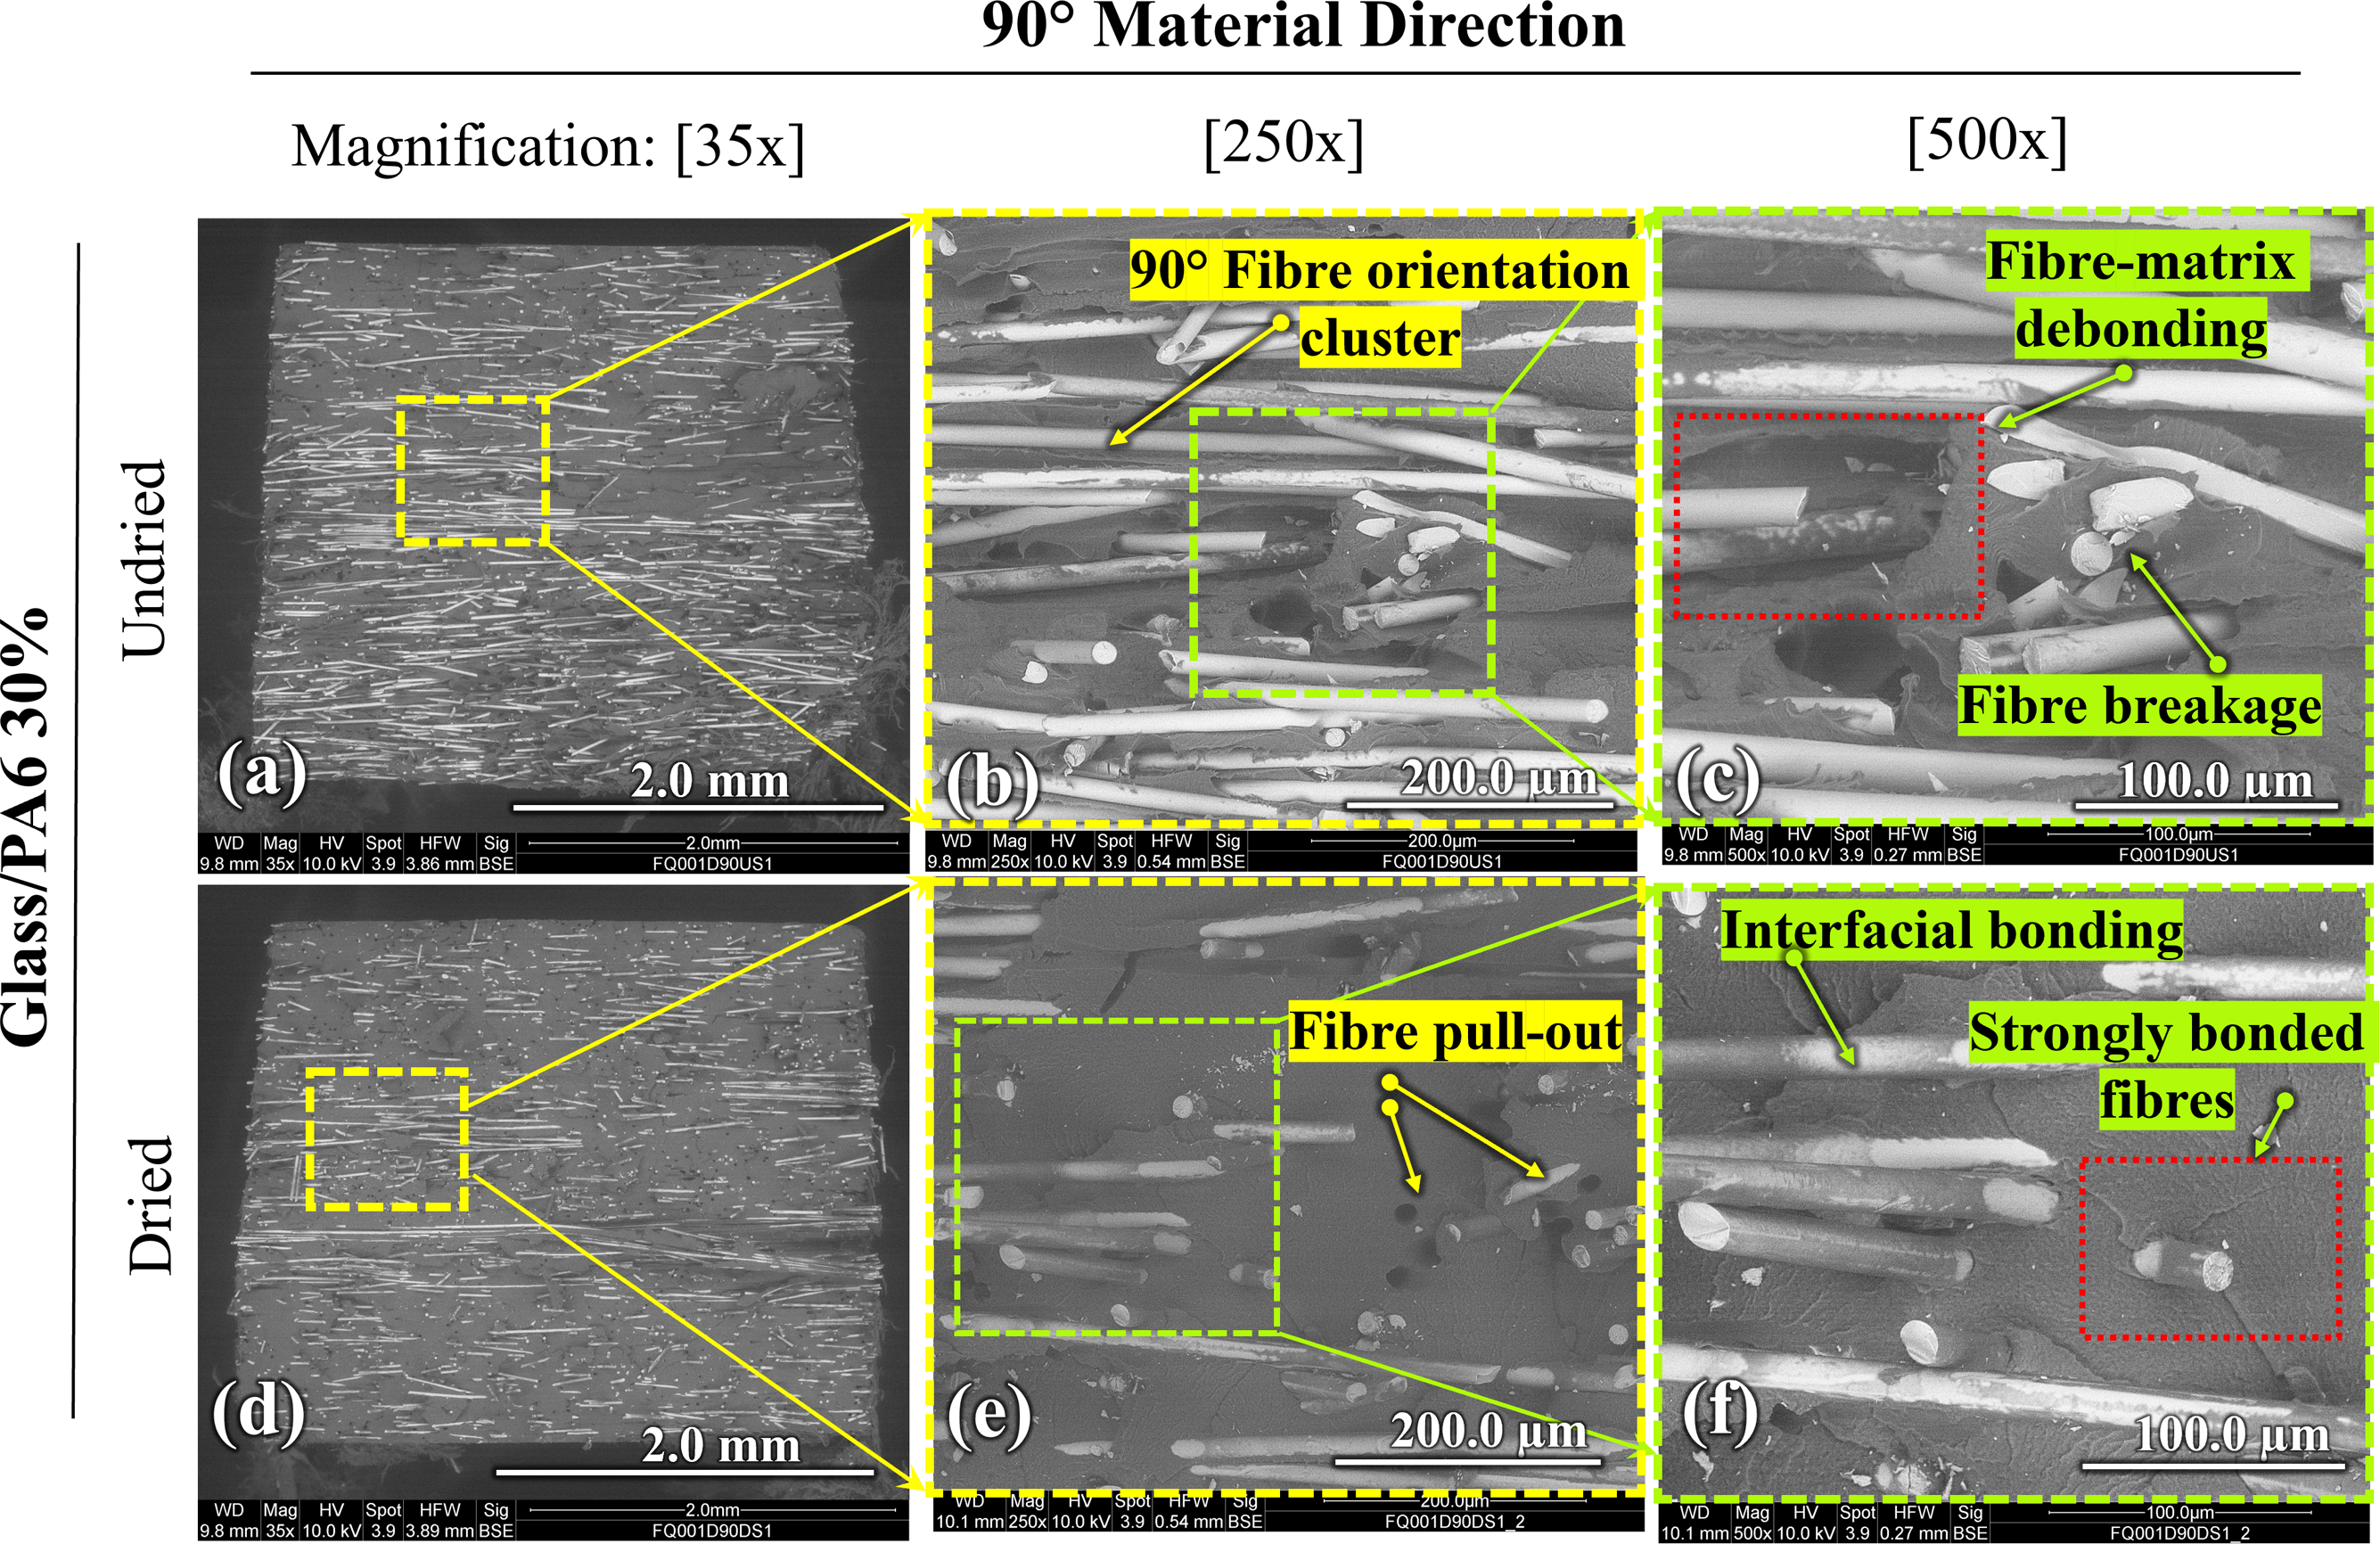
Dried PA6 samples with fibre reinforcement show a strong matrix-fibre bond and fewer voids around the fibres, as seen in Figures 17(f) and 18(f). These dried samples demonstrated improved mechanical properties, such as higher shear strength, tensile strength, and elastic modulus, compared to undried samples. Augmenting the fibre content further enhances these mechanical characteristics due to more efficient load transfer, increased bonding surface area, and improved interfacial adhesion facilitated by reduced matrix void content. Dried 90° specimens show fewer fibre pullouts compared to 0° specimens. In undried samples, Figures 17(c) and 18(c) reveal matrix-fibre debonding, enhancing ductility and tensile toughness, especially in the 90° direction. Dried 0° samples exhibit simultaneous fibre and matrix failure, indicating strong bonding without voids, as shown in Figures 17(f) and 18(f). Voids in undried samples emphasize the role of drying in reducing voids and improving matrix-fibre contact. Brittle fibre failure occurs in dried 0° samples (Figure 17(f)), while fibre pull-out is more common in undried 90° samples due to debonding and voids (Figures 17(b) and 18(b)). Higher fibre content reduces pull-out and breakage. The twin extruder method causes fibre breakage, forming glass flakes in the matrix (Figure 17(c)).
The SEM analysis of dried carbon/PA66 aimed to characterize their fracture behaviour and mechanical properties through examination of tensile fracture surfaces at 90° orientation. Figures 19(a) and (b) provide visual representations of the fracture surfaces within flow regions, specifically focusing on composites containing a 40% fibre content. SEM images of dried carbon/PA66 tensile specimen from flow region with 90° material direction.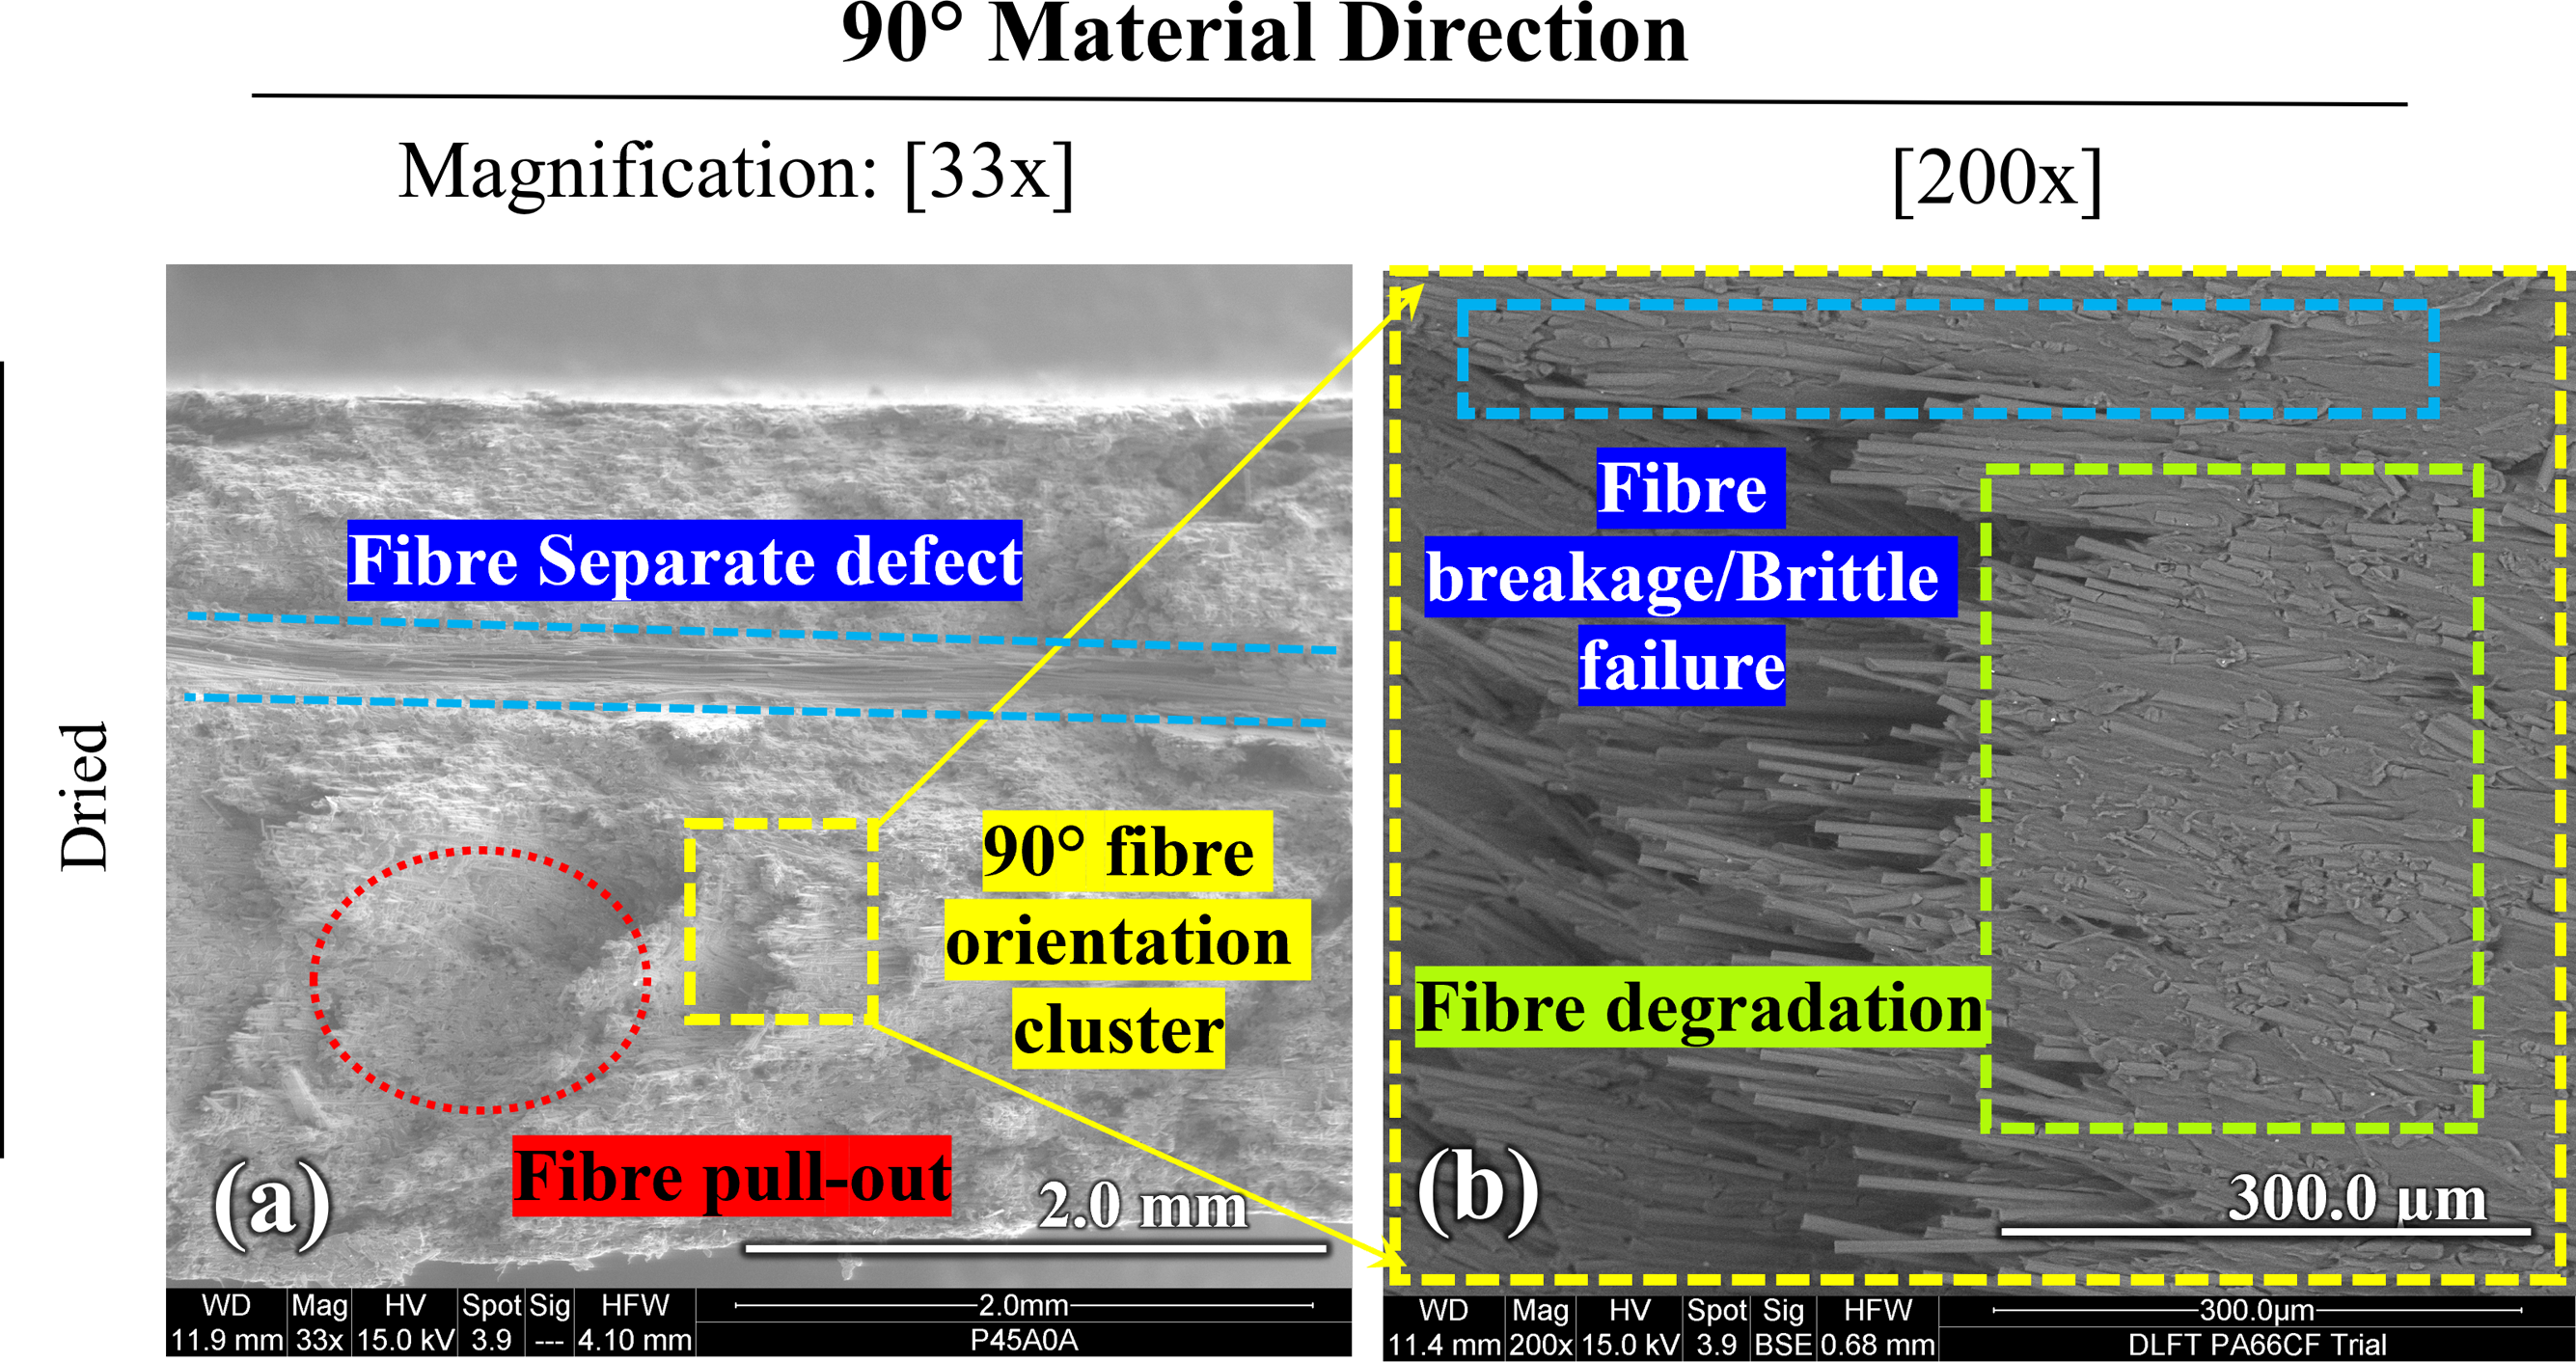
In the 0° material direction carbon/PA66 specimen (Figure 19), a notable observation was the presence of a fibre bundle at the core, aligned perpendicular to the loading axis. Figure 19(b) depicted typical failure surfaces, highlighting both the mentioned bundle and a region displaying a more common failure surface. In the 0° specimen, fibres appeared adequately encased by resin within the bundle. However, the primary failure mechanism involved matrix debonding from the fibres, leading to elongated fibre segments with minimal resin attachment. Other observed failure modes away from the bundle included fibre breakage, pullout, and occasional instances of degradation and brittle failures.
In the 90° specimen, poor wetting of fibre bundles by the polymer matrix was evident, with regions of inadequate fibre dispersion and wetting. Failures often occurred at the ends of fibre bundles, likely due to their proximity to the charge region (Figure 22(a)). While some fibres perpendicular to the fracture surface caused pullouts and flakes, most were parallel to it, aligned with the sample’s orientation. Fewer instances of fibre pullout and degradation were observed compared to 0° specimens, as shown in Figure 21(a), aligning with findings in glass LFTs. Fibre degradation during twin-screw compounding was extensively documented in reference 33. Flow direction in LFT structures was linked to fibre orientation observed at lower SEM magnifications. Understanding LFT material anisotropy is vital for targeted applications. By optimizing fibre orientation and distribution, mechanical and material properties can be tailored to meet specific application needs.
Properties of the charge and flow regions
LFT composites often show significant property differences between flow and charge regions due to compression moulding. In glass fibre-reinforced PA6 composites, the mechanical properties of these regions varied between dried and undried samples in 0° and 90° directions. Moisture significantly impacts tensile properties, with shear conditions causing greater strength reduction. Compression moulding exerts high pressure on the charge material, potentially compromising fibre integrity, and some fibres reorient perpendicularly to the surface. SEM images of plaque specimens, cut perpendicular to die-contacting surfaces, provided detailed insights into the material flow within and outside the charge region. Figure 20 depicts SEM images of a cross-section across the charge zone in the flow direction of glass LFT. Particularly noteworthy in Figure 20(a) is the dense cluster of fibres at the compressed surface, indicative of fibre reorientation and partial material flow commonly observed in compression moulding, especially within the charge zone. SEM images depicting a cross-sectional view of the charge region sample, oriented in the direction of flow.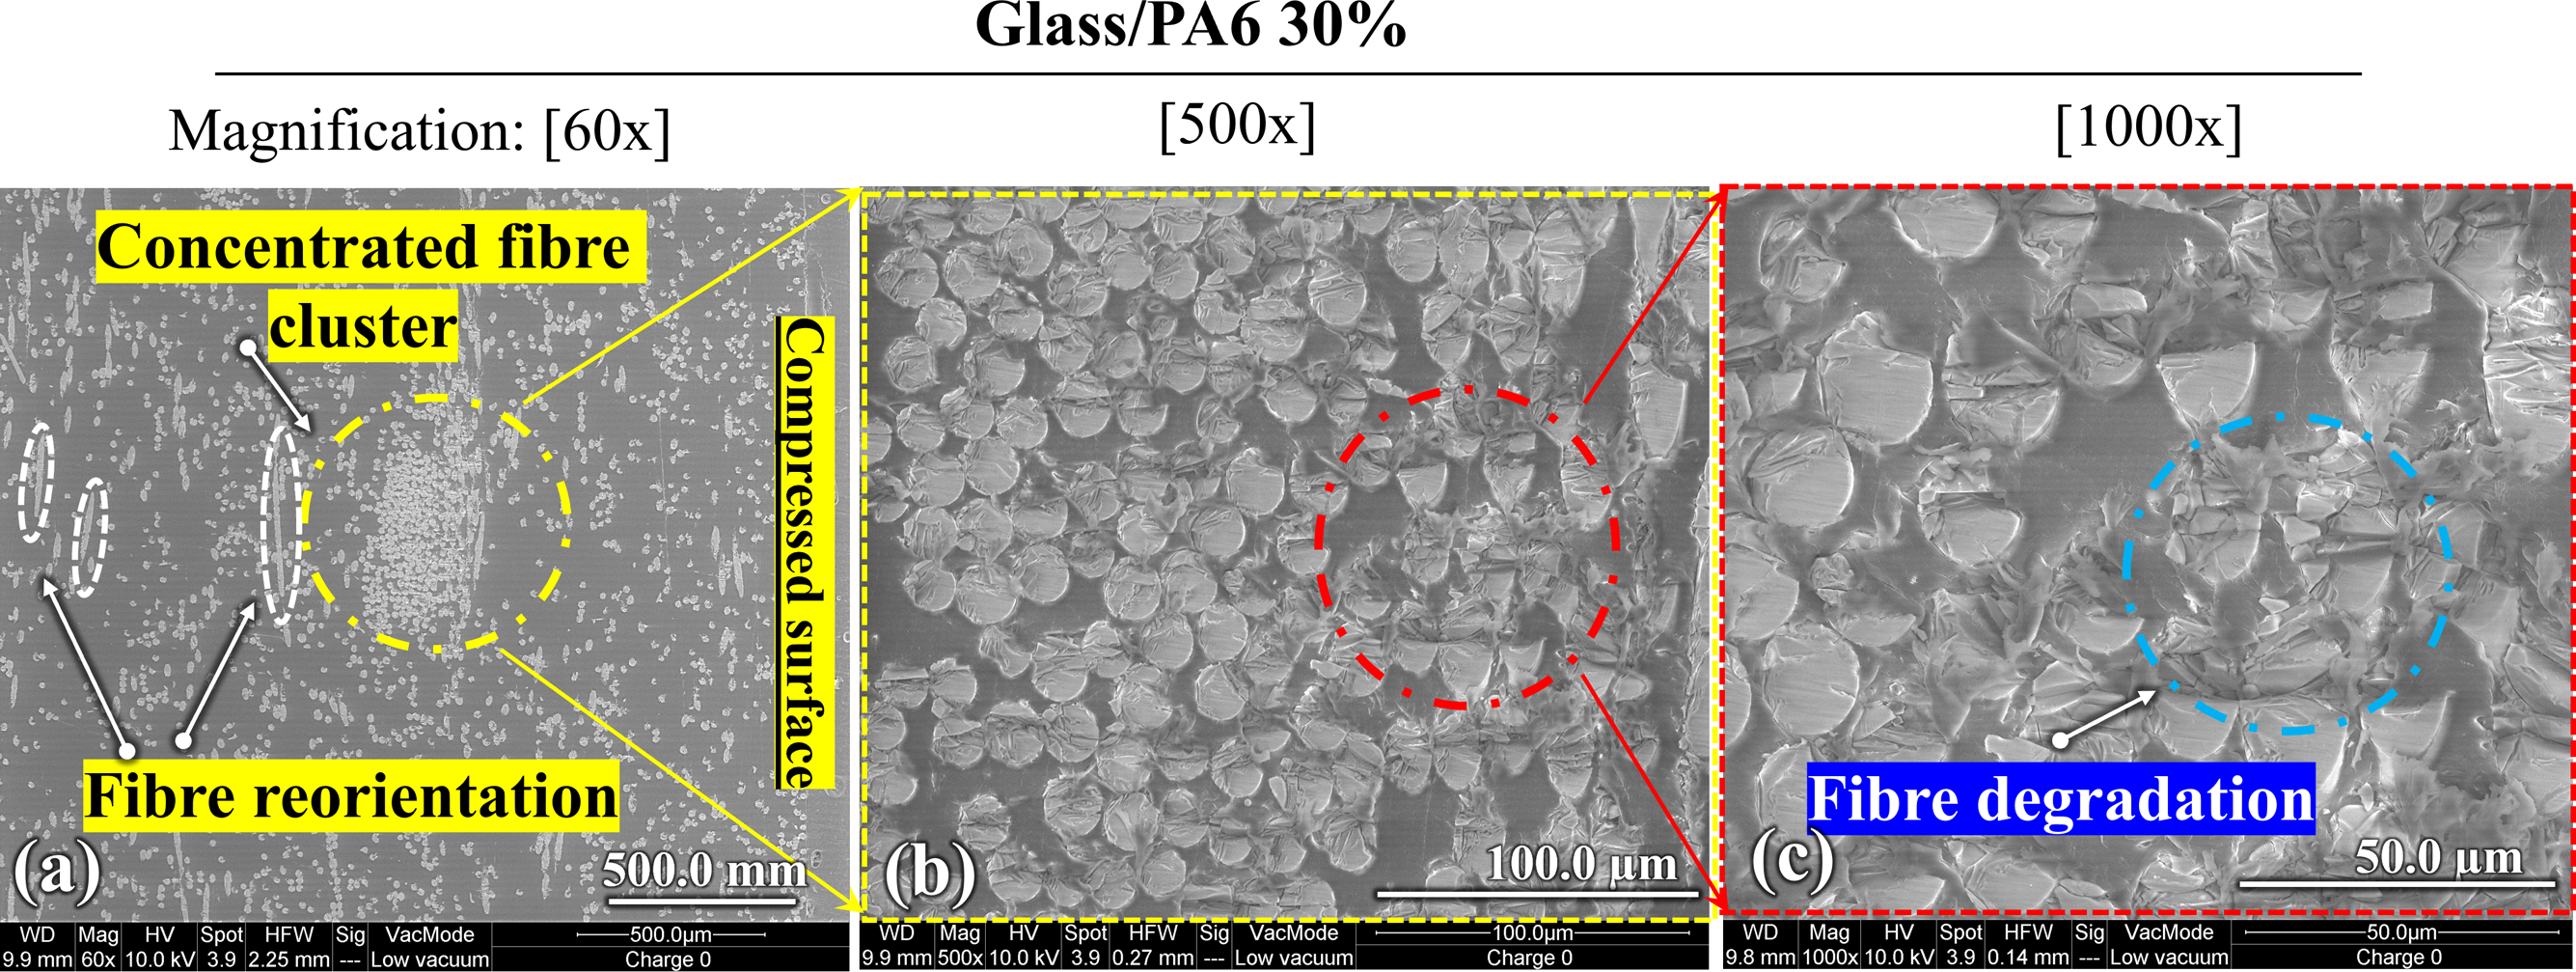
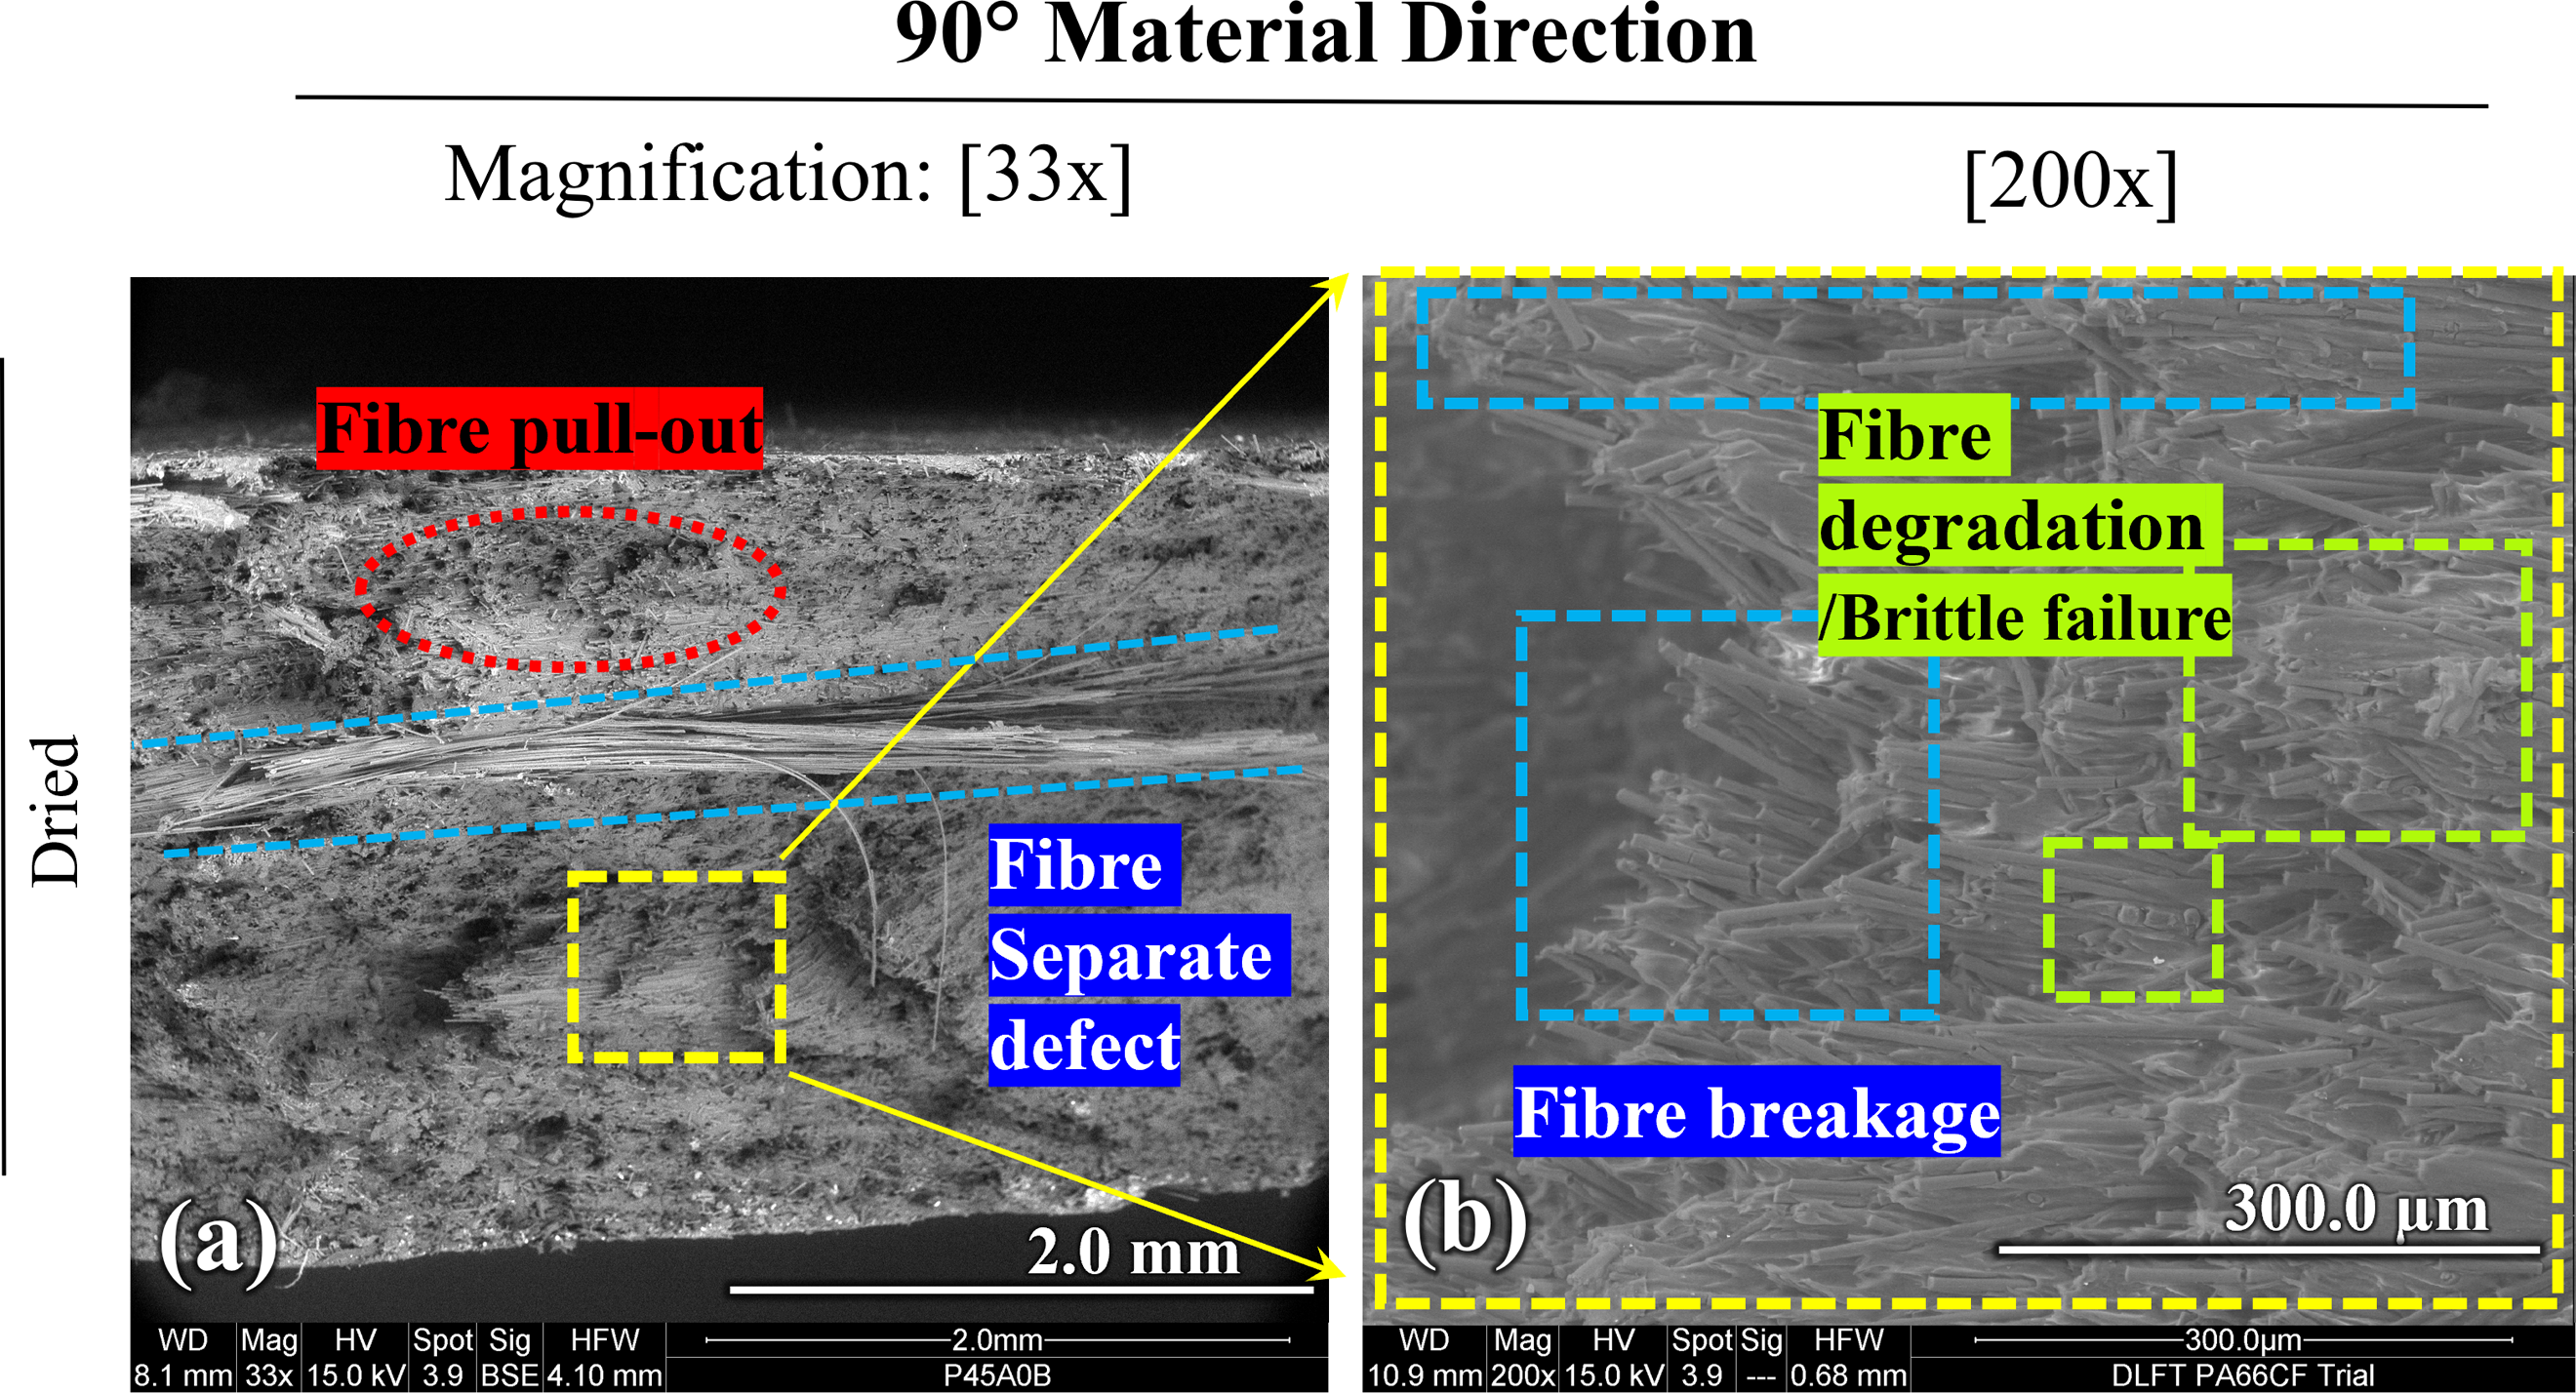
In carbon fibre LFTs, fibres in the charge region showed significant reorientation, as seen in Figure 21, with greater reorientation compared to the flow region. High compression during moulding caused pronounced fibre reorientation and separation defects due to matrix displacement (Figure 21 and 22). Understanding these dynamics is crucial for interpreting material behaviour. Initially, the LFT charge is placed in a specific mould area, flowing into the die during moulding. However, the charge region experiences incomplete flow, leading to distinct fibre distribution and orientation. This incomplete flow increases strength in the charge region when loaded perpendicular to the flow direction, resulting in higher shear strength compared to the flow region. These insights are vital for optimizing charge placement in moulds, especially for complex designs, to enhance structural integrity. Current research highlights a gap in comparative studies on direct-compounded compression-moulded LFT materials. Understanding mechanical properties across all regions is critical due to variations in fibre distribution and orientation, which influence material uniformity and behaviour. Fibre realignment can benefit applications with varying loading directions. At higher magnifications (Figure 20(b) and (c)), fibre deterioration was observed in the charge area of glass/PA6(30%) composites. Similar fibre failures were evident in Figures 21 and 22 for carbon-reinforced LFTs. Compared to specimens in the flow direction, fibre deterioration was notably more severe in the charge region (Figures 20–22), leading to reduced strength in samples with the 0° material direction. This deterioration is attributed to the pressure applied to the upper part of the charged fibre cluster during compression moulding. SEM images of dried carbon/PA66 tensile specimen from charge region with 0° material direction. SEM images of dried carbon/PA66 tensile specimen from charge region with 90° material direction.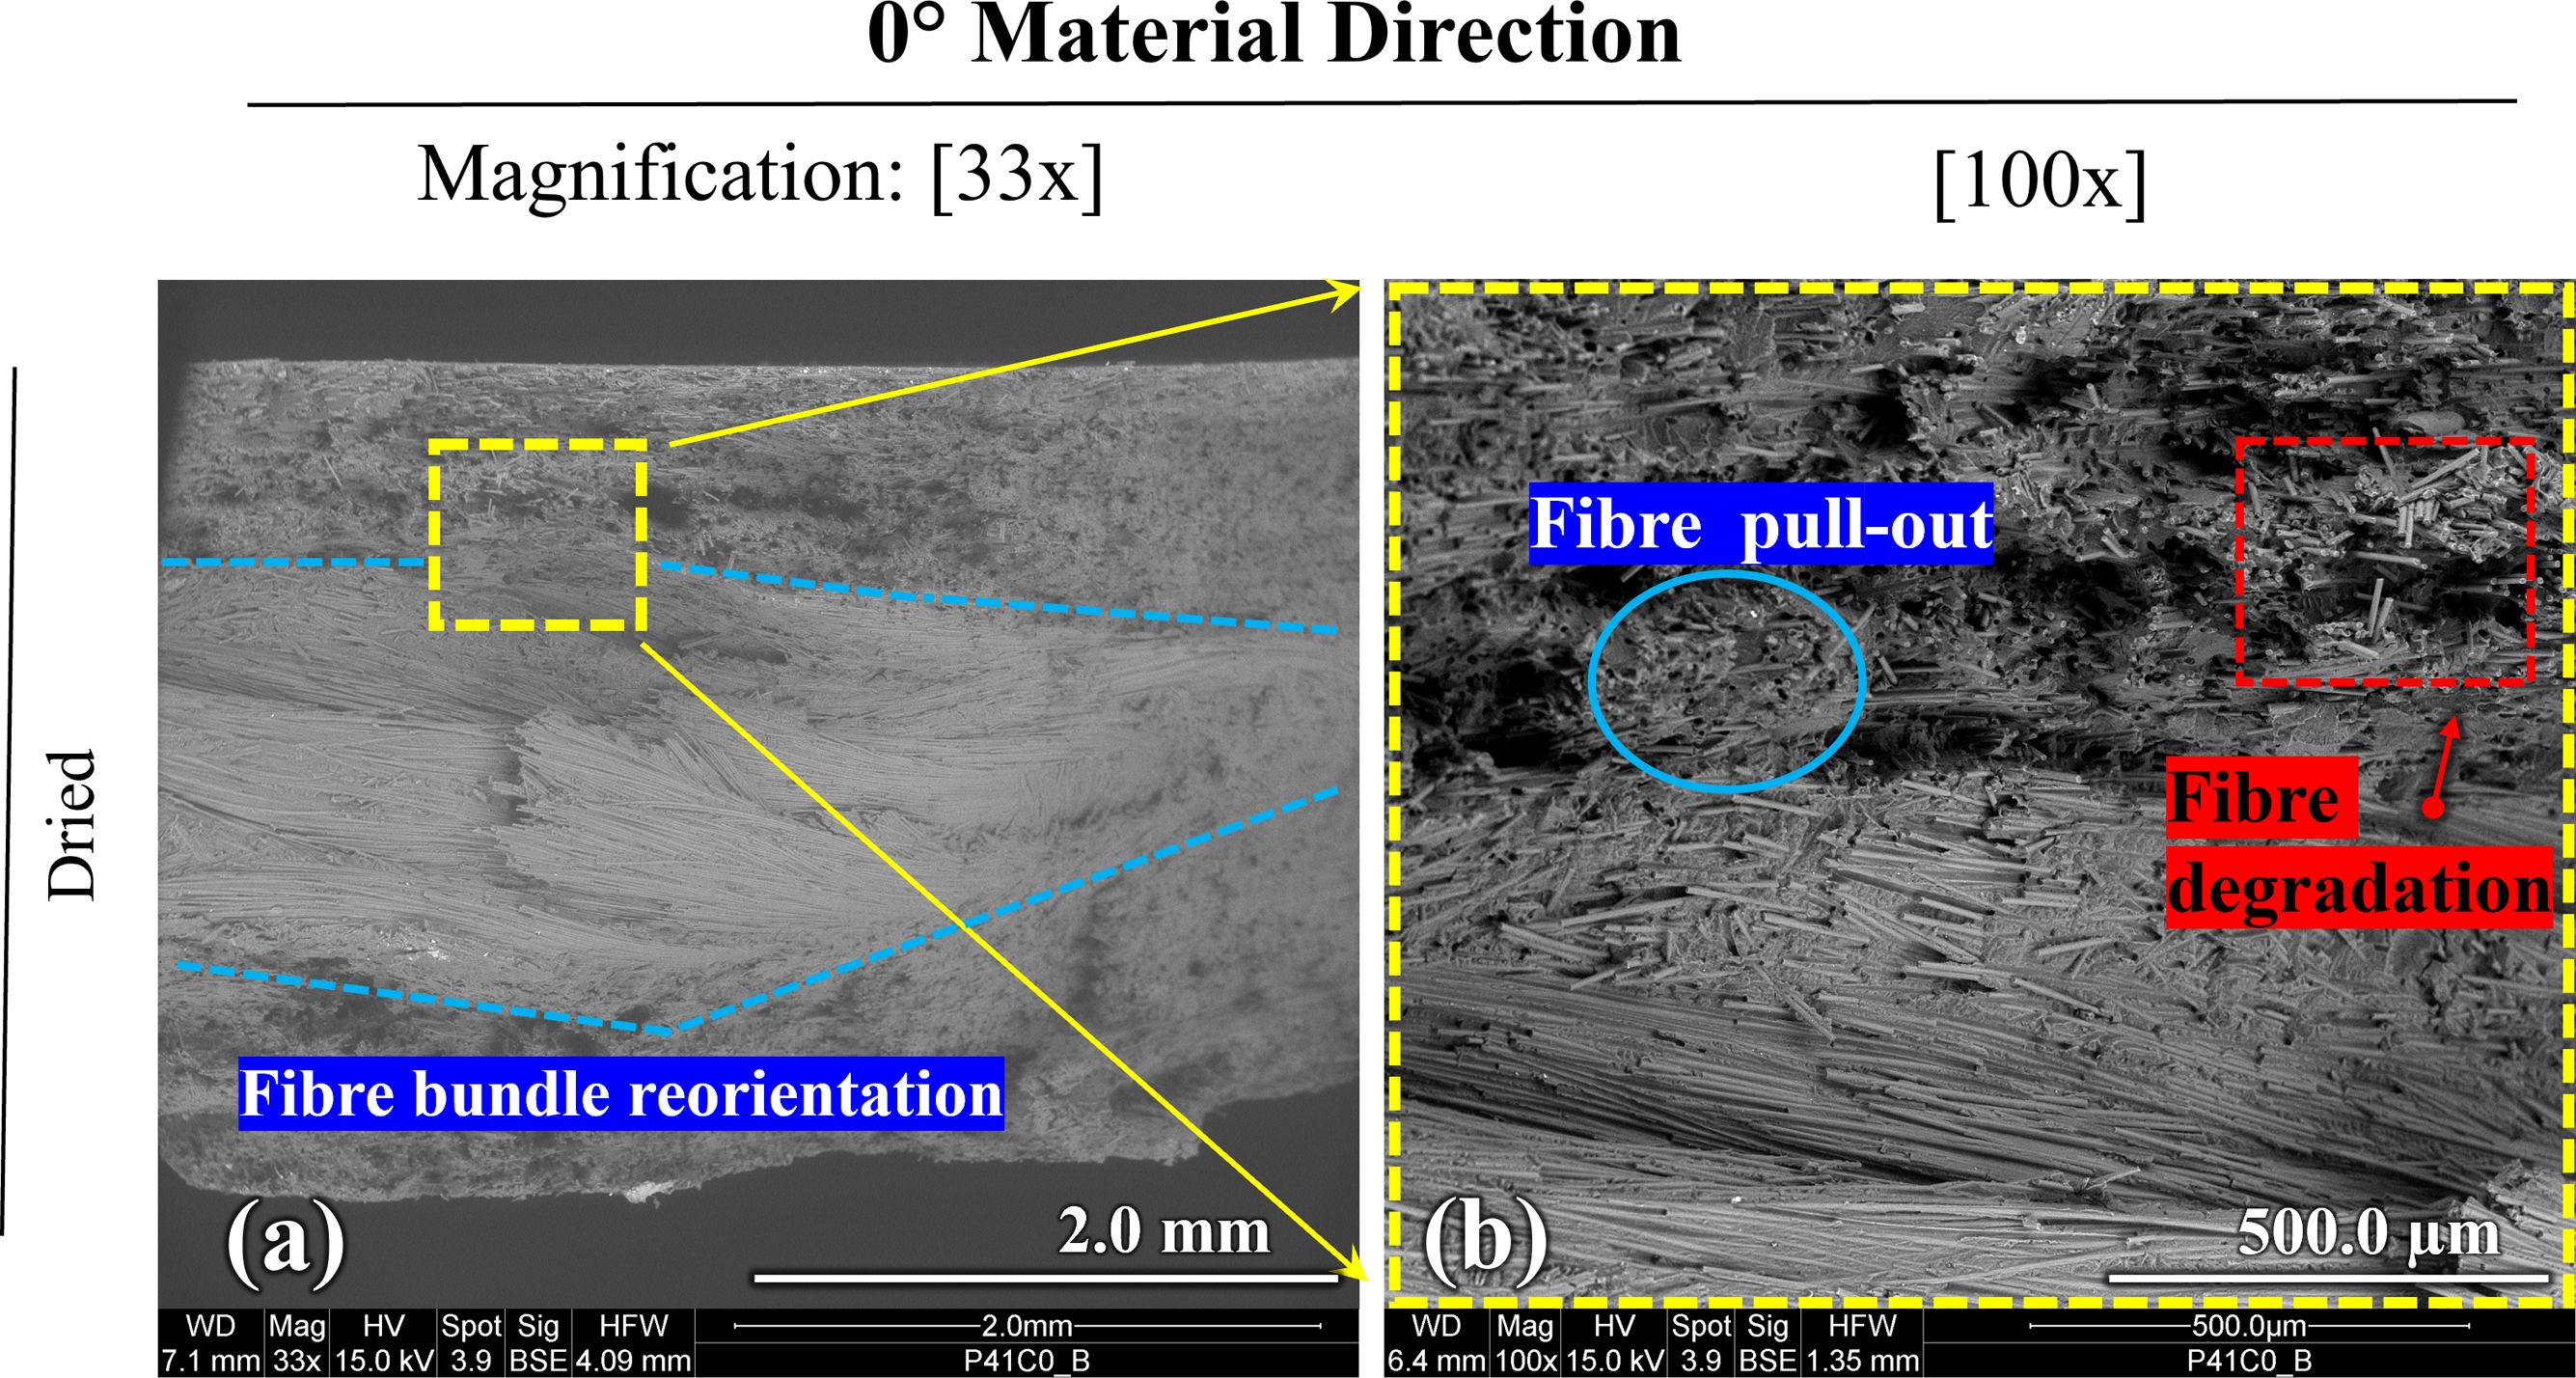
Conclusions
The aim of this study was to comprehensively characterise the anisotropic mechanical properties of LFT materials manufactured through direct in-line compounding and compression moulding, while also examining the impact of fibre type, fibre weight percentage, moisture content and anisotropy. MTS video extensometers and DIC analysis were exploited in combination with SEM analyses to provide an understanding of the detailed micro-mechanical material deformation mechanisms. The following are the key conclusions drawn from this study: 1. The glass/PA6 composite with 45% fibre content showed a 15% increase in tensile strength for 0° and −45° orientations compared to the 30% fibre variant. The Young’s modulus of the LFT materials rose significantly, with a +50% change as fibre content increased from 30% to 45%. However, no notable improvement in shear strength was observed with the higher fibre content. 2. The orientation of fibres/material direction has a significant influence on the tensile strength of the material. The 0° material direction dominated in the tensile tests, followed by −45°, 45° and 90° material direction with a mean ultimate tensile strength of 160 MPa, 126 MPa, 83 MPa and 76 MPa, respectively, for glass/PA6(45%) and 153 MPa, 110 MPa, 98 MPa and 81 MPa respectively for glass/PA6(30%). For shear strength, the difference observed was minimal. 3. The material exhibits clear directional asymmetry between +45° and −45° material direction, with −45° samples from the flow region of glass/PA6 (45%) showing a tensile strength increase of 51.8% in dried conditions and 40% in undried conditions compared to the +45° samples which align with the bias in fibre orientation observed towards −45° in the fibre orientation distribution study. 4. Moisture significantly alters the composite behaviour of LFT materials, shifting the response from brittle to ductile. In glass/PA6(45%), the introduction of moisture led to a 26% reduction in strength for flow region samples at 0° and a 60% reduction at 90° material direction, with more pronounced differences observed in glass/PA6(30%) with 2% moisture content. 5. Drying significantly enhances the mechanical performance of PA6 and PA66 LFTs by improving matrix-fibre bonding and reducing voids. In the 0° direction, dried samples exhibit brittle fibre failure, while undried ones showed increased toughness of up to 230% and enhanced ductility. 6. Compression moulding causes distinct differences between the charge and flow regions of LFT composites, impacting fibre orientation and mechanical properties. The charge region undergoes high compression, leading to fibre reorientation, surface roughness, and increased shear strength perpendicular to the flow. However, fibre deterioration in this region reduces strength in the 0° direction. Optimising charge placement and moulding parameters is crucial for enhancing structural integrity and performance in LFT applications.
Footnotes
Acknowledgements
The financial support of this research from the Natural Science and Engineering Research Council (NSERC) of Canada, the Ontario Research Fund (ORF) and the contributions from the International Composite Research Group, the Fraunhofer Innovation Platform for Composites Research at Western University, and Dr J.T. Wood are gratefully acknowledged.
Author contributions
Tarun Khapra: Conceptualization, Data curation, Formal analysis, Investigation, Methodology, Validation, Visualization, Writing - original draft, Writing - review & editing. Jacob Altenhof: Conceptualization, Data curation, Formal analysis, Investigation, Methodology, Validation, Visualization, Writing - original draft, Writing - review & editing. Reza Beigpour: Formal analysis, Investigation, Methodology, Writing - original draft, Writing - review & editing. Sajjad Dehghanpour: Formal analysis, Investigation, Methodology, Writing - original draft, Writing - review & editing. Pouya Mohammadkhani: Formal analysis, Investigation, Methodology, Writing - original draft, Writing - review & editing. Matthew Bondy: Formal analysis, Investigation, Methodology, Writing - original draft, Writing - review & editing. William Altenhof: Conceptualization, Funding acquisition, Investigation, Methodology, Project administration, Resources, Software, Supervision, Validation, Writing - review & editing.
Declaration of conflicting interests
The author(s) declared no potential conflicts of interest with respect to the research, authorship, and/or publication of this article.
Funding
The authors disclosed receipt of the following financial support for the research, authorship, and/or publication of this article: This work was supported by the Natural Science and Engineering Research Council (NSERC) of Canada and the Ontario Research Fund (ORF).