
Abstract
The utilization of agricultural biomass residues as biofillers in polymer composites enhances the evolution of green and sustainable biocomposites that assist in progressing towards sustainable development goals. Agricultural biomass residues such as peels, seeds, stalks, and bunches increase with the increase in crop production. The current research focuses on evaluating the influence of waste pomegranate peel biofiller as a novel particulate reinforcement on the mechanical, thermal, and thermomechanical properties of polylactic acid (PLA)-based biocomposites. The pomegranate peel particulate biofillers were characterized using various characterization techniques. Different concentrations of biofillers ranging from 5–25 wt. % was used for the preparation of PLA-based composites. The fabricated composites were subjected to various mechanical and thermal tests. The experimental investigations showed that 15 wt. % of biofiller-reinforced biocomposites exhibited a 13.6 % increase in tensile strength, 42 % increase in tensile modulus, 9.34% increase in compressive strength, 41% in impact strength, and 26 % increase in hardness and better thermal and thermomechanical behaviour when compared with virgin PLA. The failure morphology of the biocomposites portrayed better interfacial bonding between composite constituents. It can be concluded from this study that the pomegranate peel powder can act as potential biofiller reinforcements for producing biocomposites for various lightweight structural applications. Hybridization with biofibers and other biofillers may enhance the application spectrum of these biocomposites further.
Introduction
The utilization of biodegradable plastic material has increased in recent years because of the increasing use of non-biodegradable plastic materials and the ever-growing problem of their disposal. Though plastic materials are recyclable by some means, the rate of recycling is estimated to be one-hundredth of the produced quantity which obviously leads to disposal problems such as in the form of urban solid waste.1,2 This paves the way for the rigorous research and development of biodegradable plastics from renewable resources. Recently, a total of 2.23 million tons of bioplastics (constitutes only 1.5% of total plastics production globally) were produced specifically from biomass and other renewable resources during the year 2022 to potentially replace synthetic petroleum-based polymers. 3 Polylactic Acid (PLA) is the commonly used bioplastic readily applied to manufacture products having relatively shorter life cycles such as food containers, cutlery, and storage cans. PLA is characterized by decomposition in controlled environments releasing mostly useful biomass like moisture and CO2 and less amounts of non-toxic low molecular weight compounds. However, owing to its brittleness, insufficient thermal properties in the case of non-insulating applications, and high cost, the applications of PLA are limited.4–6
The growth of natural fiber and filler industries is enormous during the past one and a half decades due to the environmental threats arising during the manufacturing of polymer composites using synthetic fibers. Research is currently in full swing to successfully manufacture and implement biofibers reinforced biopolymer-based green composites in various applications such as aerospace, automotive, food packaging, biomedical, pharmaceuticals, healthcare, and marine industries.7,8 Various parts of the plants are utilized for the extraction and utilization of natural fibers and fillers. Even though the biofibers are utilized for various applications in different forms, the waste biomass generated by the utilization of plants is enormous. Biofillers are usually extracted from the waste fruits parts such as peels, seeds, flowers and other non-edible portions of the plants.9,10 Such extracted lignocellulosic fillers expected to act as an efficient reinforcement for the development of green composites that finds its applications in majority of engineering fields owing to their renewability, sustainability, economy and availability. Various studies were carried out on the generation of agricultural and food waste-based biomass which can be effectively used to produce green composites. Fruit peels and seeds are the major sources of such food wastes since the non-edible parts after the food processing remains a waste biomass.11,12 In many cases agricultural waste biomass such as dry mango leaves, bagasse, oil palm fruit shells, orange peels, lemon peels, and stem of castor plants were used in polymer matrices to manufacture biocomposites.13–28 Table S1 enlists the various research works carried out by using fruit peel particles as biofillers in polymer matrix composites.
Production of biocomposites from waste fruit parts were subjected to different mechanical, physical and thermal tests. The mechanical property evaluation of acacia fruit peel powder filled sugarcane fiber-based polyethylene composites suggested that the addition areca fruit peel powders increased the tensile and flexural characteristics of the composites. 29 Hybridization of tamarind seed filler with jute and hemp fibers enhanced the mechanical behaviour of the filled composites when compared to its counterparts. 30 Incorporation of Citrus limetta peel powder fillers in epoxy composites was found to increase the toughness of the composites while the tensile and flexural strength reduced. 31 The synergy between the pomegranate peel powders and the epoxy matrix increased for the jute fiber epoxy biocomposites enhanced the mechanical properties and for unfilled composites it was lesser. 32 Overall, bio-based filler addition in the polymer matrices enhanced the thermal and mechanical and thermal behaviour of the biocomposites.
Novelty of the current experimental work.
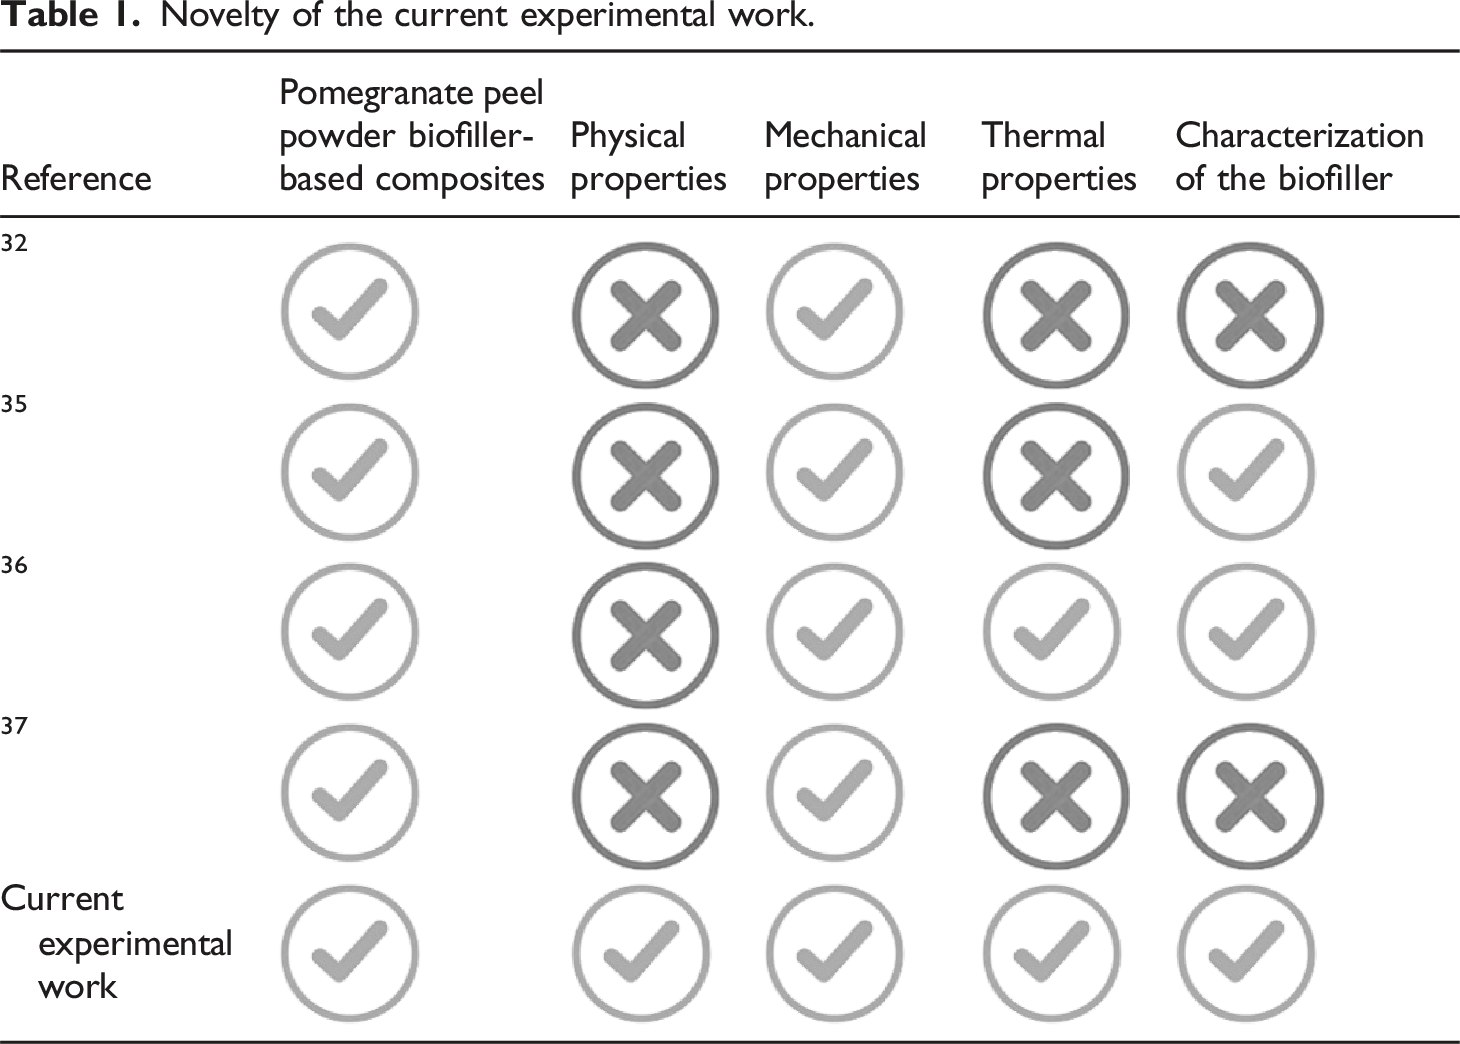
Accordingly, current experimental work aims to evaluate the mechanical, physical, and thermal behaviour of the green composites. Waste Pomegranate Peel powders (WPOP) were characterized using X-Ray diffraction (XRD), Fourier Transform Infrared Spectroscopy (FTIR) and Scanning Electron Microscopy (SEM) to assess their crystal structure, functional groups, and powder morphology respectively. Effects of WPOP filler concentration on various properties of the biocomposites were assessed through various experimental techniques.
Materials and experimentation
Materials
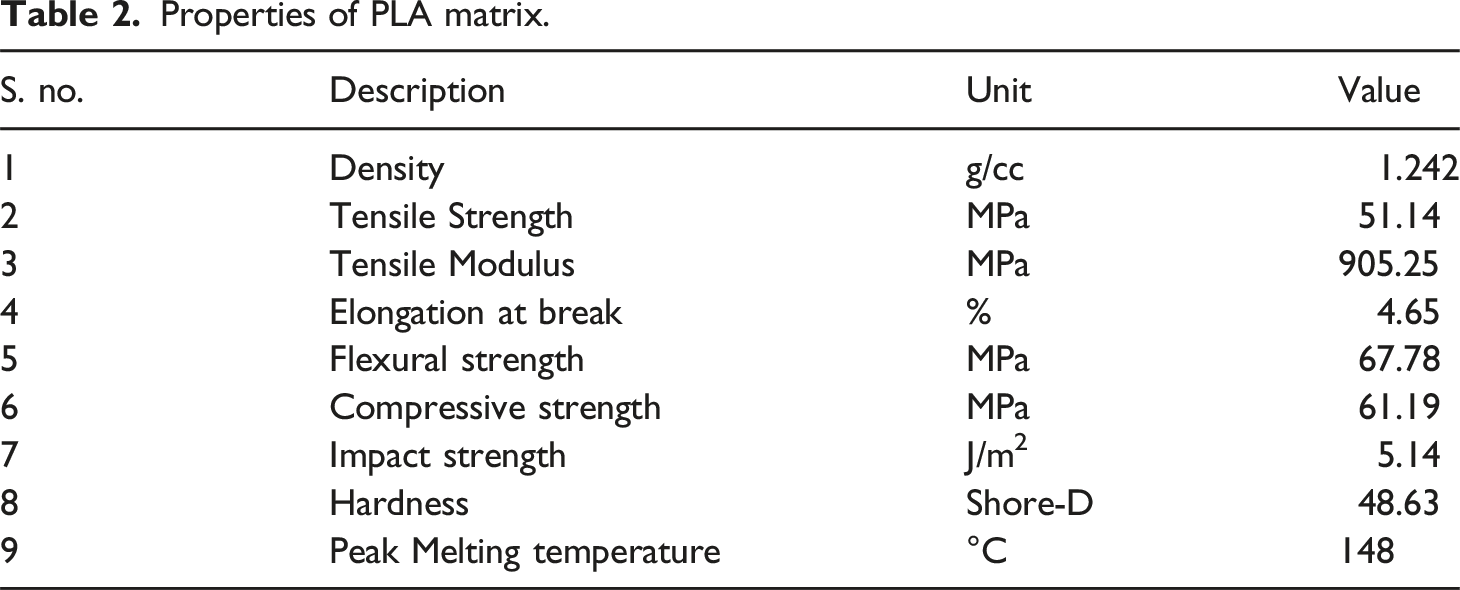
Properties of PLA matrix.
Extraction and preparation of WPOP fillers
The pomegranate peels were washed initially with tap water, chopped and dried in hot sun for 3 hours, washed again using distilled water and dried in hot air oven for 12 h at 65°C. The drying peels were weighed at regular intervals and the drying process was stopped when the weight loss of the peels was unchanged during two consecutive measurements. A 52.2 % weight loss was observed following complete drying. A mini pulverizer was used to grind the dried peels and then sieved through 100 µm mesh. Untreated fillers are used in the current study since chemical treatment results in the loss of around 85–90% of the biomass despite the enhancement of interfacial characteristics between the filler and the matrix, according to some literatures.31,38 Figure 1 depicts the process of preparing WPOP fillers. Process of preparing WPOP fillers.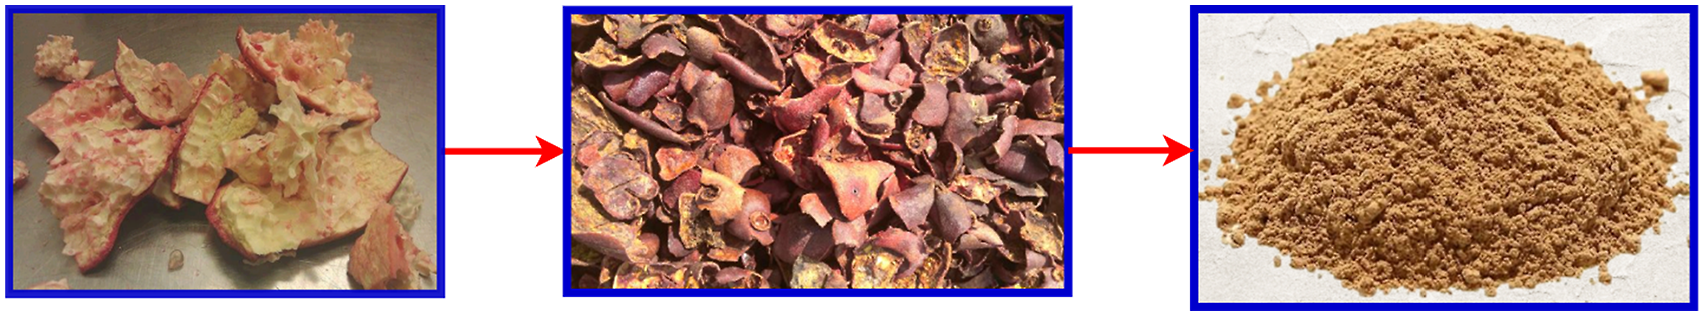
Preparation of WPOP/PLA composites
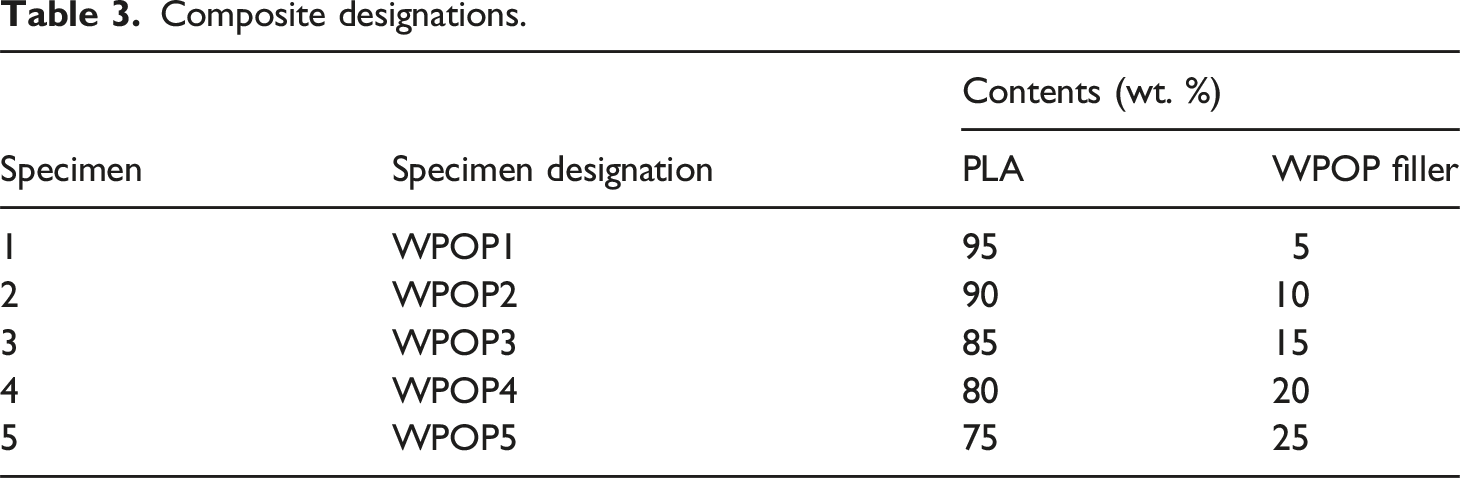
Composite samples were fabricated using an open mould casting technique by reinforcing the PLA matrix with various weight fractions of WPOP fillers. PLA pellets were melted by placing them in an electric furnace at a temperature of 180°C. Then, the molten resin was transferred to a glass beaker and the measured quantity of WPOP fillers were gradually added to it and mechanically stirred continuously at 35 r/min and ultrasonicated for about 10 min to avoid powder agglomeration and to promote uniform dispersion of WPOP fillers within the PLA matrix. The final mixture was poured into a glass mould and allowed to cure for about 20–22 hours. This render WPOP filler reinforced PLA green composites with varying weight fractions of fillers such as 5%, 10%, 15%, 20% and 25% which are further used to investigate the effects of WPOP filler as reinforcement in PLA composites. Figure 2 depicts the process of manufacturing of WPOP/PLA biocomposites. Table 3 shows the various compositions of the composite specimen and their sample designation. Various stages in manufacturing of WPOP/PLA biocomposites. This includes extraction of fillers, mechanical stirring and ultrasonication, casting and curing of the biocomposites. Composite designations.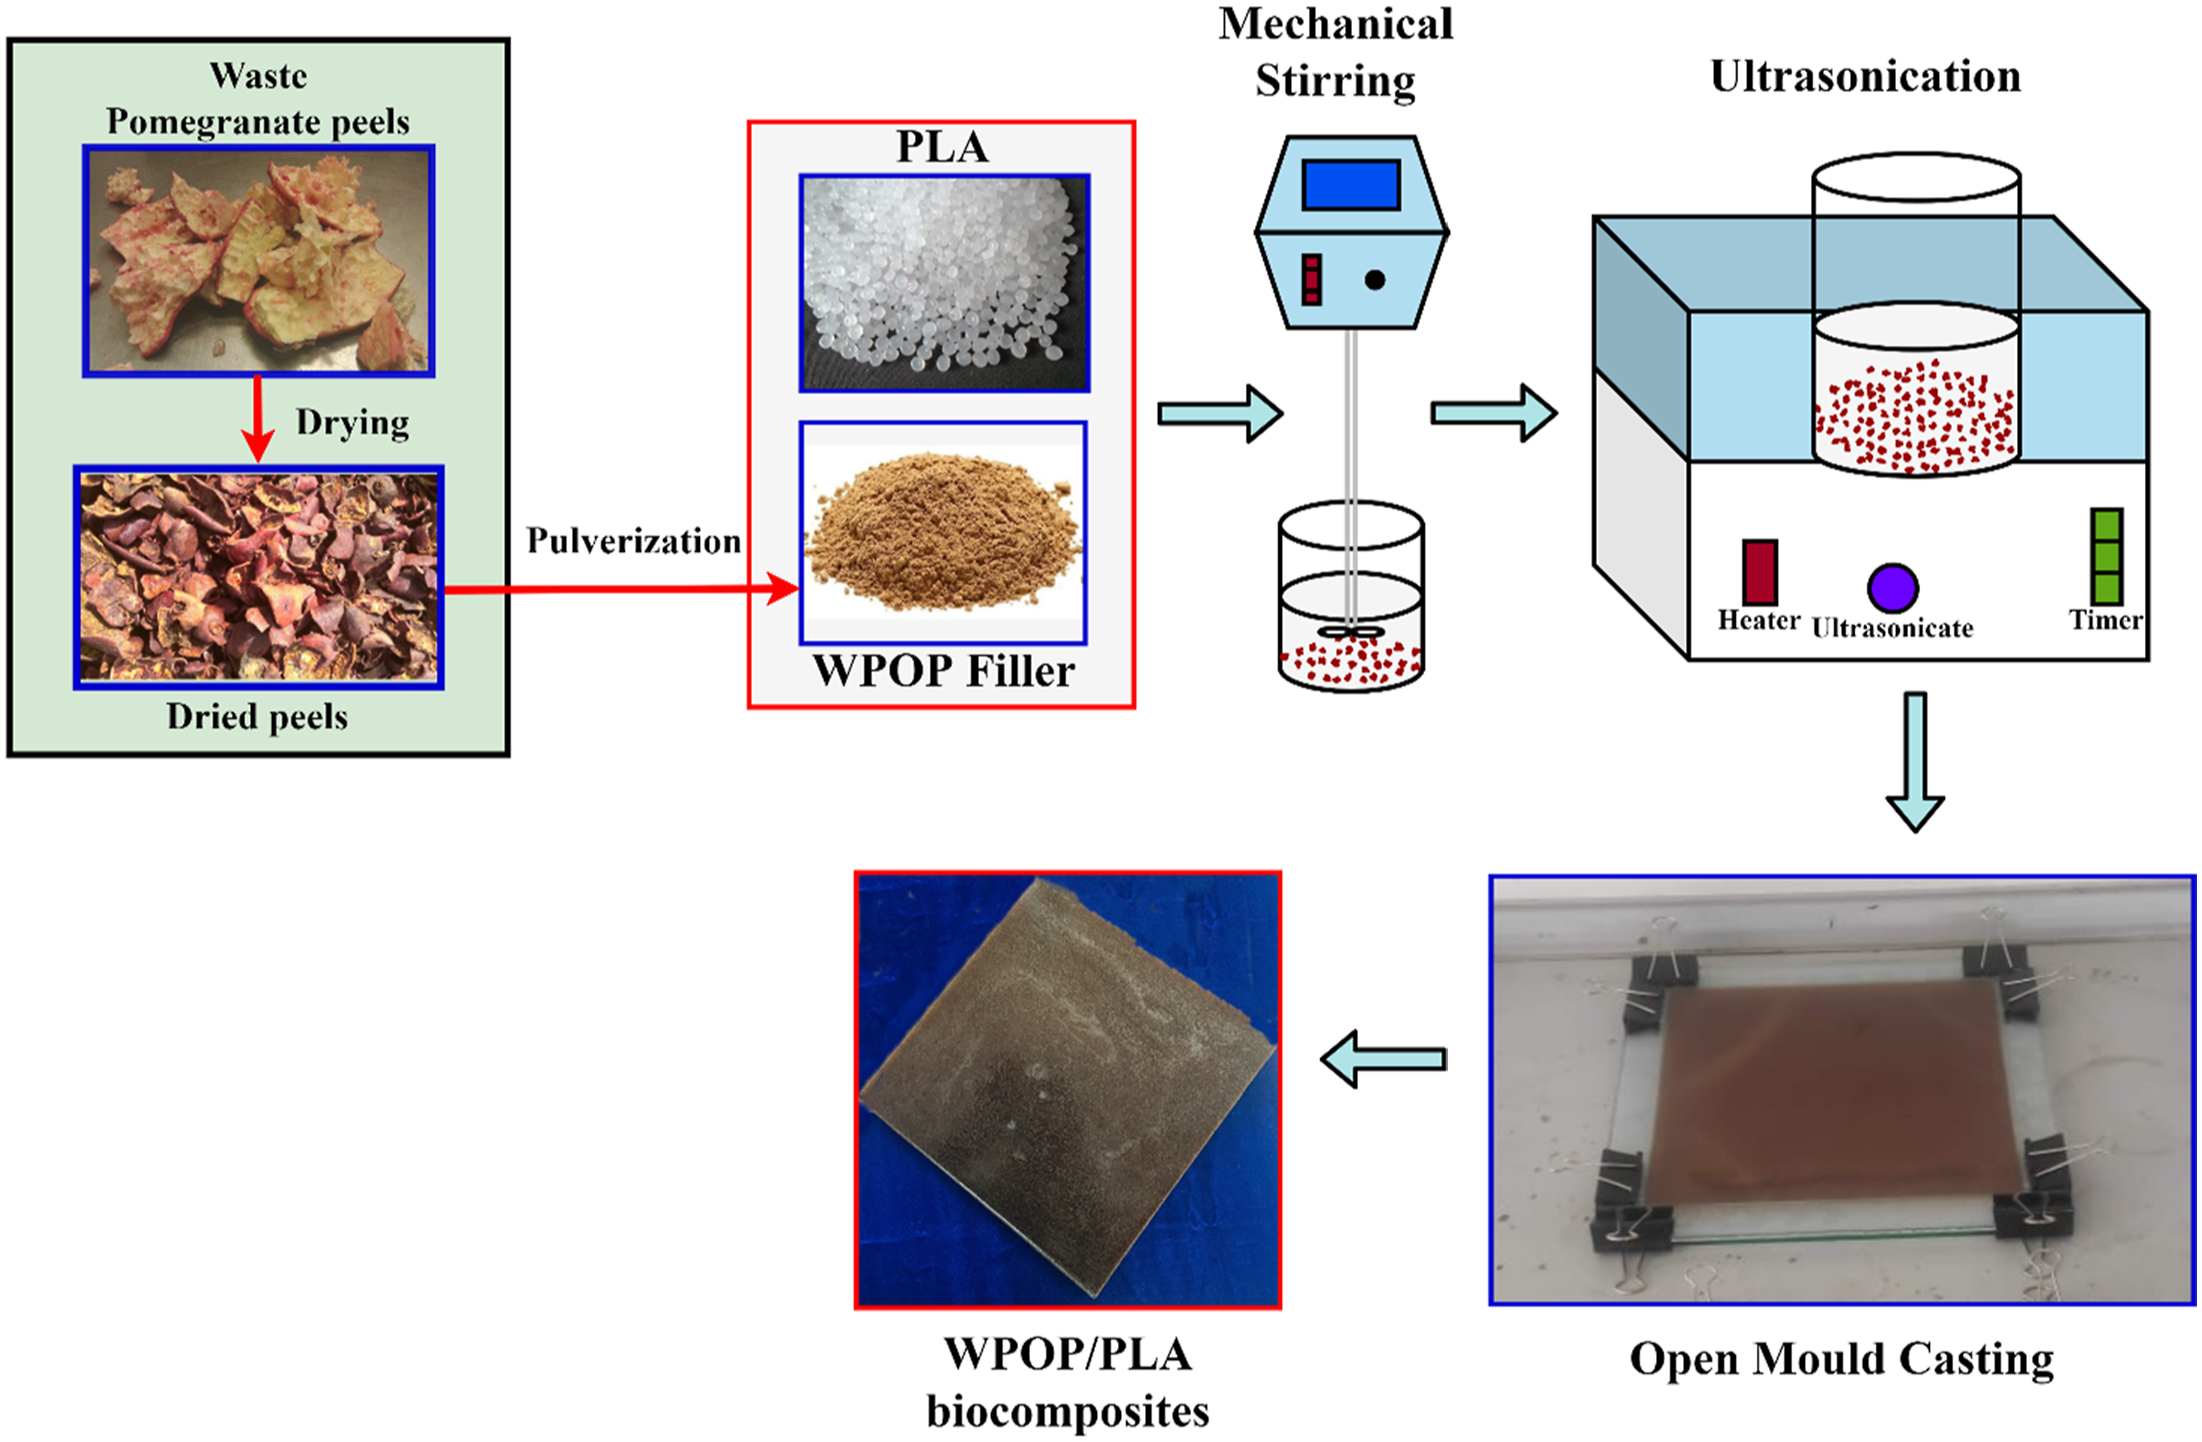
Characterization of filler and composites
Fourier Transform Infrared (FTIR) Spectroscopic analysis was carried out to identify the functional groups and chemical compounds in the WPOP filler using a Bruker make spectrometer (Model: Invenio S) with a wavelength ranging between 4000 cm−1 and 400 cm−1 in attenuated total reflectance (ATR) mode at room temperature. Scan resolution was maintained at 4 cm−1 resolution with 32 scans. X-ray Diffraction (XRD) used to characterize the WPOP fillers for their crystallographic structure and particle size. XRD analysis of WPOP powders were analyzed using a Bruker make XRD machine (Model: D8 advance) between Bragg’s angle (2θ) 5° and 90° with an operating current of 40 mA and operating voltage of 40 mV for a Cu-Kα radiation (wavelength λ = 0.154 nm). A maximum of 8 g of samples were used for the analysis at a scan step size of 2°/min. The crystallite size (CS) of the WPOP fillers was calculated using the Scherrer’s equation shown in equation (1) in which k is a constant and β refers to the value of full width half maximum of the XRD peak.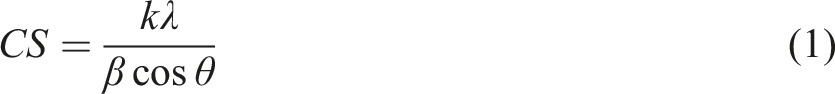
Energy dispersive X-ray spectroscopic analysis (EDAX) was carried out for WPOP fillers for elemental constituents’ identification. A Bruker make EDAX analyzer (Model: Nano Xflash Detector) was used for the analysis and the filler specimen was analysed using the area scan method to identify the elemental composition. Filler surface and fracture surface morphology of the WPOP fillers and their composites investigated using scanning electron microscopic (SEM) analysis in a Carl Zeiss and Thermo Fisher model SEM analyzer. The specimens were gold sputtered at a current of 30 mV for 45 s and were subjected to morphological analysis.
Physical properties
Density and porosity measurements
The density of WOP/PLA biocomposites was measured using an electronic balance as per ASTM D792 standards. Sample weight was measured in air and distilled water column separately at room temperature and the experimental density (ρE) was obtained. Meanwhile, equations (2) and (3) were used to calculate theoretical density (ρT) and porosity (p) of the fabricated biocomposites. Density of the biocomposites were theoretically calculated by using equation (2) in which the density of biocomposites, WPOP fillers and PLA is denoted by ρ
C
(and ρT), ρWPOP, and ρ
PLA
respectively and the volume fractions of WPOP fillers and PLA were denoted by VWPOP and VPLA respectively.

Mechanical characteristics
Mechanical test specifications.
A total of five to seven specimens in each composite composition were tested at ambient conditions and the average value was taken for further analysis.
Thermal and thermo-mechanical characteristics
Thermogravimetric analysis (TGA) was carried out to evaluate the high temperature stability of the WPOP-based biocomposites in a Mettler-Toledo analyzer (Model: TGA/DSC3+/HT1600) with 6–8 g of powdered specimen placed in an alumina crucible. Thermal degradation of the WPOP/PLA composites measured in between 25°C and 600°C in N2 atmosphere at 60 mL/min gas flow rate. The heating rate was maintained as 10°C/min. Differential scanning calorimetry (DSC) was performed in a Mettler-Toledo TGA analyzer (DSC3 + Model). The calorimetric analysis of WPOP/PLA composites was made in between 25°C and 250°C in N2 atmosphere. Single heating cycle was performed with heating rate and gas flow rate like TGA experiments. The thermos-mechanical analysis of the WPOP/PLA composites was carried out using Thermo-Mechanical Analysis (TMA) in a Mettler-Toledo analyzer (Make: TMA/SDTA1+) in between 25°C and 130°C by establishing a contact between the specimen and a quartz crystal expansion probe. The heating rate and the minimal force applied were 5°C/min and 0.01 N respectively.
Results and discussion
Characterization of WPOP fillers
FTIR spectroscopic analysis
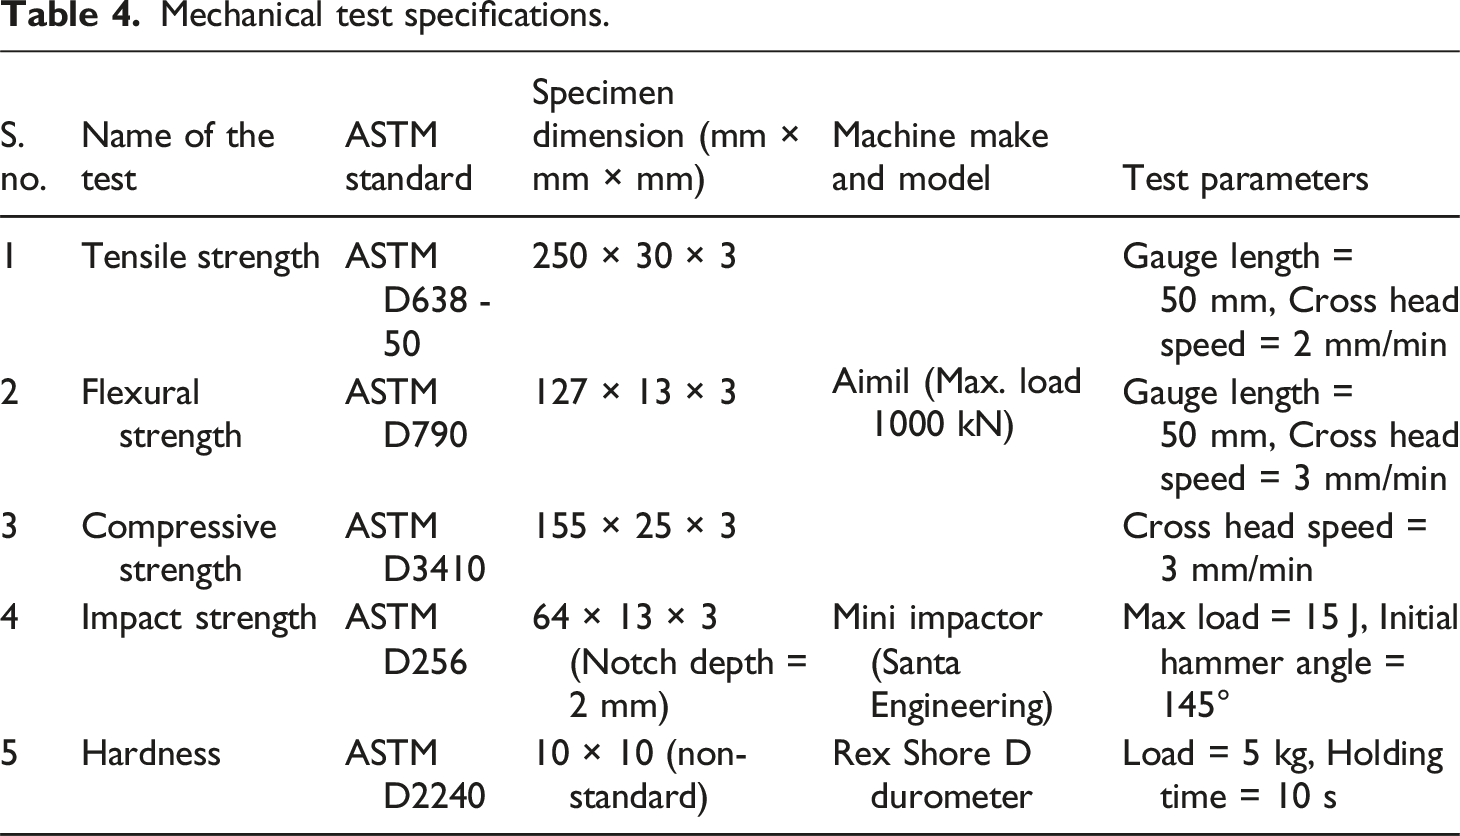
The transmittance peaks present in WPOP filler (Figure 3) shows the rich presence of polysaccharides like cellulose, hemicellulose and lignin. As enlisted in Table S2, the presence of -OH bond lies in between 3200–3570 cm−1 and this specifies the occurrence of lignin and cellulose in the WPOP powders. Similarly, the occurrence of CH2 is typically in between 2880–2940 cm−1 denoting the strong content of hemicellulose in the filler. Presence of C-OH and C-OOH bonds should typically be in between around 1530–1560 cm−1 and 1300–1430 cm−1, respectively, portraying the lignin and hemicellulose presence. Finally, the peaks around 800–880 cm−1 specifies a strong -CH bond denoting the presence of lignin. From the FTIR analysis, it could be seen that the WPOP fillers are rich in polysaccharides like cellulose, hemicellulose and lignin which aids them to be a potential reinforcement in thermoplastic matrix, rendering enhanced properties for the composites as observed by some of the previous researchers.33,34 FTIR spectrum showing the spectral peaks portraying the presence of microconstituents.
XRD analysis
The crystallographic structure and the crystallite size of the WPOP fillers were determined using XRD analysis. Figure 4(a) denotes the XRD peaks of WPOP filler. It could be seen from the XRD peaks that two peaks at 2θ = 9.67° and 15.87° were obtained within the lattice planes of (1 1 0) and (2 0 0) respectively. Since no sharp diffraction peak was observed during the XRD, it could be deduced that the presence of crystalline cellulose components was very minimal and the presence of non-crystalline elements like hemicellulose and lignin dominate. The matching peaks suggested that the WPOP fillers monoclinic and orthorhombic crystal structures. It was stated in some of the previous studies that the orthorhombic crystal structures denote the non-crystalline nature of the compound.39,40 The crystallinity index of the WPOP fillers according to the results calculated to be 44 % denoting the minimum crystallinity of the WPOP fillers. The CS of the WPOP fillers calculated based on the peak data obtained using equation (1) and the average value obtained as 33.3 nm. Some of the biofillers obtained from pine tree leaves had a CS of 27.25 nm and the Pithocellbium dulce fillers were 24.1 nm.41,42 Lower CS denotes the condensed surface area denoting their capability to render better chemical and water resistance to the reinforced composites.41,43 Figure 4(b) denotes the Weibull distribution plot for the CS of the WPOP fillers with a confidence limit of 95 %. (a) XRD peak portraying the presence of non-crystalline elements, (b) weibull plot showing the distribution of CS of the WPOP fillers.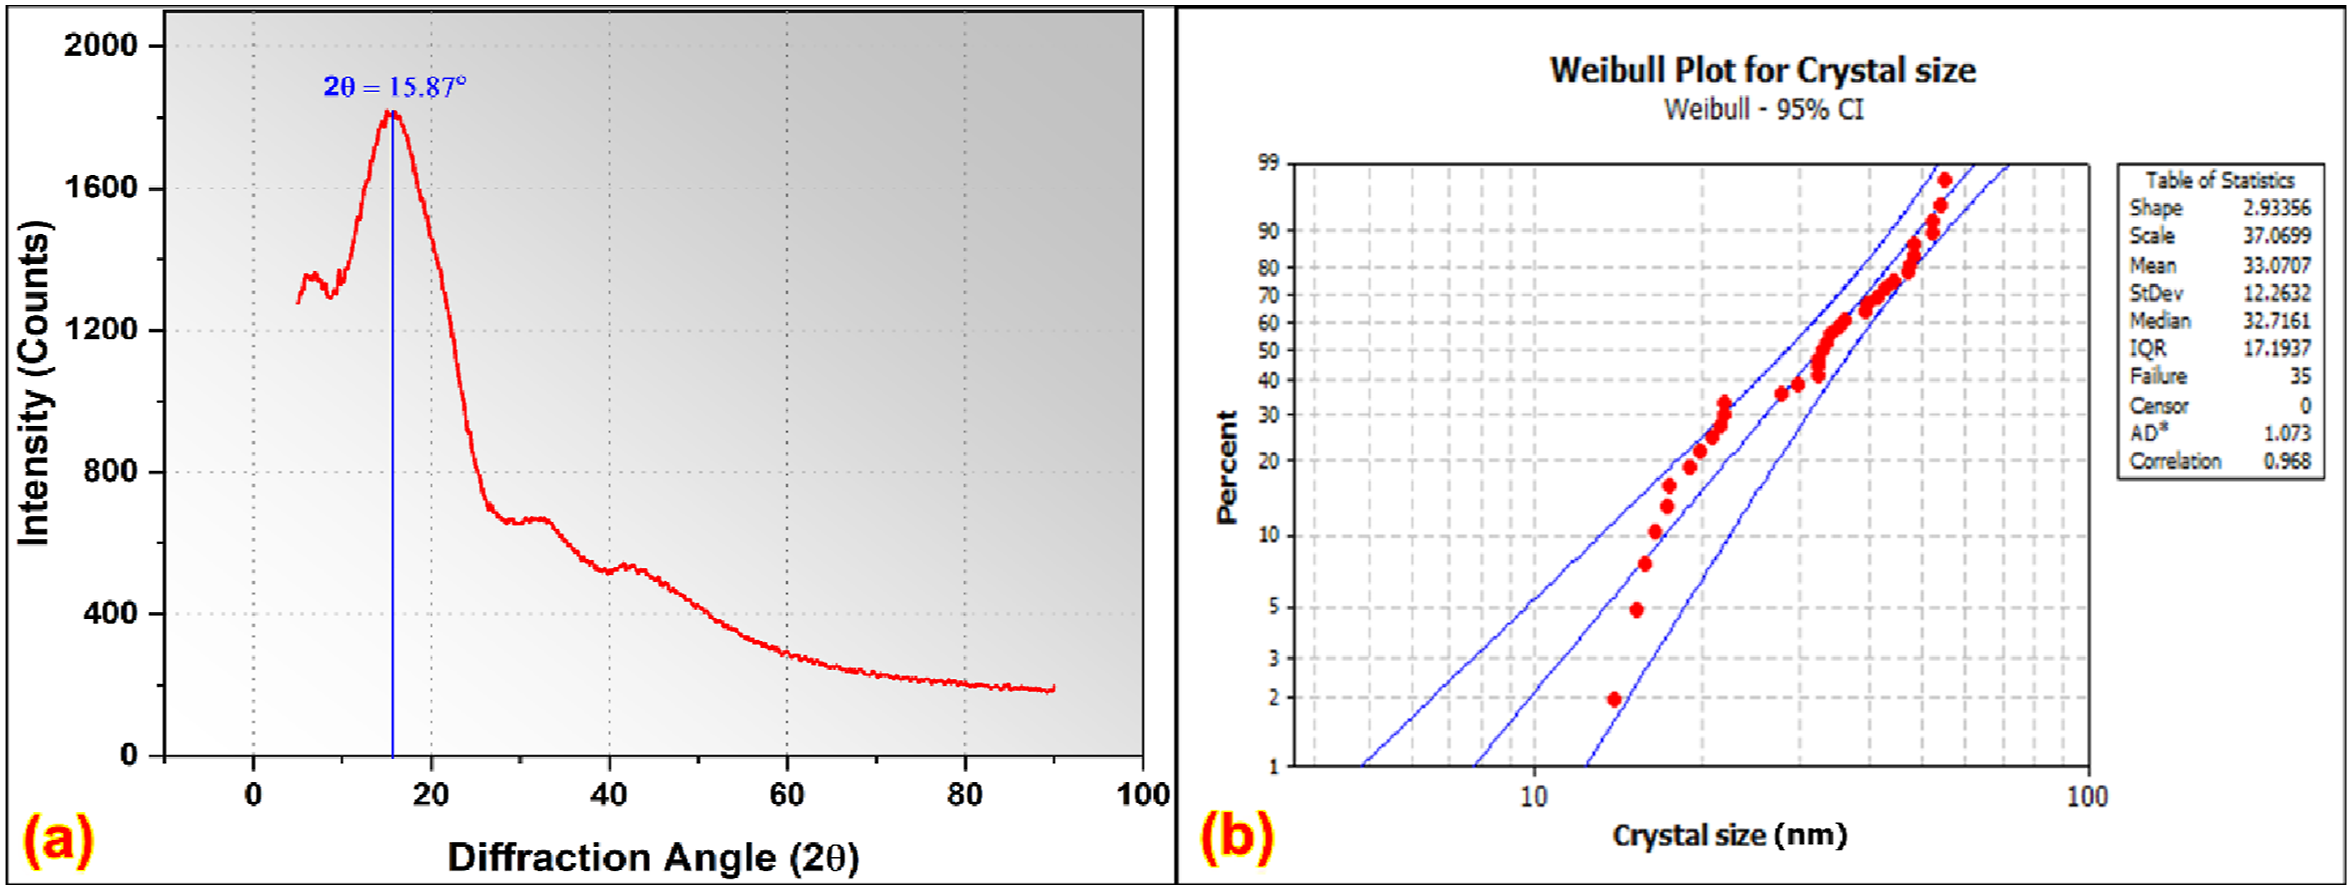
The EDAX spectrum of WPOP fillers (shown in Figure 5(a)) enlists the dominative presence of carbon (58.31 %), oxygen (41.15 %), sodium, iron, calcium and nitrogen in minimal fractions. Traces of copper, manganese and zinc are also present in the WPOP fillers. Some of the earlier studies states the presence of most of the above elements in WPOP fillers.44,45 From the SEM morphology of WPOP filler (as shown in Figure 5(b)), the soft, amorphous, and heterogenous nature is clearly seen due to the strong presence of hemicellulose and lignin and a weak presence of cellulose in the fillers, which is in line with the XRD and FTIR results. However, the roughness of the particles in the image might be due to the peel rinds containing fibrous structure as well as some fleshy portions. The appearance of the WPOP filler in the image coincides with the previous studies46,47 (a) EDAX spectrum showing the presence of various elements, (b) SEM morphology of WPOP powders illustrating various portion of pomegranate peel present in the powders in microscopic scale.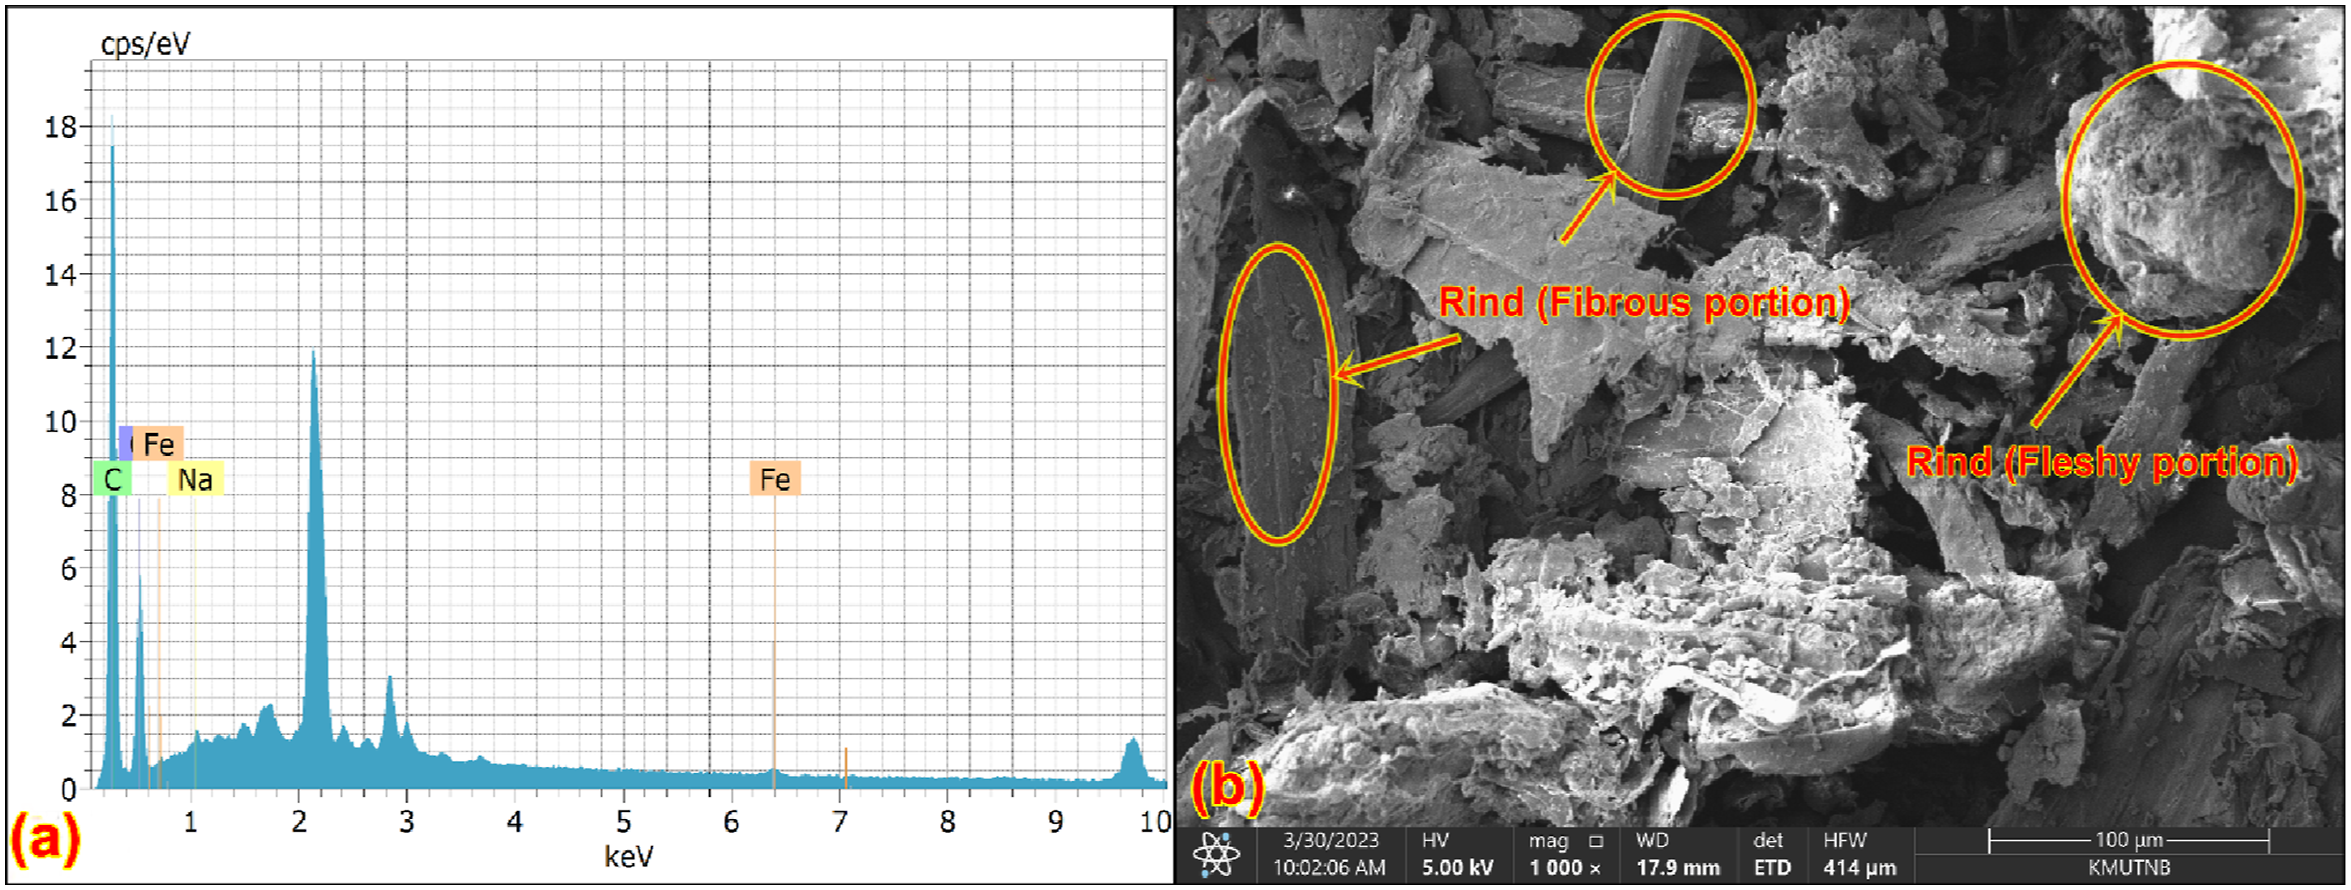
Physical properties
Density and porosity
High density of WPOP fillers (1.654 g/cc) led to the increase in density of the biocomposites than that of PLA matrix. This is a common phenomenon for all the polymer composites when the reinforcement filler’s density is higher than the density of the matrix.
24
The variation of density and the porosity values of the biocomposites is shown in Figure 6. It could be observed that the difference between the density values increase with the filler concentration. This is due to the improper wettability of the WPOP fillers and the incapability of the PLA matrix to cover the fillers at higher volume fractions due to agglomeration, resulting in the entrapment of air bubbles. In other words, the content of filler decreased the solution viscosity and the wettability of PLA matrix, which resulted in a less quantity of PLA matrix to encapsulate the WPOP fillers. This resulted in the porosity of the WPOP/PLA biocomposites which could have significant effects over its characteristics owing to the weak interfacial bonding between composite constituents.
48
The variation of theoretical and experimental density and the porosity of the composites with the variation in WPOP filler concentration is shown in Figure 6. Variation of theoretical and experimental density and porosity of WPOP/PLA biocomposites with various proportions of WPOP fillers.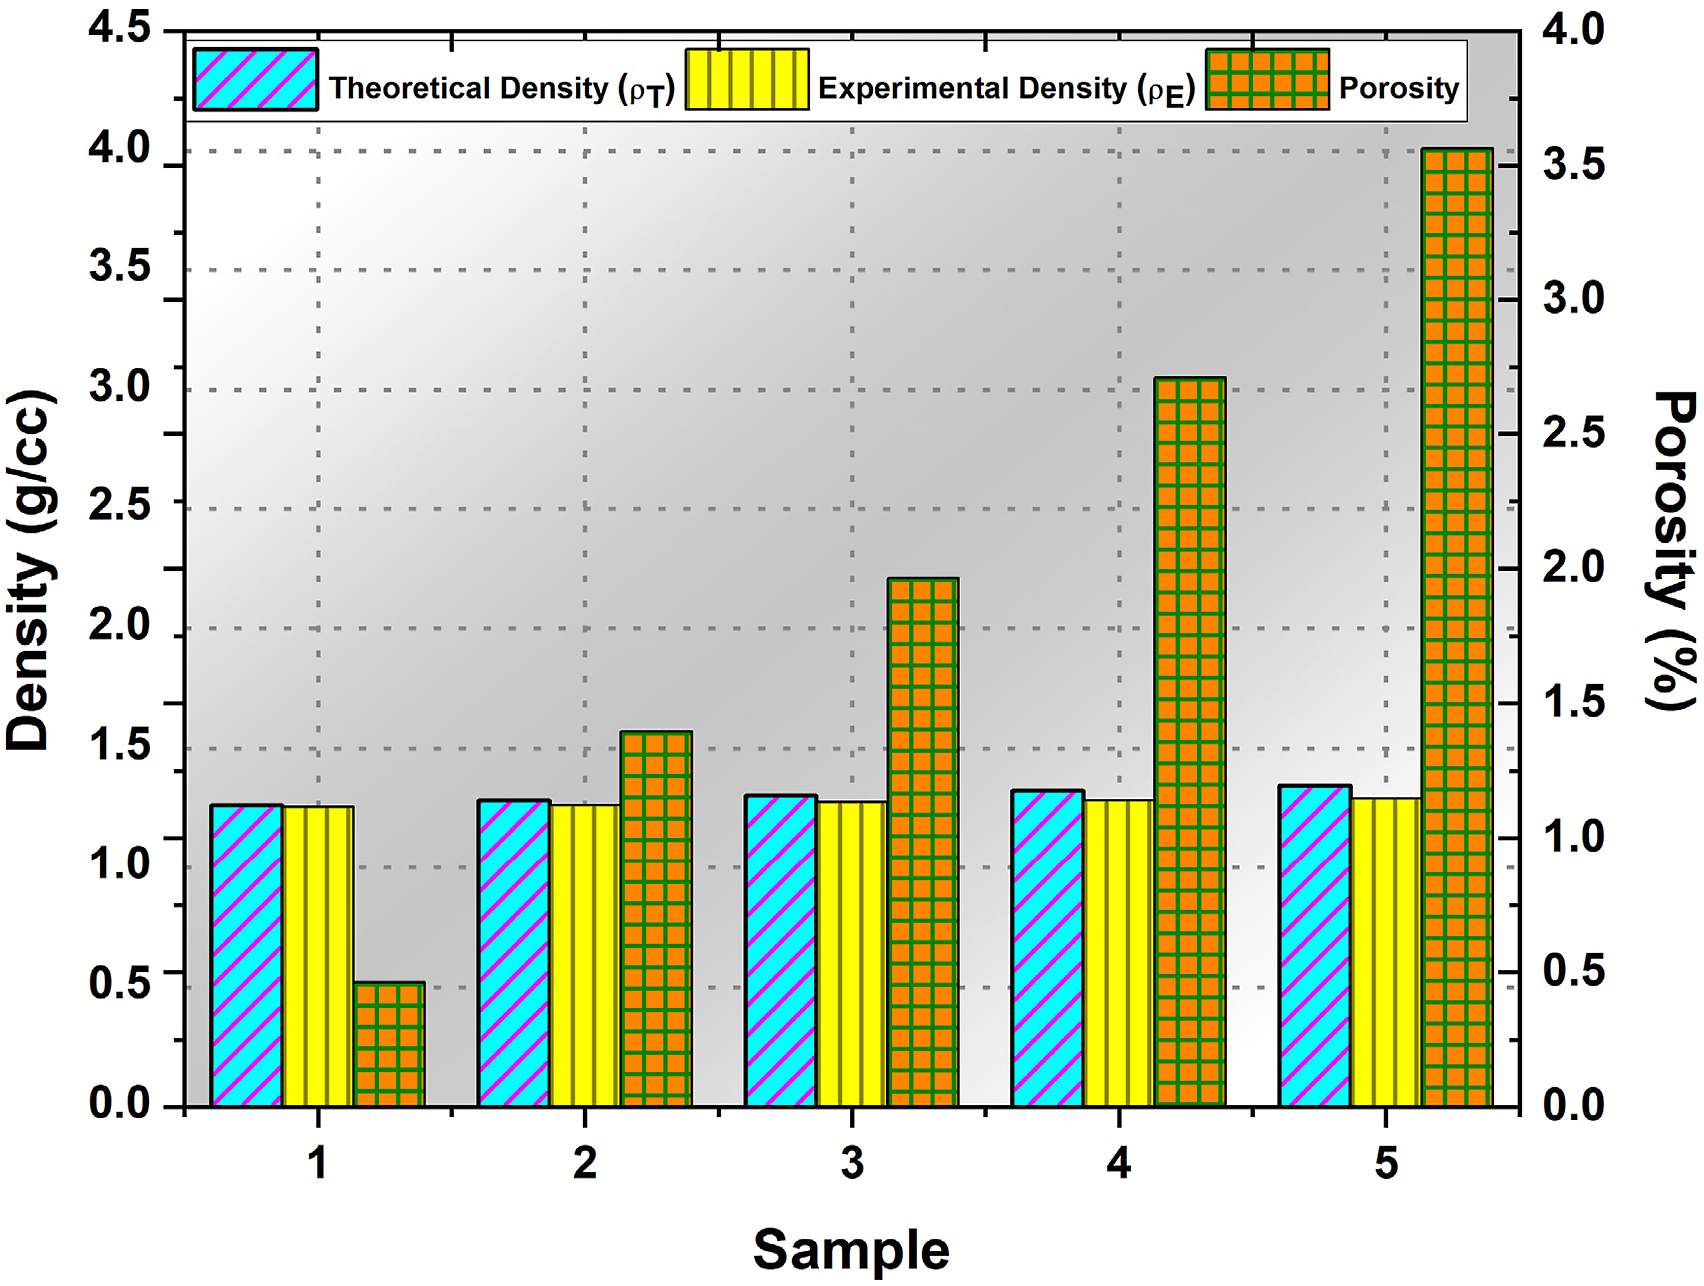
Mechanical characteristics of WPOP/PLA biocomposites
Tensile behaviour
Table S3 enlists various mechanical test results for the WPOP/PLA biocomposites. The tensile strength, modulus and elongation of WPOP1 is lower than that of the PLA. This could be because of the poor interfacial adhesion existing in between the untreated WPOP filler and PLA matrix. The soft nature of the WPOP filler can also be reason for the drop in tensile properties of WPOP1. However, the tensile behaviour was found to increase linearly with the content of the WPOP filler, due to high interfacial bonding and wettability of the WPOP fillers at higher concentrations. Higher modulus and elongation denote higher stiffness of the biocomposite material towards tensile loads.
Higher tensile strength observed for WPOP3, which could be due to the availability of sufficient fill quantity for efficient stress transfer. Tensile strength of the composites increases until WPOP3 and drops thereafter drastically. The drop in tensile strength attributed to the agglomeration of the WPOP fillers at higher loadings. Owing to the presence of more amount of WPOP fillers in WPOP4 and WPOP5, the wettability of the fillers would have reduced leading to poor interfacial characteristics between the filler and the matrix. Filler particle size would also have significantly influenced the tensile behaviour of the WPOP/PLA biocomposites. Despite filler size occupies the micro-scale, their soft nature promoted uniform dispersion until WPOP3 which could be the reason for increase in tensile properties. Nevertheless, the size of the fillers at higher filler loadings would have generated more stress concentration zones, which reduced the effective stress transfer thereby reducing the tensile properties of WPOP4 and WPOP5. A similar observation has been made in some of the previous studies.31,49 The variation of tensile strength, tensile modulus and elongation break is displayed in Figure 7(a) and (b). (a) Tensile, flexural and compressive strength and hardness (b) tensile modulus, elongation and impact strength of WPOP/PLA biocomposites with various weight fractions of WPOP fillers.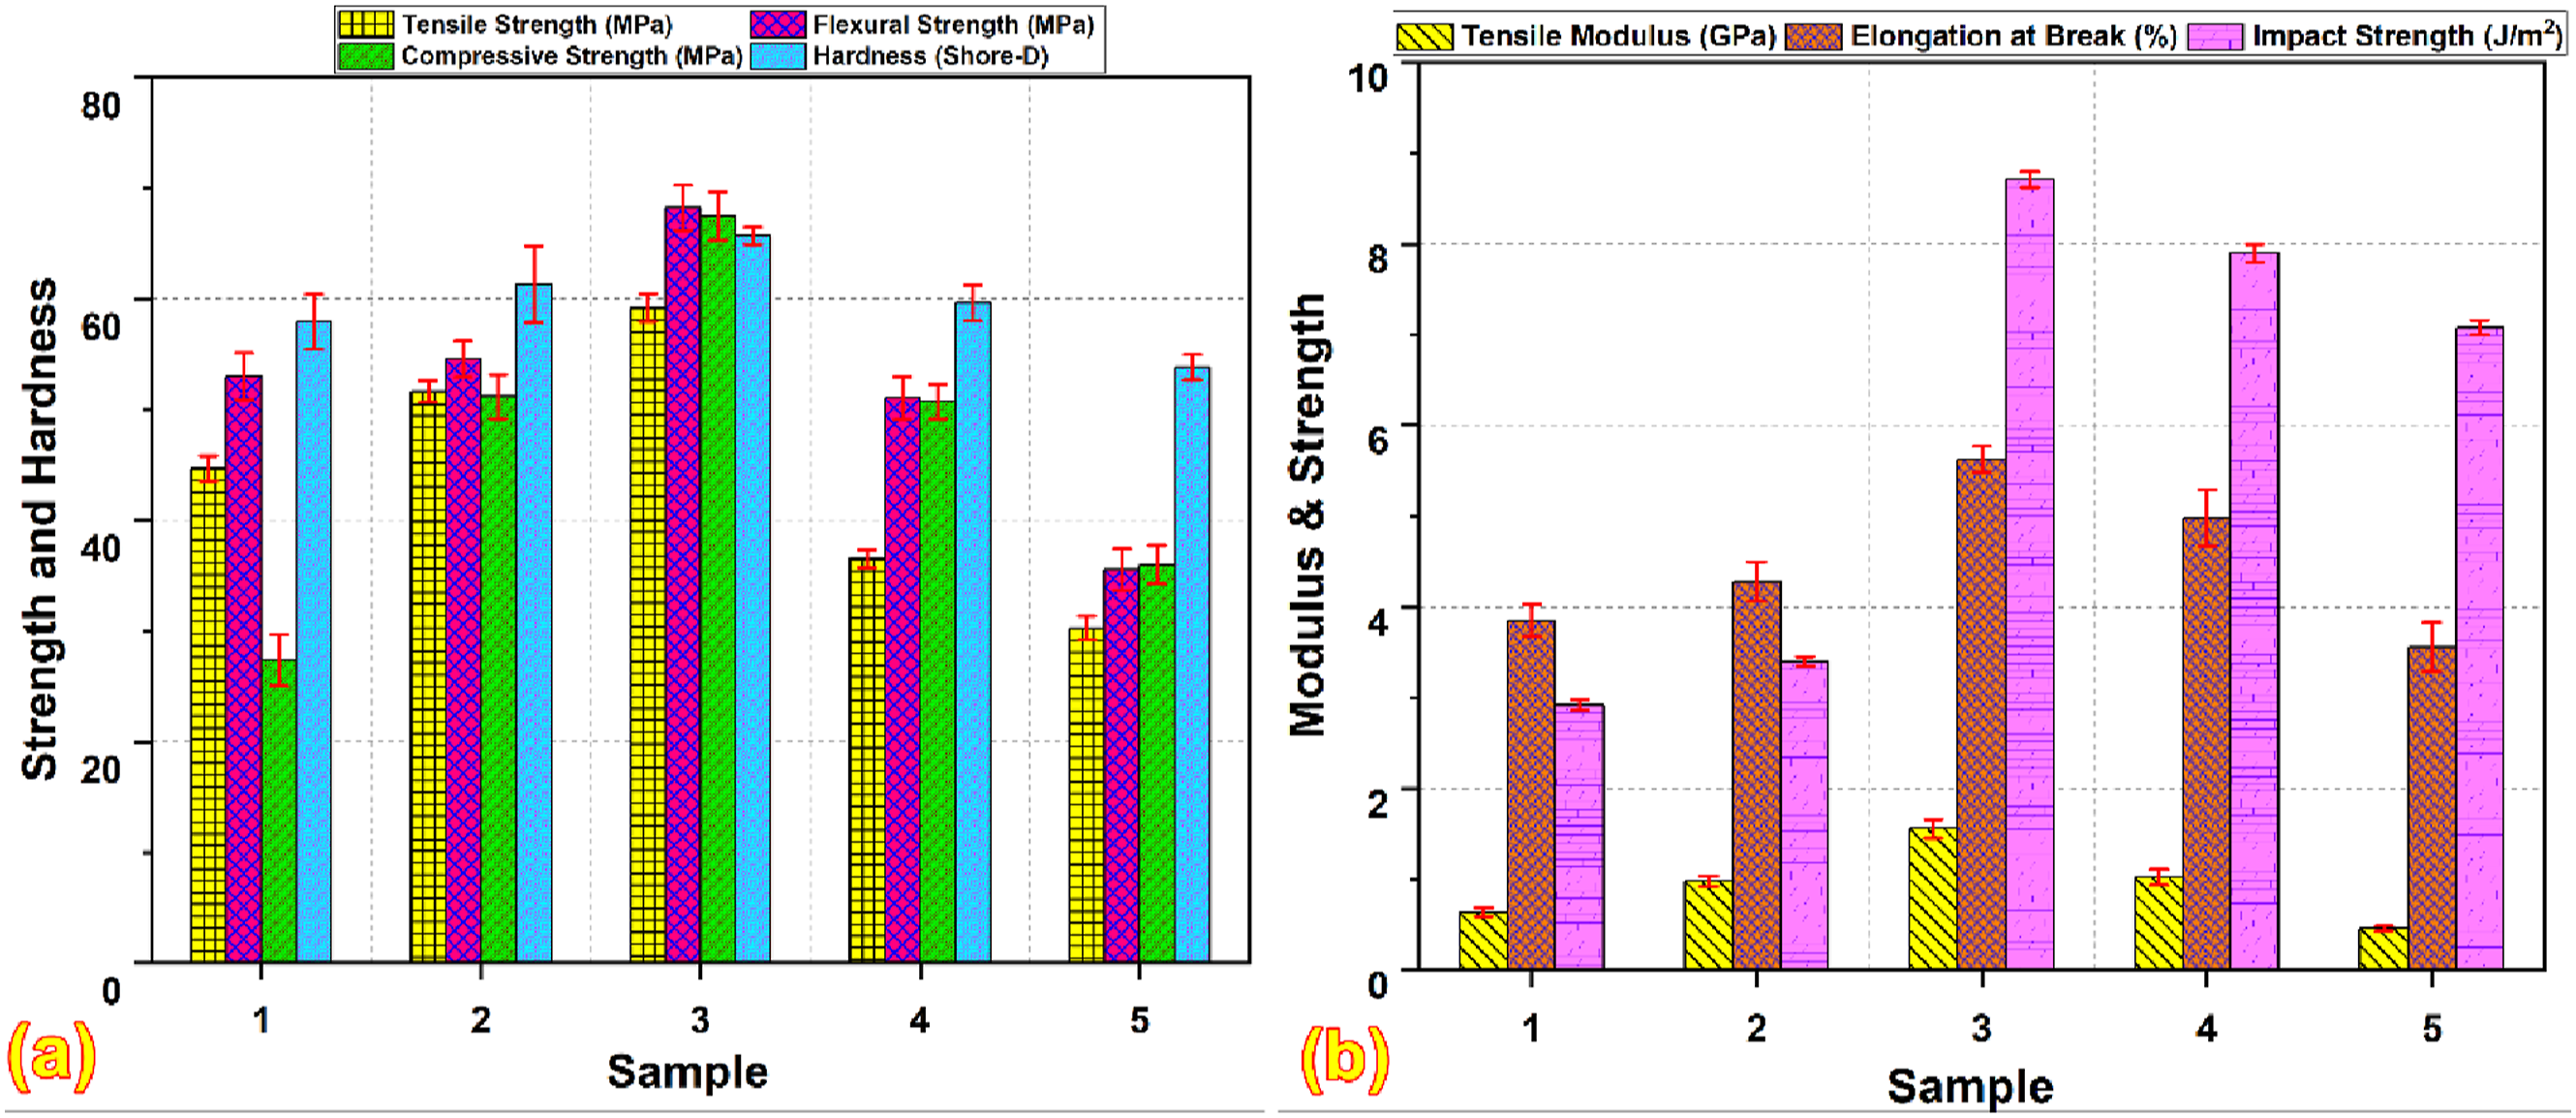
Flexural properties
The variation in flexural strength for various composite configurations are displayed in Figure 7(a). The trend followed by the flexural strength of WPOP/PLA composites is more alike the trend followed by tensile strength. The flexural strength of WPOP1 found to be lesser than the pure PLA and the strength values increased proportionally with filler volume fraction until WPOP3. Owing to the more amount of void content in WPOP1, the strength dropped. Even though the porosity also increased with filler proportion, the availability of filler to transfer the flexural load also increases. This resulted in the flexural strength rise for the biocomposites and the maximum strength value was achieved for WPOP3. Due to the homogenous dispersion of the WPOP fillers in WPOP3, their resistance towards bending loads was also higher which in turn increased the flexural strength. The drop in flexural strength for WPOP4 and WPOP5 attributed to the incapability of the filler that transfer flexural loads due to their agglomeration. The stretching and compression of top and bottom layers of the composites was non-uniform at these compositions, which drastically reduced the flexural strength. Lower filler-matrix adhesion and poor stress transfer are the reasons for the drop in flexural strength. Some of the earlier experimenters had a similar observation. 50
Compressive properties
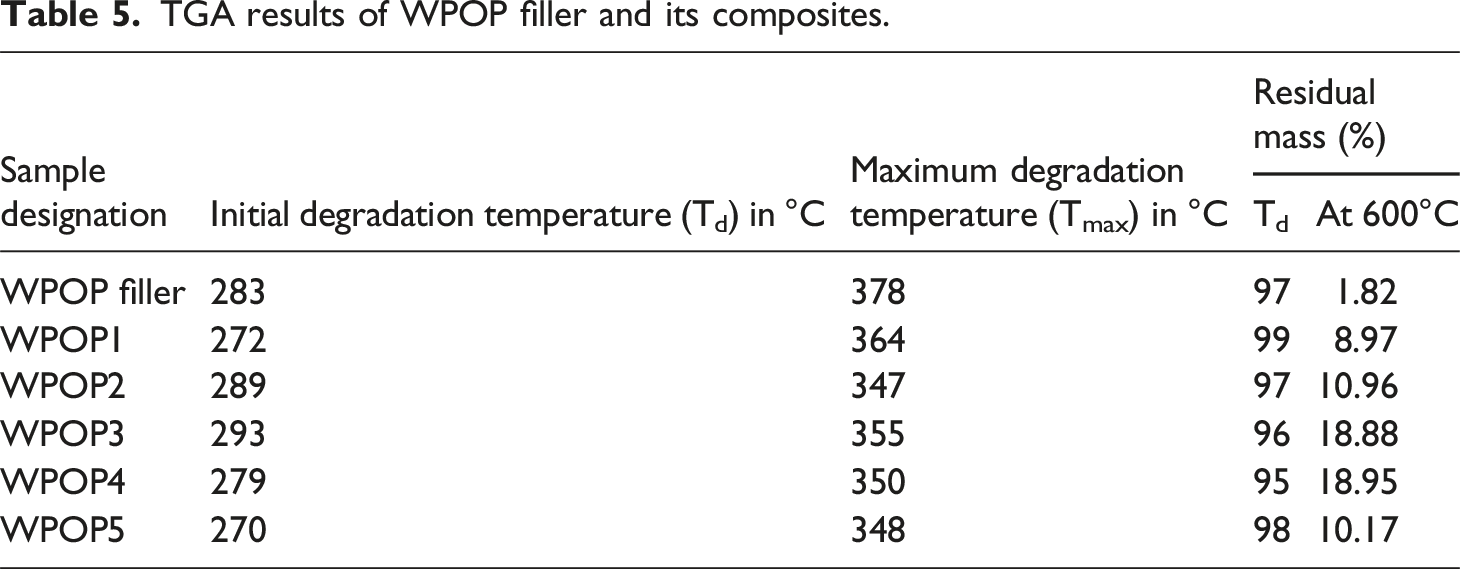
TGA results of WPOP filler and its composites.
Impact properties
Impact behaviour of the fabricated WPOP/PLA biocomposites followed an increasing trend along with the filler concentration as shown in Table S3 and Figure 7(b). At lower filler concentrations (WPOP1 and WPOP2), the energy absorption capability of the fillers was not sufficient which rendered lower impact strengths. Meanwhile, in WPOP3 owing to better compatibility and availability of fillers, the energy absorption behaviour of the composites increased rendering higher impact strengths. This is supported by the soft nature and fine structure of the WPOP fillers, which exhibited a very good wettability in PLA matrix rendering a better interfacial adhesion. At this filler concentration, the resistance towards the crack propagation during the impact loads was better and hence it rendered higher impact strengths. Thereafter, for WPOP4 and WPOP5, the impact strength dropped owing to the hindrance offered by the excessive quantity of fillers towards the cross-linking of polymers. Due to this, a proper interface result in poor energy absorption capability for the composites. Additionally, excessive quantity of fillers decreased the stiffness of the composites retarding their toughness, which could also be a reason for the drop in impact strength. At these filler concentrations, the combination of poor interfacial adhesion and voids resulted in the formation of microcracks during impact loading which failed to dissipate the gained energy and ended up in lower impact strength values. The same observation has also been made in some of the previous experimental studies.52,53
Hardness
Shore D hardness of the WPOP/PLA composites increases continuously with the increase in filler quantity until WPOP3. The hardness values from Table S3 show that WPOP filler-reinforced PLA composites had higher hardness values than neat PLA for all the composites. The variation of hardness values for various composite samples can be pictorially visualized in Figure 7(a). Owing to the smaller quantity of fillers in WPOP1 and WPOP2, the resistance offered towards the indentation by the composites was very small which resulted in lower hardness values. In WPOP3, the compatibility between constituents, uniform dispersion of fillers, and better interfacial bonding rendered significant resistance towards the penetration of the indenter within the composites. This is the reason for the maximum hardness of the WPOP3 sample. As stated earlier, agglomeration, non-uniform dispersion, void content, and poor wettability were the reasons for the drop in hardness values for WPOP4 and WPOP5. Hence, all the above studies show that WPOP3 performed better in all the mechanical tests and possesses better mechanical strength when compared with all its counterparts.
Morphological analysis
The fracture morphology of WPOP3 after tensile and flexural tests were shown in Figure 8(a) and (b) respectively. Morphology portrays a better interfacial bonding between the WPOP filler and PLA matrix. The surface of the composite is smooth proving the existence of better composite interface. Morphology also depicts the homogenous WPOP filler dispersion in the PLA matrix that promoted stress transfer. Voids, matrix cracks, and discontinuities were very minimal for WPOP3 composites showcasing the reason for higher mechanical properties. Filler pullout was observed in only a few spots depicting the appreciable adhesion of the WPOP filler with the PLA matrix. Since fillers occupied all the spaces effectively, the dispersion of the fillers was uniform in this composition. This can be witnessed from the relatively lower porosity values of WPOP3. Few ridges on the failure surface depict a subtle brittle failure owing to the soft nature of the reinforcements, which could also be due to the enhanced affinity between the WPOP filler and PLA matrix. Some previous experimental studies have made most of the above observations for filler-based polymer composites.
54
Hence, the WPOP3 composites had a very small amount of defects and abnormalities and relatively less porosity, which elevated them to possess better mechanical properties. (a) Tensile fracture morphology of the WPOP3 biocomposites showing minimal discontinuities, voids and lesser fiber pullout, (b) flexural fracture morphology showing ridges portraying the better interfacial adhesion of WPOP3 biocomposites.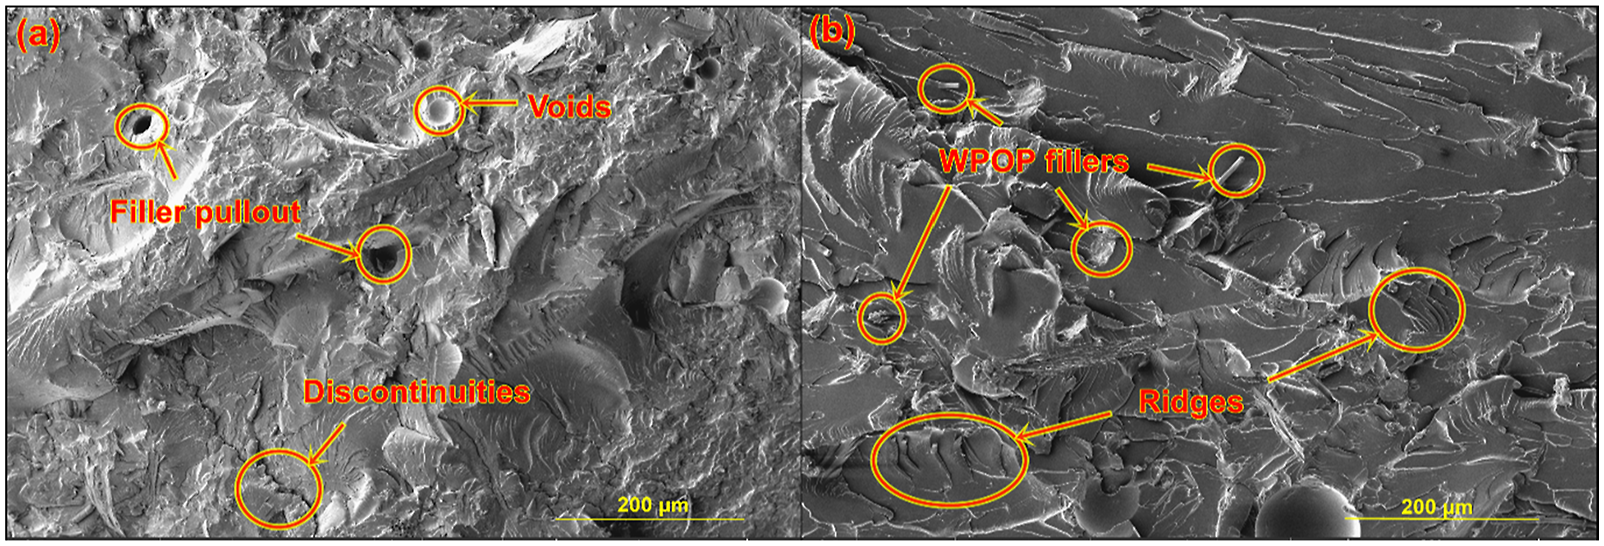
Thermal characteristics
Thermogravimetric analysis (TGA)
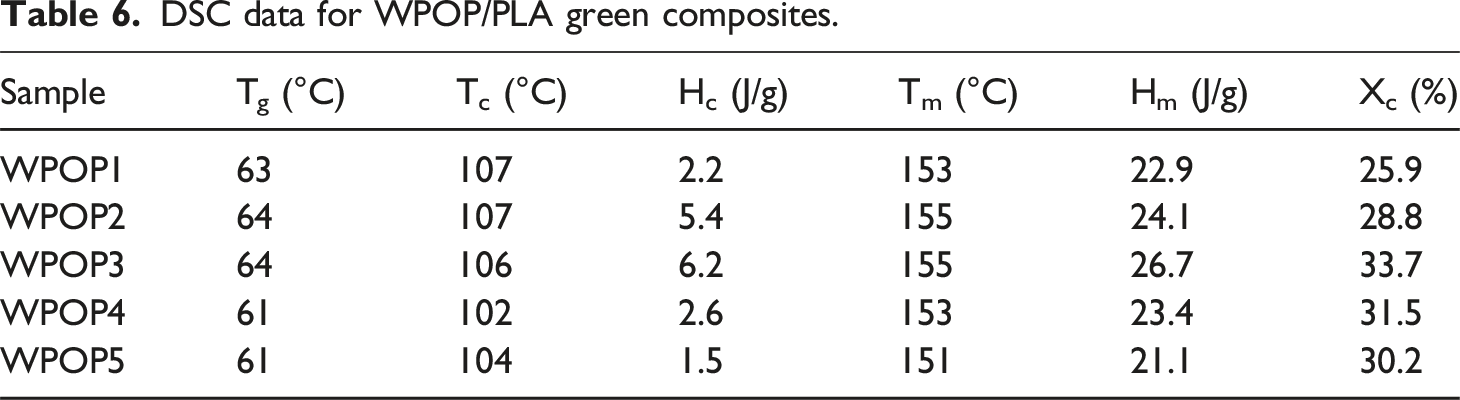
DSC data for WPOP/PLA green composites.
Sigle stage and two-stage degradation was observed for WPOP filler (Figure S1) and WPOP/PLA composites (Figure 9(a)) respectively. The first stage of degradation of WPOP/PLA biocomposites was least significant as observed in the figure. (a) TGA curve of WPOP/PLA biocomposites depicting various zones such as onset degradation, maximum degradation temperatures and residual mass after complete degradation, (b) DTG curves showing the maximum degradation temperature of the WPOP/PLA biocomposites.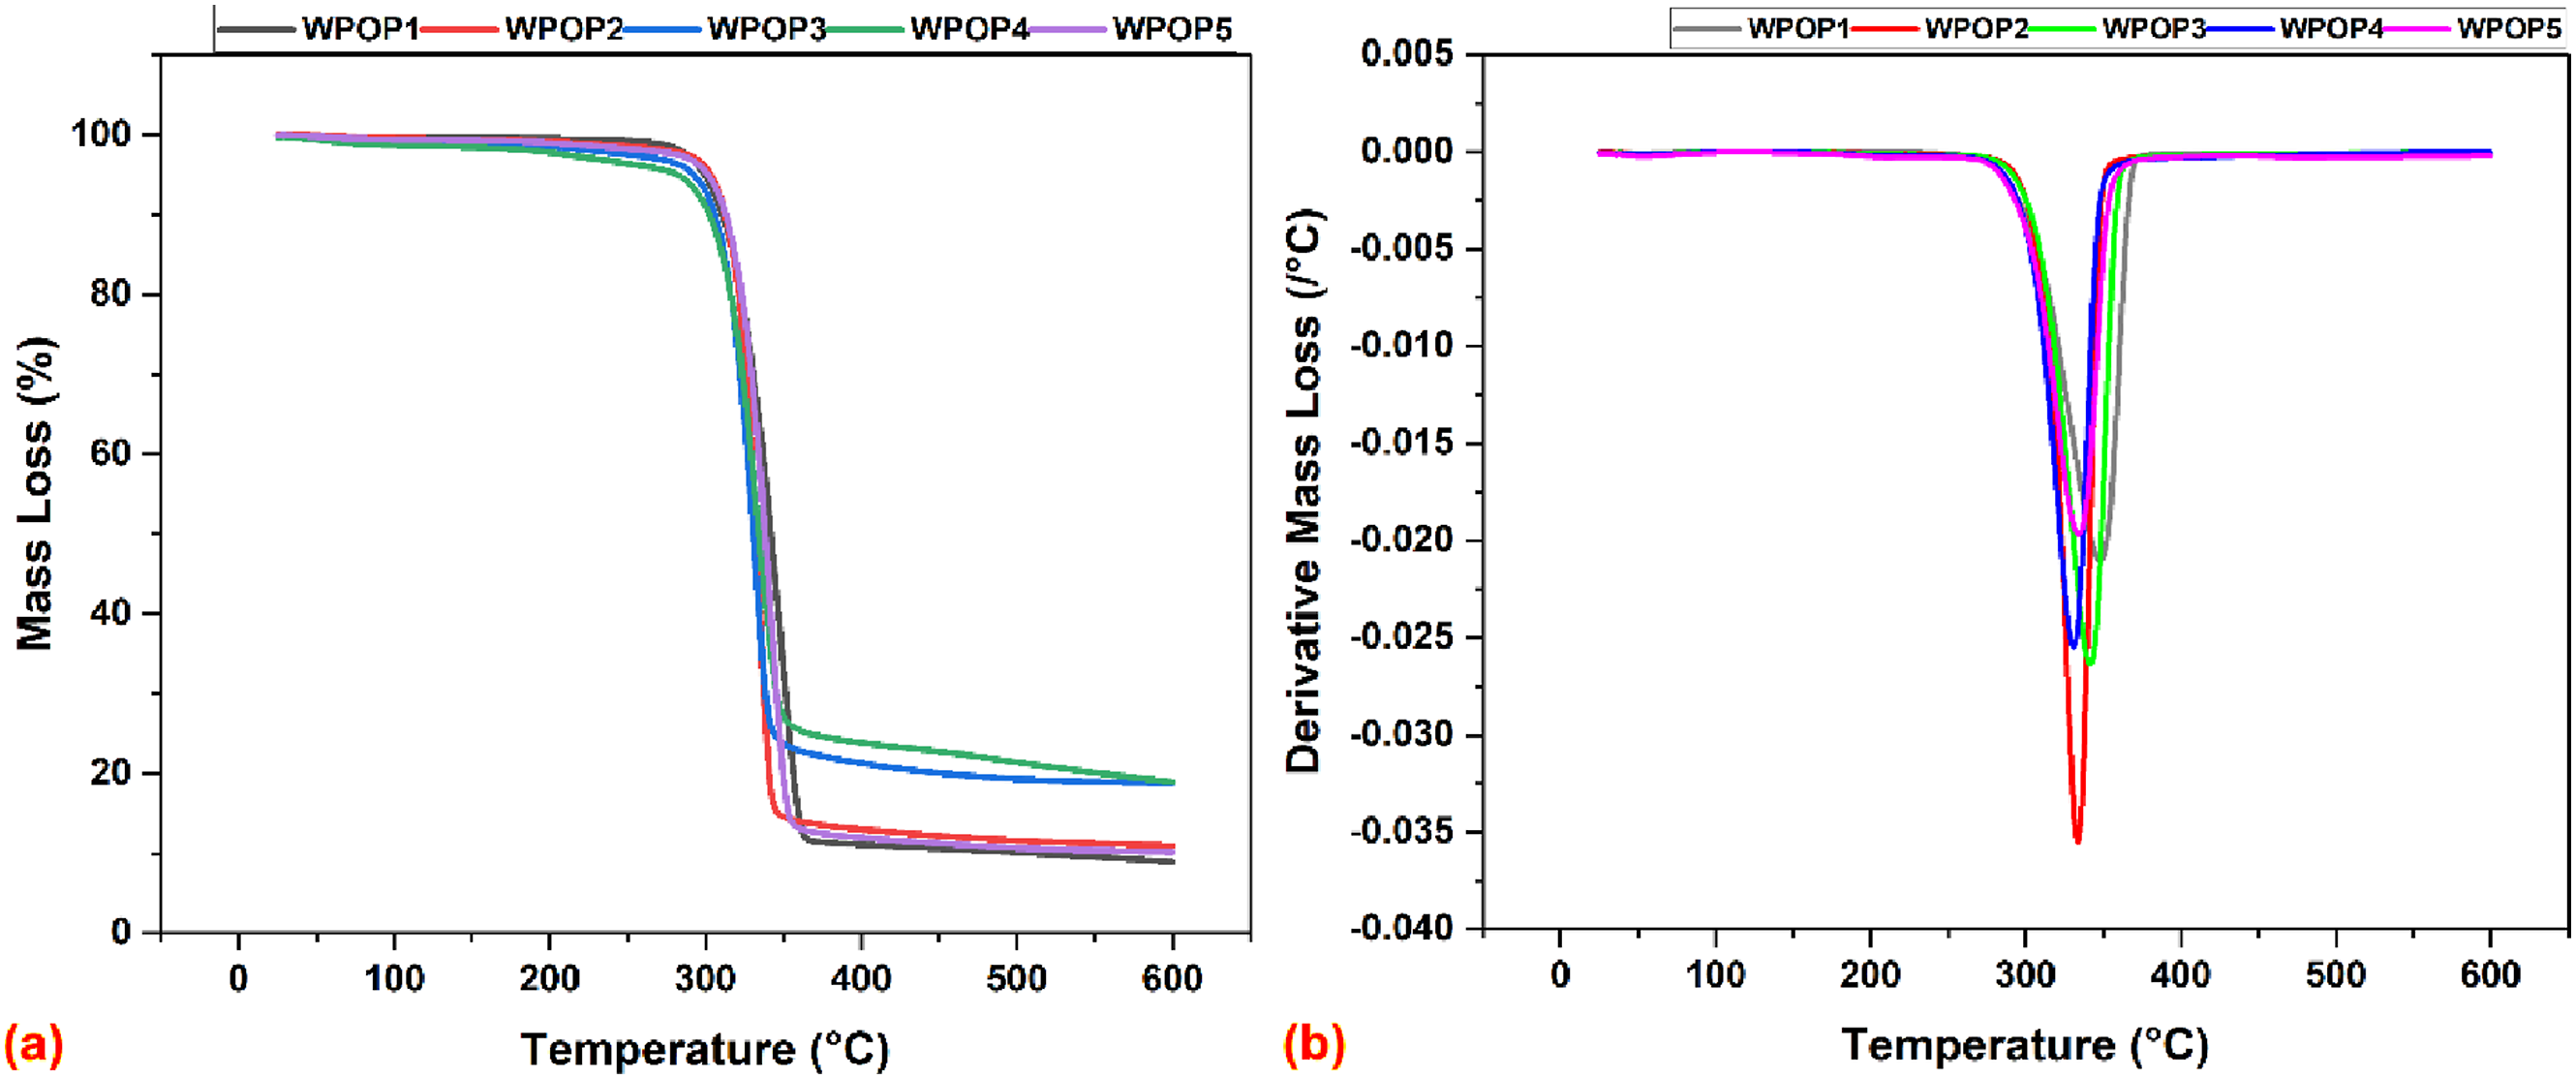
On the other hand, the presence of higher quantity of WPOP fillers resulted in the thermal decomposition and devolatilization of filler particles at lower temperatures owing to the higher magnitudes of catalytic cracking in WPOP4 and WPOP5. This reduced the maximum degradation temperatures and the residual mass at that temperature. The residual mass values at Td depicted the structural stability of the composites while the residual mass at 600°C denotes the suitability of the composites used in elevated temperature applications. The maximum residual mass after the degradation cycle portrays better interfacial adhesion and the presence of thermally stable intermolecular bonds between WPOP fillers and PLA, which highly reduced the composites’ thermal degradation. The char formation of the filler at WPOP3 acted as a protective layer from the thermal decomposition of the PLA resulting in higher residual mass values. Figure 9(b) illustrates the DTG curves of WPOP/PLA composites for all the composite samples altogether from which the Tmax could be observed. The DTG curves show that the WPOP3 has the maximum degradation temperature relatively.
Differential scanning calorimetry
The melting and crystallization behaviour of the WPOP filler and WPOP/PLA biocomposites were determined using DSC. Glass transition temperature (Tg), crystallization enthalpy (Hc), melting enthalpy (Hm), melting temperature (Tm), crystallization temperature (Tc) and crystallization rate (Xc) were calculated and inferred from the DSC test results. Equation (4) is used for calculating of Xc for WPOP/PLA biocomposites.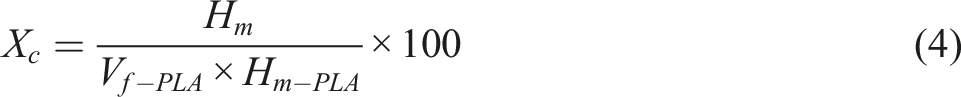
In equation (4), Vf-PLA and Hm-PLA denotes the volume fraction and enthalpy during melting for completely crystalline PLA (93 J/g) respectively.55,56 Table 6 contains the experimental and calculated values obtained from experiments and equation (4). Glass transition for WPOP fillers occurred at 62°C, crystallization occurred at 109.54°C with a crystallization enthalpy of 2.19 J/g. For WPOP/PLA biocomposites, the value of glass transition increased after the addition of WPOP fillers due to the mobility limitation caused by the fillers for the PLA network chain. Glass transition of WPOP/PLA biocomposites increased linearly with the filler content until WPOP3 according to the results. The maximum Tg was attained for WPOP3 due the close-forming of PLA particles with the maximum assistance of the WPOP filler particles. However, the glass transition of WPOP4 and WPOP5 reduced because of the agglomeration and the least hindrance offered by the WPOP fillers towards the mobility of the PLA matrix. It was stated in various studies that Tg and Xc values should linearly increase as the non-crystalline chain mobility was restricted by fixing them onto the immobile crystals of fillers. 49 In case of WPOP/PLA composites, the value of Tg increased along with the Xc values showing the increased restriction for the mobility of the PLA molecular chain. Enhanced interfacial bonding between the WPOP filler and PLA matrix and enhanced nucleation of WPOP3 increased the Xc of the composites.
In case of crystallization of WPOP/PLA biocomposites, the crystallization temperature followed a negative trend with the increase in filler concentration until WPOP3. This denotes the rapid biocomposites crystallization after the transition from rubbery region. The energy absorbed by the composites increase with the filler content denoting the swift crystallization of the WPOP/PLA biocomposites. This crystallization behaviour of the biocomposites can be attributed to their nucleation due to the addition filler. However, in the case of WPOP4 and WPOP5, the decrease in interfacial compatibility between the WPOP filler and PLA matrix reduced the nucleation effect, which ultimately reduced the crystallization of the composites. The increase in crystallization is due to infusion of WPOP fillers into the macromolecular and heterogenous crystallization of the PLA matrix which also resulted in increased viscosity of the biocomposites. The same effect was observed in some of the earlier studies.56,57
Due to the amorphic nature of the WPOP fillers, the energy required for their crystallization was more which is evident from the higher energy consumption by the composites during their recrystallization. Table 7 show the shift of the melting peaks at elevated temperatures due to the increase in the WPOP filler contents. Consumption of higher energy during the melting of biocomposites portrays the good interfacial bonding that would have delayed the thermal disintegration of polymeric chains. A similar phenomenon was observed in some of the earlier studies too.
58
It could be deduced that the incorporation of WPOP fillers increased the heating rate and the phase change temperature of the WPOP/PLA biocomposites depicting a positive thermal kinetics of the WPOP/PLA biocomposites. The DSC curve of WPOP/PLA composites is shown in Figure 10. DSC curve showing the glass transition, crystallization, and melting peaks of WPOP/PLA biocomposites.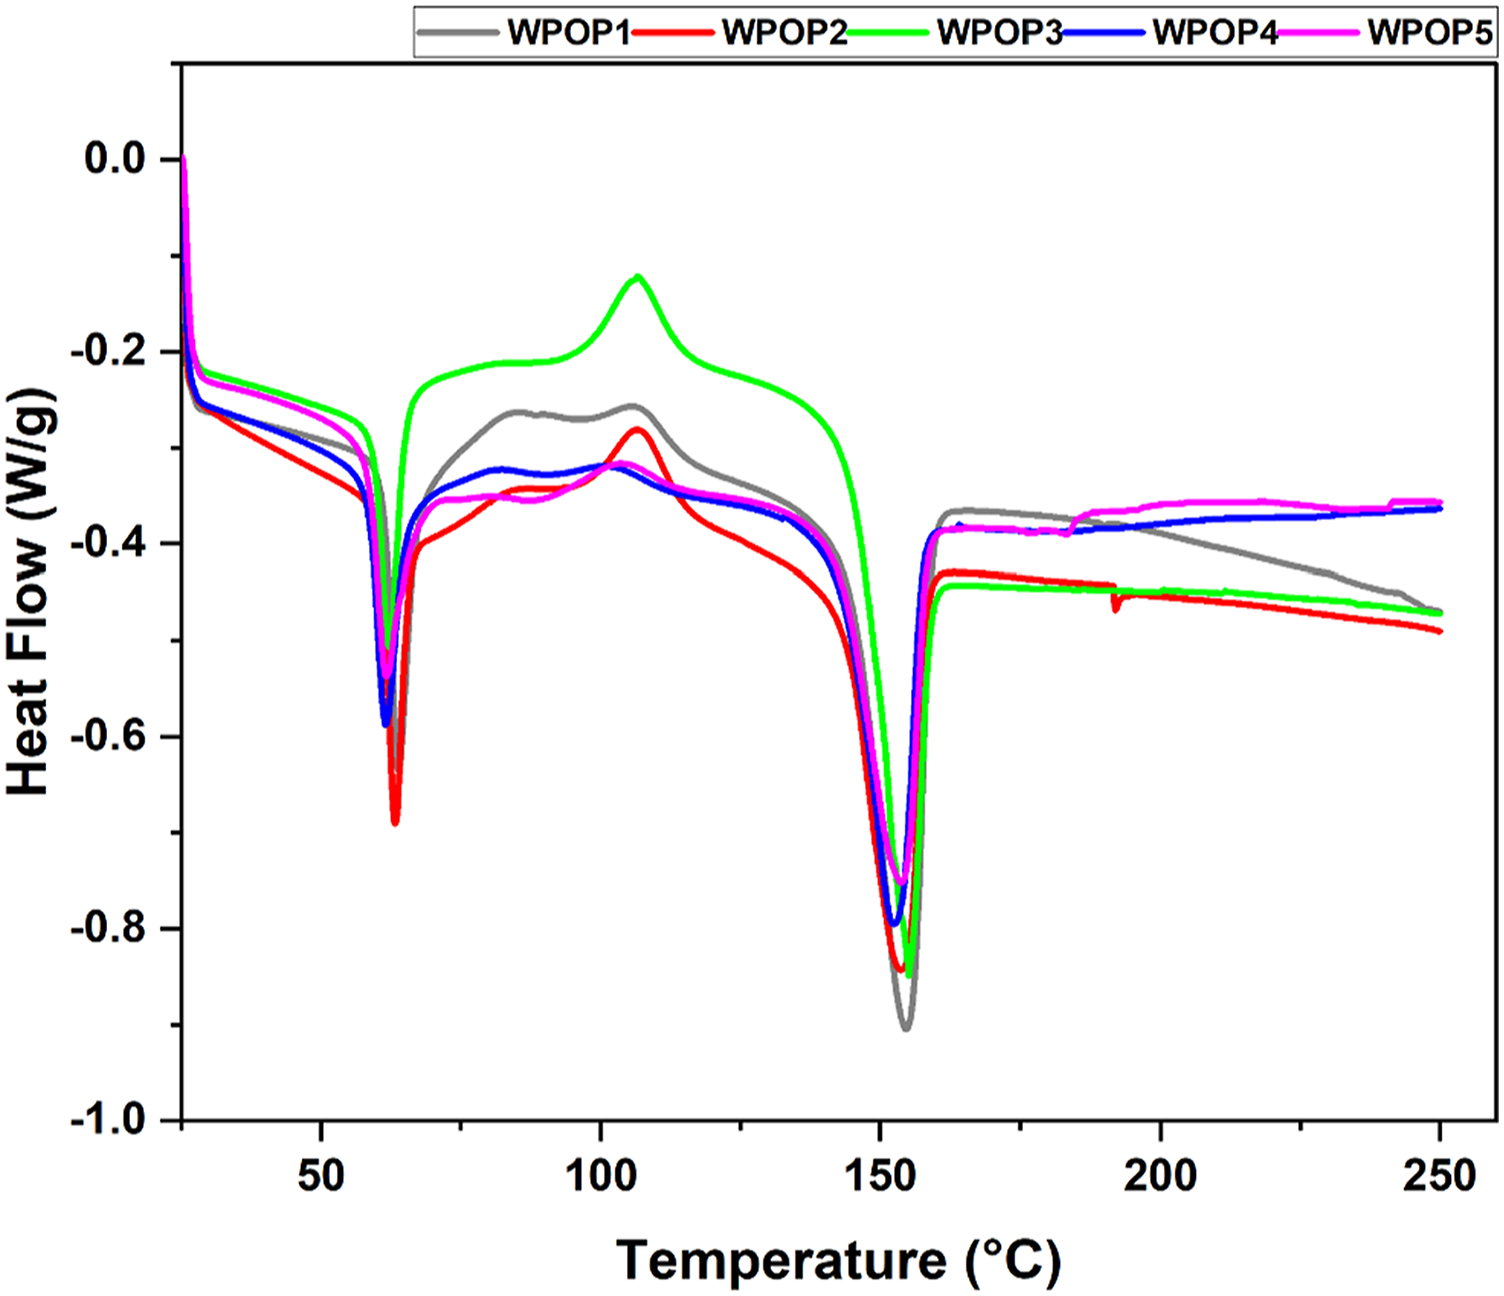
Thermo-mechanical analysis (TMA)
The dimensional and structural stability of the WPOP/PLA composites were assessed using the TMA technique. Figure 11(a) and (b) depicts the TMA results of the WPOP/PLA biocomposites illustrating the percentage of shrinkage and the coefficient of thermal expansion of the biocomposites with the temperature variation. Figure 11(a) shows that the WPOP composites had undergone dimensional change when subjected to simultaneous mechanical and thermal load. Shrinkage value increases with the increase in the content of WPOP fillers. Though the fillers act as an effective stress transfer medium, the thermal load induced variation in the PLA matrix, which was the reason for the expansion or shrinkage of the biocomposites. The WPOP3 exhibited higher dimensional stability since the expansion or shrinkage of these composites began only around 70°C. Their shrinkage values were within 3.5% showing their resistance towards the concurrent mechanical and thermal loading consitions. This could be ascribed to the better interfacial adhesion, a strong mechanical interlocking bond developed between the PLA matrix and the WPOP filler, and the better resistance offered by the fillers towards the polymeric chain mobility. (a) Shrinkage percentage of the biocomposites with the variation of temperature, (b) expansion coefficient of the biocomposite samples between 40°C and 90°C where both expansion and contraction of the biocomposites occurred.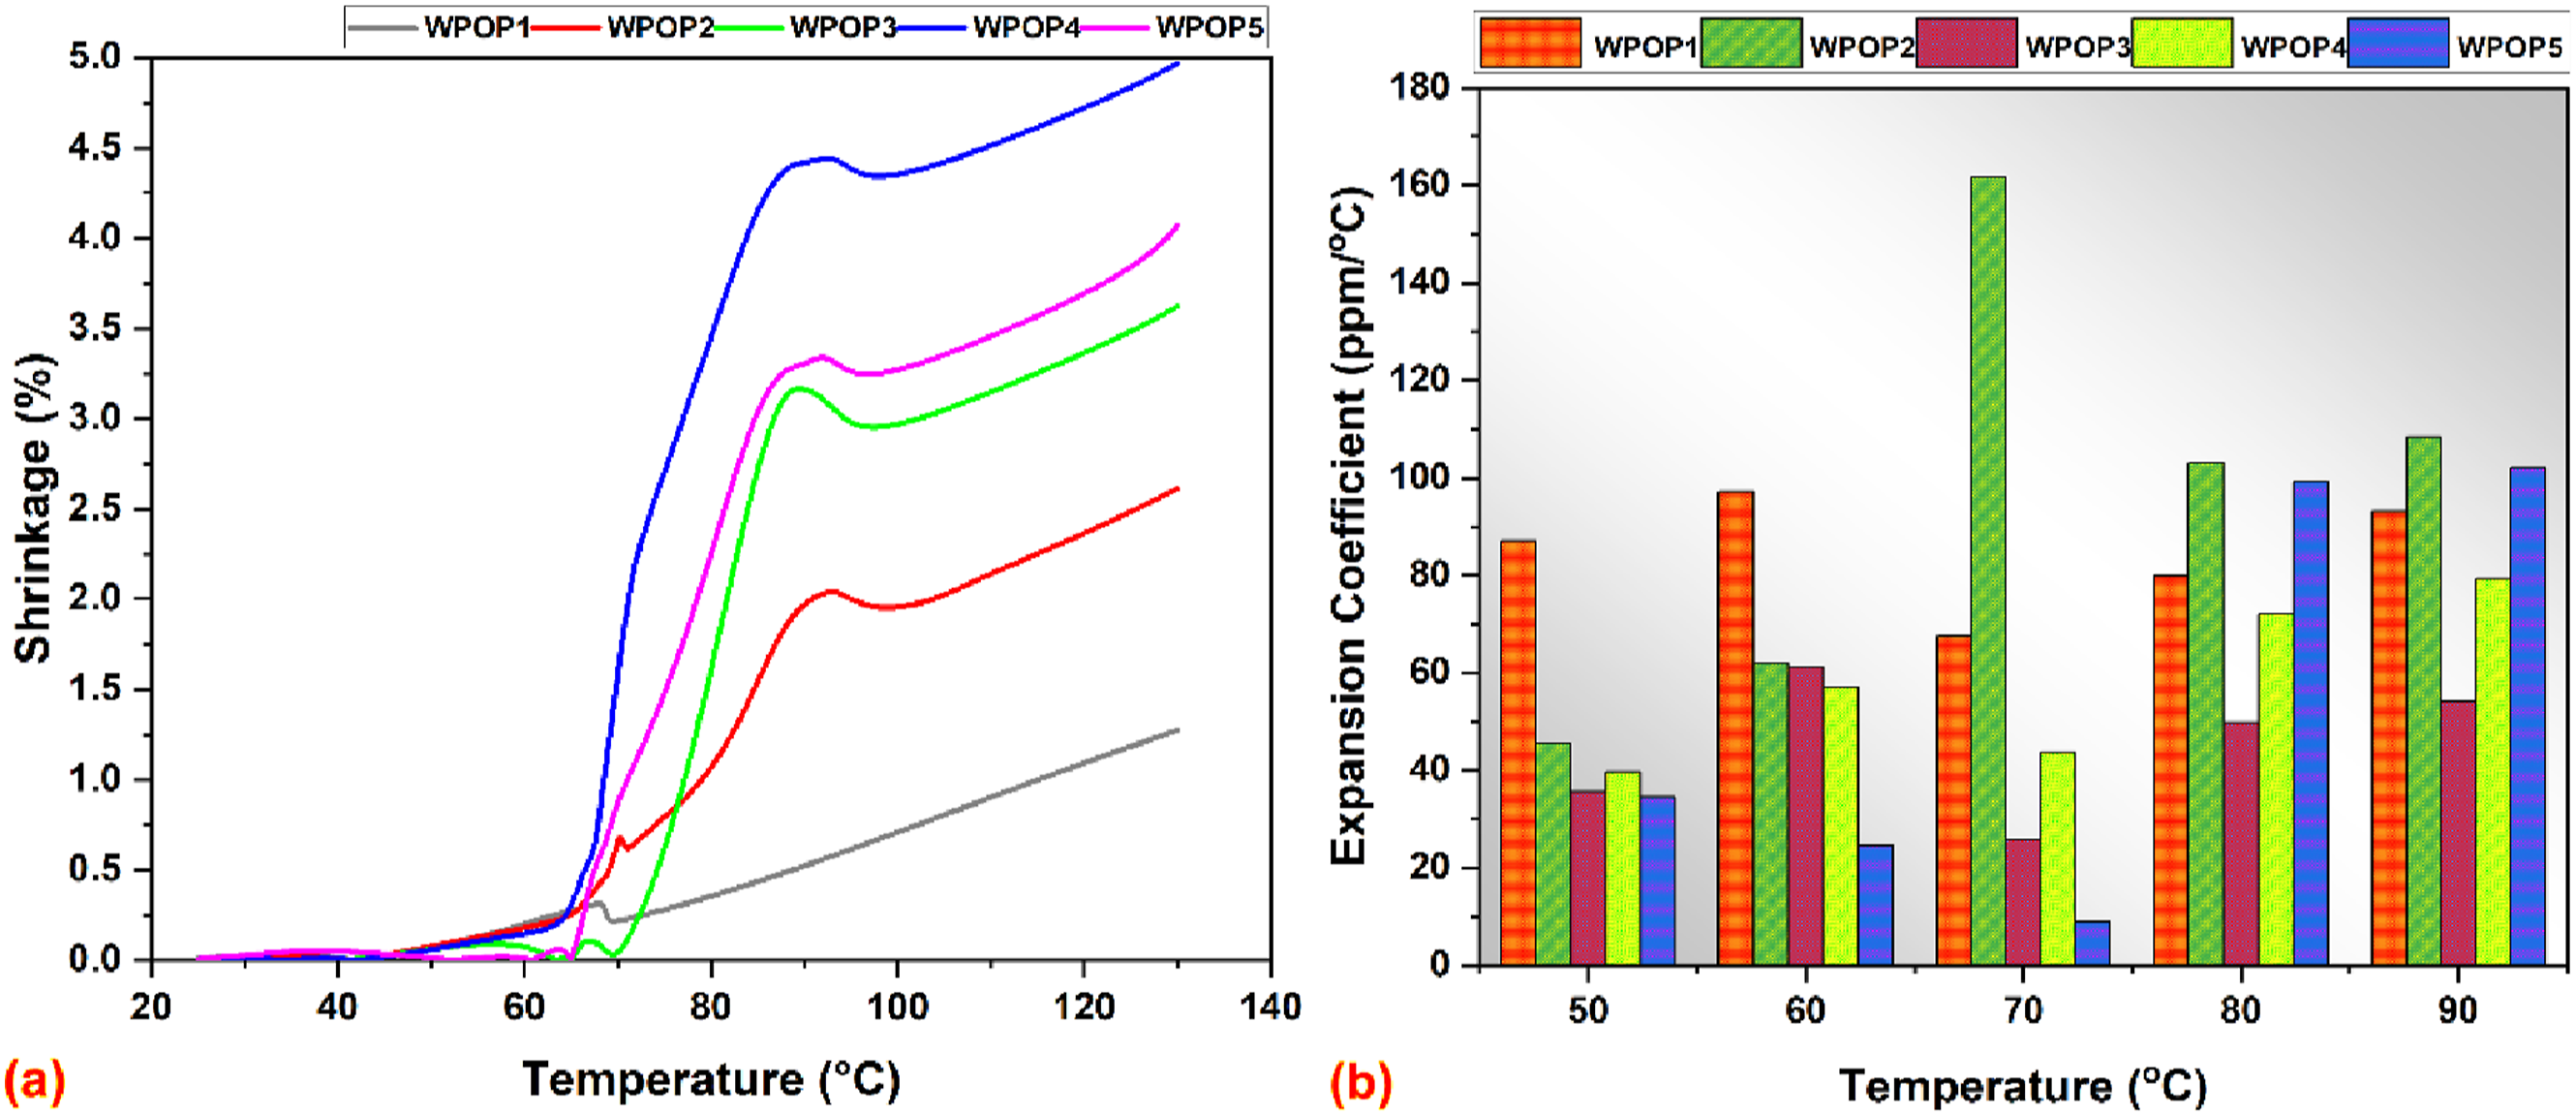
Despite their amorphous nature, the degree of crystallinity restricted the molecular movement at higher temperatures which rendered a better dimensional stability for these biocomposites. It can be evidently seen from Figure 11(b) that the coefficient of thermal expansion value is also lesser for WPOP3 due to its better structural stability. On the other hand, WPOP4 and WPOP5 exhibited relatively higher shrinkage and expansion because of the increased amorphous nature of the biocomposites at higher temperatures. Weak interfacial bonding and devolatilization of the amorphous elements reduced their dimensional stability at elevated temperatures. Hence, WPOP3 were found to possess a relatively better thermal and structural stability.
Conclusions
Using the waste pomegranate fruit peel biofillers as reinforcement with varying weight fractions in PLA matrix was the scope of the current study and various physical, mechanical and thermal properties for the developed biocomposites were evaluated. WPOP biofillers was found to possess a strong -CH2 stretching and -CH bonds depicting the strong presence of amorphous compounds. The crystallinity index of the WPOP biofillers is less which specifies the presence of amorphous and soft compounds. All the mechanical properties increased for the 15 wt. % of biofiller-based biocomposites and decreased thereafter. At 15 wt. % biocomposites, the samples exhibited 13.6% increase in tensile strength, 42% increase in tensile modulus, par flexural strength, 9.34% increase in compressive strength, 41% in impact strength and 26% increase in hardness and better thermal behaviour when compared with virgin PLA. These better mechanical properties were owing to the outstanding homogenous dispersion, interfacial adhesion, and better stiffness and toughness.
Thermal stability of the biocomposites varied with the biofiller contents and the biocomposites with 15 wt. % of biofillers exhibited better thermal stability and high residual mass after complete degradation. These biocomposites were characterized by high glass transition and low recrystallization temperature, high melting point and higher rate of crystallization. WPOP fillers exhibited a stable structure until 283°C and degraded thereafter while the residual mass of the biofiller was 1.81%. Similarly, the filler glass transition occurred at 62°C. These properties make the composites suitable for elevated temperature applications. Dimensional stability varied with the content of the biofillers and the biocomposites with 15 wt. % of biofillers were found to possess better shrinkage value and lower expansion coefficient values depicting their strong dimensional stability. From all the above, it could be concluded that the waste pomegranate fruit peel biofiller can be a potential biomass-based reinforcement for polymer matrices resulting in eco-friendly, renewable and sustainable biocomposite materials for lightweight structural applications. Further work should focus on by the hybridization of pomegranate peel powder biofillers with lignocellulosic natural fibers and other biofillers, which opens new avenues for various engineering applications.
Supplemental Material
Supplemental Material - Sustainable biocomposites based on polylactic acid and agro waste biofillers for lightweight applications: Fabrication and properties
Supplemental Material for Sustainable biocomposites based on polylactic acid and agro waste biofillers for lightweight applications: Fabrication and properties by M Ramesh, L Rajeshkumar, MR Sanjay and Suchart Siengchin in Journal of Thermoplastic Composite Materials
Footnotes
Acknowledgments
We would like to express our sincere gratitude to the Natural Composites Research lab, The Sirindhorn Thai-German Graduate School of Engineering, King Mongkut’s University of Technology North Bangkok, Thailand for providing us with the necessary facilities for the testing, and characterization of the composites. This research budget was allocated by National Science, Research and Innovation Fund (NSRF) (Fundamental Fund 2024), and King Mongkut’s University of Technology North Bangkok (Project no. KMUTNBFF-68-A-02).
Declaration of conflicting interests
The author(s) declared no potential conflicts of interest with respect to the research, authorship, and/or publication of this article.
Funding
The author(s) received no financial support for the research, authorship, and/or publication of this article.
Supplemental Material
Supplemental material for this article is available online.
References
Supplementary Material
Please find the following supplemental material available below.
For Open Access articles published under a Creative Commons License, all supplemental material carries the same license as the article it is associated with.
For non-Open Access articles published, all supplemental material carries a non-exclusive license, and permission requests for re-use of supplemental material or any part of supplemental material shall be sent directly to the copyright owner as specified in the copyright notice associated with the article.