
Abstract
This study fabricated Bioglass® reinforced polyurethane (PU) scaffolds by solvent casting/particulate leaching technique to investigate the effect of Bioglass® percentage on the properties of the PU scaffolds. Bioglass® percentage was varied for 0 wt %, 10 wt %, 20 wt %, 30 wt %, 40 wt % and 50 wt % in the PU matrix. The composite scaffolds were characterized using a field emission scanning electron microscope (FESEM) equipped with energy dispersive X-ray (EDX) to observe the morphology and compositions of the scaffolds, and Fourier transform infrared spectroscopy (FTIR) to analyze functional group interactions. Their properties were thoroughly assessed through porosity testing, compression testing and in-vitro bioactivity evaluation. Results demonstrated that increased Bioglass® percentage improved the compressive strength of the PU-BG scaffolds from 0.5 MPa to 1.5 MPa. The in-vitro test revealed that the addition of Bioglass® induced and accelerated the bioactivity of PU-BG scaffolds. When 50% of Bioglass® was added, an apatite layer was formed on the composite scaffolds after 14 days of incubation. The optimal Bioglass® content for improving both mechanical properties and bioactivity of PU scaffolds was found to be 50 wt %. These findings suggest that PU-BG composite scaffolds have potential applications in bone tissue engineering and may provide insights into designing bioactive scaffold materials for enhanced osteointegration.
Introduction
Tissue engineering is an emerging multidisciplinary and interdisciplinary field involving the development of bioartificial implants and/or the nurturing of tissue remodelling to repair and enhance tissue or organ function. 1 According to Fortune Business Insights research, the global market for Bone Graft Substitutes is expected to reach US$4.04 billion by 2024 and US$6.67 billion by 2032. 2 This high demand for bone graft substitutes is driven by a growing number of orthopaedic surgeries performed worldwide and the growth of novel bone graft substitutes and materials. The main application in tissue engineering is a 3D scaffold which provides a suitable microenvironment for the incorporation of cells or growth factors to regenerate damaged tissues or organs. The requirements for an ideal scaffold are biocompatible, biodegradable, and able to promote cellular interactions and tissue development as well as possess proper mechanical and physical properties. 3
Bioactive glass is classified as a ‘class A’ biomaterial which can form a bond with a bone and is successfully used for bone regeneration. 4 The first bioactive glass, known as Bioglass® 45S5, was discovered by Hench (2006) between 1969 and 1971. 5 With a composition of 45% SiO2, 24.5% Na2O, 24.5% CaO, and 6% P2O5, Bioglass® can acquire excellent bioactivity. 4 The high connectivity of the network containing a proportion of bridging oxygen bonds (silica tetrahedra covalently bonded to other silica tetrahedra via O–Si–O bonds) is durable in body fluid. High silica content creates high connectivity of silicate network. However, silica content should not exceed 60 mol.% as it is not considered bioactive. Ca and Na act as network-modifying cations which are required to lower the connectivity. 6 Additionally, the glass transition temperature (Tg) and the melting temperature (Tm) for Bioglass® were reported to be 538°C 7 and 1377°C8,9 respectively.
Kokubo reported in 1991 that the vital requirement for an artificial material to bond to a living bone is the formation of bone-like apatite on its surface. In vitro apatite formation can be reproducible in a simulated body fluid (SBF) with ion concentrations close to human blood plasma. 10 The formation of apatite is a mineralization phenomenon that is induced by osteoblasts in vivo. Accumulation of dissolution products on the Bioglass® interface produces a favourable chemical composition and pH conducive site for the nucleation of apatite. 11 Multi-stage processes are involved in the dissolution mechanism and bone-bonding of Bioglass® to form an apatite layer6,12: (i) A swift exchange of cation between alkali-metal cations of Na+ and/or Ca2+ from the glass with H+ from solution forms silanol bonds (Si–OH) on the glass surface. (ii) Rises in pH cause the OH− ion to attack the silica glass network, breaking Si–O–Si bonds and thus creating more Si-OH at the glass-solution interface. (iii) Condensation of Si–OH groups around the glass surface and repolymerization of the silica-rich layer occur. (iv) Adsorption of Ca2+ and (PO4)3−groups to the surface through the silica-rich layer also from the solution creates a film rich in amorphous CaO–P2O5 on the silica-rich layer. (v) Combination of hydroxyls and carbonate from surrounding solution and crystallization of the CaO–P2O5 film form hydroxycarbonate apatite layer.
Despite possessing excellent bioactivity properties, Bioglass® has weak mechanical strength with lower tensile strength than human cortical bone. With such strength, Bioglass® cannot be implanted alone in load-bearing applications. 5 Thus, Bioglass® is frequently incorporated with polymers to improve mechanical properties and induce the bioactivity of the polymers. Few studies demonstrated that incorporating Bioglass® into the polymer matrix can reduce the brittleness of the glass and increase the stiffness of the polymer phase.13–15 Few studies also coated and incorporated bioactive glass into polymers such as polyurethane (PU)14,16,17 and polycaprolactone (PCL). 18 The results showed that the composites can improve the bioactivity of the scaffolds by forming an apatite layer and positive cell growth. Among the biodegradable polymers used in tissue engineering, PU has attracted much attention with its unique segmented structure. 19 The mechanical properties, thermoplasticity and durability of PU can be tailored depending on its application19–22 owing to its tunable soft and hard segment properties. 23 The glass transition temperature (Tg) of PU ranges from −42°C to −46°C depending on the structure and composition of the PU. The melting peak reported by Ahmad Zubir S. et al. (2018) is in the range of 46°C to 49°C corresponds to the melting of the PCL soft segments, while the second peak, ranging from 154°C to 164°C, is associated with the melting of the hard segment domains. 24
However, the poor bioactivity of PU limits its application as a scaffold as it fails to regenerate bone growth. 25 Despite the advantages of PU and Bioglass®, only a few studies further investigated the development of Bioglass® reinforced PU scaffold for bone tissue regeneration.14,16,17 The present work aimed to fabricate Bioglass® reinforced PU scaffold by solvent casting/particulate leaching (SC/PL) method. SC/PL is a well-known technique due to its versatility and ease of fabrication. The process involves the dispersion of the leaching agent into a polymer solution followed by casting, drying and leaching process. 19 The effect of the percentage of Bioglass® (0 wt %, 10 wt %, 20 wt %, 30 wt %, 40 wt % and 50 wt %) on the properties of the PU scaffold were characterised in terms of morphological, physical, functional and mechanical properties as well as in-vitro behaviour. Incorporating Bioglass® into PU scaffolds is expected to enhance bioactivity, improve mechanical properties, and support better interfacial bonding between the two phases. This approach could result in scaffolds with improved mechanical strength and better biological performance for bone tissue engineering applications.
Methodology
Synthesis of polyurethane
Biodegradable PU that acts as a matrix phase for the composite scaffold was synthesized by a two-step polymerization technique according to the modified method by Ahmad Zubir S. et al. 24 Polycaprolactone (PCL) and butanediol (BD) from Sigma Aldrich were dried in a vacuum oven at 80°C for 12 h before mixing to eliminate the moisture. In the first step, PCL diol was mixed with 4, 4′-methylenebis (cyclohexyl isocyanate) (HMDI) (Sigma Aldrich) for 2.5 h at 80°C to produce a prepolymer. The prepolymer preparation took place in three-neck round bottom flask under nitrogen gas flow. In the second step, prepolymer and BD were mixed in the HAAKE™ internal mixer with the presence of 0.15 wt % catalyst. The mixing between the prepolymer and BD occurred at 90°C for 15 min with a rotor speed of 50 rpm. The stoichiometry of the reaction was 1:8:7 of PCL:HMDI:BD.
Synthesis of Bioglass® Powder
Bioglass® with 45.0 wt % SiO2, 24.5 wt % Na2O, 24.5 wt% CaO and 6 wt% P2O5 was synthesized by melt-quenching technique which was first introduced by Hench L. L. et al. 26 High purity raw materials including SiO2, Na2CO3, CaCO3 from MERCK Milipore and P2O5 (Fluka) were weighed and mixed homogeneously. The powder was melted in an alumina crucible using a furnace (Lenton Tube Furnace EHF 1800) with a maximum temperature of 1400°C heating rate for 10°C/min. The molten glass was quenched immediately in the deionized water bath at room temperature. Glass frit (glass bulk) was formed by quenching. The glass bulk was dried and then crushed by agate mortar into a small granule for milling. The glass granules were dry-milled into a fine powder using a tungsten oxide (WO) ball mill in a WO crucible. Milling occurred in FRITSCH Pulverisette 6 planetary mono mill with a milling rotation speed of 350 rpm for 30 min. The obtained average size of glass particles was 35 µm.
Fabrication of PU-BG scaffolds
The composite scaffold was fabricated by SC/PL technique. Synthesized PU was cut into small pieces and weighed before being dissolved in tetrahydrofuran (THF) solvent (MERCK Milipore) at 19 wt/vol. % of polymer solution concentration. The solution was continuously stirred for 2 h at a temperature of 50°C to ensure complete dissolution of PU in the solvent. Synthesized Bioglass® powder (0 wt %, 10 wt %, 20 wt %, 30 wt %, 40 wt % and 50 wt %) was then added to the PU dispersion. The percentage of Bioglass® was calculated by considering that THF was completely evaporated and leaving behind the amount of PU which is 19 g. Example for the calculation of 10BG (10 wt% of Bioglass®) is as follows:

Subsequently, the mixture of PU and Bioglass® was stirred continuously for another 1.5 h to allow homogeneous dispersion of Bioglass® in the PU solution. Leaching agents NaCl and NaHCO3 from MERCK Milipore were added to the dispersion and mixed homogeneously for another hour. The ratio of PU to the leaching agent was 1:6, and the composition was 65% NaCl–35% NaHCO3. The dispersion was then transferred into a Teflon mould (14 mm in diameter and 28 mm in thickness) and dried at room temperature for 3 days to allow complete THF evaporation. The leaching agent in the sample was then washed out by immersing the sample in de-ionized water for 7 days. The water was changed every 6 h to ensure the complete leaching of salt from the sample. Finally, the obtained scaffold was dried in an oven at 80°C for 24 h.
In-vitro immersion in Hank’s balanced salt solution
The bioactivity of the composite scaffold with different percentages of Bioglass® was assessed by an in-vitro test based on the standard ISO/FDIS 23317. The specimen was prepared in a shape of a disc with the dimension 14 ± 1 mm in diameter and 2 ± 1 mm in thickness. The immersion solution used in this testing was Hank’s Balanced Salt Solution (HBSS) supplied by Gibco. HBSS solution was poured into a sterilized falcon tube with certain volume based on the following equation:

Characterizations
Field emission scanning electron microscopy (FESEM) equipped with energy dispersive X-ray (EDX) was employed to analyse the porous structure of the PU-BG scaffolds. The surface changes of the PU-BG scaffolds after in-vitro immersion were also observed by FESEM. The bulk density of the scaffold (ρ_scaffold) was calculated by volume over the mass. The volume was calculated from the dimension of the scaffold which was measured using a digital caliper (Mitutoyo Japan). The mass was determined using an electronic analytical weighing balance (RADWAG AS 220/X). The average of volume and mass were taken from five readings. The total porosity or known as percentage porosity (Π) can be calculated as follows27,28:


Results and discussion
Morphological analysis
Porous PU-BG scaffolds were prepared by SC/PL technique with varying Bioglass® content. Figure 1 shows the FESEM images for the morphology of PU-BG scaffolds varied with 0 wt %, 10 wt %, 20 wt %, 30 wt %, 40 wt % and 50 wt % of Bioglass®. All the scaffolds were observed with the irregular shape of macropores, and the pore size ranged from 300 µm to 500 µm. The formation of interconnected micropores mostly occurred on the walls of the scaffold regardless of Bioglass® percentage. Based on the observation, the Bioglass® percentage did not significantly influence pore shape and size. The leaching agent was the major factor that influenced the pore structure for PU-BG scaffolds. Scaffolds with pore sizes larger than 300 µm and porosity of more than 60 % improved osteogenesis.
29
Morphology of PU-BG scaffolds at 50X magnification with variations in Bioglass® percentage.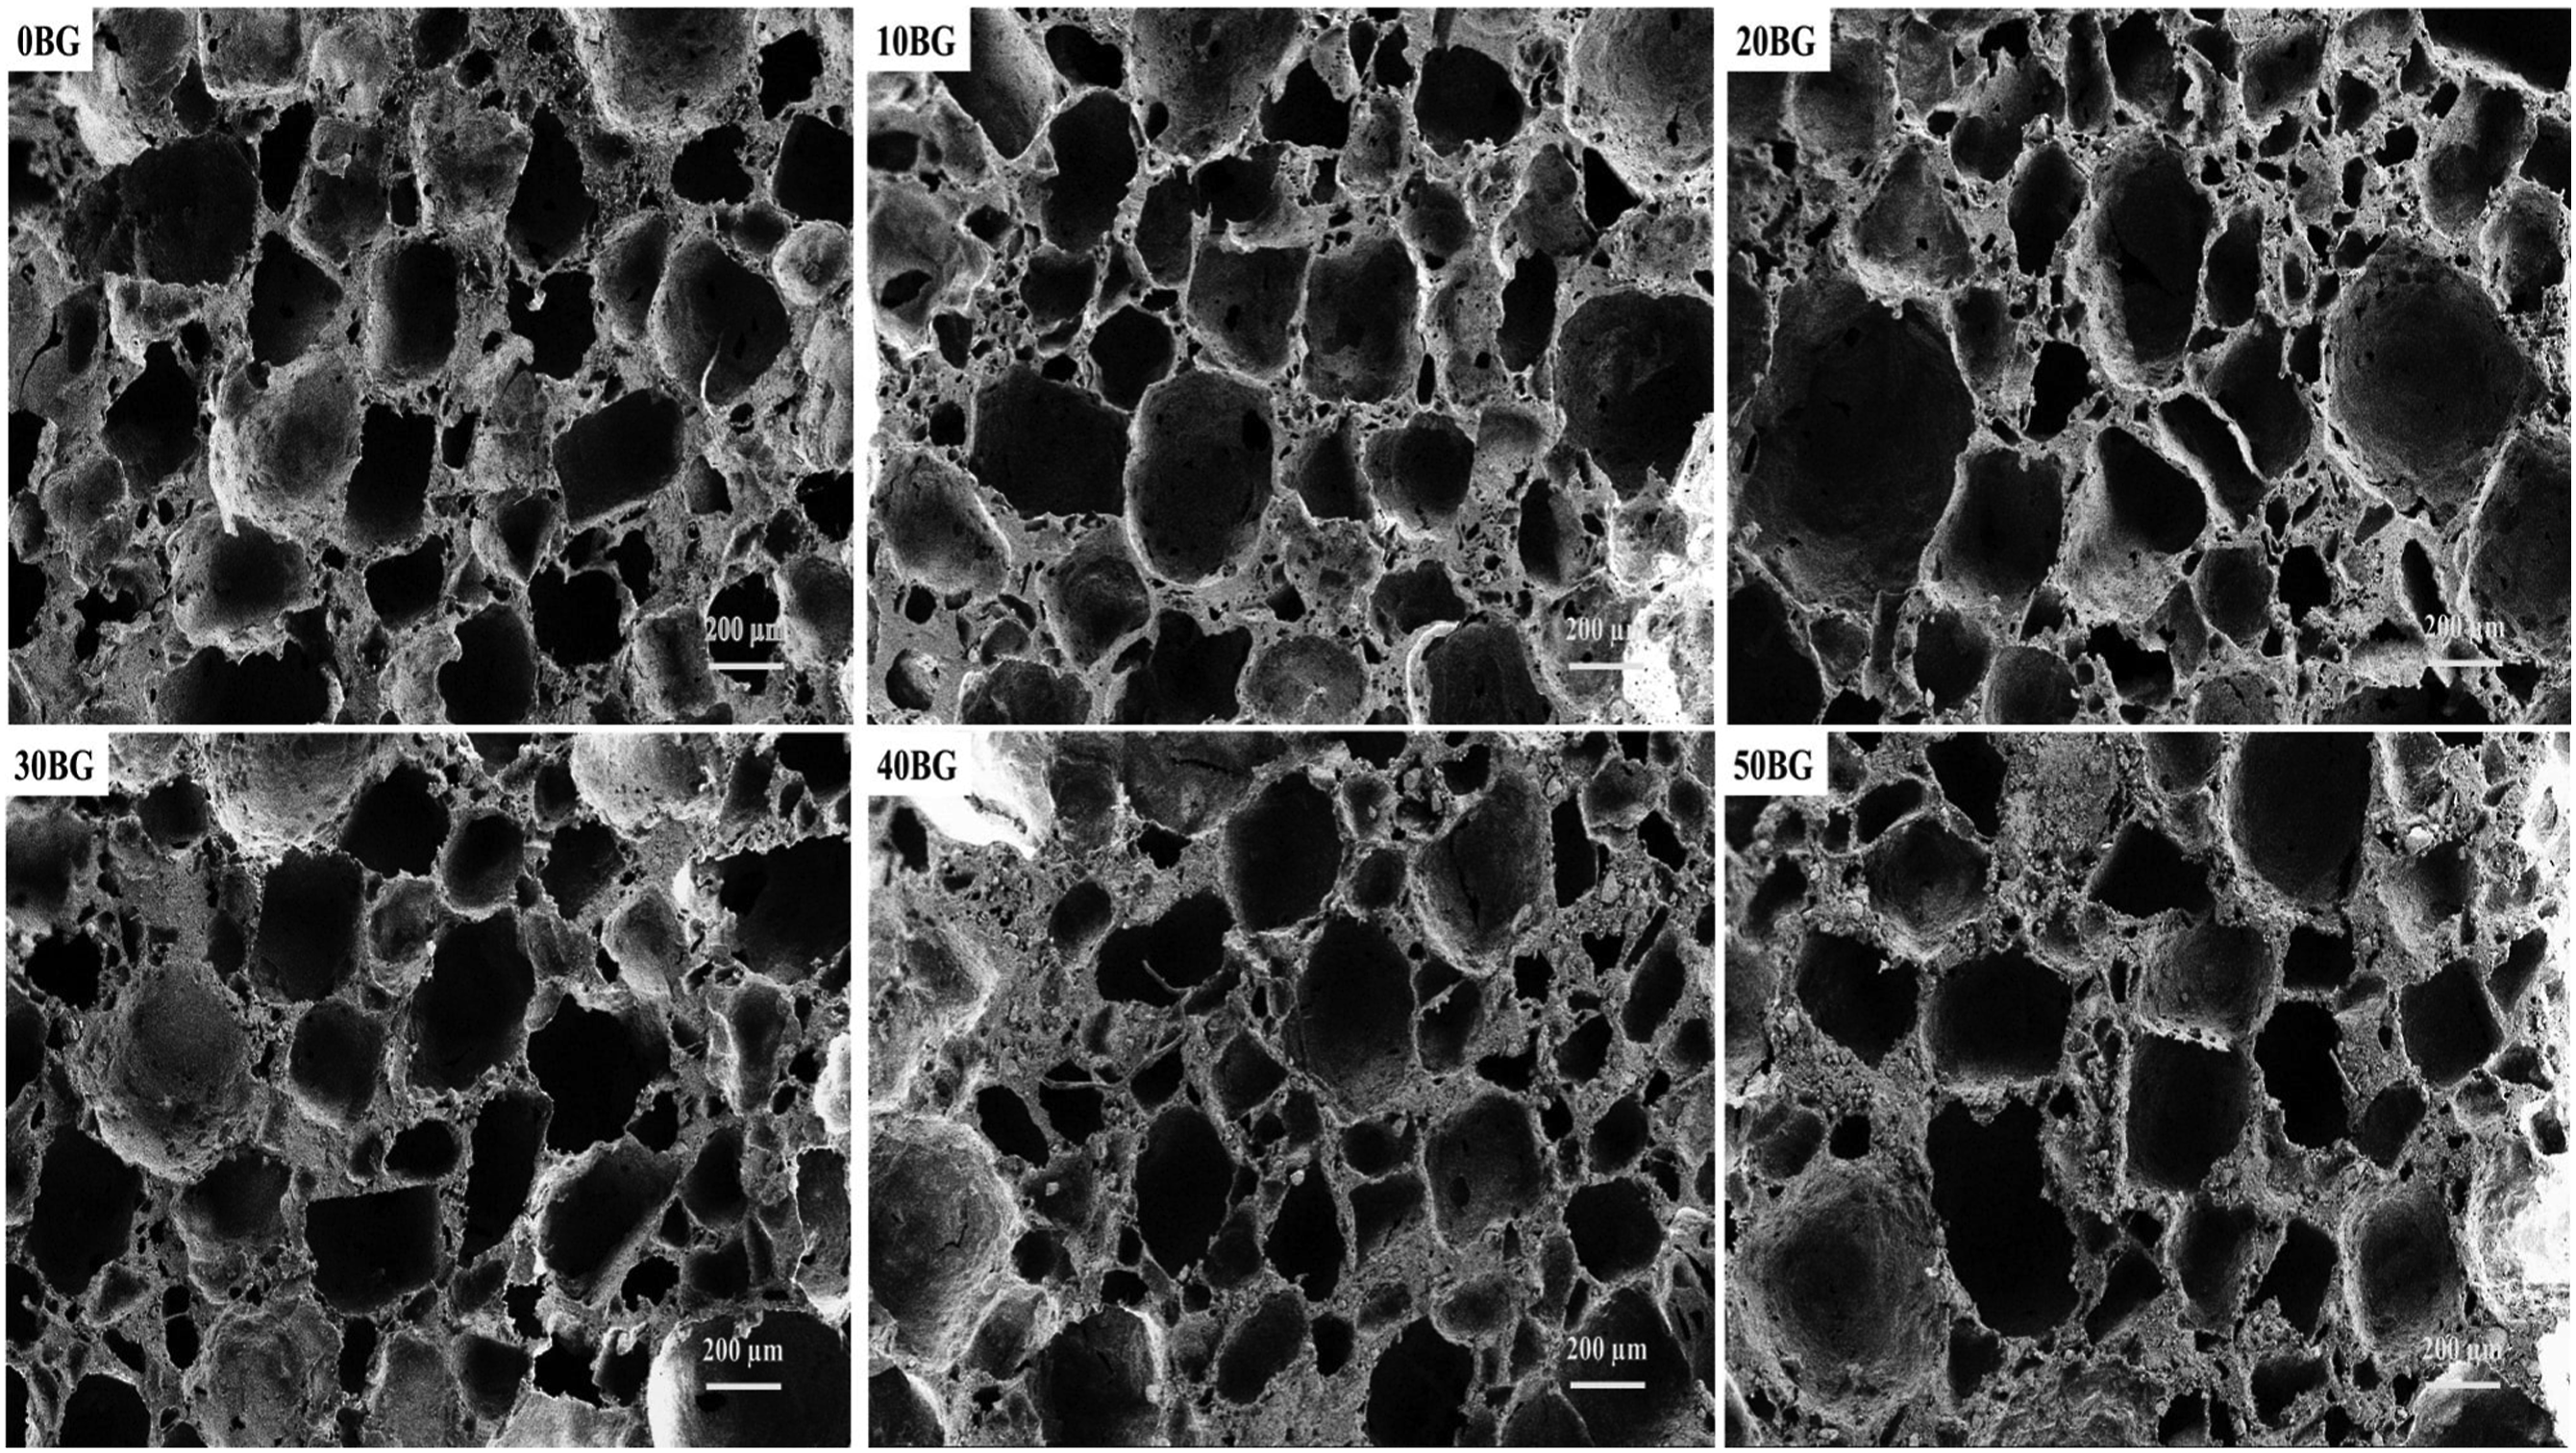
Figure 2 shows the back-scattered FESEM images of PU-BG scaffolds with 0 wt %, 30 wt % and 50 wt % of Bioglass® which were used to analyse the distribution of glass particles in the PU matrix. Based on the figures, a thorough distribution of Bioglass® could be observed inside and outside of the pore for 30BG and 50BG scaffolds. A closer distribution of Bioglass® particles was observed for the 50BG scaffold which was caused by the high loading of Bioglass® content. A rougher surface was observed on the scaffold’s surface with 30 wt% and 50 wt% due to the adhesion of glass particles on the PU matrix surface compared with the smooth surface of pure PU scaffolds. That surface roughness of the scaffolds might have the potential for cell attachment and proliferation. Surface roughness improves wetting properties of the surface which facilitate focal contact of protein serum adsorption to improve cell attachment.
30
Back-scattered electron FESEM images of 0BG, 30BG and 50BG.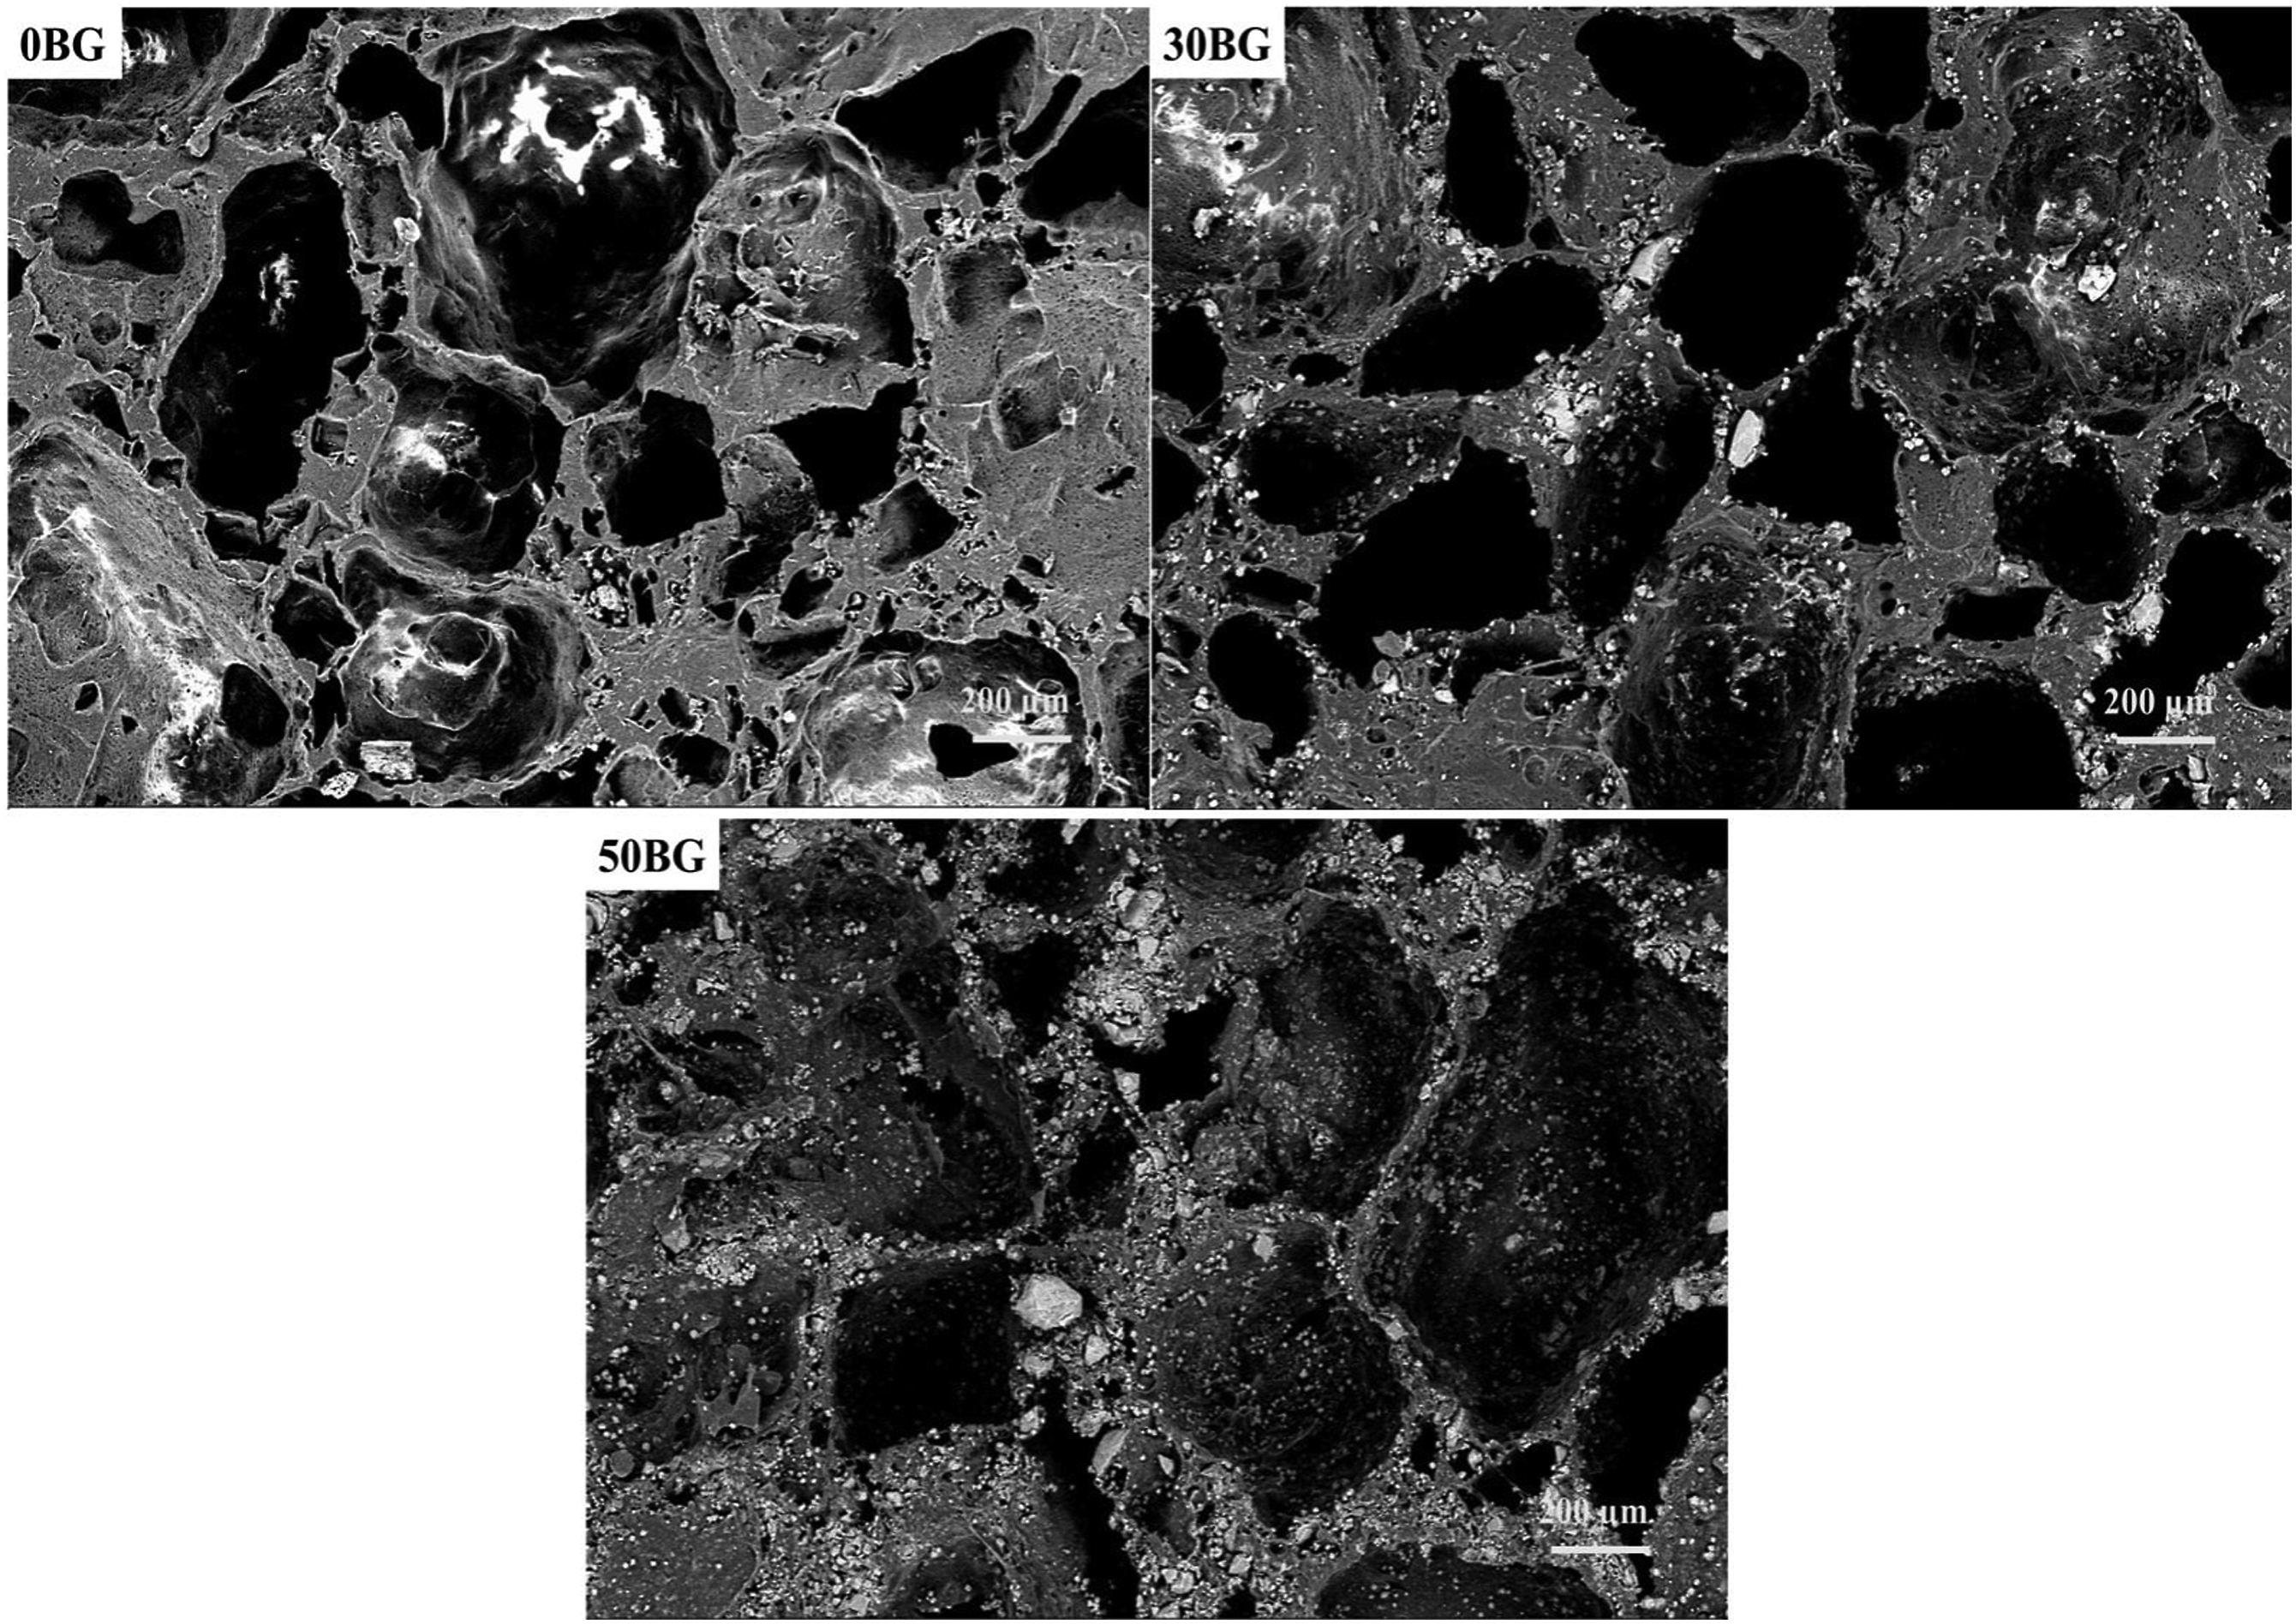
Physical properties
The effect of Bioglass® percentage on the physical properties of PU-BG scaffolds was analysed using porosity and density plots, as shown in Figure 3. Based on the figure, the PU-BG scaffolds showed an increase in density as the Bioglass® percentage increased. The increasing behaviour of density was because the density of Bioglass® (ρBG = 2.577 g/cm3) was higher than the density of solid PU (ρPU = 1.108 g/cm3). The porosity of PU-BG scaffolds showed insignificant changes, with a small range of porosity values from 77 % to 79 %, as the Bioglass® percentage increased. The leaching agent was the pore-forming agent for PU-BG scaffolds, so the presence of Bioglass® did not greatly influence the pore structure and porosity of the PU-BG scaffolds. As a consequence, the porosity of the PU-BG showed an inconsistent trend as the Bioglass® percentage increased. Density and porosity of PU-BG scaffolds with variations in Bioglass® percentage.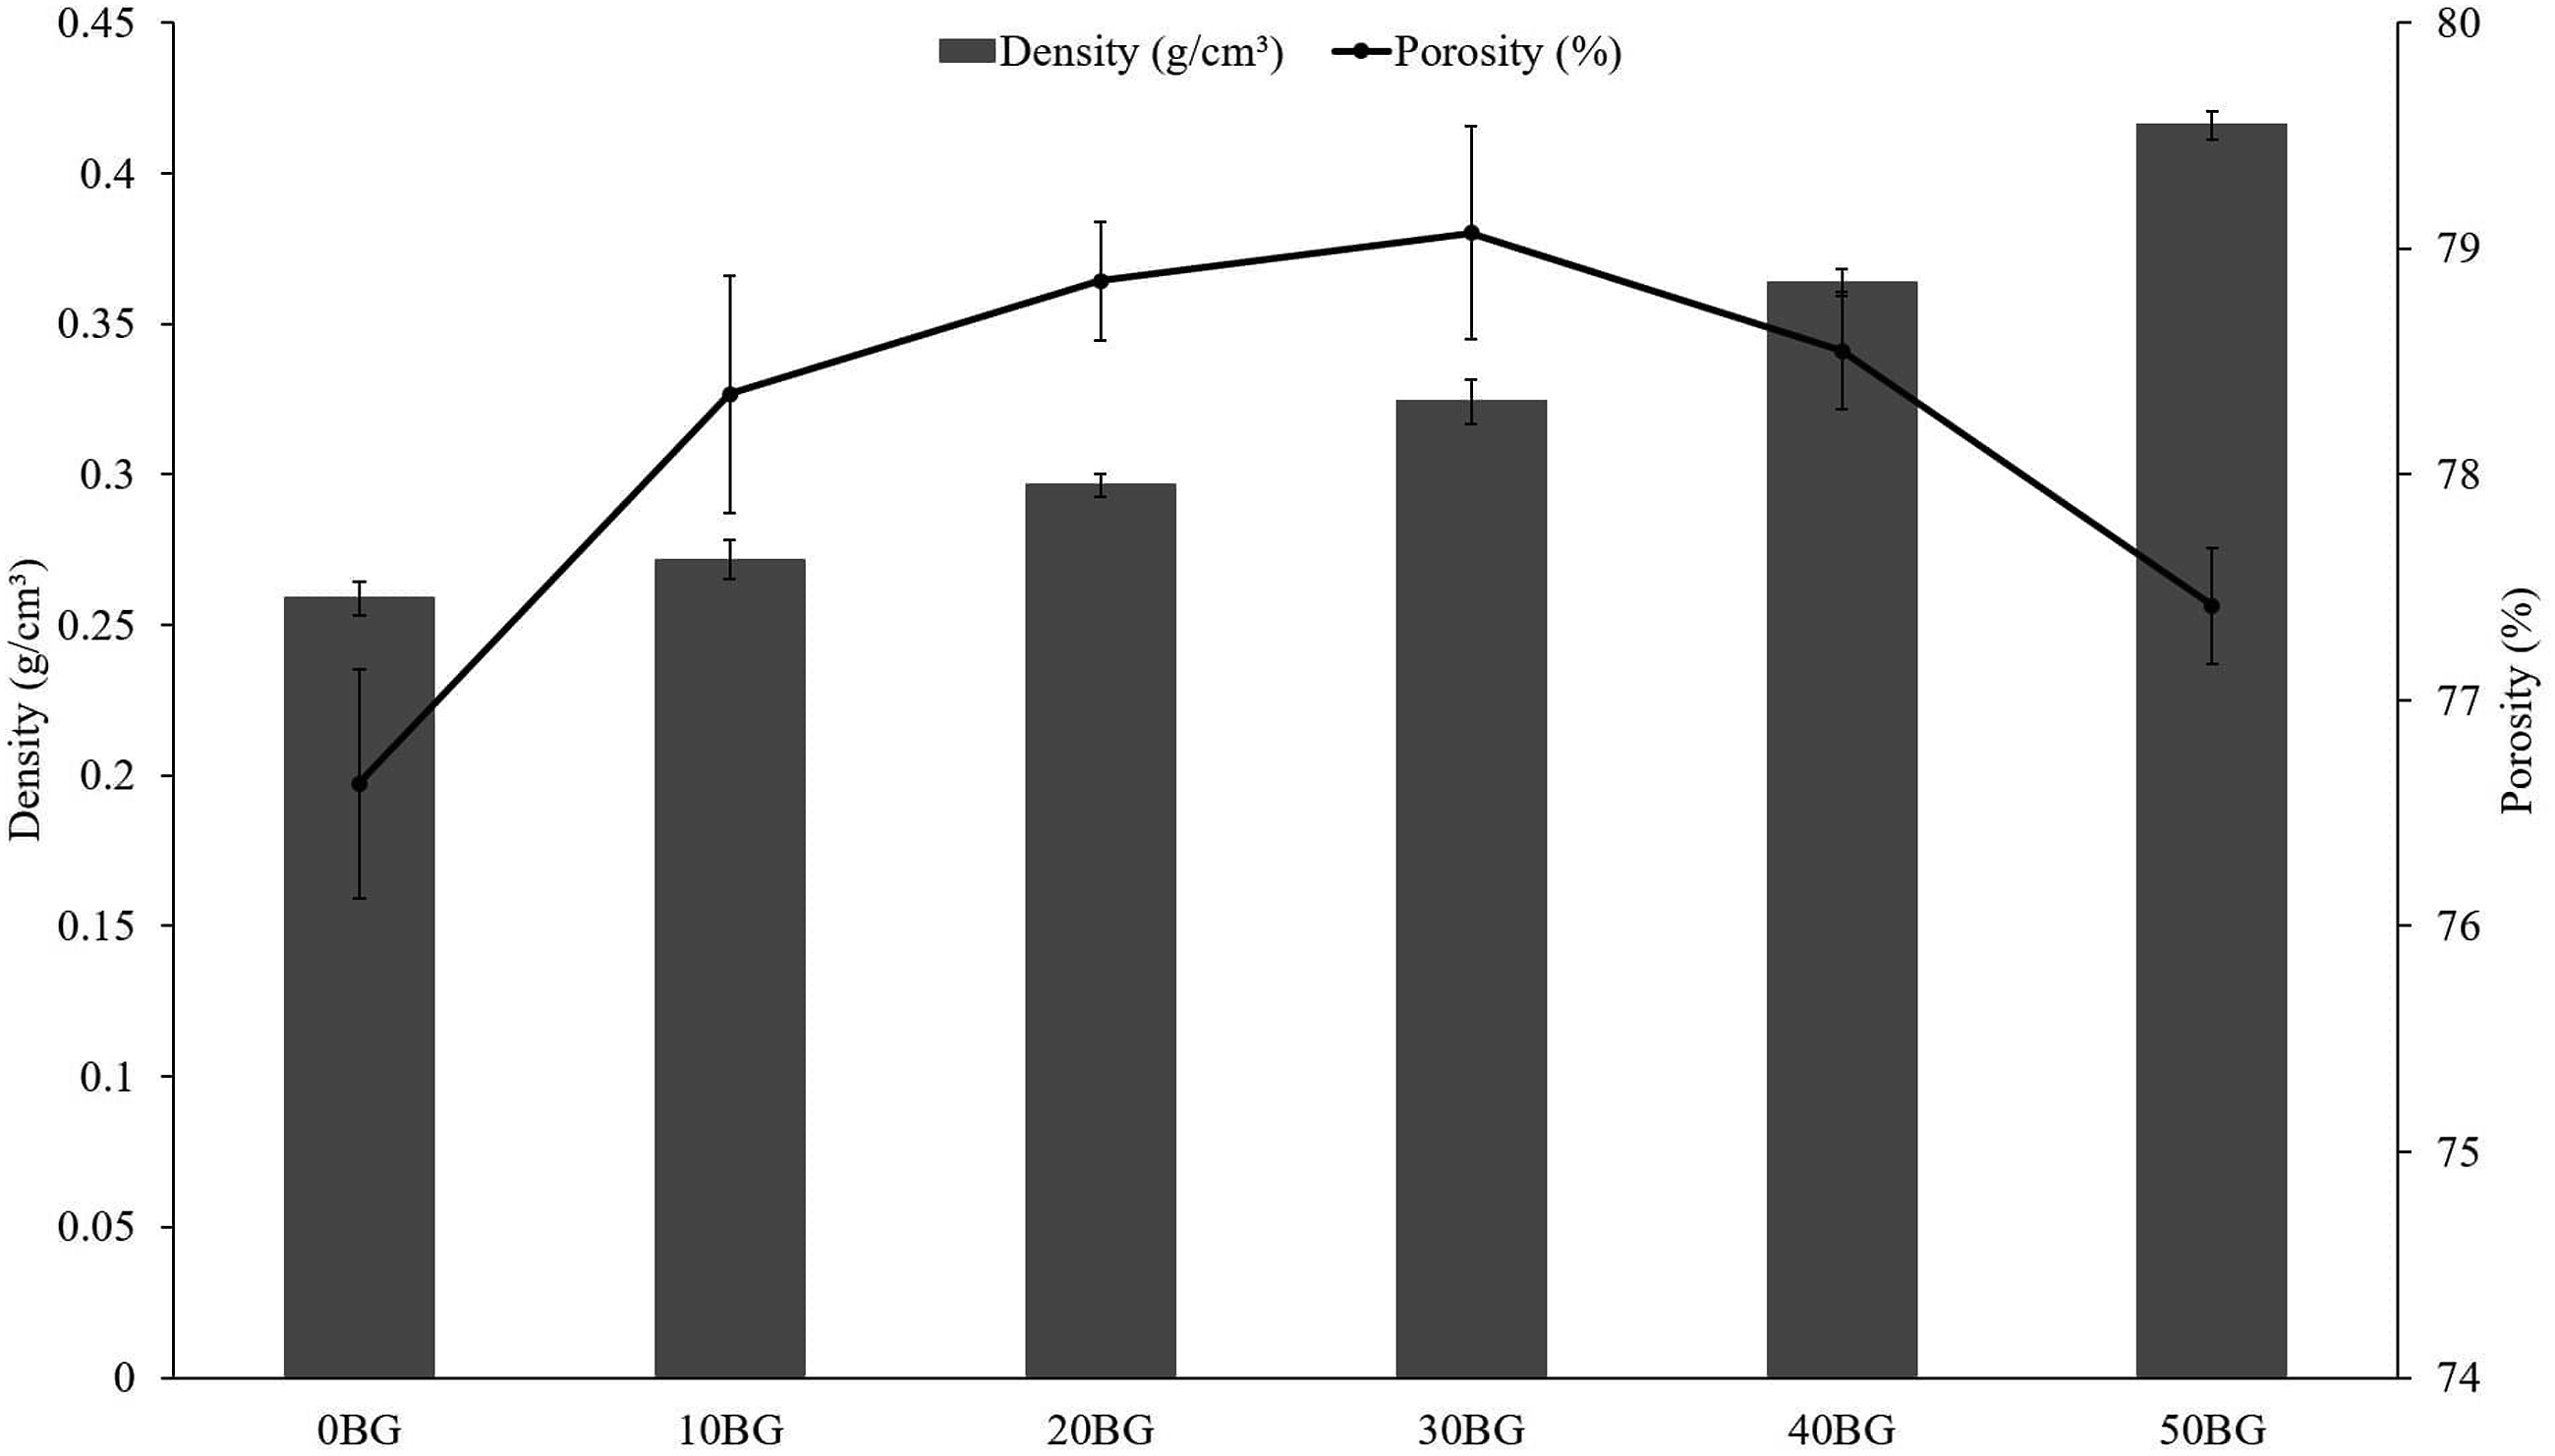
Functional group analysis
Figure 4 presents the FTIR spectra of Bioglass® and PU-BG scaffolds with different Bioglass® percentages between the wavenumber 4000 cm−1 to 600 cm−1. The formation of the shoulder at wavenumber 927 cm−1 contributed to the Si–O stretching. The characteristic band of Bioglass® was located at 1024 cm−1 represents the symmetric vibration of oxygen bonding with silicon (Si-O-Si).8,31 Determining the effect of Bioglass® on the functional group of the scaffolds was difficult as the trend was inconsistent and the functional band of the Bioglass® could be masked and overlapped by the C–O–C band of PU.17,32 However, only the scaffold with 50 wt % of Bioglass® (50BG scaffold) showed a slight stretching around 1000 cm−1 in the band of PU which might be due to the influence of the Si–O–Si band from the Bioglass® at 1024 cm−1. The peak at 1160 cm−1 is assigned to C = O stretching and at 1231 cm−1 is assigned to C-N stretching. At approximately 1530 cm−1 in 0BG – 50BG is assigned to N-H bending vibration which confirmed the formation of urethane bonds during the synthesis of PU. Moreover, the formation of the urethane group is also confirmed by the appearance of strong peaks around 1716 cm−1 and 1657 cm−1. The peaks correspond to carbonyl group (C = O) due to hydrogen-bonded carbonyl (amide I).
33
The FTIR spectra of PU peaks showed a symmetric CH2 stretching at 2848 cm−1, asymmetric CH2 stretching at 2935 cm−1 and another N-H group stretching vibration at 3300 cm−1. The surface of the Bioglass® reveals an absorption peak at 3444 cm−1, which corresponds to the stretching vibration of the OH group.
34
FTIR spectra of PU-BG scaffolds with variations in Bioglass® percentage.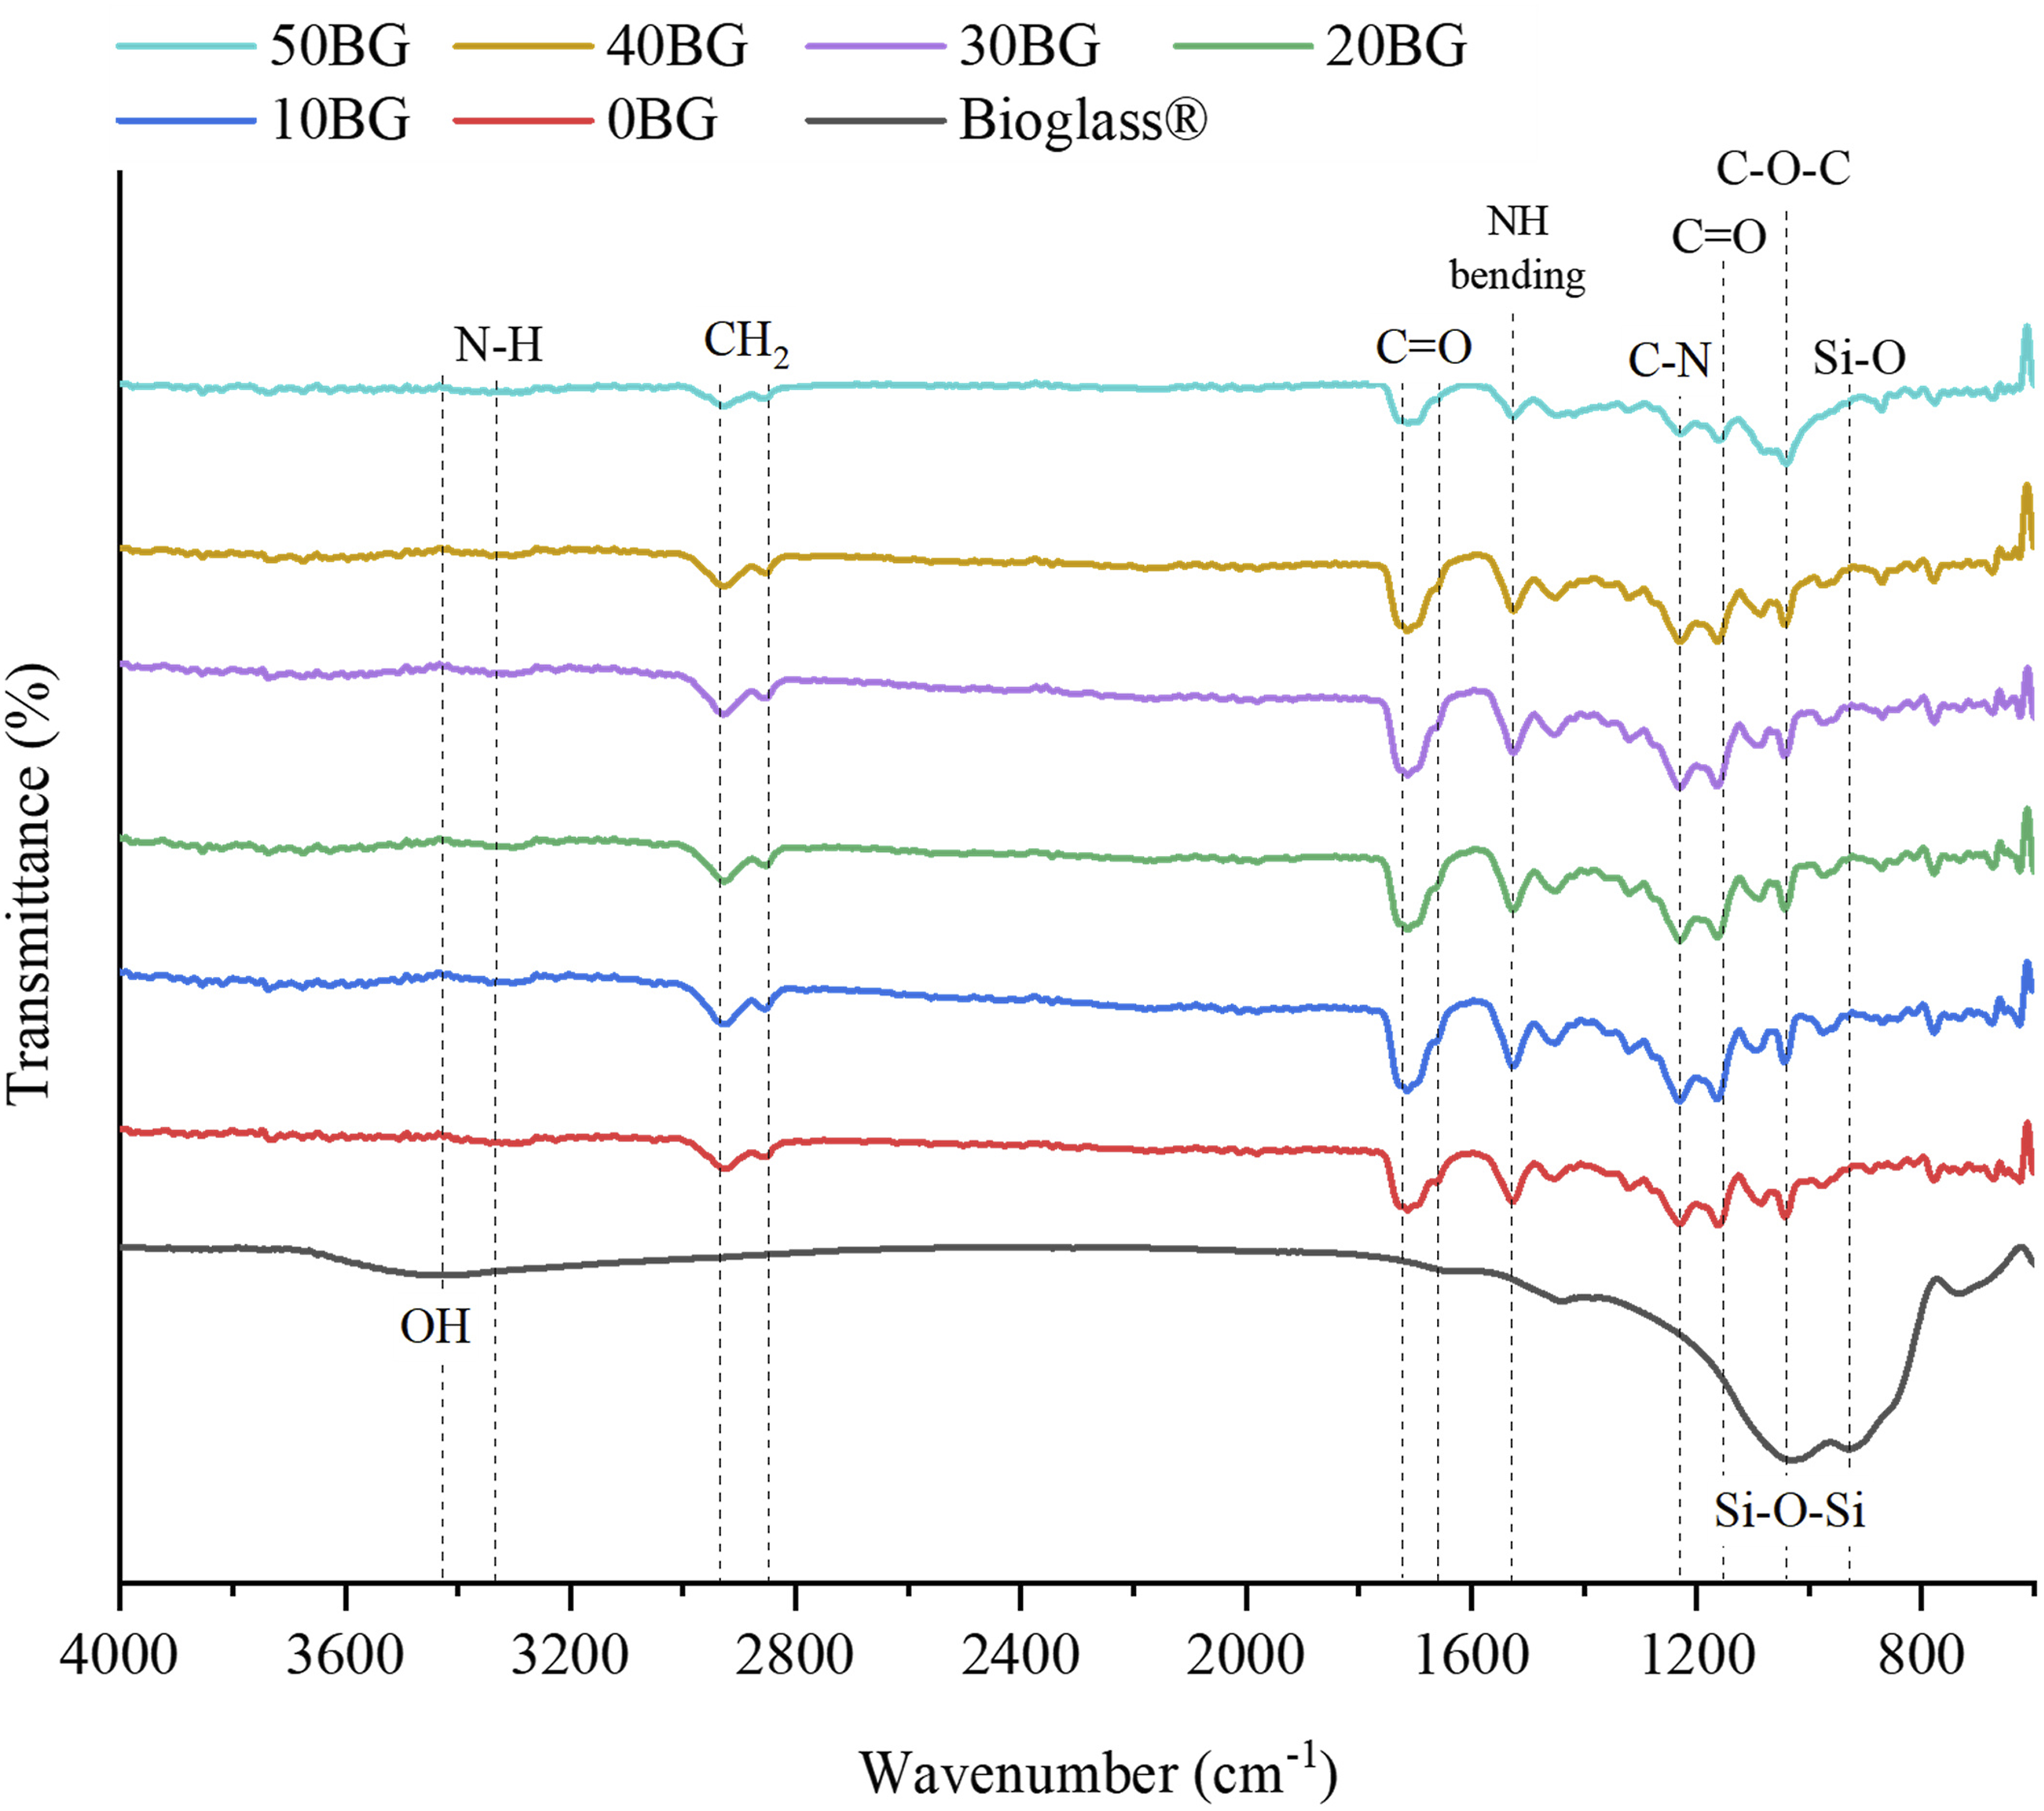
Compressive strength
Figure 5 illustrates the compressive strength value of PU-BG scaffolds obtained during mechanical testing. In general, the compressive strength increased from 0.5 MPa to 1.5 MPa as the Bioglass® percentage increased from 0 wt % to 50 wt %. Although the porosity of 20BG and 30BG scaffolds was higher than that of the neat PU scaffold, the strength of the composite scaffolds was greater than that of the pure PU scaffold. This behaviour indicated that Bioglass® percentage exerted a more significant influence on the compressive strength than the porosity. The progressive increase in compressive strength indicated the interfacial bonding between the Bioglass® particles and the PU matrix. The interaction that occurred between the glass filler, and the PU matrix enhanced the stress transfer from the matrix to the rigid Bioglass® particles, consequently improving the strength of the PU-BG scaffolds. Moreover, 50BG scaffolds with the maximum loading of Bioglass® (50 wt %) recorded with maximum compressive strength (1.5 MPa) indicated a homogeneous distribution of Bioglass® particles throughout the PU matrix. If the agglomeration of glass existed within the scaffold structure, then compressive strength could decrease as the agglomeration-initiated stress concentration that could result in material failure. Compressive strength of PU-BG scaffolds with variations in Bioglass® percentage.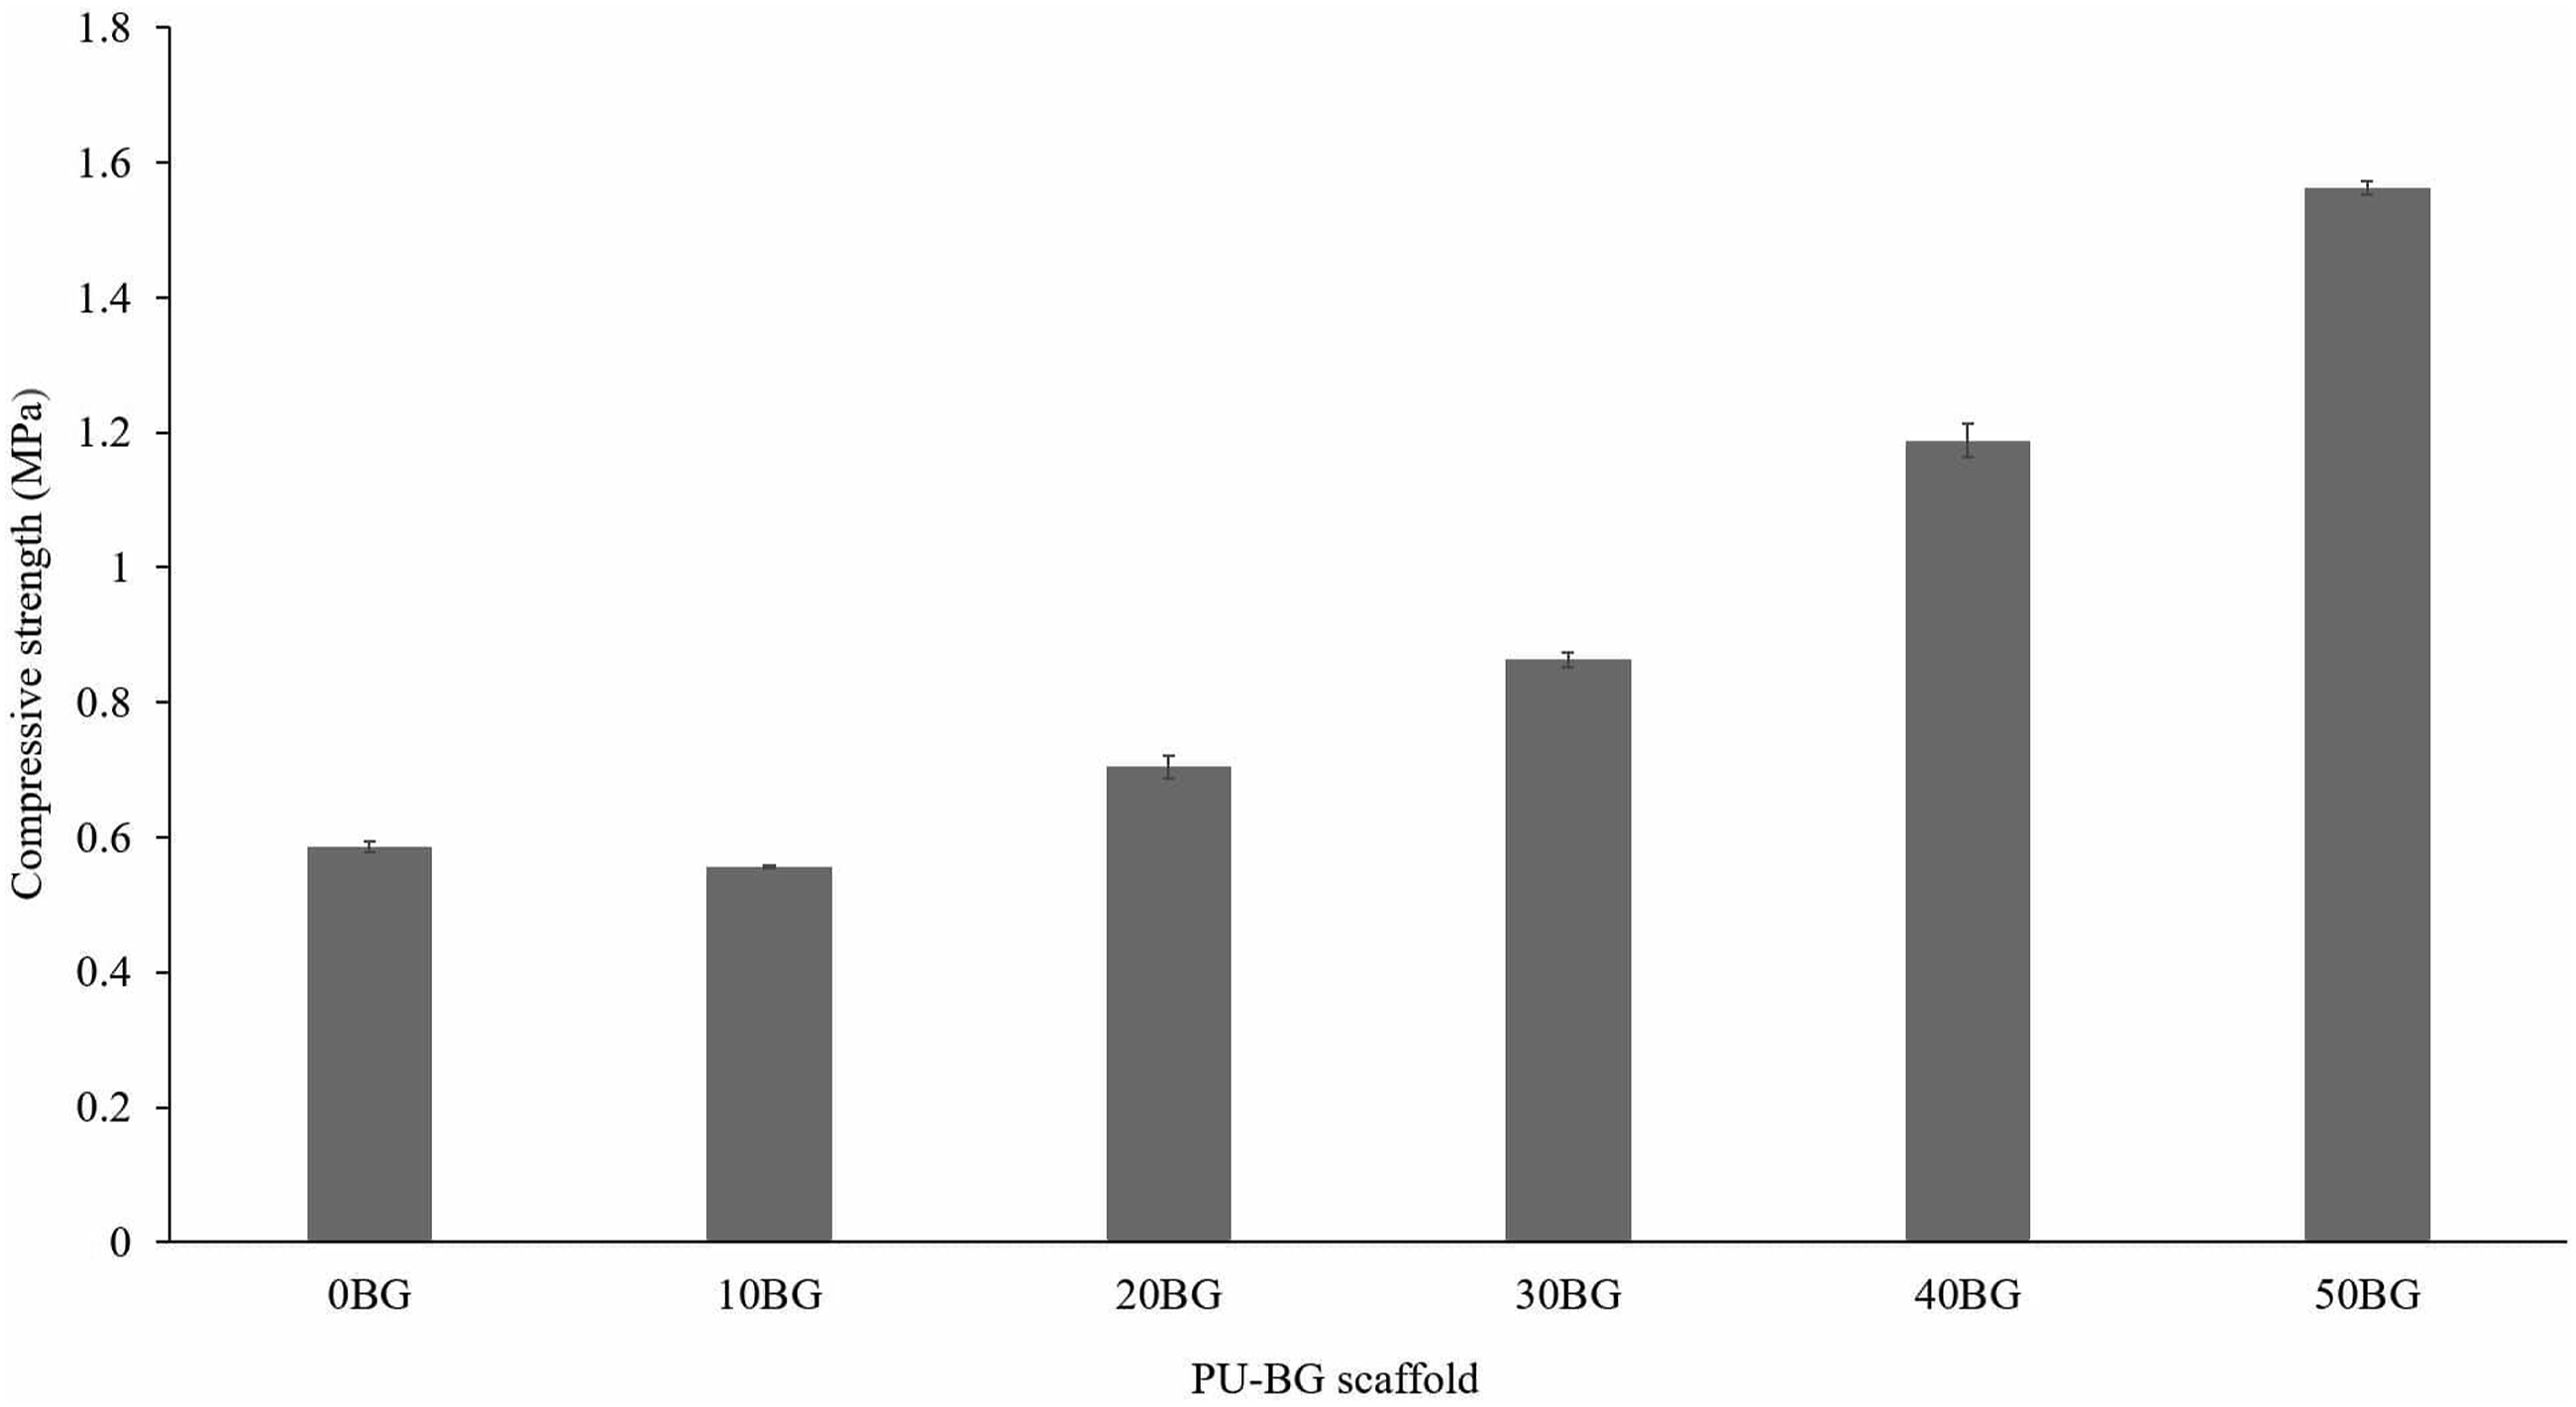
In-vitro bioactivity
FESEM was used to observe the surface changes of the PU-BG scaffolds after 7, 14, 21 and 28 days of immersion in HBSS solution. Figures 6–8 show the FESEM images of samples 0BG, 30BG, and 50BG after being immersed in HBSS solution for 7, 14, 21 and 28 days, respectively. All the samples were labelled according to the Bioglass® percentage and immersion time. For example, sample 50BG 28D is for the composite scaffold containing 50 wt % Bioglass® immersed for 28 days. Figure 6 shows the morphology of the neat PU (0BG) scaffold from 7 days until 28 days of immersion in HBSS. Based on the figure, the surface of the PU scaffold did not show any sign of precipitation on the surface after immersion in HBSS for 28 days. Hong et al. also showed a similar finding for neat poly(l-lactic acid) scaffold in which no apatite precipitation occurred after being immersed in SBF solution for 21 days.
35
The result indicated that the neat polymer scaffold does not induce bioactivity properties during the in-vitro test. Surface changes of 0BG scaffold in 7, 14, 21 and 28 days of incubation in HBSS solution at 37°C 5k magnification. Surface changes of 30BG scaffold in 7, 14, 21 and 28 days of incubation in HBSS solution at 37°C 5k magnification. Surface changes of 50BG scaffold in 7, 14, 21 and 28 days of incubation in HBSS solution at 37°C 5k magnification.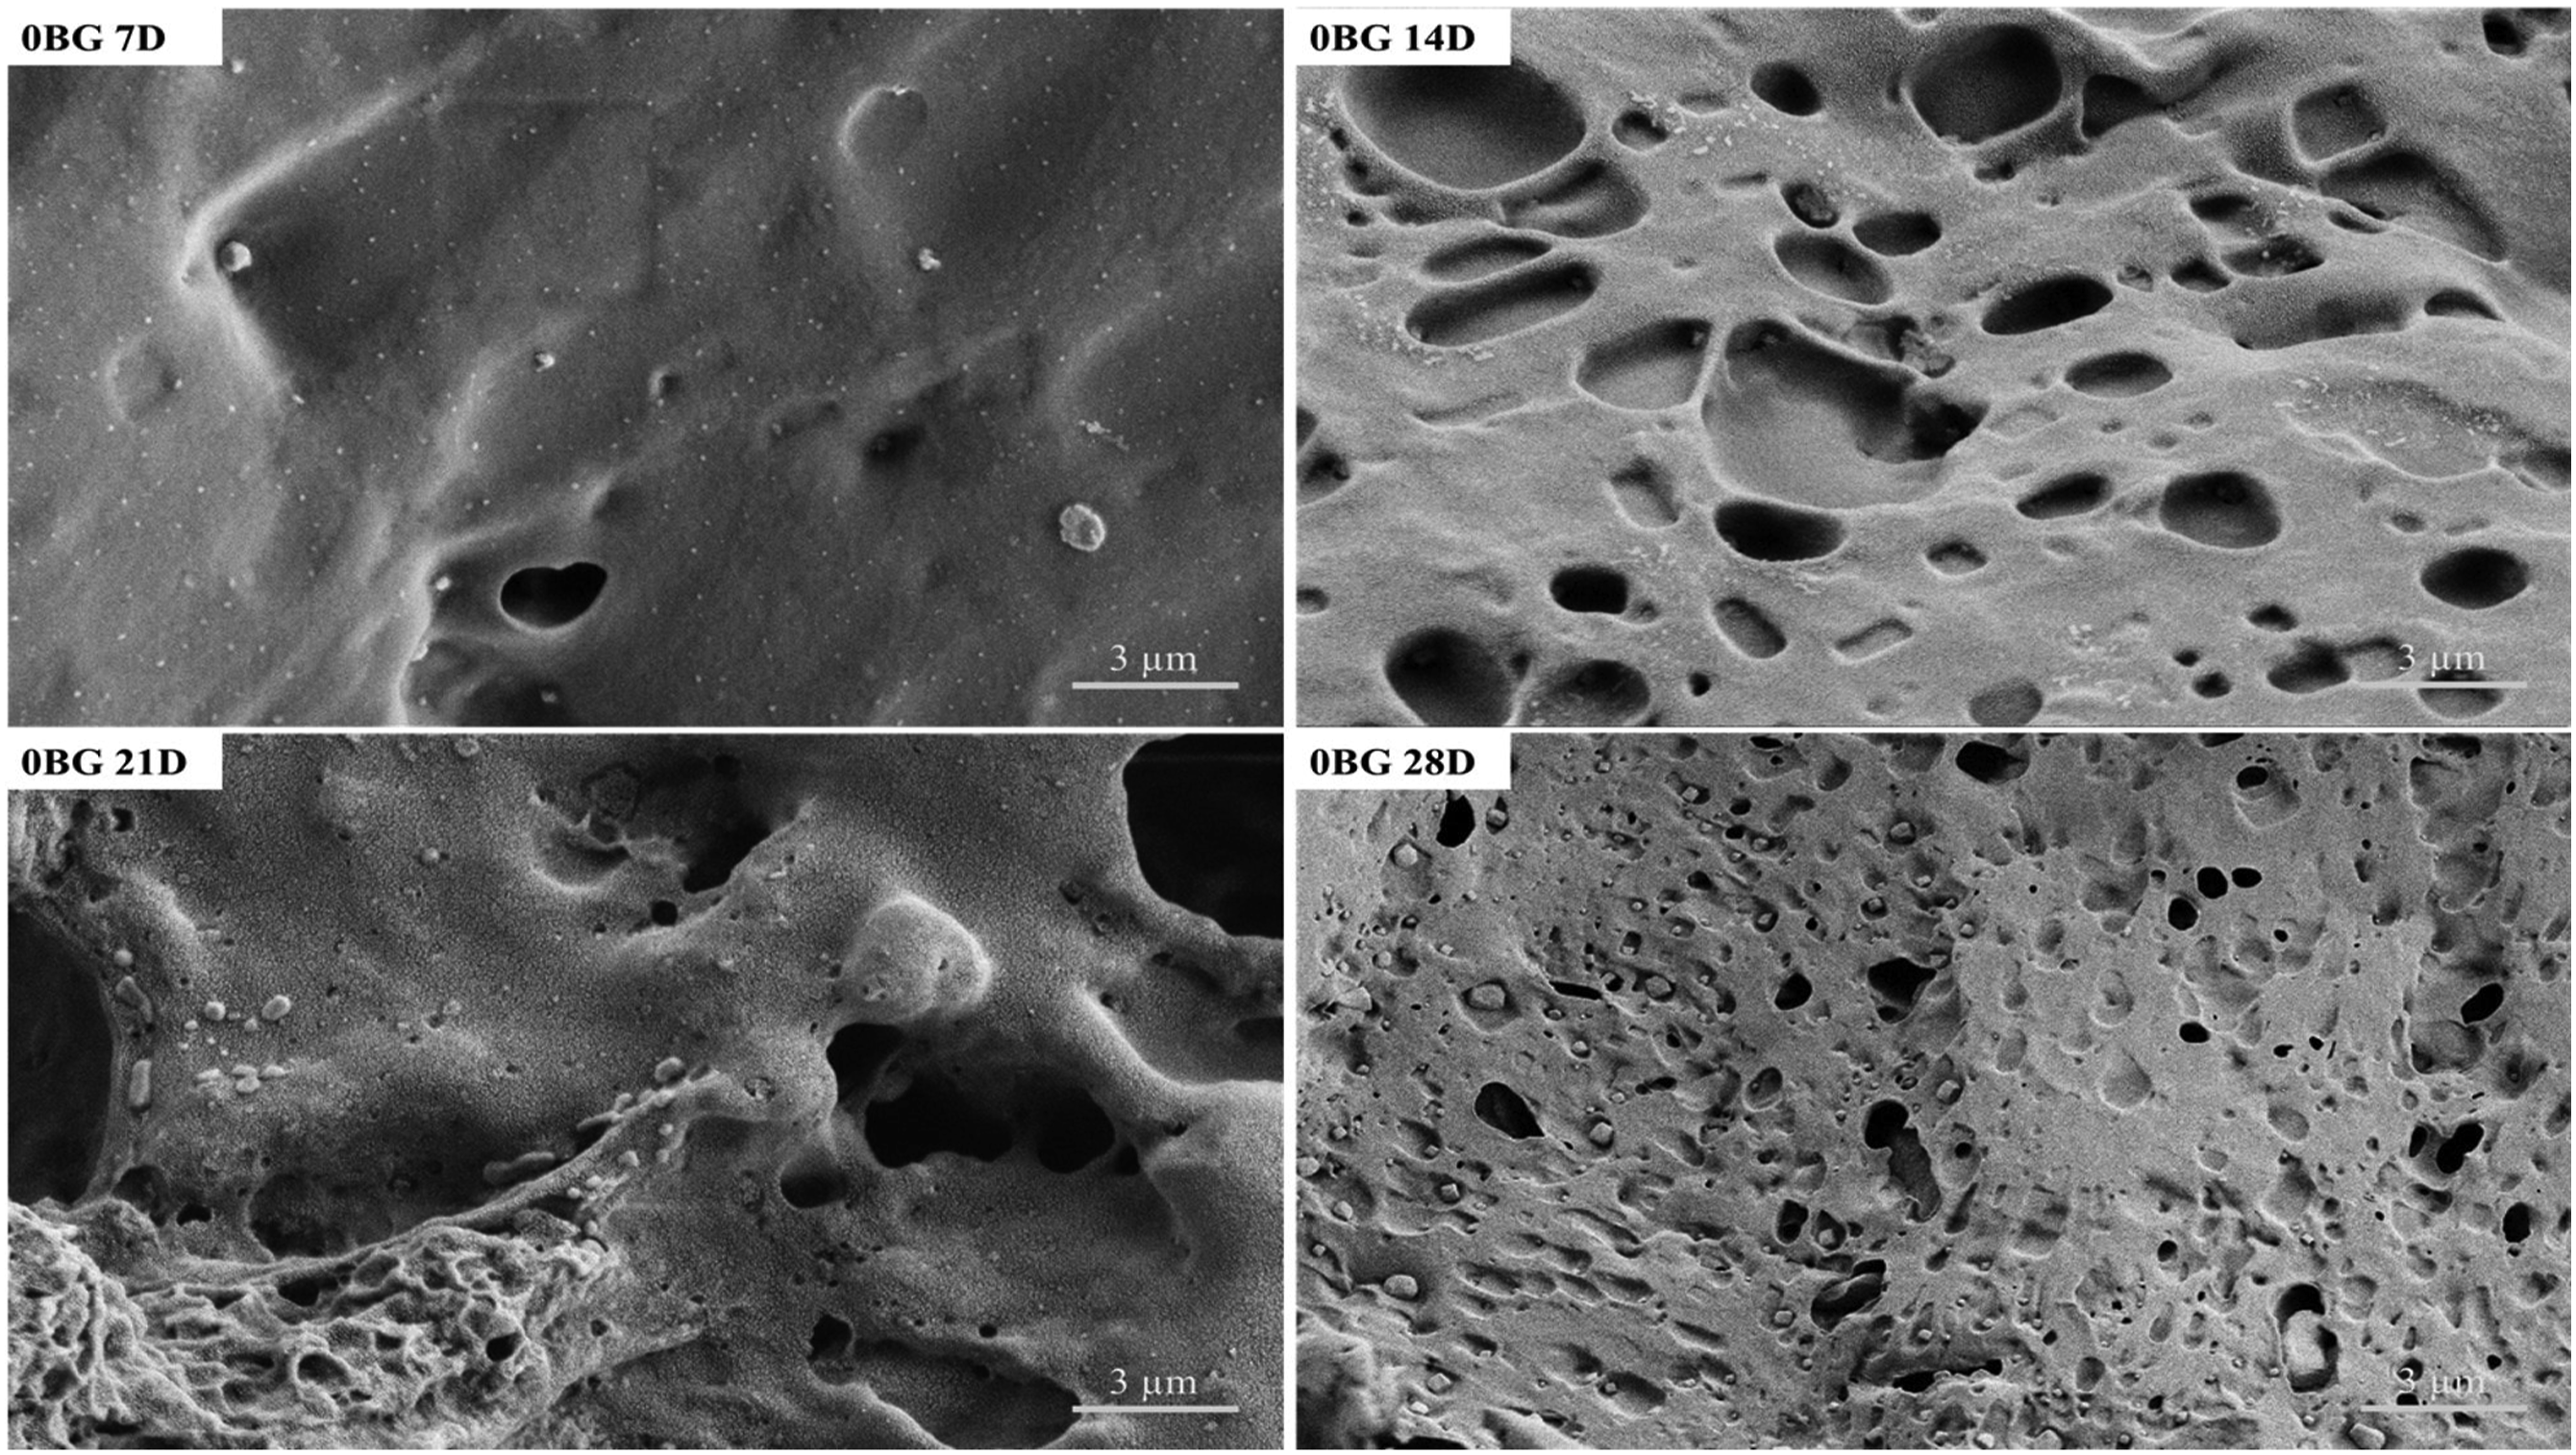
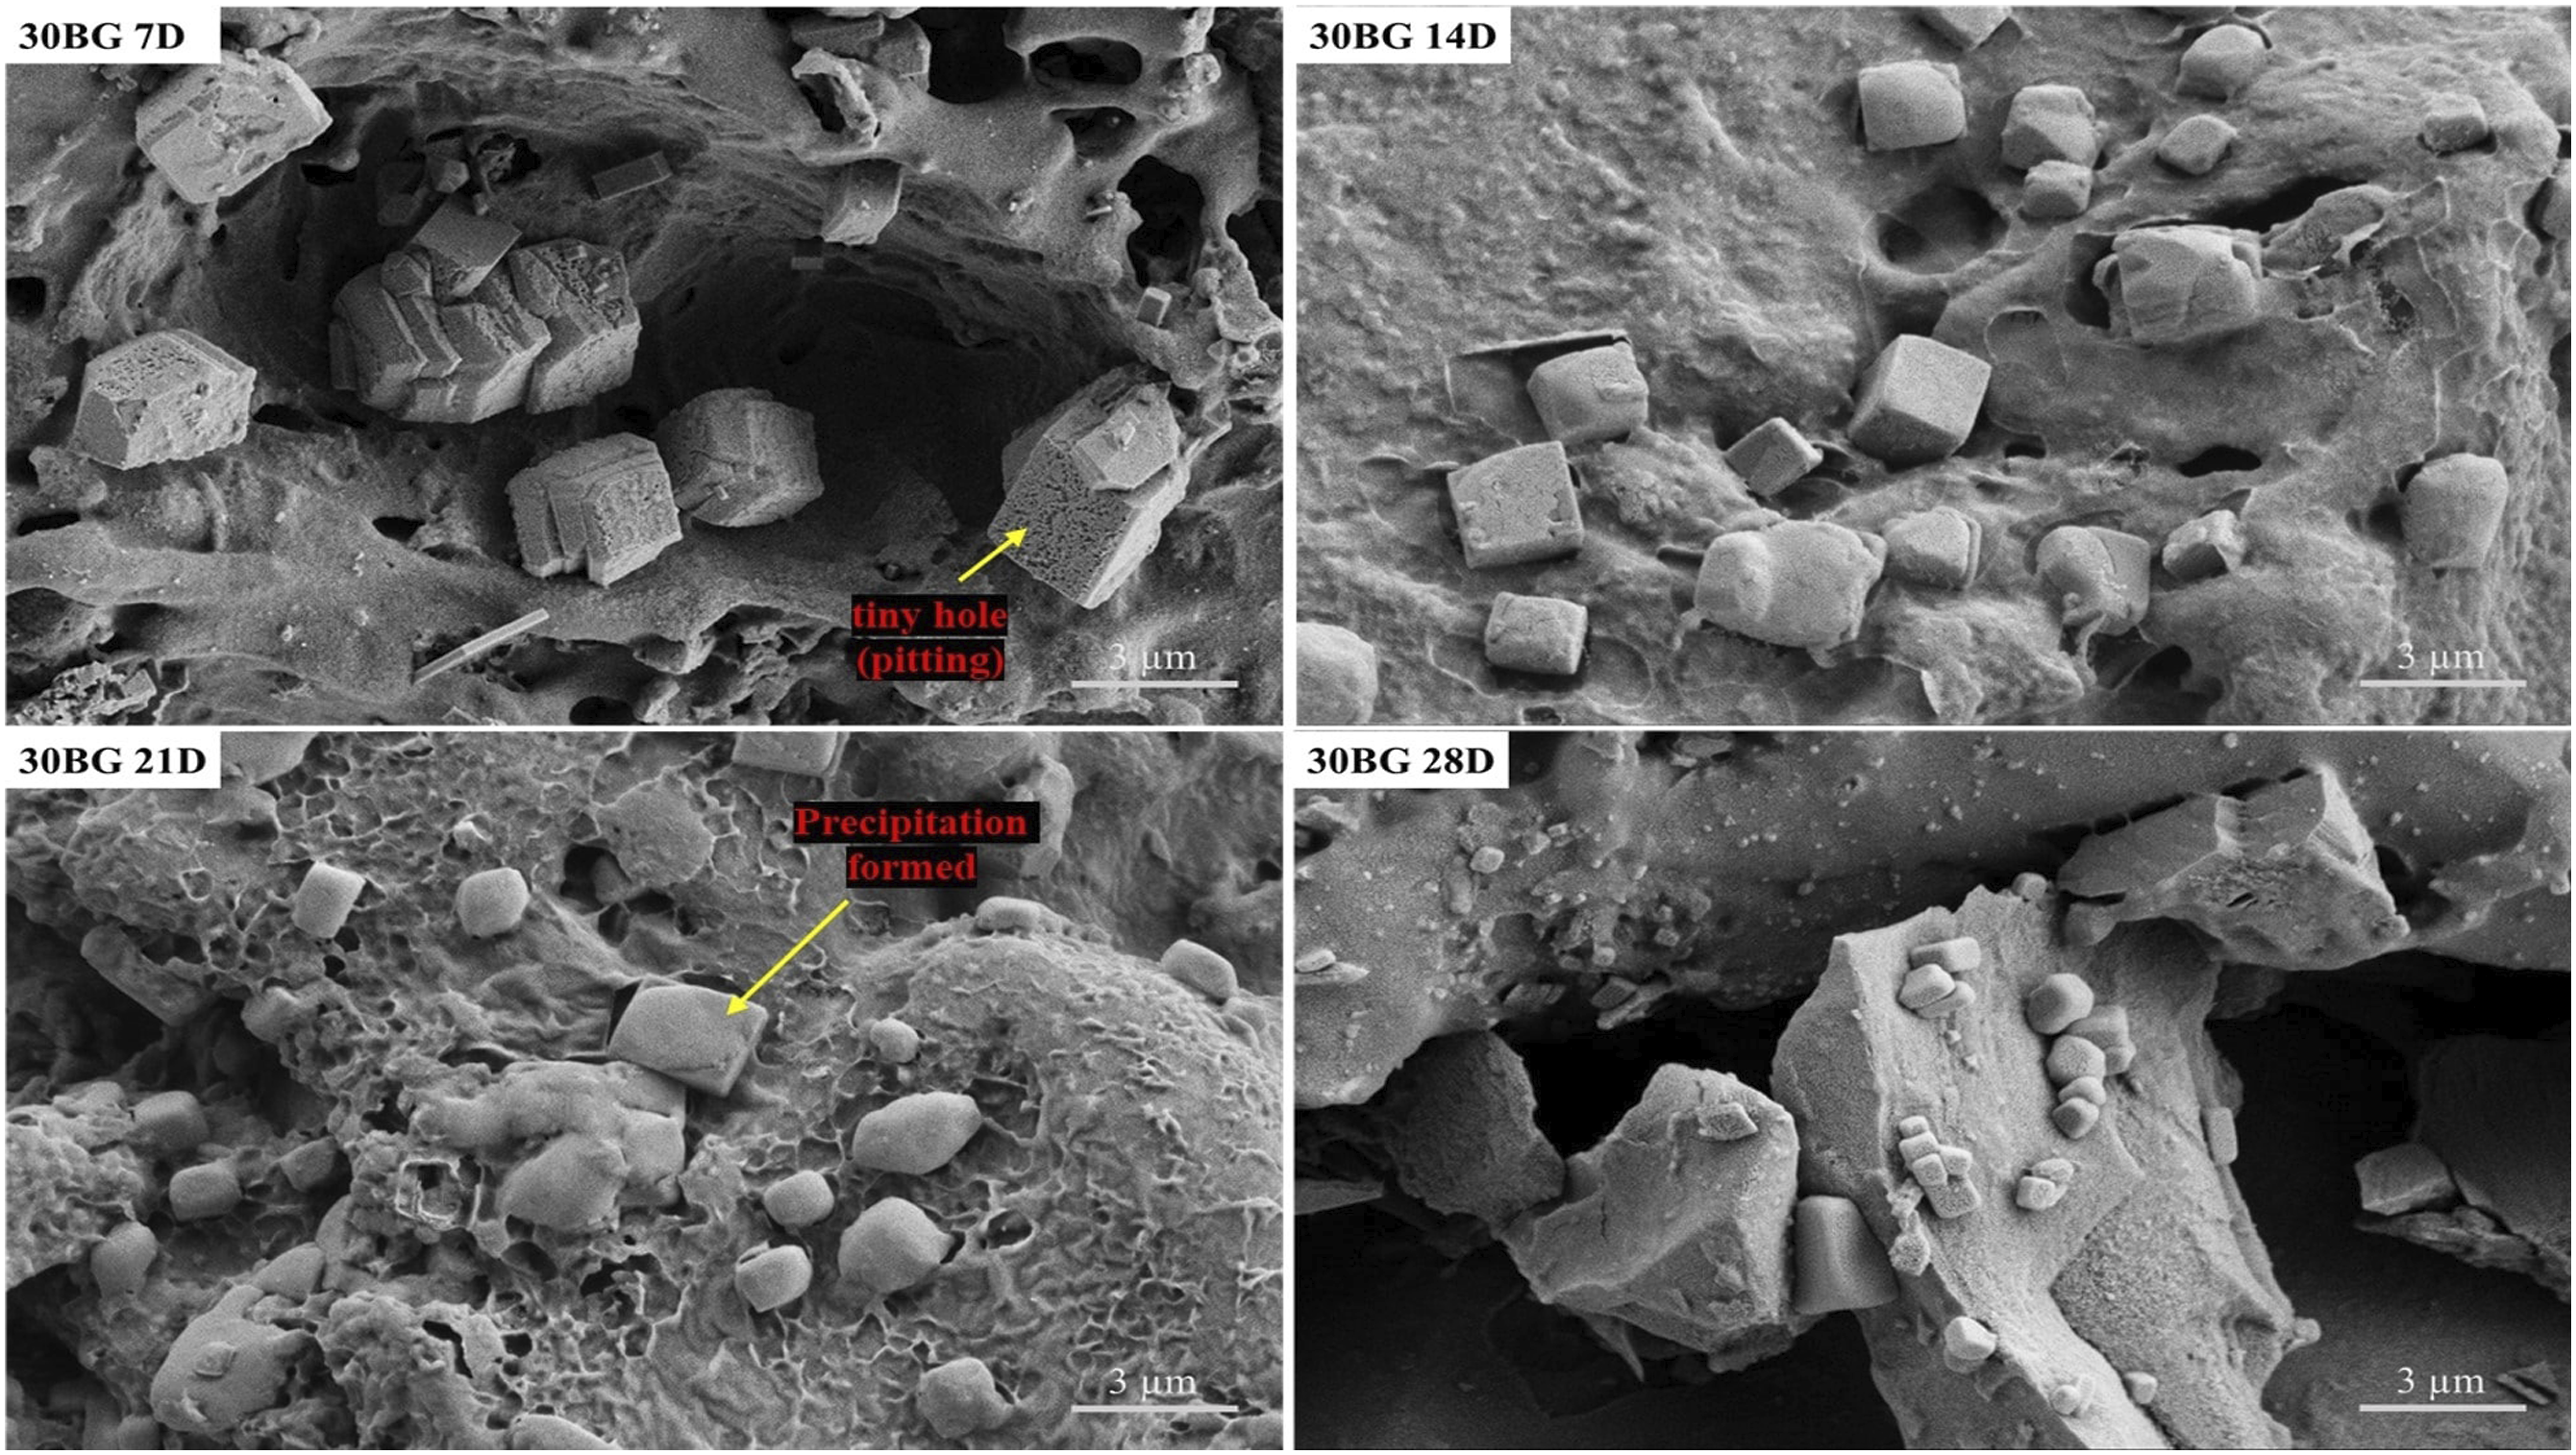
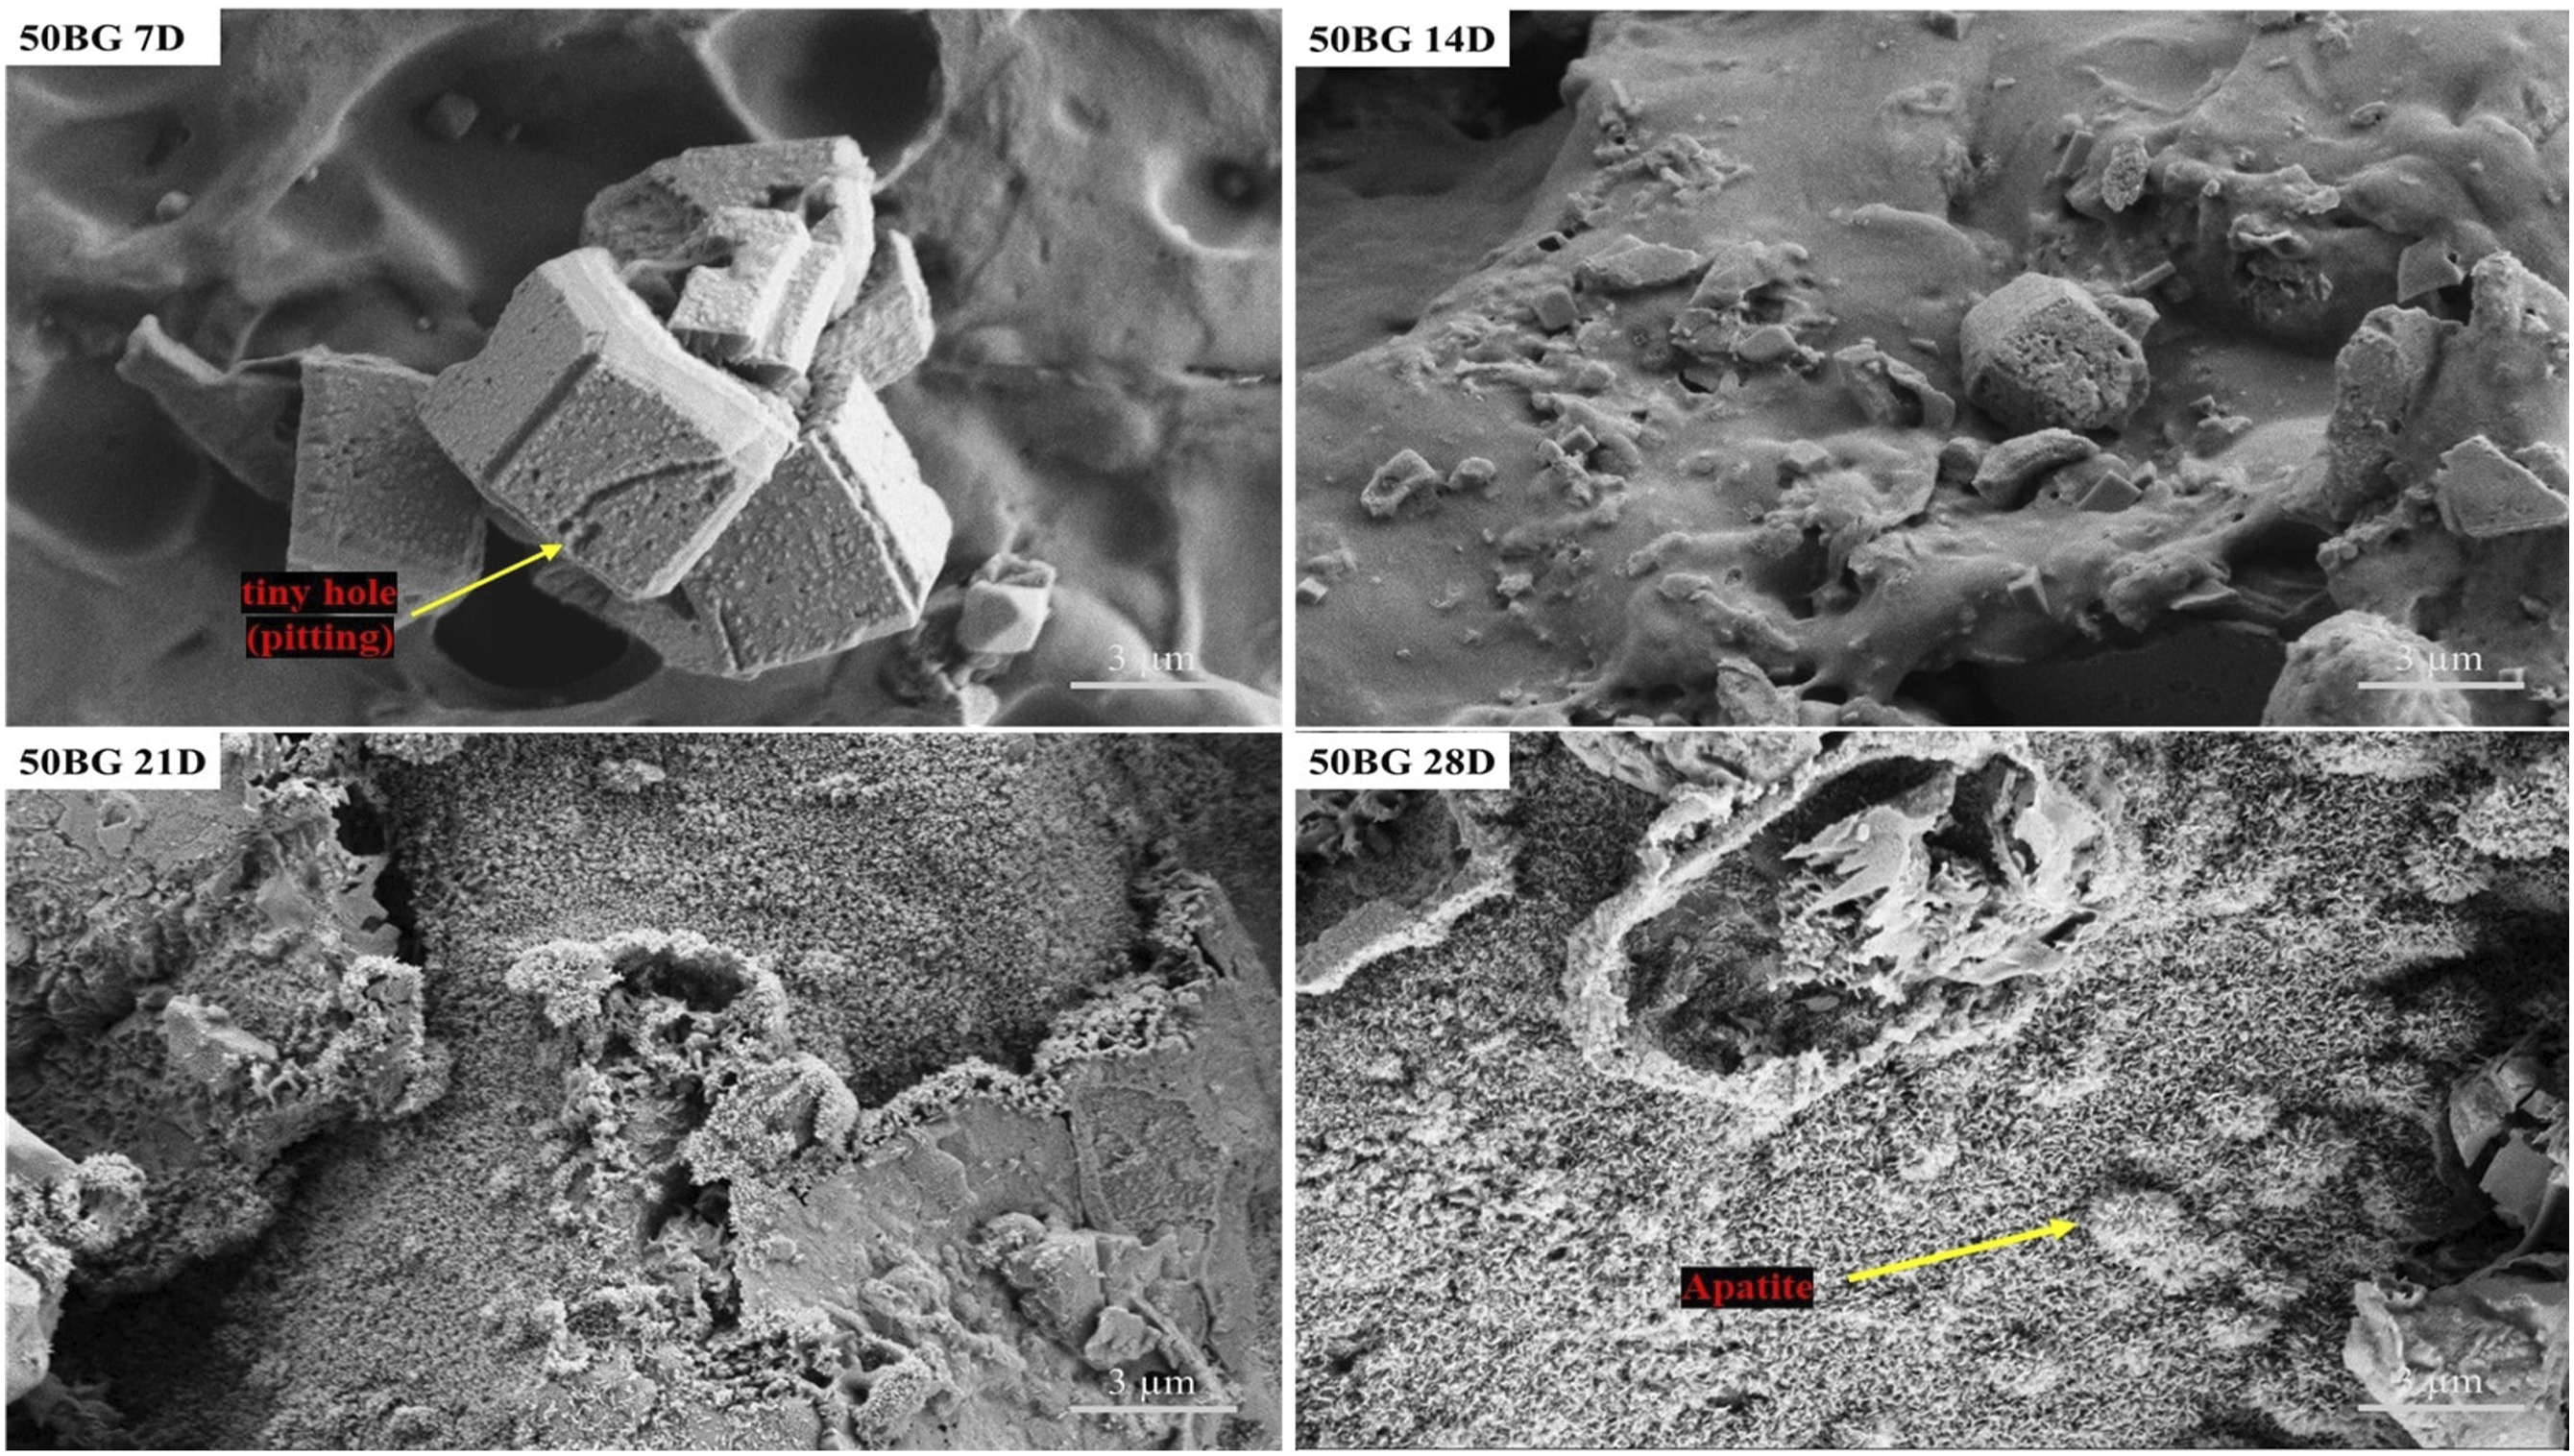
Figure 7 shows the morphological changes of 30BG scaffolds throughout 28 days of immersion. On day 7, the surface of Bioglass® particles showed a sign of degradation with the formation of pitting-like corrosion. The degradation of the glass surface might indicate cation exchange of alkali-metal ion from the glass with H+ from the HBSS solution. As a consequence, the dissolution of ions caused the breaking of silica glass network (Si–O–Si) bonds forming silanol bonds (Si–OH) on the glass surface. 6 The formation of the silanol-rich layer was further continued by the release of Si(OH)4 into the solution due to the attack of OH− ion on the silica glass network. On day 14, the surface of the composite scaffolds showed initial depositions at certain spots on the surface of the glass particles and spread out as the immersion time was extended until 21 and 28 days of incubation. The deposition could be related to the nucleation of the apatite layer due to the adsorption of Ca2+ and (PO4)3− to the glass surface through the silica-rich layer creating a film rich in amorphous CaO–P2O5. Scaffold containing 50 wt % (50BG) of Bioglass® showed a significant difference in morphological changes at the end of the immersion period.
Based on Figure 8, the glass particles of the 50BG scaffold showed a sign of degradation on the surface of the glass on day 7 and precipitation on day 14. The degradation and precipitation on the glass surface were similar to those observed on the 30BG. As the incubation was prolonged until 21 to 28 days, the precipitation in the ‘cauliflower’ shape was observed on the surface of the 50BG scaffold. The formation of precipitation in the shape of ‘cauliflower’ is believed to be a nanocrystalline apatite as the morphology is quite similar to other studies that also resulted in the typical cauliflower shape of apatite.14,17,36 Figure 9 shows the EDX analysis of 50BG scaffolds before (0 day) and after (28 days) immersion in HBSS solution. The result showed a significant increase in the percentages of Ca and P accompanied by a decrease in the percentage of Si after immersion in the HBSS for 28 days. This finding offered significant indications of apatite formation on the surface of PU-BG scaffolds. Based on the observation of immersed scaffolds in HBSS, the apatite formation was likely accelerated by the higher weight percentage of Bioglass® and longer immersion period. Therefore, the introduction of Bioglass® improved the bioactivity of the polymeric scaffold. EDX analysis of 50BG scaffold at 0 and 28 days of immersion in HBSS.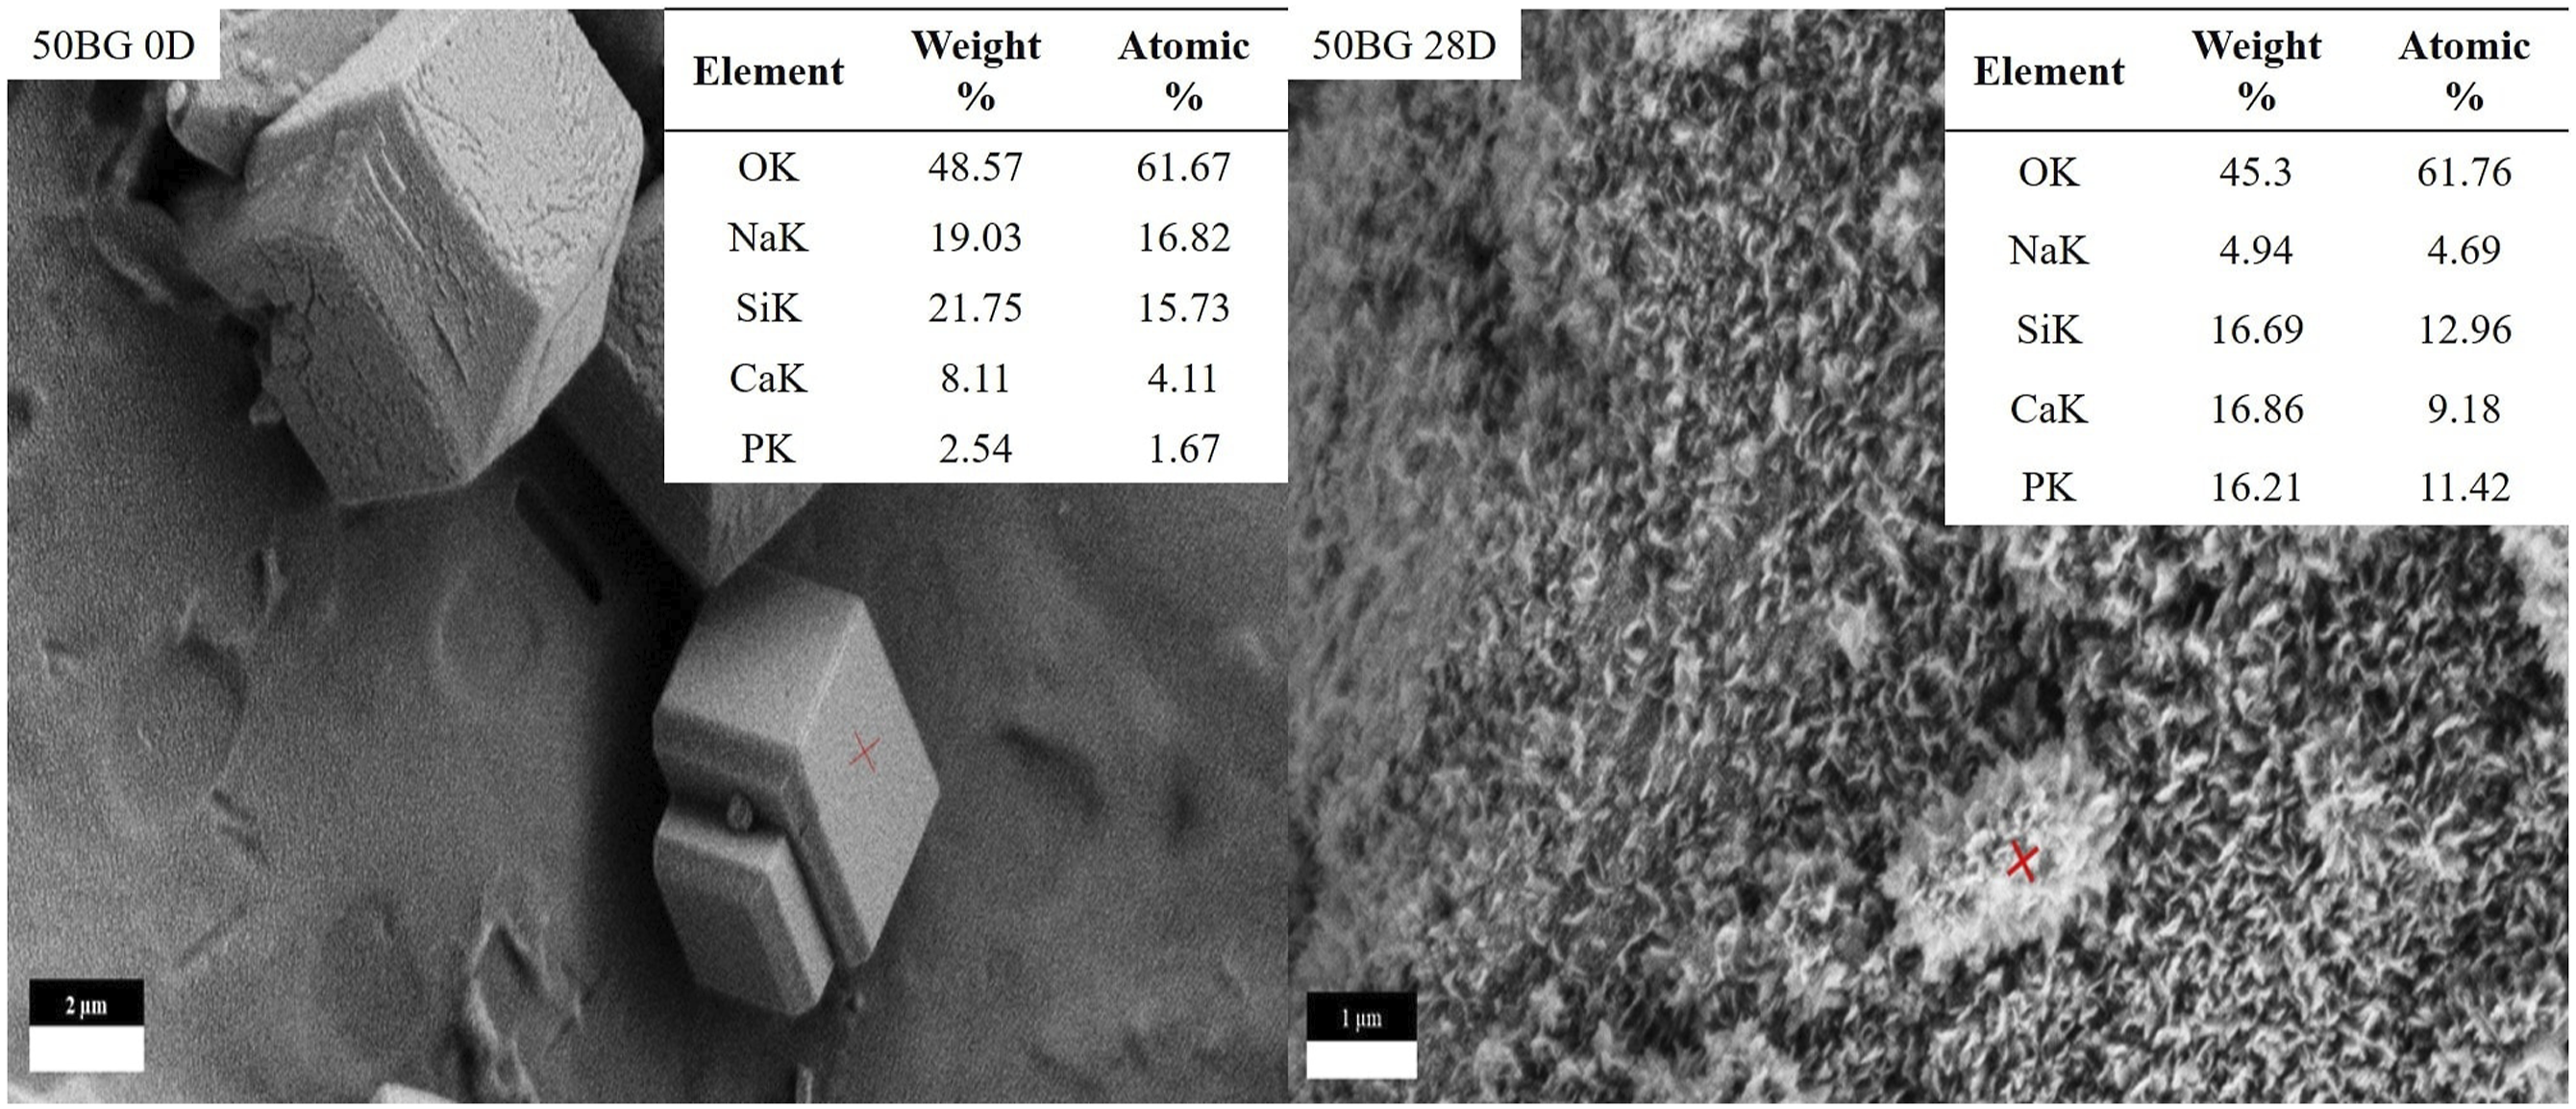
ICP was used for the elemental analysis to trace the concentration of elements in a sample. Si, P and Ca ion concentrations in the HBSS media throughout the immersion period were measured using ICP-OES. The measured concentrations of ions indicated the bioactivity and biodegradation behaviour of PU-BG scaffolds during the in-vitro immersion. Figure 10 shows the concentration of Si, P and Ca ions in HBSS solution for 0, 7, 14, 21 and 28 days of immersion. Based on the concentration of Si in Figure 10(a), the sample 0BG recorded a very low and constant value of Si ion concentration throughout the immersion. This outcome was mainly because the 0BG scaffold consisted of only a PU matrix which did not release any Si ion. The composite scaffolds were observed with a rapid increase in Si ion from day 0 to day 14. This increase could be related to the breakdown of the silica glass network by OH− as breaking Si–O–Si bonds leads to the dissolution of silica in the form of Si(OH)4.
36
This behaviour could be explained by the formation of pits on the surface of Bioglass® particles on day 7 (Figures 7 and 8). Concentration of (a) Si, (b) Ca and (c) P ions in HBSS solution at 0, 7, 14, 21 and 28 days.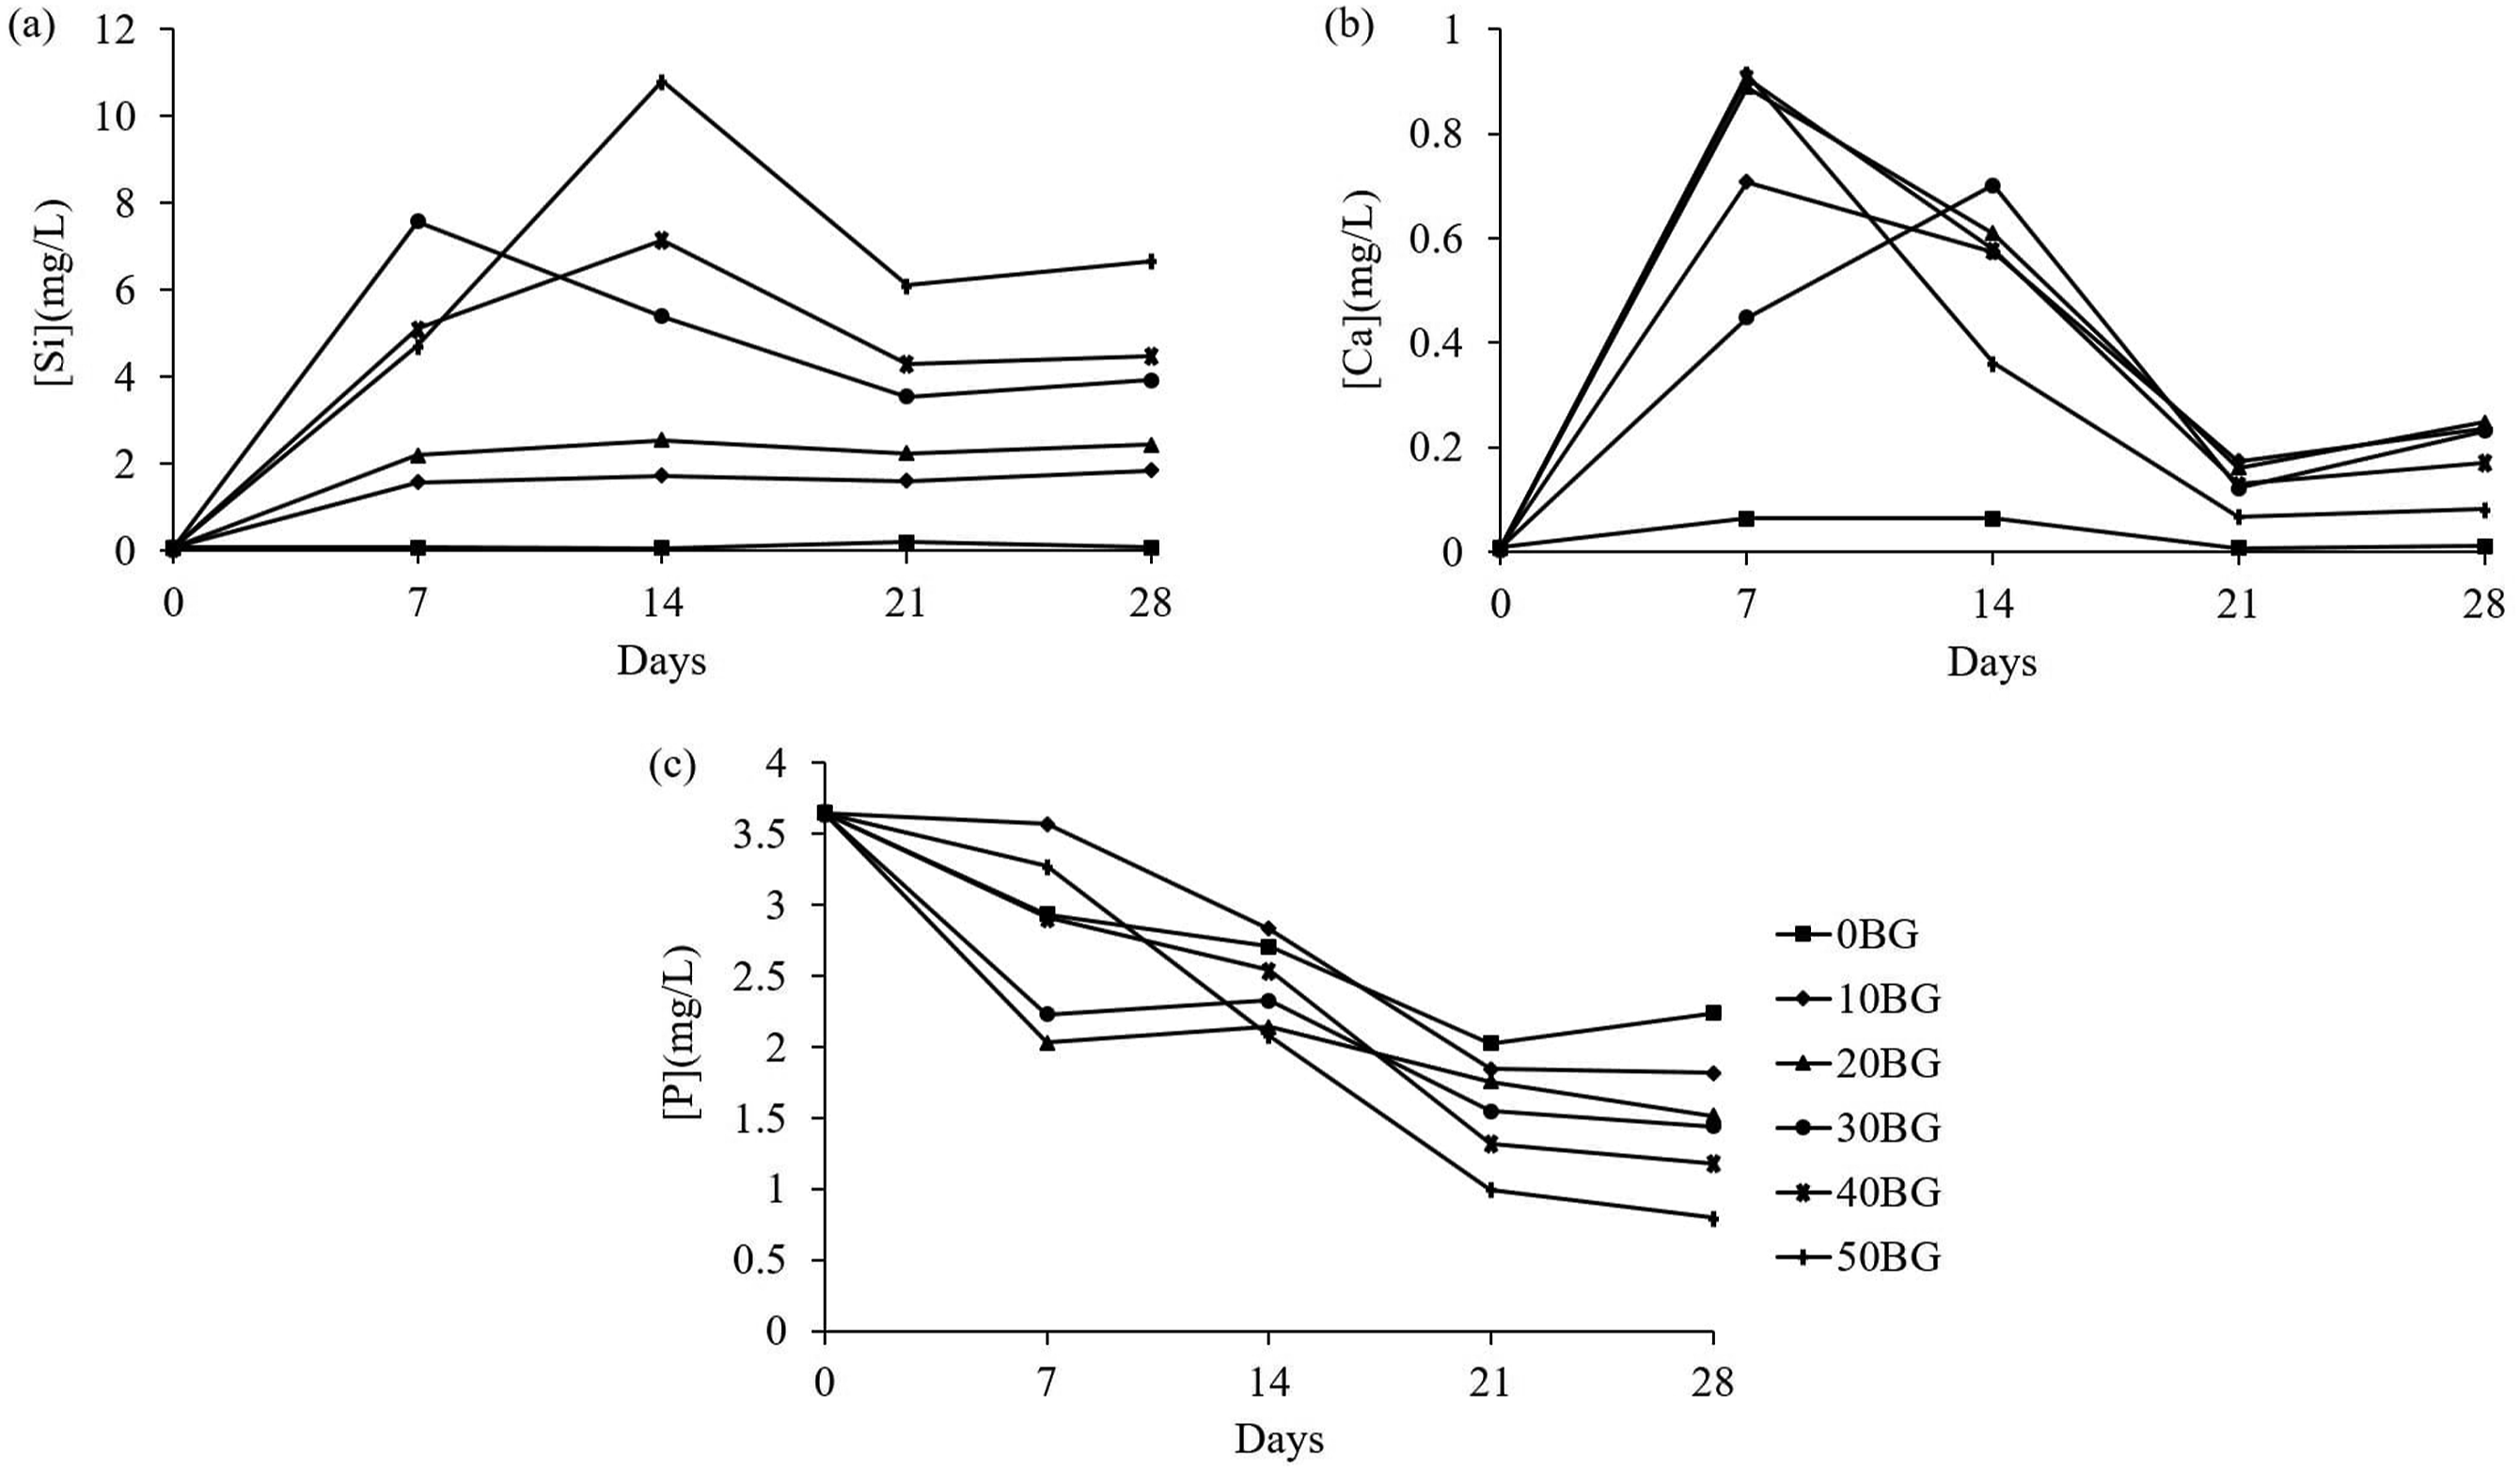
As soaking time increased from day 14 to day 21, the concentration of Si ion decreased then slightly increased upon reaching day 28. The decrease in Si ion was due to the deposition of Ca and P on the silica-rich layer which might hinder the release of soluble silica into the solution. By increasing the immersion time, unreacted Bioglass® came into contact with HBSS media, leading to the dissolution of ion and breakdown of silica glass network which caused a slight increase of Si ion at the end of immersion. 37 Hence, the concentration of Si ion increased with an increase in Bioglass® percentage due to the dissolution of Si(OH)4 from the glass to the HBSS solution. The formation of the apatite layer was aided by the incorporation of Ca and P from the glass and solution on the silica-rich layer.
As can be seen in Figure 10(b) and (c), the rapid increase of Ca ions from day 0 until day 7 was contributed by the dissolution of Ca ions from the glass. The increase of Ca ions could be explained by the rapid cation exchange of alkali-metal cations, most likely Na+ and /or Ca2+ ions, from the glass with H+ from the HBSS solution creating silanol bonds on the glass surface. 12 Ca and P ions decreased gradually after day 7 which was most likely due to the formation of a silica-rich and Ca–P layer on the surface of the scaffolds.4,37,38 Ca and P migrated from the glass and solution, forming a film rich in amorphous Ca–P on the silica-rich layer.12,36 Pure PU scaffolds had relatively constant ion concentration during the 28 days of immersion which could describe the absence of apatite on the PU surface. The morphology changes in composite scaffolds in Figures 7 and 8 could be directly correlated to the change in ion concentration in HBSS solution during the immersion period. Moreover, PU-BG scaffolds with high Bioglass® percentage resulted in a low concentration of Ca and P ions on day 28 of in-vitro immersion. This outcome was due to the high adsorption of Ca and P ions with the silica-rich layer, forming an apatite layer spreading on the scaffold surface.
In-vitro degradation
Figure 11 shows the variation of degradation kinetics (WL, WA and pH) of PU-BG scaffolds with different Bioglass® percentages during the 28 days of incubation in HBSS solution at 37°C. During the incubation in HBSS media, all the scaffolds recorded small weight loss within the range of 0% – 4.6%. All the composite scaffolds showed rapid weight loss from the first until the second week of immersion which was likely due to the rapid ionic dissolution of Bioglass® to the solution. After day 14, the percentage of weight loss slightly increased as the precipitation of the Ca–P rich layer started to deposit on the glass and PU matrix. The gradual increase of weight loss after day 14 might be due to the dissolution of Bioglass® and precipitation of the Ca–P layer which occurred simultaneously. Degradation kinetics of PU-BG scaffolds during incubation in HBSS solution for 0, 7, 14, 21 and 28 days: (a) weight loss, (b) water absorption and (c) pH.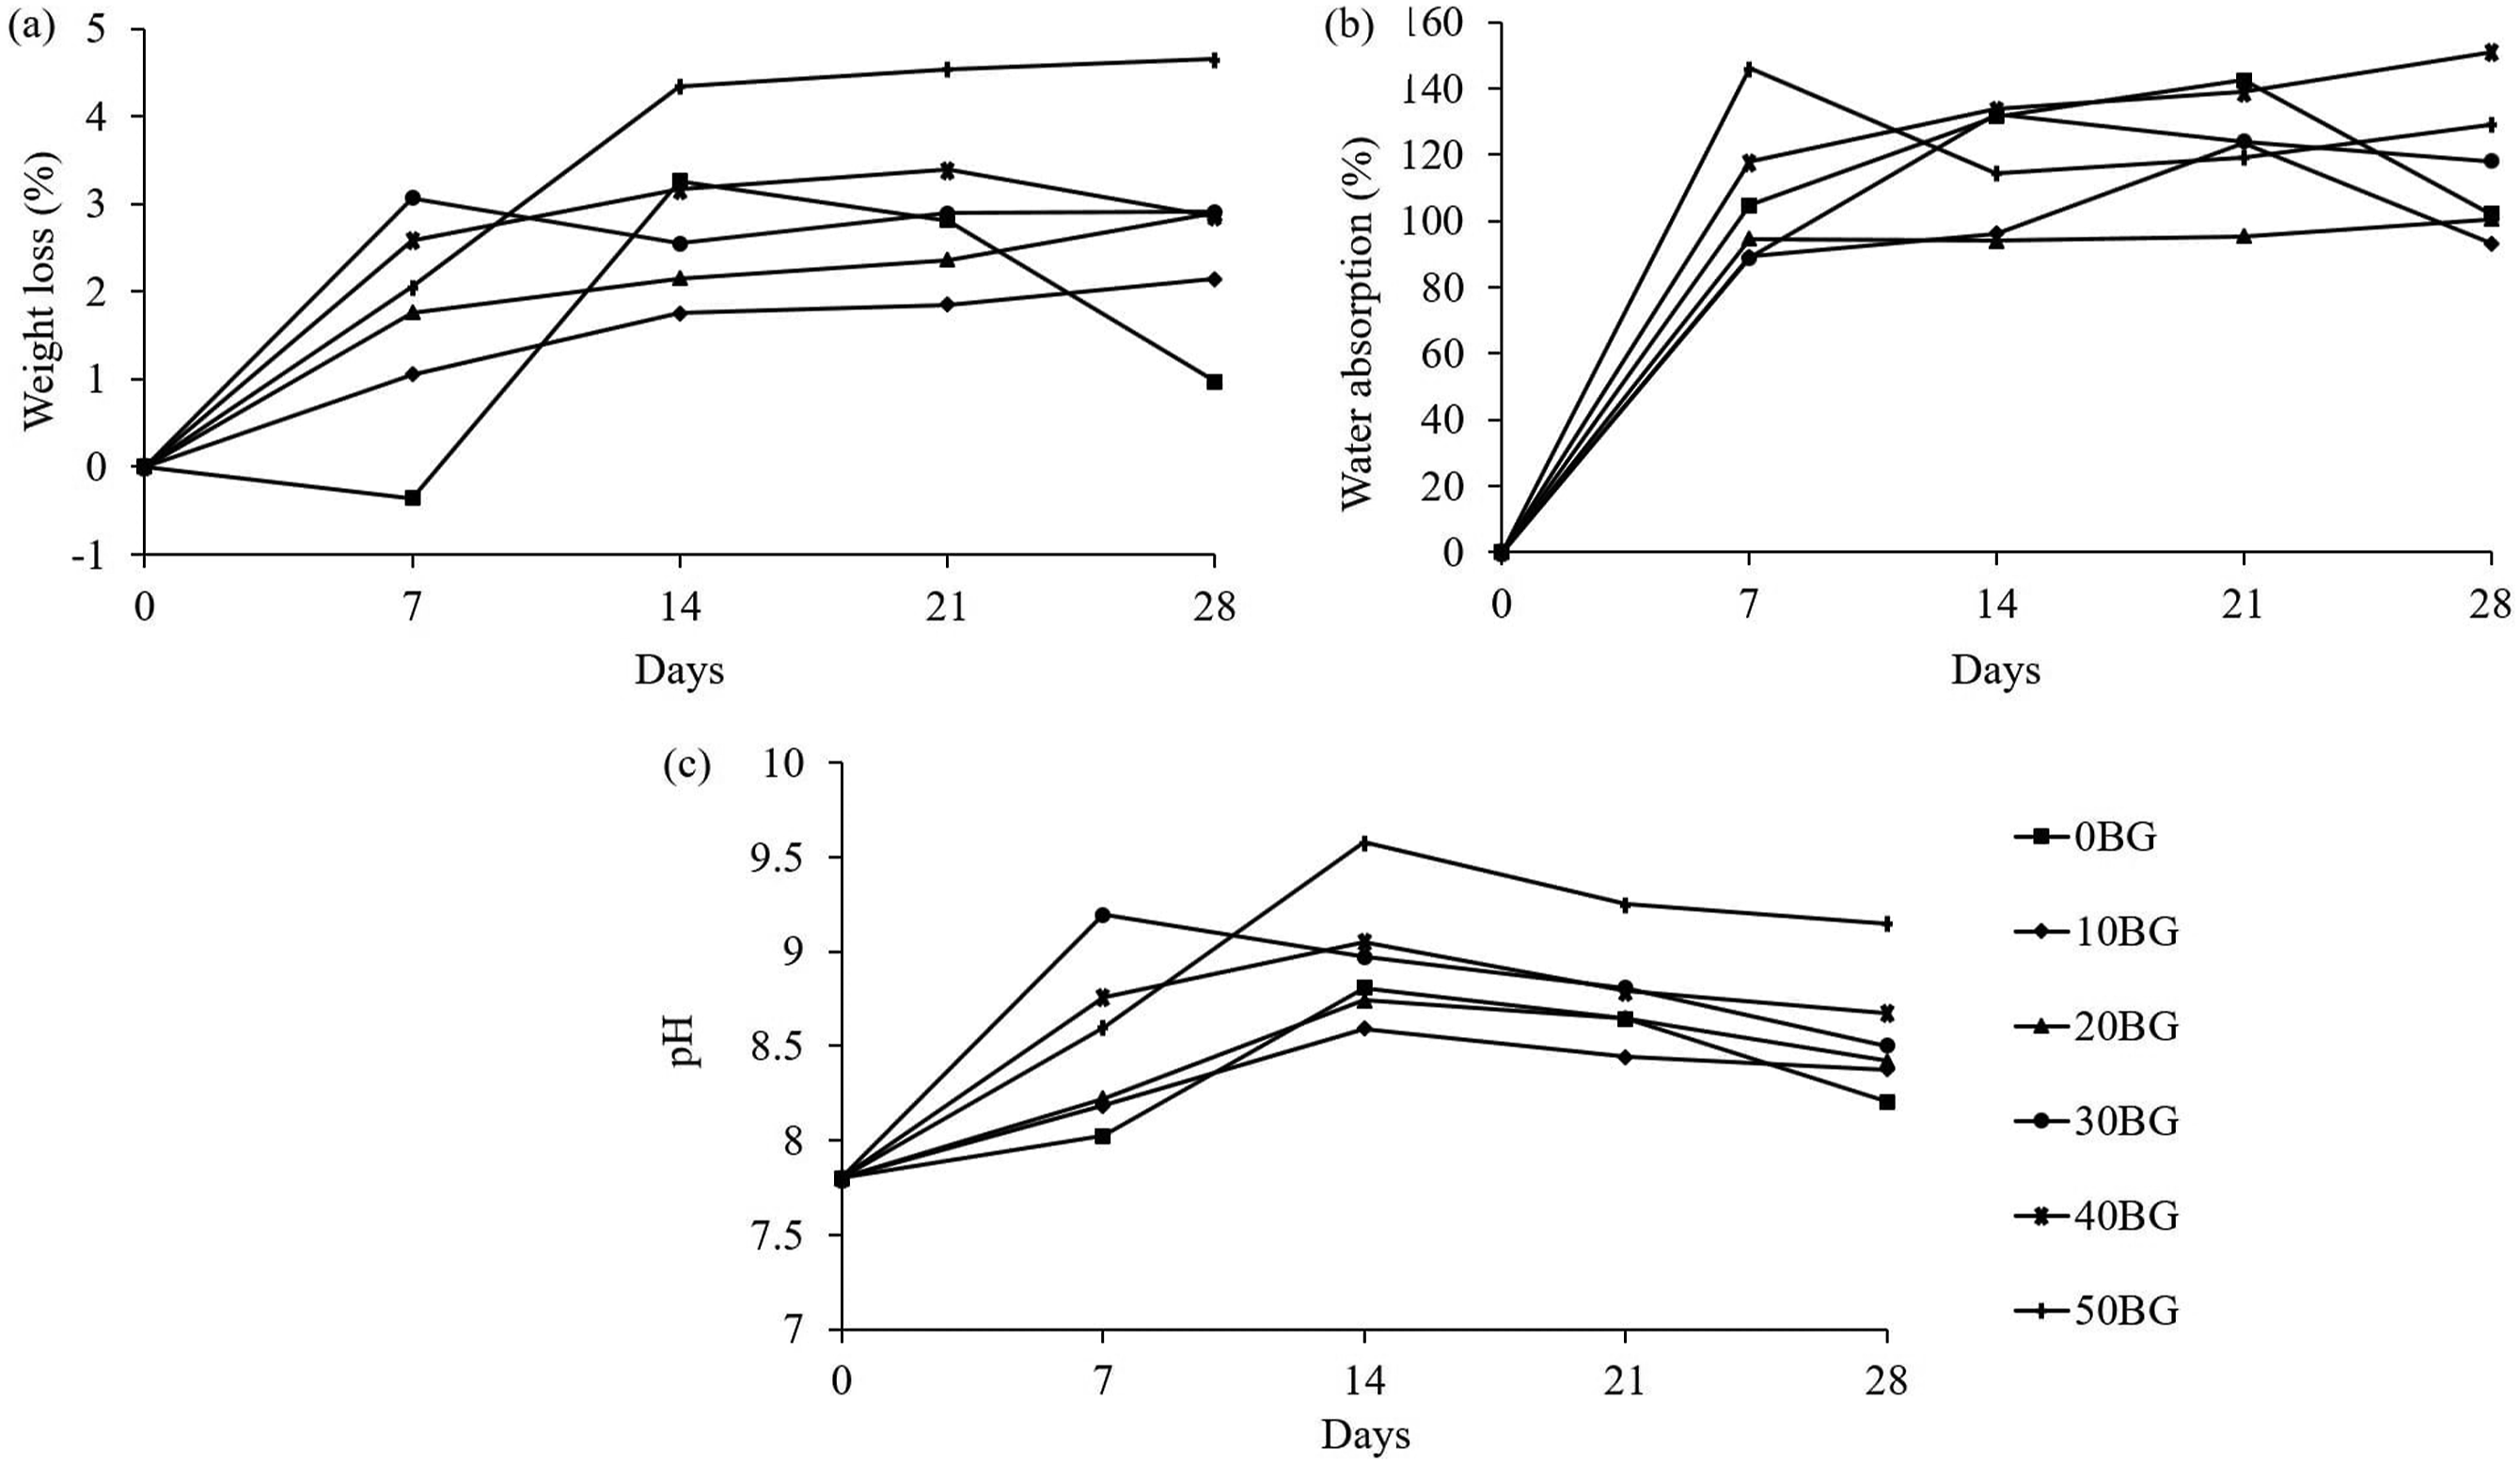
As can be seen in Figure 11(a), the weight loss of the scaffolds increased as the Bioglass® percentage increased, implying the addition of the Bioglass® into the PU matrix accelerated the degradation rate of the polymer scaffold.20,39,40 The degradation of scaffolds is crucial to be eventually replaced with new tissue. However, the degradation rate of the scaffolds should be designed properly to ensure that the degradation of scaffolds and the formation of new tissue occur at an equal rate. 4 The neat PU scaffold showed inconsistent weight loss during the immersion in HBSS. Twenty-eight days of incubation period might be inadequate to observe the degradation behaviour of PU which likely showed an inconsistent trend.
Figure 11(b) shows that the scaffolds absorbed a large amount of water with a maximum value of 146 % of WA for the 50BG scaffold during the first week of incubation. An increase in mass was observed for pure PU scaffold until day 21 and dropped significantly until the end of incubation. Composite scaffolds with 40 wt % of Bioglass® exhibited the highest WA (∼151%) towards the end of incubation. All the scaffolds in this study showed the inconsistent ability of water absorption regardless of Bioglass® content, unlike in other studies.13,35 All the PU-BG scaffolds could absorb water which encouraged the absorption of body fluid into the scaffolds so as to provide an ideal environment for cells to grow into the scaffolds. 41 Figure 11(c) displays the changes in pH during the entire incubation in HBSS solution. Based on the figure, the pH of the HBSS was recorded within the range of 7.8–9.6 which was slightly alkaline.
As mentioned previously, Bioglass® released alkali-metal ions into the HBSS solution which could explain the increase in pH until day 14 for the composite scaffolds. After day 14, the pH dropped slowly mainly due to the deposition of Ca and P on the surface of the glass preventing the dissolution of the alkali ion into the media. A small range in the percentage of weight loss (0% – 4.6%) caused the polymer and composite scaffolds to retain the porous structure and 3D morphology until the end of the incubation. The degradation of PU-BG scaffolds was still in the early stage as the release of acidic residues did not occur. 13 This finding could explain why no significant drop in pH was measured in this study. Moreover, an alkaline environment during the immersion might help to avoid inflammatory response due to the acidic degradation (hydrolytic degradation of ester into carboxylic acid) from the polymer. 42 Hence, the reading of pH was more alkaline at a high Bioglass® percentage due to the high dissolution of metal-alkaline ion from the Bioglass®.
Conclusion
The aim of this study was to evaluate the effect of Bioglass® addition on the properties of PU-based composite scaffolds, focusing on pore structure, surface roughness, mechanical strength, bioactivity, and degradation behavior. The addition of the Bioglass® did not significantly affect the pore structure but induced the surface roughness of the composite scaffolds due to the distribution of Bioglass® particles on the PU matrix. Despite the inconsistent trend in porosity for scaffolds containing 10 wt %–30 wt % of Bioglass®, the scaffolds showed consistent improvement in compressive strength (0.6–1.6 MPa) as the Bioglass® percentage increased. The characterisation of scaffolds was continued with in-vitro bioactivity and degradation evaluation in HBSS until 28 days. The 30BG and 50BG scaffolds exhibited apatite nucleation after 14 days of immersion, and the apatite growth progressed into a typical ‘cauliflower’ shape by days 21 and 28 for scaffolds with 50 wt % of Bioglass®. The apatite formation was further supported by the decrease in Ca ion concentration in HBSS solution from 7 days until 28 days of immersion. The neat PU scaffold, in contrast, did not show any precipitation on the surface. These results suggest that the incorporation of Bioglass® into PU scaffolds enhanced their bioactivity. Furthermore, at the end of the incubation period, weight loss and water absorption of the scaffolds increased as the Bioglass® percentage increased. In conclusion, this work demonstrates that the inclusion of Bioglass® in PU scaffolds significantly improves the mechanical strength, bioactivity and degradation properties, making them promising candidates for tissue engineering applications.
Footnotes
Author contributions
Intan Syazana Suhaimin: formal analysis, investigation, methodology, writing-original draft. Syamimi Abu Kassim: writing-review & editing. Syazana Ahmad Zubir: conceptualization. Tuti Katrina Abdullah: supervision, conceptualization, writing-review & editing, methodology, funding acquisition.
Declaration of conflicting interests
The author(s) declared no potential conflicts of interest with respect to the research, authorship, and/or publication of this article.
Funding
The author(s) disclosed receipt of the following financial support for the research, authorship, and/or publication of this article: this work was supported by Universiti Sains Malaysia through the Bridging-Insentif grant (203.PBAHAN.6316441) and the Ministry of Higher Education Malaysia through the Fundamental Research Grant Scheme, FRGS with grant number; FRGS/1/2015/TK05/USM/03/1.