
Abstract
Fused deposition modelling (FDM) is extensively utilized in aerospace and biomedical industries for creating intricate and complex parts and prototypes. The mechanical properties of 3D printed components heavily rely on selecting the appropriate process parameters. This study aims to investigate the effects of process parameters, such as infill pattern type, nozzle diameter, and nozzle temperature, on the mechanical properties and surface roughness of FDM printed parts. Analysis of variance was employed to assess the effects of each parameter and identify the significant ones. The results revealed that nozzle diameter has the most influence on tensile behavior, while infill pattern affects impact strength and surface roughness the most. The process parameters were optimized to achieve lower surface roughness and maximum tensile and impact strength, as well as elongation at break, for the printed parts. A novel optimization technique called war strategy optimization (WSO) was implemented in this investigation, using regression correlations as objective functions. For each objective function, exclusive optimal parameter settings were proposed.
Keywords
Introduction
One of the developed methods in order to produce metal, polymer, ceramic and composite parts in the past few years, is 3D printing or additive manufacturing, which has attracted the attention of many researchers and craftsmen.
1
In this method, unlike traditional manufacturing methods such as machining or molding, a segment with any complexity in its geometry including negative angles, suspended sections, etc., can be produced.2,3 All the methods of 3D printing or additive manufacturing have in common that the production is implemented gradually or step by step. Additive manufacturing is widely used in various industries such as construction, rapid prototyping and biomechanics.
4
The FDM process is the most well-known and widely used method among all additive manufacturing techniques due to its simple mechanism, low production cost, and the ability to print relatively complex parts. The schematic of the FDM process is shown in Figure 1. Accordingly, the consumables are thermoplastic filaments with the same diameter which are heated in the chamber and extruded in a semi-liquid form through the nozzle on the printer screen. The final shape is obtained from the layer-by-layer extrusion of the melted filament based on the Computer Aided Design (CAD) file. The most commonly used materials in FDM are polylactic acid (PLA), acrylonitrile butadiene styrene (ABS), thermoplastic polyurethane (PU), polyamide (PA), polyethylene terephthalate glycol (PET), and polyether ether ketone (PEEK). The most important feature of the materials used in this method is their low cost, recyclability and high biocompatibility. PLA is the most commonly used thermoplastics for FDM. The use of PLA is increasing because it is a biodegradable thermoplastic. It also requires less energy and temperature to produce good quality prototypes and functional parts. Many desktop 3D printers now use PLA as a filament because it does not require a heated bed.
5
FDM process principle.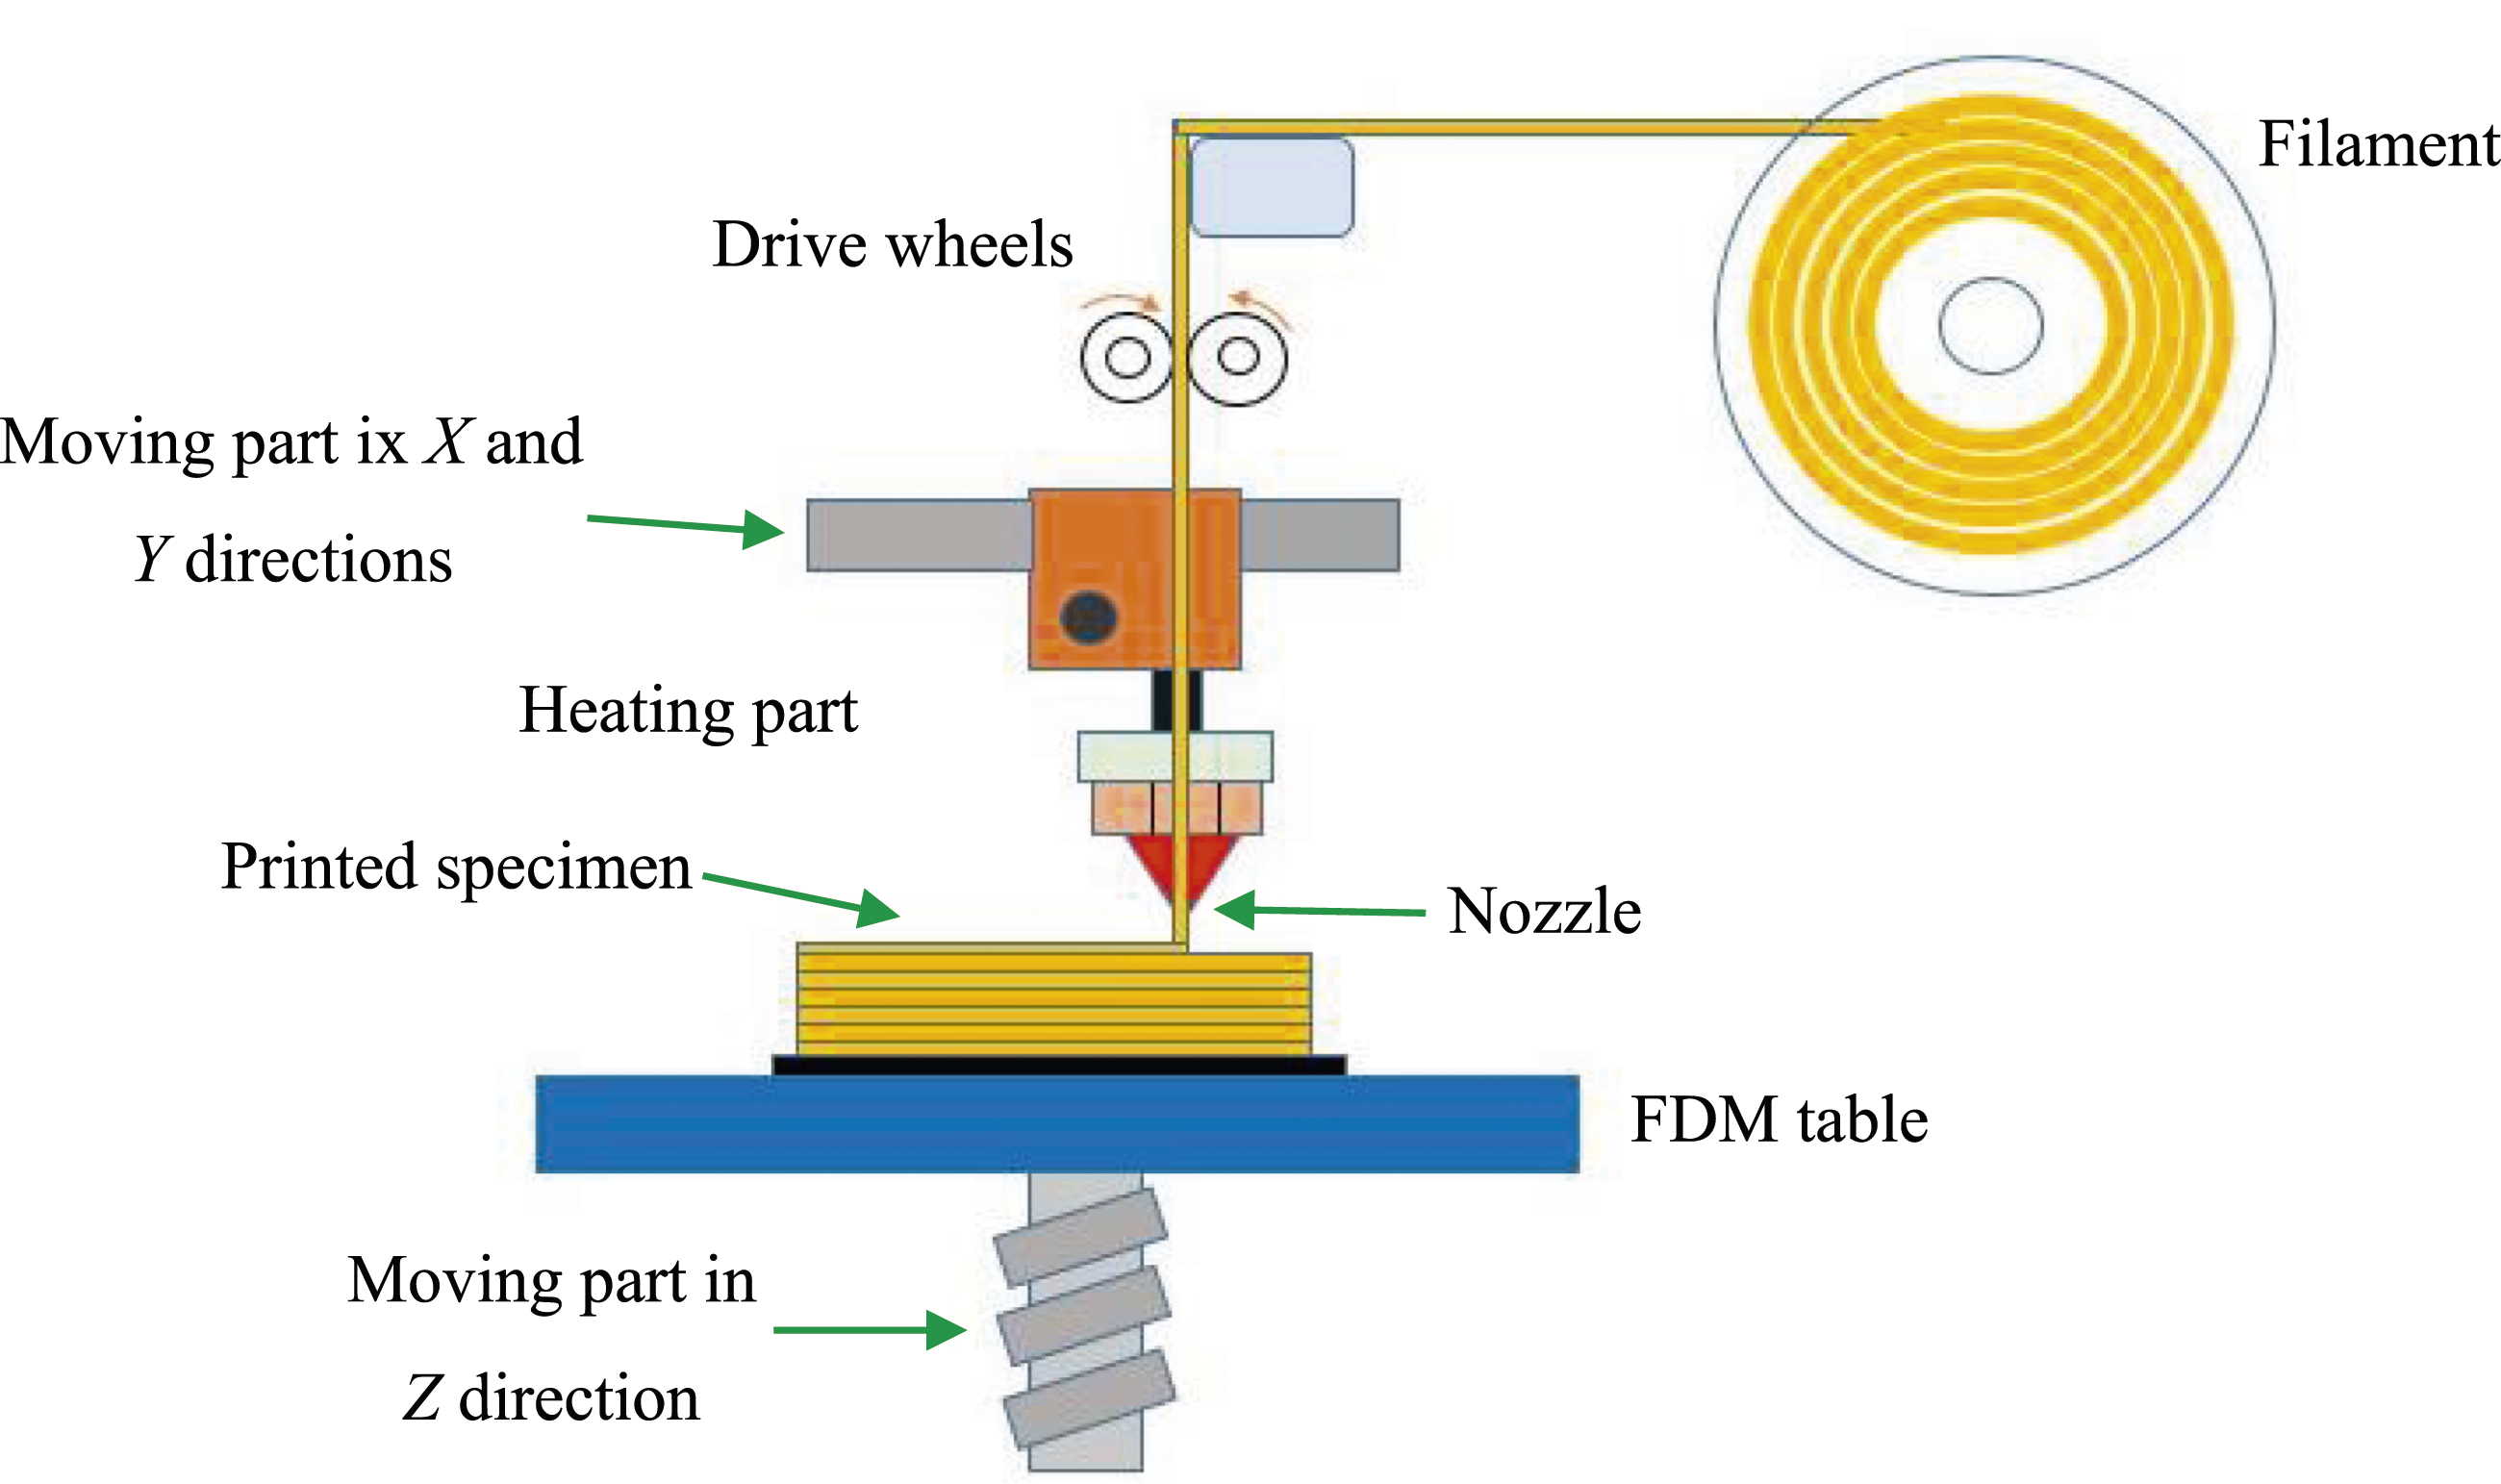
In spite of this mechanism simplicity, numerous effective parameters in this process have made it a challenge to achieve the desired mechanical and physical properties. However, the FDM needs a long process ahead to be suitable enough to replace the traditional methods owing to high production time. The important challenges that FDM faces are: high shrinkage, low surface roughness, dimensional tolerance, mechanical strength and production efficiency, layered structure, anisotropy and high production cost.6,7 For this purpose, most of the recent researches have investigated the effect of these parameters on mechanical and physical properties to improve the printed parts’ quality.8–10 The nozzle and the print plate temperature, print speed, print angle, print orientation, infill pattern, nozzle diameter and layer thickness are the most important parameters in the FDM process. Numerous numbers of researchers have investigated in order to examine impacts of the mentioned factors on surface quality, build time, mechanical properties and dimensional tolerances.
Akhundi et al. 11 showed that increasing the nozzle temperature improves the quality of the printed layers, and also their mechanical tests showed that PLA printed at the highest temperature has the highest mechanical properties. Ding et al. 12 stated that increasing nozzle temperature for PEEK material, relative density and flexural strength is increased. Yang et al. 13 investigated the effect of nozzle diameter on the mechanical properties, surface roughness and fabrication time of PLA and reported that by changing the nozzle diameter from 0.2 mm to 0.6 mm, the tensile strength improved by 19%. The printing time was also reduced from 3.81 hours to 1.30 hours. However, the surface quality was reduced by 108%. In another study by Quanjin et al., 14 simultaneous effect of filling density and print pattern on the quasi-static behavior under compressive loading for PLA and carbon fiber reinforced PLA was investigated.
Usually, in 3D printing with the FDM for commercial and conventional filaments such as ABS and PLA, two patterns of unidirectional and cross printing (changing the printing direction by 90° in each layer) are used. 15 Kindle et al. 6 showed that by changing the printing pattern and direction for PLA material, it is possible to control the mechanical properties.
The main index of the part quality in FDM is surface roughness. Surface roughness improvement leads to aesthetic view enhancement and is important to ensure proper function of mechanical parts such as friction plates and sealing shafts in automotive industry. The effects of process parameters on surface roughness depends not only on the part shape and complexity, but also on the parameters’ setting. Improved surface quality decreases the post-processing costs. Vasudevarao et al. 16 studied on the effects of different parameters on the FDM built part surface quality. That was stated high build orientation and low layer thickness decreases surface roughness. Kim et al. 17 examined the fabrication parameters such as nozzle/substrate gap, filament material speed and nozzle speed on the surface roughness and presented an empirical correlation based on the experimental results. Buj corral et al. 18 addressed the print orientation angle influence on the surface roughness in lateral walls. That was stated by increasing print orientation from 5° to 85°, surface roughness values rise.
On the other hand, mechanical characteristics of the FDM built part are significant. Mechanical characteristics should be examined depending on the application area. Because of various FDM process parameters, mechanical properties of the FDM built part are different with the used filament. In the meantime, tensile strength is the most analyzed mechanical characteristic by the researchers.19,20 Garg et al. 21 investigated on deformation behavior of the FDM parts in different layer thicknesses and also directions under tensile loading by finite element analysis and experimental confirmation. Heidari-Rarani et al. 22 examined influence of three main FDM factors including layer thickness, print speed and infill density on the tensile strength and failure strain of PLA material and distinguished the optimal process parameters using Taguchi method. Mohamed et al. 23 optimized the FDM process parameters to improve the tensile properties of the FDM built PEEK. The examined tensile properties included tensile strength and young’s modulus. Furthermore Maguluri et al. 24 by optimizing the FDM process aimed at enhancing tensile behavior, stated that nozzle temperature has the most effect on the tensile characteristics followed by infill density. Besides, impact strength is another important mechanical property which is affected by the FDM process parameters. Ramesh et al. 25 also studied on improving mechanical properties of the FDM built nylon material including tensile, impact and flexural strength. They employed analysis of variance (ANOVA) to study on the effect of input variables: infill density, layer height and print speed. Jatti et al. 26 also found that layer thickness reduction leads to impact strength decrement which has also been previously reported by Ramkumar. 27
Another fundamental challenge of the FDM process is choosing the optimal printing parameters for different materials. In fact, print parameters are very effective on mechanical properties, surface roughness, dimensional accuracy, printing time (cost) and relative density. Most of the previous researches have addressed this issue. 28 In another words, dependence of the final part properties on the printing parameters in FDM process is very high, and each of these parameters can lead to a wide range of mechanical properties, surface roughness, consumption material volume and manufacturing time. Therefore, selecting the printing parameters to check how they affect the final properties is an important step to achieve the desired properties. Saad et al. 29 applied particle swarm optimization (PSO) to optimize the FDM process towards the flexural strength of PLA. The conducted research was single objective. Because of the multi-objective structure of the FDM process, different methods have been used. 30 Kumar et al. used Taguchi-grey relational analysis (GRA) to conduct multi-objective optimization on FDM. Tensile strength and elastic modulus were selected as evaluation factors. D’Addona et al. 31 also used desirability function approach to optimize consumed filament length, component weight and printing time.
In summary, the majority of researches have focused on the on examining the effects of the factors such as infill density, printing speed and layer thickness that helps in reducing printing time, material usage and overall cost. Typically, other parameters have been left at their default values. Besides, tensile behavior of the FDM-built specimens has been investigated in many papers. Impact strength is another mechanical property which is important for applications such as mobile phone cases and protective cushioning in industry machinery. The paper presents a study aimed at optimizing the key responses of FDM: ultimate tensile strength, elongation at break, impact strength and surface roughness. To achieve that, for the experimental trials, three FDM parameters were considered: nozzle diameter, nozzle temperature and two common printing patterns inclusive of linear and concentric. The optimal values of the examining parameters were determined by the novel optimization technique called war strategy optimization (WSO).
Material and methods
In this study, a FDM-3D printer (Creality Ender 3V3 model, made in China) has been used to produce the specimens. The printer bed dimension is 220 × 220 × 250 mm. Cura software was used to control the printing process parameters. The CAD files were designed by CATIA software. The used material was PLA which is a thermoplastic polymer in the shape of filament with 1.75 mm diameter. The PLA filament was provided from eSun Company and the grade of PLA used in this study is 4032D. PLA filament is used in the medical industry, packaging, disposable containers, textiles, etc. Since PLA does not cause any harm to the environment and does not endanger human health, it is a very suitable option for disposable production and food packaging. In addition, its melting temperature is 180°C to 230°C, which is much lower compared to the melting temperature of ABS filament (210°C to 250°C). This means that there is no requirement to use a substrate while printing. Figure 2 provides the FDM printer used to print PLA samples. Creality Ender 3V3 FDM device.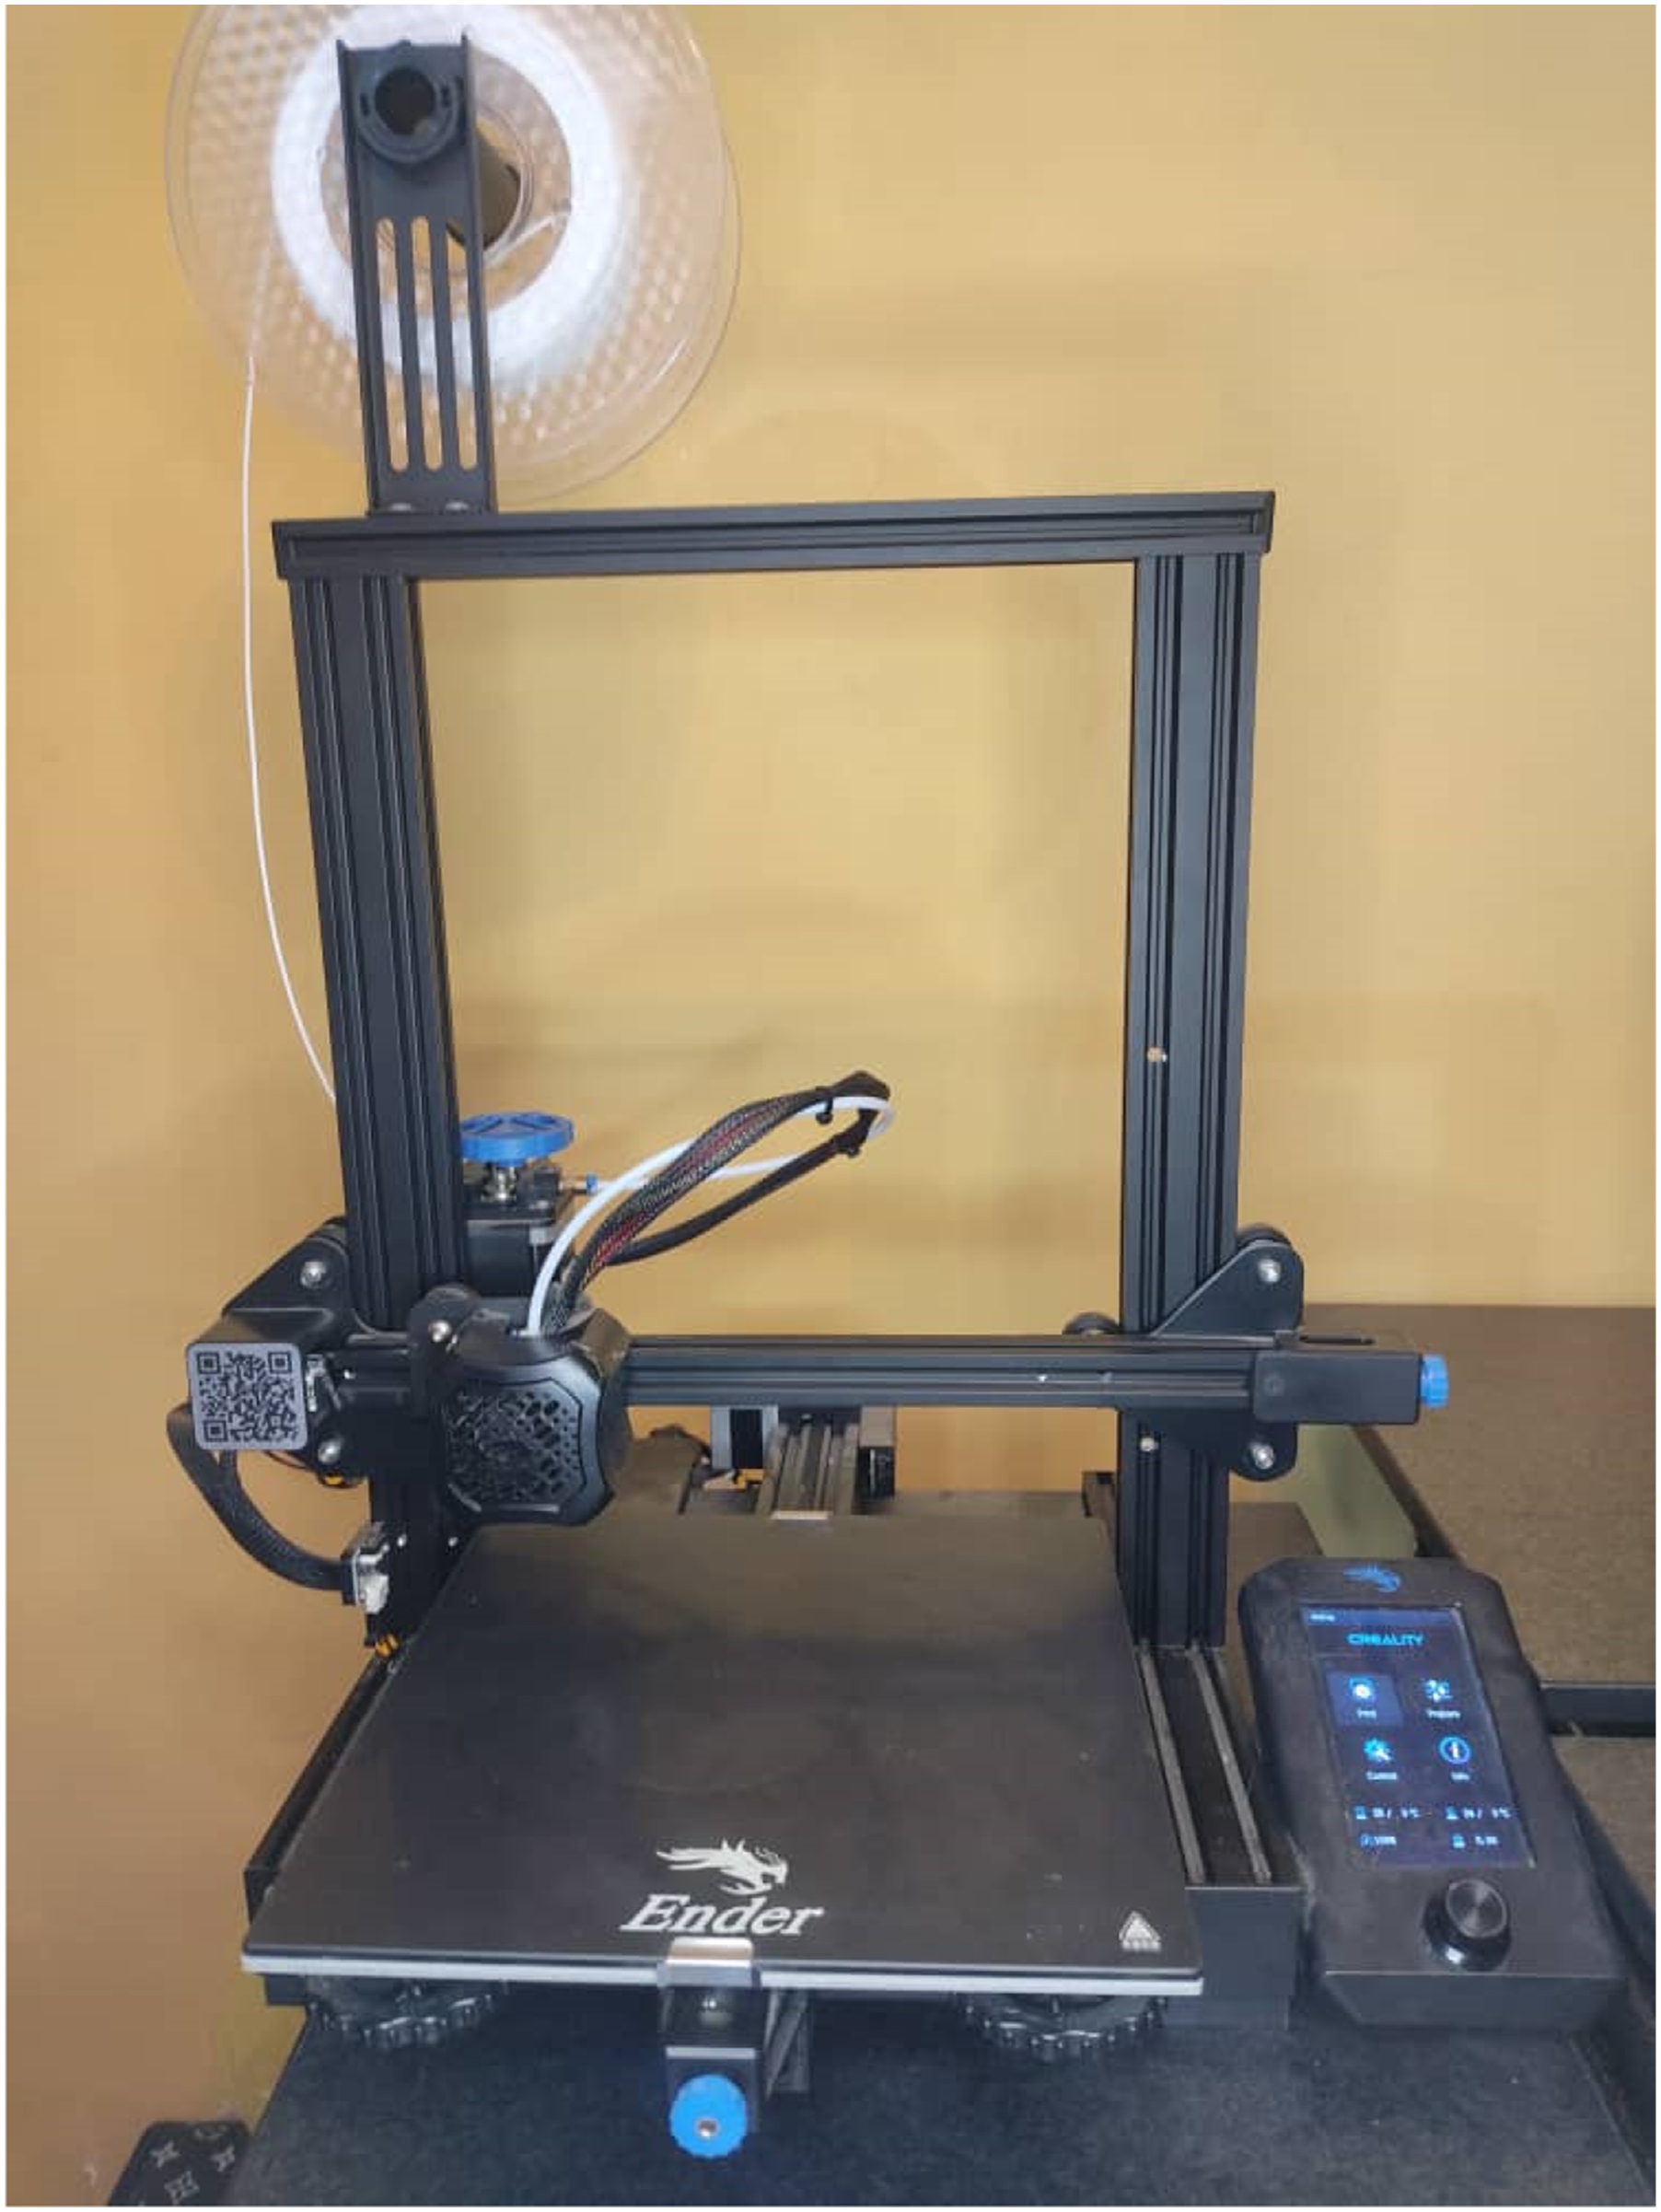
Geometry of the printed parts are in two shapes of tensile test and impact test standards. The dimension of tensile test specimens is 165 × 19 × 3.2 mm which is according to ASTM D 638 standard. Each specimen was tested at room temperature under a quasi-static tensile test with loading rate of 1 mm/min and a load cell of 500 kg. An extensometer with 50 mm gauge length was also used to measure the elongation at break. The dimension of impact test specimens is 127 × 12.7 × 7.2 mm which is according to ASTM D 6110-18 standard. Impact test method is notched Charpy. The machine used to conduct impact test is from Gotech company (made in Taiwan) in model of GT-TCS-2000. The standard specimens are depicted in Figure 3. In order to evaluate surface roughness, Mahr Perthometer M2 was established. The cut-off length was 5.6 mm. The surface roughness parameter was arithmetical mean height (Ra). The surface roughness was measured in two perpendicular directions for three times and the average value was reported. Dimensions of standard specimen for (a) tensile test and (b) impact test.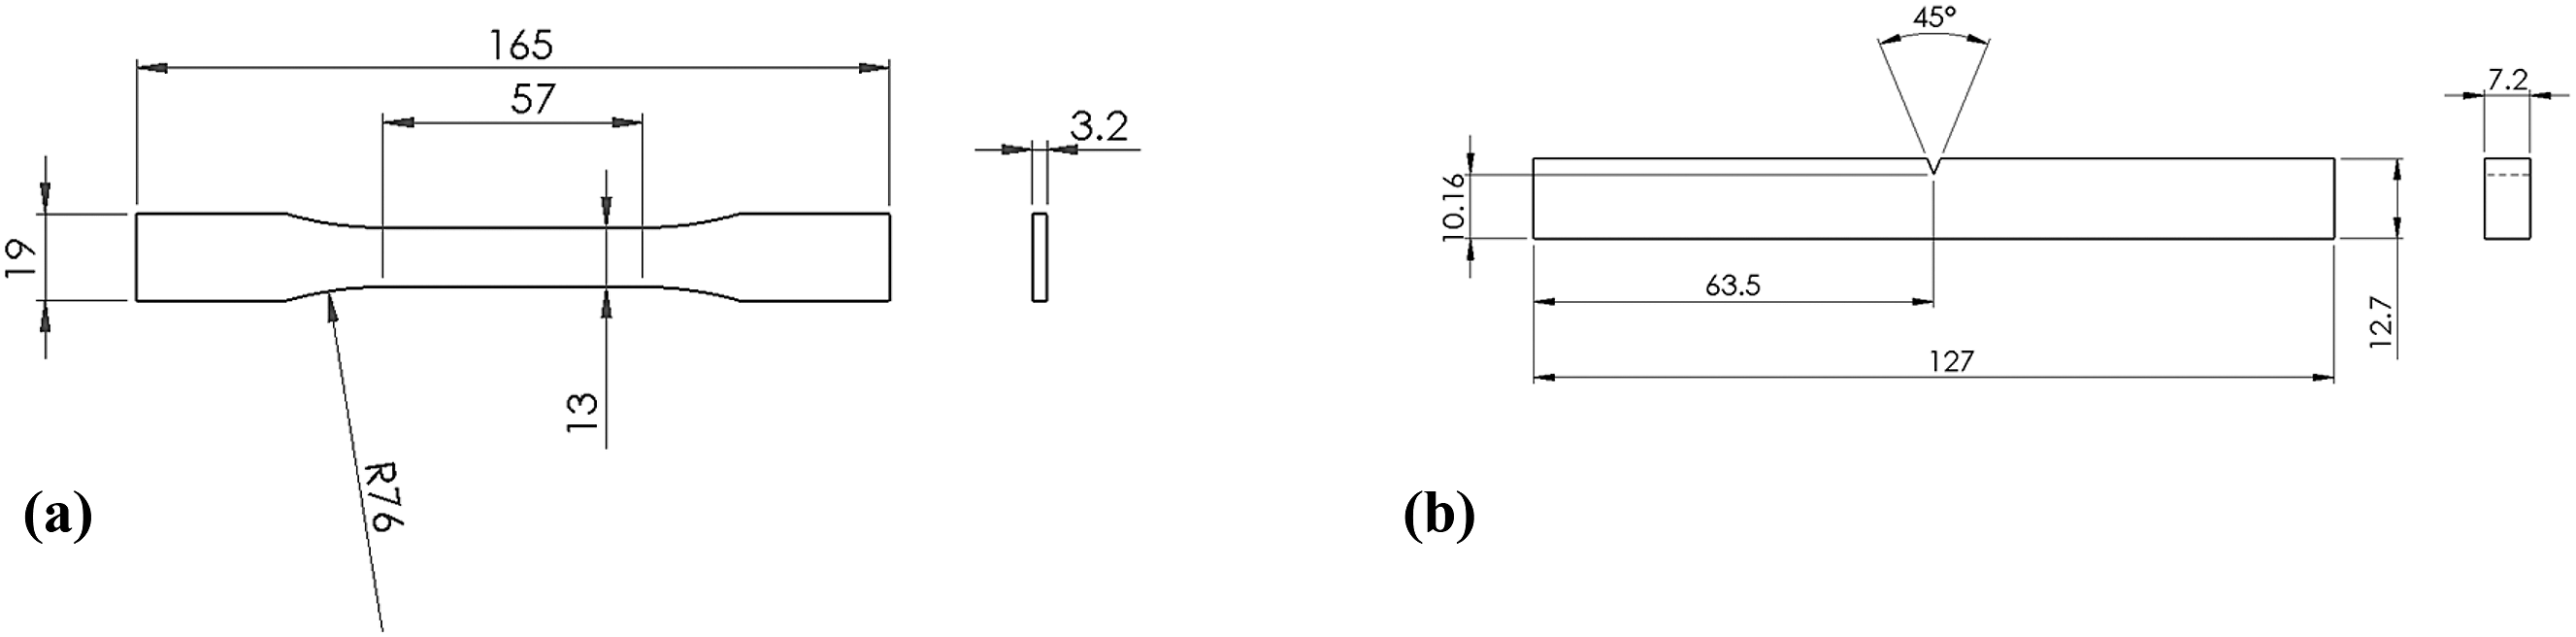
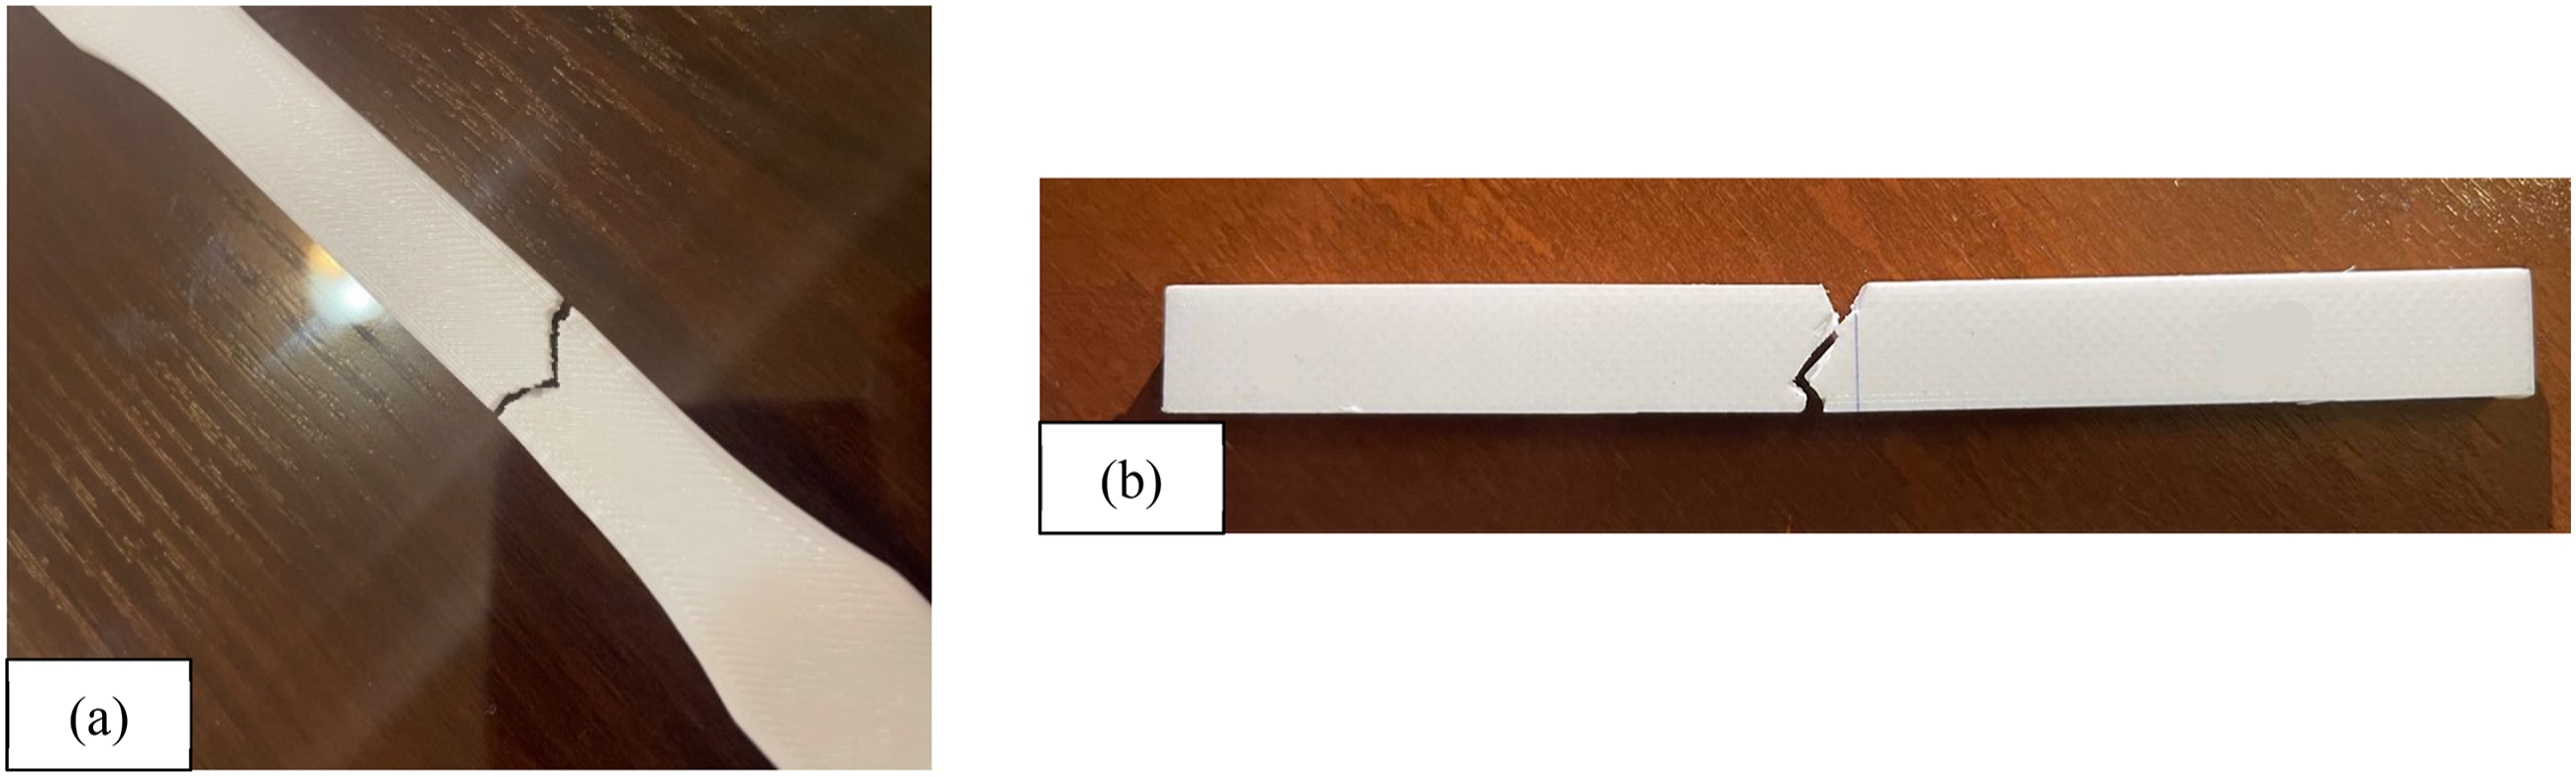
To investigate the microstructure and fracture mechanism of the printed samples, scanning electron microscope (SEM) was used. The used SEM device is MIRA3 FEG-SEM, manufactured by Tescan company in Czech Republic. The resolution of this device is up to 1 nm and its magnification power is up to 1 million times when applying 30 kV. The used testing devices in this investigation are demonstrated in Figure 4. In addition, the specimens after tests are demonstrated in Figure 5. (a) Tensile test setup, (b) FE-SEM, (c) Impact test setup, (d) Surace profilometer. Specimens after (a) tensile test, (b) impact test.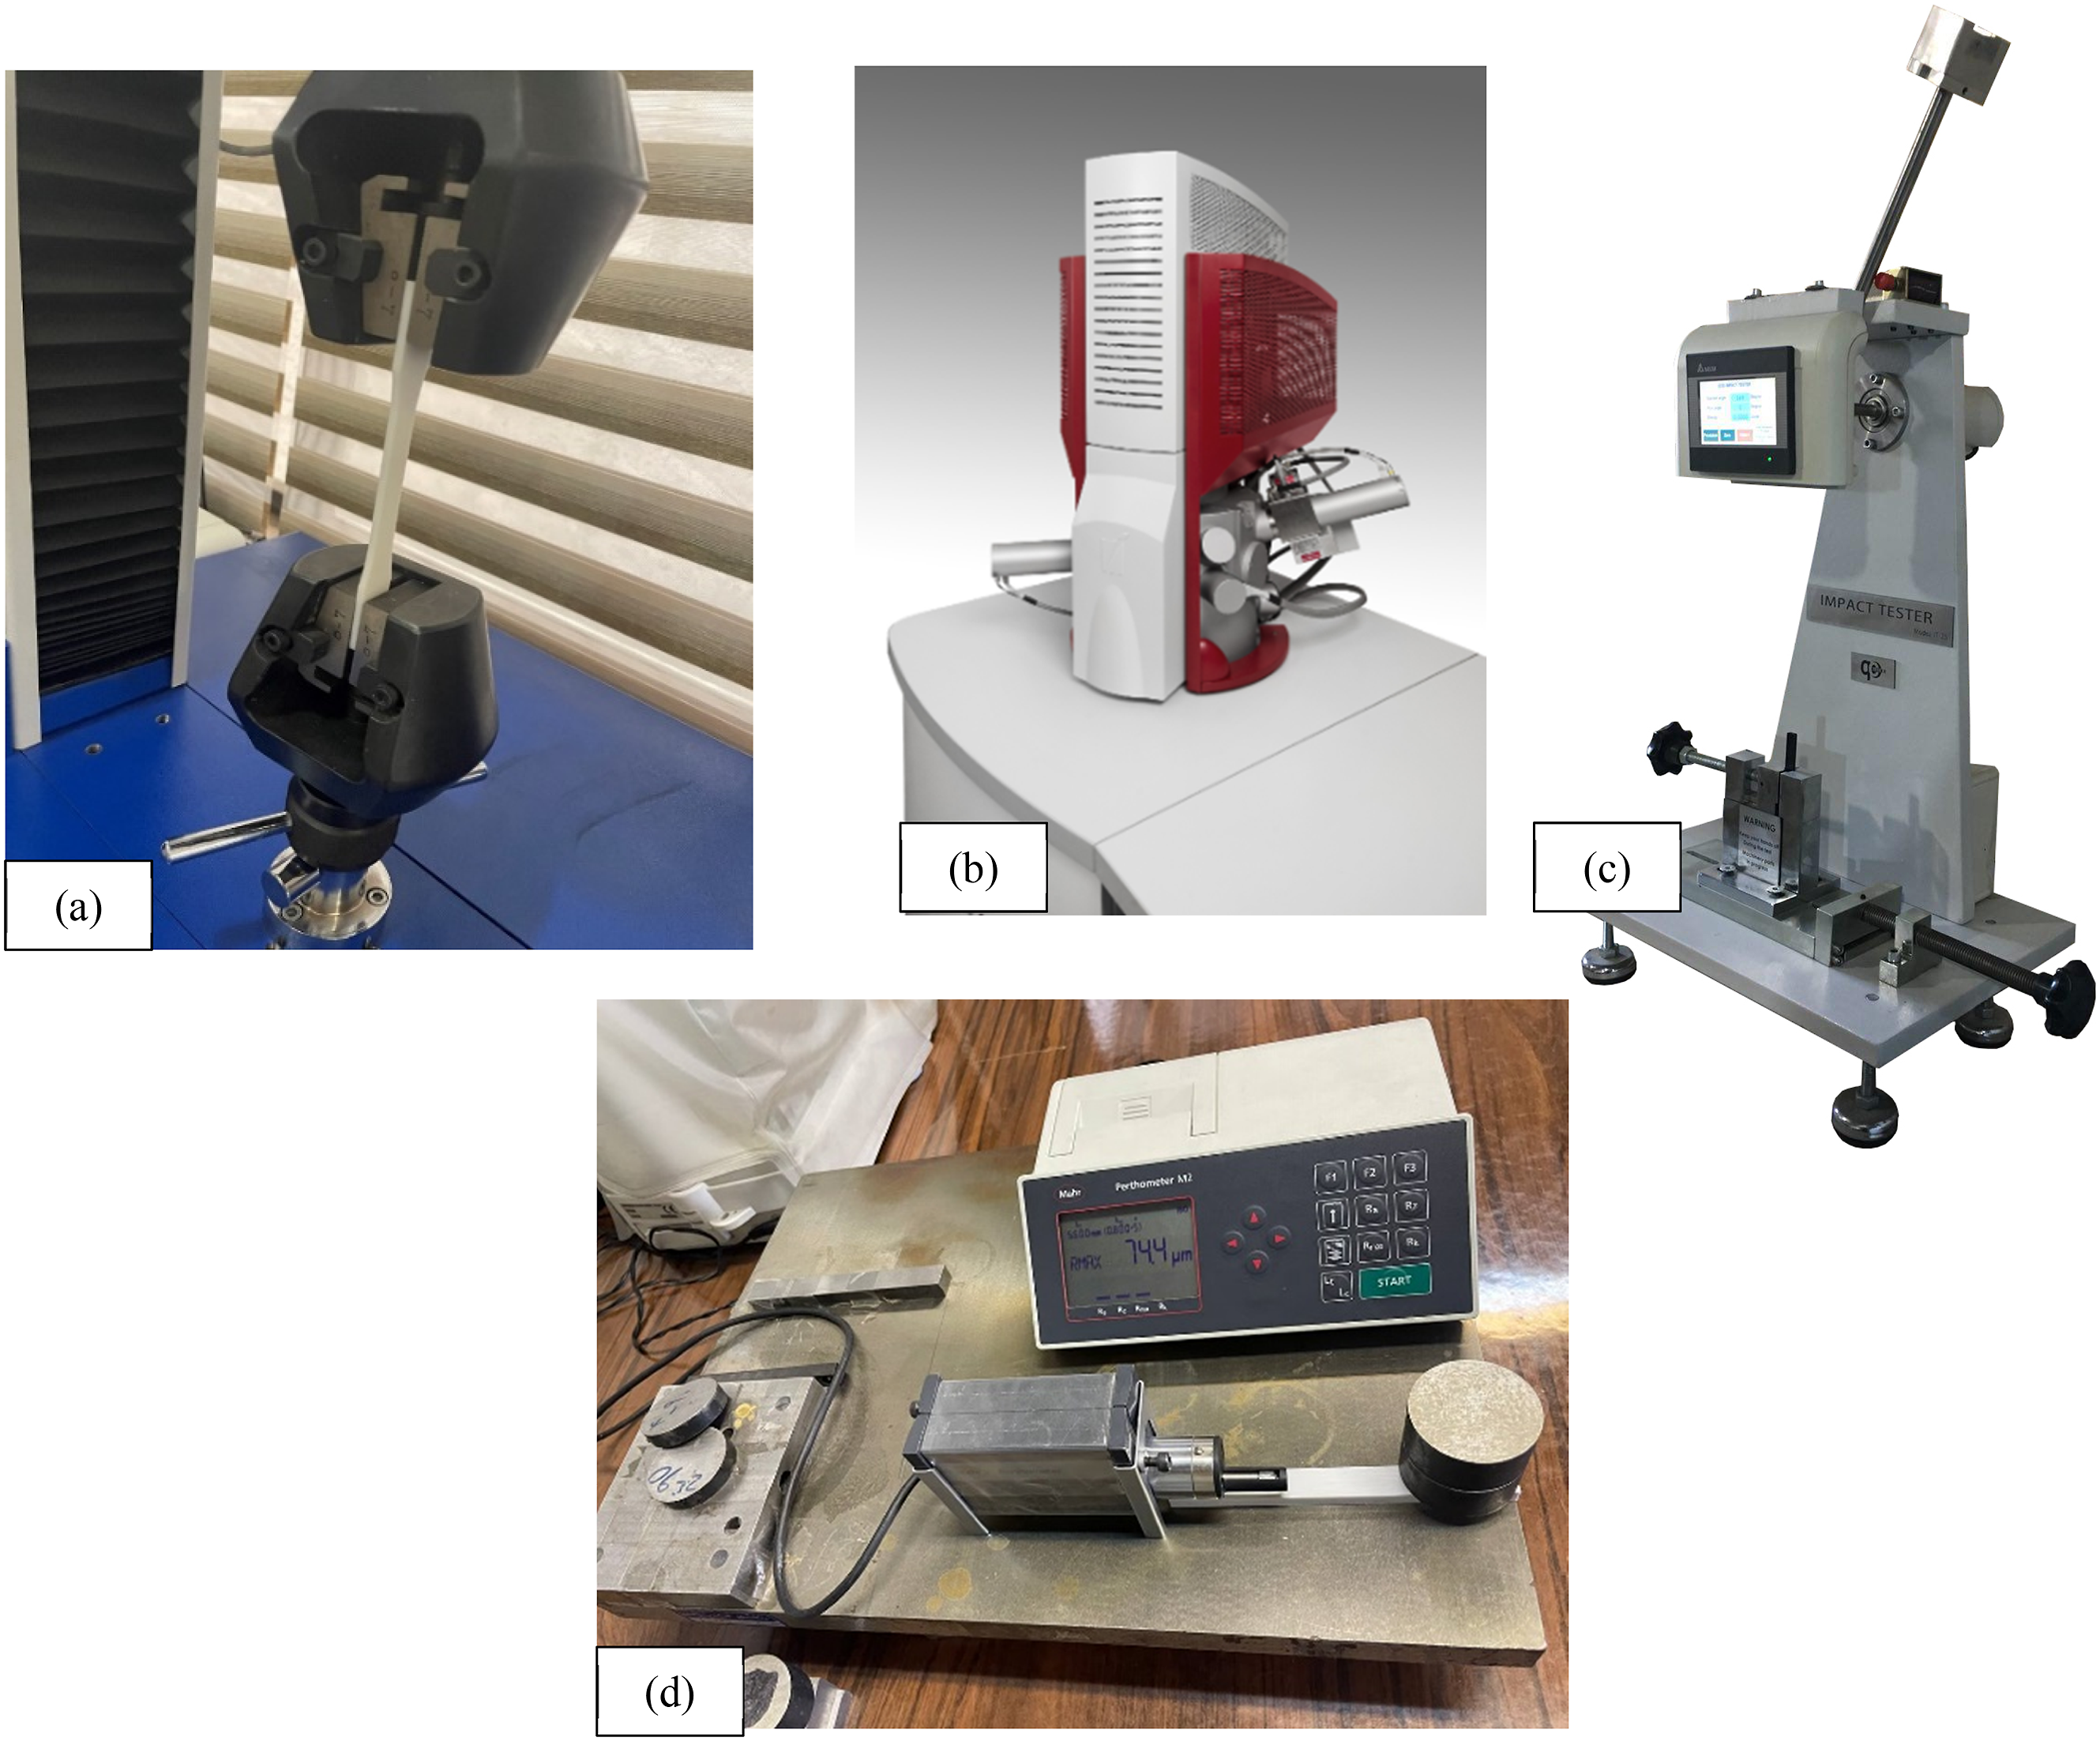
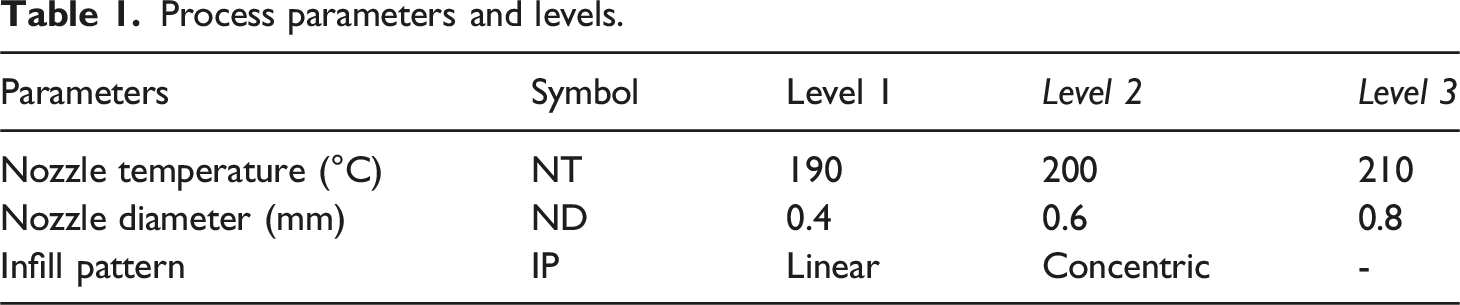
Process parameters and levels.
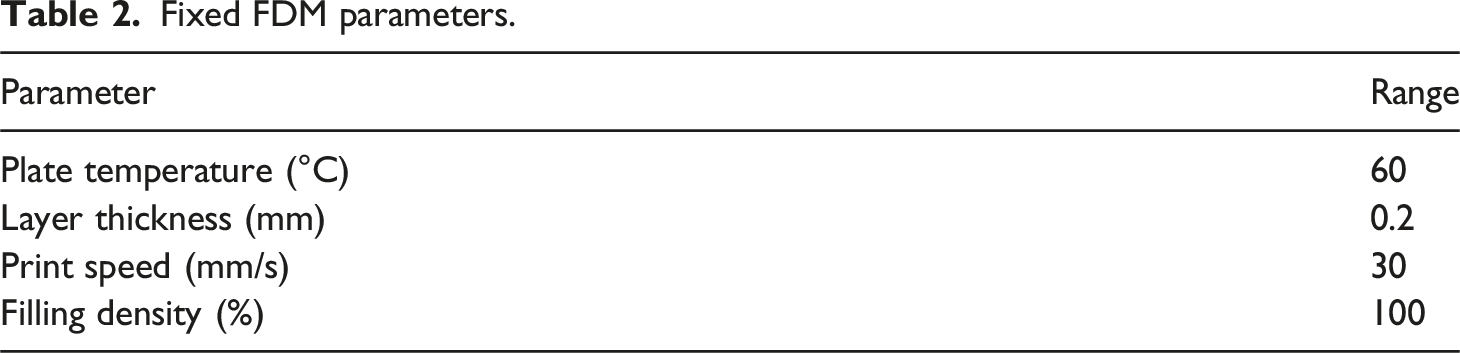
Fixed FDM parameters.
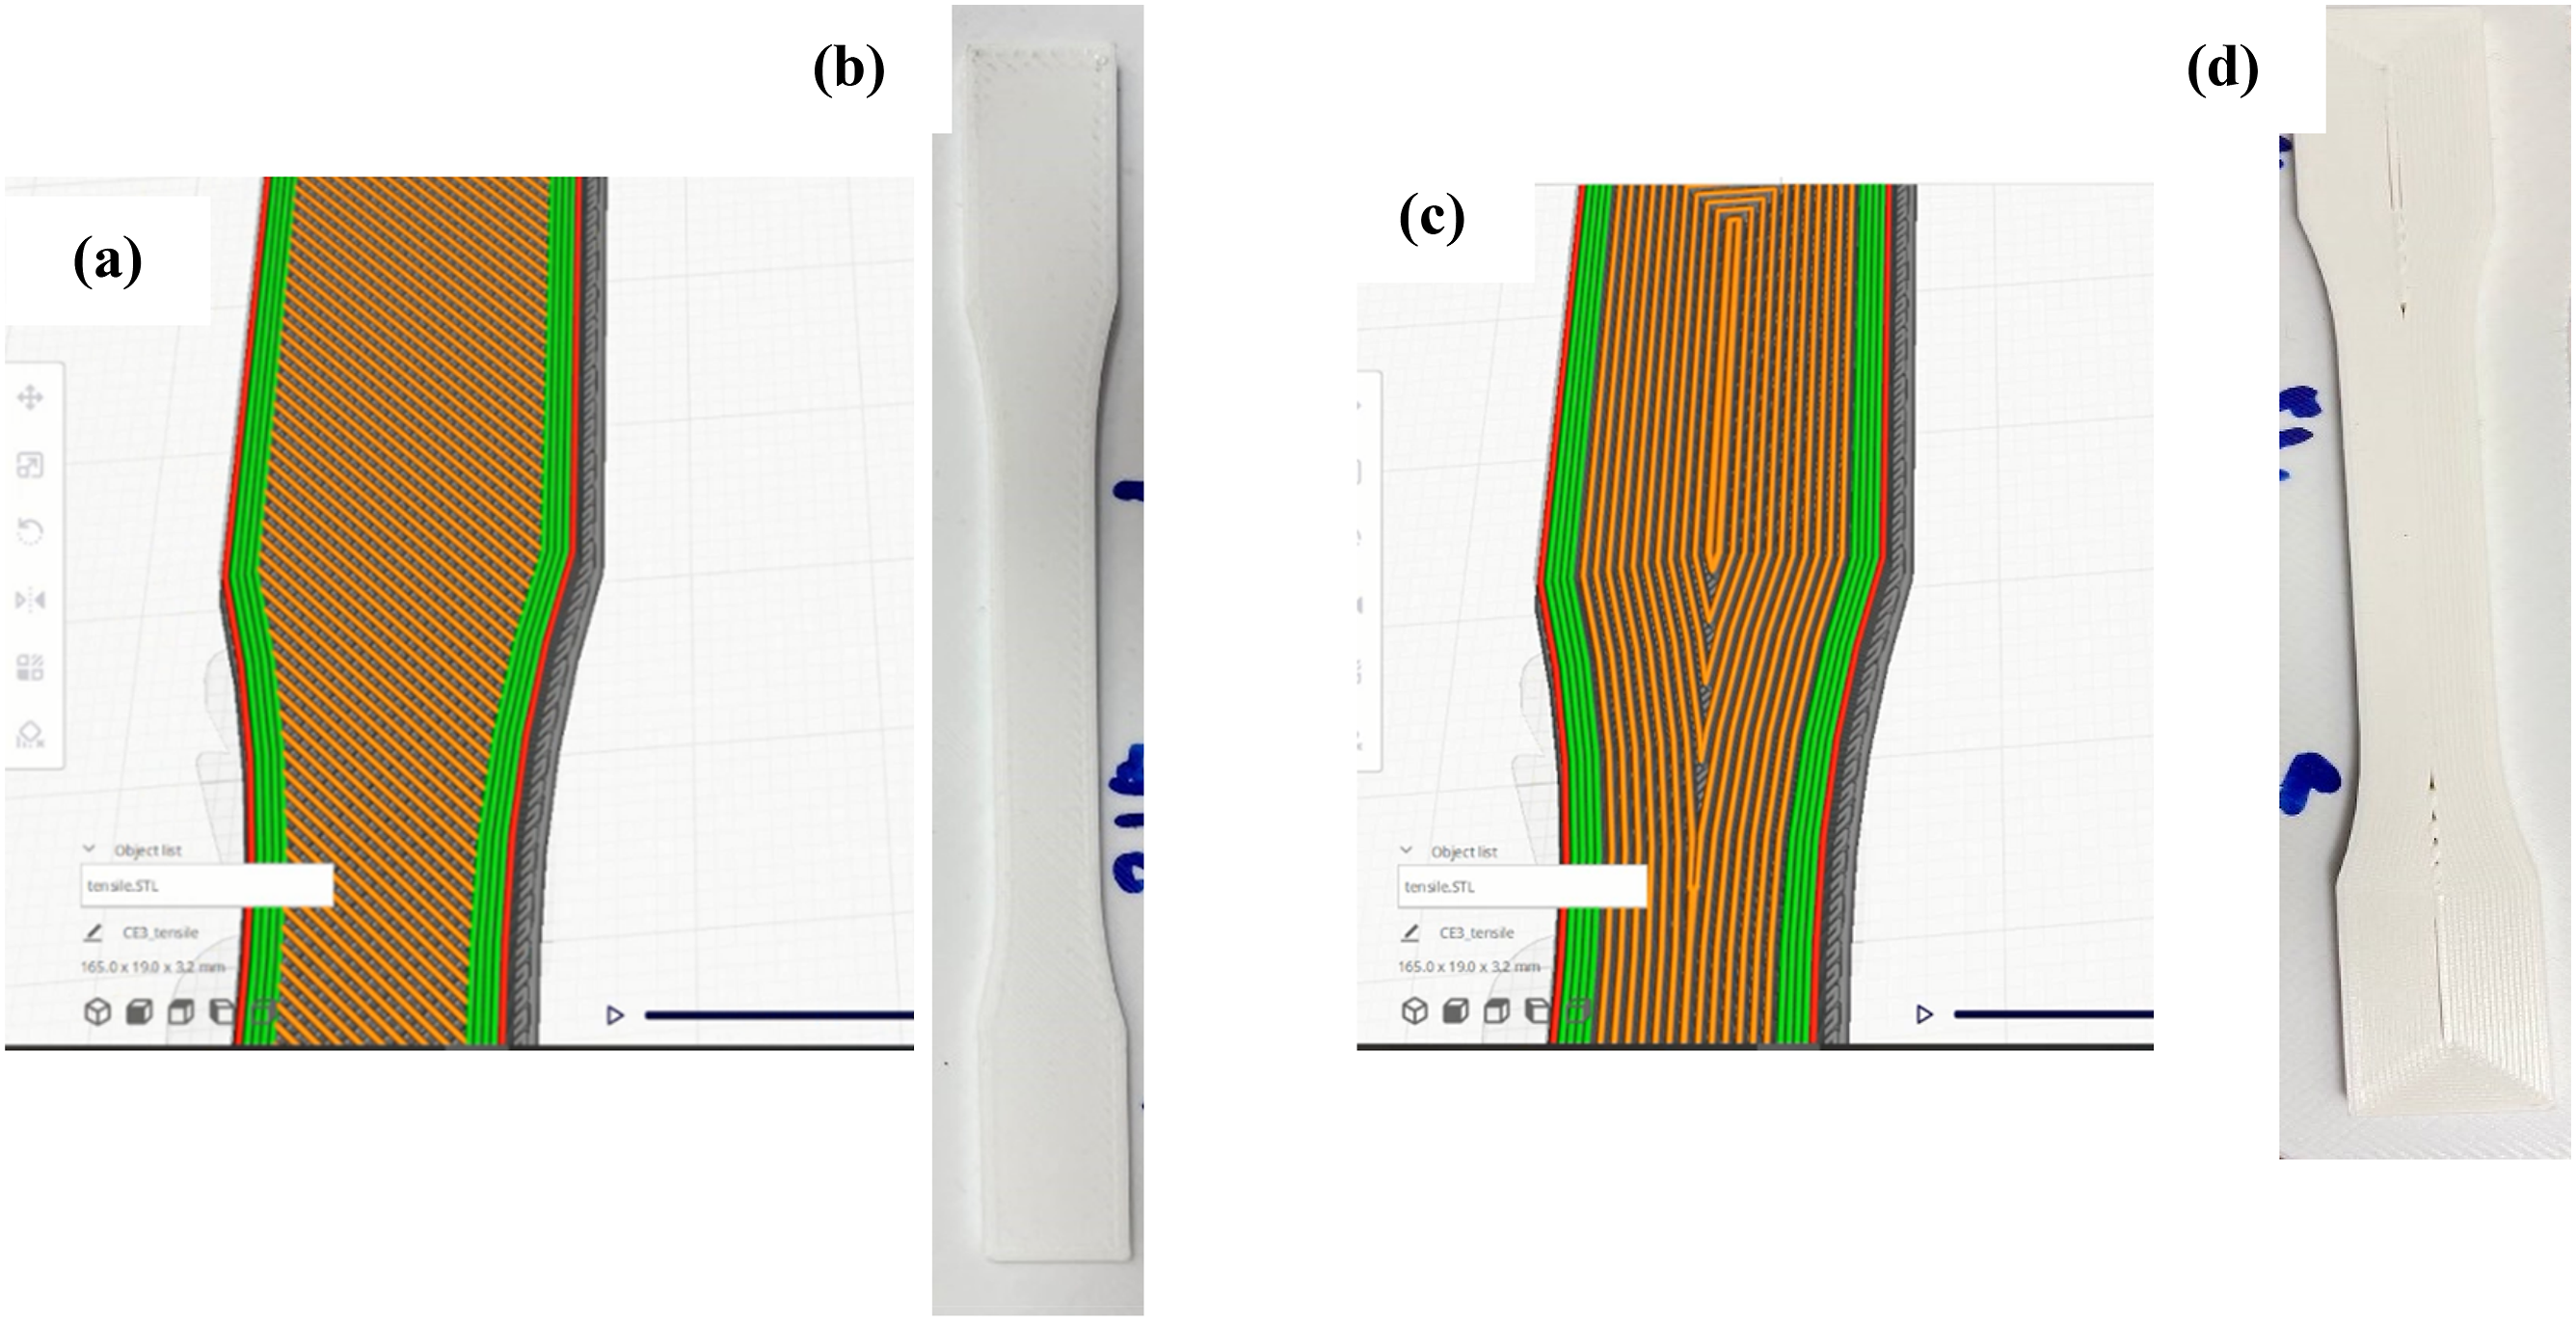
(a) linear infill pattern in Cura software, (b) printed specimen by linear infill pattern, (c) concentric infill pattern in Cura software, (d) printed specimen by concentric infill pattern.
Printing speed significantly influences the material’s flow behavior and the bonding between layers. Higher speeds can lead to increased void content and weaker inter-layer bonding due to insufficient time for the material to properly fuse. Lower speeds, in contrast, generally promote better layer adhesion and strength but may increase the risk of overheating, affecting viscosity and flow. Therefor, printing speed of 30 mm/s was selected for this study based on the previous researches.33,34
The build plate temperature primarily influences the cooling rate of the deposited layers and the crystallinity of the material, especially in materials like PLA. A higher plate temperature can reduce warping and improve adhesion with the initial layer, enhancing the overall strength and dimensional accuracy of the part. The plate temperature of 60°C was the best optimal temperature for printing PLA material. 33
Meanwhile, layer thickness also impacts the surface roughness and void content. Thinner layers tend to improve surface finish but may increase printing time, while thicker layers can accelerate the process but compromise the part’s surface quality. In this study according to the previous researches, 0.2 mm was applied.35,36
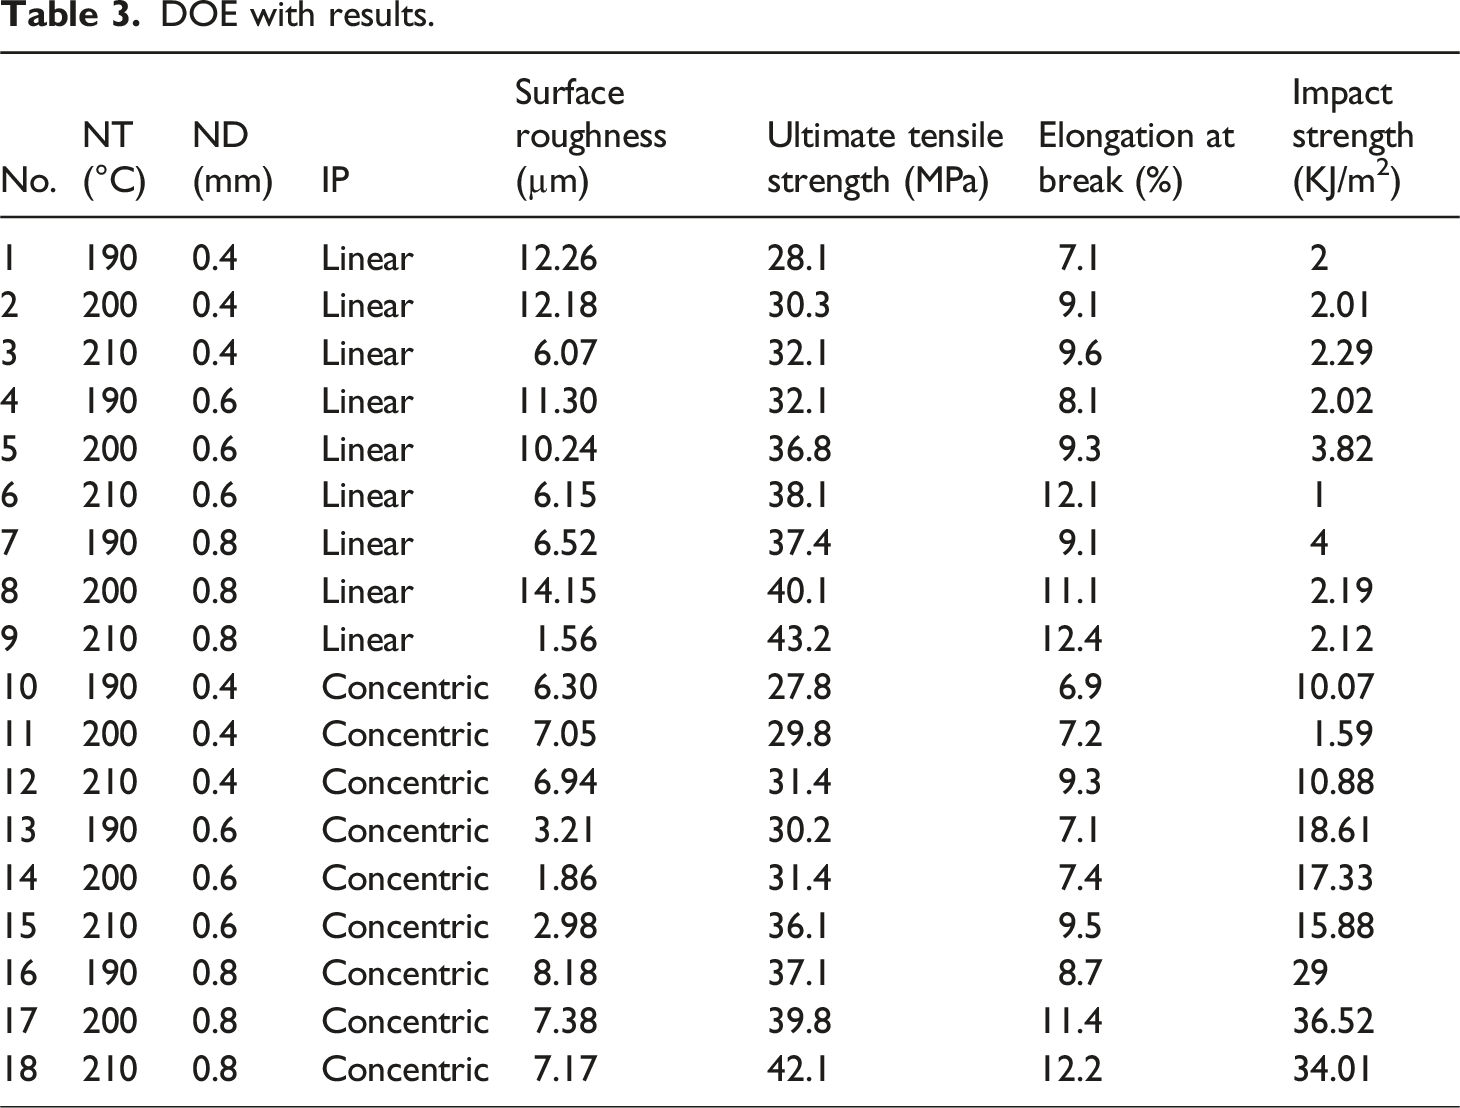
DOE with results.
Results and discussion
The FDM-built specimens were prepared and characterized for mechanical properties such as tensile and impact strength. In addition, surface roughness tests were conducted on the specimens. Examining each of the specifications is in the following:
Tensile behavior
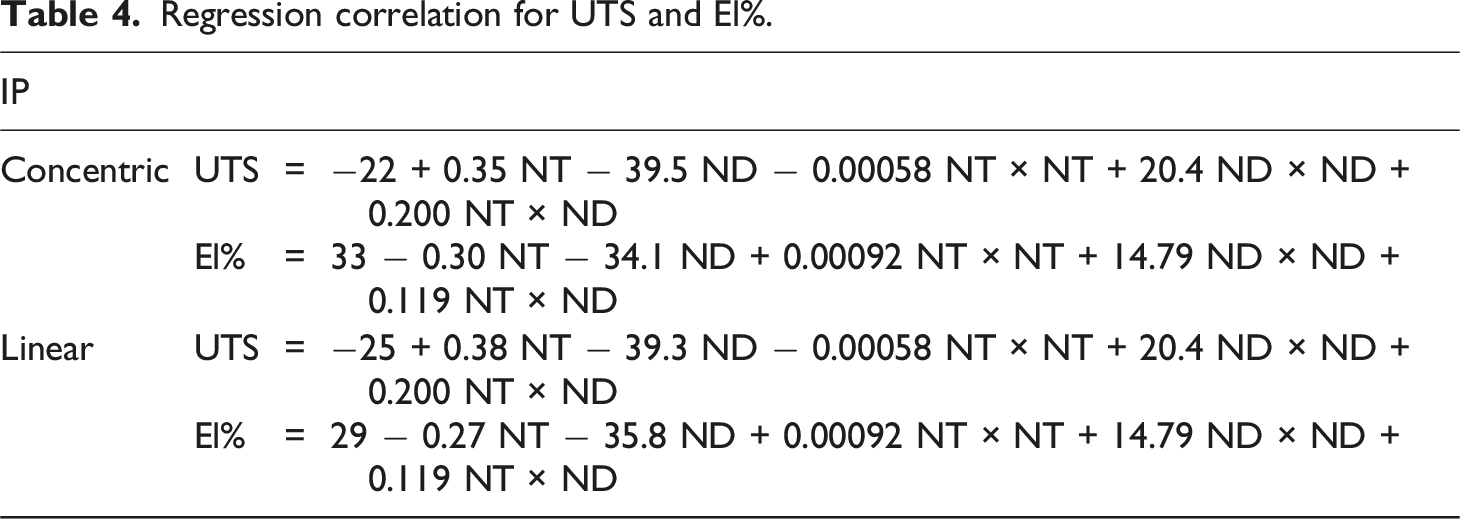
Regression correlation for UTS and El%.
ANOVA for UTS and El%.
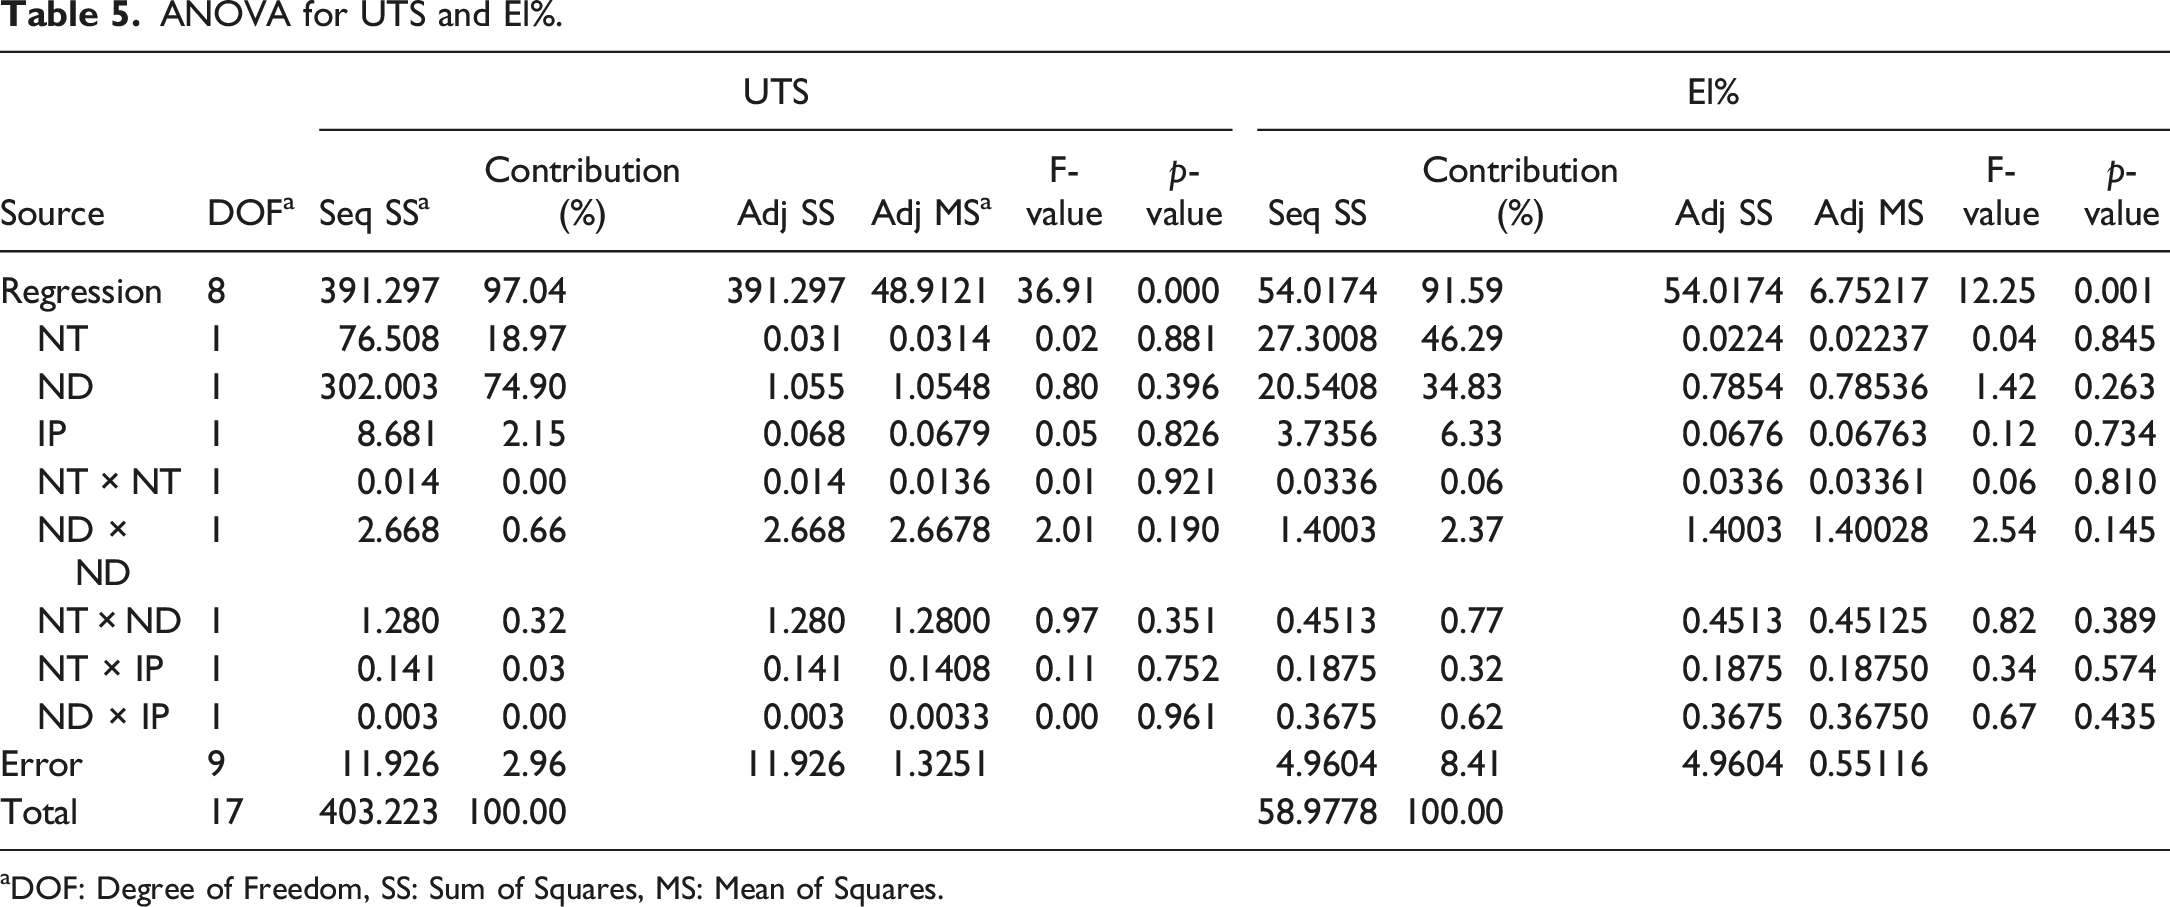
aDOF: Degree of Freedom, SS: Sum of Squares, MS: Mean of Squares.
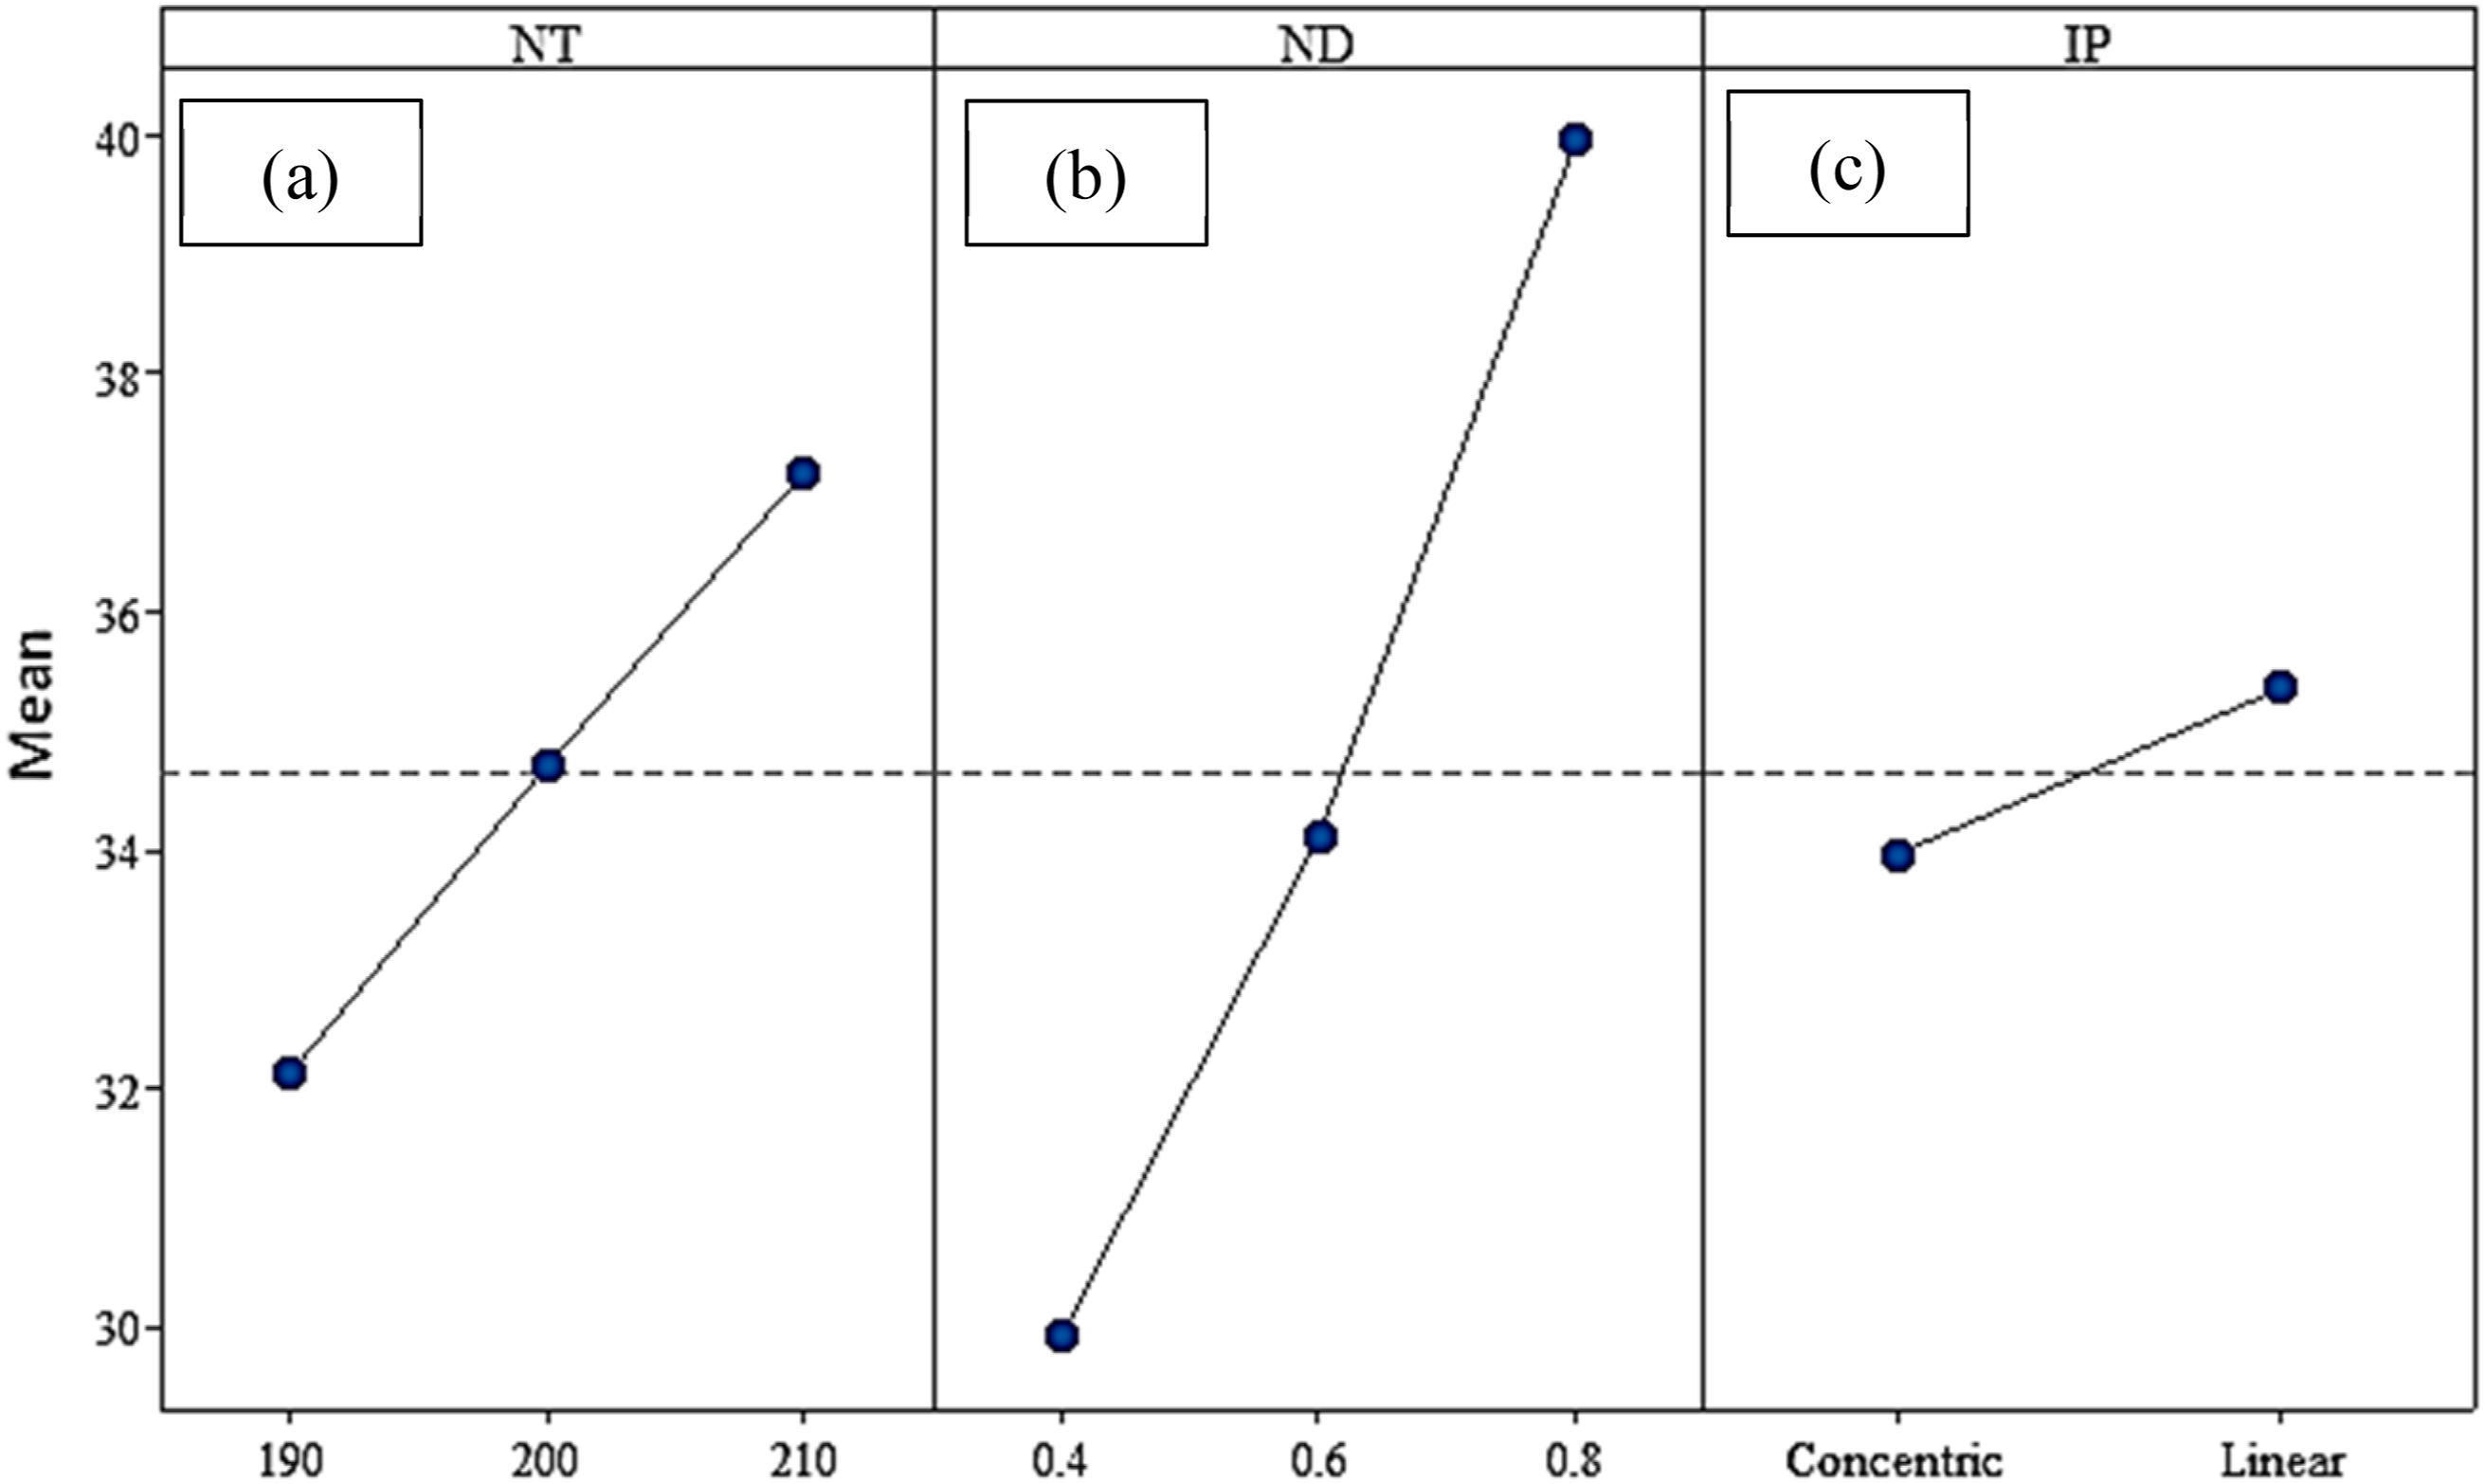
The main effects plot for UTS.
The main effects plot for the obtained results from the tensile tests are demonstrated in Figures 7 and 8. The main effects plot for El%.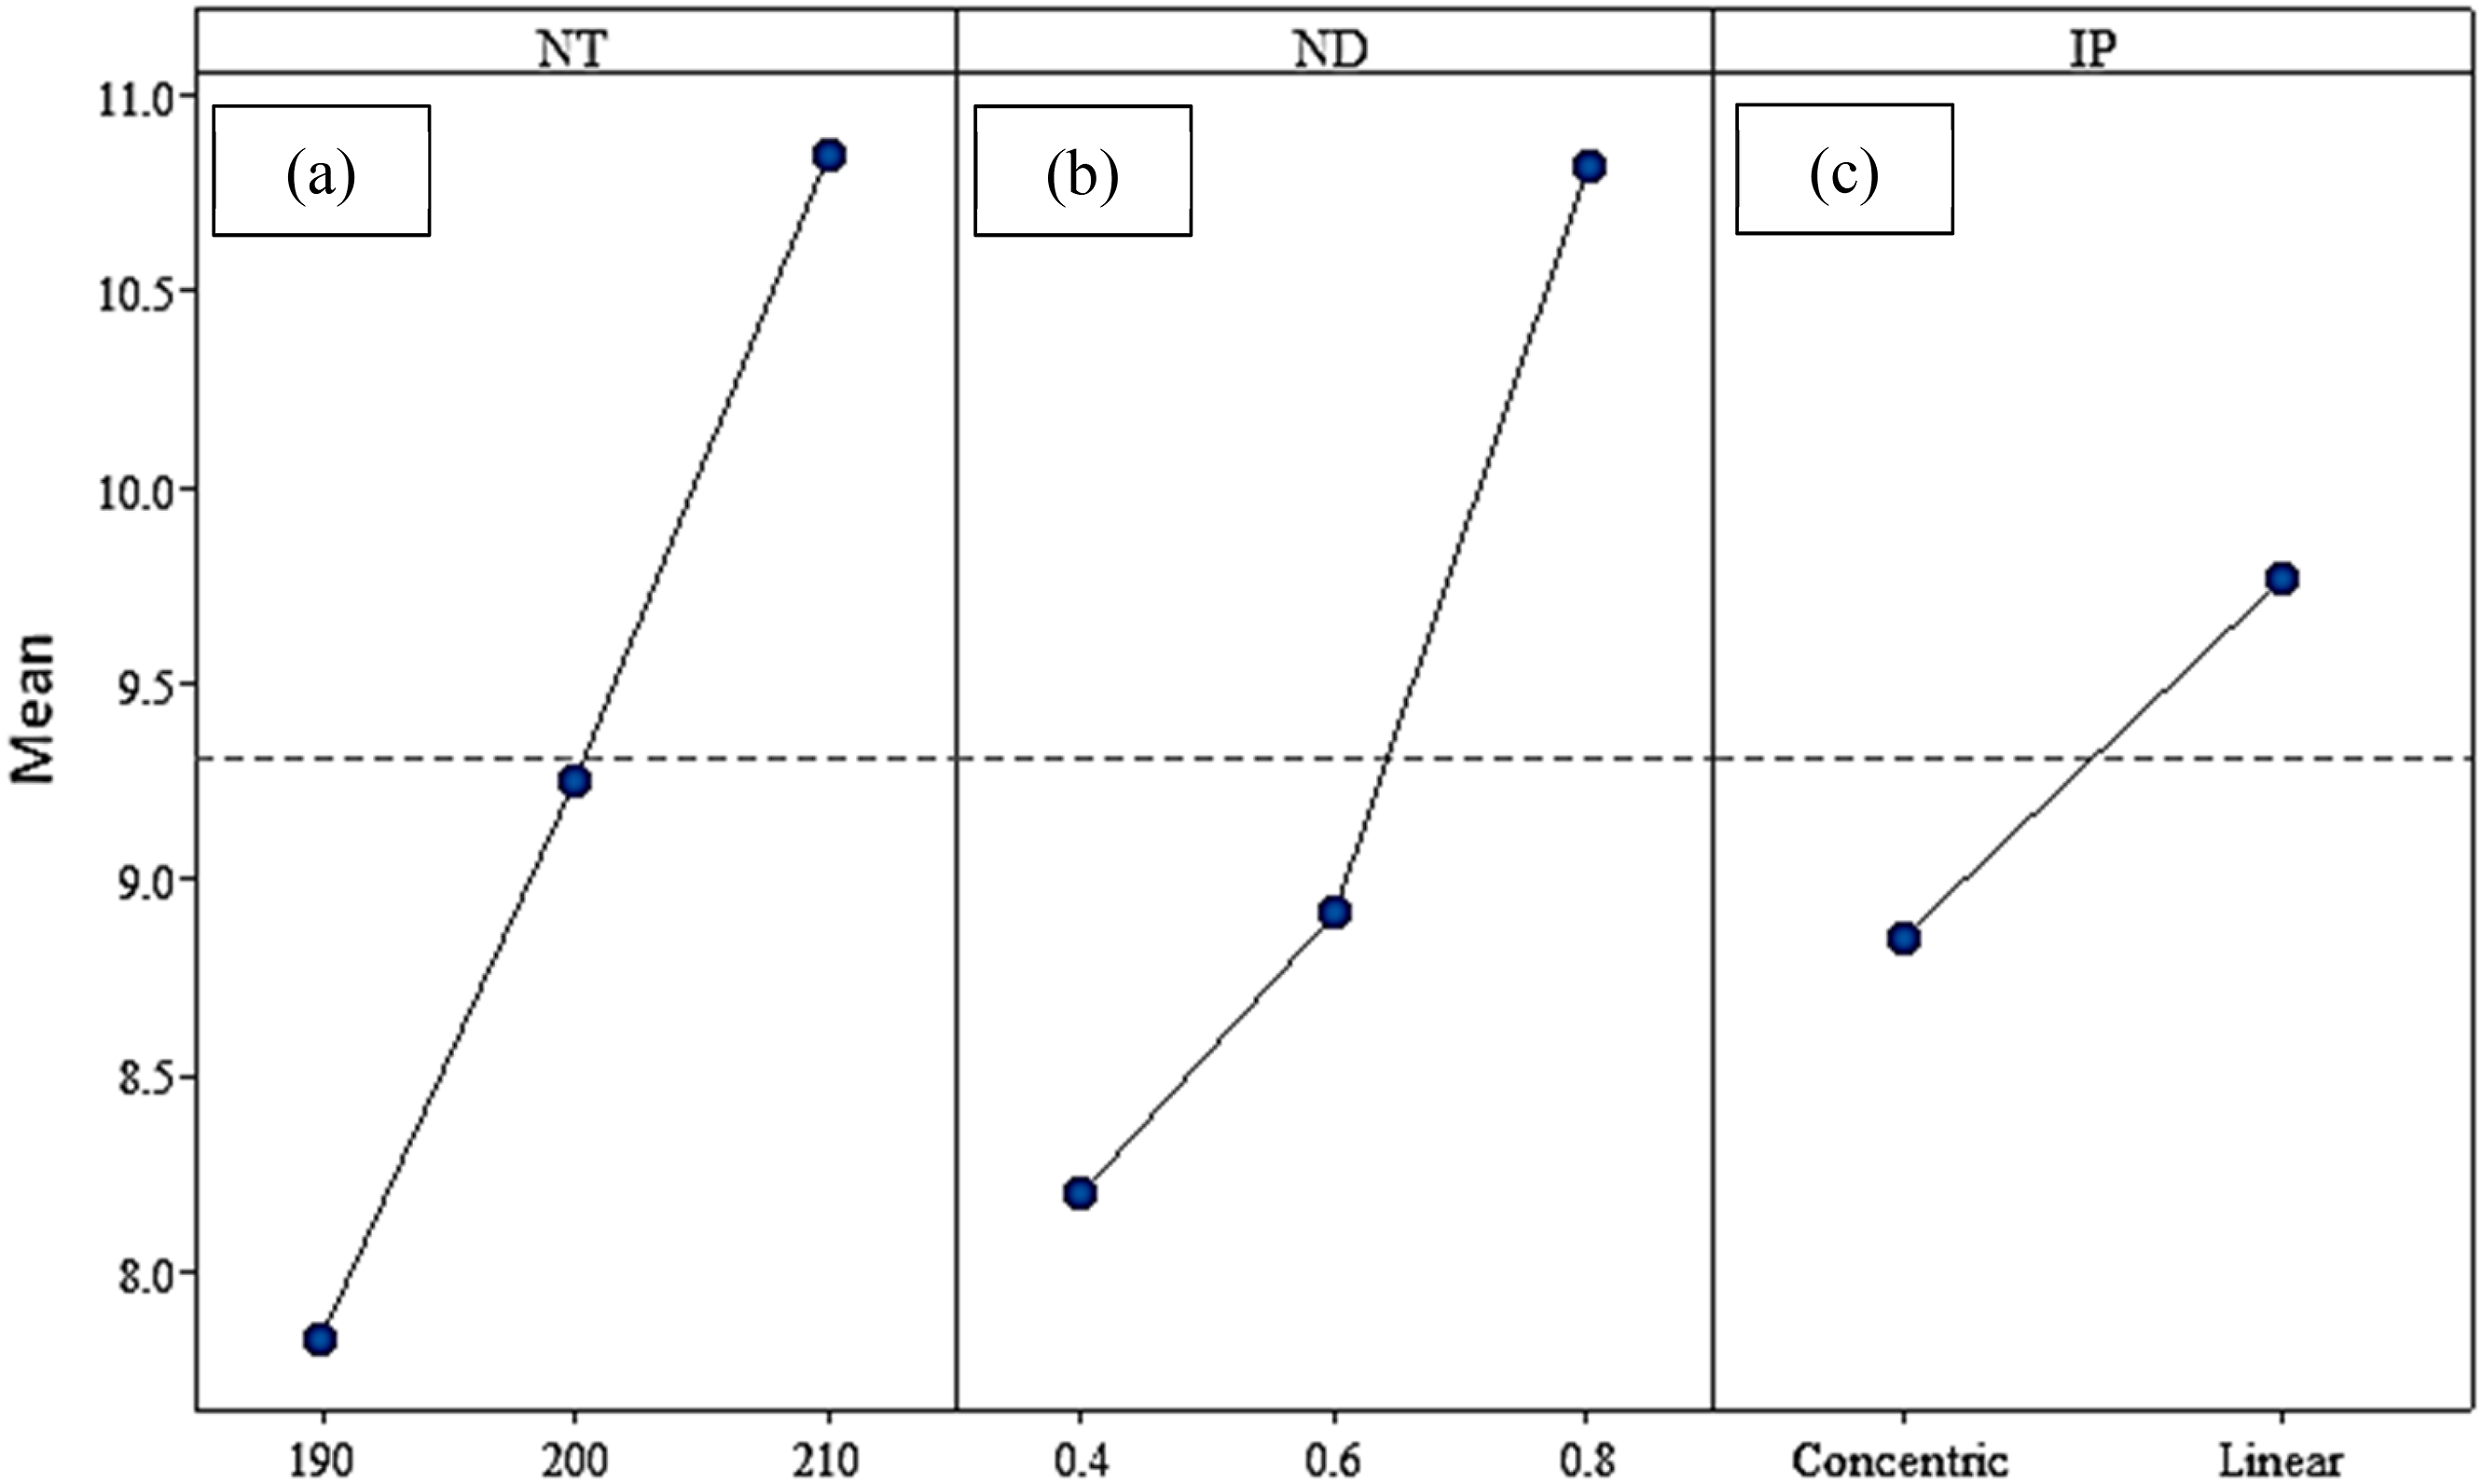
To enhance the mechanical characteristics, the fusion of the new layer with the existing layers occurs prior to the extruded filament reaching its glass transition temperature. The longer the filament remains at a higher temperature than its glass transition level, the stronger the bond becomes. PLA, with a lower glass transition temperature and heat conduction coefficient, achieves better fusion with the surrounding layers and filaments. As shown in Figures 7(a) and 8(a), by increase in nozzle temperature, the UTS and El% have been increased. Increasing the nozzle temperature leads to more crystallization, enhanced bonding of the layers and higher fluidity. At elevated temperatures, the viscosity of molten PLA decreases, enabling the bonding of the newly added PLA fiber to the extruded one. As a result, the width of the bond between the extruded layers increases, leading to a strengthening of the overall structure.
39
In addition, Figure 9 demonstrates that increasing the nozzle temperature from 190°C to 210°C results in a noticeable reduction in the formation of air pores within the printed part. For instance, some air pores have been indicated in Figure 9. On the other hand, Figure 9 shows that increasing nozzle diameter causes the change in fracture type from brittle to ductile which indicates increasing El% value. This reduction in porosity enhances the overall density of the material, which directly contributes to an increase in UTS. The decreased number of air pores at higher temperatures is likely due to improved melt flow and layer fusion, as higher temperatures reduce the viscosity of the PLA, allowing for better layer adhesion and fewer voids between deposited strands. The reduction in air pores minimizes weak points within the structure, leading to more uniform stress distribution during tensile loading, which consequently enhances the UTS. Furthermore, the SEM images indicate that increasing the nozzle diameter affects the fracture behavior of the material. As the nozzle diameter increases, there is a transition from brittle to ductile fracture modes. This change suggests that the larger nozzle diameter facilitates greater elongation at break (El%), which is attributed to the increased flow rate of the molten material. A larger nozzle diameter allows for more material to be deposited per layer, leading to thicker and stronger bonds between layers. This results in a more ductile failure mode, where the material can undergo greater deformation before fracturing, as opposed to the brittle failure seen with smaller nozzle diameters. The enhanced ductility and reduced brittleness at larger diameters lead to improved overall mechanical performance, particularly in terms of elongation and energy absorption during deformation. SEM images from cross section of the tensile test specimen in nozzle temperature of (a) 190°C and (b) 210°C.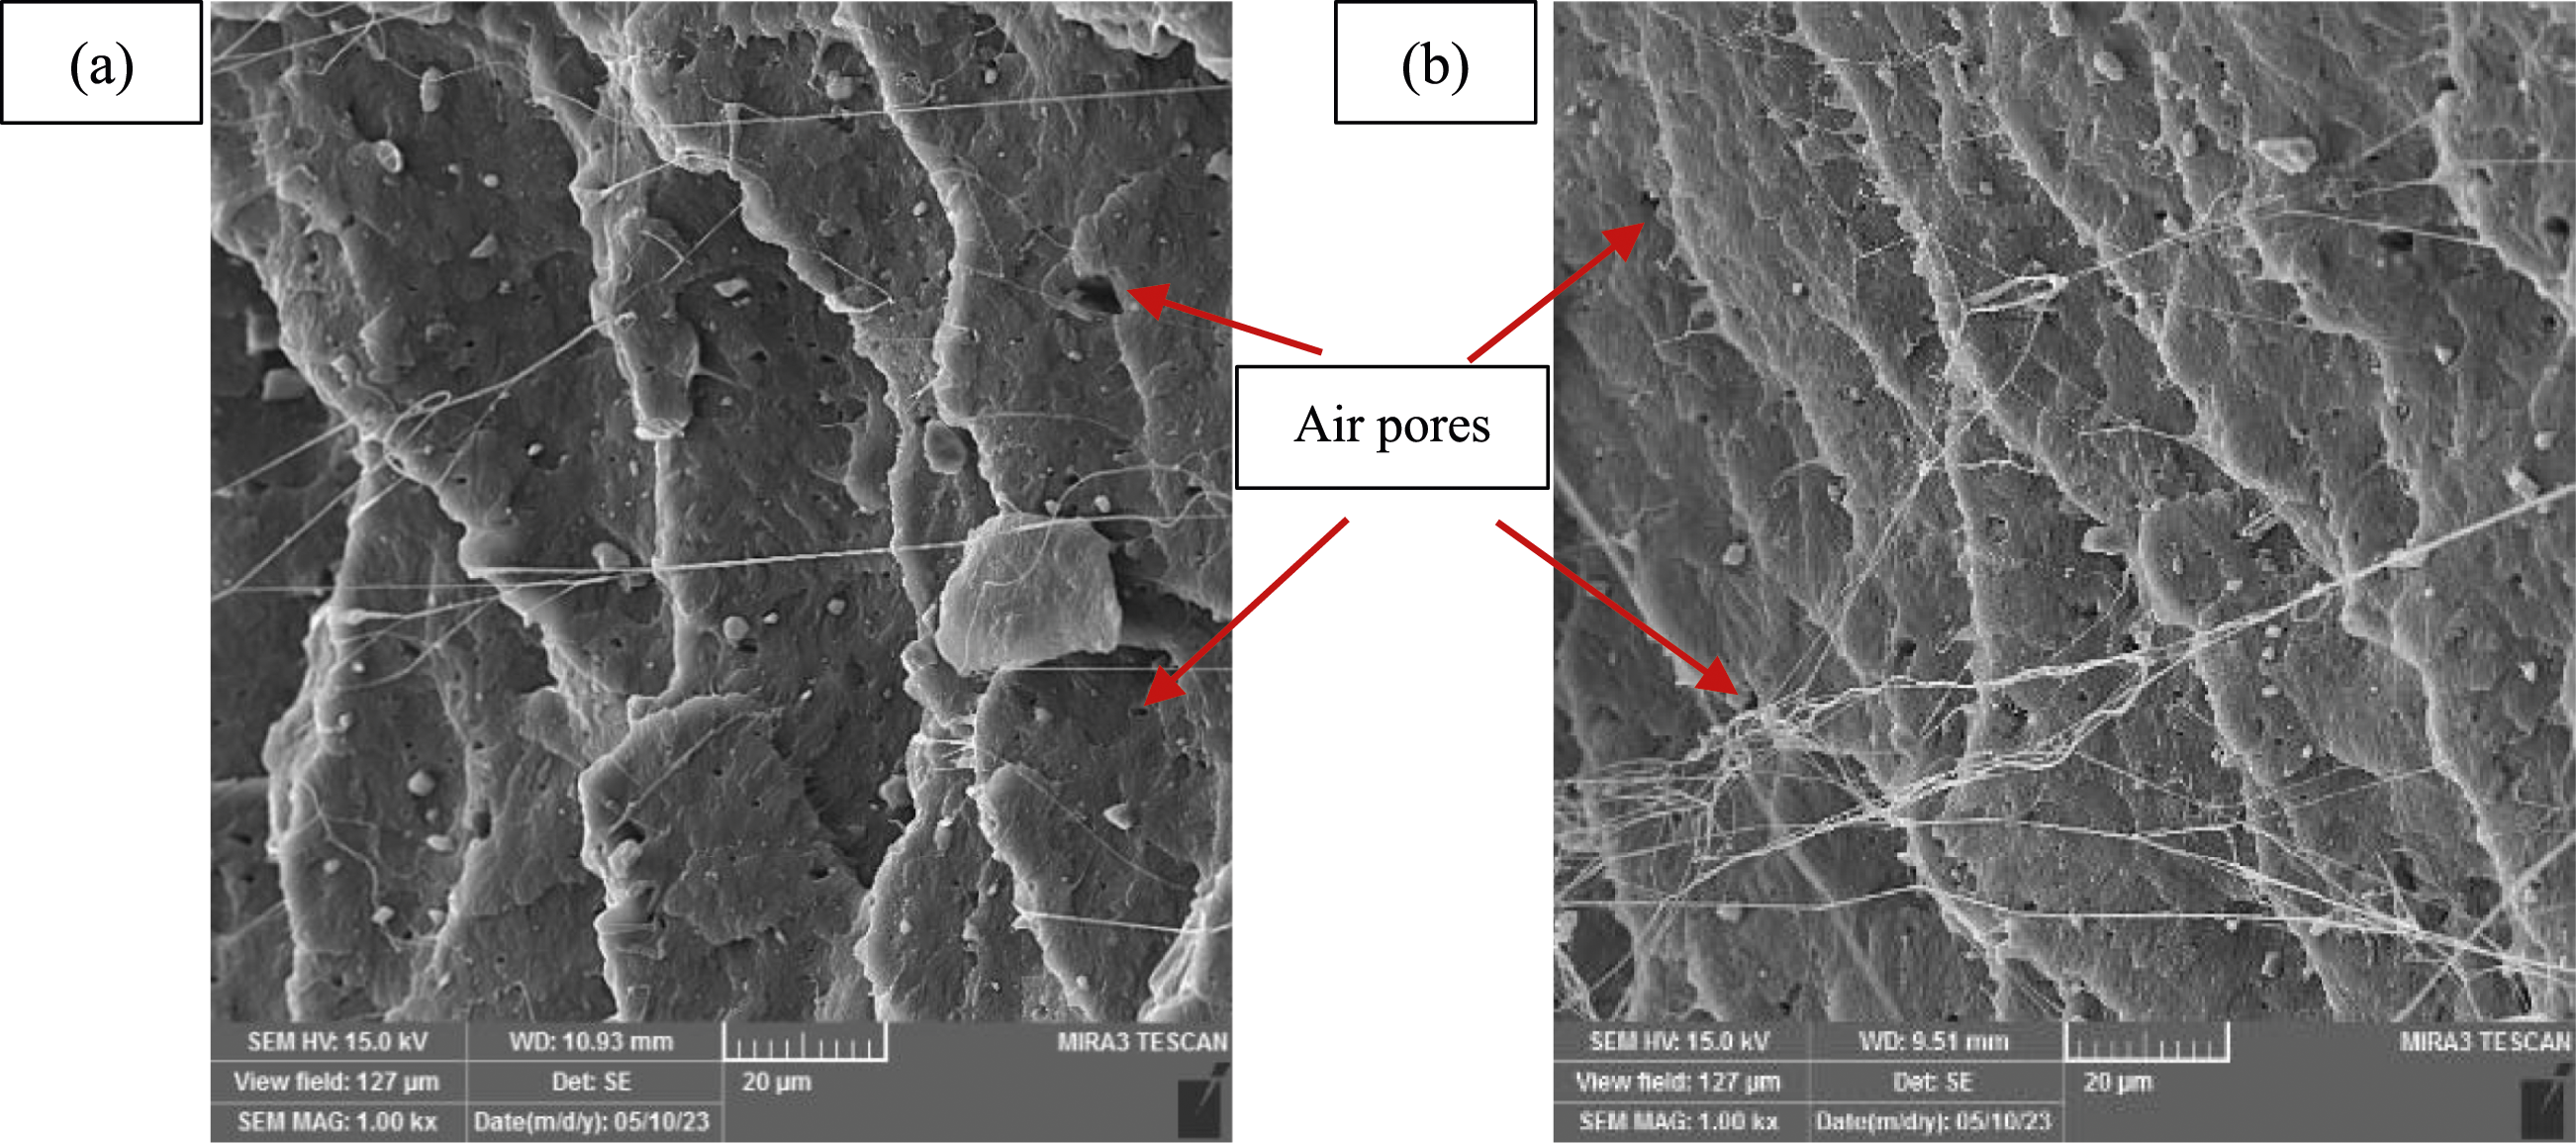
Based on Figures 7(b) and 8(b), nozzle diameter increase induces larger UTS and El% value. The larger nozzle diameter, has a direct effect on melt flow. By increasing the melt flow, density of the micro-holes in the interface layers decreases and leads to producing the parts with larger density. Figure 10 demonstrates the SEM picture of the generated micro-holes in the specimens at different nozzle diameters. Lower number of micro-holes at lower nozzle diameter induce larger UTS value. Besides, Vicente et al.
40
provided an explanation for this phenomenon, attributing it to the gravitational force that aids in the dispersion of the molten plastic. They further noted that this process is particularly effective when dealing with larger nozzle sizes. On the other hand, based on the Figure 10, the material deformation at larger nozzle diameters is more ductile which indicated the larger El% value. SEM images from cross section of the tensile test specimen in nozzle diameter of (a) 0.4 mmm (b) 0.8 mm.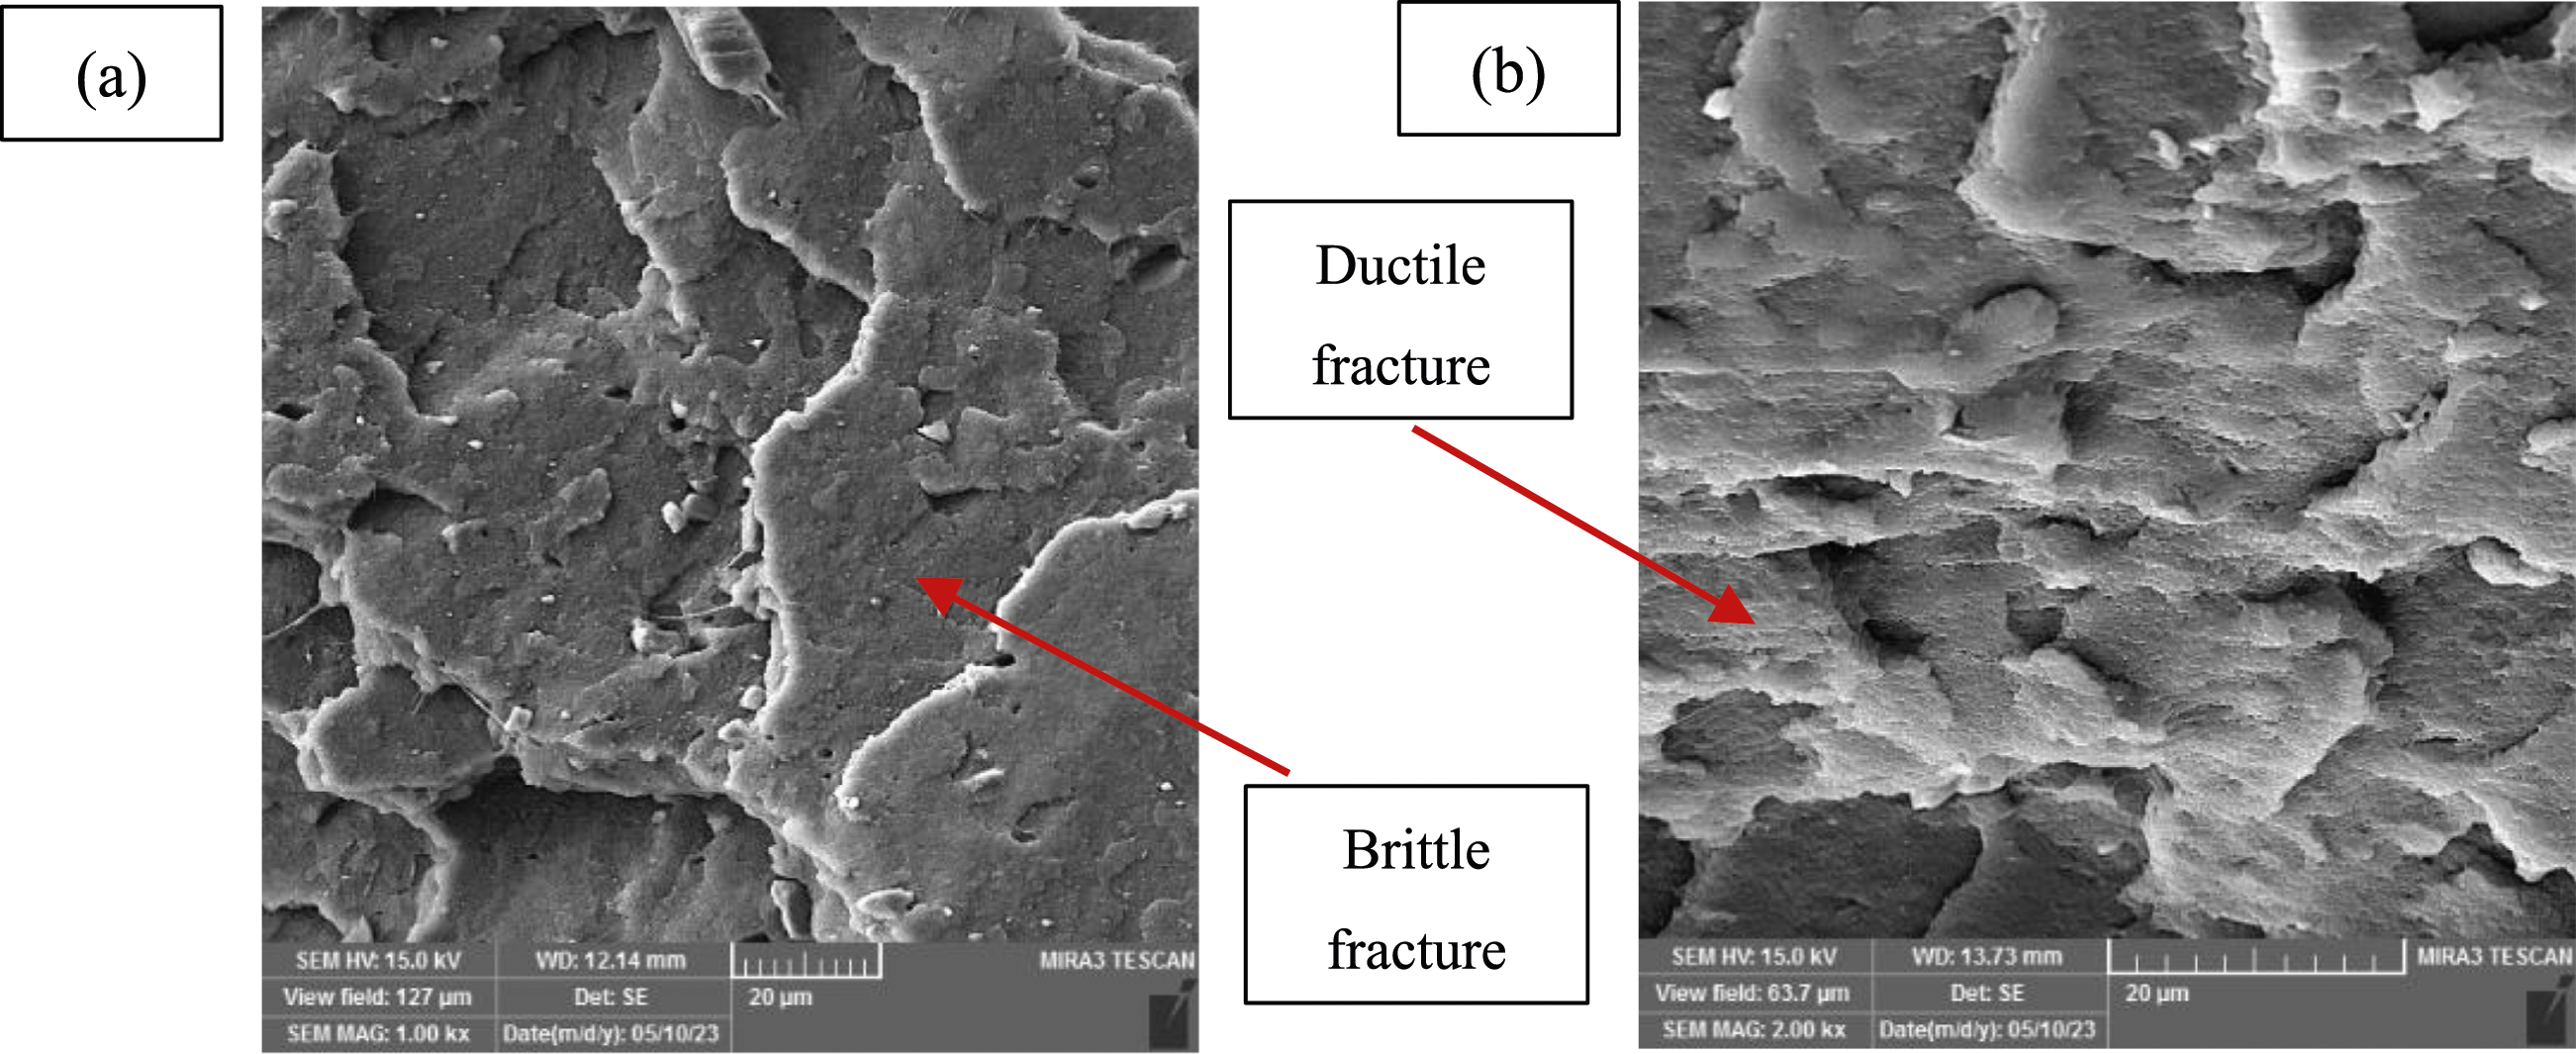
According to Figures 7(c) and 8(c), the linear infill pattern compared to concentric one causes larger UTS and El% values. In concentric infill pattern comparing to linear one, there are larger pores which are related to the infill pattern type (Figure 11). These pores make the concentric infill pattern printed parts weaker and the part has lower UTS and El% values. SEM images from cross section of the tensile test specimen in infill pattern of (a) linear, (b) concentric.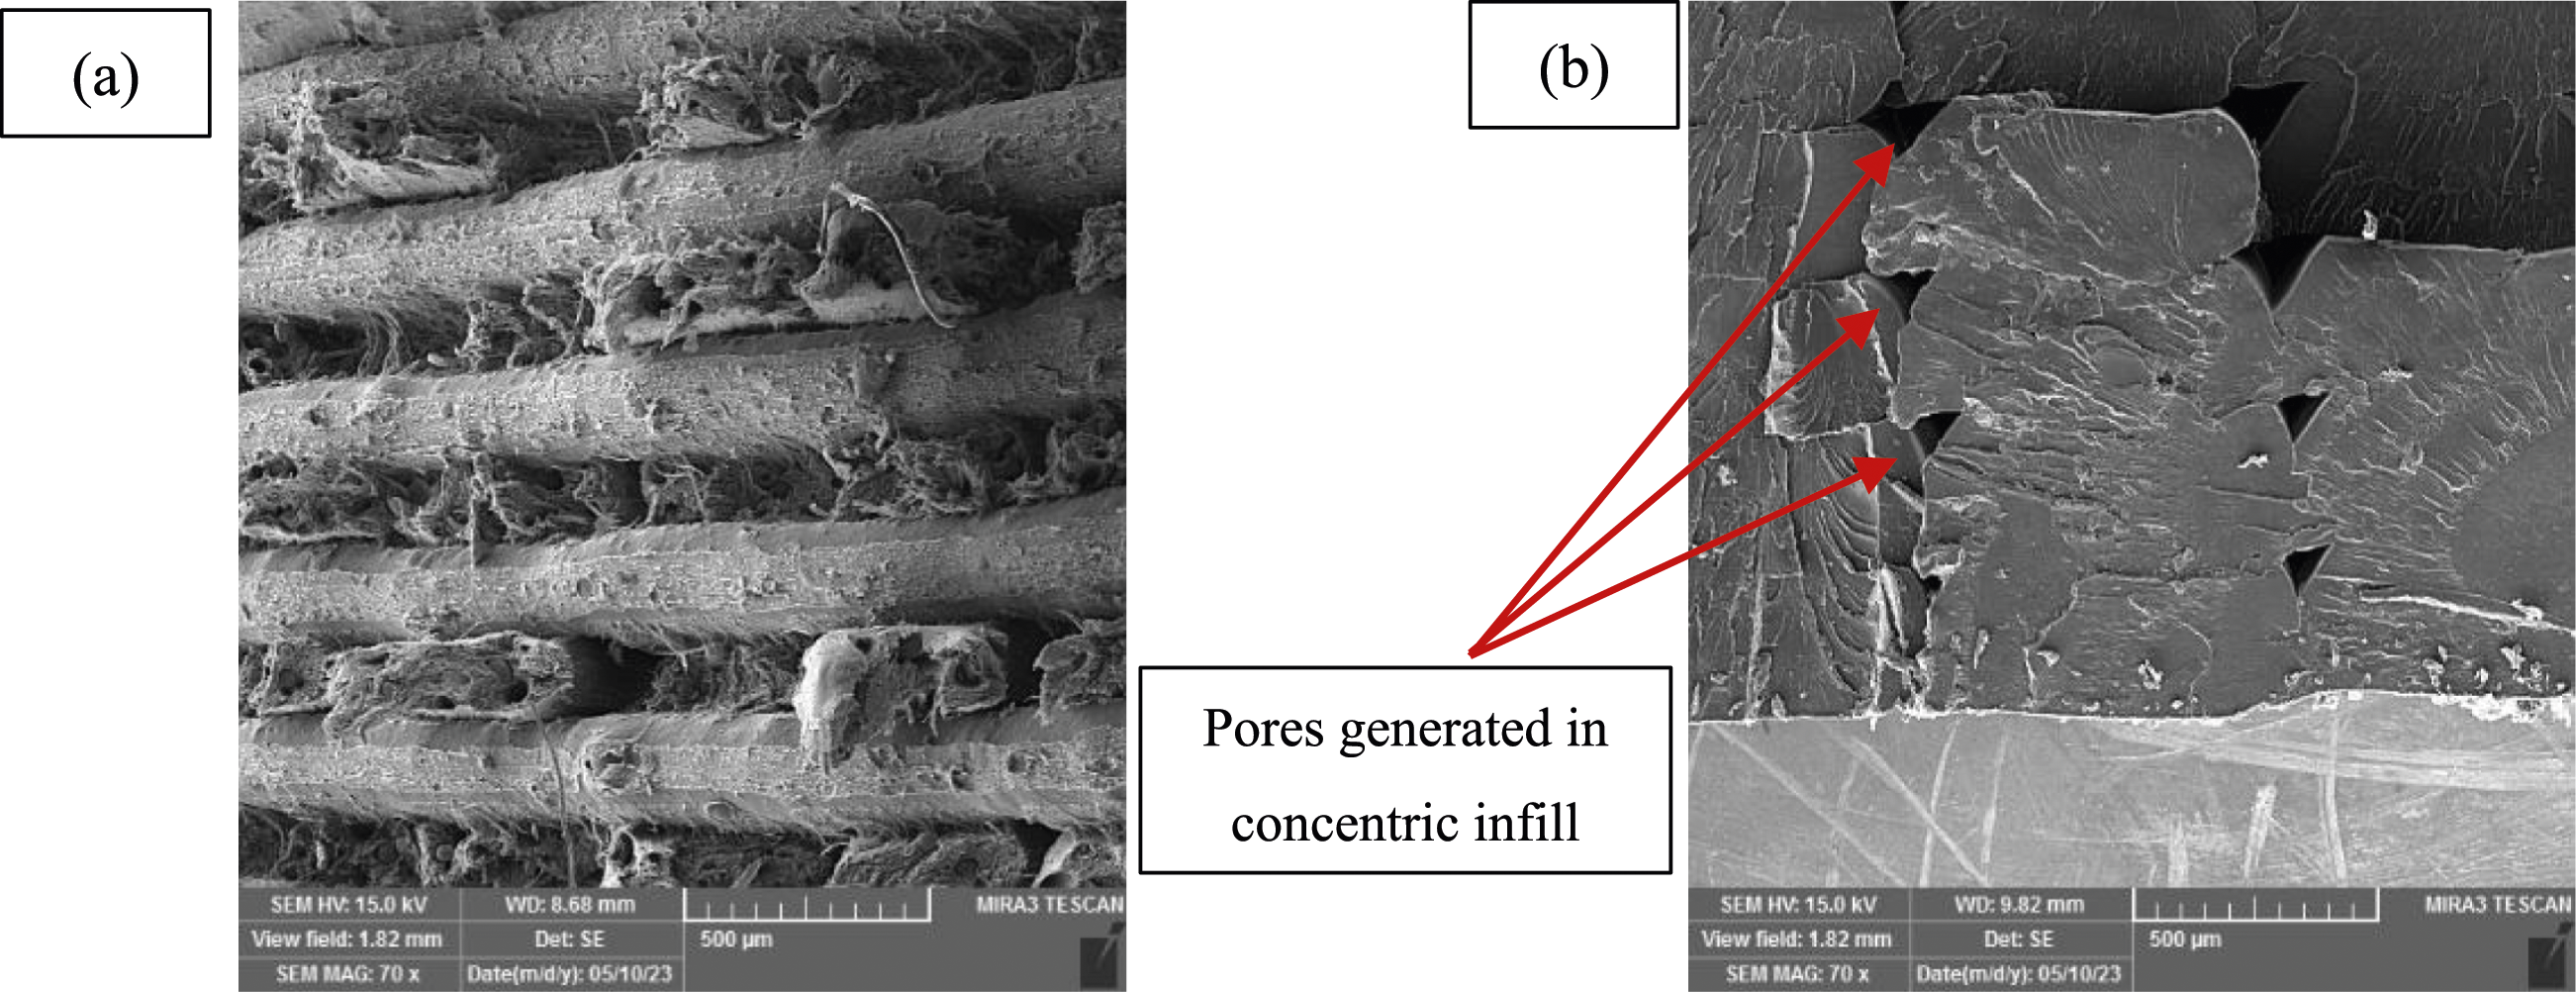
Besides, Lay et al. 41 compared the tensile properties of the PLA material fabricated through FDM and injection molding. That was observed FDM printed PLA exhibits a tensile strength that is approximately 48% lower than that of injection molded PLA. The Young’s modulus of FDM PLA is about 47.2% lower than that of injection molded PLA. This significant reduction indicates that injection molding produces stronger materials due to the high-pressure conditions that promote better entanglement of polymer chains during the process. FDM PLA exhibits an elongation at break that is approximately 32.9% lower compared to injection molded PLA. his reduction indicates that FDM PLA is less ductile, meaning it is more likely to fracture rather than stretch when subjected to tensile forces.
Impact strength
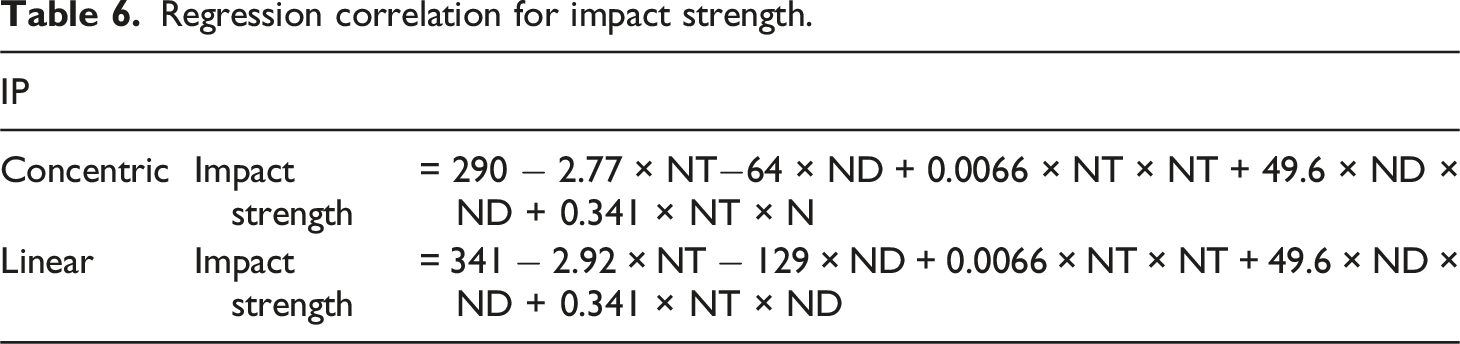
Regression correlation for impact strength.
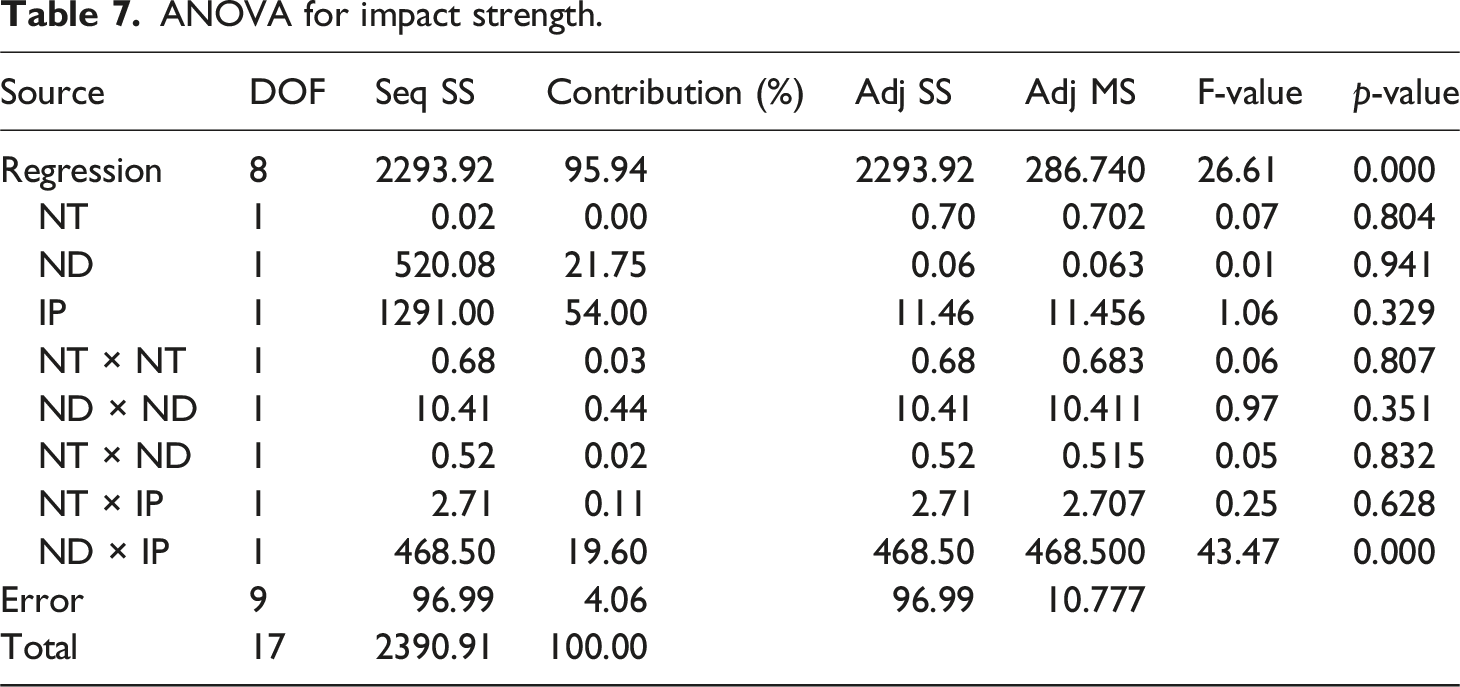
ANOVA for impact strength.
Main effects plot of the FDM process parameters on the impact strength is demonstrated in Figure 12. Main effects plot for impact strength.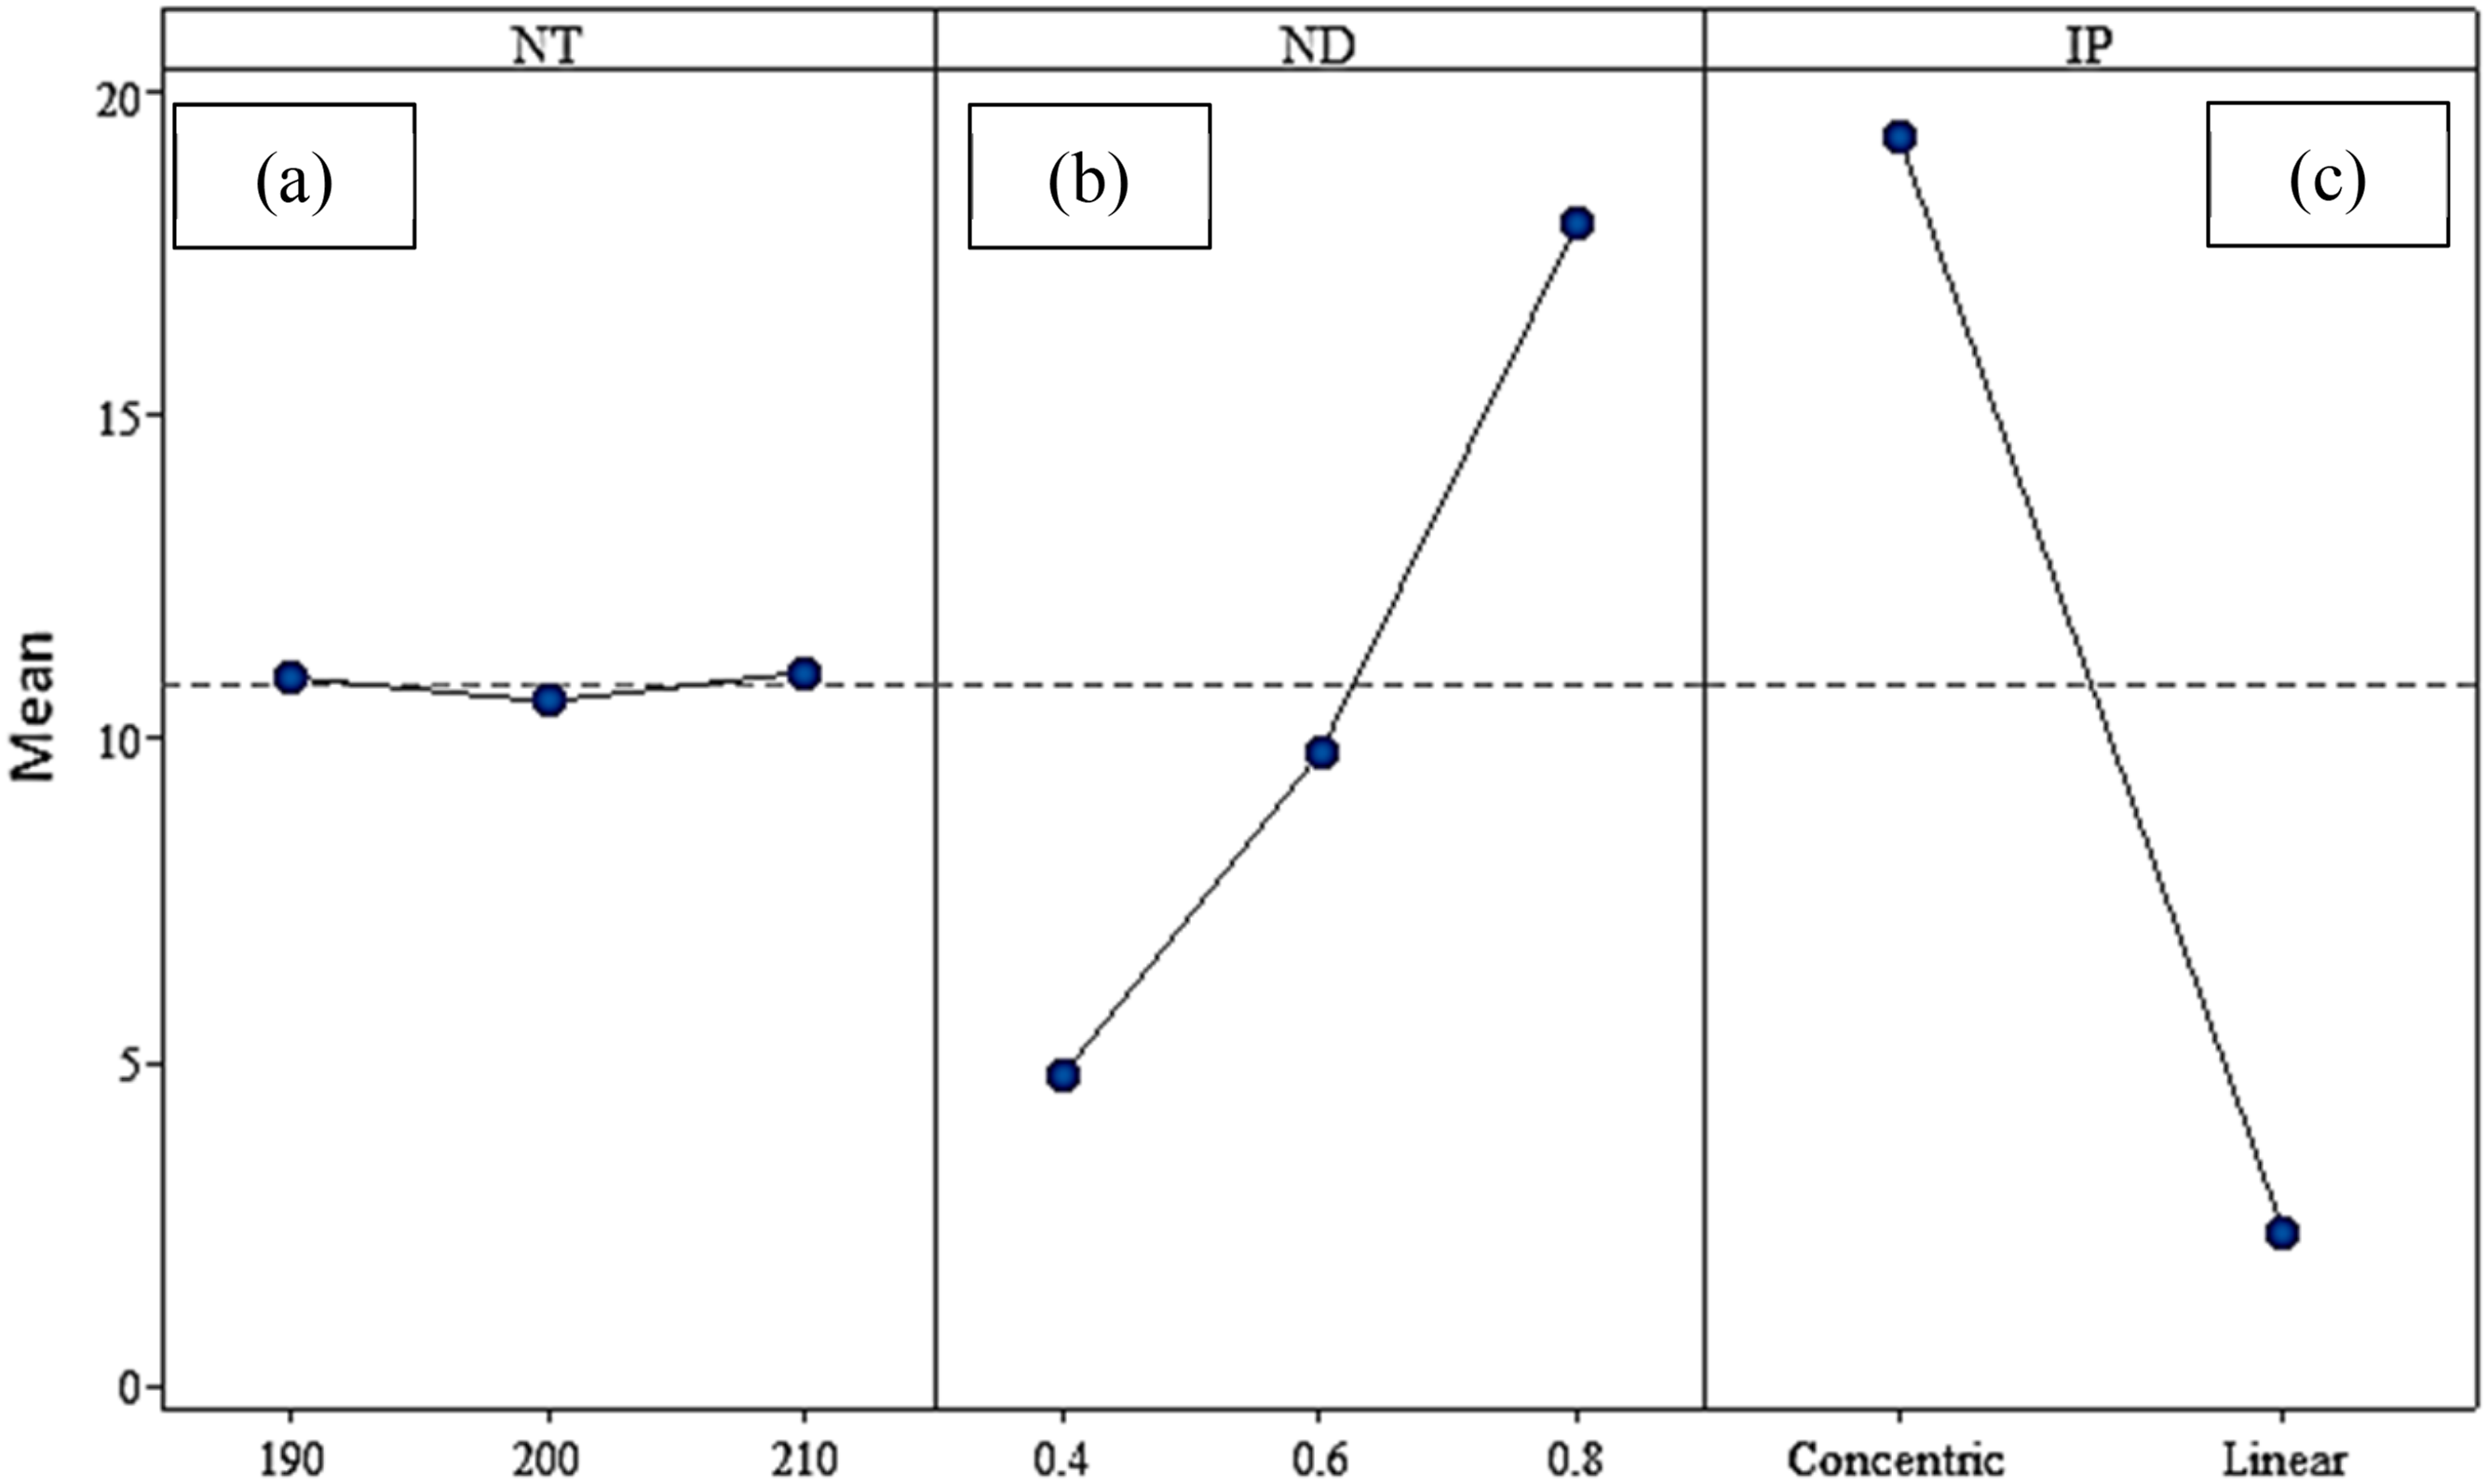
Figure 12(a) indicates that nozzle temperature variation has not significant influence on the impact strength. This was also determined by ANOVA in Table 7. According to Figure 12(b), increasing nozzle diameter causes impact strength increase. This can be attributed to the increased melt flow at larger nozzle diameters which helps to produce high density FDM products. This can lead to larger impact strength. Based on Figure 12(c), linear infill pattern compared to concentric one generates poorer impact strength. That is because crack propagation is problematic in concentric infill pattern because of having more pores. However, in case of linear pattern, cracks propagate more easily and the impact strength is deteriorated.
Surface roughness
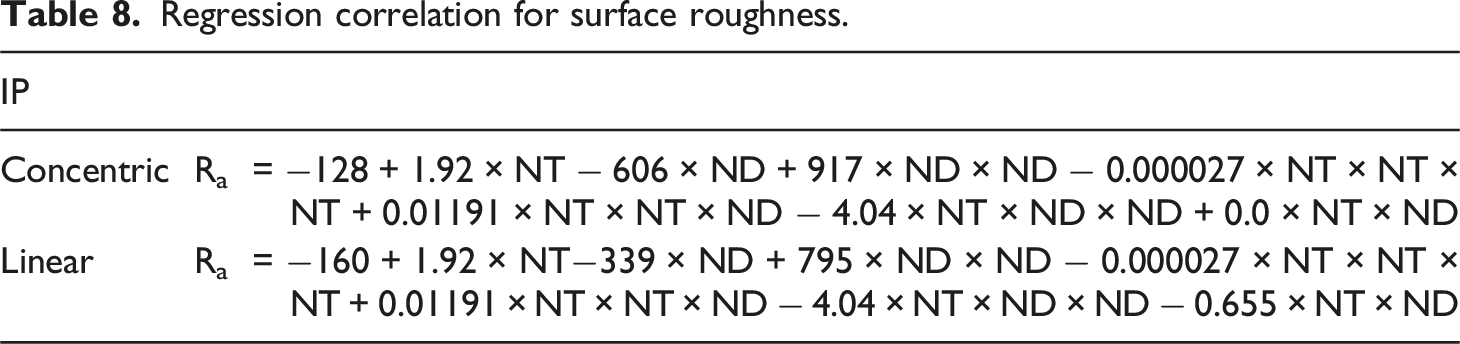
Regression correlation for surface roughness.
ANOVA for surface roughness.
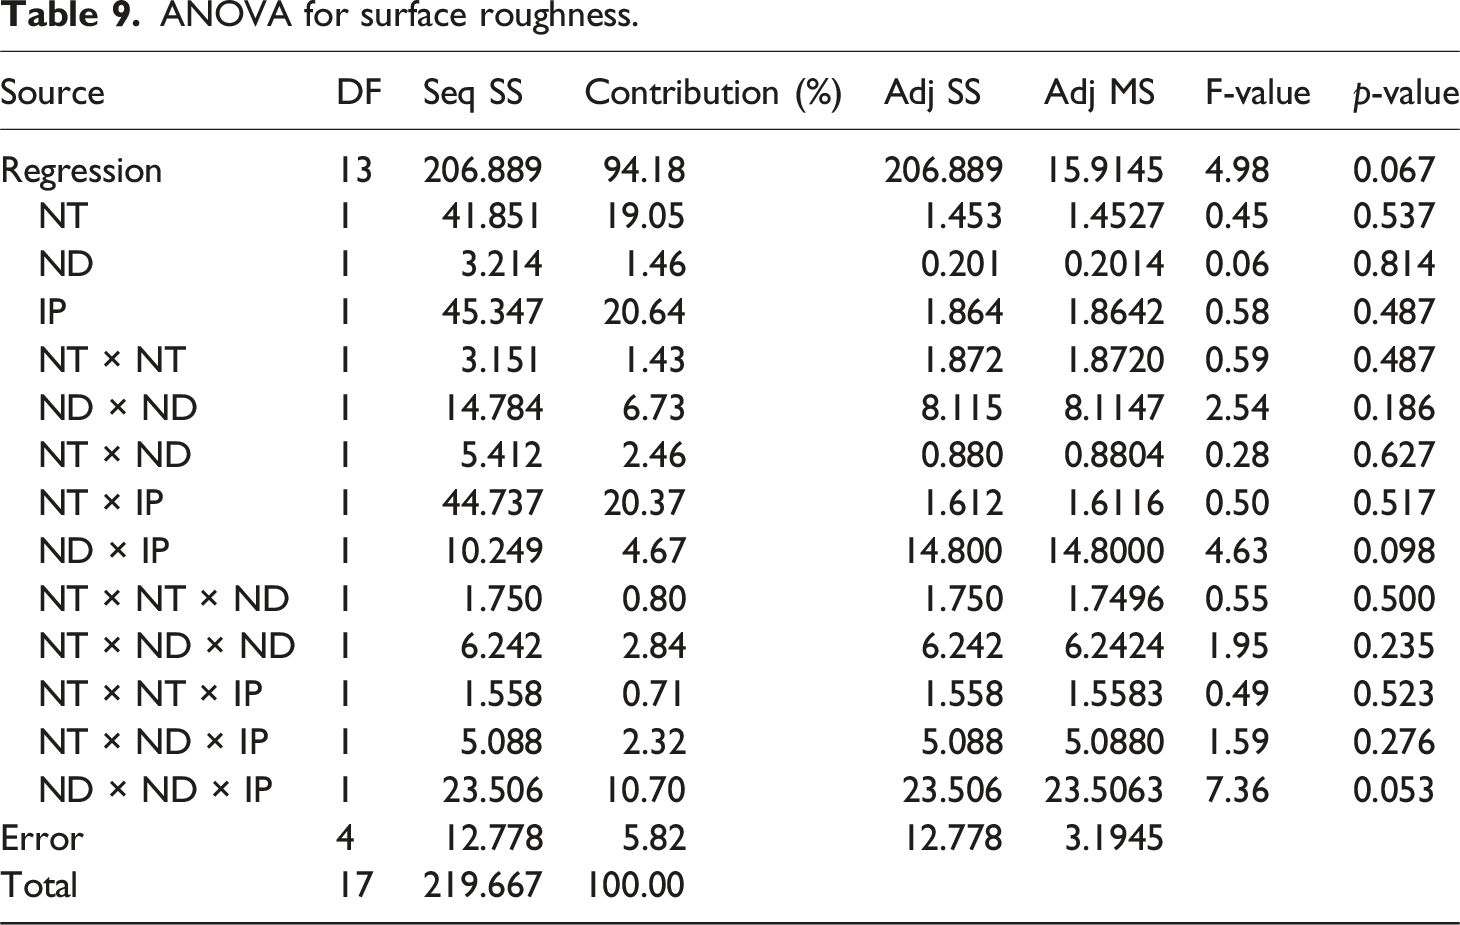
Figure 13(a) shows that larger nozzle temperature induces lower surface roughness value. At higher nozzle temperatures, the material fluidity increases which leads to proper distribution of the molten PLA and prevents wavy surface. Figure 13(b) demonstrates that larger nozzle diameter has an optimum value in order to obtain the best surface quality. Increasing nozzle diameter from 0.4 mm to 0.6 mm induces melt flow increment and proper distribution of the molten material. This leads to better surface quality. However, if the nozzle diameter exceeds the 0.6 mm to 0.8 mm, the material flow is increased and the surface quality is deteriorated. Hence, in order to have the best surface quality, the nozzle diameter should be 0.6 mm. Based on the Figure 13(c) linear infill pattern causes larger surface roughness comparing to concentric one. Laye-by-layer printing in FDM generates a step-like effect on the final part. On the other hand, concentric infill pattern produces a more homogenous surface which leads to lower surface roughness. Hence, in order to have good surface quality, concentric infill pattern is suggested. Main effects plot for surface roughness.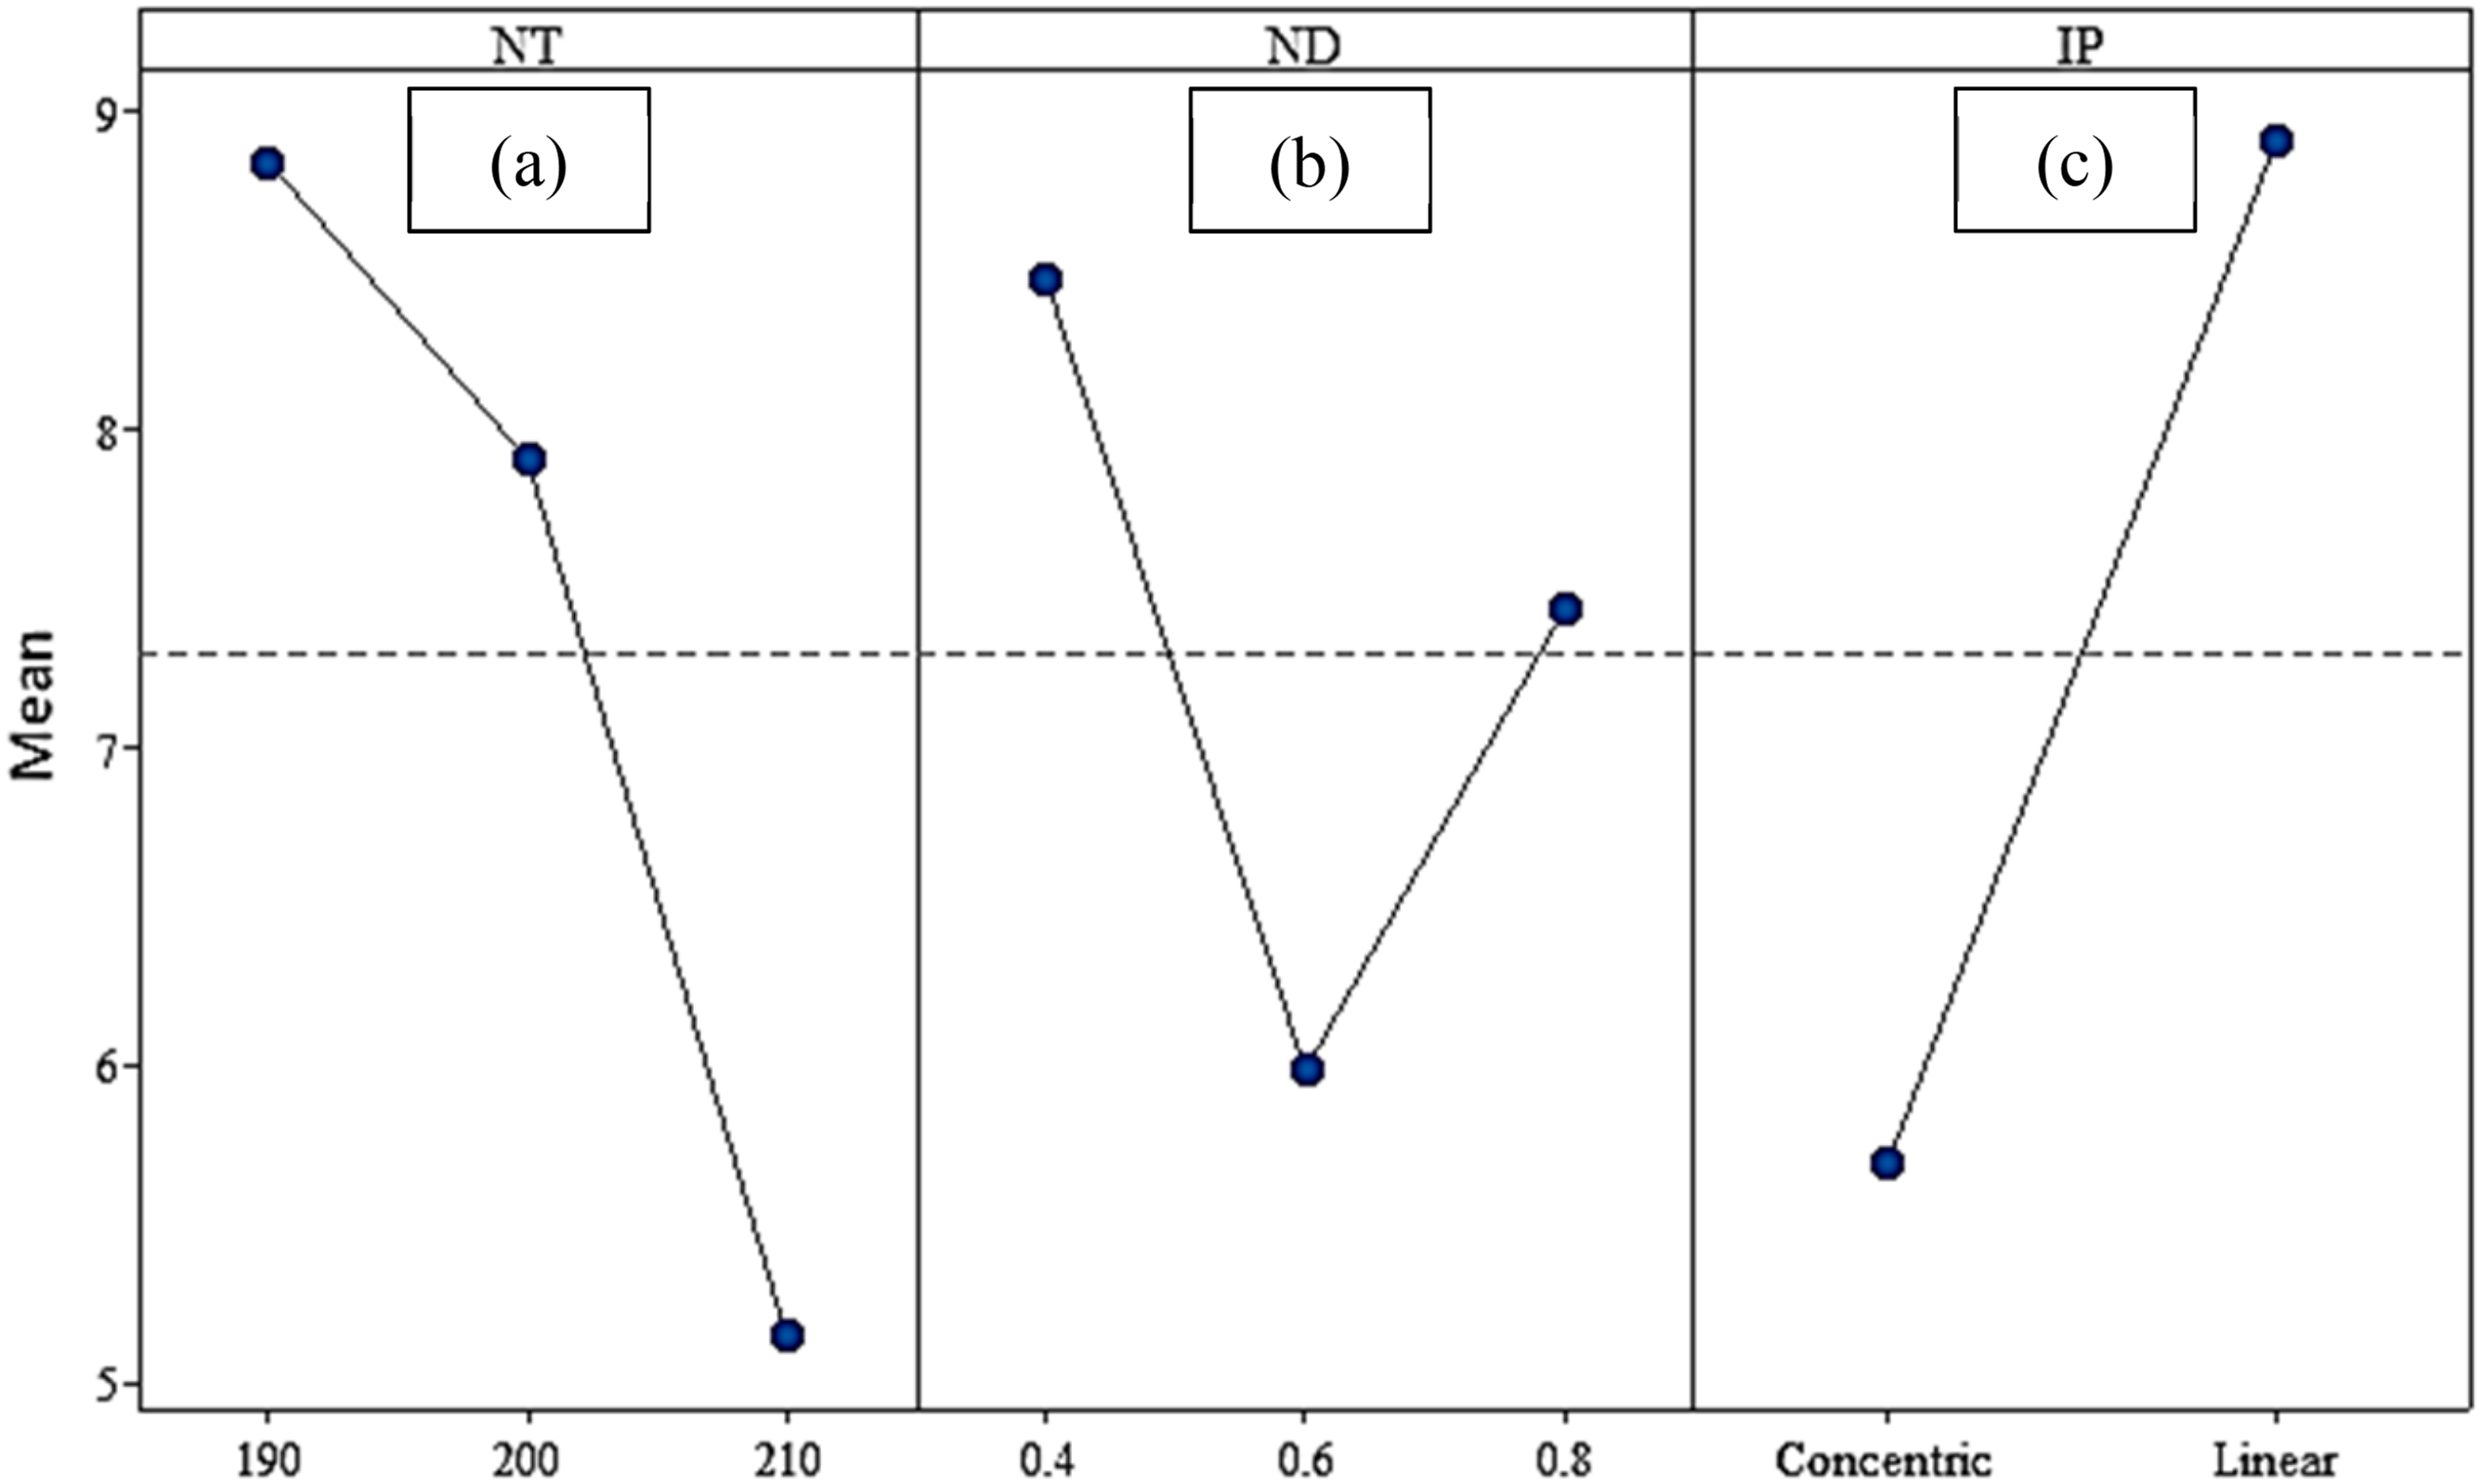
On the other hand, Bay et al. 41 compared the impact strength of FDM fabricated PLA and injection molded one. The impact strength of FDM PLA is around 78% lower than that of injection molded one.
Optimization
Each application of the FDM-built material needs special properties. Besides, since different characteristics of the FDM-built part has been investigated in this study, optimization of the process was also conducted separately for each characteristic. In this paper, the war strategy optimization (WSO) method was used in order to find out the optimal solution for each result. WSO is a new method that has been introduced in 2022. 42 That is based on the strategic movement of the army troops during war. In WSO, each soldier should move dynamically to the optimum position. Two strategies are modeled here: attack and defense. The proposed algorithm showed higher performance compared to other metaheuristics algorithms. 43 Exploration in order to find optimal condition and exploitation aimed at convergence are the main subjects in any proposed metaheuristic solutions. WSO can provide suitable exploration and exploitation by defense and attack strategy, respectively.
In comparison with other optimization methods such as particle swarm optimization (PSO) and genetic algorithms (GA), WSO offers several advantages. PSO, while efficient in many cases, can sometimes suffer from premature convergence, failing to explore the solution space thoroughly enough, especially in multi-objective problems like optimizing FDM parameters for both mechanical properties and surface quality. WSO, through its dynamic attack and defense strategies, prevents getting trapped in local optima by enhancing exploration capabilities, allowing for better performance in complex scenarios. Similarly, although GA is a powerful method using crossover and mutation for evolution, it can be computationally intensive, requiring a large population size and many generations to reach optimal solutions. WSO, on the other hand, converges faster by employing focused strategies, making it more computationally efficient. This balance of exploration and exploitation makes WSO particularly well-suited for optimizing FDM parameters, such as nozzle temperature and infill percentage, to achieve the best mechanical properties and surface quality of PLA thermoplastic, outperforming PSO and GA in this context.
WSO mathematical model
In each iteration, all soldiers have an equal probability of becoming king or commander based on their fighting strength (fitness value). The king and the commander act as leaders in the war. The movements of the king and the commander in the war would guide the remaining soldiers. It is likely that the king or commander will face strong competition from the enemy soldier (local Optima), who has enough power to trap the leaders. To avoid this, soldiers in the war would be guided not only by the position of the king or commander but also by the overall tactics of their movements. Two war strategies are modeled which described in the following 44 :
Attack strategy
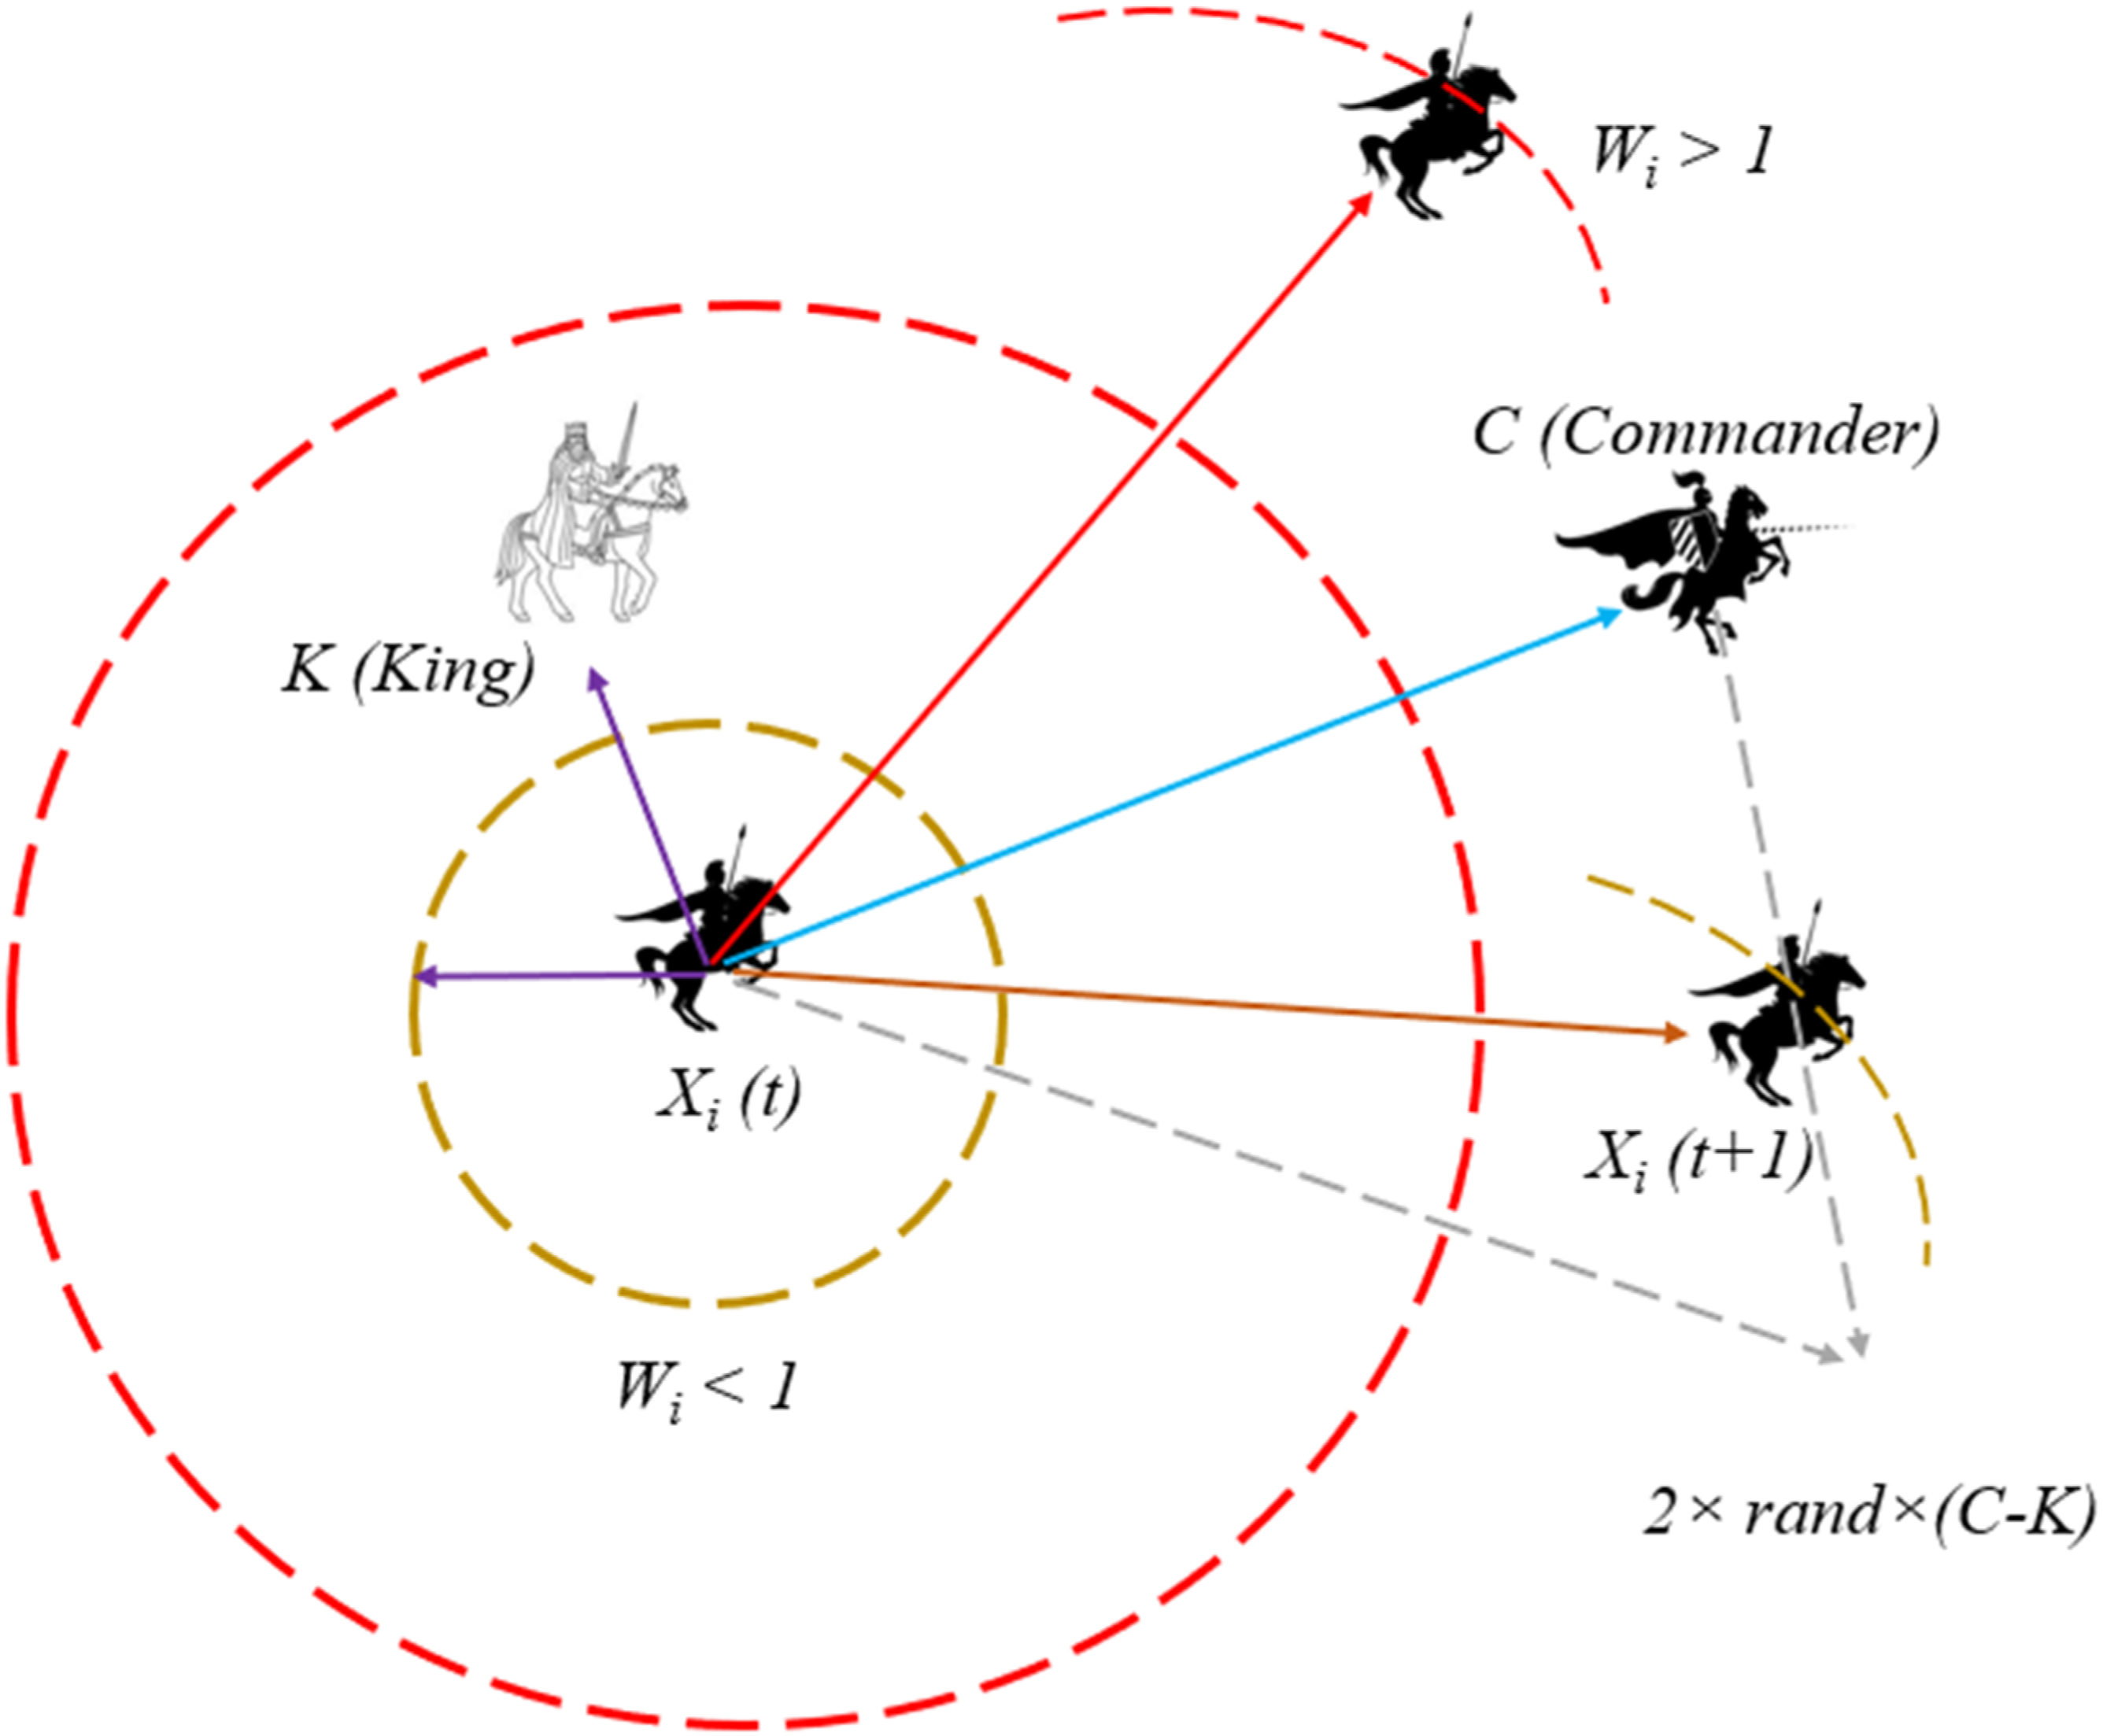
In the first case, each soldier updates his position based on the king and commander’s positions. Mechanism of updating in attack model is demonstrated in Figure 14. The king occupies a favorable position to launch a major attack on the opposition. Therefore, the soldier with the best attack power or fitness is considered the king. All soldiers will have the same rank and weight at the beginning of the war. If the soldier successfully executes the strategy, his rank will increase. However, as the war progresses, the ranks and weights of all soldiers will be updated based on the success of the strategy. When the war ended, the positions of the king, army commanders, and soldiers remained tight as they approached their targets. Mechanism of attack model in WSO.
Rank and weight updation
Updating the position of each search agent depends on the interaction between the position of king, commander and the rank of each soldier. Each soldier’s rank depends on his history of success in the war governed by equation (4), which then affects the weighting factor W i . Each soldier’s rank reflects how close the soldier (search agent) is to the target (fitness value). It can be noted that the weight coefficients in other competing algorithms change linearly while in WSO algorithm, the weight (Wi) changes exponentially as a coefficient of α.
If the attack force (fitness) in the updated position (F
n
) is lower than that of the previous one (F
p
), the soldier takes the previous position (equation (2)).
If the position of the soldier was updated successfully, the rank R
i
of the soldier will be upgraded (equation (3)):
According to the rank, the updated weight is obtained via equation (4):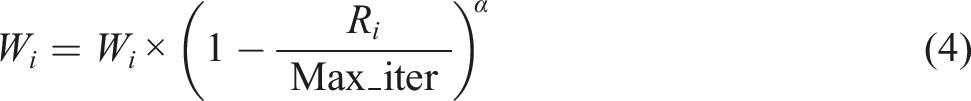
Defense strategy
The second strategy position update is based on the positions of the king, army head and a random soldier. While updating of the ranking and weight remains the same.
This war strategy explores more search space when compared to the attack strategy because it involves random soldier positions. For high W i values, soldiers must take large steps and update their position. For small W i values, soldiers must take small steps while position updating.
Replacement/relocation of weak soldiers
For each iteration, weak soldiers having the worst fitness are identified. The replacement approach is replacing the weak soldier with a random soldier as given in equation (6).
The summary of the WSO algorithm flow is depicted in Figure 15. WSO algorithm flow.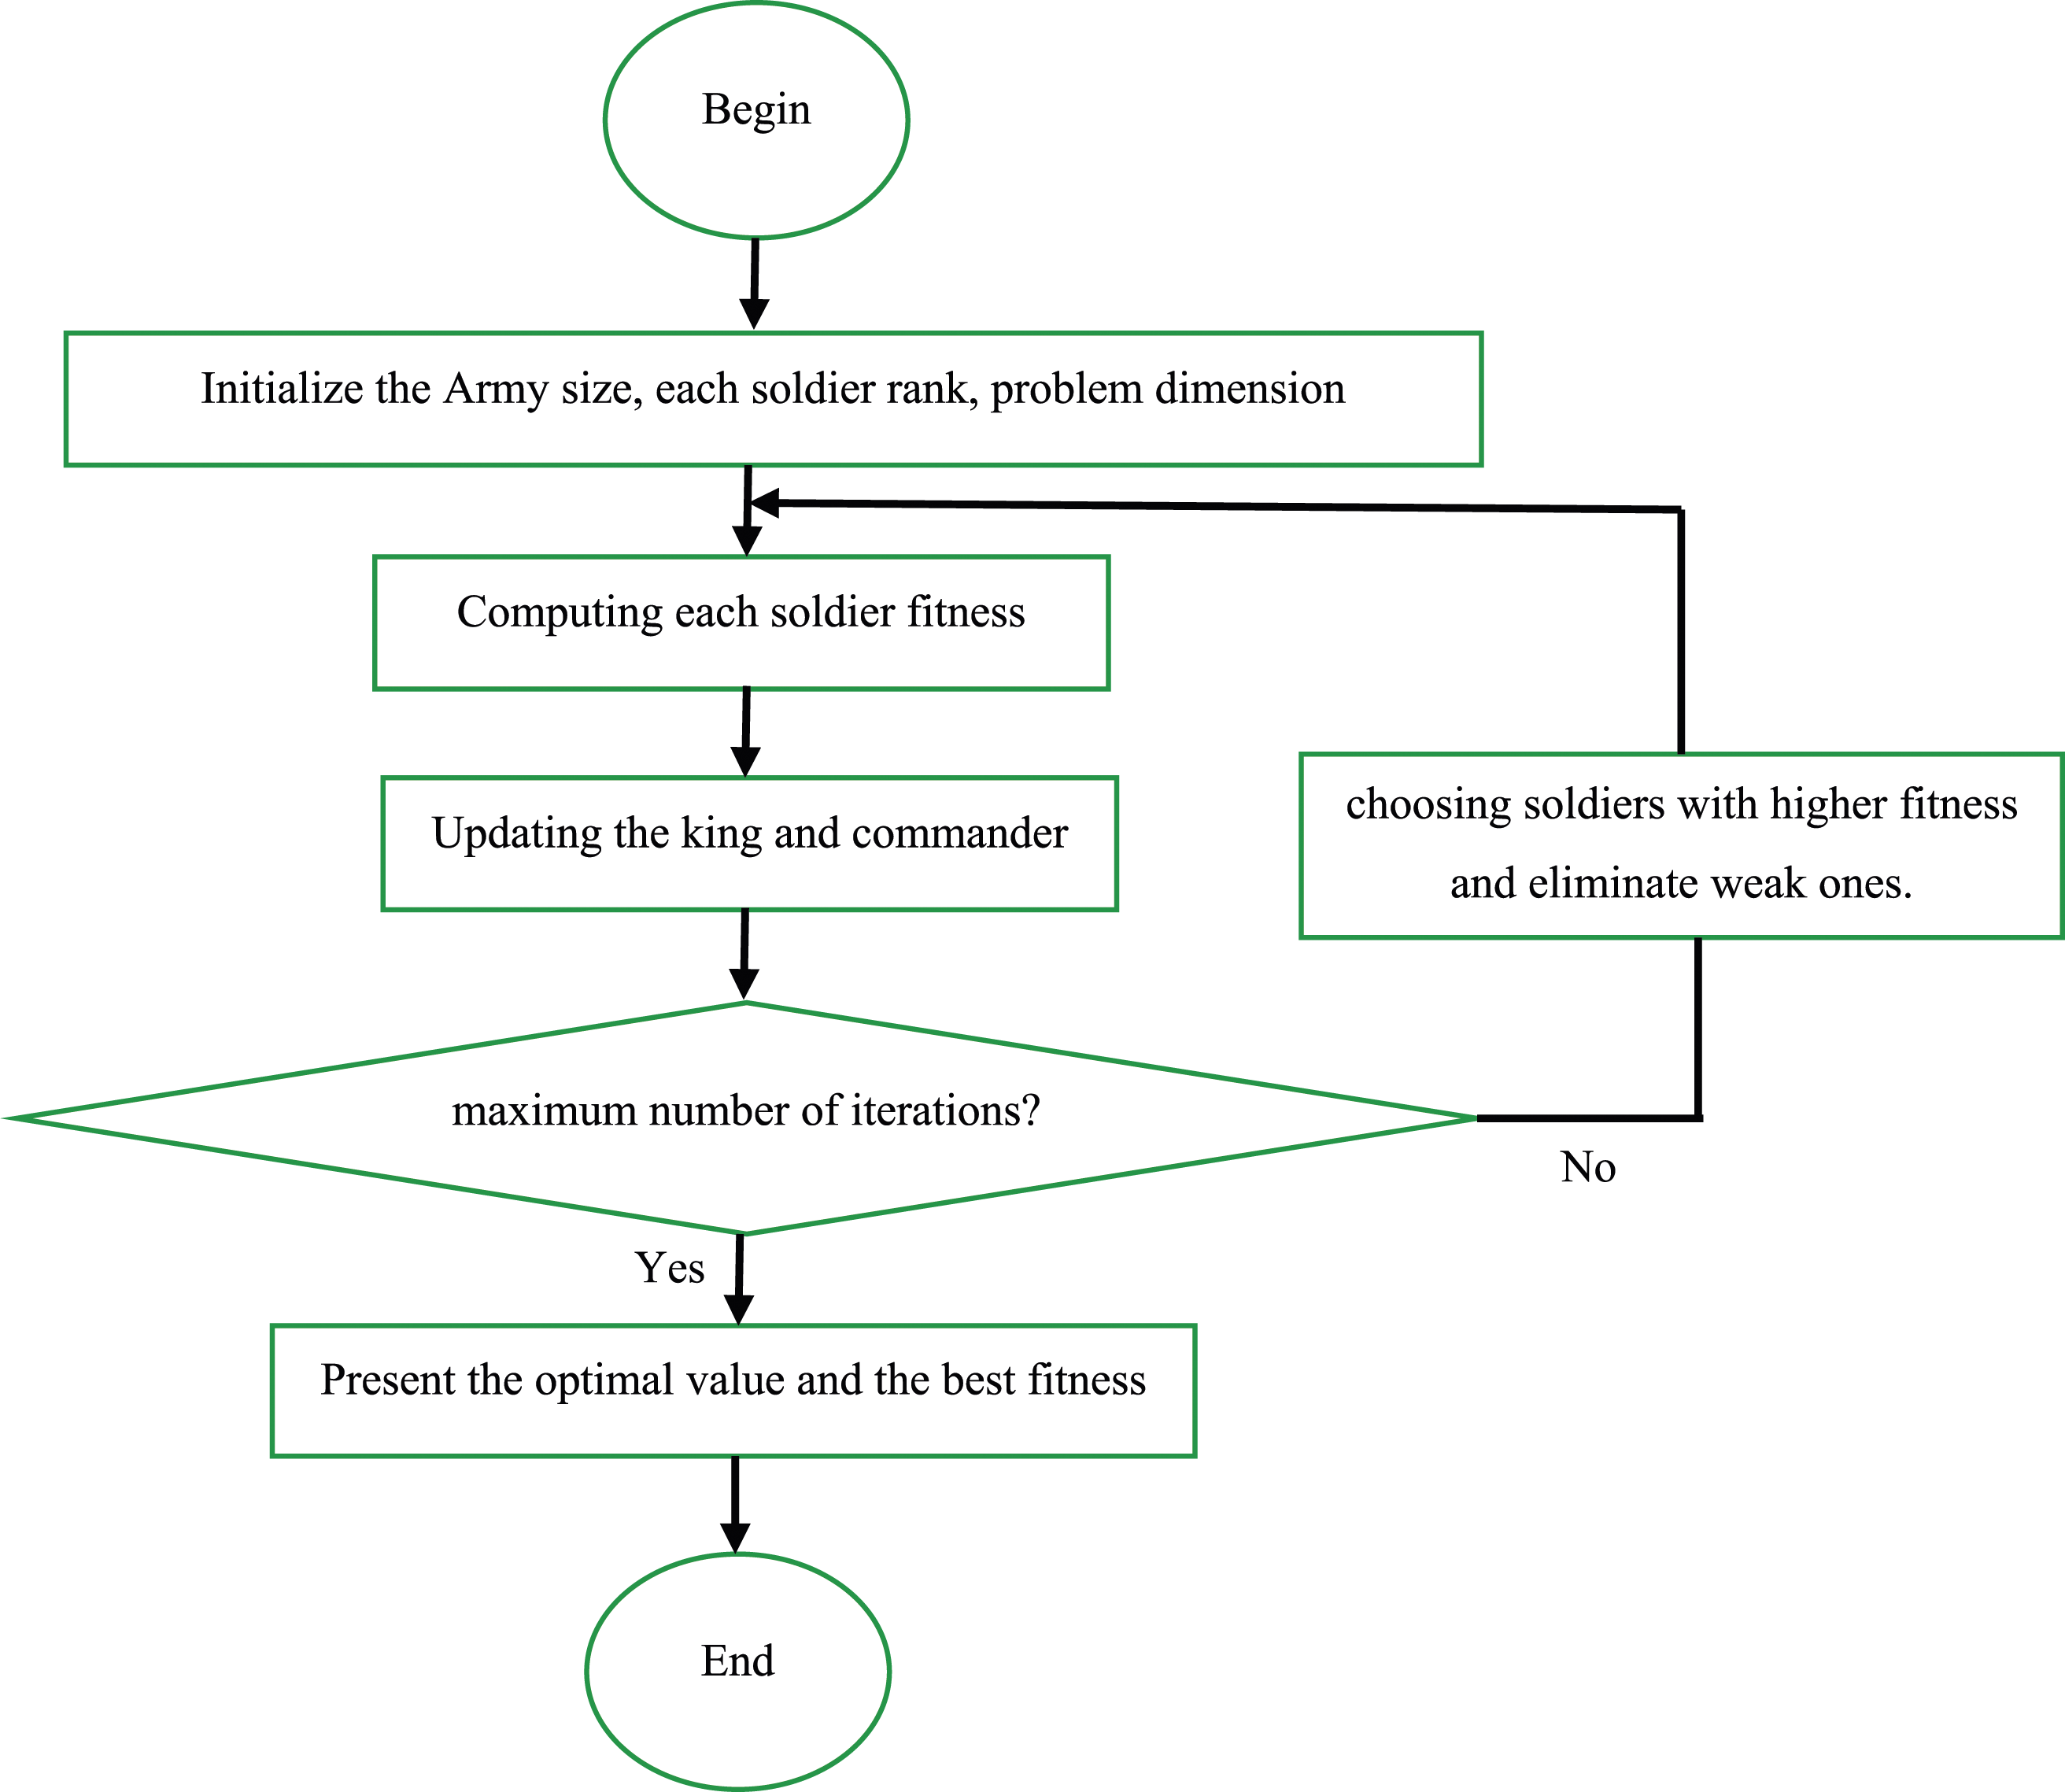
Optimizaing the FDM process by WSO algorithm
Feasibility of WSO method in optimizing the FDM process was explored in this section. The WSO achieves a good balance between exploration and exploitation. Each solution (soldier) has its own weight depending on its rank. The weights will change non-linearly. The weights change by a large value in the first iteration and change by a small value in the last iteration that leads to faster convergence towards the global optimal value. In addition, the proposed algorithm is simple and requires less computation. For searching the accurately optimal solution, 1000 iterations were produced. Maximum number of soldiers in WSO algorithm was set to 400. The WSO constraints were directed based on the range of the process parameters (Table 1).
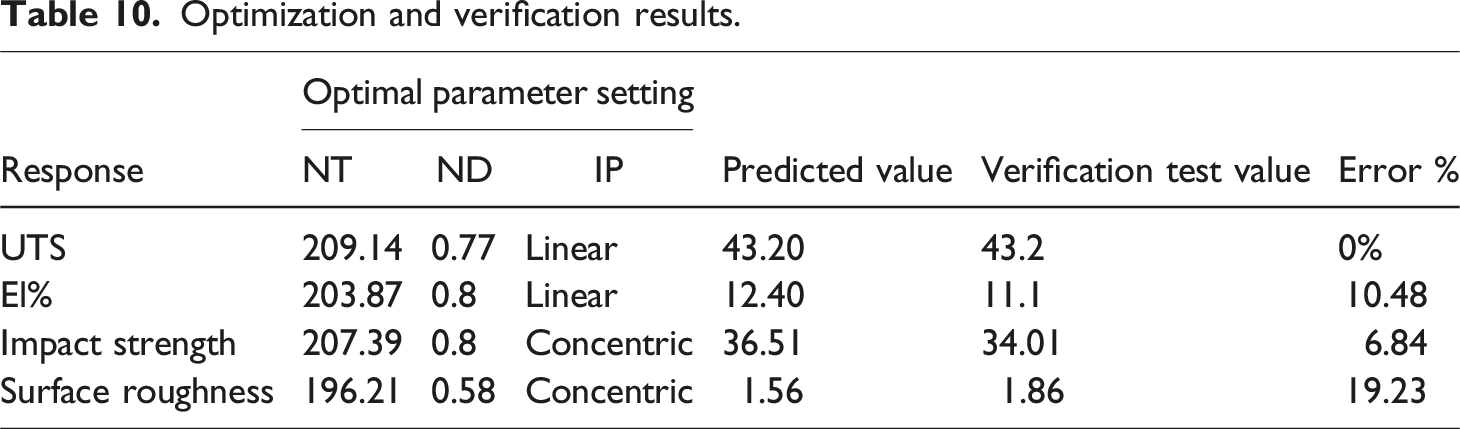
WSO algorithm was conducted for each objective. That should be noted, for UTS, El% and impact strength, the maximum value is the optimized condition. Hence, reverse of the regression correlations in Tables 4 and 6 were considered as objective functions. Besides, for surface roughness, the minimization is the optimization goal. Therefore, the regression correlations in Table 8 were selected for surface roughness objective function. Figure 16 illustrates the convergence plot and their fitness values for UTS, El%, impact strength and surface roughness achieved by WSO algorithm. Moreover, to appraise the optimization results, verification tests are required. The optimal parameter settings are shown in Table 10. As seen from Table 10, the results of the process in Table 3 can be used to conduct the verification stage. The optimal process settings and the predicted results as well as the verification experiments’ outcomes are presented in Table 10. That is observed the error values for mechanical properties are in the acceptable range. However, the value for surface roughness is high that is due to lower R-squared value for the regression correlations of surface roughness. Generally, the results indicate that WSO algorithm has high performance in optimizing the FDM process variables. Convergence curve for (a) UTS, (b) El%, (c) Impact strength, (d) Surface roughness. Optimization and verification results.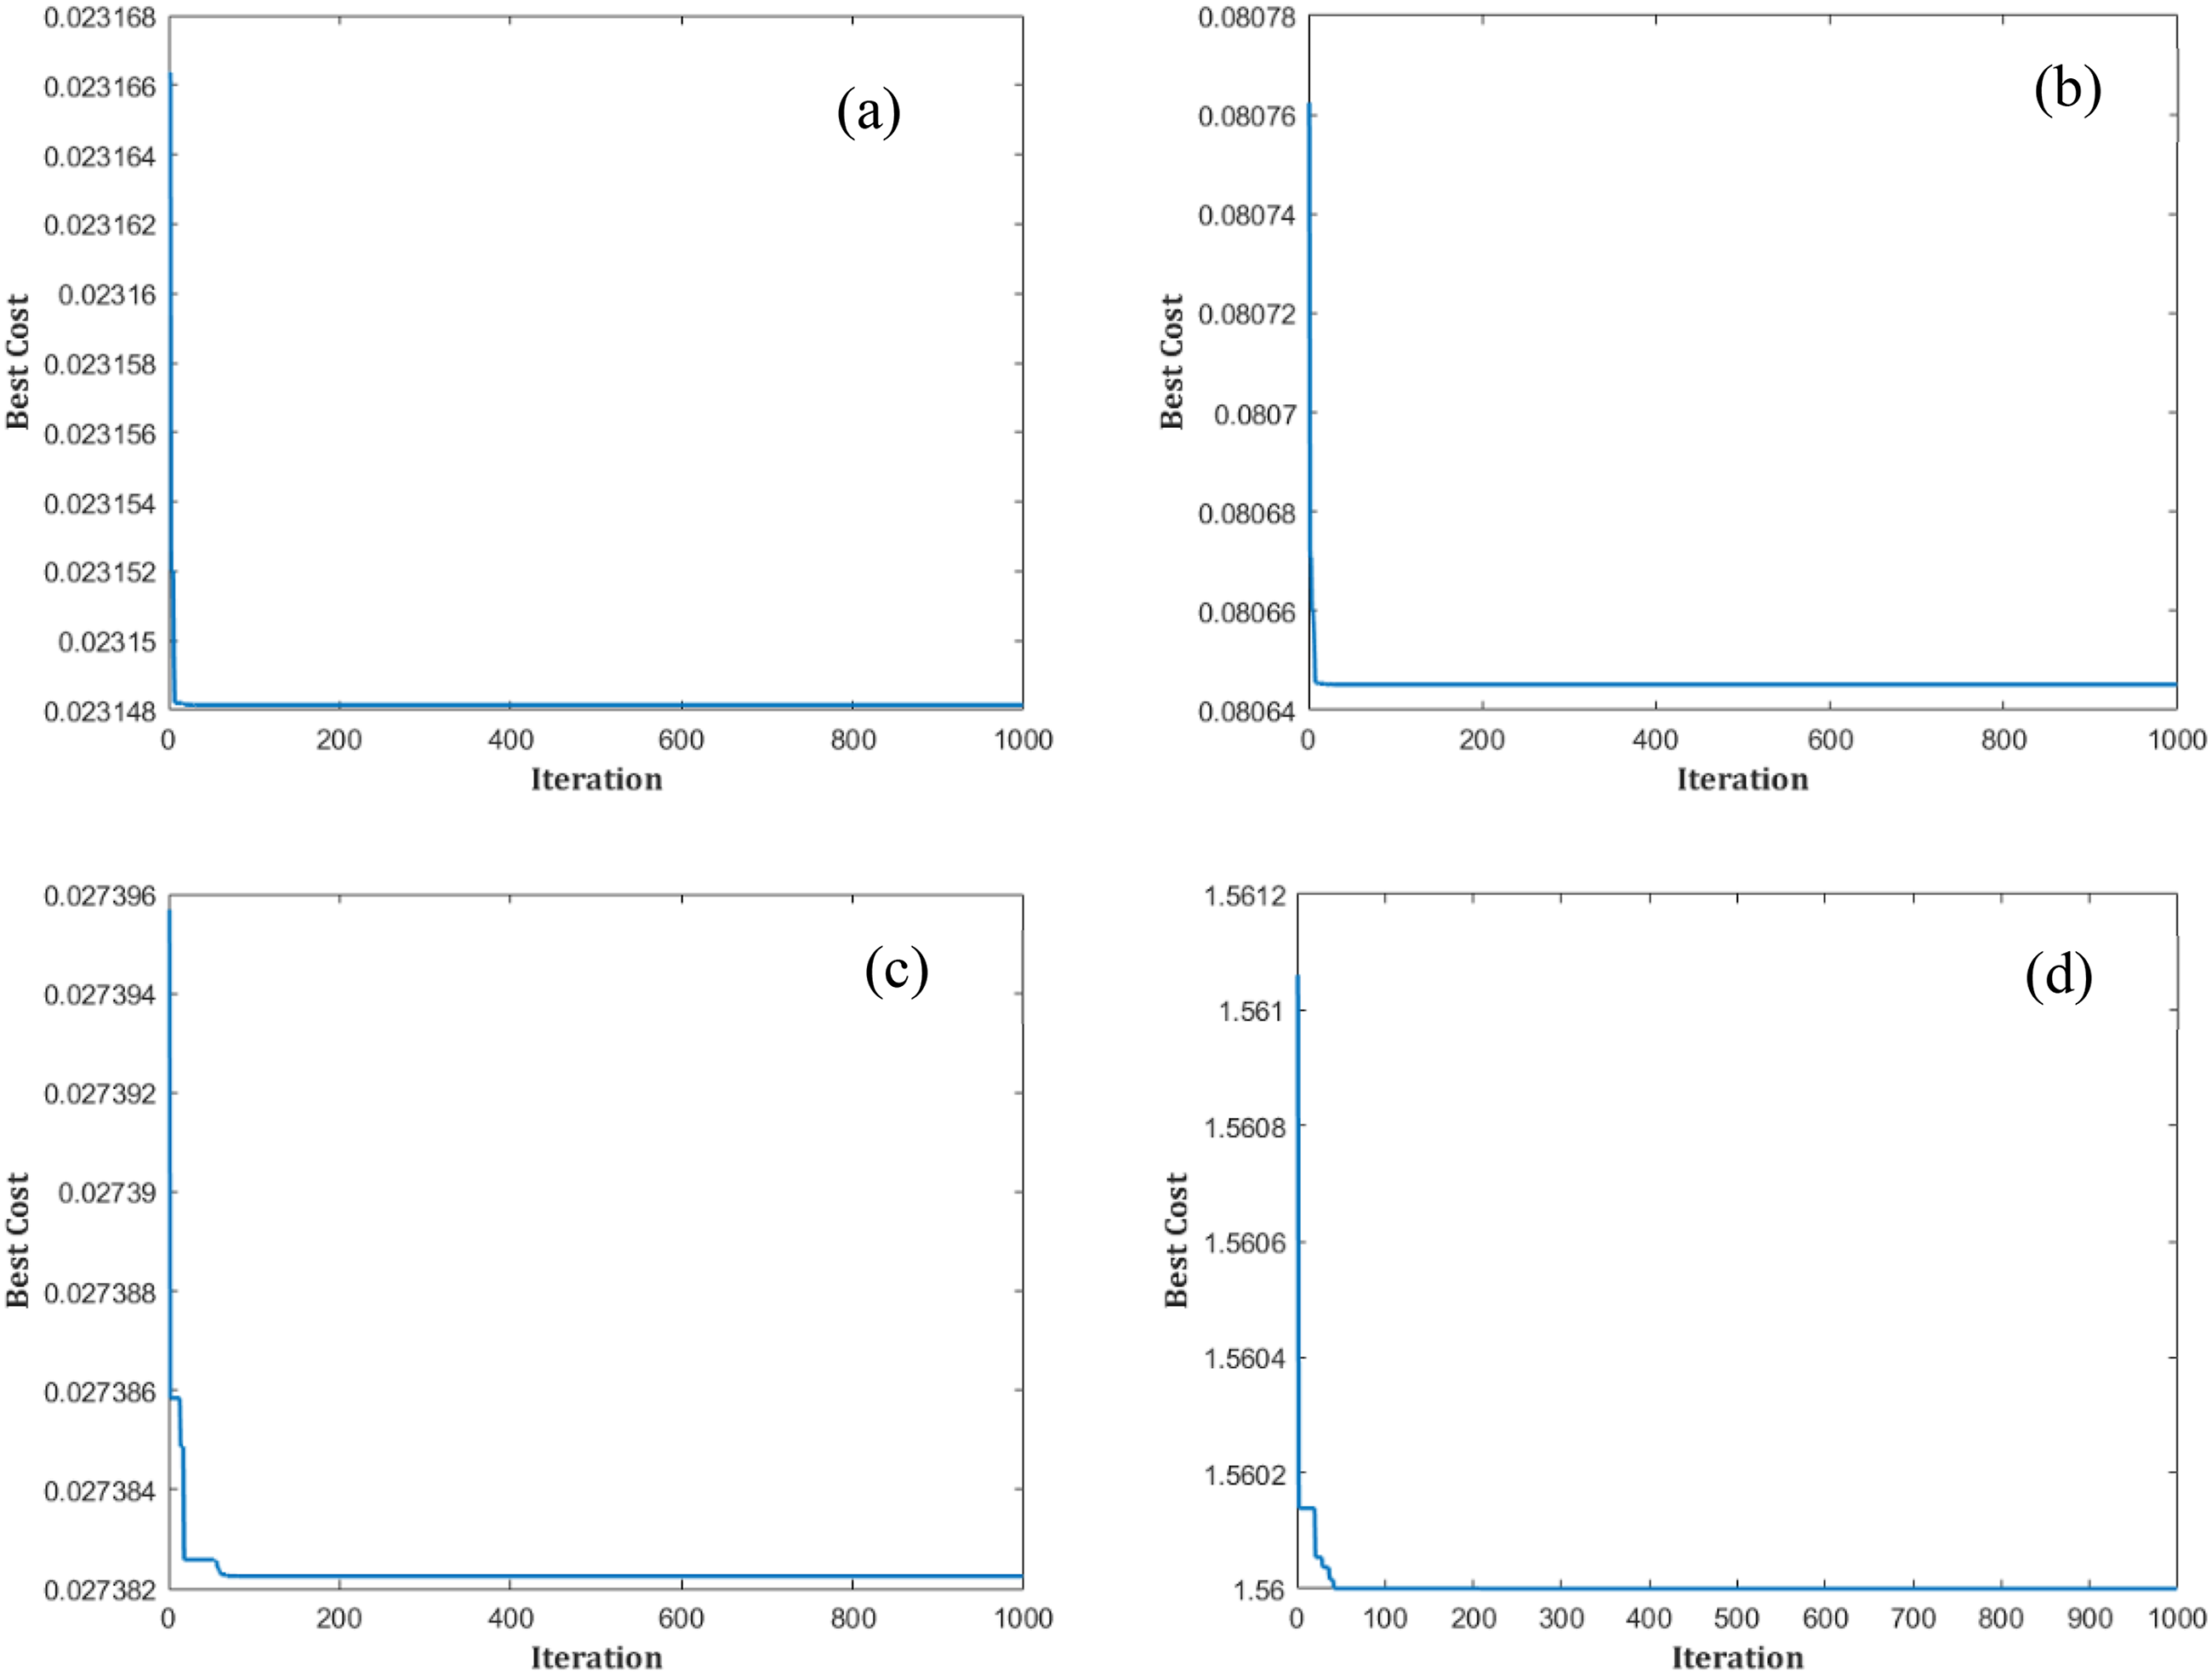
Conclusions
This work aims to study the influence of FDM process parameters such as infill pattern, nozzle diameter, and nozzle temperature on the mechanical properties and surface quality of the printed parts. The full factorial method was used to design the experiments. Regression correlations with high R-squared values were established for each factor. Additionally, ANOVA was used to study the influence of input parameters on the results. The main results of this article are as follows: - Nozzle diameter has the greatest influence on tensile strength, by a 74.9%. Contribution Additionally, the elongation at break was influenced by the nozzle temperature by a 46.29% contribution. An increase in nozzle temperature and nozzle diameter causes an increase in UTS and El% due to an increase in fluidity. In addition, linear pattern compared to concentric one results in higher UTS and El%. SEM images were also used to examine the results of the tensile experiments. - The impact strength of a material is primarily affected by the type of infill pattern, which accounts for 54% of the overall influence. The nozzle temperature, on the other hand, does not have a significant effect on the impact strength. Increasing the nozzle diameter, results in an increase in impact strength. Moreover, using a concentric infill pattern enhances the impact strength because it allows for more pores in the part, which can absorb the impact energy. - When it comes to surface roughness, the infill pattern has the greatest influence, contributing to 20.64% of the overall effect. The interaction between nozzle temperature and infill pattern is the next most influential factor, accounting for about 20.37%. Opting for a concentric infill pattern leads to lower surface roughness due to the even distribution of layers. Furthermore, increasing the nozzle temperature results in decreased surface roughness, as it promotes better distribution of the molten material. - The process parameters were optimized to in order to achieve lower surface roughness, higher tensile strength, increased elongation at break, and improved impact strength using the WSO algorithm. Each specific application of the FDM-built material requires unique properties. In addition, since different characteristics of the FDM-built part were examined in this study, the process optimization was performed separately for each characteristic. The WSO algorithm was employed for this purpose, which is inspired by the strategic movements of army troops during war. The proposed algorithm demonstrated superior performance compared to other metaheuristic algorithms. WSO offers a balance between exploration and exploitation through its defense and attack strategies, respectively. - Objective functions for optimization were determined by utilizing regression correlations. In order to search for the most accurate optimal solution, total of 1000 iterations were performed. The WSO algorithm was set to allow a maximum of 400 soldiers. Varied optimal configurations were obtained based on each objective function. Furthermore, verification tests were carried out, and the error values fell within an acceptable range. This study demonstrated the effectiveness of the WSO algorithm in identifying the optimal conditions for the FDM process. - While WSO method effectively optimized mechanical properties and surface quality in the FDM process, future research should explore the influence of additional parameters such as print speed and layer thickness, and consider integrating WSO with other advanced techniques like machine learning or hybrid metaheuristics to enhance its adaptability and performance in more complex scenarios. - While these findings highlight optimal settings for our specific material (PLA) and printer setup, that is acknowledged the limitations of generalizing these results to other printers or materials. Each printer and material have unique characteristics that interact with process parameters in distinct ways. Therefore, a generalized process model is essential for broader applications across different materials. The insights here are specific to PLA on the used printer model, and transferring these parameters to other setups would require further validation.
Footnotes
Declaration of conflicting interests
The author(s) declared no potential conflicts of interest with respect to the research, authorship, and/or publication of this article.
Funding
The author(s) received no financial support for the research, authorship, and/or publication of this article.